Article

Generative vs. Non-Generative Models in Engineering Shape Optimization

by
Zahid Masood
1,*,†,
Muhammad Usama
2,*,†,
Shahroz Khan
3,*,†,
Konstantinos Kostas
1 and
Panagiotis D. Kaklis
2,4
1
Department of Mechanical & Aerospace Engineering, School of Engineering and Digital Sciences, Nazarbayev University, Kabanbay Batyr Ave. 53, Astana 010000, Kazakhstan
2
Department of Naval Architecture, Ocean and Marine Engineering, University of Strathclyde, Glasgow G4 0LZ, UK
3
BAR Technologies, Portsmouth PO1 2JJ, UK
4
Group of Data Science, Division of Numerical Analysis & Computational Science, Institute of Applied & Computational Mathematics (IACM), Foundation for Research & Technology Hellas (FORTH), 700 13 Heraklion, Greece
*
Authors to whom correspondence should be addressed.
These authors contributed equally to this work.
J. Mar. Sci. Eng. 2024, 12(4), 566; https://doi.org/10.3390/jmse12040566
Submission received: 13 February 2024 / Revised: 17 March 2024 / Accepted: 24 March 2024 / Published: 27 March 2024
(This article belongs to the Special Issue Machine Learning and Modeling for Ship Design)

Abstract

:
Generative models offer design diversity but tend to be computationally expensive, while non-generative models are computationally cost-effective but produce less diverse and often invalid designs. However, the limitations of non-generative models can be overcome with the introduction of augmented shape signature vectors (SSVs) to represent both geometric and physical information. This recent advancement has inspired a systematic comparison of the effectiveness and efficiency of generative and non-generative models in constructing design spaces for novel and efficient design exploration and shape optimization, which is demonstrated in this work. These models are showcased in airfoil/hydrofoil design, and a comparison of the resulting design spaces is conducted in this work. A conventional generative adversarial network (GAN) and a state-of-the-art generative model, the performance-augmented diverse generative adversarial network (PaDGAN), are juxtaposed with a linear non-generative model based on the coupling of the Karhunen–Loève Expansion and a physics-informed shape signature vector (SSV-KLE). The comparison demonstrates that, with an appropriate shape encoding and a physics-augmented design space, non-generative models have the potential to cost-effectively generate high-performing valid designs with enhanced coverage of the design space. In this work, both approaches were applied to two large foil profile datasets comprising real-world and artificial designs generated through either a profile-generating parametric model or a deep-learning approach. These datasets were further enriched with integral properties of their members’ shapes, as well as physics-informed parameters. The obtained results illustrate that the design spaces constructed by the non-generative model outperform the generative model in terms of design validity, generating robust latent spaces with no or significantly fewer invalid designs when compared to generative models. The performance and diversity of the generated designs were compared to provide further insights about the quality of the resulting spaces. These findings can aid the engineering design community in making informed decisions when constructing design spaces for shape optimization, as it has been demonstrated that, under certain conditions, computationally inexpensive approaches can closely match or even outperform state-of-the art generative models.

1. Introduction

The design process is a critical phase for any industry, and it can be revolutionized by incorporating state-of-the-art intelligent methods. This integration not only automates design processes but also aids designers in creating innovative and optimized solutions for free-form functional surfaces, such as wings, turbine blades, and ship hulls. Optimizing such surfaces often plays a crucial role in enhancing their functional performance; see, for example, Refs. [1,2,3,4]. Effective design parameterization, facilitating high levels of intuitiveness, flexibility, and representational accuracy, is a crucial prerequisite for such shape optimization approaches. Intuitiveness is essential for enabling designers to articulate the design logic, while flexibility is crucial for accommodating intricate design specifications. Representational accuracy ensures that a concise set of design parameters can effectively capture an expansive design space, encompassing physically optimal solutions across a diverse range of design conditions and constraints [5,6]. However, using traditional methods to create a design space that accommodates these three qualities often results in prohibitively high dimensionality and increased complexity.
In the realm of engineering design, the methods and processes for generating appealing and optimized designs have continuously evolved, mirroring technological advances and paradigm shifts in design approaches. For instance, the recent growth of generative methods within engineering design disciplines has contributed significantly to the automation of the design generation process. These models have the ability to extract and capture the underlying data distribution of the design space, enabling them to generate conventional as well as novel design samples; see Refs. [7,8,9]. Notably, deep generative models (DGMs), such as generative adversarial networks (GANs) [10], variational autoencoders (VAEs) [11], and deep reinforcement learning techniques, have found applications in diverse domains, such as microstructural design [12], 3D modeling [13], and aerodynamic shape design and optimization [14].
Despite these developments, conventional generative models, primarily focused on learning the distribution of an existing design space, often encounter significant challenges when applied in engineering design synthesis. These challenges relate to reduced diversity, sub-optimal performance, and a lack of novelty, which can be primarily attributed to the limitations of the employed design space [15,16,17]. To address these issues, researchers have proposed a series of advanced algorithms [18,19,20]. Notably, Chen et al. [21] proposed the performance-augmented diverse generative adversarial network (PaDGAN), incorporating a loss function based on determinantal point processes (DPPs) [22,23]. This approach aims to synthesize high-performance and diverse designs while extending the boundaries of the existing design space for the generation of novel designs.
While generative approaches show promise, they often come with significant computational costs when dealing with complex designs. In contrast, non-generative approaches, such as Principal Component Analysis (PCA)/Karhunen–Loève Expansion (KLE) [24,25], can be tailored by appropriate methodological expansions and augmentations to approach (and in some cases, even outperform) the performance of generative models while being computationally more efficient, as will be described below. The dichotomy between generative and non-generative models becomes evident in their approaches to data representation and design generation. Generative models focus on capturing the underlying data distribution and generating novel and diverse design samples, while non-generative models solely focus on extracting latent features from the design space without explicitly modeling the underlying data distribution. Classic non-generative methods face limitations in preserving intricate shape complexity and underlying geometric structures. This leads to latent subspaces that may not permit the efficient generation of diverse and valid shapes during shape optimization [26]. The compromised representational capacity impedes optimizers and wastes computational resources in the exploration of infeasible designs and/or shapes lacking novelty. Moreover, these techniques rely predominantly on geometric features, neglecting crucial quantities of interest pertaining to physics and performance, which actually drive the design optimization process. Consequently, along with the lack of a prior probability distribution, the generated designs tend to be either close replicates of the original dataset members or inter-member interpolants lying in their respective neighborhoods. Therefore, there is a wide variety of challenges to be addressed before contemporary design process objectives can be met.
While PCA/KLE techniques may be computationally efficient, their linear nature and susceptibility to generating less diverse design spaces with a relatively high number of invalid designs make them less effective when compared to other modern non-generative models. For example, autoencoders have demonstrated their ability to produce diverse design spaces with a low number of invalid designs while also capturing nonlinearities within datasets [27,28,29]. To address the above-mentioned limitations of conventional linear non-generative approaches, Khan et al. [26] introduced an augmented shape signature vector (SSV) coupled with a KLE-based approach and managed to improve the original design space representation by incorporating both geometric and physical information into the design description. Enhanced performance was demonstrated in their study without sacrificing computational efficiency. A further step in the same direction was performed in Masood et al.’s study [30], where the effect of different shape-discretization methods was highlighted, and by using a similarly augmented SSV, they showcased the positive impact of an enhanced data representation, which tackled the problems of invalid designs and lack of diversity.
These recent results provide the motivation to conduct a comparison between a representative of the state-of-the-art generative models with the enhanced KLE-based non-generative model mentioned above. Specifically, non-generative models are represented by the SSV-KLE-based approach, which is an enhanced linear shape-supervised dimension reduction approach (see Section 2.1), whereas PaDGAN (see Section 2.2) is the generative model of choice. PaDGAN is a nonlinear method with a nominal two-fold advantage over non-generative models: i.e., it captures nonlinearities and learns the underlying data distribution. The comparison is performed on airfoil design spaces, which align very well with this work’s research aims, as airfoil design requires rich design spaces with adjustable parameters influencing performance. At the same time, due to their 2D nature, their performance evaluation does not require prohibitively costly computations and therefore permits a thorough investigation into how generative and non-generative models cope with the intricacies of complex design spaces and performance-based shape optimization within them. Thus, both the design space quality and design performance assessment, which produce valuable insights into the respective models’ capabilities and limitations, can be simultaneously covered. The effectiveness and efficiency of both generative and non-generative models are significantly affected by the representation of the design dataset, which plays a pivotal role in each model’s capacity to capture relevant features and patterns within the design space. The aim here is to demonstrate that, with appropriate data representation, non-generative models can achieve results on par with those of generative models. The comparison is facilitated by the following major steps:
  • The generation of datasets with varying shape signature vectors (with and without augmentation with performance-based components).
  • The performance of varying shape discretizations to quantify their effects as well as identify the ones that lead to data representations with enhanced quality.
  • The deployment of both generative and non-generative models on the created datasets.
  • The performance a comprehensive analysis of latent space quality to evaluate the efficacy of the implemented models in design optimization.
This paper is divided into two main sections: Section 2, where the employed models and comparison criteria are discussed, and Section 3, containing the produced results and their analysis, followed by a summary of main observations and future research directions in Section 4.

2. Methods

This section begins with the presentation of the selected non-generative approach in Section 2.1, followed by the employed generative model in Section 2.2. The dataset generation process for the two datasets is described in Section 2.3, with the presentation of the quality metrics, which are employed in the models’ comparison, being presented in Section 2.4.

2.1. Shape-Supervised Dimension Reduction (SSDR)

The non-generative SSDR employed in this work is adopted from Ref. [30], which combines a Karhunen–Loève Expansion (KLE) approach with a shape signature vector (SSV—see also Ref. [31]) that is augmented with physics-informed quantities (mainly geometric moments; see Section 2.1.1) and considers varying discretization methods in shape encoding. In this context, a rich and diverse space of foil-profile designs, denoted by C , is assumed, with each design being represented or modified using a design vector v V R n . The design space V is constrained by an appropriate set of bounds that limit the space to geometrically and physically valid foil profiles.
The vector v V facilitates the definition of a shape modification procedure θ ¯ = θ ¯ + v θ ¯ , where θ ¯ denotes the initial foil geometry, discretized into a set of points that are encoded into this vector of point coordinates, whereas the vector θ ¯ corresponds to the resulting vector encoding of the shape after applying the modification procedure. For the generation of the augmented SSV, the geometry, v θ ¯ , with a vector of physics-informed quantities, μ ( v θ ¯ ) , is combined to form the final unique SSV, ϑ :
ϑ = v θ ¯ , μ ( v θ ¯ ) , p ϑ P R n p ,
where the function p ϑ incorporates both geometrical and physics-informed information, and n p = n + n μ , with n corresponding to the dimension of V , and n μ to the number of physics-informed quantities employed in the augmentation. To reduce the computation cost, quantities that are related to performance instead of actual performance metrics can be used. In this work, the foil’s geometric moment invariants (see Section 2.1.1) are mainly used, but performance metrics, namely, lift and drag coefficients, are also considered.
Finally, the KLE approach facilitates the determination of an appropriate set of orthonormal basis functions, { ϕ i ( ϑ ) } i = 1 κ , which will be used in the approximation of the initial design space, i.e.,
p ¯ ( ϑ ) = i = 1 u i ϕ i ( ϑ ) i = 1 κ u i ϕ i ( ϑ ) ,
where { ϕ i ( ϑ ) } i = 1 κ spans the latent space U , u = ( u 1 , u 2 , u i , , u κ ) is the vector of latent parameters, and κ is the number of eigenvectors that retain the required percentage of total variance in the given dataset. For the calculation of the eigenvectors/basis functions, the approach discussed extensively in Refs. [25,26,30] is adopted in this work. The interested reader may specifically study the full derivation of this approach for the case of airfoil design spaces in Ref. [30].
Apart from the KLE method mentioned above, geometric moment invariants, which are mainly used for the augmentation of the SSV (see Section 2.1.1), and the bounds, ( u l o w , u h i g h ) , employed for the resulting latent spaces (see Section 2.1.2), are also described.

2.1.1. SSV Augmentation—Geometric Moments

As mentioned before, SSV augmentation is performed with the use of a series of physics-informed quantities that lead to significant quality enhancements in the resulting latent spaces, as demonstrated in Ref. [26]. This approach addresses the limitations of conventional dimensionality reduction approaches, which often fail to preserve the full complexity of the shape and the underlying geometric structure. One obvious approach for the application at hand is to use performance metrics, such as lift and drag coefficients, to augment the SSV. However, such metrics can become computationally expensive, and therefore, following the insights of Khan et al. [26] and Masood et al. [30], geometric moment invariants are introduced as physical information substitutes. This addition not only encompasses additional integral geometric characteristics but also incorporates relevant physical properties of the designs, as geometric moments exhibit strong correlations with common performance metrics in airfoil design.
If Ω is used to denote the 2D domain, enclosed by a given 2D foil profile, the rth-order moments can be calculated using the following general equation:
M ( r ) = M p , q = + + x p y q ρ ( x , y ) d x d y , p , q { 0 , 1 , 2 , } , p + q = r .
In this expression, the “density” function ρ ( x , y ) assumes the value 1 when ( x , y ) Ω and 0 otherwise. However, as one may easily observe, the moments in Equation (3) depend on the shape’s rigid motions, whereas the common relevant performance metrics, i.e., lift and drag coefficients, are invariant to translations and uniform scaling. For that reason, appropriate scale- and translation-invariant moments should be used if noise and non-relevant information are to be blocked from entering the SSV. Moments that are invariant to translations, rotations, and scaling were presented in Ref. [32]. Since rotational invariance is unwanted, only the normalized version of central moments, which deliver the needed invariance with respect to uniform scaling and translations, are employed. Specifically, central moments are defined as
M ¯ ( r ) = M ¯ p , q = ( x c x ) p ( y c y ) q ρ ( x , y ) d x d y ,
where c = ( c X , x y ) corresponds to the centroid of Ω . Finally, normalization is performed to eliminate the scaling influence. This can be carried out by dividing by any of the moments, but picking a low-order one is computationally more stable. Hence, if M ¯ 0 , 0 is picked for normalization, the resulting moment reads
μ ( r ) = μ p , q = M ¯ p , q M ¯ 0 , 0 p + q + 2 2 ,
with μ p , q being the main quantities augmenting the SSV in this work. For a more detailed discussion regarding geometric moments and their invariants, the interested reader may refer to [26,30,32].

2.1.2. Latent Space Bounds

Design space bounds are generally easy to determine, especially when their generation is performed by parametric models that employ parameters with physical meaning. These bounds are of utmost importance, as they limit the design space to regions producing valid geometrical profiles, hence excluding regions that would produce infeasible and/or invalid designs, which would obviously impede the design optimization process. However, determining the bounds of latent parameters is a daunting task, as latent parameters have no physical interpretation. Nevertheless, setting appropriate bounds for the latent space is still a crucial step, as regions with infeasible or invalid shapes need to be excluded or minimized so that optimizers are not trapped in irrelevant design regions. At the same time, overly tight bounds may negatively effect the design space since they undermine the potential of generating rich spaces with novel designs. Specifically, in this work, although it is relatively easy to derive bounds for the parameters of the v vector in V , the same cannot be said for the latent vector u U . Although various methods are proposed in the pertinent literature, it is still hard to determine the values of ( u l o w , u h i g h ) in a way that would guarantee the satisfaction of all design requirements, i.e., a diverse and rich design space with no invalid/infeasible designs.
One approach entails the projection of the original design space bounds to the latent space which, although feasible, may over-constrain the latent space and exclude large useful regions. Another approach, which is computationally inexpensive and is commonly used in the pertinent literature, involves the use of the standard deviation for the mean design, placed at the center of the latent space. This approach achieves a good compromise between the aim of contracting regions with invalid designs and the requirement for a rich and diverse design space. Specifically, this approach involves the eigenvalues { λ i } i = 1 κ identified when calculating the basis functions in Equation (2).
u i α λ i , α λ i , i = 1 , , κ
where α is a whole number ranging from 1 to 3 and determines the number of standard deviations around the mean space, which will be used in the definition of the design space. It should also be noted here that the variance is represented by the sum of all eigenvalues, i.e., σ 2 = i = 1 λ i , which is also used for the determination of the number of eigenvectors sufficient for capturing the required percent of the total variance, i.e.,
i = 1 κ λ i β i = 1 λ i = β σ 2 , λ i λ i + 1 ,
where β % is the required variance in the latent space.

2.2. PaDGAN: Performance-Augmented Diverse Generative Adversarial Network

Traditional GANs [33] consist of two neural networks, a generator G and a discriminator D, that are trained simultaneously in an adversarial mode with the following objective function, including both generator and discriminator loss terms:
min G max D J ( D , G ) = E x P V ( x ) [ log D ( x ) ] + E z P z [ log ( 1 D ( G ( z ) ) ) ]
where x represents a sample of real data, drawn from the data distribution P V , and z is a random noise vector drawn from the noise distribution P z , while D ( x ) represents the discriminator’s output when evaluating the real data distribution, and D ( G ( z ) ) is the discriminator’s output when evaluating the generated data. In other words, G aims to minimize the objective, whereas D aims to maximize it.
Conventional GANs do not perform well when the real-world functional performance of designs and their physical feasibility for fabrication are taken into consideration [15]. Besides that, GANs often suffer from mode collapse [19], which means that G focuses on producing a limited set of designs deceiving D without being able to produce the full range of possible designs. In other words, G becomes fixated on a few dominant modes in the training data and fails to capture the full diversity of the data distribution, resulting in a lack of diversity and novelty in generated designs.
To address these issues, the PaDGAN algorithm [21] measures diversity and quality during training by incorporating a loss function that is based on a performance-augmented determinantal point process (DPP). DPPs are probabilistic models that are designed to efficiently subsample large sets of data and are well aligned with the objective of promoting design diversity without sacrificing quality. To model diversity and quality simultaneously, the performance-augmented DPP loss gives a lower value for both high-performance and diverse designs. Specifically, considering a DPP kernel matrix L B for a generated set of designs, B, each element can be written as
L B ( i , j ) = k ( x i , x j ) ( q ( x i ) q ( x j ) ) γ 0 ,
where k ( x i , x j ) is the similarity kernel between two designs, x i and x j , and q ( x ) is the performance function evaluated for x. The exponent γ 0 is added to control the contribution of the design’s performance: i.e., a value of γ 0 = 0 will obviously eliminate performance contributions, while a large exponent value will promote high-quality designs and undermine the diversity term’s effect. Now, using Equation (8), the performance-augmented DPP loss function can be written as
L P a D ( G ) = 1 | B | log det ( L B ) = 1 | B | i = 1 | B | log λ i ,
where λ i is the ith eigenvalue of the kernel matrix L B for the design set B. Finally, by including this loss term in the initial GAN objective function (see (7)), the PaDGAN objective function is derived:
min G max D J ( D , G ) + γ 1 L P a d ( G ) ,
where γ 1 controls the contribution of the performance-augmented DPP loss of the generator.

2.3. Dataset Generation

This study utilized two datasets, which were both derived from the publicly available UIUC foil design database [34]. In both cases, the approximately 1600 foil profiles residing in the UIUC database are enriched with a large number of artificial designs that are produced either by perturbations of the parametric model described below (dataset D 1 ) or synthesized by the Bézier-GAN approach described in Ref. [35] (dataset D 2 ).

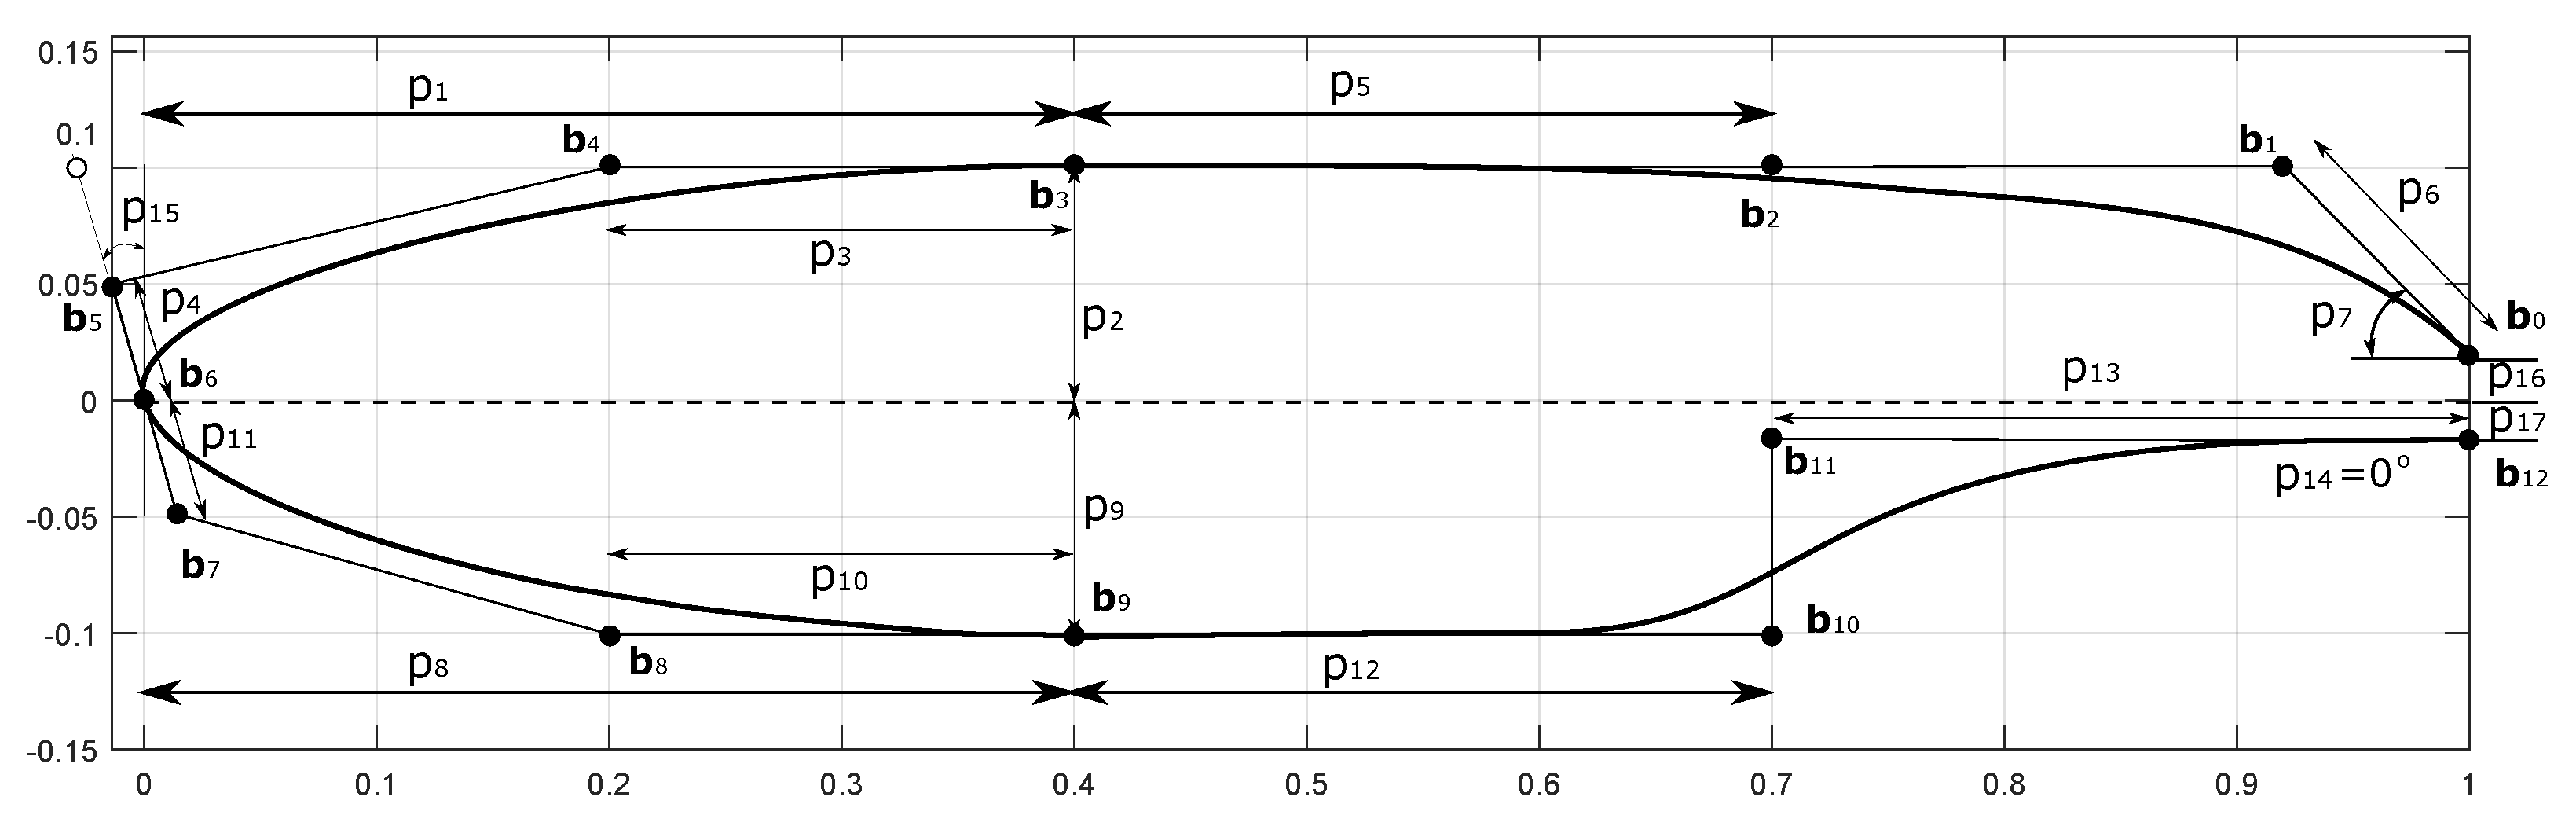
2.3.1. Parametric Model

The parametric model for airfoil/hydrofoil generation, initially presented in Ref. [2] and subsequently extended to encompass a broader range of designs in Refs. [36,37], has been extensively used in the generation of D 1 . The parametric model proposed by Kostas et al. in Ref. [36] was selected, as it is specifically designed to meet the particular requirements of design optimization, i.e., the guaranteed generation of valid foil geometries using parameters with physical interpretations and high representational capacity, as it can approximate, within Kulfan tolerance [6,38], all profile designs residing in the UIUC database. The adopted foil parametric model in this work generates each foil profile instance as a cubic NURBS curve of order 4 with 13 control points from a nondimensionalized design vector p P R 17 with P [ 0 , 1 ] 17 , as is depicted in Figure 1. For a detailed description of the construction and parametric definition of the foil profile, readers are encouraged to refer to Ref. [36].
The process is initiated by approximating the foil profile designs in the UIUC database with the above-mentioned parametric model, which results in approximately 1600 parameter vectors p . Subsequently, for each design vector, five random perturbations are generated within ± 5 % of the original design vector’s parametric values. Hence, following the exclusion of a small number of inappropriate or nearly identical designs found in the UIUC database, a core set comprising 1263 foil designs was identified for processing. For each of these base designs, as mentioned above, five random shape perturbations were generated, resulting in a total of 1263 + 5 × 1263 = 7578 foil designs constituting the first design dataset, D 1 .

2.3.2. Augmented Airfoil

The second dataset, D 2 , is once again based on the UIUC airfoil database, but this time, the additional artificial designs are produced by employing BézierGAN [39], which was trained using the UIUC dataset, as described in Ref. [35]. Specifically, BézierGAN produces smooth curves by synthesizing the control points, weights, and parameterization of rational Bézier curves that correspond to artificial foil profiles. In the last stage, these profiles were discretized to generate the corresponding SSVs needed in this work. This second dataset contains a total of 38,802 foil designs.

2.3.3. Discretization

For both datasets, D 1 and D 2 , the geometric component of the SSVs is produced by discretizing the corresponding smooth profile curves, which can generally be represented by parametric NURBS curves. The process of discretization involves transforming the continuous foil profile representation into a polygonal approximation, which can then be stored as a vector of point coordinates for further processing. However, as demonstrated by Masood et al. [30], this discretization, i.e., the point distribution on the profile curve, has a significant impact on the quality of the produced latent space. Therefore, the following four distinct discretization methods for producing N points on the foil profile are explored in this work:
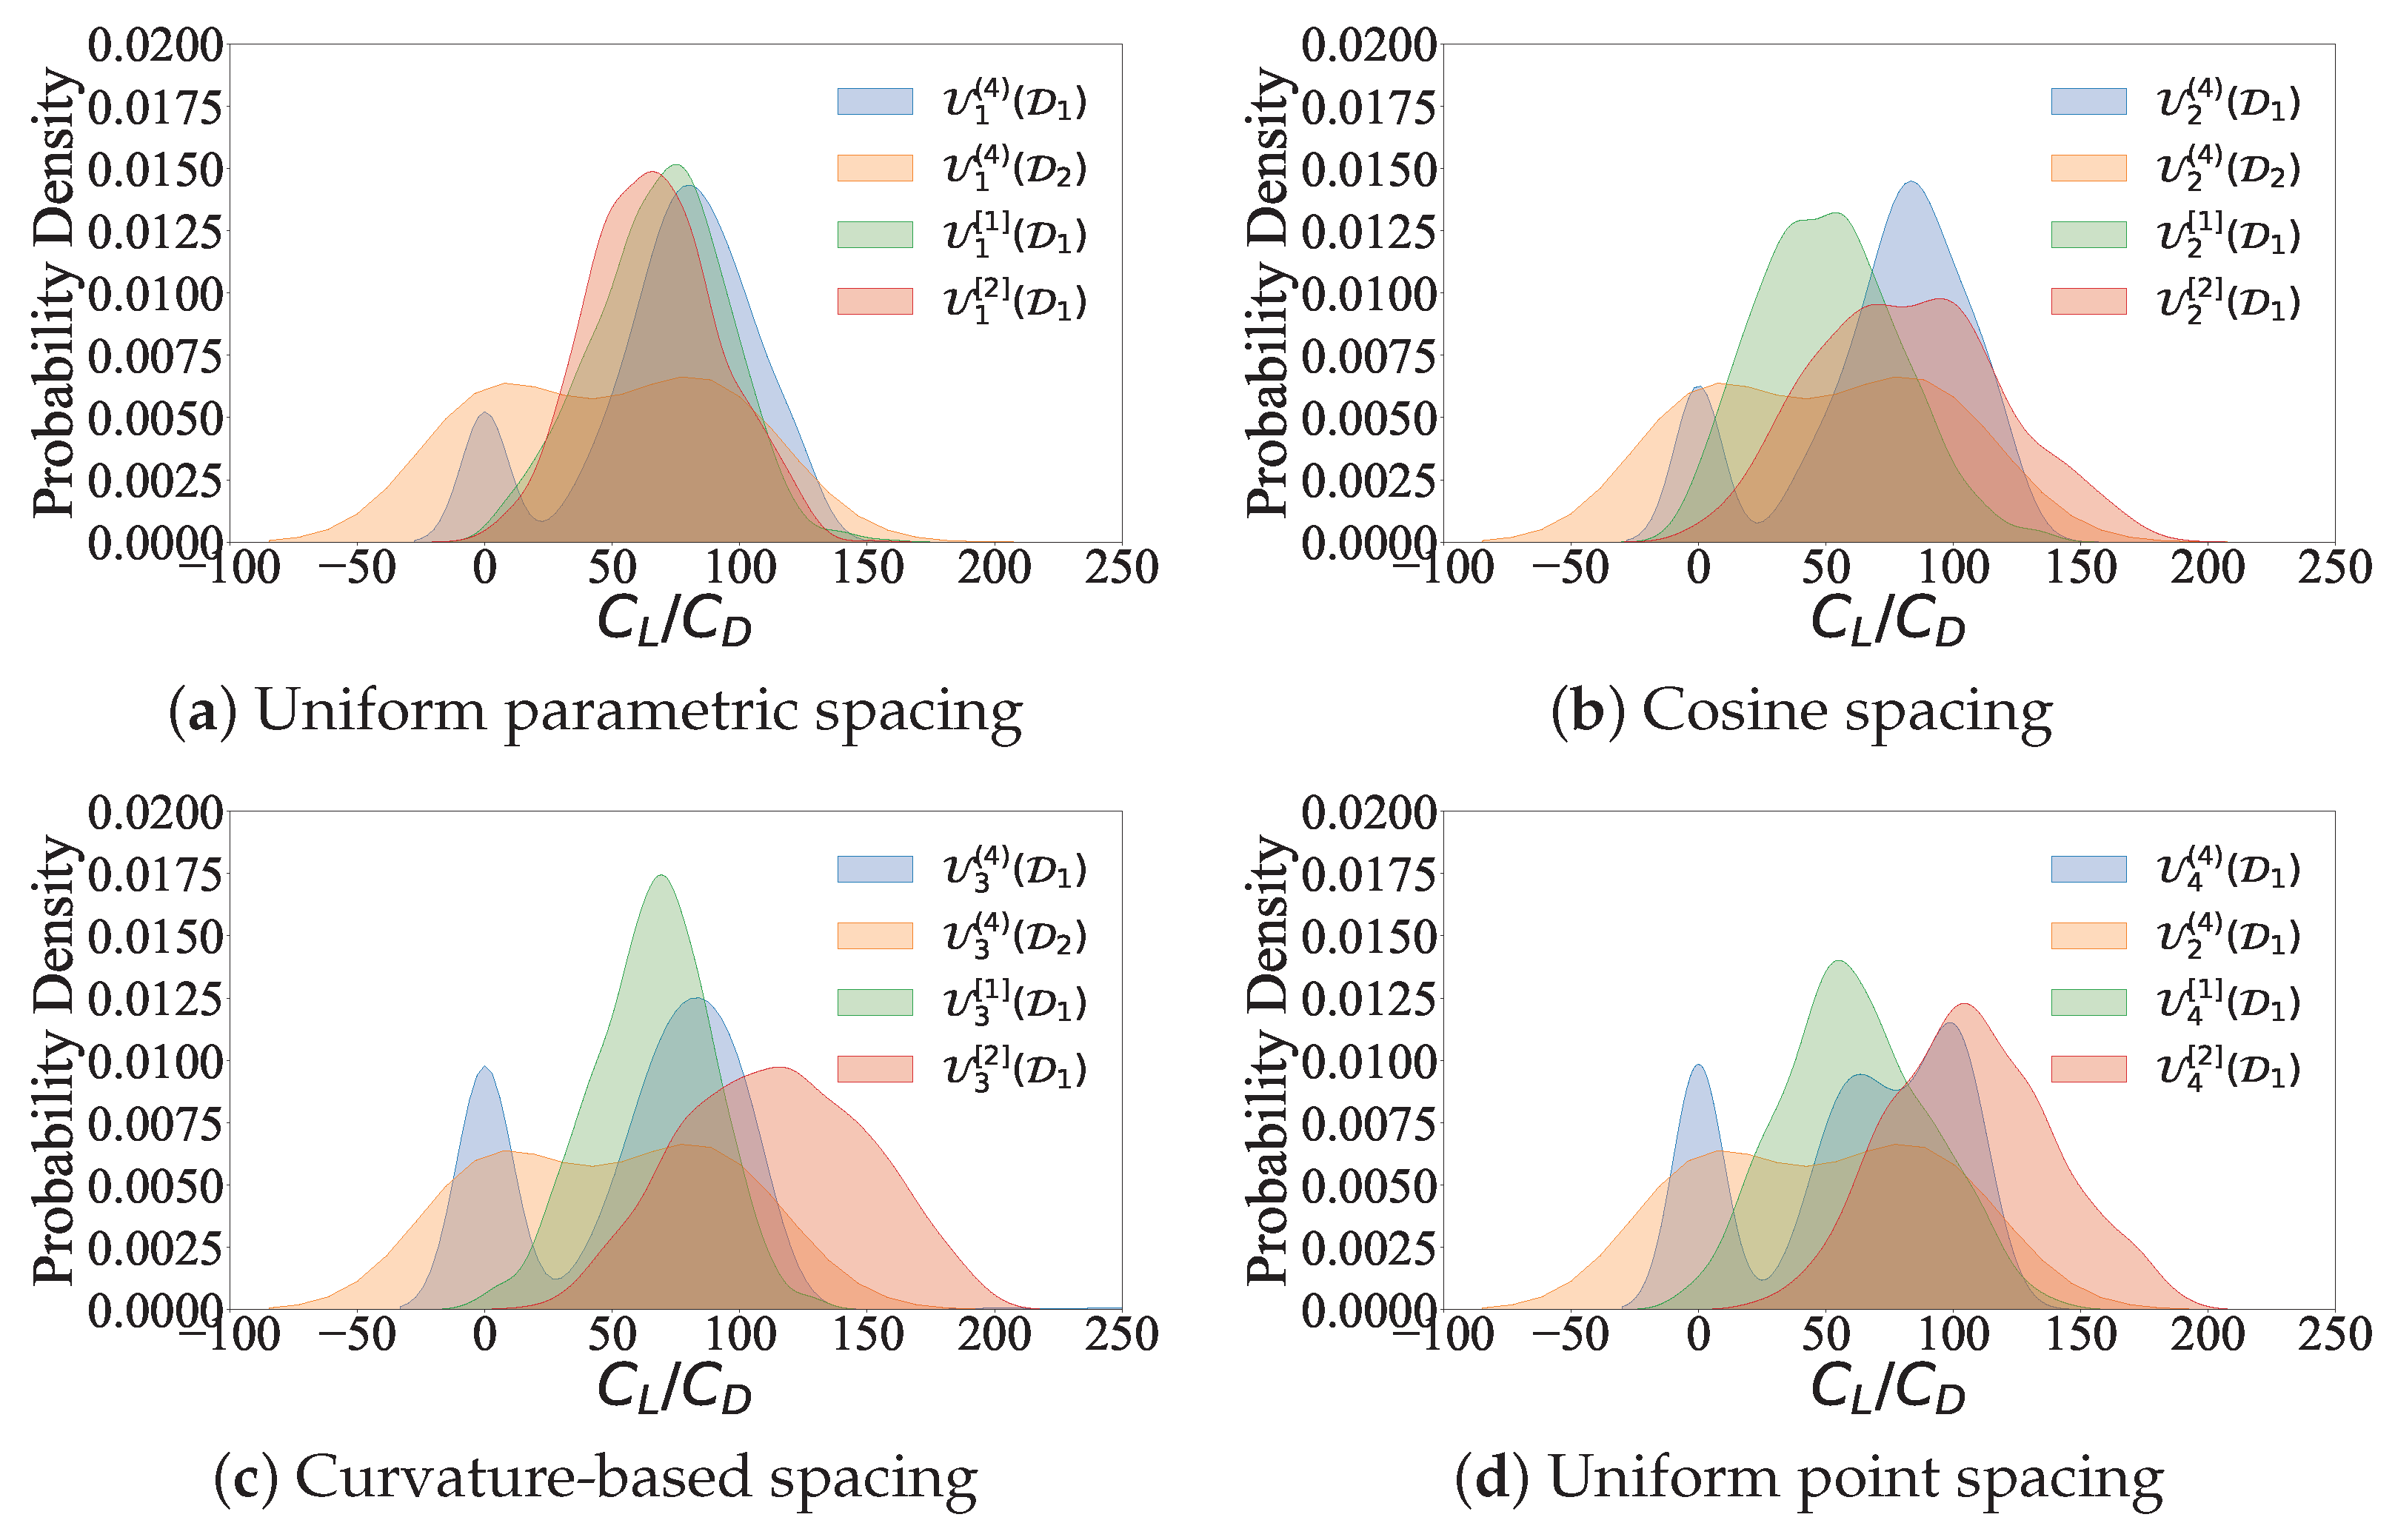
  • Uniform Parametric Spacing: N parametric values, t 1 , , t N , uniformly distributed over the curve’s parametric domain are selected. The resulting N points, { p ( t i ) } i = 1 N , are subsequently used in the curve encoding; see Figure 2a.
  • Cosine Spacing: A re-parameterization of all NURBS curves using the cosine function is performed. This re-parameterization results in the concentration of the generated curve points near the leading and trailing edges of the profile; see Figure 2b.
  • Curvature-Based Spacing: In this approach, the profile’s curvature is utilized to determine the distribution of parametric values. More precisely, parametric points are distributed to ensure an equal curvature integral across all parametric intervals. Consequently, this method leads to a significant point concentration near regions of high curvature, e.g., the leading edge region; see Figure 2c.
  • Uniform Point Spacing: Finally, this approach discretizes the profile by computing segments of equal arc length on the curve; see Figure 2d.
Obviously, apart from the point distribution, their number, N, plays an equally significant role in both the shape’s encoding and the evaluation of the design’s performance. Therefore, taking into account the requirements of the computational package XFOIL [40,41], used in analyzing foil performance, along with the need for an accurate geometric representation of the dataset, a value of N = 200 is used, which achieves a generally low approximation error, and it is also sufficient for performing the evaluation in XFOIL.

2.4. Quality Analysis Metrics

In this section, the quality metrics are defined, which will be used in assessing the generated latent spaces using the two approaches described in Section 2.1 and Section 2.2. These metrics are employed in Section 3, where a systematic comparison is performed.
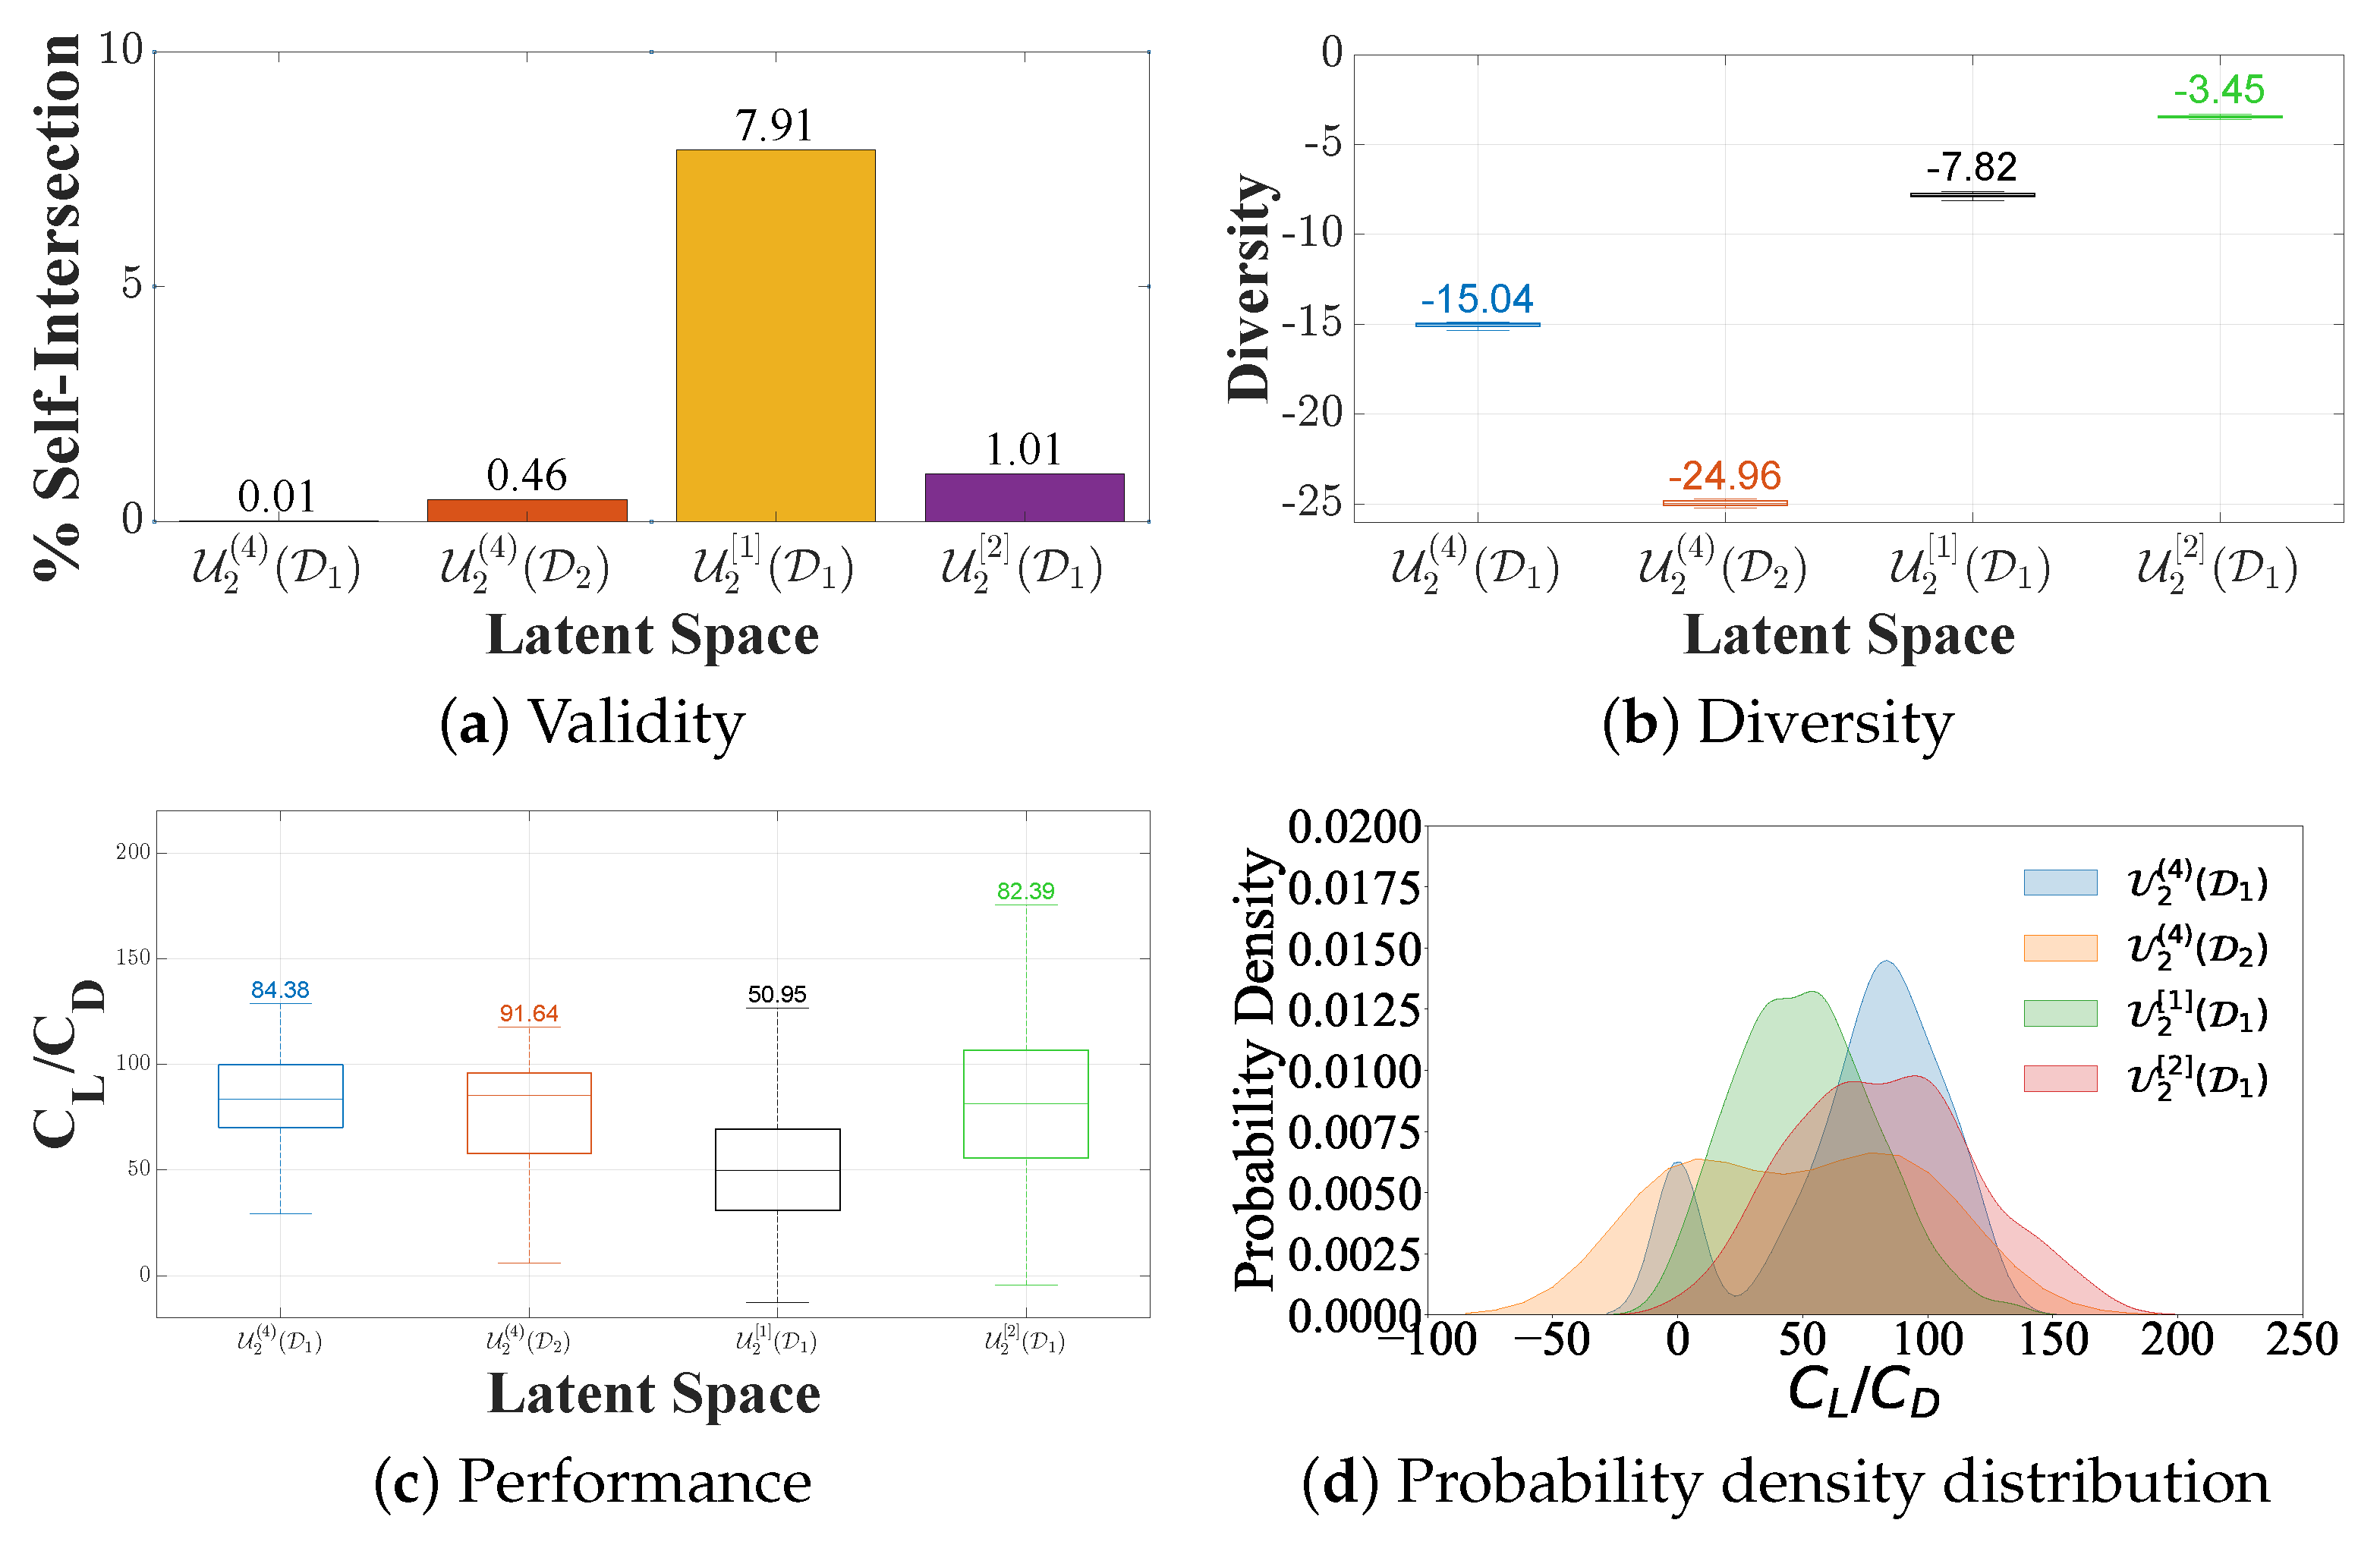
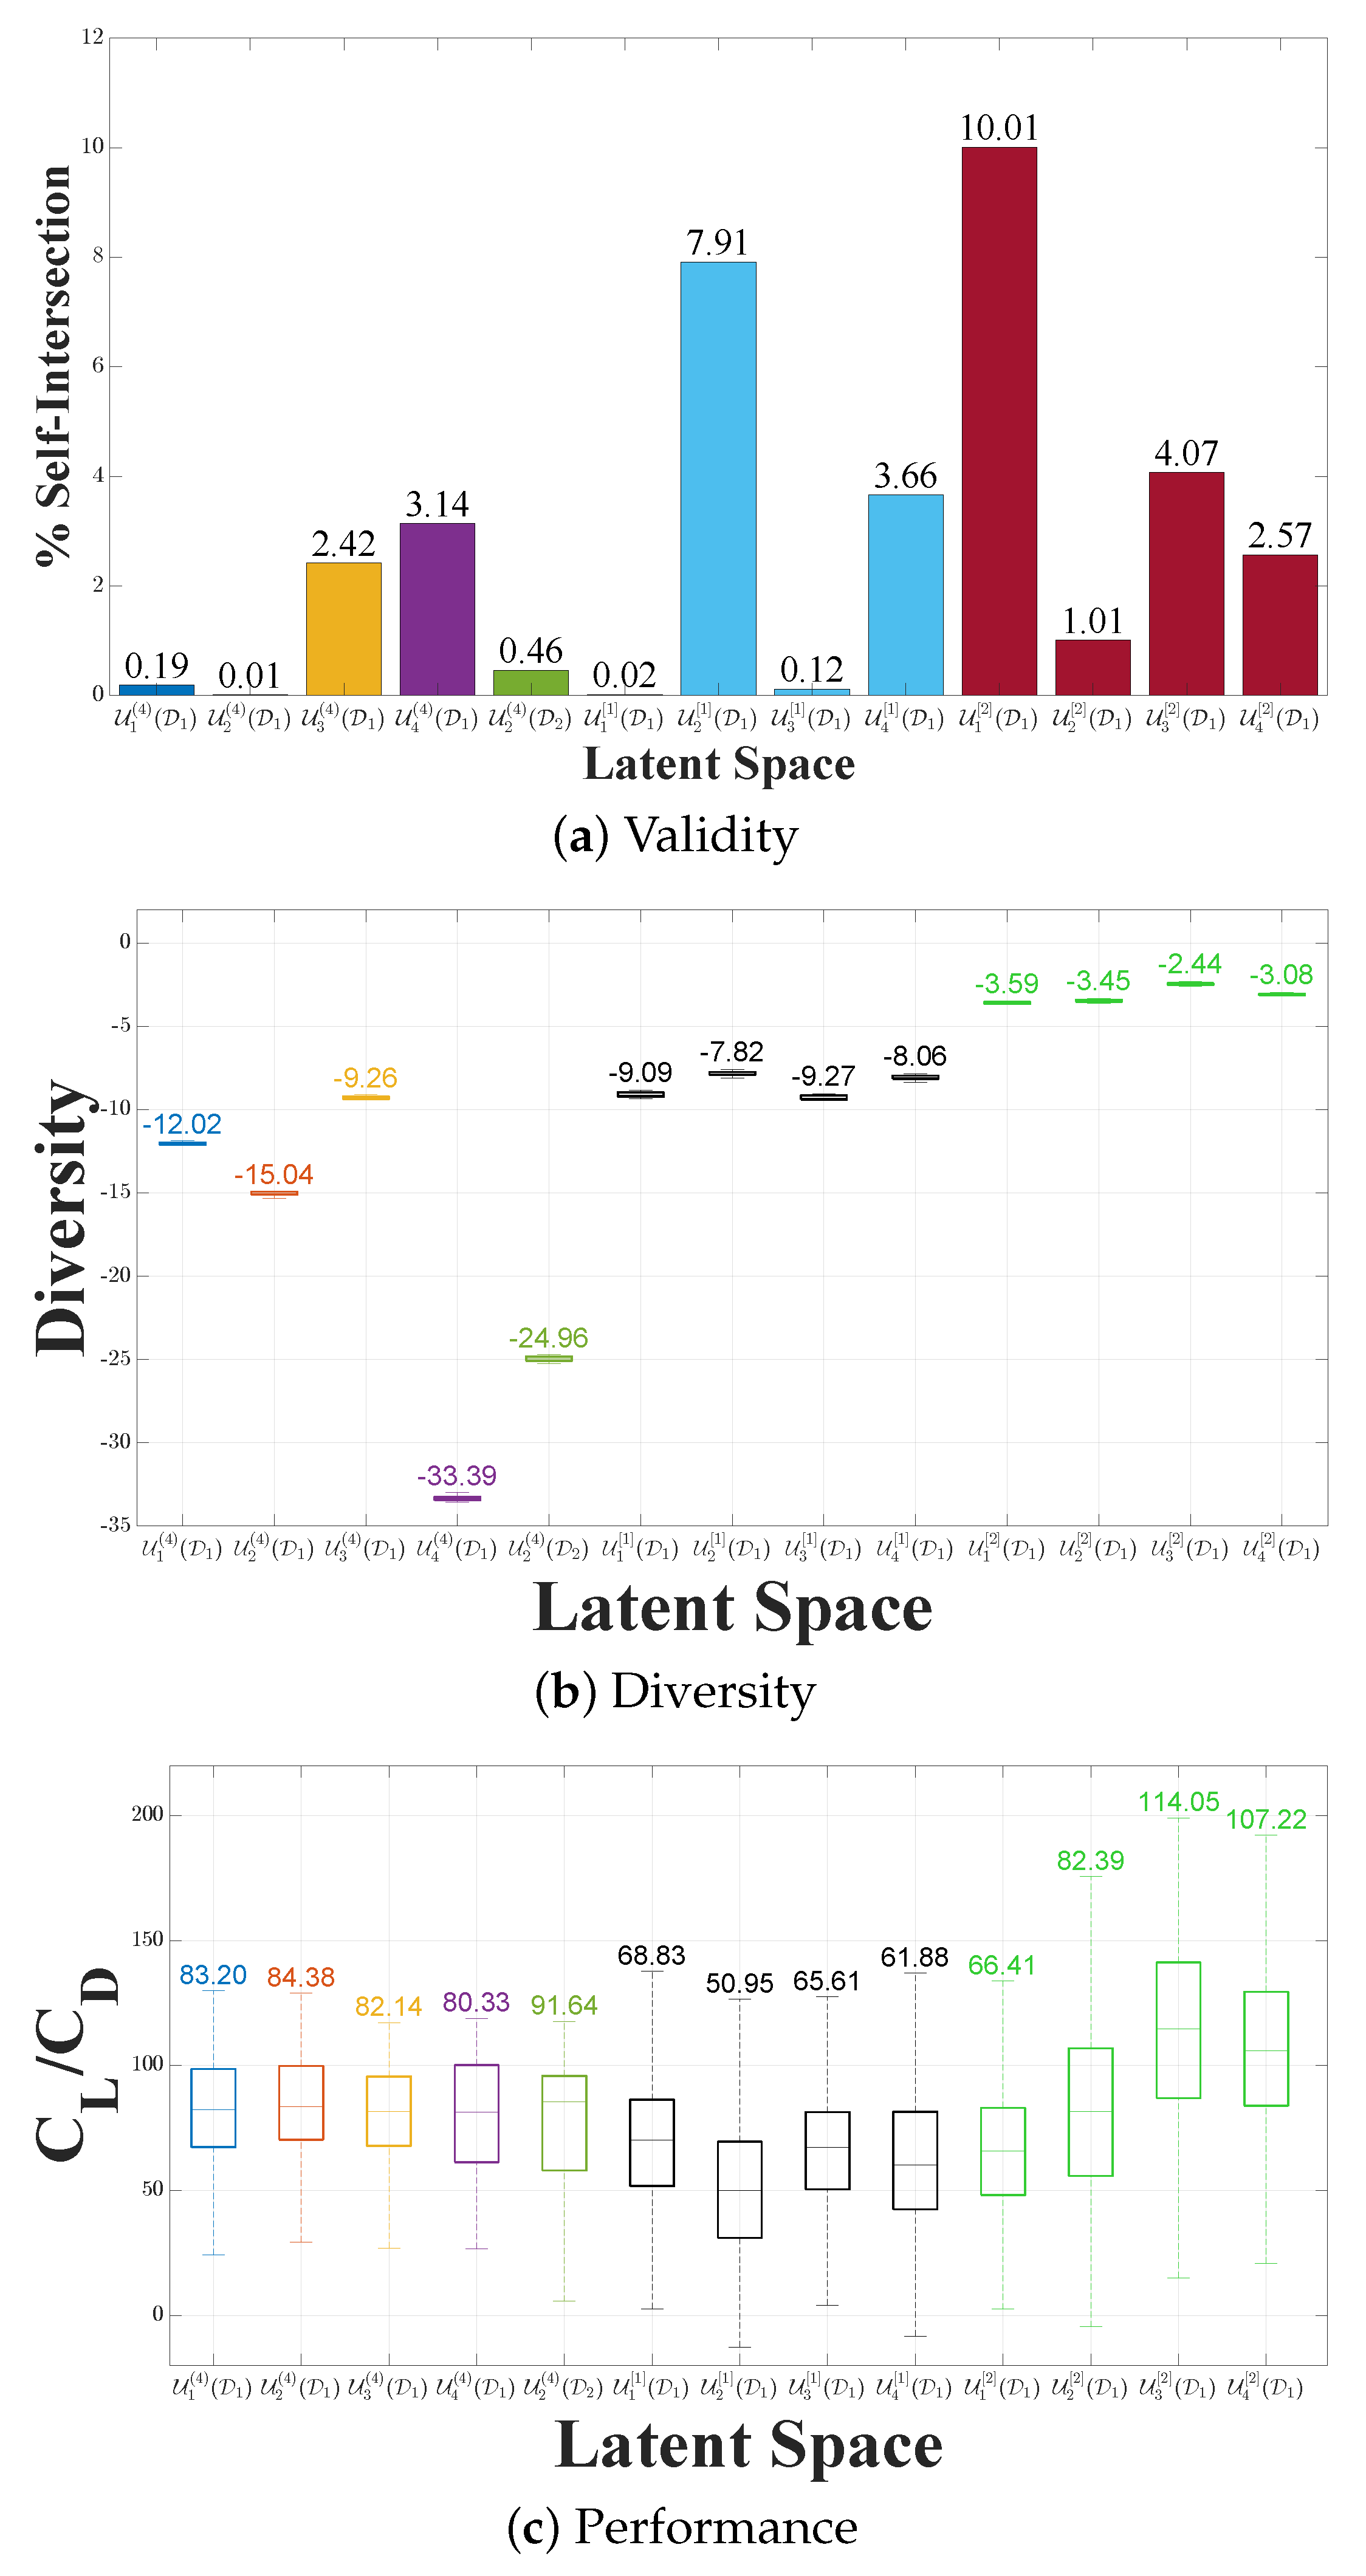
  • Design Validity: Ensuring shape validity is a critical aspect for a robust latent design space. Space validity aims at eliminating, to the extent possible, invalid shapes, such as self-intersecting or undulating profiles, from the design space. Obviously, self-intersections can lead to ambiguous or erroneous interpretations, and high design validity is essential for maintaining fidelity and interpretability in the reduced-dimensional representation. Self-intersections can be easily checked with a line–line self-intersection algorithm applied to polygonal approximations of the profiles. To check undulations, unwanted inflection points in the curvature graph can be identified.
  • Design Diversity: Diversity pertains to the richness/variability of the latent space designs. Assessing diversity in a latent space offers insights into the space’s capability to represent a broad spectrum of profiles, ultimately preventing the undesirable case where the space contracts into a small region with very similar designs. A diverse latent space signals the underlying model’s capacity to capture the inherent complexity and variability present in the data. The similarity kernel in Equation (8), computed for a large number of random designs in the latent space, can be used to this end.
  • Design Performance: Finally, the functional performance of the designs residing in the latent space is obviously of utmost significance, especially when performance-based optimization is being considered. The lift-to-drag ratio C L / C D for a given set of positive angles of attack was used in this work to capture the aerodynamic/hydrodynamic performance of each profile design. High values indicate the achievement of large lift forces without imposing a drag penalty, whereas lower values will generally indicate less preferable designs. For the evaluation of both coefficients, the XFOIL computational package was employed, which is a widely used and validated computational tool for airfoil analysis.

3. Results and Discussion

In this part, the results of a systematic comparison between the latent spaces generated by the enhanced non-generative model (SSV-KLE-based approach described in Section 2.1) and the performance-augmented generative model (PaDGAN model described in Section 2.2) are presented. At the same time, for reference reasons, the corresponding results of a conventional GAN model (see Equation (7)) are also presented. Latent space assessment is performed using the metrics described in Section 2.4, with all discretization approaches being applied in the comparison.

3.1. Latent Space Generation

For all methods, the initial step involves the determination of the shape signature vector (SSV) which will be used for each design encoding. For the SSV-KLE-based approach, seven distinct SSVs are considered: one based solely on point coordinates, with the remaining six being augmented with performance-informed components (either directly via the lift-to-drag ratio or indirectly via geometric moments). In addition, for the point distribution, four different shape discretizations are considered. Therefore, seven latent spaces for each discretization are ultimately produced. Table 1 includes these seven latent spaces ( U ) based on the SSV, which was used to produce them using the SSV-KLE-based approach.
With regard to latent spaces constructed by the GAN and PaDGAN, SSVs with geometric information, i.e., profile point coordinates, are only employed, as PaDGAN already encapsulates a performance-informed layer, as can be observed in Equations (8) and (10). Augmented SSVs cannot be utilized with the GAN model, and similarly to PaDGAN, only varying discretizations of the foil geometry are considered. Therefore, the corresponding latent spaces included in Table 2 are differentiated only by the point distribution method used in the profiles’ discretization.

3.2. Design Space Quality Comparisons

The analysis conducted here aims to quantify and compare the suitability of the resulting subspaces for design exploration and optimization. In this context, their ability to effectively capture the underlying shape structure, using the latent parameter vector u , and whether they can generate valid and diverse geometries are evaluated. At the same time, the quality of the design space in terms of the target functional performance is also measured. The three quality metrics described in Section 2.4, validity, diversity, and performance, are used to assess the capacity of the space to generate valid profiles (validity) with a wide range of varying shapes (diversity) while targeting high-performance profiles (performance).
Validity is measured in terms of the percentage of invalid shapes present in the latent space. Ideally, latent spaces that eliminate or at least minimize the percentage of invalid designs are obviously preferred. Diversity is assessed by measuring the similarity for all pairs of designs stemming from each latent space, while performance comparisons are performed with the lift-to-drag ratio estimated with the XFOIL computation package. The actual calculation is performed by averaging the resulting values for multiple randomly generated samples with 10,000 designs each.
Although varying SSVs (with and without augmentation) along with different discretizations were tested, the presentation begins by focusing on the cosine spacing, augmented with fourth-order geometric moments for the SSV-KLE-based approach, which consistently yielded good results across all quality metrics for both models and datasets. As illustrated in Figure 3a, the SSV-KLE-based approach achieves the best results in terms of validity, as it produces a highly robust latent space with only 0.01 % invalid designs for the D 1 dataset and a slight higher value ( 0.46 % ) for D 2 . The corresponding latent space for the PaDGAN approach results in 1.01 % invalid designs, which is approximately twice the value achieved by the non-generative SSV-KLE-based approach. Finally, the non-enhanced GAN model produces a latent space with a significantly larger percentage of invalid designs— 7.91 % . In light of the results, it becomes evident that, with appropriate design encoding, the non-generative model (SSV-KLE-based approach) can easily outperform both generative models (GAN and PaDGAN) in terms of robustness.
The diversity score evaluates the latent space’s capability to generate novel designs. To obtain a fair assessment, all invalid designs in the set of 10,000 sampled designs from each latent space are removed. Subsequently, the remaining designs are divided into 10 subsets and the maximum diversity for each subset is calculated. As depicted in Figure 3b, the latent space generated by the non-generative model (SSV-KLE-based approach) exhibits a lower diversity compared to the generative models. Specifically, the average diversity scores for D 1 and D 2 datasets are 15.04 and 24.96 , respectively, while the generative models, GAN and PaDGAN, achieve higher average diversity scores of 7.82 and 2.44 , respectively. Although the non-generative model with the parametric dataset shows lower diversity, the distance from the generative models is relatively small, especially when considering the former’s linear nature compared to the nonlinear characteristics of the latter models.
While higher diversity in the latent space increases the possibility of discovering optimal designs, it is important to note that having a space with higher diversity does not guarantee the inclusion of high-performing designs in the latent space. Therefore, the combination of performance indicators and quality metrics is more indicative of the appropriateness of each latent space. For the performance indicator, invalid designs are once again removed to ensure that subsequent aerodynamic evaluations are performed on valid and meaningful designs. To assess the performance indicator of each latent space, the C L / C D ratio is evaluated for a fluid flow with the Reynolds number (Re) set to 500,000 and the Mach number (Ma) set to 0.00 at an angle of attack of 3 degrees. This performance indicator metric provides insights into the aerodynamic efficiency of the airfoil designs represented in the latent space under specific flow conditions. As illustrated in Figure 3c, the average performance achieved by both non-generative and generative models is comparable for both datasets. Notably, the SSV-KLE-based approach coupled with D 2 results in an average performance indicator of 91.64 , which is the best among all tested latent spaces. Interestingly, the GAN model achieves the least favorable average performance value of only 50.95 . Nevertheless, the average value of this performance indicator provides only an indication of which latent space may yield the best designs. However, one cannot rely solely on this metric, as it might not capture the nuances and variability within the design space. To gain a more comprehensive understanding, it is crucial to consider additional metrics and analyses that further explore the distribution and diversity of designs within each latent space.
A noteworthy observation obtained from Figure 3c is that the enhanced generative model, i.e., PaDGAN, exhibits a widely spread design distribution. This suggests a higher diversity in the design space, which is attributed to the inclusion of the DPP kernel and its loss (9), in addition to the traditional GAN loss function. However, for the second dataset ( D 2 ), the non-generative model exhibits a non-balanced distribution of designs above and below the average value, which indicates a more narrow high-performing region and a more diverse low-performing region. In contrast, when the same model is used with the first dataset ( D 1 ), a more balanced distribution is obtained, with designs distributed uniformly around the average value of ( 84.38 ) . Intriguingly, even in this dataset, the average performance value ( 82.39 ) of the SSV-KLE-based approach outperforms, once again, the enhanced generative model (PaDGAN).
Finally, Figure 3d, which depicts kernel density estimates, provides some further insights into these results. The generative models, GAN and PaDGAN, exhibit a less concentrated distribution over the region of high-performing designs. As for the non-generative model, it exhibits an almost uniform distribution when D 2 is used with a high concentration over symmetric and high-performing designs when D 1 is employed; observe the two distinct peaks when D 1 is used.
To assess the computational cost for both models, the models’ construction was performed on the same PC equipped with a dual 24-core 2.7 GHz Intel Xeon Gold 6226 CPU and 128 GB of memory. For D 1 , the PaDGAN model required approximately 199.08 h, while the SSV-based KLE approach concluded its construction in 9.98 h. Similarly, for D 2 , PaDGAN required 199.91 h, whereas the SSV-based KLE approach was constructed in 59.09 h. These results clearly demonstrate that the SSV-based KLE approach poses significantly lower computational requirements when compared to the generative approach.

Effect of Discretization

As previously discussed, the distribution of points along the curve significantly influences the quality of the achieved latent space. In this comparison, the focus is on the D 1 dataset for both generative and non-generative models. By examining Figure 4a, one may clearly notice a distinct influence of different discretization methods on the validity of the latent space. For example, the non-generative model employing the uniform point spacing exhibits a notable increase in invalid designs ( 3.14 % ) . For the PaDGAN approach, the latent space with uniform parametric spacing produces the worst-performing latent space with a significantly elevated percentage of invalid designs, reaching 10.01 % . These results highlight the sensitivity of all models, especially generative ones, to the employed point distribution.
With regard to diversity, a rather mild effect of the discretization scheme is observed when generative models are considered; see Figure 4b. However, the effect of the discretization scheme on the SSV-KLE-based approach is pronounced, with average diversity values ranging widely from 33.39 to 9.26 . The PaDGAN approach achieves the highest value when curvature-based spacing is employed, with an average diversity score of 2.44 .
Furthermore, in terms of the performance indicator, Figure 4c depicts the impact of the discretization scheme on performance values, as performance values vary for D 1 in all models, although less so for the SSV-KLE-based approach. Notably, curvature-based spacing with PaDGAN achieves the highest performance, with an average value of 114.05 , suggesting its favorable performance and diversity characteristics in the case of generative models. This is another indicative example of generative models’ sensitivity to the discretization type.
Finally, Figure 5 visualizes the substantial impact of discretizations on probability density distributions. Specifically, as seen in Figure 5a, the uniform parametric spacing produces latent spaces with similar distributions for all models. However, when curvature-based spacing (Figure 5c) and uniform point spacing (Figure 5d) are used, a significant shift toward high-performing regions is exhibited for PaDGAN, while the SSV-KLE-based method produces an increased number of designs in the vicinity of the symmetrical design region. The GAN model also exhibits changes but to a lesser extent.

4. Conclusions and Future Work

In this work, the performance and efficiency of generative and non-generative models in the field of engineering design synthesis were compared, while at the same time, it was demonstrated how recent enhancements in these models can effectively revolutionize the process. The presented approaches are primarily useful during the conceptual and initial design phases, where designers need to quickly explore a wide range of potential designs and be able to cost-effectively assess their performance with respect to application-specific criteria before moving on to the detailed design phase. However, even in later stages, design spaces of reduced dimensions can facilitate the design optimization process and speed up the design process. The PaDGAN model, specifically designed for engineering design synthesis applications, is compared with a non-generative linear KLE-based approach. This study illustrates that the employed discretization in the shape representation significantly affects the performance of both approaches, emphasizing the importance of the representation of the design dataset. Additionally, augmenting profile encodings with integral shape characteristics and physics-informed parameters significantly improves the quality of the resulting latent spaces and the efficacy of the KLE-based approach.
In summary, this study demonstrates that non-generative models, which are linear and cost-effective, can achieve results on par with those of generative models.
Design spaces for airfoils and/or hydrofoils have been employed in this comparison, and although they are important design elements for both aviation and marine industries, they are only 2D designs in nature. An obvious future extension of this work would address the 3D shape synthesis of more complicated functional surfaces, such as wings, blades, propellers, and others, and conduct optimization with appropriate objective functions and constraints to provide a more insightful comparison between these models. At the same time, the models presented in this work can find applications as conceptual design assistants, which could be implemented as design wizard applications in modern CAD engineering software packages, by building a generic parametric model coupled with a surrogate model to predict the qualities of interest (QoIs) and then formulate distinct design exploration modes to cater to different levels of designer involvement [17].

Author Contributions

Conceptualization, S.K., Z.M., M.U., K.K. and P.D.K.; methodology, S.K., Z.M., M.U., K.K. and P.D.K.; software, S.K., Z.M. and M.U.; validation, S.K., Z.M. and M.U.; formal analysis, S.K., Z.M. and M.U.; resources, K.K. and P.D.K.; data curation, S.K., Z.M. and M.U.; writing—original draft preparation, Z.M. and M.U.; writing—review and editing, S.K., Z.M., M.U., K.K. and P.D.K.; supervision, K.K. and P.D.K.; project administration, K.K. and P.D.K.; funding acquisition, K.K. and P.D.K. All authors have read and agreed to the published version of the manuscript.

Funding

This work received funding from Nazarbayev University, Kazakhstan, under the Faculty Development Competitive Research Grants Program 2022–2024 “Shape Optimization of Free-form Functional surfaces using isogeometric Analysis and Physics-Informed Surrogate Models—SOFFA-PHYS”, Grant Award Nr. 11022021FD2927 (PI: K.V. Kostas), and the European Union’s Horizon-2020 Research and Innovation Programme under the Marie Skłodowska-Curie grant agreement No. 860843—“GRAPES: Learning, Processing and Optimising Shapes” (PI: I. Emiris, Site Leader: P.D. Kaklis).

Institutional Review Board Statement

Not applicable.

Informed Consent Statement

Not applicable.

Data Availability Statement

The raw data required to reproduce findings in this work are available from Zahid Masood and Muhammad Usama upon email request ([email protected] and [email protected]).

Conflicts of Interest

Shahroz Khan was employed by BAR Technologies. The remaining authors declare that the research was conducted in the absence of any commercial or financial relationships that could be construed as a potential conflict of interest. The funders had no role in the design of the study; in the collection, analyses, or interpretation of data; in the writing of the manuscript; or in the decision to publish the results.

References

  1. Kostas, K.; Ginnis, A.; Politis, C.; Kaklis, P. Ship-hull shape optimization with a T-spline based BEM–isogeometric solver. Comput. Methods Appl. Mech. Eng. 2015, 284, 611–622. [Google Scholar] [CrossRef]
  2. Kostas, K.; Ginnis, A.; Politis, C.; Kaklis, P. Shape-optimization of 2D hydrofoils using an Isogeometric BEM solver. Comput.-Aided Des. 2017, 82, 79–87. [Google Scholar] [CrossRef]
  3. Khan, S.; Goucher-Lambert, K.; Kostas, K.; Kaklis, P. ShipHullGAN: A generic parametric modeller for ship hull design using deep convolutional generative model. Comput. Methods Appl. Mech. Eng. 2023, 411, 116051. [Google Scholar] [CrossRef]
  4. Usama, M.; Arif, A.; Haris, F.; Khan, S.; Afaq, S.K.; Rashid, S. A data-driven interactive system for aerodynamic and user-centred generative vehicle design. In Proceedings of the 2021 International Conference on Artificial Intelligence (ICAI), Islamabad, Pakistan, 5–7 April 2021; pp. 119–127. [Google Scholar]
  5. Khan, S.; Awan, M.J. A generative design technique for exploring shape variations. Adv. Eng. Inform. 2018, 38, 712–724. [Google Scholar] [CrossRef]
  6. Kulfan, B.M. Universal parametric geometry representation method. J. Aircr. 2008, 45, 142–158. [Google Scholar] [CrossRef]
  7. Oh, S.; Jung, Y.; Kim, S.; Lee, I.; Kang, N. Deep generative design: Integration of topology optimization and generative models. J. Mech. Des. 2019, 141, 111405. [Google Scholar] [CrossRef]
  8. Burnap, A.; Hauser, J.R.; Timoshenko, A. Design and Evaluation of Product Aesthetics: A Human-Machine Hybrid Approach; Elsevier: Amsterdam, The Netherlands, 2021. [Google Scholar]
  9. Shu, D.; Cunningham, J.; Stump, G.; Miller, S.W.; Yukish, M.A.; Simpson, T.W.; Tucker, C.S. 3d design using generative adversarial networks and physics-based validation. J. Mech. Des. 2020, 142, 071701. [Google Scholar] [CrossRef]
  10. Goodfellow, I.; Pouget-Abadie, J.; Mirza, M.; Xu, B.; Warde-Farley, D.; Ozair, S.; Courville, A.; Bengio, Y. Generative adversarial nets. In Proceedings of the Advances in Neural Information Processing Systems 27 (NIPS 2014), Montreal, QC, Canada, 8–13 December 2014; Volume 27. [Google Scholar]
  11. Kingma, D.P.; Welling, M. Auto-encoding variational bayes. arXiv 2013, arXiv:1312.6114. [Google Scholar]
  12. Yang, Z.; Li, X.; Catherine Brinson, L.; Choudhary, A.N.; Chen, W.; Agrawal, A. Microstructural materials design via deep adversarial learning methodology. J. Mech. Des. 2018, 140, 111416. [Google Scholar] [CrossRef]
  13. Zhang, W.; Yang, Z.; Jiang, H.; Nigam, S.; Yamakawa, S.; Furuhata, T.; Shimada, K.; Kara, L.B. 3D shape synthesis for conceptual design and optimization using variational autoencoders. In Proceedings of the International Design Engineering Technical Conferences and Computers and Information in Engineering Conference, Anaheim, CA, USA, 18–21 August 2019; Volume 59186, p. V02AT03A017. [Google Scholar]
  14. Chen, W.; Chiu, K.; Fuge, M.D. Airfoil design parameterization and optimization using bézier generative adversarial networks. AIAA J. 2020, 58, 4723–4735. [Google Scholar] [CrossRef]
  15. Regenwetter, L.; Nobari, A.H.; Ahmed, F. Deep generative models in engineering design: A review. J. Mech. Des. 2022, 144, 071704. [Google Scholar] [CrossRef]
  16. Chen, W.; Ahmed, F. MO-PaDGAN: Reparameterizing Engineering Designs for augmented multi-objective optimization. Appl. Soft Comput. 2021, 113, 107909. [Google Scholar] [CrossRef]
  17. Khan, S.; Kaklis, P.; Goucher-Lambert, K. How Does Agency Impact Human-AI Collaborative Design Space Exploration? A Case Study on Ship Design with Deep Generative Models. In Proceedings of the ASME 2023 International Design Engineering Technical Conferences and Computers and Information in Engineering Conference, Boston, MA, USA, 20–23 August 2023; Volume 3B, p. V03BT03A055. [Google Scholar]
  18. Srivastava, A.; Valkov, L.; Russell, C.; Gutmann, M.U.; Sutton, C. Veegan: Reducing mode collapse in gans using implicit variational learning. In Proceedings of the Advances in Neural Information Processing Systems 30 (NIPS 2017), Long Beach, CA, USA, 4–9 December 2017; Volume 30. [Google Scholar]
  19. Salimans, T.; Goodfellow, I.; Zaremba, W.; Cheung, V.; Radford, A.; Chen, X. Improved techniques for training gans. In Proceedings of the Advances in Neural Information Processing Systems 29 (NIPS 2016), Barcelona, Spain, 5–10 December 2016; Volume 29. [Google Scholar]
  20. Mirza, M.; Osindero, S. Conditional generative adversarial nets. arXiv 2014, arXiv:1411.1784. [Google Scholar]
  21. Chen, W.; Ahmed, F. Padgan: Learning to generate high-quality novel designs. J. Mech. Des. 2021, 143, 031703. [Google Scholar] [CrossRef]
  22. Borodin, A. Determinantal point processes. arXiv 2009, arXiv:0911.1153. [Google Scholar]
  23. Kulesza, A.; Taskar, B. Determinantal point processes for machine learning. Found. Trends Mach. Learn. 2012, 5, 123–286. [Google Scholar] [CrossRef]
  24. D’Agostino, D.; Serani, A.; Diez, M. Design-space assessment and dimensionality reduction: An off-line method for shape reparameterization in simulation-based optimization. Ocean Eng. 2020, 197, 106852. [Google Scholar] [CrossRef]
  25. Diez, M.; Campana, E.F.; Stern, F. Design-space dimensionality reduction in shape optimization by Karhunen–Loève expansion. Comput. Methods Appl. Mech. Eng. 2015, 283, 1525–1544. [Google Scholar] [CrossRef]
  26. Khan, S.; Kaklis, P.; Serani, A.; Diez, M.; Kostas, K. Shape-supervised dimension reduction: Extracting geometry and physics associated features with geometric moments. Comput.-Aided Des. 2022, 150, 103327. [Google Scholar] [CrossRef]
  27. Kou, J.; Botero-Bolívar, L.; Ballano, R.; Marino, O.; de Santana, L.; Valero, E.; Ferrer, E. Aeroacoustic airfoil shape optimization enhanced by autoencoders. Expert Syst. Appl. 2023, 217, 119513. [Google Scholar] [CrossRef]
  28. Zhou, Q.; Li, B.; Tao, P.; Xu, Z.; Zhou, C.; Wu, Y.; Hu, H. Residual-recursive autoencoder for accelerated evolution in savonius wind turbines optimization. Neurocomputing 2022, 500, 909–920. [Google Scholar] [CrossRef]
  29. Makhzani, A.; Shlens, J.; Jaitly, N.; Goodfellow, I.; Frey, B. Adversarial autoencoders. arXiv 2015, arXiv:1511.05644. [Google Scholar]
  30. Masood, Z.; Kostas, K.V.; Khan, S.; Kaklis, P.D. Shape-informed dimensional reduction in airfoil/hydrofoil modeling. J. Mar. Sci. Eng. 2023, 11, 1851. [Google Scholar] [CrossRef]
  31. Bronstein, A.M.; Bronstein, M.M.; Kimmel, R. Numerical Geometry of Non-Rigid Shapes; Springer: Berlin/Heidelberg, Germany, 2008. [Google Scholar]
  32. Xu, D.; Li, H. Geometric moment invariants. Pattern Recognit. 2008, 41, 240–249. [Google Scholar] [CrossRef]
  33. Goodfellow, I.; Pouget-Abadie, J.; Mirza, M.; Xu, B.; Warde-Farley, D.; Ozair, S.; Courville, A.; Bengio, Y. Generative adversarial networks. Commun. ACM 2020, 63, 139–144. [Google Scholar] [CrossRef]
  34. UIUC Applied Aerodynamics Group. UIUC Airfoil Coordinates Database. 2023. Available online: https://m-selig.ae.illinois.edu/ads/coord_database.html (accessed on 1 February 2023).
  35. Chen, W.; Chiu, K.; Fuge, M. Aerodynamic Design Optimization and Shape Exploration using Generative Adversarial Networks. In Proceedings of the AIAA SciTech Forum, San Diego, CA, USA, 7–11 January 2019. [Google Scholar]
  36. Kostas, K.; Amiralin, A.; Sagimbayev, S.; Massalov, T.; Kalel, Y.; Politis, C. Parametric model for the reconstruction and representation of hydrofoils and airfoils. Ocean Eng. 2020, 199, 107020. [Google Scholar] [CrossRef]
  37. Kostas, K.V.; Manousaridou, M. Machine-Learning-Enabled Foil Design Assistant. J. Mar. Sci. Eng. 2023, 11, 1470. [Google Scholar] [CrossRef]
  38. Kulfan, B.; Bussoletti, J. Fundamental Parametric Geometry Representations for Aircraft Component Shapes. In Proceedings of the 11th AIAA/ISSMO Multidisciplinary Analysis and Optimization Conference, Portsmouth, VA, USA, 6–8 September 2006. [Google Scholar]
  39. Chen, W.; Fuge, M. BezierGAN: Automatic Generation of Smooth Curves from Interpretable Low-Dimensional Parameters. arXiv 2018, arXiv:1808.08871. [Google Scholar]
  40. Drela, M.; Giles, M. Viscous-inviscid analysis of transonic and low Reynolds number airfoils. AIAA J. 1987, 25, 1347–1355. [Google Scholar] [CrossRef]
  41. Drela, M. XFOIL: An Analysis and Design System for Low Reynolds Number Airfoils. In Low Reynolds Number Aerodynamics, Lecture Notes in Engineering; Mueller, T., Ed.; Springer: Berlin/Heidelberg, Germany, 1989; Volume 54. [Google Scholar]
Figure 1. A profile instance generated by the parametric model introduced in Ref. [36]. The 17 parameters ( p 1 , , p 17 ) are used to define the coordinates of the 13 control points b i , i = 0 , , 12 depicted in the same figure; the figure is adapted from Ref. [30].
Jmse 12 00566 g001
Figure 2. NACA 2410 foil discretized using 4 different point distribution schemes.
Jmse 12 00566 g002
Figure 3. Plots for all Quality Analysis Metrics, as discussed in Section 2.4, with cosine spacing and SSVs with 4th geometric moments when augmented SSVs are required. The horizontal line within each box represents the average value, which is also marked at the top of each box.
Jmse 12 00566 g003
Figure 4. The effect of eachdiscretization scheme on the three Quality Analysis Metrics. The horizontal line in boxes represents the average value, which is also marked at the top of each box.
Jmse 12 00566 g004
Figure 5. Probability density distribution for each discretization in D 1 .
Jmse 12 00566 g005
Table 1. Design vectors and corresponding latent spaces for each considered geometry discretization for the SSV-KLE-based approach. For the latent space symbols, d denotes the discretization type (1: uniform parametric; 2: cosine; 3: curvature-based; and 4: uniform point spacing), and D i the employed dataset ( D 1 or D 2 ).
SSV DescriptionSSVLatent Space
Geometry only p ( ϑ 1 ) U d ( 1 ) ( D i )
Geometry and 2nd-order moments p ( ϑ 2 ) U d ( 2 ) ( D i )
Geometry and 3rd-order moments p ( ϑ 3 ) U d ( 3 ) ( D i )
Geometry and 4th-order moments p ( ϑ 4 ) U d ( 4 ) ( D i )
Geometry and 2nd- to 3rd-order moments p ( ϑ 2 3 ) U d ( 2 3 ) ( D i )
Geometry and 2nd- to 4th-order moments p ( ϑ 2 4 ) U d ( 2 4 ) ( D i )
Geometry and performance ( C L / C D ) p ( ϑ P ) U d ( P ) ( D i )
Table 2. Corresponding latent spaces for each considered geometry discretization for the GAN and PaDGAN approaches. As before, subscripts denote the discretization type, while D i can be either D 1 or D 2 .
SSV DescriptionGAN Latent SpacePaDGAN Latent Space
Uniform parametric spacing U 1 [ 1 ] ( D i ) U 1 [ 2 ] ( D i )
Cosine spacing U 2 [ 1 ] ( D i ) U 2 [ 2 ] ( D i )
Curvature-based spacing U 3 [ 1 ] ( D i ) U 3 [ 2 ] ( D i )
Uniform point spacing U 4 [ 1 ] ( D i ) U 4 [ 2 ] ( D i )
Disclaimer/Publisher’s Note: The statements, opinions and data contained in all publications are solely those of the individual author(s) and contributor(s) and not of MDPI and/or the editor(s). MDPI and/or the editor(s) disclaim responsibility for any injury to people or property resulting from any ideas, methods, instructions or products referred to in the content.

