Article

Numerical Computation of Restoring Time and Prediction of Self-Righting Process

School of Naval Architecture and Ocean Engineering, Huazhong University of Science and Technology, Wuhan 430074, China
*
Author to whom correspondence should be addressed.
J. Mar. Sci. Eng. 2024, 12(4), 529; https://doi.org/10.3390/jmse12040529
Submission received: 12 February 2024 / Revised: 4 March 2024 / Accepted: 15 March 2024 / Published: 22 March 2024
(This article belongs to the Special Issue Computational Fluid Dynamic of Floating Offshore Structures)

Abstract

:
Excellent self-righting performance is important to guarantee the normal navigation of Unmanned Surface Vehicles (USVs) after overturning, and the restoring time is an important index in design requirements. Traditionally, the static stability method and experiments on full-scale vehicles were used to analyze the large-angle stability of the USV. However, when it comes to the analysis of self-righting performance, the traditional static stability method will cause improper integration, and experiments are not convenient. To solve these problems, an improved static stability method was proposed, and a whole self-righting process simulation of a physical model was finished. The numerical simulation method was used to predict the self-righting process of a USV under four working conditions. Firstly, a midpoint average method based on the static stability theory was adopted to compute the static restoring time, and the results were compared with the results of the references, which verifies the effectiveness of the midpoint average method. Also, the midpoint average method is convenient because it only needs the restoring arm curve, the width and the gravity center height. Then, a numerical simulation of a physical model in static water was finished, and an experiment for a physical model in a towing tank was conducted. Comparing the restoring time of the midpoint average method, the numerical simulation and the experiment, the results show that the numerical simulation has high accuracy. Moreover, the numerical simulation was used to predict the self-righting process and analyze the self-righting performance of a USV under four working conditions.

1. Introduction

Under real sea conditions, the Unmanned Surface Vehicle (USV) may overturn when executing tasks. If the USV does not have the self-righting ability after overturning, it will lose maneuverability and can only wait for rescuing, which will cause problems when the USV sails out. Therefore, a USV with the self-righting ability is favored and researchers have conducted broad research on it.
At first, researchers mainly analyzed the self-righting performance via experiments; it is intuitive to improve the performance according to experimental results. Hudson et al. evaluated the design requirements of the hull form, the machinery installation and the construction materials [1]. The results show that composite materials which were carefully designed could reduce high hydrodynamic influence. Shepard et al. introduced a high-speed and heavy-weather motor lifeboat, which was designed to have the self-righting ability and operate in a wave which is up to 20 feet in height [2]. Renilson et al. conducted an experiment on a 1/12.5 scale model and developed two different experimental procedures which were for a single breaking wave and steep irregular waves, and then they tested four working conditions to explore the limit of stability [3]. Kim et al. researched materials to prevent the overturn of a rigid inflatable boat [4]. The results show that Thermoplastic Polyurethane tubes were better than single Hypalon tubes and that high buoyant materials arranged in empty spaces could increase the spare buoyancy of the ship. Fu researched the configuration of a self-righting lifeboat named Huaying 396 [5]. Grenestedt et al. introduced a high-performance USV with applications for surveillance and monitoring tasks, and then they demonstrated an effective trajectory following a riverine environment at peak speeds of 30 mph [6]. Akyildiz et al. used a watertight superstructure to provide enough buoyancy to realize the self-righting function [7]. The results show the advantage of this structure by comparing it with airbags and self-operating ballast water replacement systems. Relying on experiments, researchers mainly tested self-righting performance under uncomplicated working conditions.
However, the model must be manufactured via complicated steps and the experiment can only research a few working conditions, which costs a lot and is not convenient, especially when it comes to large-scale ships. Furthermore, it is hard to measure some data such as restoring arms, which are important for self-righting analysis in the experiment. With the development of numerical methods and lots of commercial software, researchers began to use these new tools to analyze the self-righting performance.
Normally, the simulation of self-righting ability analyzes the static stability based on the theory of ship hydrostatics and stability. In this analysis method, the static stability curve should be computed first, and researchers should observe whether the restoring arm is always positive when the roll angle is between 0° and 180°. In static stability theory, the restoring arm is considered to be the criterium to analyze the self-righting performance. In order to guarantee enough static stability during the self-righting process, the restoring arm should be positive at all roll angles. Yim et al. proposed a stability analysis method under severe sea conditions and built roll-heave models with a high-degree polynomial approximation of restoring forces and moments [8]. Bellec et al. applied artificial neural network technology to the parametric rolling prediction on head seas [9]. Storey et al. developed a MATLAB simulator to model the vessel’s tilting motion on the surface of the sea [10]. Jing et al. researched the self-righting performance of a 10 m rescue boat with different trims, gravity centers and water displacements through NAPA [11]. Yao et al. established a nonlinear roll equation of a rotary-molded boat based on nonlinear feature analysis of restoring torques and damping torques [12]. Then, they dissected its dynamic characteristic of rolling motion via the simulation. Bai et al. computed the restoring time and rolling cycles by solving the motion equations based on the transformed variable method [13]. The comparisons of computation results and the model experiment results of a float boat showed the reliability of this method. Tavakoli et al. determined the roll restoring moment by implementing an asymmetric parameter in previous lift equations and proposed an empirical method for computing restoring arms [14]. Zaman et al. analyzed the effect of gravity point on the engine room longitudinally, vertically and transversely on the simulation’s ability to self-right [15]. Lin et al. proposed a new self-righting design method based on the parametric design of decks for an unmanned speedboat [16]. Deng et al. simulated the hydrofoil rotation around the center of a wave-powered boat and the passive rotation around the center of the hydrofoil [17]. Guan et al. proposed a design method of self-righting decks, and they analyzed stability based on the combination of the particle swarm optimization and the sequential quadratic programming [18]. Trimulyono et al. examined the design of an anti-capsize ship by improving the self-righting moment with different heights of deck house and designed a ship whose restoring arm is positive when the roll angle is between 0° and 180° [19]. With the improvement of algorithms and software, the efficiency of self-righting designs has greatly increased compared with traditional experiments.
As the development of self-righting designs progresses, the period of restoring time has been restricted. Restoring time has been added to the criteria of self-righting performance analysis by more and more researchers [13]. According to the design requirement, restoring time refers to the time from the moment when the USV begins the self-righting motion to the moment when the USV returns to the upright position for the first time.
Xu simulated the whole self-righting process of an electric propulsion unmanned ship and computed restoring time [20]. Nevertheless, the acquisition of restoring time is mainly based on static stability theory, in which the damping factor and the wave factor are not considered or are simplified via estimation. The above static stability method, which only exists according to restoring arm curves, cannot meet present design requirements which contain restoring time.
Based on the above studies, it is of great importance to improve the traditional static stability method and adopt a new numerical simulation method to predict the self-righting process of the USV. Before the simulation, a midpoint average method based on the static stability theory was used to compute the static restoring time. Even though the midpoint average method is not accurate enough under real sea conditions, its computational process is convenient because it only needs the restoring arm curve, the width of the USV and the gravity center height of the USV. Rigorous verification studies, including the Grid Convergence Index (GCI) analysis and the comparison with the experiment, were carried out to validate the simulation. A USV under four working conditions was used in CFD prediction. Comparisons between the self-righting process on four working conditions were performed to analyze the self-righting performance.
The remainder of this paper is divided into four parts. In Section 2, the disadvantage of the traditional transformed variable method is analyzed, and a new midpoint average method is introduced and validated. In Section 3, the detailed procedure of the simulation is introduced, and validation studies are conducted on the simulation. Then, the results of the simulation are compared with those of the midpoint average method and those of the experiment. In Section 4, the simulation results of a USV under four working conditions are introduced and the restoring time results are analyzed. In Section 5, there is the summary and the reflection for this paper.

2. Static Stability Method

2.1. Transformed Variable Method

According to the nonlinear roll theory, there are four moments during the self-righting process: the inertia moment, the damping moment, the restoring moment and the wave-disturbing moment. The equation of the nonlinear large-angle roll motion is [21]:
I x x ϕ · · + 2 N ϕ · + D l ϕ = D h α m 0 sin ( ω t )
where ϕ is the roll angle, ϕ · is the angular velocity, ϕ · · is the angular acceleration, I x x is the total moment of inertia, 2 N is the coefficient of damping moment, D is the weight of displacement, l ϕ is the restoring arm, h is the initial stability height, α m 0 is the amplitude of the roll angle of the effective wave and ω is the angular frequency of the wave.
Usually, the damping moment term is measured in the experiment, the restoring moment term is computed via fitting the restoring arm curve and the wave-disturbing moment term is computed from the approximate estimation in engineering.
Due to no higher requirement for accuracy, traditionally, the restoring time of the USV in static water is used to represent self-righting performance under real sea conditions. When it comes to static water, the wave-disturbing moment term does not exist. Because damping moment has a slight influence on restoring time, it can be ignored for convenience. Equation (1) can be changed to:
ϕ · · = D l ϕ I x x
The total moment of inertia is itself composed of the moment of inertia I x x and the added moment of inertia J x x . The computation of J x x is complicated in the CFD method. So, the total moment of inertia I x x is computed using an empirical equation:
I x x = D 10 g B 2 + 4 z g 2
where B is the width of the ship, g is the gravitational acceleration and z g is the height of the center of gravity (measured from the bottom of the ship).
According to the nonlinear large-angle roll theory, Equation (2) is changed to:
ϕ ϕ m d [ ( θ · ) 2 ] = 2 D I x x [ 0 ϕ m l ( θ ) d θ 0 ϕ l ( θ ) d θ ]
d t = I x x 2 D d ϕ l d ( ϕ m ) l d ( ϕ )
where ϕ m is the maximum roll angle, ϕ m ( 0 0 , 180 0 ) , θ is a temporal parameter in the integration which represents the roll angle and l d ( ϕ ) is the dynamic stability arm, l d ( ϕ ) = 0 ϕ l ( θ ) d θ .
The time from ϕ m to 0° is:
T = I x x 2 D 0 ϕ m d ϕ l d ( ϕ m ) l d ( ϕ )
The improper integration in Equation (6) is changed to:
T = 2 I x x l d ( ϕ m ) D 0 90 sin ξ l ( ϕ ) d ξ
where l d ( ϕ ) = l d ( ϕ m ) sin 2 ξ , ξ [ 0 0 , 90 0 ] , d ϕ = d [ l d ( ϕ ) ] l ( ϕ ) = 2 l d ( ϕ m ) sin ξ cos ξ d ξ l ( ϕ ) . The monotonicity of ϕ is consistent with that of ξ , which means that when ξ approaches 0°, ϕ will approach 0°; when ξ approaches 90°, ϕ will approach ϕ m .
When ξ approaches 90°, lim ξ 90 0 sin ξ l ( ϕ ) = 1 l ( ϕ m ) . When ξ approaches 0°, L’Hospital’s rule is used:
lim ξ 0 0 sin ξ l ( ϕ ) = lim ξ 0 0 cos ξ d [ l ( ϕ ) ] d ϕ d ϕ d ξ = 1 2 l d ( ϕ m ) G M ¯ lim ξ 0 0 sin ξ l ( ϕ )
lim ξ 0 0 sin ξ l ( ϕ ) = 1 2 l d ( ϕ m ) G M ¯
where G M ¯ = d [ l ( ϕ ) ] d ϕ ϕ = 0 0 is the initial stability height.
The transformed variable ξ is discretized into several intervals in [ 0 0 , 90 0 ] , and 0 90 sin ξ l ( ϕ ) d ξ is computed via the numerical integration. Due to the introduction of ξ , the above Equation (11) is called the transformed variable method (T-V method).
However, when it comes to the self-righting motion, the maximum angle ϕ m is 180°. The restoring arm at 180° is zero, which means lim ξ 90 0 sin ξ l ( ϕ ) = 1 l ( ϕ m ) . This integration is improper and will cause a large error.

2.2. Midpoint Average Method

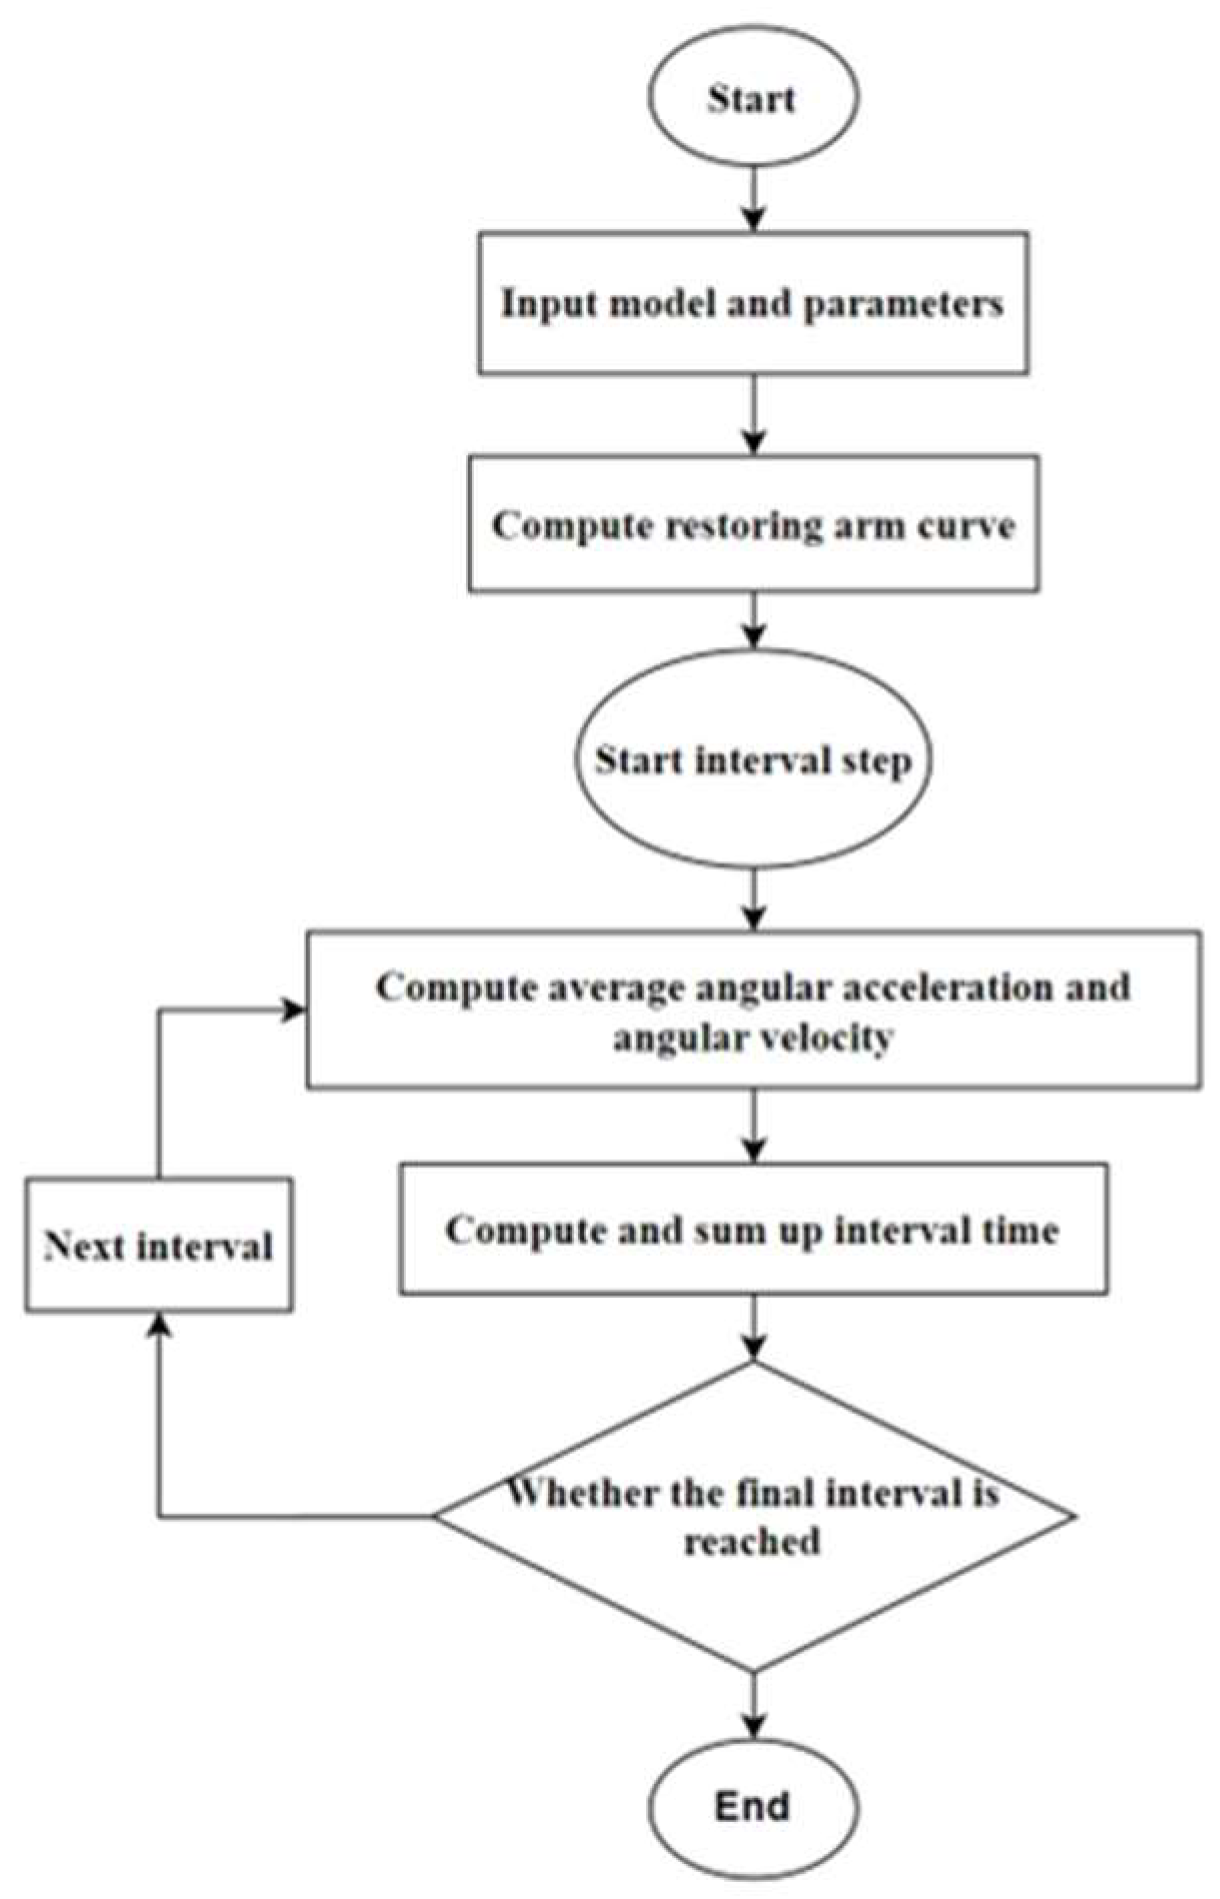
To avoid the improper integration, a new midpoint average method (M-A method) to compute the static restoring time was proposed. The whole self-righting angle is averagely discretized into N intervals and N + 1 nodes. In the nth interval, the variable angular accelerated motion is approximately replaced by a uniformly angular accelerated motion. The angular acceleration is the arithmetic average value of the angular acceleration in two endpoints. Equation (2) is discretized:
ϕ · · ¯ n = ϕ · · n 1 + ϕ · · n 2 = D 2 I x x [ l ( ϕ n 1 ) + l ( ϕ n ) ]
where ϕ · · ¯ n is the average angular acceleration in the nth interval, ϕ · · n 1 and ϕ · · n are angular accelerations at the n−1th node and the nth node and l ( ϕ n 1 ) and l ( ϕ n ) are restoring arms at the n − 1th node and the nth node.
The iterative equation of the angular velocity at the n − 1th node and at the nth node is:
ω 0 = 0 ω n = ω n 1 2 2 ϕ · · ¯ n π N ( 1 n N )
where ω 0 is the initial angular velocity while ω n 1 and ω n are angular velocities at the n−1th node and the nth node.
Total static restoring time is the sum of time in every interval.
T R = n = 1 N t n = n = 1 N ω n ω n 1 ϕ · · ¯ n
The overall solution flowchart of the new midpoint average method is presented in Figure 1.

2.3. Validation and Analysis

The static restoring time of a trial boat in the transformed variable method and in the experiment were used to verify the accuracy of the midpoint average method. According to the previous study [13], there were two conditions in the experiment and four working conditions in the transformed variable method. The only difference between these conditions was the gravity center height. Restoring arm curves on different conditions were shown in the previous study. Based on these curves, the static restoring time in the midpoint average method was computed via the procedure shown in Figure 1. In this procedure, roll angle nodes and their corresponding restoring arms were straightly measured from restoring arm curves in the previous study.
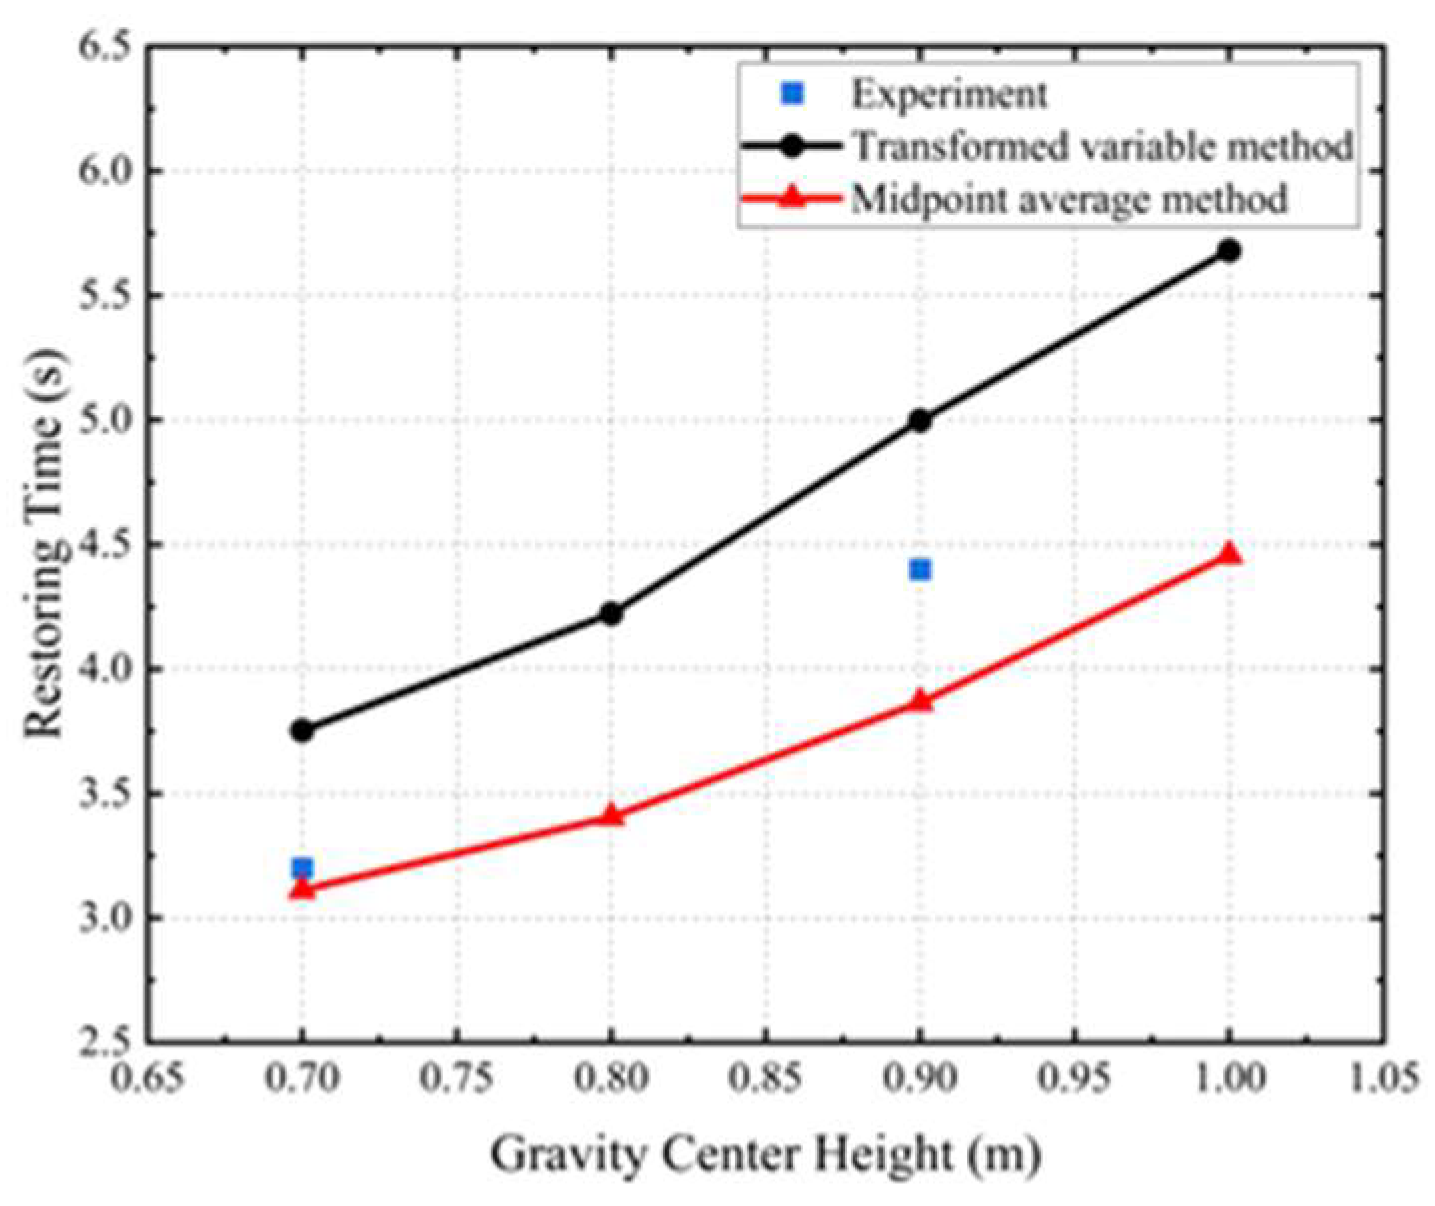
Based on data from restoring arm curves in the previous study, the results of the new midpoint average method were compared with the available experimental results [13] and transformed variable method results [13]. In these methods, gravity center height is measured from the bottom baseline of the boat. According to Equations (1) and (2), if the damping factor and wave-disturbing factor are ignored, the restoring time of the static condition should be shorter than that of the real sea condition because of larger angular acceleration. The results in Figure 2 and Table 1 show that the absolute value of comparison error of the new midpoint average method was lower than that of the transformed variable method, which indicates that the validation of the new midpoint average method was successful.

3. Numerical Simulation

Different to the large-angle stability, there are more obvious damping factors and wave factors in the self-righting process because of the larger angular velocity and the larger change in water surface shape. The numerical simulation is necessary to take these two factors in account.

3.1. Geometry Model

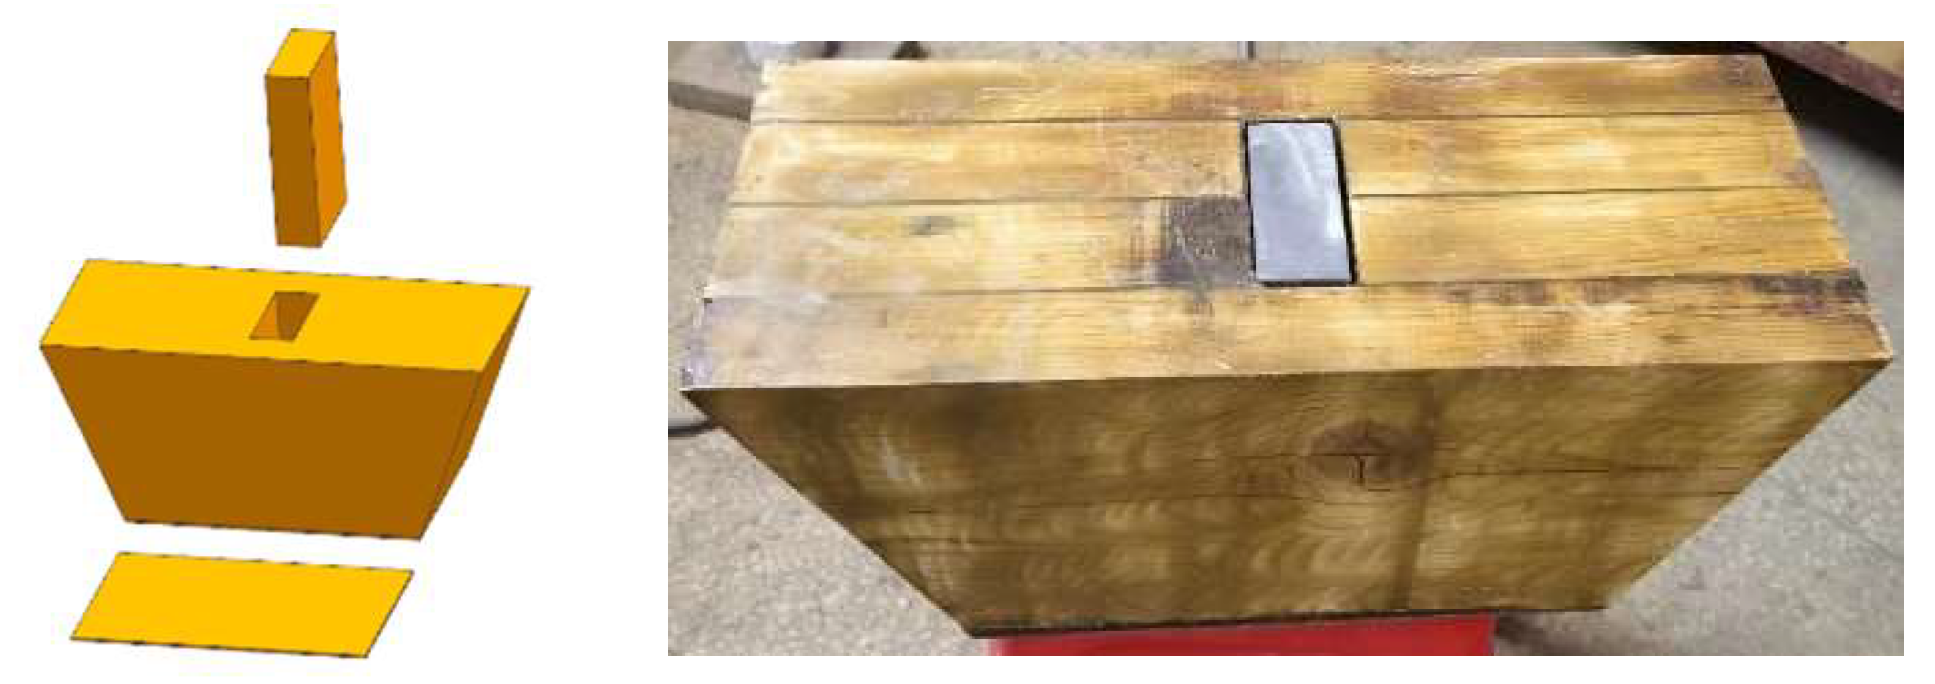
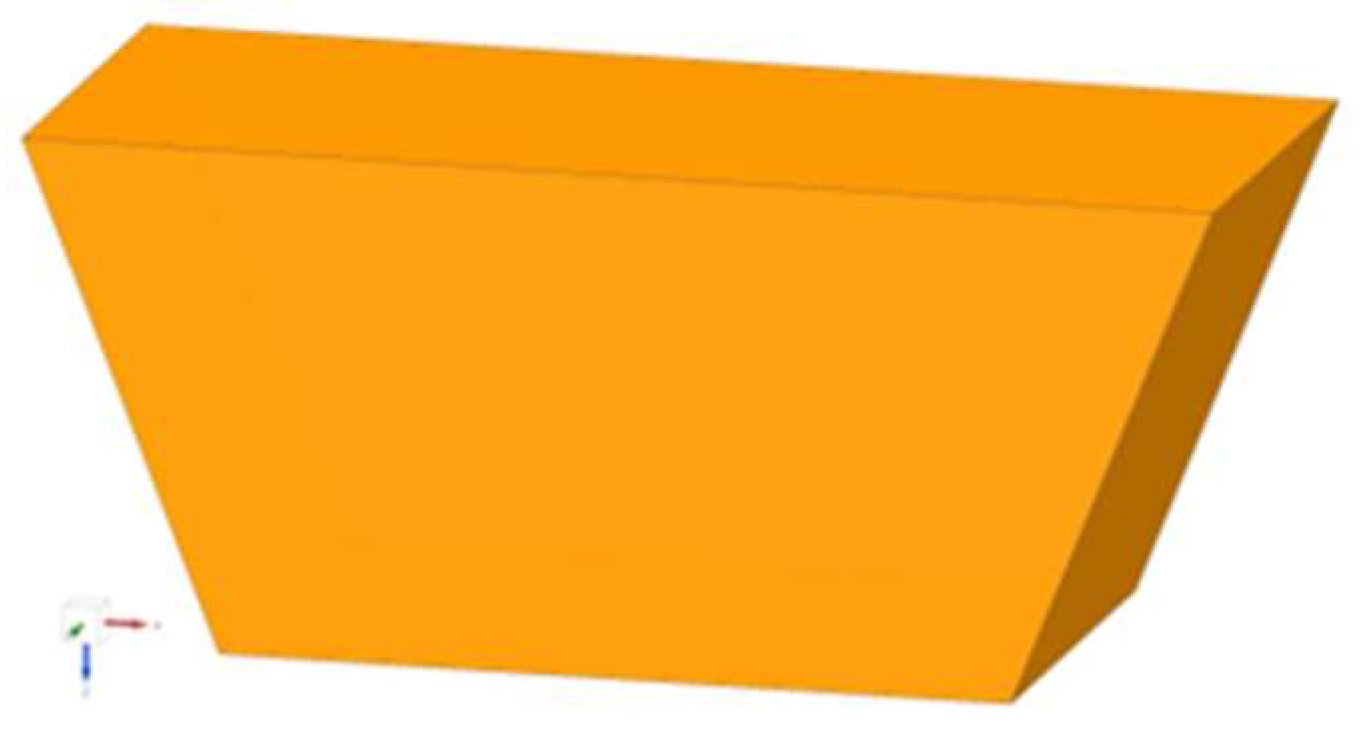
To verify the validation of the simulation in static water, a physical model was used to compute the restoring time. Figure 3 shows the geometry model, and Table 2 shows the main parameters. The overall appearance of the physical model was a ladder shape, which is convenient to control its geometrical parameter. The origin point of the global coordinate was set in the center of the bottom of the trapezoid. The top length of the trapezoid was set as Lpp (length between perpendiculars).

3.2. Static Stability Result

The restoring arm curve was computed in a commercial software, Maxsurf version 20.1.0.59. In Maxsurf, the reference point is in the center of the model bottom and the model is divided into 200 stations along the longitudinal direction. The result of restoring arm curve is shown in Figure 4. When the roll angle was from 0° to 180°, the restoring arm was always positive. When the roll angle is 102.7°, the restoring arm reaches the largest value, which is 17.5 mm. From the curve, it is clearly demonstrated that the stability range of the model is 180°, which means the physical model has the ability to return back to the upright position.
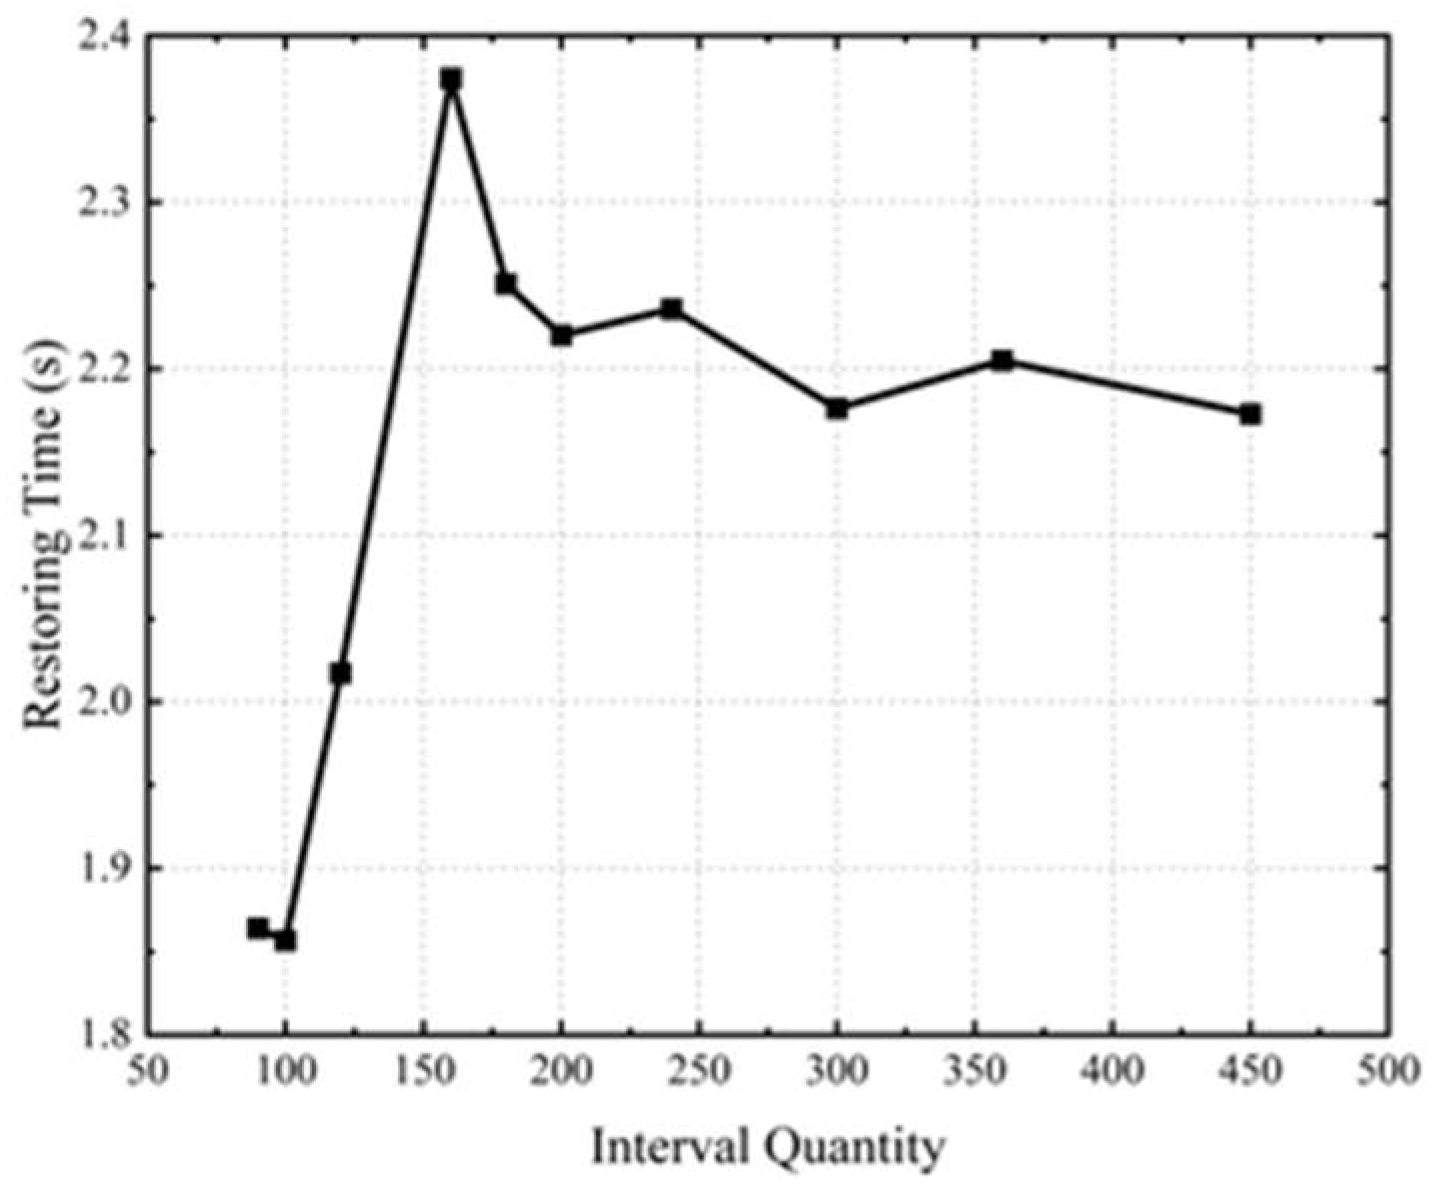
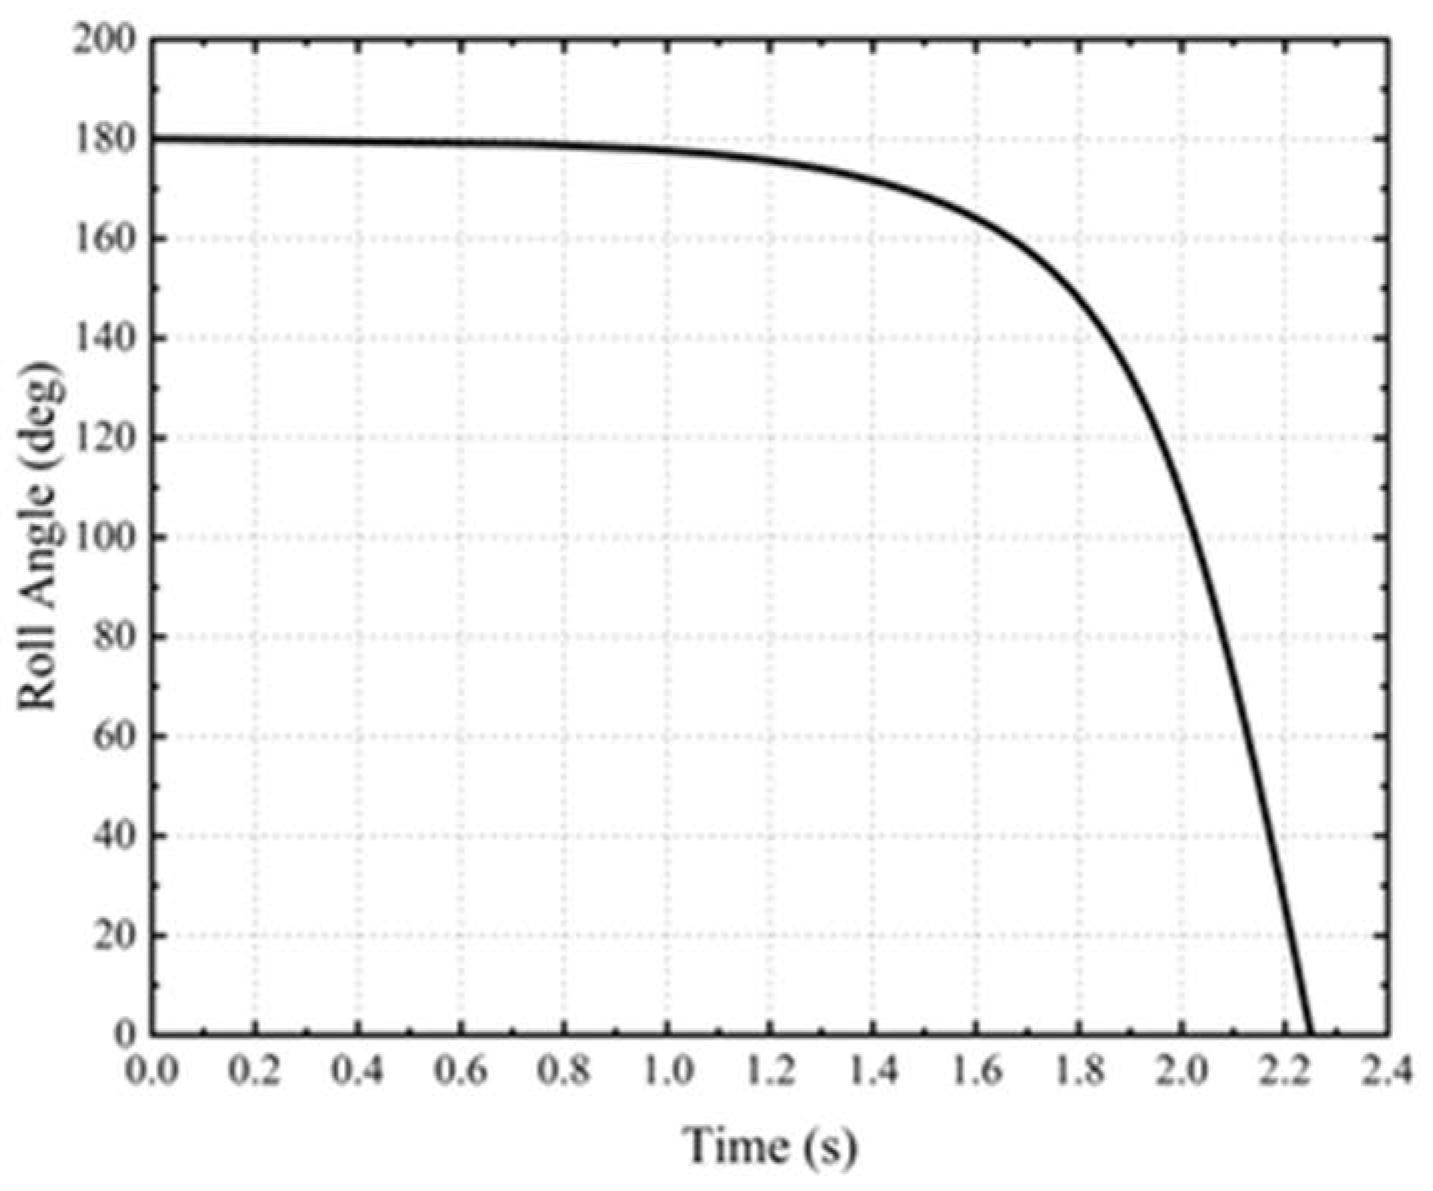
Figure 5 and Table 3 show the results of the interval quantity convergence analysis. The error between the result of 180 intervals and the result of 200 intervals is less than 1.3%, which means the accuracy of 180 intervals is enough. According to Equation (16) in the midpoint average method, the restoring time is 2.22 s. Figure 6 shows the result of the midpoint average method in the time domain. This restoring time result is to be the reference in the simulation.

3.3. Simulation Procedure

The self-righting motion of the physical model is part of a roll decay motion, and the roll decay simulation was conducted using commercial CFD software Siemens Star-CCM+ version 17.04. The processor was Intel (R) Core (TM) i5-8250U (1.60 Ghz).

3.3.1. Computational Domain and Mesh Generation

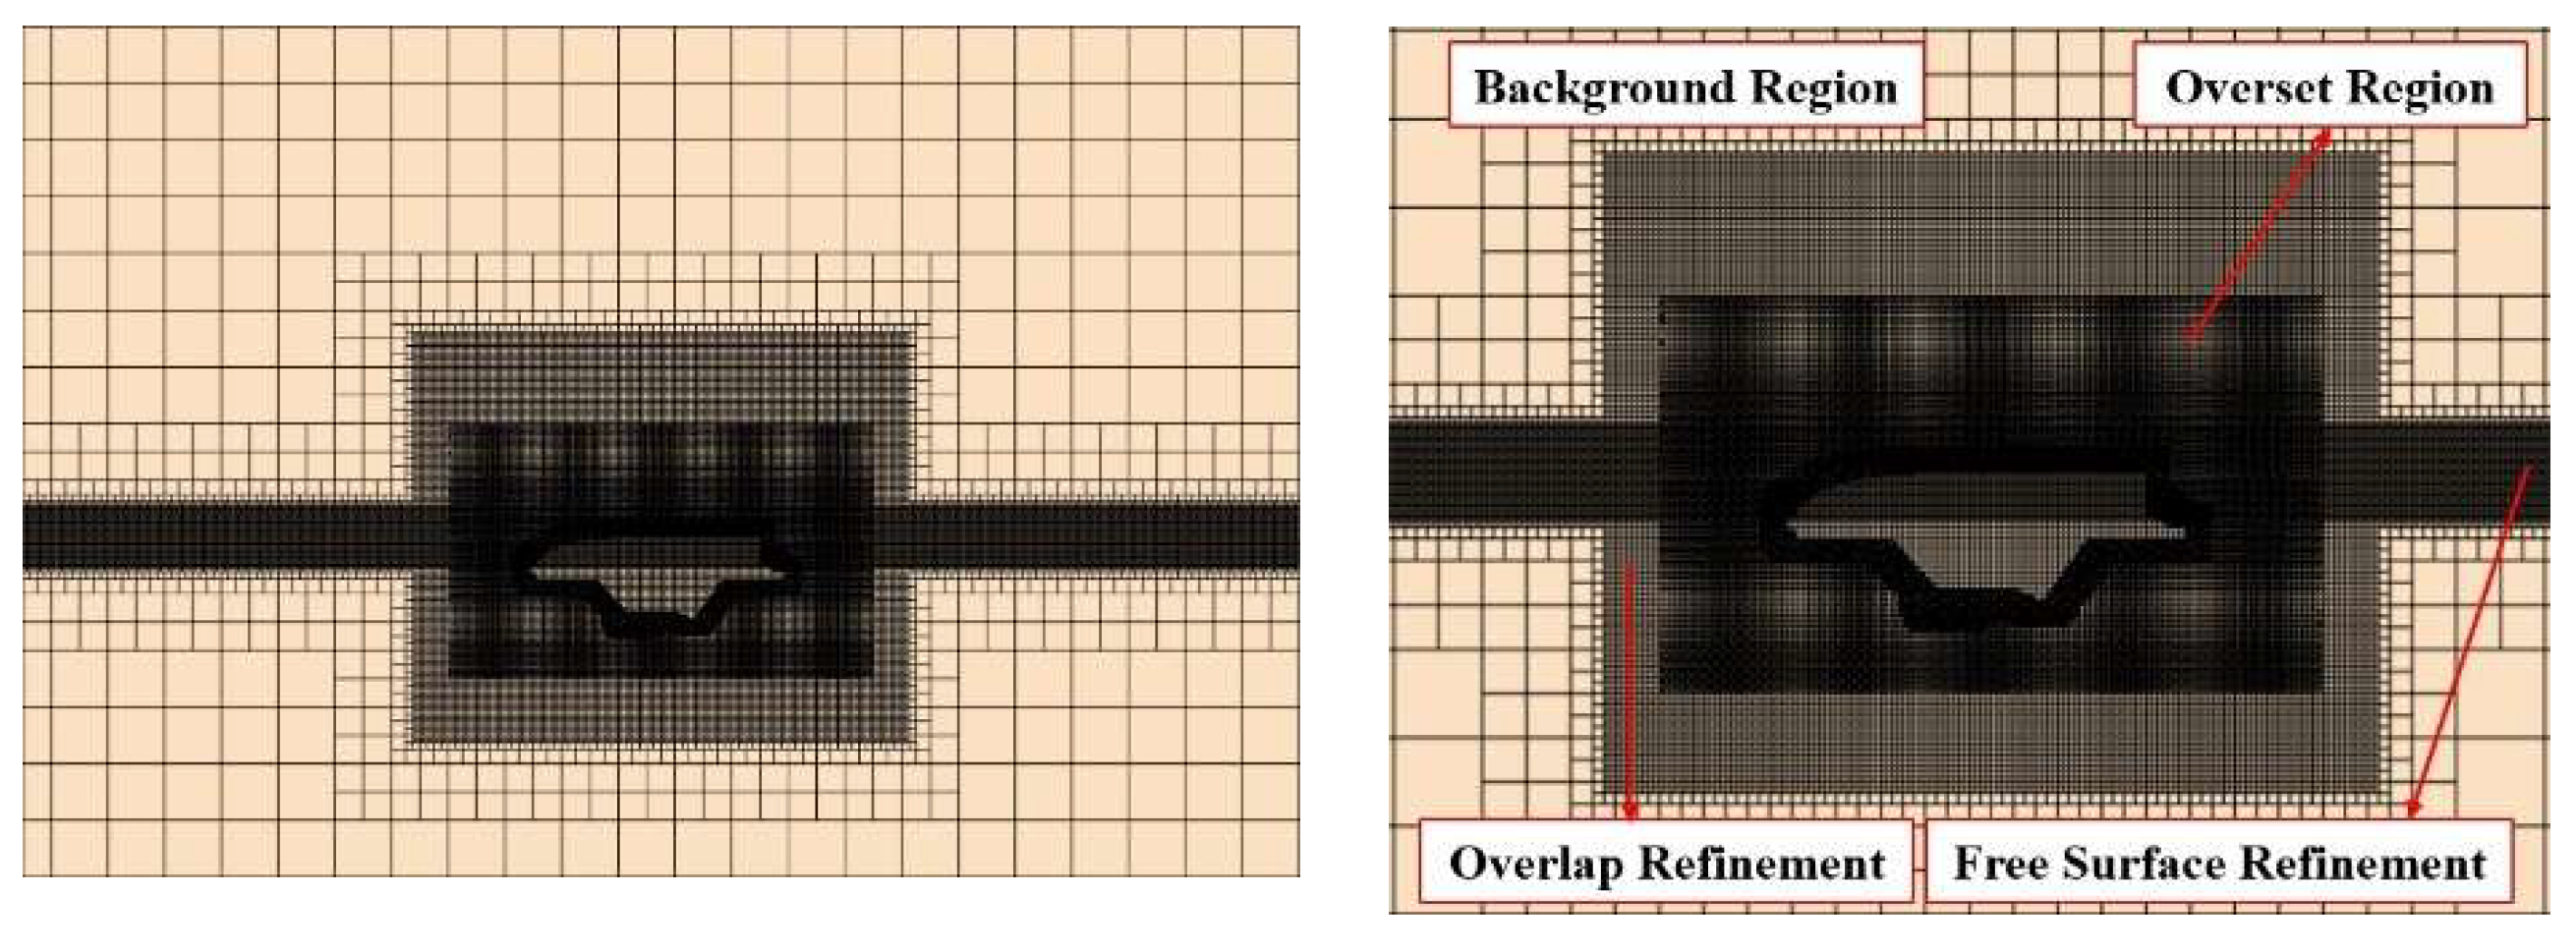
The computational domain is shown in Figure 7, which extends over the ranges of −2Lpp < x < 2Lpp, −Lpp < y < Lpp, −Lpp < z < 2Lpp. The origin point of the global coordinate was set in the center of the bottom of the trapezoid. The initial state of the physical model was inverted and completely immersed under the water surface to simulate extreme conditions after capsizing. Figure 8 shows two refinement regions: the overlap refinement region and the free surface refinement region. The overlap refinement is employed between the surface of the physical model and the background to ensure that the transition of these two regions is smooth. The size of the box for the overlap refinement is −0.3 m < x < 0.3 m, −0.2 m < y < 0.2 m, −0.26 m < z < 0.09 m, and this size covers the physical model height. For the free surface refinement, the size is −1.25 m < x < 1.25 m, −1.1 m < y < 1.1 m, −0.02 m < z < 0.02 m. The free surface refinement region is located near the water surface and used to distinguish the water phase and the air phase with high precision.
Two mesh tools called the surface remesher and trimmed cell mesh are used to generate the mesh, which is a mixed mesh mainly composed of structured mesh. The prism layer around the physical model surface is divided into five layers of prismatic cells. The free surface refinement region includes 50 grid points in the range of the wavelength [22]. For Grid Convergence Index (GCI) analysis, three types of mesh with different accuracies are generated, which are called the coarse mesh, the medium mesh and the fine mesh. The fine mesh has a total of 7,551,460 cells, and it is coarsened with the refinement ratio 2 to generate the medium mesh. The medium mesh has a total of 2,965,373 cells, and it is coarsened with the refinement ratio 2 to generate the coarse mesh. The coarse mesh has a total of 1,091,170 cells.

3.3.2. Physical Conditions

As for Unsteady Reynolds-Averaged Navier–Stokes (URANS) equations, the Finite Volume Method (FVM) was used to discretize their integral form. In convective terms, a second-order convection scheme was used. The time-domain solution used a first-order temporal discretization for the convergence rate. The turbulence effect in boundary layers was modeled using the Shear-Stress Transport (SST) method [23], which uses a k ω model near the wall and a k ε model in the far field.
The VOF (Volume of Fluid) method was used to capture the free surface of the water and air [24]. In the VOF method, two phases of the fluid (water and air) are defined by assigning a scalar value of 0 to the air and 1 to the water in each cell, while the value of the interface between the two types of fluid (air and water) is 0.5. A derived surface is set as the interface to simulate the water surface by using the VOF model. Considering the disturbance of the physical model on the water surface in the self-righting process, the flat wave is set in the VOF model.
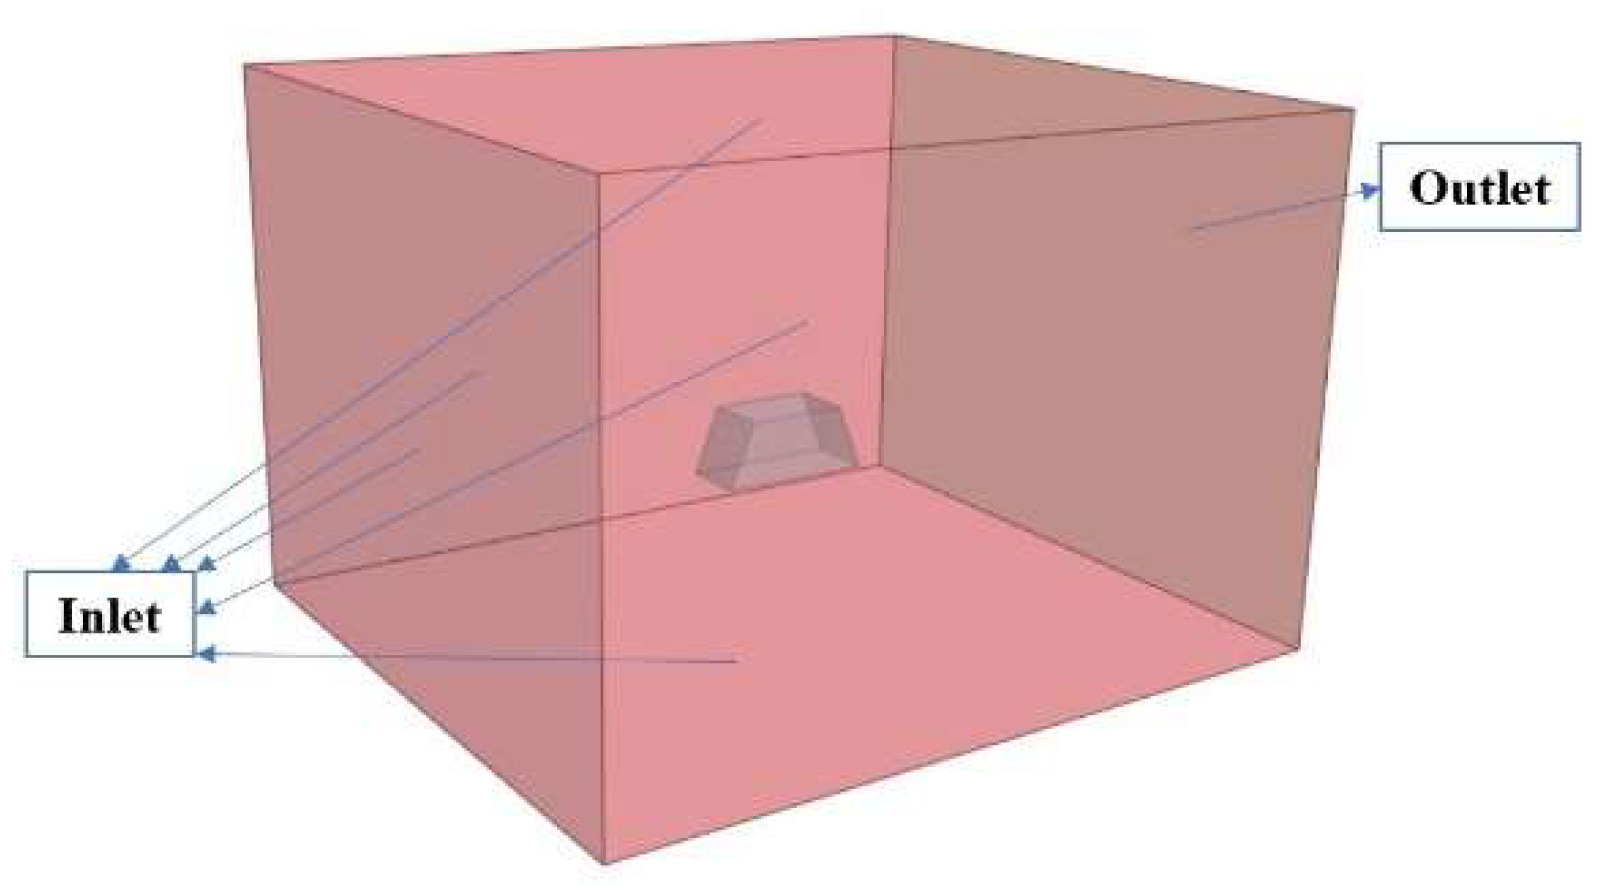
The back side of the computational domain surface shown in Figure 9 is set as the pressure-outlet face, on which the pressure is defined by the hydrostatic pressure of fluid. The other faces shown in Figure 9 are set as the velocity-inlet face, on which the velocity is defined by the VOF fluid.
The origin point is set at the gravity center of the model. The self-righting motion can be simplified as the combination of translation along the Z-direction and rotation around the X-direction. The dynamic fluid body interaction (DFBI) module was used to capture these two motions. This module obtains a new position in each time step by computing exciting forces and moments in governing equations. The local coordinate system moves and rotates together with the model all the time during the entire motion process.

3.3.3. Time Step

The period of the roll decay motion after returning to the upright position is approximated using the natural roll period. Based on Equation (4), the natural roll period is as follows [21]:
T ϕ = 2 π I x x D h = 2 π B 2 + 4 z g 2 10 g h
It is recommended that at least 100 time-steps per period are used for the periodic phenomena [25]. According to Equation (13) and Table 2, the natural roll period is 1.03 s, and the maximum time step based on the ITTC recommendation is 0.01 s. For time step convergence analysis, three types of time step are generated with the division ratio 2 for coarse (0.01 s), medium (0.005 s) and fine (0.0025 s). The total simulation time is 10 s, which contains at least four roll decay periods. The results of the angular velocity in upright position simulated via coarse, medium and fine time steps are summarized in Table 4. Considering computational accuracy and efficiency, the medium time step (0.005 s) was chosen.

3.3.4. Grid Convergence Index Analysis

Based on the Grid Convergence Index (GCI) analysis method [26,27,28,29], the refinement was to choose the proper quantity of mesh cells, which is shown as follows:
G C I = F s ε r p 1
ε = f 2 f 1 f 1
r = h 1 h 2
where F s is a factor of safety, ε is the relative difference, f 1 is the interested physical value in fine mesh, f 2 is the interested physical value in coarse interval, r is the mesh refinement factor, h 1 is the spacing value in coarse mesh, h 2 is the spacing value in fine mesh and p is the accuracy order of numerical scheme. In this Grid Convergence Index analysis, F s = 1.25 for a three (or more)-grid convergence study.
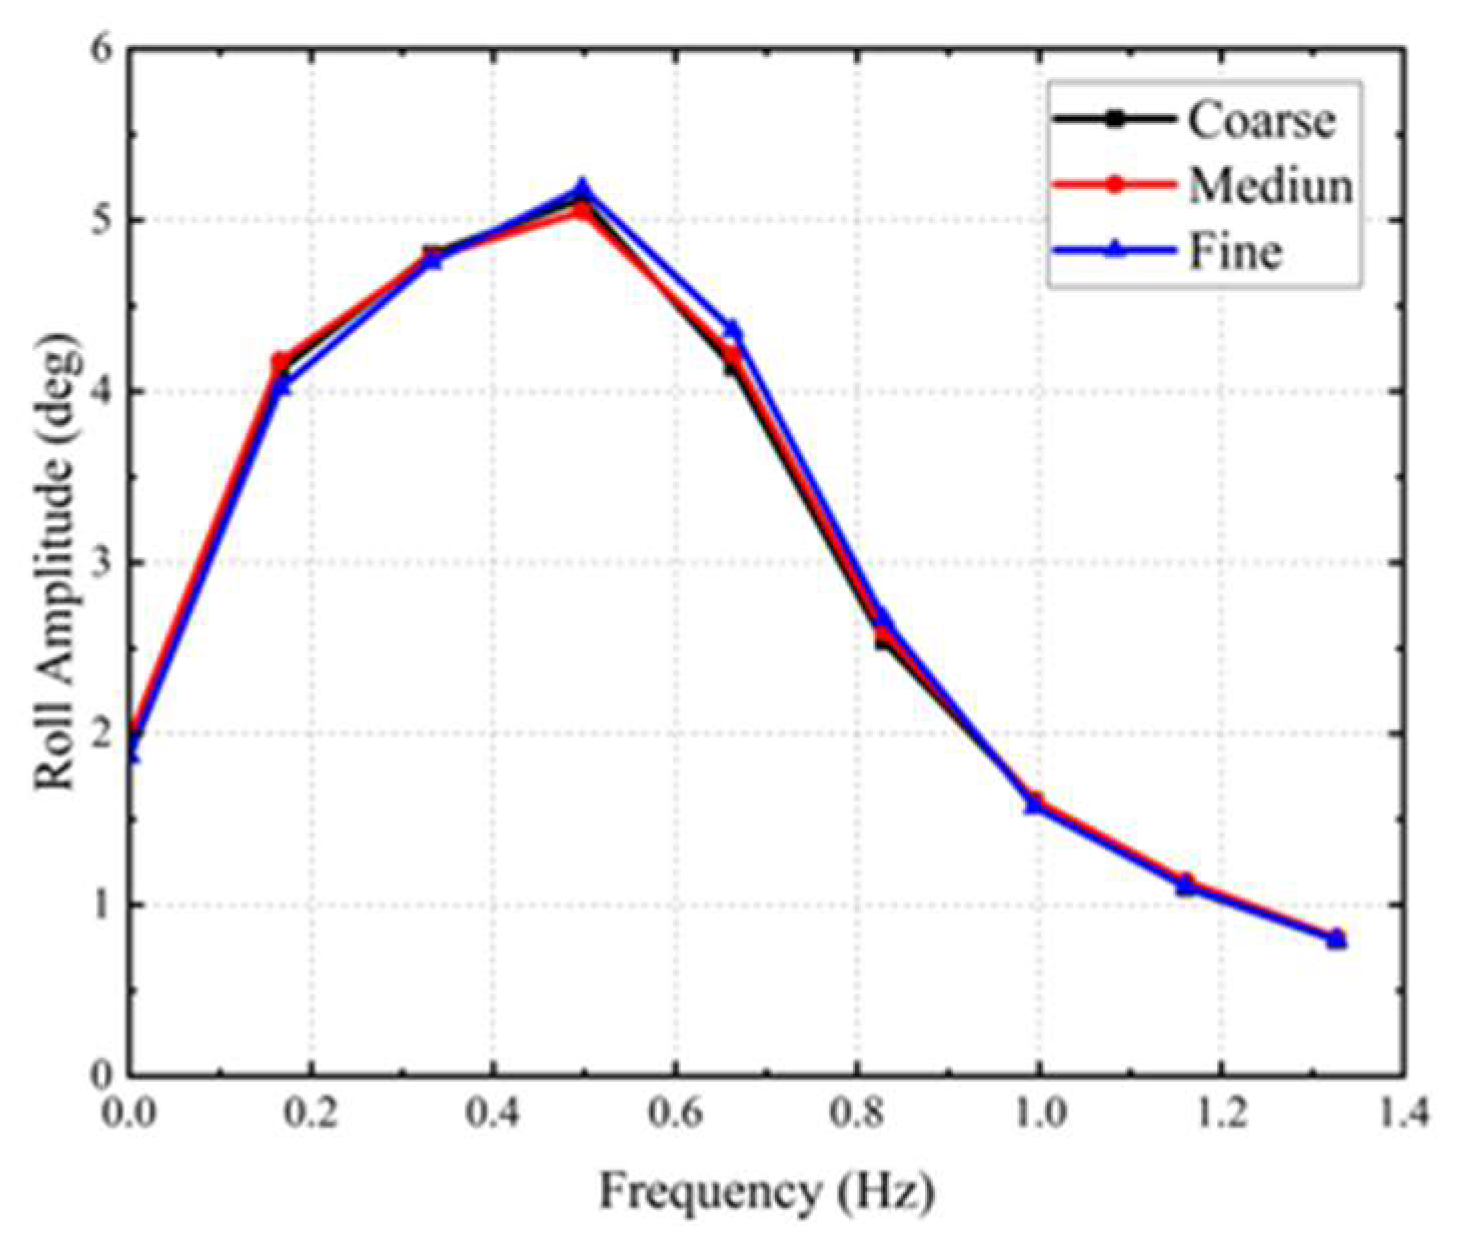
The roll amplitudes of roll decay simulations for the fine, medium and coarse mesh configurations are shown in Figure 10. Fourier series (FS) analysis was used to capture the characteristics in the frequency domain for GCI analysis:
ξ ( t ) = ξ 0 + i = 1 N ξ i cos ( ω i t + φ i )
where ξ i is the nth-order harmonic amplitude and φ i is the corresponding phase.
The Fast Fourier transform (FFT) was used to process the time histories and obtain the values, as follows:
ξ i = a i 2 + b i 2
φ i = arctan ( b i a i )
a i = 2 T 0 T ξ ( t ) cos ( ω i t ) d t
b i = 2 T 0 T ξ ( t ) sin ( ω i t ) d t
ξ 0 = 1 T 0 T ξ ( t ) d t
where T is the period of the time history, ξ 0 is the averaged value of the time history and ξ i is the linear term defined as a fundamental component.
In time history curves, there is a large difference from the initial position to the upright position, which may lead to errors in the FS analysis. As such, the roll amplitude that is used for FS analysis is taken from the roll angle of 0°. Figure 10 shows the time series of roll amplitude for FS analysis, in which the references of time history align. Figure 11 shows the results of frequency domain after FFT, with the peak of each curve being the roll amplitude occurring at the natural frequency.
GCI analysis shown in Equations (23)–(27) was used as a verification study to quantify the numerical uncertainties of the simulation. This method was based on a convergence verification procedure [30]. The GCI result of the fine mesh configuration shown in Table 5 is less than 4%, which indicates that the numerical error in this simulation is small. The verification of fine mesh was successful, and the restoring time in the simulation was 2.575 s.
R = ε 21 ε 32 = S 2 S 1 S 3 S 2
p = 1 ln r 21 ln ε 32 ε 21 + q ( p )
q ( p ) = ln ( r 21 p s r 32 p s )
s = sgn ( ε 32 ε 21 )
G C I = 1.25 S 1 S 2 S 1 r 21 p 1
where S 1 , S 2 and S 3 are the maximum amplitude in frequency domain roll responses obtained from the fine, medium and coarse configurations, R is the convergence ratio, p is the order of accuracy, r 21 is the refinement ratio between the medium configuration and the fine configuration and r 32 is the refinement ratio between the coarse configuration and the medium configuration.

3.4. Experiment and Validation

The self-righting experiment was performed to measure the restoring time under real conditions and validate the simulation result. The physical model is shown in Figure 12 and its main parameters are listed in Table 6. The main material of the model was wood because it is normal for boat models and it has enough intensity. There was a rectangular hole through the center of the model. The iron block was used to increase the draft in order to imitate the high-loaded working conditions. There was an iron sheet fixed in the bottom of the model. The iron sheet was used to decrease the gravity center height of the model in order to guarantee enough stability. To prevent water from penetrating the wood, there was a layer of wax wrapping the surface of the whole model.
A high-speed camera was used to record the short-time process; the performance parameters of it are listed in Table 7. The self-righting process of the experiment is shown in Figure 13.
The restoring time in the experiment was 2.46 s, which is shown in Figure 14. Compared with the restoring time in the midpoint average method, the restoring time of the simulation and the restoring time of the experiment were longer. Damping factor and wave factor are ignored in the midpoint average method, so when they are at the same position, the total angular acceleration in the midpoint average method is larger than that in the simulation and in the experiment. Larger angular acceleration at the same roll angle means less time, so the static restoring time is less than the restoring times of the simulation and the experiment. Compared to the results of the midpoint average method, the simulation results had higher accuracy. The error of restoring time between the midpoint average method and the experiment was less than 10%. The error of restoring time between the simulation and the experiment was less than 5%. The simulation can be used to predict the self-righting process of the USV.

4. Prediction of Self-Righting Performance

This USV was designed to execute rescue tasks and should have safe navigation ability under severe sea conditions. Parameters of the USV are listed in Table 8, and a simplified model is shown in Figure 15. There are four working conditions when the USV executes tasks: they are leaving port with the design load (condition 1), reaching port with the design load (condition 2), leaving port with maximum load (condition 3) and reaching port with maximum load (condition 4). The differences in the four working conditions can be simplified as differences in displacement and in gravity center position. The reference point is set at the backend of the bottom of the USV. The parameters of the four working conditions are listed in Table 9. The numerical simulation method above was used to predict the self-righting performance of the USV under four working conditions.
The setting of the computational domain is the same as the introduction in Section 3. The length of it is 45 m, the width of it is 21.2 m and the height of it is 30 m, which is shown in Figure 16. The size of the box for the overlap refinement is −4 m < x < 11 m, −4 m < y < 4 m, −5 m < z < 4 m, which is shown in Figure 17. Similar to the simulation procedure in Section 3, the total cell number of the computational domain is 4,268,280 cells and the time step is 0.005 s.
Head wave simulations were carried out to represent a severe sea condition in a wave with wave amplitude A L p p = 0.0183 and wavelength λ L p p = 1 , which follows INSEAN captive tests [31].
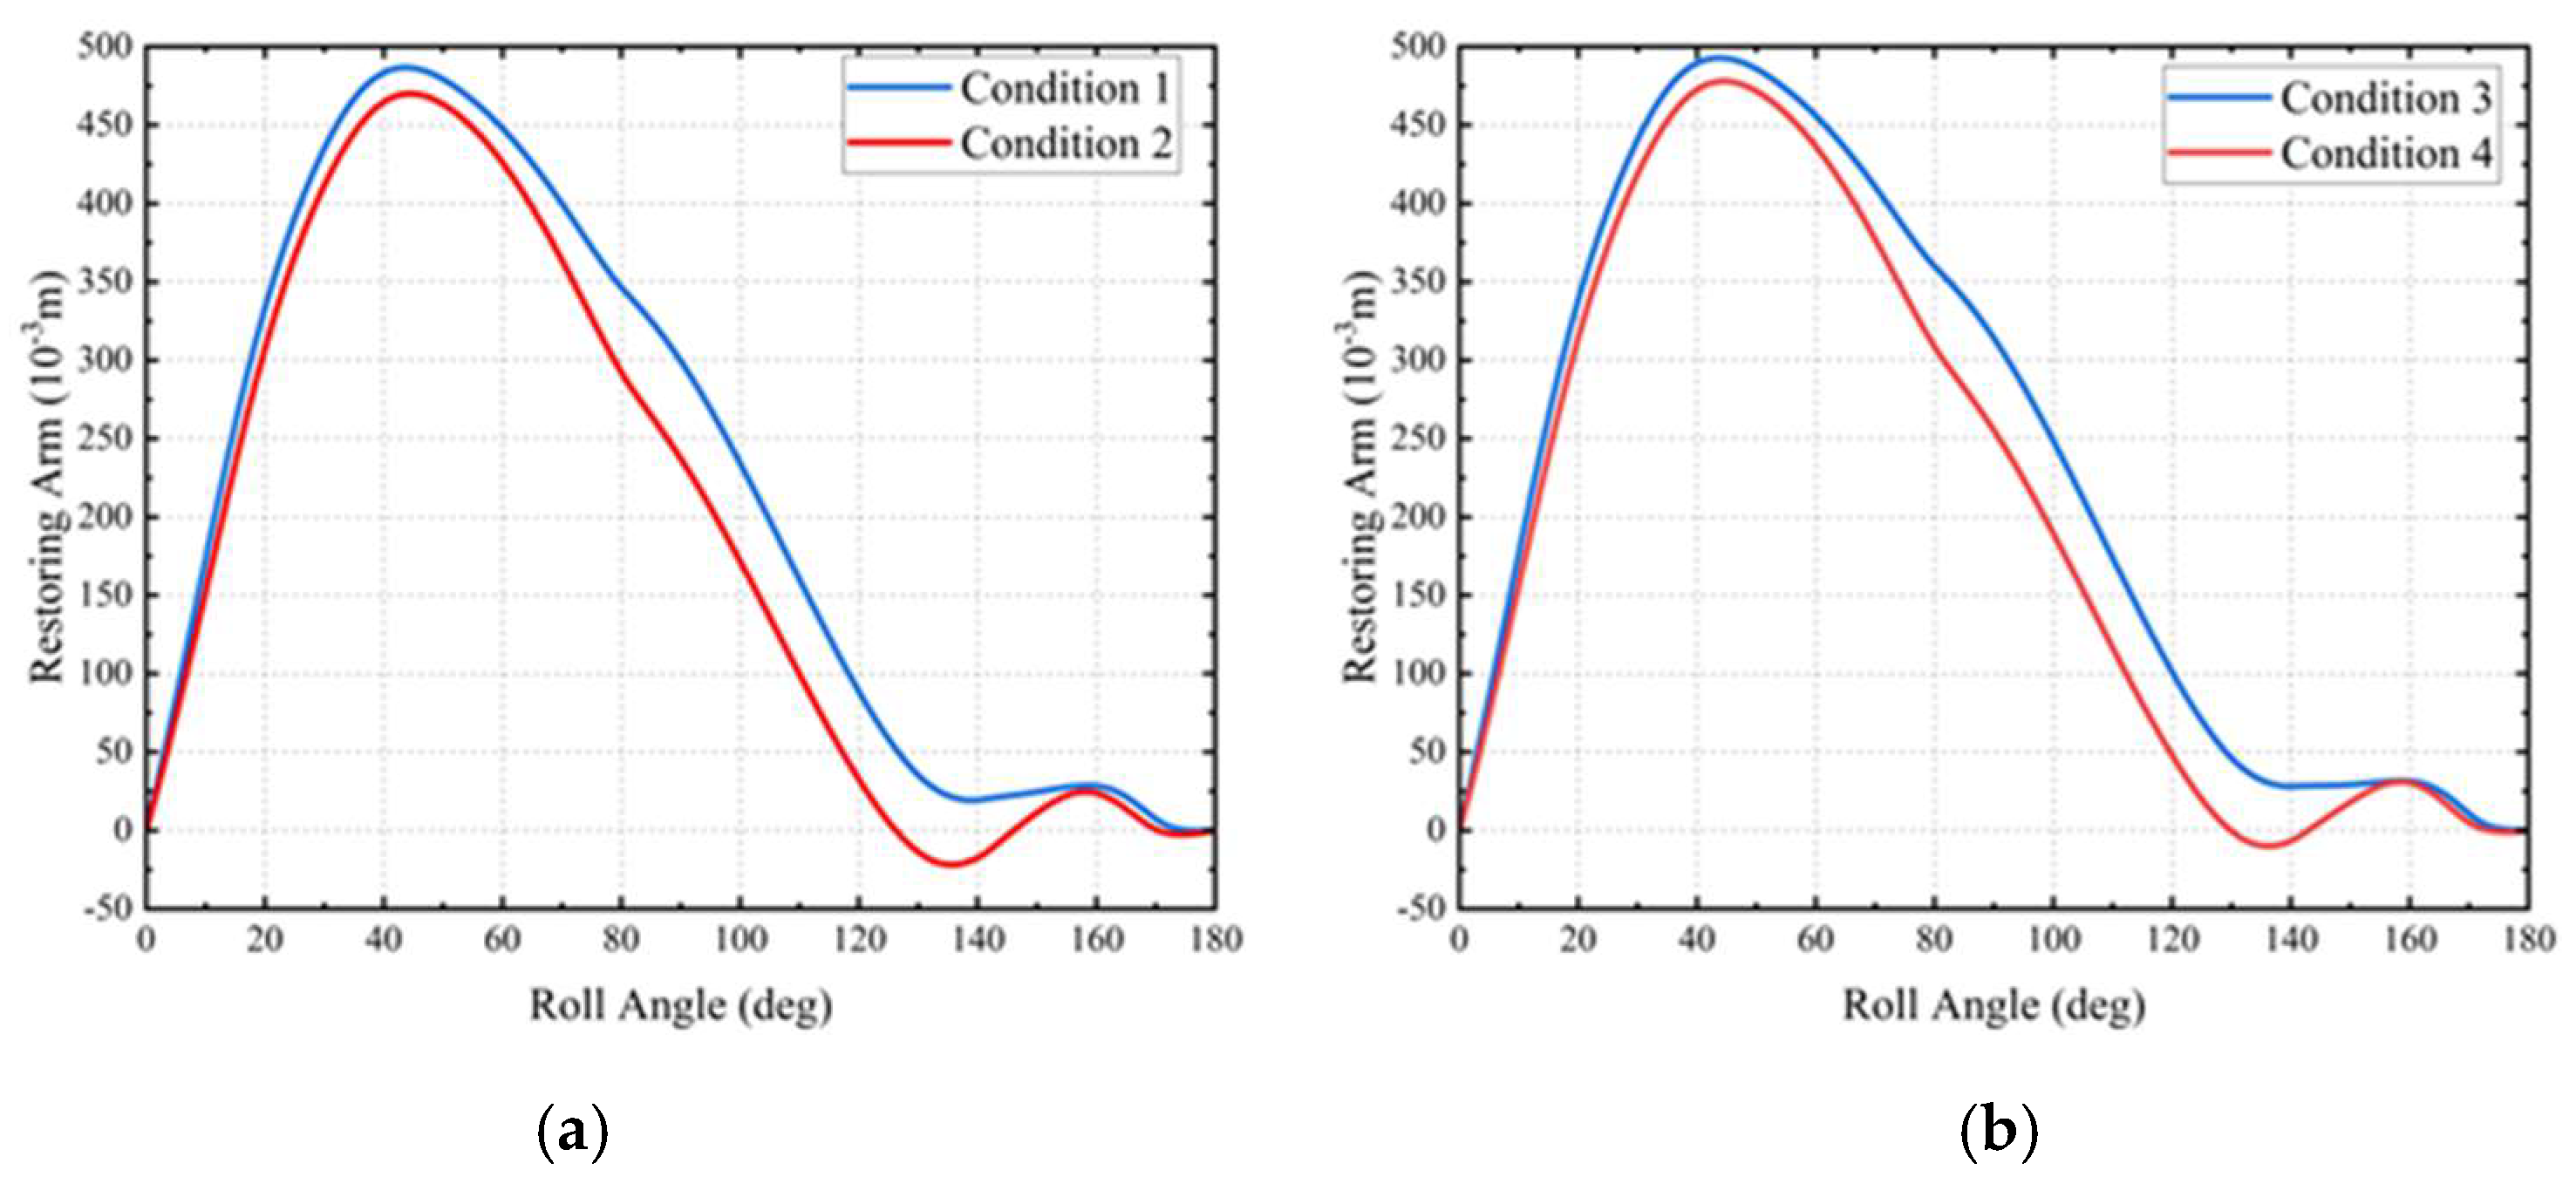
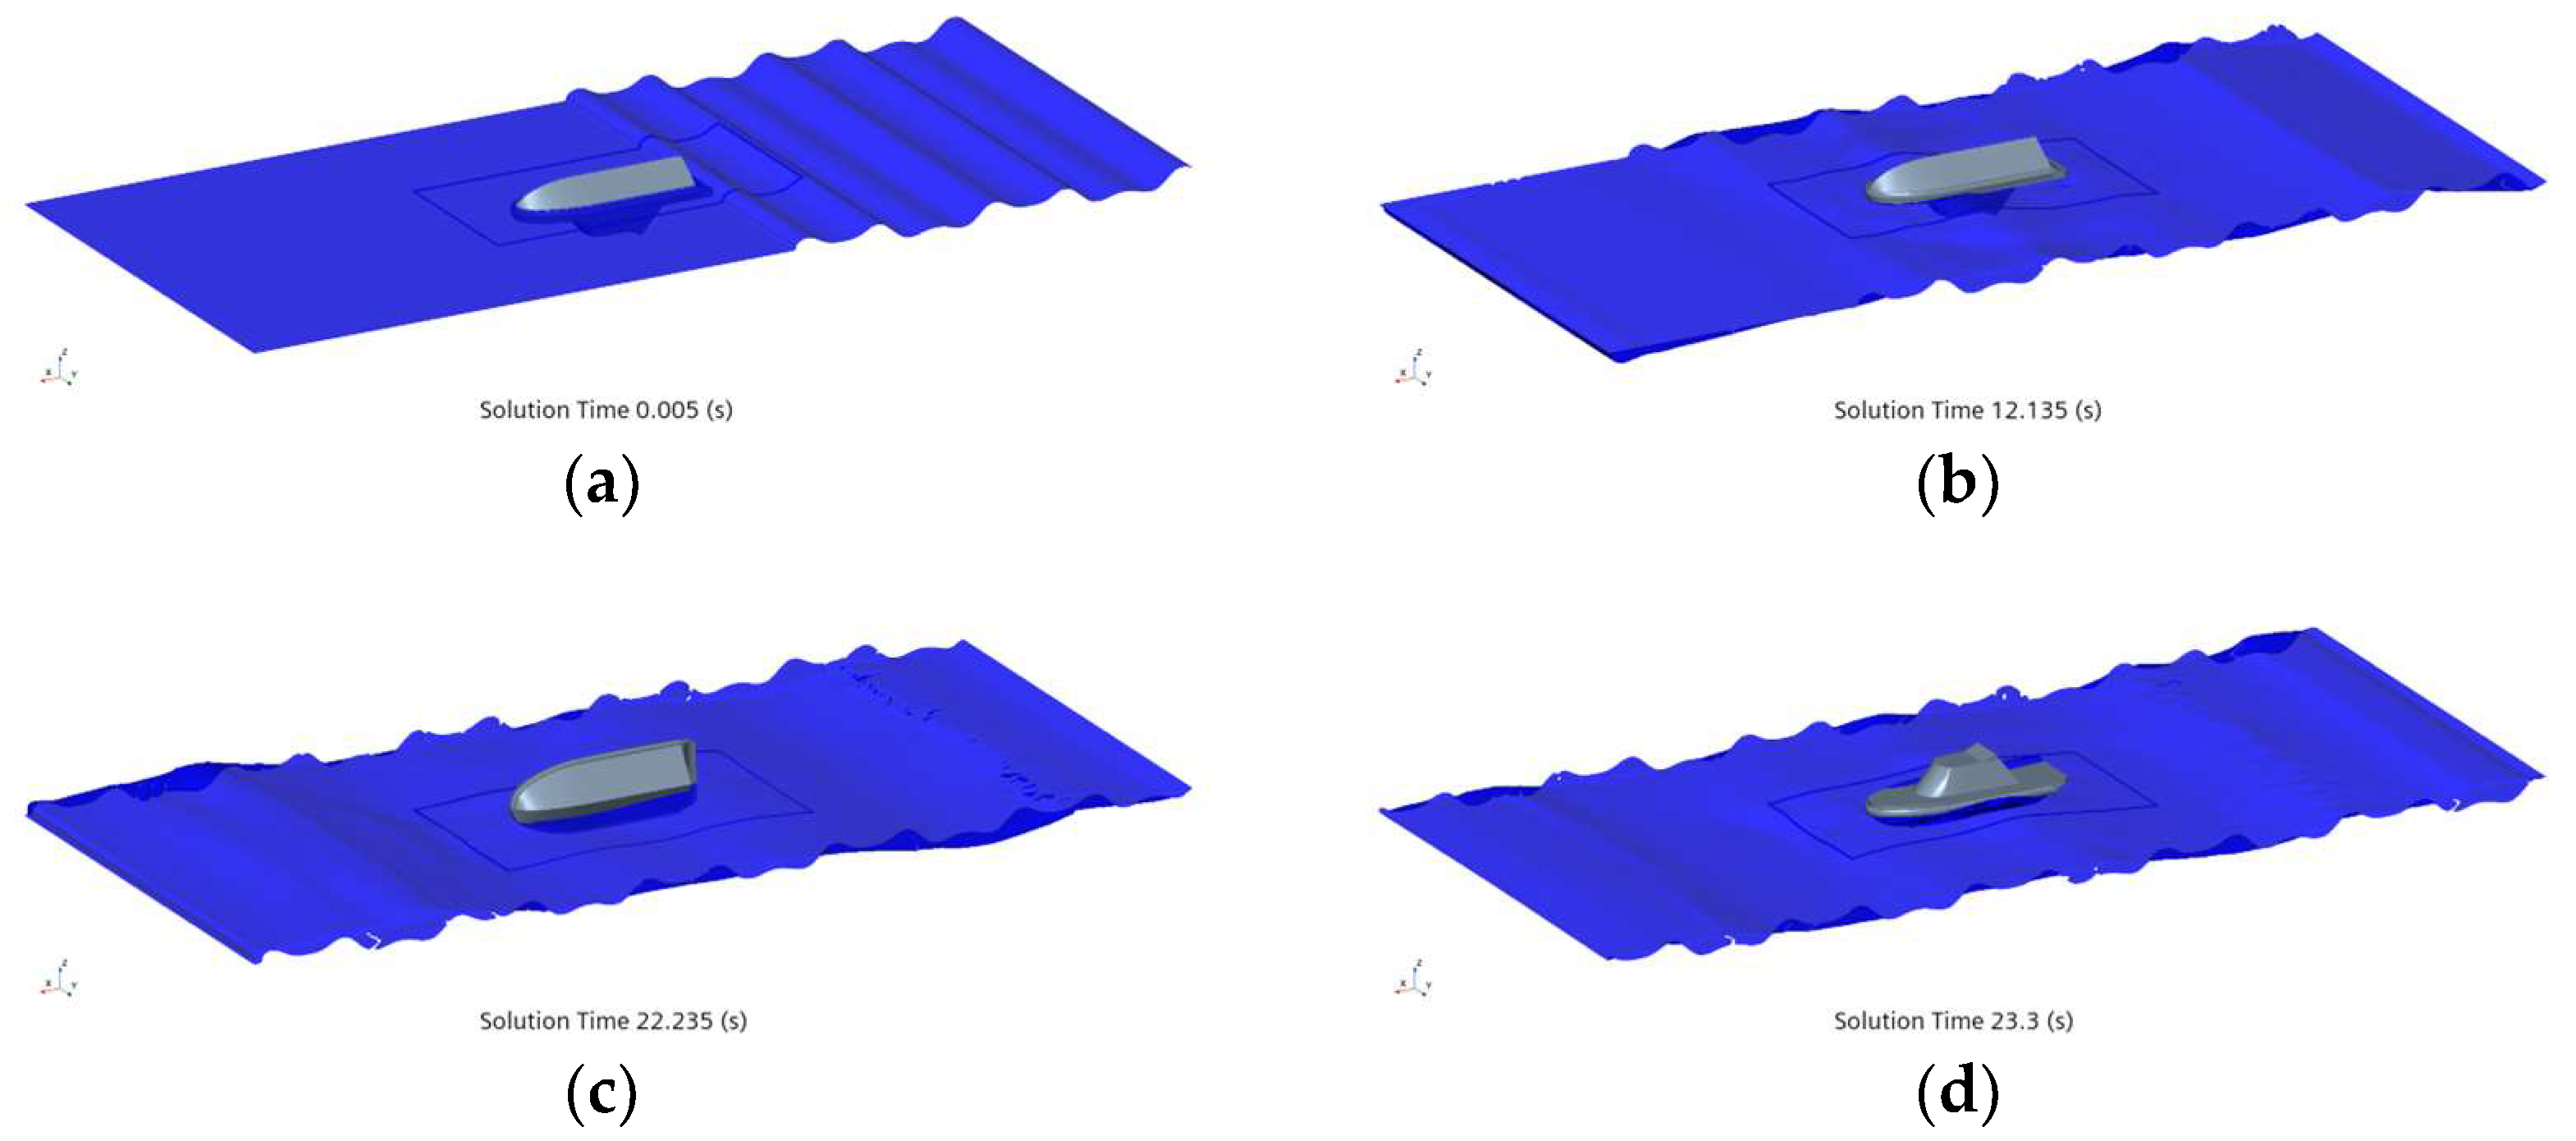
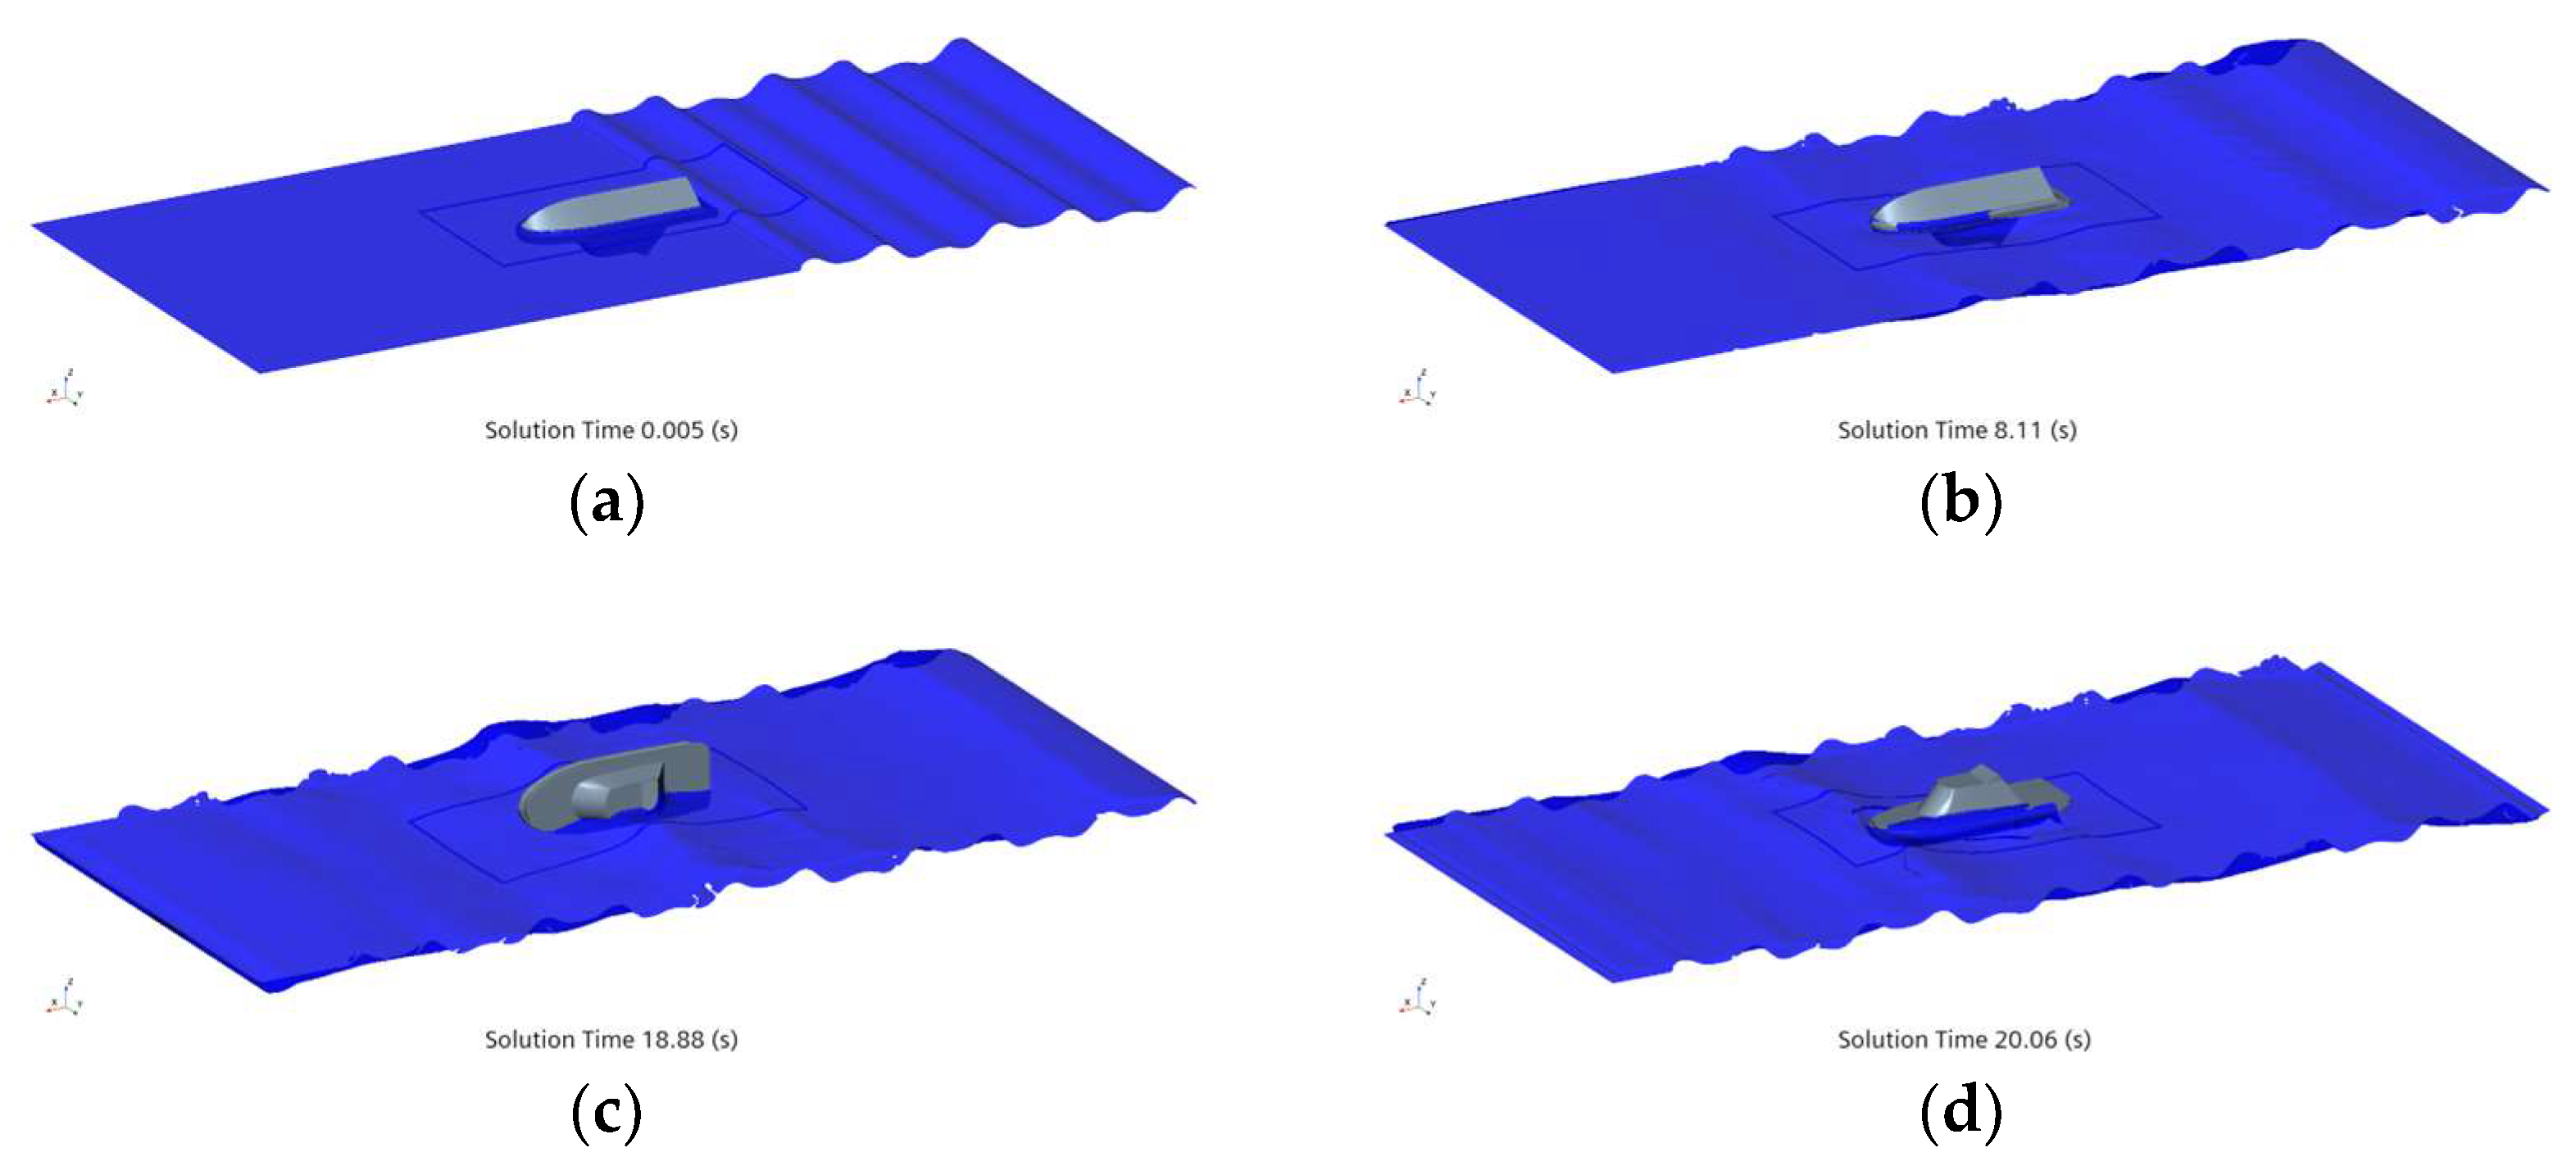
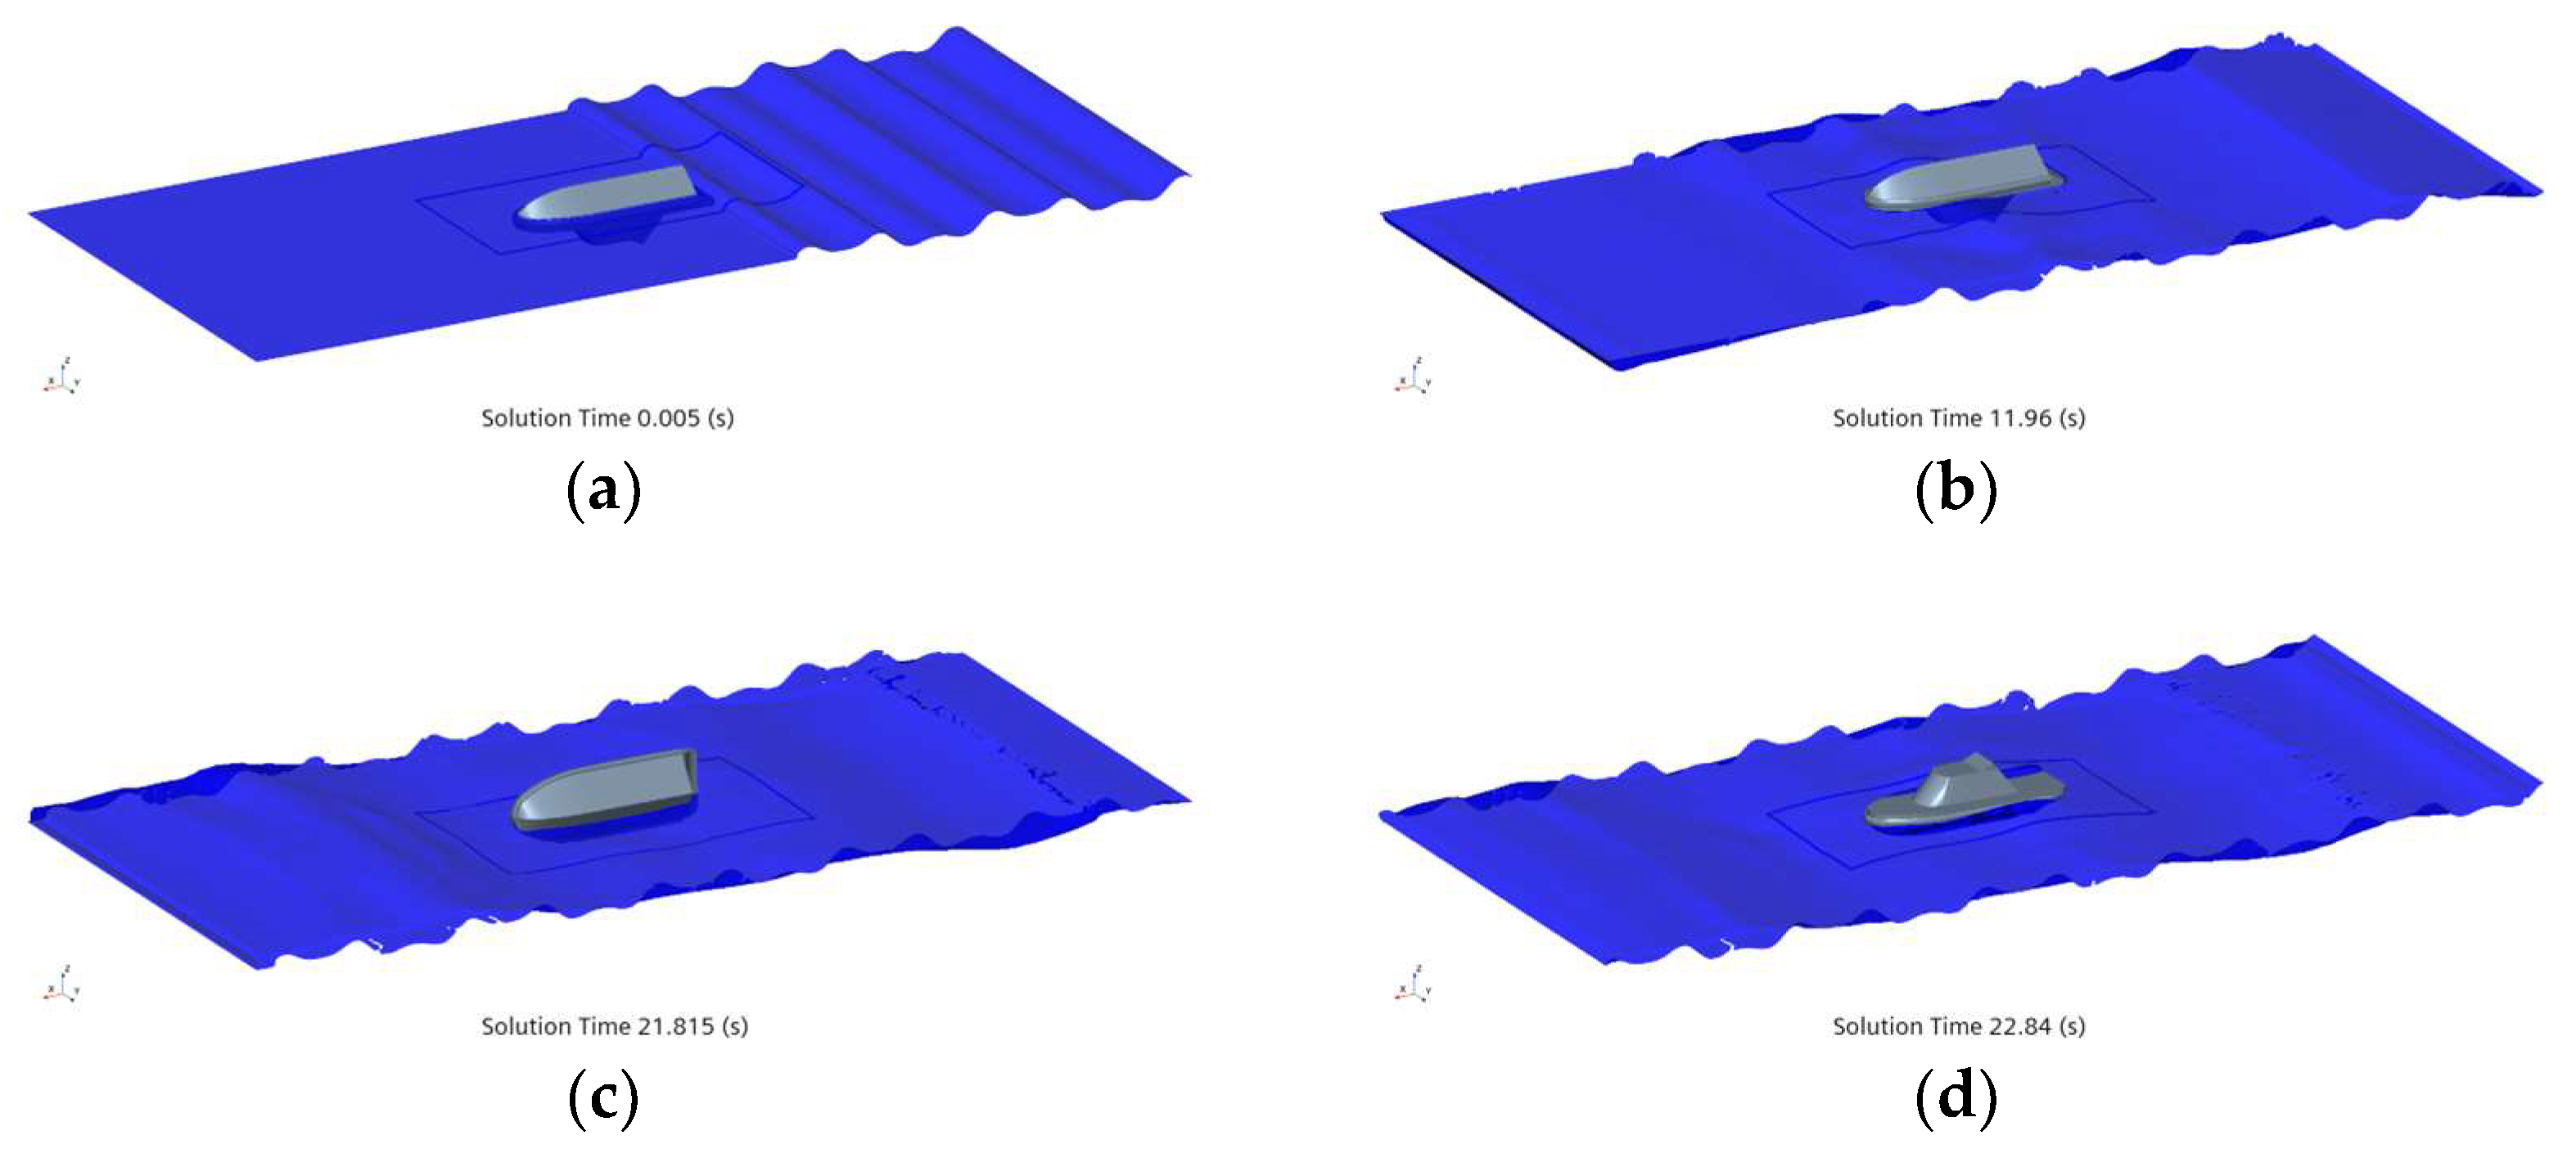
The displacement in condition 1 was smaller than that of condition 3, and the gravity center height of condition 1 was higher than that of condition 3. The displacement in condition 2 was smaller than that of condition 4, and the gravity center height of condition 2 was higher than that of condition 4. There were two factors which were different at the same time, and the influences of the two factors on self-righting performance were opposite. According to the restoring arm curves in Figure 18, the restoring arm is less than zero between 126.4° and 146° for condition 2, and the restoring arm is less than zero between 130° and 142.8° for condition 2. The restoring arm curves mean that, based on the static stability theory, the USV should not have the self-righting ability under condition 2 and condition 4. However, the simulation results shown in Figure 19, Figure 20, Figure 21 and Figure 22 prove the self-righting ability under four working conditions. The change of water surface shape makes the restoring arm in the simulation different from that of the static stability method, which will influence the restoring time. In terms of the restoring time shown in Table 10, the self-righting performance sorted from best to worse is as follows: condition 4, condition 3, condition 1 and condition 2.

5. Conclusions

In our study, the self-righting process and the restoring time of a physical model were computed by using the midpoint average method, the numerical simulation and the experimental method. Then, the reliability of the simulation was fully verified by comparing the CFD results with the results of the improved static method and the experimental method. Eventually, the self-righting performance of a USV under four working conditions was evaluated and analyzed via the simulation method. It was demonstrated that:
(1) The new midpoint average method has computational stability in the integration and is able to estimate the restoring time more conveniently.
(2) Compared with the experiment, the numerical simulation is accurate enough in the self-righting process. This numerical simulation method can be used to compute the restoring time precisely and to predict the self-righting process.
(3) The simulation results of a USV under four working conditions show that under condition 3 (leaving port with maximum load) and under condition 4 (reaching port with maximum load), the USV can return to upright position in 11 s. Under condition 1 (leaving port with the design load) and under condition 2 (reaching port with the design load), the USV returns to the upright position after more than 11 s. The self-righting performance with maximum load is better than that with the design load.
The new midpoint average method and the numerical simulation will serve as tools for the prediction of self-righting performance under different working conditions. However, there are also external forces such as winds and rain under real sea conditions which may greatly influence the self-righting performance of the USV. Future studies will add external forces to the CFD prediction.
Author Contributions

Conceptualization, J.L.; methodology, J.L.; writing—original draft preparation, J.L.; writing—review and editing, G.H.; visualization, G.H.; supervision, G.H.; project administration, J.L.; funding acquisition, G.H. All authors have read and agreed to the published version of the manuscript.

Funding

This study was funded by the National Natural Science Foundation of China (Grant No. 51979115 and No. 51679099) and the special project in Ship of Green Ecology and Environmental Protection (Grant No. 2020307).

Institutional Review Board Statement

Not applicable.

Informed Consent Statement

Not applicable.

Data Availability Statement

The data and any statistical analysis can be made available from the corresponding author upon request.

Conflicts of Interest

The authors declare no conflicts of interest.

References

  1. Hudson, F.D.; Hicks, I.A.; Cripps, R.M. The Design and Development of Modern Lifeboats. Proc. Inst. Mech. Eng. Part A-J. Power Energy 1993, 207, 3–12. [Google Scholar] [CrossRef]
  2. Shepard, D.M. The Development of the Us-Coast-Guards 47-Foot Motor Lifeboat. Nav. Eng. J. 1994, 106, 79–87. [Google Scholar] [CrossRef]
  3. Renilson, M.; Tuite, A. An investigation into the self-righting of a modern racing yacht in waves. J. Ship Res. 2001, 45, 241–247. [Google Scholar] [CrossRef]
  4. Park, J.B.; Lee, D.H.; Kim, D.E.; Kim, S.Y. The Study on The Development of Boats applied to Skill to Prevent Sinking. J. Soc. Nav. Archit. Korea 2006, 43, 844–849. [Google Scholar]
  5. Fu, Q. Discussion on self-supporting lifeboat. Ship Stand. Eng. 2009, 42, 33–36. [Google Scholar]
  6. Grenestedt, J.; Keller, J.; Larson, S.; Patterson, J.; Spletzer, J.; Trephan, T. LORCA: A High Performance USV with Applications to Surveillance and Monitoring. In Proceedings of the IEEE International Symposium on Safety, Security, and Rescue Robotics, West Lafayette, IA, USA, 18–20 October 2015. [Google Scholar]
  7. Akyildiz, H.; Simsek, C. Self-righting boat design. Gemi Insa. Ve Deniz Bilim. Dergi 2016, 6, 41–54. [Google Scholar]
  8. Yim, S.C.S.; Nakhata, T.; Huang, E.T. Coupled nonlinear barge motions, Part II: Stochastic models and stability analysis. J. Offshore Mech. Arct. Eng.-Trans. Asme 2005, 127, 83–95. [Google Scholar] [CrossRef]
  9. Bellec, J.R.; Rodriguez, C.A.; Neves, M.A.S. An investigation on parametric rolling prediction using neural networks. In Proceedings of the 14th International Congress of the International-Maritime-Association-of-the-Mediterranean (IMAM), Genova, Italy, 13–16 September 2011. [Google Scholar]
  10. Storey, J.P.; Hammond, J.L.; G-H-Cater, J.E.; Metcalfe, B.W.; Wilson, P.R. Modelling Dynamic Photovoltaic Arrays for Marine Applications. In Proceedings of the 17th IEEE Workshop on Control and Modeling for Power Electronics (COMPEL), Trondheim, Norway, 27–30 June 2016. [Google Scholar]
  11. Jing, S.; Zhao, Z. Calculation and optimization of self-righting for high speed craft. GSI Ship Build. Technol. 2016, 2, 1–6. [Google Scholar]
  12. Yao, Q.G.; Liu, Y.L. Research on chaos and nonlinear rolling stability of a rotary-molded boat. Nonlinear Dyn. 2016, 84, 1373–1382. [Google Scholar] [CrossRef]
  13. Bai, T.C.; Ding, Z.Y.; Wang, X.Z.; Zhang, Z.G.; Zhang, F.C. Theoretical Analysis of the Performance of a Self-Righting Boat. In Proceedings of the 36th ASME International Conference on Ocean, Offshore and Arctic Engineering, Trondheim, Norway, 25–30 June 2017. [Google Scholar]
  14. Tavakoli, S.; Ghadimi, P.; Sahoo, P.K.; Dashtimanesh, A. A hybrid empirical-analytical model for predicting the roll motion of prismatic planing hulls. Proc. Inst. Mech. Eng. Part M-J. Eng. Marit. Environ. 2018, 232, 155–175. [Google Scholar] [CrossRef]
  15. Zaman, M.B.; Baidowi, A.; Fanany, A.I. Effect of Design Engine Room Layout on Self-Righting System-Case Study: Fast Boat. Int. J. Mar. Eng. Innov. Res. 2019, 4, 57–68. [Google Scholar] [CrossRef]
  16. Lin, Y.; Xu, X.; Ye, C. Self-righting optimization design for an unmanned speedboat on the high seas. J. Harbin Eng. Univ. 2020, 41, 1261–1267. [Google Scholar]
  17. Deng, C.; Chang, Z.; Feng, Z.; Zhang, J. Propulsion performance analysis of hydrofoil on a wave-powered boat. Chin. J. Ship Res. 2020, 15, 119–126. [Google Scholar]
  18. Guan, G.; Wang, L.; Geng, J.H.; Yang, Q. Automatic optimal design of self-righting deck of USV based on combined optimization strategy. Ocean Eng. 2020, 217, 107824. [Google Scholar] [CrossRef]
  19. Trimulyono, A.; Fuadi, M.A.; Zakki, A.F.; Mursid, O.; Iqbal, M. Design of Anti-Capsize Ship for Patrol Vessel with the Self-Righting Moment. J. Mar. Sci. Eng. 2023, 11, 133. [Google Scholar] [CrossRef]
  20. Xu, T. Automatic sampling of sea water quality based on electric propulsion unmanned ship. Water Sci. Technol. 2021, 84, 3346–3358. [Google Scholar] [CrossRef] [PubMed]
  21. Sheng, Z.; Liu, Y. Ship Principle; Shanghai Jiaotong University Press: Shanghai, China, 2015. [Google Scholar]
  22. Liu, L.; Chen, M.; Wang, X.; Zhang, Z.; Yu, J.; Feng, D. CFD Prediction of Full-Scale Ship Parametric Roll in Head Wave. Ocean Eng. 2021, 233, 109180. [Google Scholar] [CrossRef]
  23. Menter, F.R. Two-Equation Eddy-Viscosity Turbulence Models for Engineering Applications. AIAA J. 1994, 32, 1598–1605. [Google Scholar] [CrossRef]
  24. Hirt, C.W.; Nichols, B.D. Volume of Fluid (VOF) Method for Dynamics of Free Boundaries. J. Comput. Phys. 1981, 39, 201–225. [Google Scholar] [CrossRef]
  25. ITTC. Practical Guidelines for Ship CFD Applications; 7.5-03-02-03, ITTC-Recommended Procedures and Guidelines; ITTC: Zürich, Switzerland, 2014. [Google Scholar]
  26. Roache, P. Errors bars for CFD. In Proceedings of the 41st Aerospace Sciences Meeting, Reno, NV, USA, 6–9 January 2003. AIAA 2003-408. [Google Scholar]
  27. Manna, P.; Dharavath, M.; Sinha, P.K.; Chakraborty, D. Optimization of a flight-worthy scramjet combustor through CFD. Aerosp. Sci Technol. 2013, 27, 138–146. [Google Scholar] [CrossRef]
  28. Freitas, C.J. The issue of numerical uncertainty. Appl. Math. Model. 2002, 26, 237–248. [Google Scholar] [CrossRef]
  29. Cuter, A.D.; Danehy, P.M.; O’Byrne, S.; Rodrigues, C.G.; Drummond, J.P. Supersonic combustion experiment for CFD model development and validation. In Proceedings of the 42nd AIAA Aerospace Sciences Meeting and Exhibit, Reno, NV, USA, 5–8 January 2004. AIAA paper no. 2004-266. [Google Scholar]
  30. Celik, I.; Ghia, U.; Roache, P.; Freitas, C.; Coloman, H.; Raad, P. Procedure for Estimation and Reporting of Uncertainly Due to Discretization in CFD Applications. J. Fluids Eng. 2008, 130, 078001. [Google Scholar]
  31. Sadat-Hosseini, S.H. CFD Prediction of Ship Capsize: Parametric Rolling, Broaching, Surf-Riding, and Periodic Motions; University of Iowa: Iowa City, IA, USA, 2009. [Google Scholar]
Figure 1. Solution flowchart for the midpoint average method.
Jmse 12 00529 g001
Figure 2. Restoring time results of the experiment [13], T-V method [13] and M-A method.
Jmse 12 00529 g002
Figure 3. Physical model.
Jmse 12 00529 g003
Figure 4. Restoring arm curve of physical model.
Jmse 12 00529 g004
Figure 5. Interval quantity convergence.
Jmse 12 00529 g005
Figure 6. Results of the midpoint average method in time domain.
Jmse 12 00529 g006
Figure 7. Computational domain.
Jmse 12 00529 g007
Figure 8. Two refinements and the fine mesh configuration of the physical model.
Jmse 12 00529 g008
Figure 9. Inlet and outlet surfaces.
Jmse 12 00529 g009
Figure 10. Comparison of (a) whole time histories and (b) processed time histories in fine, medium and coarse mesh.
Jmse 12 00529 g010
Figure 11. Roll amplitude in frequency domain from Fourier series analysis.
Jmse 12 00529 g011
Figure 12. Physical model in experiment.
Jmse 12 00529 g012
Figure 13. Self-righting process of simulation and experiment. (a) Roll angle is 180°; (b) roll angle is 90°; (c) roll angle is 0°.
Jmse 12 00529 g013
Figure 14. Restoring time of the midpoint average method, the simulation and the experiment.
Jmse 12 00529 g014
Figure 15. The USV model.
Jmse 12 00529 g015
Figure 16. Computational domain of USV.
Jmse 12 00529 g016
Figure 17. Two refinements and the fine mesh configuration of the boat.
Jmse 12 00529 g017
Figure 18. (a) Restoring arm curves for condition 1 and condition 2. (b) Restoring arm curves for condition 3 and condition 4.
Jmse 12 00529 g018
Figure 19. Self-righting process for condition 1. (a) Simulation initiation; (b) roll angle is 180°; (c) roll angle is 90°; (d) roll angle is 0°.
Jmse 12 00529 g019
Figure 20. Self-righting process for condition 2. (a) Simulation initiation; (b) roll angle is 180°; (c) roll angle is 90°; (d) roll angle is 0°.
Jmse 12 00529 g020
Figure 21. Self-righting process for condition 3. (a) Simulation initiation; (b) roll angle is 180°; (c) roll angle is 90°; (d) roll angle is 0°.
Jmse 12 00529 g021
Figure 22. Self-righting process for condition 4. (a) Simulation initiation; (b) roll angle is 180°; (c) roll angle is 90°; (d) roll angle is 0°.
Jmse 12 00529 g022
Table 1. Results of validation compared to Bai et al. [13].
Gravity center height (m)0.70.80.91.0
T - V   method Experiment Experiment +17.27%-+13.6%-
M - A   method Experiment Experiment −0.03%-−12.17%-
Table 2. Main parameters of model.
Top length of trapezoid48.2 cm
Bottom length of trapezoid32.24 cm
Width of trapezoid20 cm
Height of trapezoid20 cm
Total weight15.6 kg
X-direction gravity center position0 cm
Y-direction gravity center position0 cm
Z-direction gravity center position9.33 cm
X-direction moment of inertia (based on gravity center)0.1 kg·m2
Table 3. Results of interval quantity convergence.
Interval quantity90100120160180200240300360450
Restoring time (s)1.861.852.022.372.252.222.242.182.202.17
Table 4. Results of time step convergence.
Time StepSize (s)Angular Velocity (rad/s)
Coarse0.012.741
Medium0.0052.898
Fine0.00252.895
Table 5. GCI results.
Refinement ratio, r 2
Fine configuration solution (°), S 1 5.185
Medium configuration solution (°), S 2 5.051
Coarse configuration solution (°), S 3 5.122
Order of accuracy, p 1.84
GCI0.0364
Table 6. Main parameters of model in the experiment.
Top length of trapezoid48.2 cm
Bottom length of trapezoid32.24 cm
Width of trapezoid20 cm
Height of trapezoid20 cm
Length of iron block4.7 cm
Width of iron block10.9 cm
Height of iron block20 cm
Length of iron sheet32 cm
Width of iron sheet20 cm
Height of iron sheet0.3 cm
Weight of trapezoid8.1 kg
Weight of iron block5.7 kg
Weight of iron sheet1.8 kg
Total weight15.6 kg
X-direction gravity center position0
Y-direction gravity center position0
Z-direction gravity center position9.33 cm
X-direction moment of inertia (based on gravity center)0.1 kg·m2
Table 7. Parameters of camera.
Exposure TimeFrame RateImage WidthImage Height
479 μs1256 Fps1280860
Table 8. Main parameters of the USV.
Length8.819 m
Width2.94 m
Depth1.5 m
Design displacement6.33 t
Standard draft0.761 m
Design speed30 kn
Table 9. Parameters of working conditions.
Displacement (t)Draft (m)Position of Gravity Center
x G (m) y G (m) z G (m)
Condition 16.830.8102.8800.947
Condition 26.200.7732.8101.001
Condition 36.930.8162.9100.934
Condition 46.300.7792.8400.985
Table 10. Restoring time for four working conditions in the simulation.
Restoring Time (s)
Condition 111.17
Condition 211.955
Condition 310.885
Condition 49.645
Disclaimer/Publisher’s Note: The statements, opinions and data contained in all publications are solely those of the individual author(s) and contributor(s) and not of MDPI and/or the editor(s). MDPI and/or the editor(s) disclaim responsibility for any injury to people or property resulting from any ideas, methods, instructions or products referred to in the content.