Brief Report

Environmental Factors Influencing Annual Changes in Bycatch per Unit Effort of Delphinus delphis around Their Main Hotspot in Korean Waters

1
Cetacean Research Institute, National Institute of Fisheries Science, Ulsan 44780, Republic of Korea
2
Ocean Climate and Ecology Research Division, National Institute of Fisheries Science, Busan 46083, Republic of Korea
*
Author to whom correspondence should be addressed.
J. Mar. Sci. Eng. 2024, 12(4), 525; https://doi.org/10.3390/jmse12040525
Submission received: 16 February 2024 / Revised: 20 March 2024 / Accepted: 20 March 2024 / Published: 22 March 2024
(This article belongs to the Section Marine Ecology)

Abstract

:
In this study, the characteristics of temporal changes in bycatch per unit effort (BPUE) as an index of the relative density of the common dolphin around their widest hotspot in the East Sea/Sea of Japan were examined from 2011 to 2021. BPUE rapidly increased from 2017 to 2019. The annual changes in BPUE were due to changes during March–April, which is the most abundant season for common dolphins. The annual relationship between BPUE and four variables (Pacific herring, common squid catches, chlorophyll-a concentration, and sea surface temperature) around their main hotspot for March–April was investigated using generalized linear models (GLMs) for gamma distribution. A stepwise Bayesian information criterion for the gamma GLM yielded significant retention of two variables, Pacific herring catch and chlorophyll-a concentration, over the study period, indicating that the rapid increase of the relative density of the common dolphin in the early spring during 2017–2019 could be due to the increase of their prey abundance caused by higher primary productivity. Therefore, ecosystem productivity altered by nutrient conditions could be a key biological process that enhances habitat use of cetaceans in highly productive seasons and regions.

1. Introduction

The common dolphin (Delphinus delphis Linnaeus) is a globally abundant species that is mainly distributed in the tropical and temperate waters of the Atlantic and Pacific oceans [1,2]. It has been known that common dolphins calving in the offshore waters of the North Pacific Ocean and Black Sea peaks in May-June and June-August, respectively, and their prey consists largely of small epipelagic schooling fishes and squid [1,3]. In Korean waters, most studies on the ecology of common dolphins have focused on the distribution characteristics and composition of prey species [4,5]. For example, Ahn et al. [5] reported that the prey species found in the stomach contents of common dolphins were mostly Enoploteuthis chunii (a squid species), common squid, and Pacific herring. According to several prior studies [6,7,8], common dolphins are mostly found in the East Sea of Korea. Yoo et al. [4] identified the existence of common dolphin hotspots in the coastal regions of the East Sea based on cetacean sighting surveys in Korean waters over the past 20 years.
Hotspots are defined as areas with a high concentration of species [9,10]. Many marine wildlife populations have hotspots in their distribution [11]. Hotspots have been widely used to determine priority areas for spatial conservation at different geographic scales because they can represent core areas of the habitat use of a species [12]. Therefore, numerous studies have been conducted to identify the hotspots of marine mammals [4,13,14,15]. Hotspots are areas that are not spatially fixed and can change over time. A number of studies have reported on human activity and natural impacts that drive hotspot alteration [13,16,17]. Considering that marine mammals are vulnerable to habitat alteration, how they use their habitat and how their populations change over time in their habitat are of central importance in their management [13,18]. In addition, in the core habitats of cetaceans, although many studies have shown that human activities such as fisheries bycatch (incidental catch of non-target species) pose risks to them [16,19,20], the mechanism by which environmental factors affect their abundance (or density) has been examined in several studies because of cetaceans’ role within ecosystems and in the evaluation of their habitat use [21,22].
The hotspots of common dolphins in Korean waters are vulnerable habitats because the fishing grounds of various fisheries are formed around these hotspots, resulting in the bycatch of a large number of common dolphins [4]. Although implementing policies such as restrictions on fishing activities in the hotspots of common dolphin is necessary to maintain its population, environmental factors that influence spatial and temporal variations in its population must also be examined, because such factors can induce uncertainty regarding the effectiveness of these policies. However, there is little information on the environmental factors driving the habitat use of common dolphins in Korean waters.
Changes in sea temperature resulting from climate changes are a physical factor producing a variety of impacts on the distribution, habitat, and migration of cetaceans [23]. In particular, sea temperature features are a key factor in the habitat selection of cetaceans [24]. For example, Ferrero et al. [25] described latitudinal shifts toward habitats characterized by the preferred sea surface temperatures (SSTs) of small cetaceans in the central North Pacific. According to Citta et al. [26], bowhead whales in the Chukchi Sea are generally found in water with temperatures <0 °C. Furthermore, Cox et al. [27] reported that increased harbor porpoise detection rates in the late winter or early spring in the Celtic Sea are associated with low SSTs.
Chlorophyll concentration and prey abundance (e.g., small pelagic fishes) are biological factors that determine habitat use of cetaceans [11]. Hotspots may be locations with coastal foraging habitats [17]. Cañadas and Hammond [28] showed that chlorophyll concentration was correlated with common dolphin abundance. Scott et al. [17] reported that seven species of marine mammals preferentially foraged within habitats with high concentrations of chlorophyll in their hotspots in the North Sea off the east coast of Scotland, UK. According to Pietroluongo et al. [29], common dolphins in the western and eastern Mediterranean areas during warmer months preferred coastal waters because of the movement of small pelagic fish to epipelagic areas. Meyer-Gutbrod et al. [30] examined seasonal relationships between habitat use patterns of the right whale and its prey abundance in its Southeast US calving grounds from 1990 to 2018. Furthermore, primary productivity and prey distribution have been used as predictor variables in habitat models of small cetaceans [31,32].
Annual changes in the abundance (or density) of highly mobile marine mammals, estimated from ship-based or aerial line-transect surveys, have been described in their coastal habitats [22,29,33]. Visual line-transect surveys are commonly used to estimate cetacean abundance [34], but ship and aerial use of such surveys can be prohibitively expensive [35,36]. Recently, our study examined whether bycatch per unit effort (BPUE) can be considered as a possible relative abundance index of cetacean species as part of an inexpensive method for examining changes in abundance and suggested that the annual BPUE of common dolphins by set net could be used to index the relative abundance of species in the coastal regions of the East Sea of Korea [37].
In this study, we focused on environmental factors that influence annual changes in the BPUE of the common dolphin around their main hotspots in Korean waters. Reliable information on cetacean bycatch has been provided since 2011, when a legal system for collecting information in Korean waters was established [37]. Therefore, we initially examined the characteristics of temporal changes in the BPUE from 2011 to 2021 and then investigated the relationships between the annual BPUE and environmental variables using regression models.

2. Materials and Methods

2.1. Data Collection

A certificate reported from a mandatory investigation (bycatch species and location, type of injury to cetacean, etc.) for each cetacean bycaught by fishermen was issued by the Korean Coast Guard in 2011 [37]. Each cetacean bycaught in fishing gear is individually counted. In this study, spatial and temporal count data of (individual) common dolphin bycatch in Korean waters from 2011 to 2021 were obtained from these certificates.
Two provinces (Gangwon-do and Gyeongsangbuk-do) occupy most of the eastern part of the Korean Peninsula (Figure 1). The widest hotspot of common dolphins in Korean waters was formed in the coastal region of Gyeongsangbuk-do, which is located in the southern area of the East Sea/Sea of Japan (ES) (Figure 1) [4]. This study was conducted around the widest hotspot of common dolphins, as their main hotspot. In the present study, the BPUE of common dolphins using a set net is used to index the relative density of species in the coastal region [37]. The BPUE was calculated by dividing the bycatch by the gear number of the set nets in each year. The annual effort data (number of gears) of the set nets permitted by Gyeongsangbuk-do in 2011–2021 are available at the Korea Statistical Information Service website (http://kosis.kr, accessed on 22 September 2023). In Korean waters, set net fishing is annually permitted at a certain location within the coastal region in accordance with the pertinent law. Therefore, there are hardly any monthly changes in the gear number of set nets in the coastal regions, but the annual changes showed slight decreases from 2011 to 2019 [37].
The present study is designed to examine how nutritional and physical variables influence annual changes in BPUE in the study area. Prey abundance and primary production were considered as nutritional variables of the common dolphin in the study area. Two species (Pacific herring and common squid) of the three species known to be the main prey species of common dolphin [5] have been regarded as major fishery resources in Korean waters, and their catch data have been recorded as National Statistics. Pacific herring and common squid catches from set nets in the coastal region of Gyeongsangbuk-do were considered as prey abundance variables of common dolphins in the study area. These catch data were obtained from the abovementioned Korea Statistical Information Service website.
Chlorophyll-a concentration (µg L−1) was considered as a proxy for primary production. Chlorophyll-a, which was estimated using the OCx algorithm, was obtained from VIIRS-SNPP by the Ocean Biology Processing Group at NASA Goddard Space Flight Center (https://oceandata.sci.gsfc.nasa.gov/VIIRS-SNPP, accessed on 4 September 2023). In this study, the monthly level-3 datasets from 2011 to 2021 at a spatial resolution of 4 km were used. The spatial range for chlorophyll-a concentration estimated in the study area is shown in Figure 1.
On the other hand, SSTs along the coast of Gyeongsangbuk-do were used to build our statistical habitat models as a physical variable. The SSTs on the coast have been monitored daily at Gampo, Pohang, and Jukbyeon since 2011 (Figure 1). However, the SSTs at Gampo and Jukbyeon were only observed from 2012 to 2015. The monthly averaged SST at Pohang had a positive significant (R2 = 0.9149, p < 0.05) correlation with the monthly average SSTs of Gampo and Jukbyeon from 2012 to 2015. Therefore, the temporal changes in SSTs at Pohang may present the changes in SSTs in the study area. The SST data were provided through the Korea Ocean Data Center (https://www.nifs.go.kr/kodc/index.kodc, accessed on 22 September 2023).

2.2. Data Analysis

The relationships among the variables were examined using Pearson and Spearman rank correlations. The Spearman correlation is appropriate when the normality of variables is not guaranteed [38]. A Shapiro–Wilk test was performed to detect the non-normality of variables with small sample sizes [39].
We also examined the relationships between a response variable (BPUE) and four explanatory variables (Pacific herring, common squid catches, chlorophyll-a concentration, and SST) using generalized linear models (GLMs). In addition, we used the generalized variance inflation factor (GVIF) to examine the presence of multicollinearity among explanatory variables within the GLM (GVIF < 5) [40]. The GLM has been used in the temporal analysis of cetacean abundance to relate timing to environmental variability at various timescales [41,42]. The GLM goes beyond the general linear model by allowing for non-normally distributed response variables [43]. When the distribution of a continuous response variable is non-normal and its values are positive, gamma distribution is useful in a GLM [43]. The gamma GLM takes an inverse link function as a canonical link. A stepwise procedure was applied to select the best model, which was composed of the combination of explanatory variables with the lowest Bayesian information criterion (BIC) [44]. BIC was selected as the measure of variable utility because it generally yields a more parsimonious model [44,45]. The stepwise BIC procedure has often been used to select the best habitat model for cetaceans [46,47]. Statistical modeling was performed using a GLM function in R (R Development Core Team). Confidence intervals at the 95% level for the coefficients estimated from the selected gamma GLM were calculated using a percentile method with 1000 bootstrap samples. Furthermore, additional confidence intervals at the 95% level were computed for predictions from the selected gamma GLM based on the percentiles of the gamma distribution using a function in R.

3. Results

3.1. Characteristics of Temporal Changes in BPUE

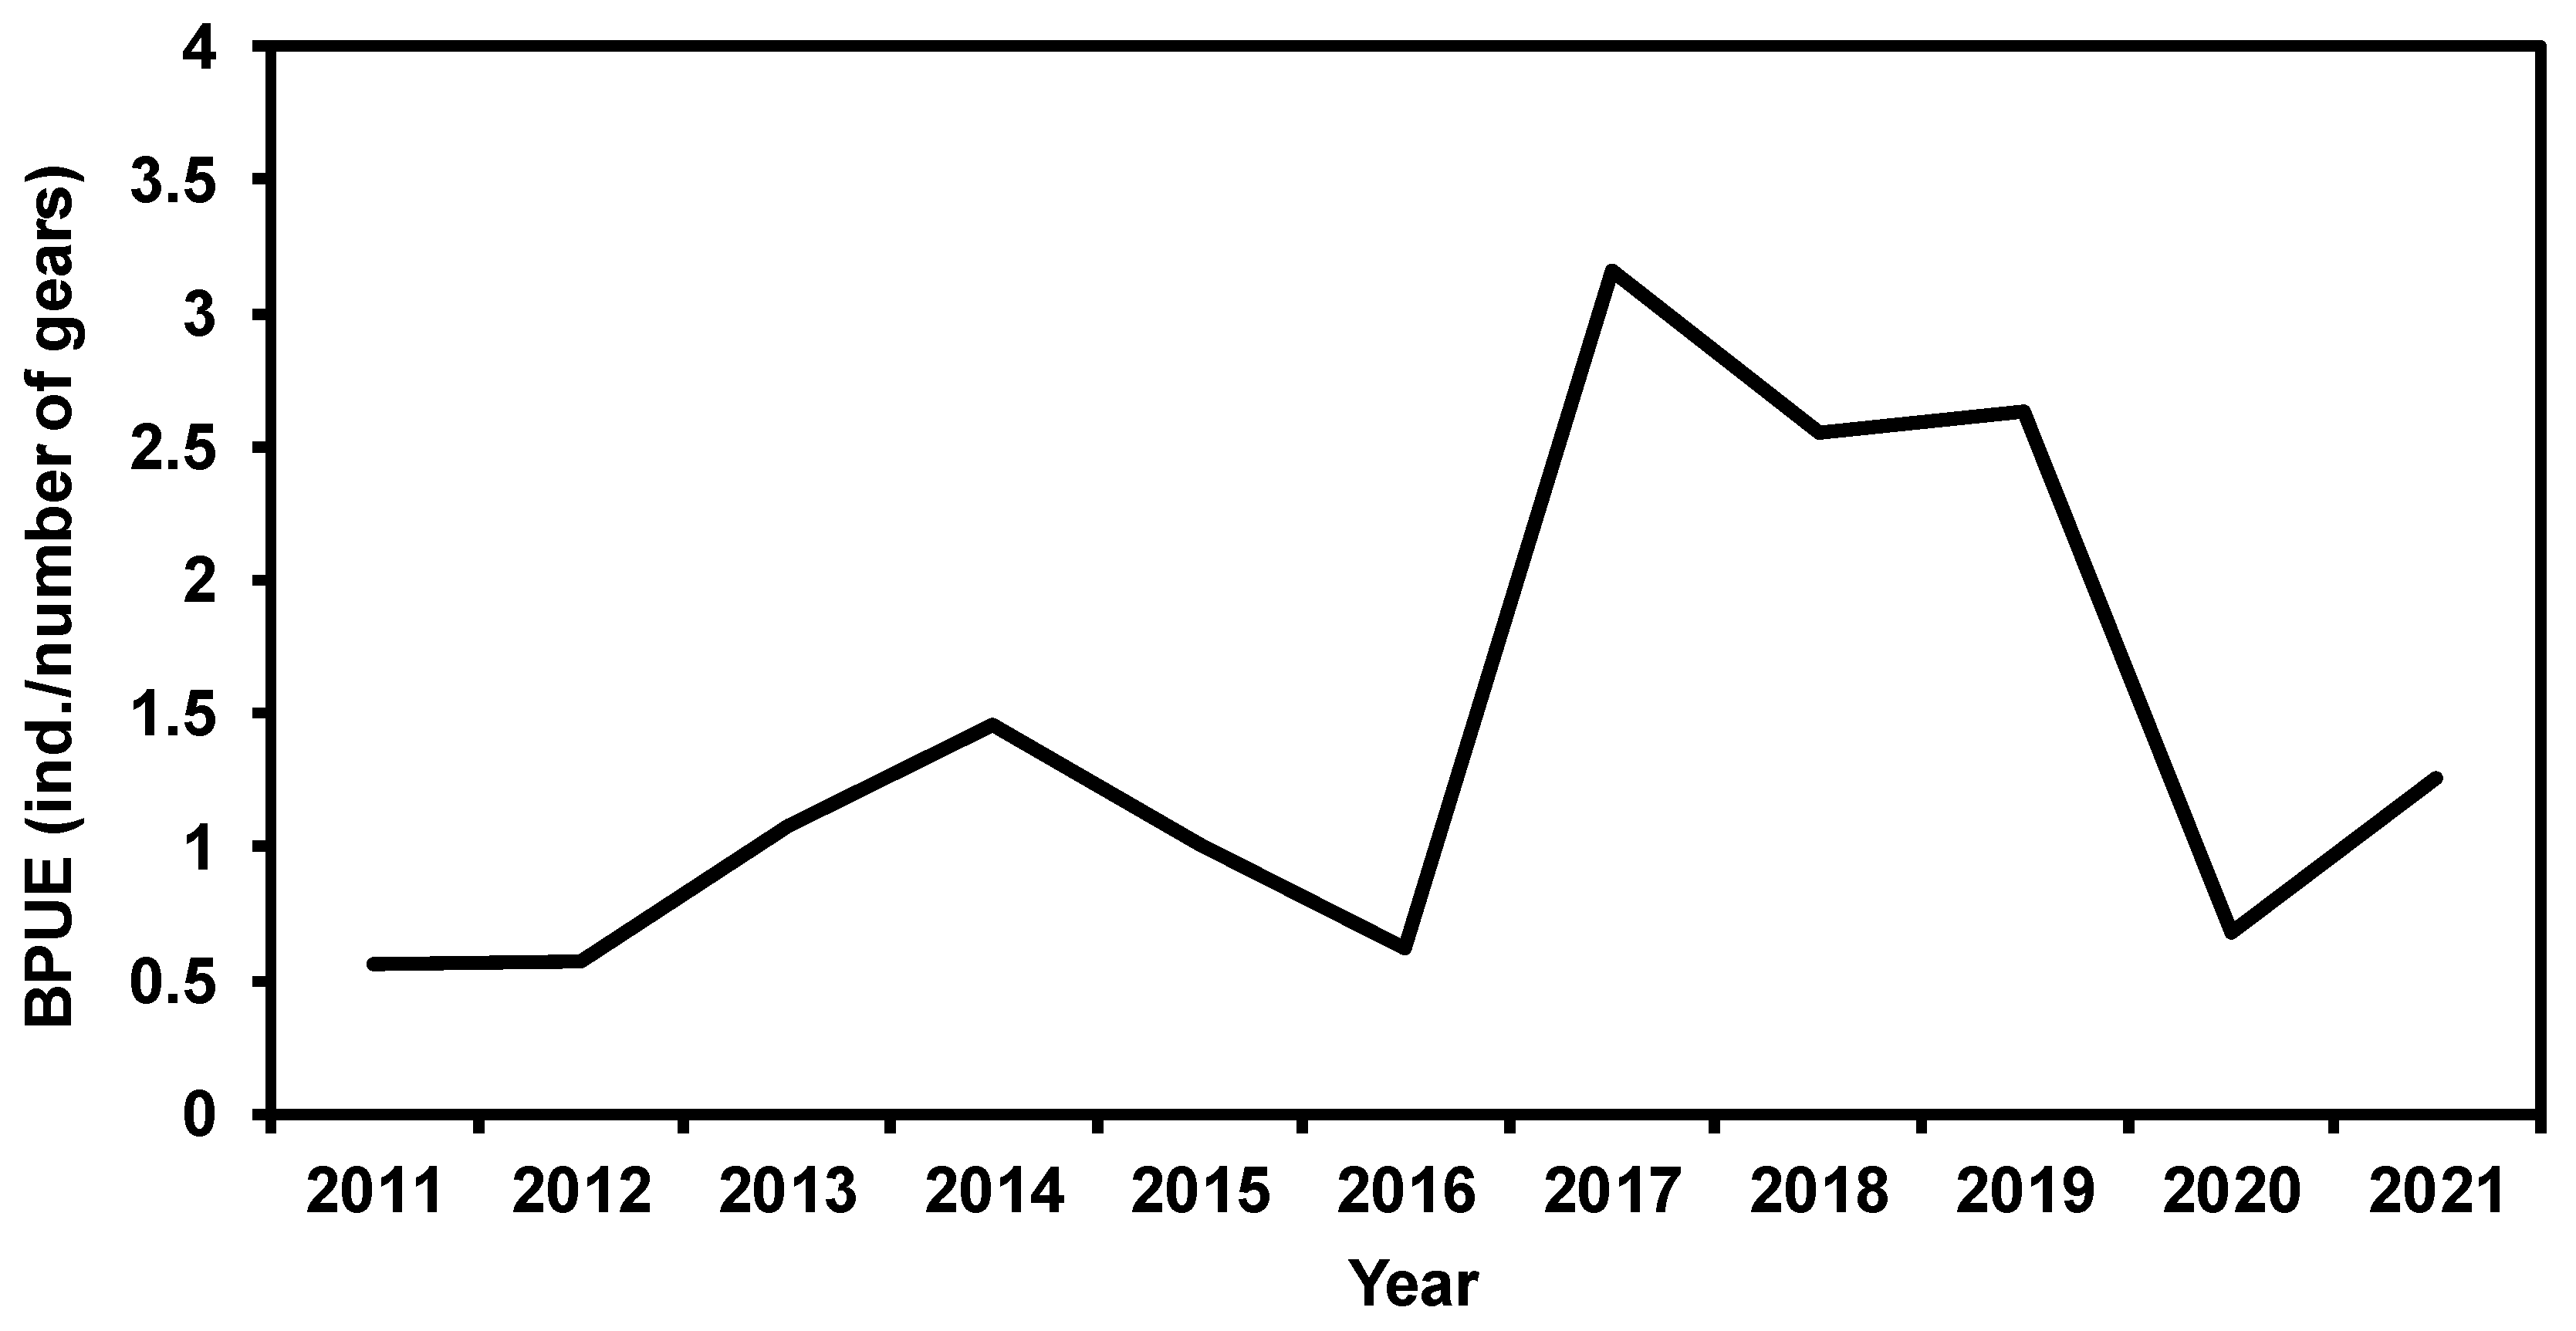
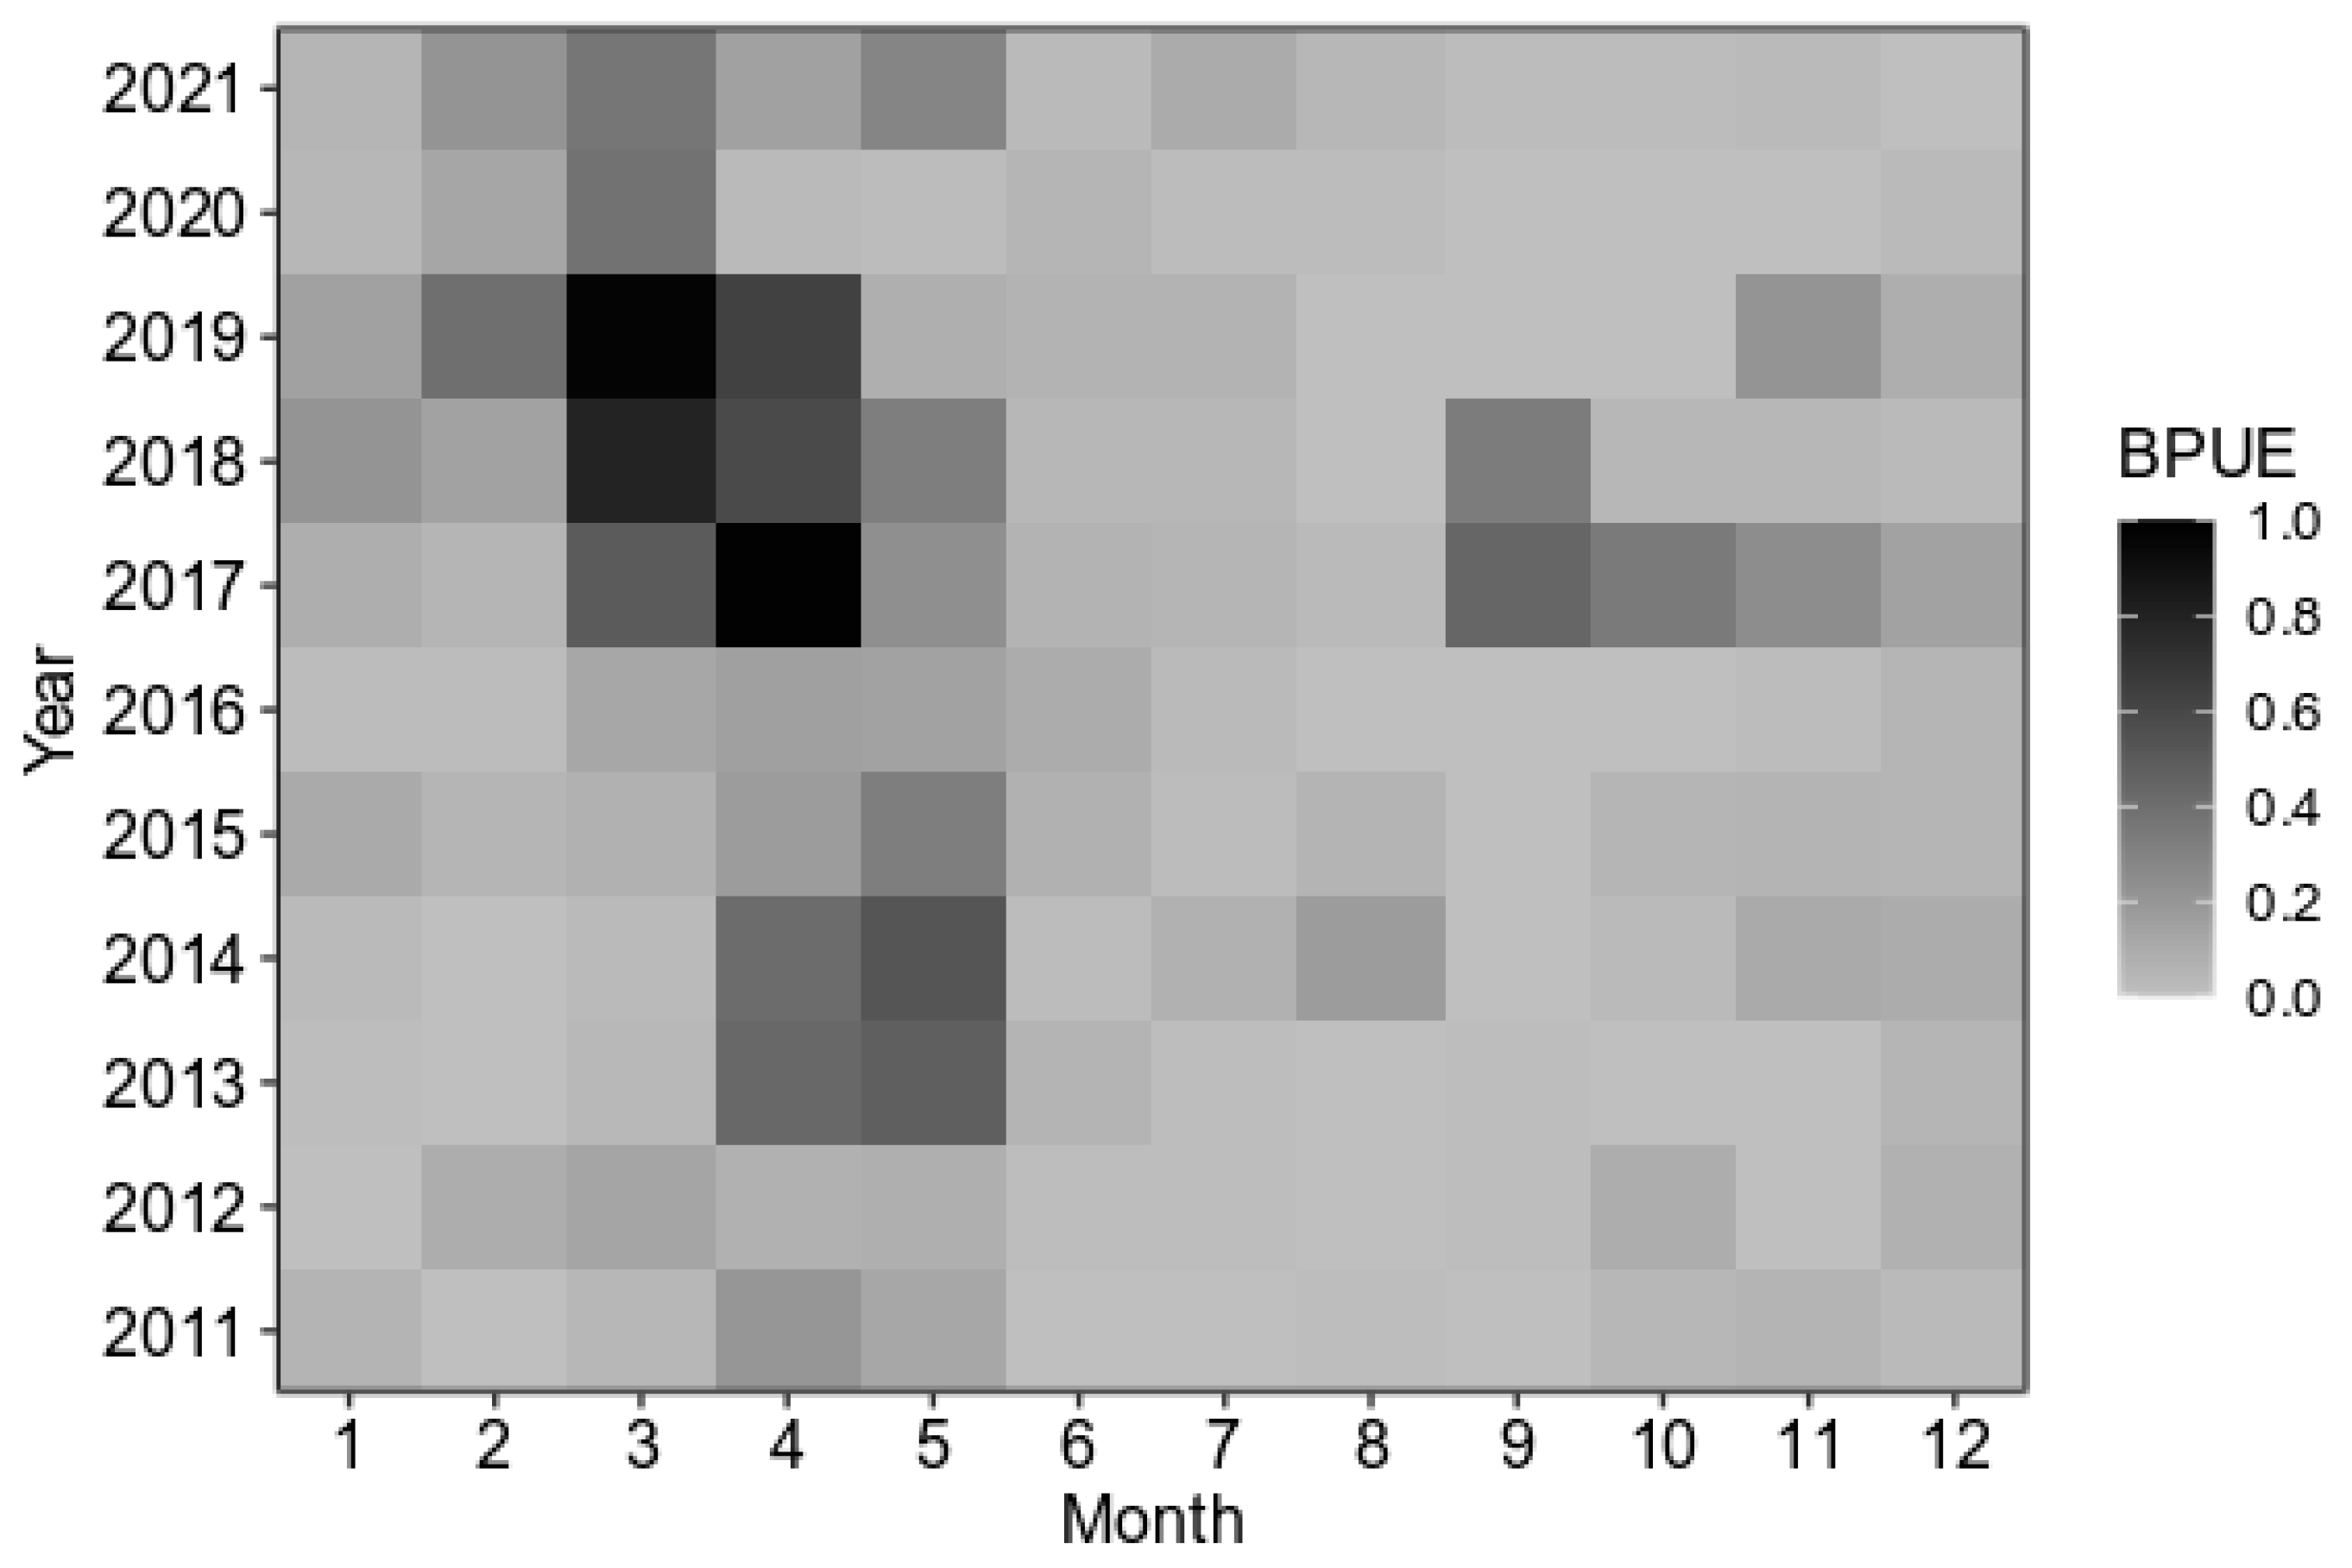
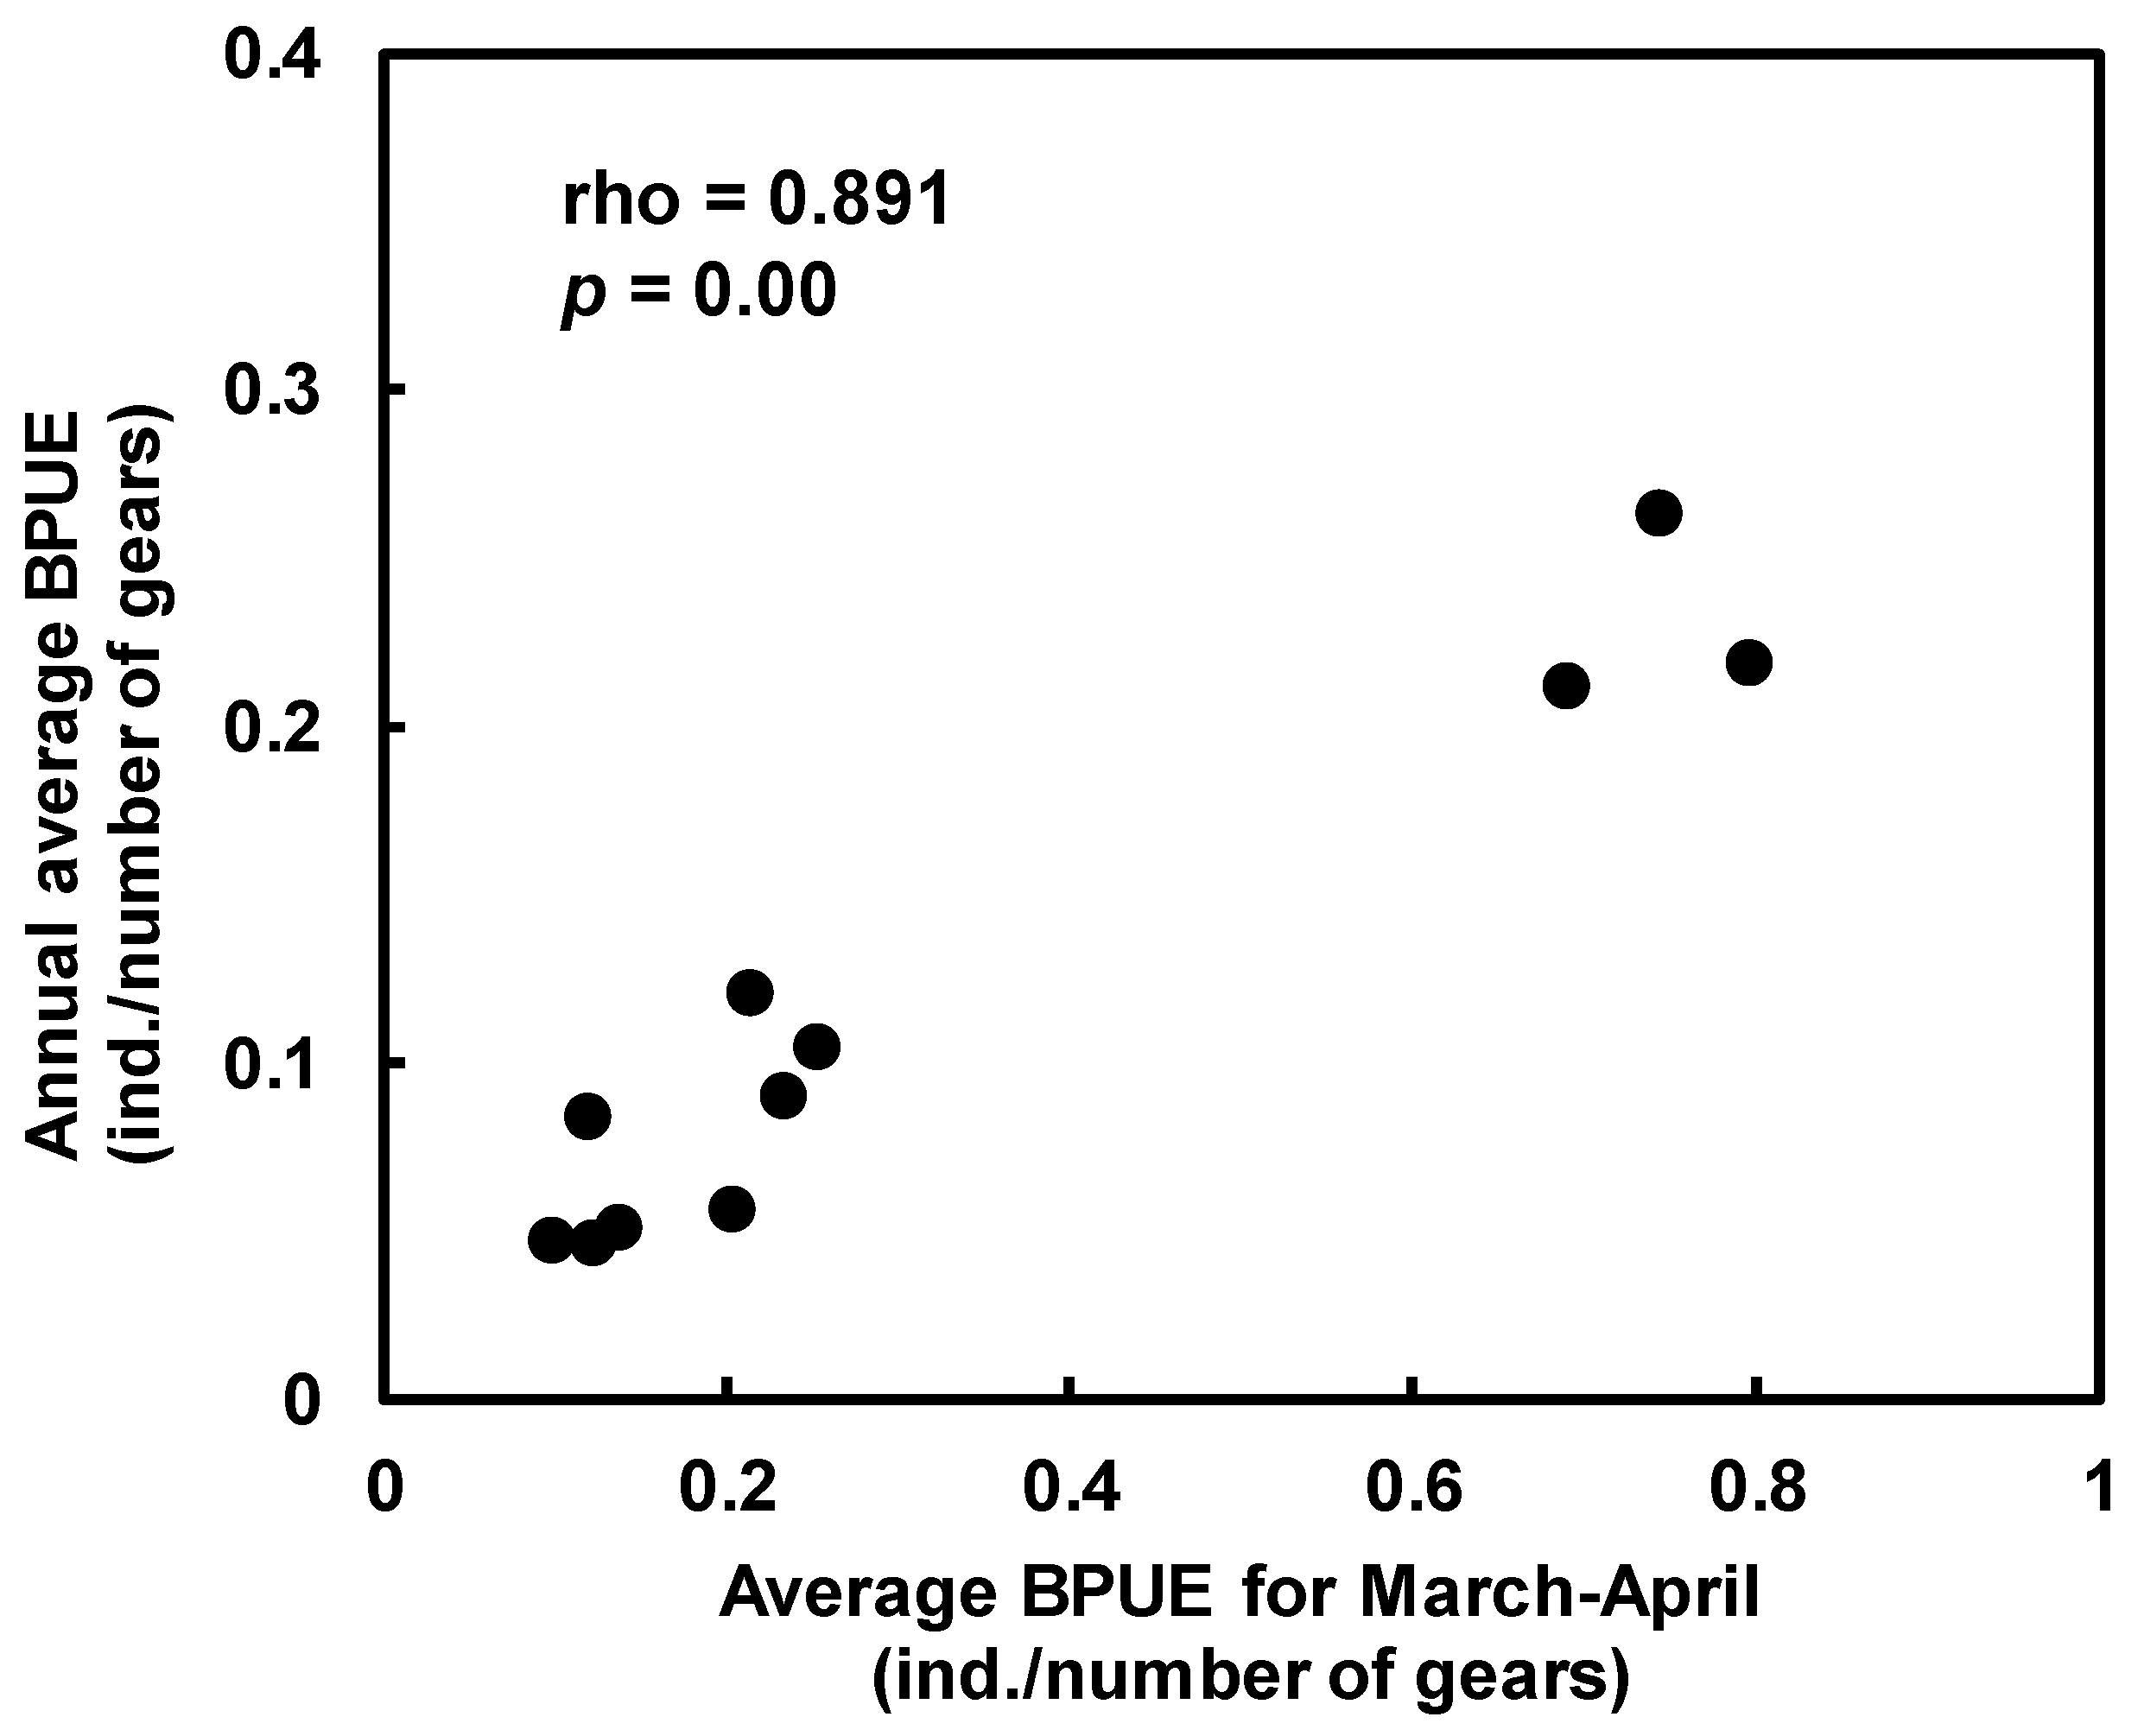
The annual changes in the BPUE (individuals/number of gears) of the common dolphin from 2011 to 2021 in the study area is illustrated in Figure 2. Overall, the BPUE increased slightly over the study period. However, the BPUE remained relatively low until 2016. Subsequently, the BPUE value rapidly increased, but it dropped dramatically in 2020. The non-normality of the BPUE from 2011 to 2021 was confirmed by the Shapiro–Wilk test (W = 0.748, p < 0.05). The monthly changes in the BPUE from 2011 to 2021 are shown in Figure 3 as a heatmap. In general, the BPUE was largest and lowest during spring and summer, respectively. In particular, in 2017–2019, which showed the highest BPUE over the study period, the BPUE from March to April substantially increased, and that in September slightly increased. The averaged BPUE from March to April was significantly and positively correlated with the annual averaged BPUE with a high correlation coefficient (Spearman rank correlation coefficient [rho = 0.891, p < 0.05], Figure 4).

3.2. Statistical Habitat Modeling

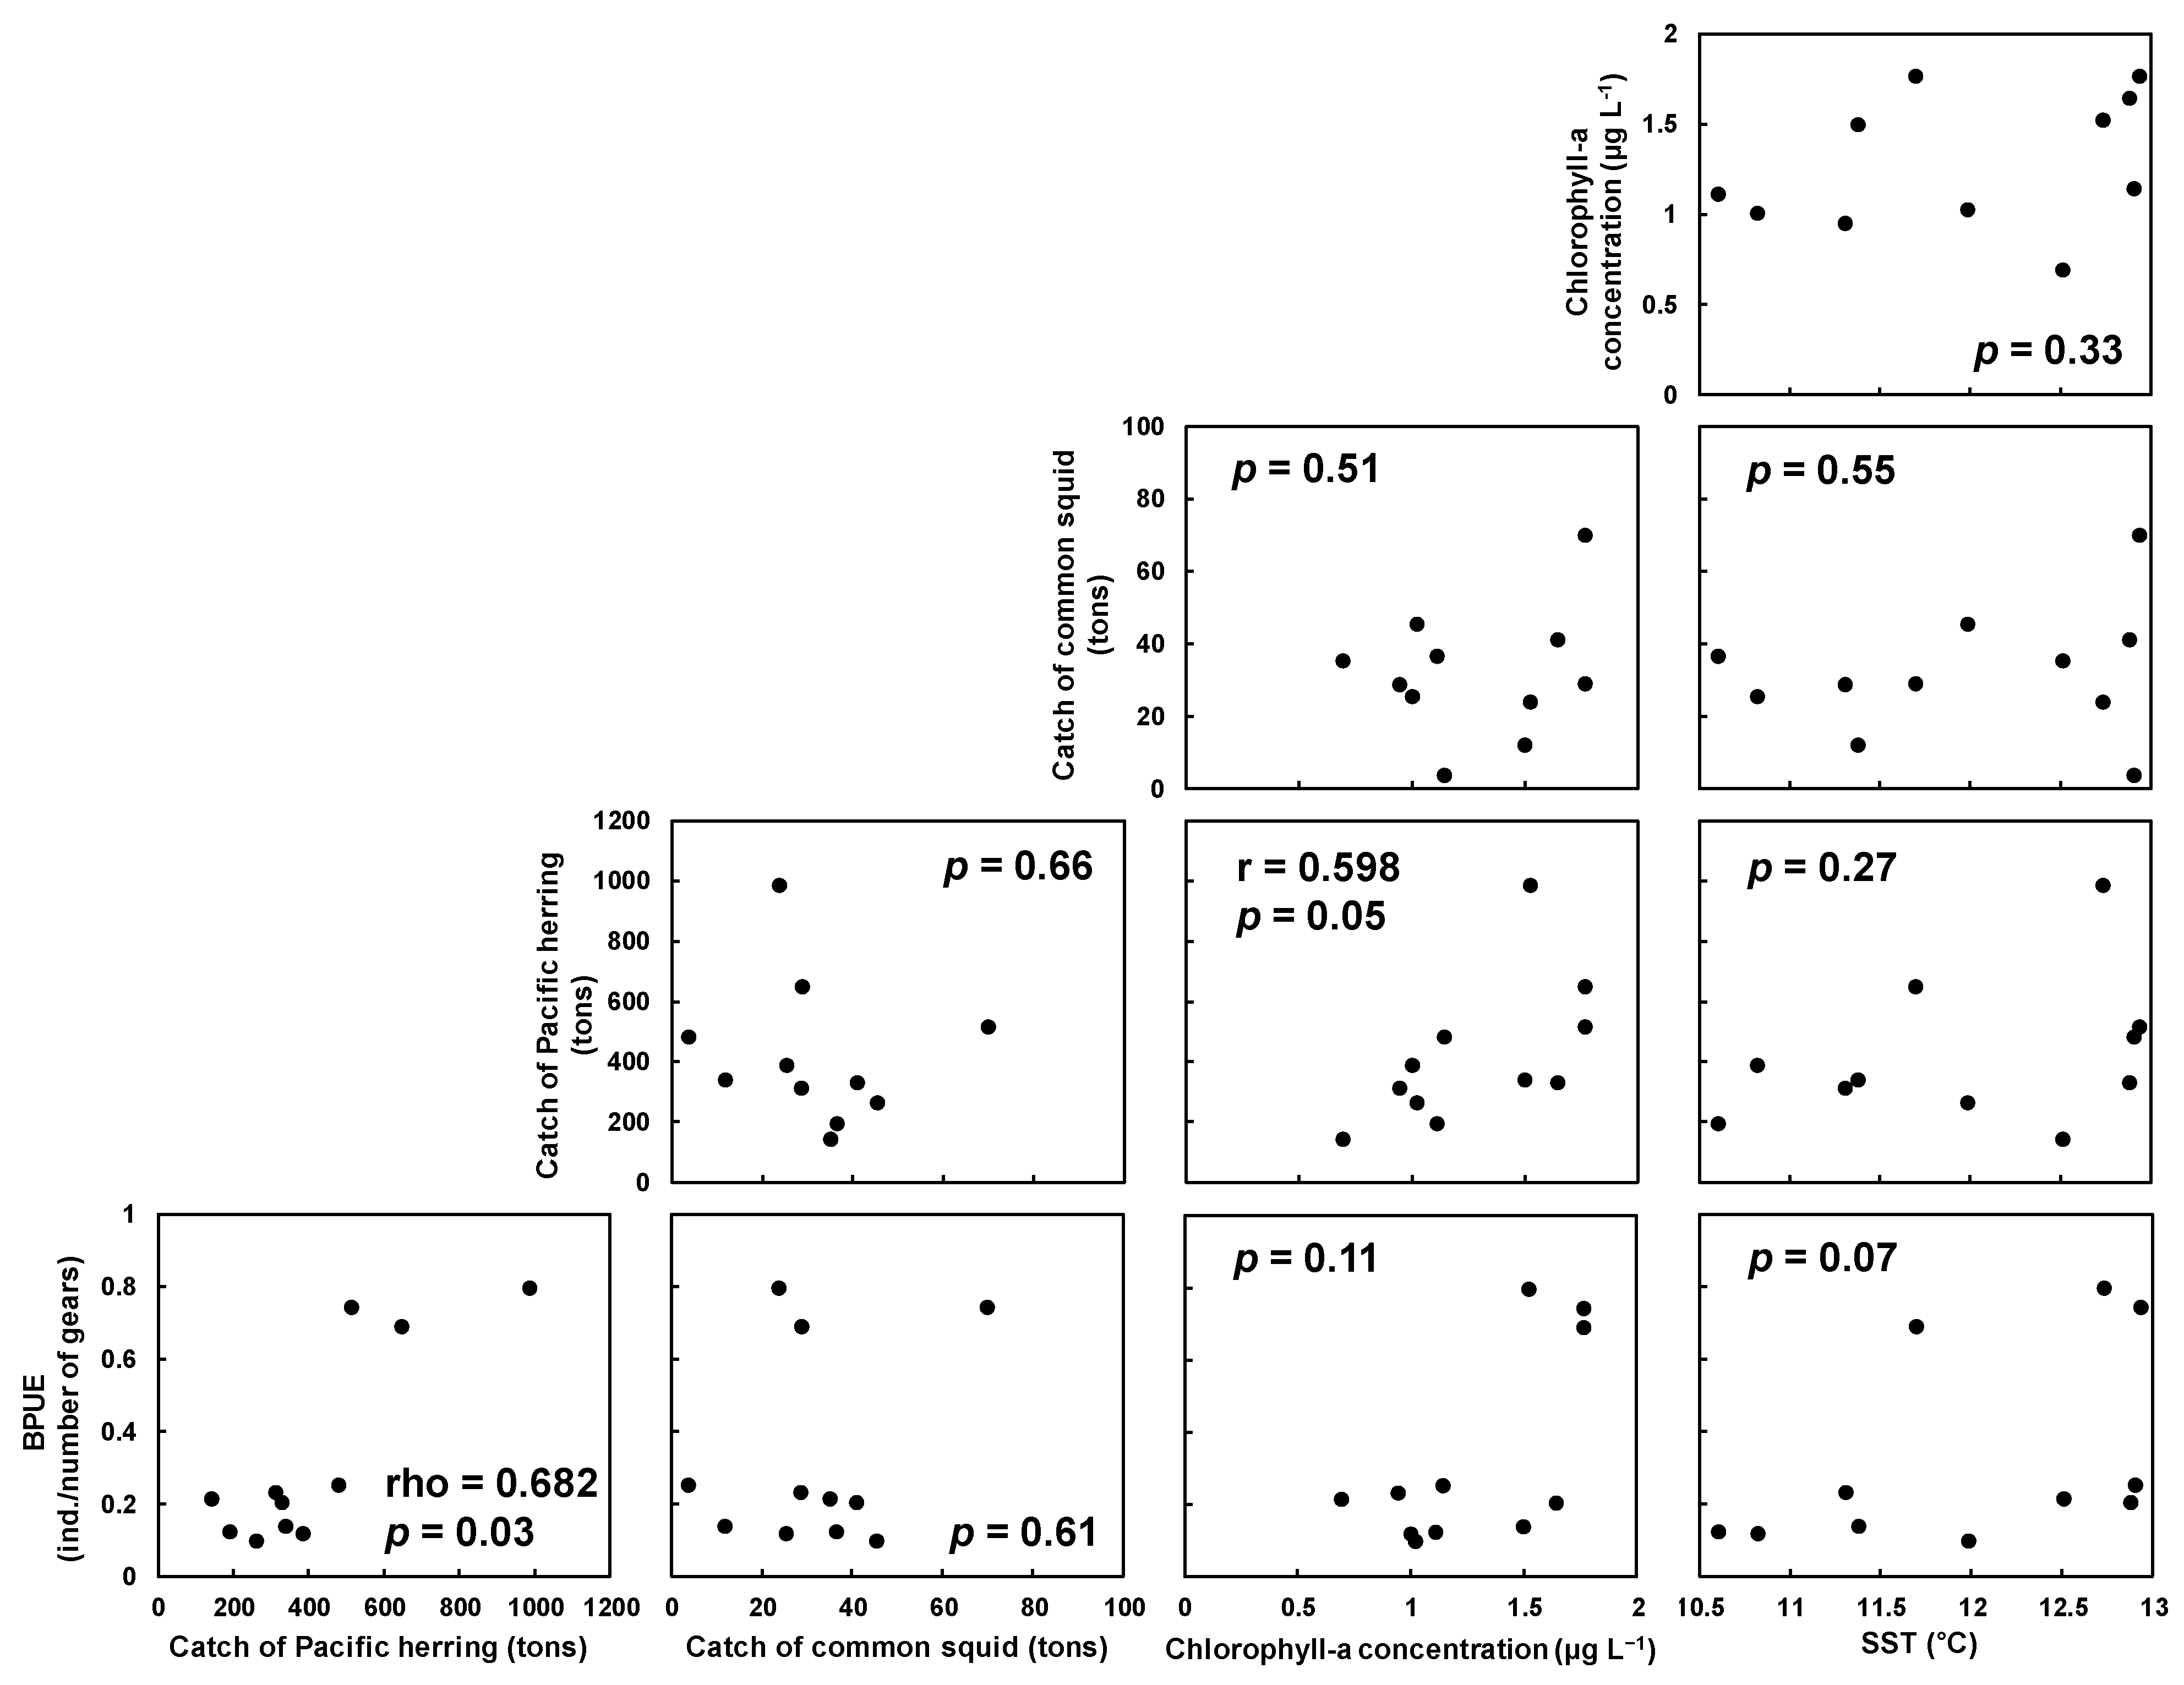
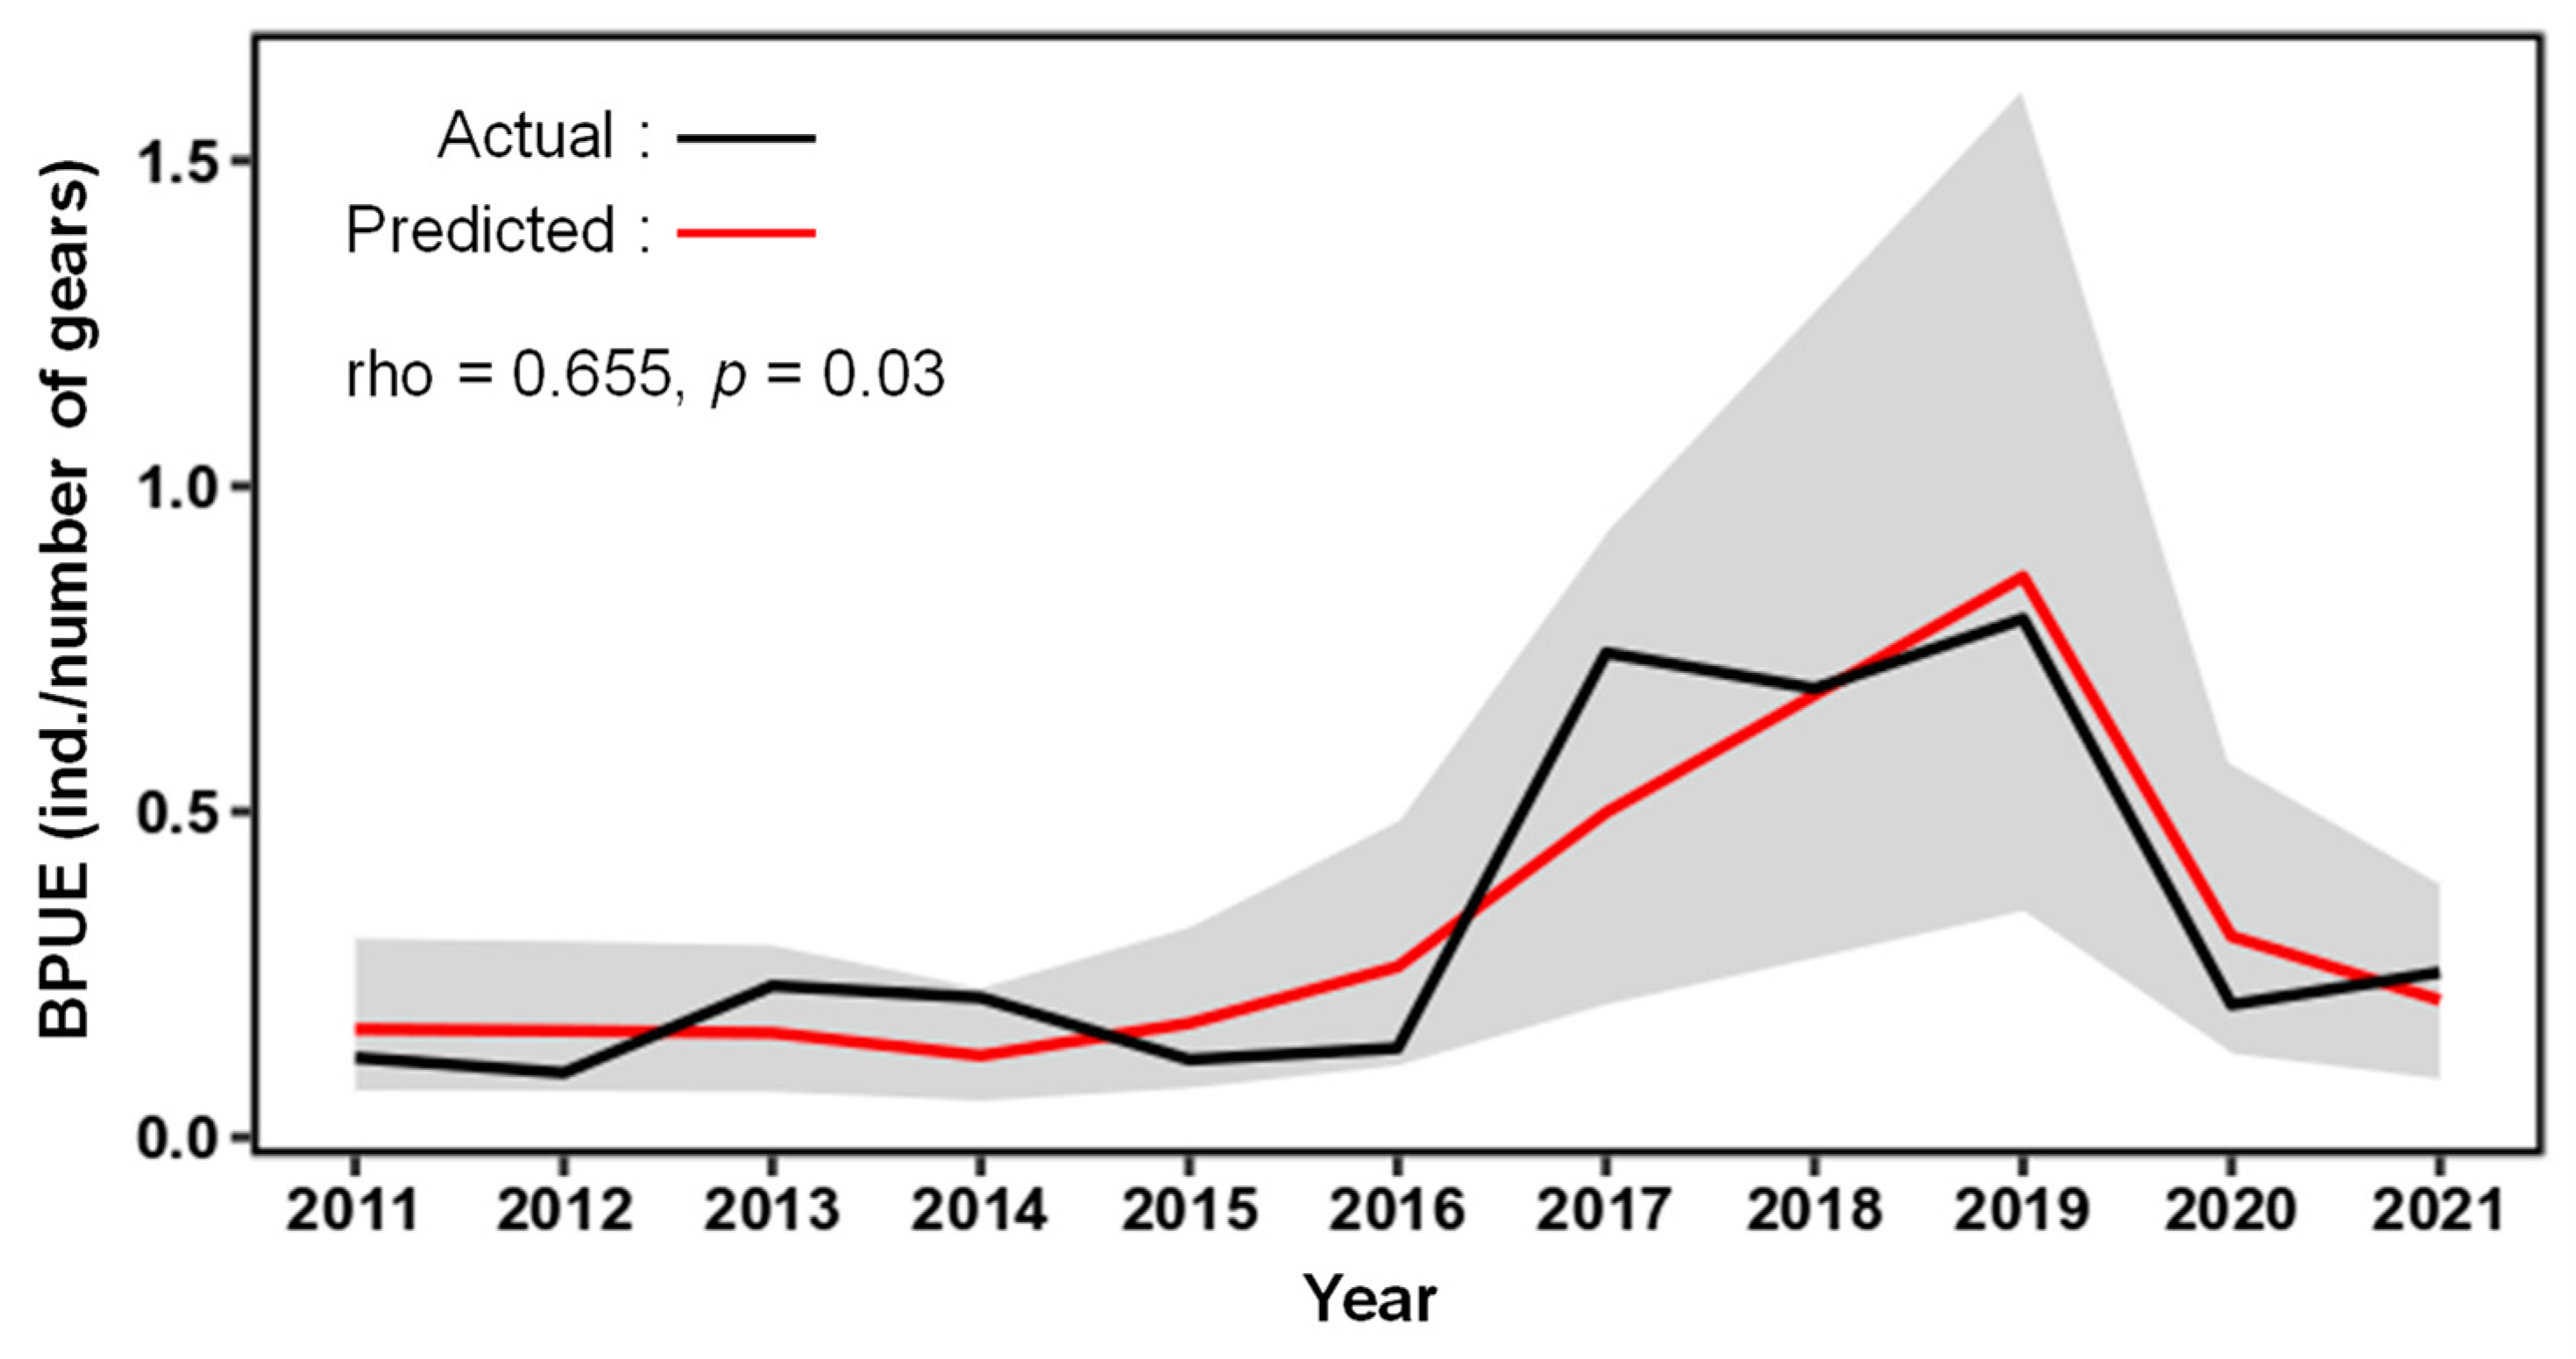
The correlations among individual variables averaged for March–April from 2011 to 2021 are shown in Figure 5. The result of the Shapiro–Wilk test shows that the normality for all explanatory variables was verified on the basis of a p-value greater than 0.05. The BPUE had a significant correlation only with Pacific herring catch (rho = 0.682, p < 0.05). Furthermore, among the explanatory variables, the Pacific herring catch was only slightly correlated with chlorophyll-a concentration (r = 0.598, p = 0.05). Table 1 shows the estimated results modeled by the gamma GLM. Within the gamma GLM, utilizing two variables selected through the stepwise BIC procedure, the Pacific herring catch and chlorophyll-a concentration were retained as significant (p < 0.05) variables (Table 2). The values of GVIF for each of the two explanatory variables in the final GLM were smaller than 2. In addition, the actual BPUE exhibited a significant correlation with that predicted by the gamma GLM utilizing two variables (rho = 0.655, p < 0.05, Figure 6).

4. Discussion

Understanding the temporal changes in the abundance of cetaceans living in highly dynamic regions in space and time and the environmental factors influencing these changes is necessary to evaluate their habitat use. Environmental factors influencing temporal changes in the relative density of common dolphins around core areas of their habitat use in Korean waters were examined for the first time in the present study. We found that the relative density of common dolphins indexed by the BPUE showed large annual changes because of its rapid increase in 2017–2019 in the study area over the past decade (Figure 2). Furthermore, the annual relative density significantly changed in accordance with the density during March–May (Figure 4). Such rapid temporal changes in the local density of common dolphins can result in a skewed distribution of the species. Anganuzzi and Buckland [48] described large annual changes in the relative abundance of spotted dolphin, common dolphin, and spinner dolphin in the eastern tropical Pacific from 1975 to 1987. According to Campbell et al. [49], the maximum annual density values of Pacific white-side dolphin and Dall’s porpoise off southern California from 2004 to 2013 were tenfold and fivefold, respectively, which were higher than their minimum values. In addition, Brough et al. [13] reported that the relative density of Hector’s dolphins at all hotspots of Banks Peninsula, New Zealand, substantially increased during summer, indicating large seasonal variations. Based on the results of the present study, the large temporal changes in the relative abundance of small cetaceans could be characterized as an important ecological feature of their habitat use.
The BPUE of common dolphins around their main hotspot during March–April was significantly (p < 0.05) related only to Pacific herring catch over the past decade. The Pacific herring catch might exhibit an increasing trend as the chlorophyll-a concentration increases along the food chain, because the species primarily feeds on zooplankton such as euphausiids and copepods in the coastal regions of Korean waters [50,51]. The stepwise BIC procedure for the gamma GLM yielded significant retention of two variables, Pacific herring catch and chlorophyll-a concentration, indicating that the annual changes in the relative density of the common dolphin around their main hotspot in the early spring were significantly affected by the changes in their prey abundance and primary production. Therefore, the rapid increase in the relative density of common dolphins in 2017–2019 could be due to the increase in their prey abundance, which might be due to the higher primary productivity. Yoo and Park [52] reported that the waters around the study area constituted the most productive region, coupled with frequent coastal upwelling in the ES. Joo et al. [53] reported that the primary productivity in the southern area, including the area of the present study, was highest in spring. Primary production is a biological factor that drives the habitat use of cetaceans. In general, primary production in marine ecosystems forms an essential part of food webs [54]. Primary production serves as the foundation of zooplankton and pelagic fish production, which can lead to feeding aggregation of cetaceans, resulting in the formation of their coastal foraging hotspots [55,56]. Moura et al. [57] showed that a patchy distribution of common dolphins along the Portuguese coastline was associated with chlorophyll concentration, which can reflect ecological specialization of pelagic schooling fish. La Manna et al. [31] noted that bottlenose dolphins in the southern Mediterranean Sea prefer shallower feeding grounds, which often host rich food webs. Meyer-Gutbrod et al. [30] described decadal variations in the seasonal patterns of right whale habitat use induced by seasonal variations in its prey abundance (zooplankton) in its Southeast US calving grounds. In this study, we produced available evidence supporting the hypothesis that ecosystem productivity altered by nutrient conditions could be considered as a key biological process enhancing habitat use of cetaceans in highly productive seasons and regions [11].
In Korean waters, the main fishing grounds for Pacific herring are located in the southern area of the ES, and the species is caught to some extent throughout the year [58]. By contrast, commercial fishing for common squid in the ES begins in earnest in July [59], and the catch level of the species is very low during the spring [60]. In the ES, common squid has two seasonal spawning groups, from May to November [61], and the species migrates from its spawning to feeding grounds during late spring–autumn [60,62]. Therefore, few common squids may inhabit the southern area of the ES during March–April. This finding may determine an ecological feature of common squid in Korean waters. Given the results from the stomach content analysis of common dolphins sampled in the ES from February to September, as performed by a previous study [5], common squid has been found to be a major prey. However, considering that very few common squids are found around the main hotspot of common dolphins in spring, the species may function as a main prey of common dolphin during summer–winter. This feature could result in a nonsignificant relationship between BPUE and common squid catch during March–April, based on the results of our statistical analysis (Figure 1; Table 1).
The phenomenon of increases in sea temperature, as a climate-related alteration to ocean conditions, has affected latitudinal shifts toward suitable habitats for cetaceans and changes in the timing of their migration [23,63]. In this study, the variability of SST averaged during March–April around the main hotspot of common dolphins was low over the past decade (Figure 5). Therefore, considering the absence of remarkable changes in SST during the study period, sea temperature was not significantly correlated with BPUE (Figure 5), and it could not be selected in the stepwise BIC procedure (Table 1). Dolphin abundance may be affected by the distribution of their prey, which is associated with sea temperature [64]. Yoo and Kim [58] reported that the annual catch of Pacific herring in the southern area of the ES had a significantly linear correlation with SST over the past 50 years, although a result of correlation analysis in the present study indicates that no significant linear relationship existed between the two variables around the main common dolphin hotspot over the past decade (Figure 5). In addition, cetaceans have a preferred sea temperature range [65]. The optimal sea temperature ranges in which cetaceans are predominantly observed in visual line-transect surveys have been reported in previous studies [66,67]. Such a temperature range may be related to seasonal differences in the presence of cetaceans [68]. However, the results of this study remain insufficient to clarify changes in the habitat usage of the common dolphin induced by thermal changes in Korean waters. Therefore, long-term and seasonal relationships among the relative abundance of common dolphins, their prey availability, and sea temperature in the ES should be investigated in future studies.
We used only SST as the physical factor influencing the relative abundance of common dolphins around their main hotspot. However, Brough et al. [11] reported that various environmental variables (tidal current velocity, sand, etc.) were correlated with the relative abundance of Hector’s dolphin at Banks Peninsula on the east coast of New Zealand’s South Island. However, the physical environmental factors influencing the changes in the abundance of common dolphins, which are associated with the drivers of habitat use, remain unclear. Furthermore, Yoo et al. [4] claimed that shallow waters in the coastal region, which consists of ria coasts and broad tidelands, are likely not a suitable habitat for common dolphins.
On the contrary, the annual changes in BPUE had a strong correlation with its changes from March to April over the past decade (Figure 4). Therefore, if the relative abundance of common dolphins during March–April can be predicted from predictive models, then the annual relative abundance can be predicted from the predicted relative abundance using a regression equation. In general, predictive models are used to develop hypotheses about ecological processes that can reduce unexplained variation in population trends and abundance estimation, providing evidence required for precautionary conservation and management of endangered cetacean populations [44]. Therefore, developing a predictive system for assessing the relative abundance of cetaceans in their habitats is an important future task.
In Korean waters, common dolphin is the second most bycaught species [8]. The bycatch of common dolphins in their habitats must be mitigated to maintain the species’ population, because there is a possibility of a decline in cetacean population resulting from fishery mortality [69]. The present study found a rapid increase in the relative density of common dolphins, one which could be induced by changes in the environmental factors around their main hotspot. However, implementing a national cetacean bycatch reduction policy remains difficult in many countries because, realistically, many fishermen require a high financial reward and aid from the government to compensate for catch losses [37]. Hence, flexible conservation strategies such as temporary restrictions on fishing activities of the bycatch fisheries associated with common dolphins based on the evaluation of their spatial and temporal habitat use in Korean waters could be considered as a feasible conservation policy to preserve the species’ population.
In conclusion, we examined environmental factors influencing annual changes in the relative density of common dolphins, indexed by the BPUE, around their main hotspot in Korean waters over the last decade. The annual changes in BPUE were due to changes during March-April. The performance of the gamma GLM with the lowest BIC in the present study indicated that the annual changes in the BPUE during March-April were significantly related only to the Pacific herring catch and chlorophyll-a concentration over the study period, suggesting that ecosystem productivity altered by nutrient conditions could be a key biological process that influences temporal changes in the habitat use of cetaceans in highly productive seasons and regions.

Author Contributions

Conceptualization, writing—original draft preparation, review and editing, and formal analysis, J.-T.Y.; investigation, M.K.L. and H.J. All authors have read and agreed to the published version of the manuscript.

Funding

This study was funded by a grant from the National Institute of Fisheries Science, Korea (R2024004).

Institutional Review Board Statement

Not applicable.

Informed Consent Statement

Not applicable.

Data Availability Statement

Not applicable.

Conflicts of Interest

The authors declare no conflict of interest.

References

  1. Jefferson, T.A.; Webber, M.A.; Pitman, R.L. Marine Mammals of the World: A Comprehensive Guide to Their Identification; Academic Press: San Diego, CA, USA, 2015; pp. 268–272. [Google Scholar]
  2. Perrin, W.F. Common dolphins—Delphinus delphis and D. Capensis. In Encyclopedia of Marine Mammals; Perrin, W.F., Würsig, B., Thewissen, J.G.M., Eds.; Academic Press: San Diego, CA, USA, 2009; pp. 255–259. [Google Scholar]
  3. Ferrero, R.C.; Walker, W.A. Growth and reproduction of the common dolphin, Delphinus delphis Linnaeus, in the offshore waters of the North Pacific Ocean. Fish. Bull. 1995, 93, 483–494. [Google Scholar]
  4. Yoo, J.T.; Park, K.J.; Lee, K.; Lee, D. A first study on distribution characteristics of common dolphin in Korean waters: A study using data collected during the past 20 years. J. Mar. Sci. Eng. 2023, 11, 1635. [Google Scholar] [CrossRef]
  5. Ahn, S.; Kim, H.W.; Kim, S.; Lee, Y.R.; Park, K.J.; Kim, D.N.; An, D.H. Diet of long-beaked common dolphin (Delphinus capensis) in the East Sea, Korea. Anim. Cells Syst. 2014, 18, 340–350. [Google Scholar] [CrossRef]
  6. Kim, D.N.; Sohn, H.; An, Y.R.; Park, K.J.; Kim, H.W.; Ahn, S.E.; An, D.H. Status of the cetacean bycatch near Korean waters. Korean J. Fish. Aquat. Sci. 2013, 46, 892–900. [Google Scholar] [CrossRef]
  7. Lee, J.H.; Kim, E.H.; Lee, K.; Park, K.J.; An, Y.R.; Kim, H.W. Occurrence and spatial distribution of marine mammals by sighting surveys in Korean waters during 2011-2020. Korean J. Fish. Aquat. Sci. 2022, 55, 938–945. [Google Scholar] [CrossRef]
  8. Lee, S.; Choi, S.; Kim, J.H.; Kim, H.W.; Sohn, H. Characteristics of the cetacean bycatch in Korean coastal waters from 2011 to 2017. Korean J. Fish. Aquat. Sci. 2018, 51, 704–713. [Google Scholar] [CrossRef]
  9. Harcourt, A.H. Coincidence and mismatch of biodiversity hotspots: A global survey for the order, primates. Biol. Conserv. 2000, 93, 163–175. [Google Scholar] [CrossRef]
  10. Nelson, T.A.; Boots, B. Detecting spatial hot spots in landscape ecology. Ecography 2008, 31, 556–566. [Google Scholar] [CrossRef]
  11. Brough, T.E.; Rayment, W.J.; Slooten, L.; Dawson, S. Prey and habitat characteristic contribute to hotspots of distribution for an endangered coastal dolphin. Front. Mar. Sci. 2023, 10, 1204943. [Google Scholar] [CrossRef]
  12. Ceballos, G.; Ehrlich, P.R. Global mammal distributions, biodiversity hotspots, and conservation. Proc. Natl. Acad. Sci. USA 2006, 103, 19374–19379. [Google Scholar] [CrossRef]
  13. Brough, T.; Rayment, W.; Slooten, E.; Dawson, S. Fine scale distribution for a population of New Zealand’s only endemic dolphin (Cepbalorbyncbus bectori) shows long-term stability of coastal hotspots. Mar. Mamm. Sci. 2018, 35, 1–24. [Google Scholar] [CrossRef]
  14. Hamilton, C.D.; Lydersen, C.; Aars, J.; Biuw, M.; Boltunov, A.N.; Born, E.W.; Dietz, R.; Folkow, L.P.; Glazov, D.M.; Haug, T.; et al. Marine mammal hotspots in the Greenland and Barents Seas. Mar. Ecol. Prog. Ser. 2021, 659, 3–28. [Google Scholar] [CrossRef]
  15. Santora, J.A.; Veit, R.R. Spatio-temporal persistence of top predator hotspots near the Antarctic Peninsula. Mar. Ecol. Prog. Ser. 2013, 487, 287–304. [Google Scholar] [CrossRef]
  16. Davidson, A.D.; Boyer, A.G.; Kim, H.; Pompa-Mansilla, S.; Hamilton, M.J.; Costa, D.P.; Ceballos, G.; Brown, J.H. Drivers and hotspots of extinction risk in marine mammals. Proc. Natl. Acad. Sci. USA 2012, 109, 3395–3400. [Google Scholar] [CrossRef] [PubMed]
  17. Scott, B.E.; Sharples, J.; Ross, O.N.; Wang, J.; Pierce, G.J.; Camphuysen, C.J. Sub-surface hotspots in shallow seas: Fine-scale limited locations of top predator foraging habitat indicated by tidal mixing and sub-surface chlorophyll. Mar. Ecol. Prog. Ser. 2010, 408, 207–226. [Google Scholar] [CrossRef]
  18. Bennington, S.; Rayment, W.; Currey, R.; Oldridge, L.; Henderson, S.; Guerra, M.; Brough, T.; Johnston, D.; Corne, C.; Johnson, D.; et al. Long-term stability in core habitat of an endangered population of bottlenose dolphins (Tursiops truncatus): Implications for spatial management. Aquat. Conserv. Mar. Freshw. Ecosyst. 2020, 31, 665–676. [Google Scholar] [CrossRef]
  19. Avila, I.C.; Kaschner, K.; Dormann, C.F. Current global risks to marine mammals: Taking stock of the threats. Biol. Conserv. 2018, 211, 44–58. [Google Scholar] [CrossRef]
  20. Brownell, R.L., Jr.; Reeves, R.R.; Read, A.J.; Smith, B.D.; Thomas, P.O.; Ralls, K.; Amano, M.; Berggren, P.; Chit, A.M.; Collins, T.; et al. Bycatch in gillnet fisheries threatens critically endangered small cetaceans and other aquatic megafauna. Endanger. Species Res. 2019, 40, 285–296. [Google Scholar] [CrossRef]
  21. Cañadas, A.; Vázquez, J.A. Common dolphins in the Alboran Sea: Facing a reduction in their suitable habitat due to an increase in sea surface temperature. Deep-Sea Res. II 2017, 141, 306–318. [Google Scholar] [CrossRef]
  22. Cotton Rockwood, R.; Elliott, M.L.; Saenz, B.; Nur, N.; Jahncke, J. Modeling predator and prey hotspots: Management implications of baleen whale co-occurrence with krill in Central California. PLoS ONE 2020, 15, e0235603. [Google Scholar] [CrossRef]
  23. Weelden, C.V.; Towers, J.R.; Bosker, T. Impacts of climate change on cetacean distribution, habitat and migration. Clim. Chang. Ecol. 2021, 1, 100009. [Google Scholar] [CrossRef]
  24. Azzellino, A.; Gaspari, S.A.; Airoldi, S.; Lanfredi, C. Biological consequences of global warming: Does sea surface temperature affect cetacean distribution in the western Ligurian Sea? J. Mar. Biol. Assoc. UK 2008, 88, 1145–1152. [Google Scholar] [CrossRef]
  25. Ferrero, R.C.; Hobbs, R.C.; VanBlaricom, G.R. Indications of habitat use patterns among small cetaceans in the central North Pacific based on fisheries observer data. J. Cetacean Res. Manag. 2002, 4, 311–321. [Google Scholar] [CrossRef]
  26. Citta, J.J.; Okkonen, S.R.; Quakenbush, L.T.; Maslowski, W.; Osinski, R.; George, J.C.; Small, R.J.; Brower Jr, H.; Heide-Jørgensen, M.P.; Harwood, L.A. Oceanographic characteristics associated with autumn movements of bowhead whales in the Chukchi Sea. Deep Sea Res. II 2018, 152, 121–131. [Google Scholar] [CrossRef]
  27. Cox, S.L.; Witt, M.J.; Embling, C.B.; Godley, B.J.; Hosegood, P.J.; Miller, P.I.; Votier, S.C.; Ingram, S.N. Temporal patterns in habitat use by small cetaceans at an oceanographically dynamic marine renewable energy test site in the Celtic Sea. Deep Sea Res. II 2017, 141, 178–190. [Google Scholar] [CrossRef]
  28. Cañadas, A.; Hammond, P.S. Abundance and habitat preferences of the short-beaked common dolphin Delphinus delphis in the southwestern Mediterranean: Implications for conservation. Endanger. Species Res. 2008, 4, 309–331. [Google Scholar] [CrossRef]
  29. Pietroluongo, G.; Cipriano, G.; Ashok, K.; Antichi, S.; Carlier, H.; Miliou, A.; Maglietta, R.; Fanizza, C.; Carlucci, R. Density and abundance of Delphinus delphis in waters south of Samos Island, Greece (Eastern Mediterranean Sea). J. Mar. Sci. Eng. 2020, 8, 218. [Google Scholar] [CrossRef]
  30. Meyer-Gutbrod, E.L.; Davies, K.T.A.; Johnson, C.L.; Plourde, S.; Sorochan, K.A.; Kenney, R.D.; Ramp, C.; Gosselin, J.-F.; Lawson, J.W.; Greene, C.H. Redefining North Atlantic right whale habitat-use patterns under climate change. Limnol. Oceanogr. 2023, 68, S71–S86. [Google Scholar] [CrossRef]
  31. La Manna, G.; Ronchetti, R.; Sarà, G. Predicting common bottlenose dolphin habitat preference to dynamically adapt management measures from a marine spatial planning perspective. Ocean Coast. Manag. 2016, 130, 317–327. [Google Scholar] [CrossRef]
  32. Torres, L.G.; Read, A.J.; Halpin, P. Fine-scale habitat modeling of a top marine predator: Do prey data improve predictive capacity? Ecol. Appl. 2008, 18, 1702–1717. [Google Scholar] [CrossRef]
  33. Raudino, H.C.; Bouchet, P.J.; Douglas, C.; Douglas, R.; Waples, K. Aerial abundance estimates for two sympatric dolphin species at a regional scale using distance sampling and density surface modeling. Front. Ecol. Evol. 2023, 10, 1086686. [Google Scholar] [CrossRef]
  34. Barlow, J. Inferring trackline detection probabilities, g(0), for cetaceans from apparent densities in different survey conditions. Mar. Mammal Sci. 2015, 31, 923–943. [Google Scholar] [CrossRef]
  35. Sahri, A.; Mustika, P.L.K.; Purwanto, P.; Murk, A.J.; Scheidat, M. Using cost-effective surveys from platforms of opportunity to assess cetacean occurrence patterns for marine park management in the heart of the coral triangle. Front. Mar. Sci. 2020, 7, 569936. [Google Scholar] [CrossRef]
  36. Thomas, L.; Williams, R.; Sandilands, D. Designing line transect surveys for complex survey regions. J. Cetacean Res. Manag. 2007, 9, 1–13. [Google Scholar] [CrossRef]
  37. Yoo, J.T.; Park, K.J. Can the annual bycatch per unit effort of common dolphins (Delphinus delphis) be used to index the species’ relative abundance in the East Sea of Korea? Mar. Mam. Sci. 2023, 1–10. [Google Scholar] [CrossRef]
  38. Sokal, R.R.; Rohlf, F.J. Biometry: The Principles and Practice of Statistics in Biological Research; W.H. Freeman and Company: New York, NY, USA, 1995; pp. 593–608. [Google Scholar]
  39. Mishra, P.; Pandey, C.M.; Singh, U.; Gupta, A.; Sahu, C.; Keshri, A. Descriptive statistics and normality tests for statistical data. Ann. Card. Anaesth. 2019, 22, 67–72. [Google Scholar] [CrossRef] [PubMed]
  40. Harrison, E.; Pius, R. R for Health Data Science; Chapman and Hall/CRC Press: New York, NY, USA, 2020; pp. 213–251. [Google Scholar] [CrossRef]
  41. Ingman, K.; Hines, E.; Mazzini, P.L.F.; Cotton Rockwood, R.; Nur, N.; Jahncke, J. Modeling changes in baleen whale seasonal abundance, timing of migration, and environmental variables to explain the sudden rise in entanglements in California. PLoS ONE 2021, 16, e0248557. [Google Scholar] [CrossRef] [PubMed]
  42. Lechwar, A.; Rasmussen, M.; Basran, C.; Collins, S. Habitat preference and trend in relative abundance of common minke whales (Balaenoptera acutorostrata) in Skjálfandi Bay, Iceland. J. Cetacean Res. Manag. 2023, 24, 29–46. [Google Scholar] [CrossRef]
  43. Anderson, C.J.; Verkuilen, J.; Johnson, T. Applied Generalized Linear Mixed Models: Continuous and Discrete Data; Springer: New York, NY, USA, 2012; pp. 7–59. [Google Scholar]
  44. Redfern, J.V.; Ferguson, M.C.; Becker, E.A.; Hyrenbach, K.D.; Good, C.; Barlow, J.; Kaschner, K.; Baumgartner, M.F.; Forney, K.A.; Ballance, L.T.; et al. Techniques for cetacean-habitat modeling. Mar. Ecol. Prog. Ser. 2006, 310, 271–295. [Google Scholar] [CrossRef]
  45. Gailey, G.; Sychenko, O.; Zykov, M.; Rutenko, A.; Blanchard, A.; Melton, R.H. Western gray whale behavioral response to seismic surveys during their foraging season. Environ. Monit. Assess. 2022, 194, 740. [Google Scholar] [CrossRef] [PubMed]
  46. Ausen, E.; Barber, D.G.; Basu, A.; Ehn, J.; Walker, D.; Dalman, L.; Marcoux, M. River-influenced beluga (Delphinapterus leucas) summer habitat use in western Hudson Bay, Canada. Arct. Sci. 2023, 9, 869–885. [Google Scholar] [CrossRef]
  47. Derville, S.; Torres, L.G.; Garrigue, C. Social segregation of humpback whales in contrasted coastal and oceanic breeding habitats. J. Mammal. 2018, 99, 41–54. [Google Scholar] [CrossRef]
  48. Anganuzzi, A.A.; Buckland, S.T. Reducing bias in trends in dolphin relative abundance, estimated form tuna vessel data. Rep. Int. Whal. Commn. 1989, 39, 323–334. [Google Scholar]
  49. Campbell, G.S.; Thomas, L.; Whitaker, K.; Douglas, A.B.; Calambokidis, J.; Hildebrand, J.A. Inter-annual and seasonal trends in cetacean distribution, density and abundance off southern California. Deep-Sea Res. II 2015, 112, 143–157. [Google Scholar] [CrossRef]
  50. Kim, H.J.; Jeong, J.M.; Park, J.H.; Baeck, G.W. Feeding habits of larval Clupea pallasii in the eastern Jinhae Bay, Korea. J. Korean Soc. Fish. Technol. 2017, 53, 107–113. [Google Scholar] [CrossRef]
  51. Son, S.H.; Jeong, J.M.; Kim, H.J.; Kim, K.R.; Baeck, G.W. Feeding habits of the Pacific herring Clupea pallasii in the coastal waters of the East Sea, Korea. Korean J. Fish. Aquat. Sci. 2022, 55, 224–228. [Google Scholar] [CrossRef]
  52. Yoo, S.; Park, J. Why is the southwest the most productive region of the East Sea/Sea of Japan? J. Mar. syst. 2009, 78, 301–315. [Google Scholar] [CrossRef]
  53. Joo, H.T.; Son, S.H.; Park, J.W.; Kang, J.J.; Jeong, J.Y.; Lee, C.I.; Kang, C.K.; Lee, S.H. Long-term pattern of primary productivity in the East/Japan Sea based on ocean color data derived from MODIS-Aqua. Remote Sens. 2016, 8, 25. [Google Scholar] [CrossRef]
  54. Lim, A.S.; Jeong, H.J. Primary production by phytoplankton in the territorial seas of the Republic of Korea. Algae 2022, 37, 265–279. [Google Scholar] [CrossRef]
  55. Mills, E.L.; Fournier, R.O. Fish production and the marine ecosystems of the Scotian shelf, Eastern Canada. Mar. Biol. 1979, 54, 101–108. [Google Scholar] [CrossRef]
  56. Shannon, L.V.; Field, J.G. Are fish stocks food-limited in the southern Benguela pelagic ecosystem? Mar. Ecol. Prog. Ser. 1985, 22, 7–19. [Google Scholar] [CrossRef]
  57. Moura, A.E.; Sillero, N.; Rodrigues, A. Common dolphin (Delphinus delphis) habitat preferences using data from two platforms of opportunity. Acta Oecologica 2012, 38, 24–32. [Google Scholar] [CrossRef]
  58. Yoo, J.T.; Kim, J.J. Fishing characteristics of Pacific herring Clupea pallasii and relationship between its catch and sea temperature during the past 50 years in Korean waters. Korean J. Fish. Aquat. Sci. 2021, 54, 208–217. [Google Scholar] [CrossRef]
  59. Hwang, K.; Kang, S.; Oh, T.Y.; Choi, K.H.; Lee, D.W. Change in the fishing grounds and the relationship between the abundance of the common squid Todarodes pacificus and the distribution of zooplankton in the East Sea. Korean J. Fish. Aquat. Sci. 2012, 45, 173–179. [Google Scholar] [CrossRef]
  60. Kim, Y.H.; Choi, K.; Lee, C.I. Migration and distribution of the common squid (Todarodes pacificus) in Korean waters. J. Environ. Sci. Int. 2017, 26, 173–181. [Google Scholar] [CrossRef]
  61. Murata, M. Oceanic resources of squids. Mar. Behav. Physiol. 1990, 18, 19–71. [Google Scholar] [CrossRef]
  62. Choi, K.; Lee, C.I.; Hwang, K.; Kim, S.W.; Park, J.H.; Gong, Y. Distribution and migration of Japanese common squid, Todarodes pacificus, in the southwestern part of the East (Japan) Sea. Fish. Res. 2008, 91, 281–290. [Google Scholar] [CrossRef]
  63. Peters, K.J.; Stockin, K.A.; Saltré, F. On the rise: Climate change in New Zealand will cause sperm and blue whales to seek higher latitudes. Ecol. Indicat. 2022, 142, 109235. [Google Scholar] [CrossRef]
  64. Bräger, S.; Harraway, J.A.; Manly, B.F.J. Habitat selection in a coastal dolphin species (Cephalorhynchus hectori). Mar. Biol. 2003, 143, 233–244. [Google Scholar] [CrossRef]
  65. Adams, L. Species distribution model of cetaceans in relation to environmental factors at two locations in the north Atlantic. Plymouth Stud. Sci. 2019, 12, 3–24. [Google Scholar]
  66. Jackson-Ricketts, J.; Junchompoo, C.; Hines, E.M.; Hazen, E.L.; Ponnampalam, L.S.; IIangakoon, A.; Monanunsap, S. Habitat modeling of Irrawaddy dolphins (Orcaella brevirostris) in the eastern Gulf of Thailand. Ecol. Evol. 2020, 10, 2778–2792. [Google Scholar] [CrossRef] [PubMed]
  67. Yamada, K.; Yoo, J.T. Spatial relationship between distribution of common minke whale (Balaenoptera acutorostrata) and satellite sea surface temperature observed in the East Sea, Korea in May from 2023 to 2020. J. Korean Soc. Fish. Ocean Technol. 2022, 58, 281–287. [Google Scholar] [CrossRef]
  68. Gauger, M.F.W.; Romero-Vivas, E.; Peck, M.A.; Balart, E.F.; Caraveo-Patiño, J. Seasonal and diel influences on bottlenose dolphin acoustic detection determined by whistles in a coastal lagoon in the southwestern Gulf of California. PeeJ 2022, 10, e13246. [Google Scholar] [CrossRef] [PubMed]
  69. Slooten, E. Effectiveness of area-based management in reducing bycatch of the New Zealand dolphin. Endanger. Species Res. 2013, 20, 121–130. [Google Scholar] [CrossRef]
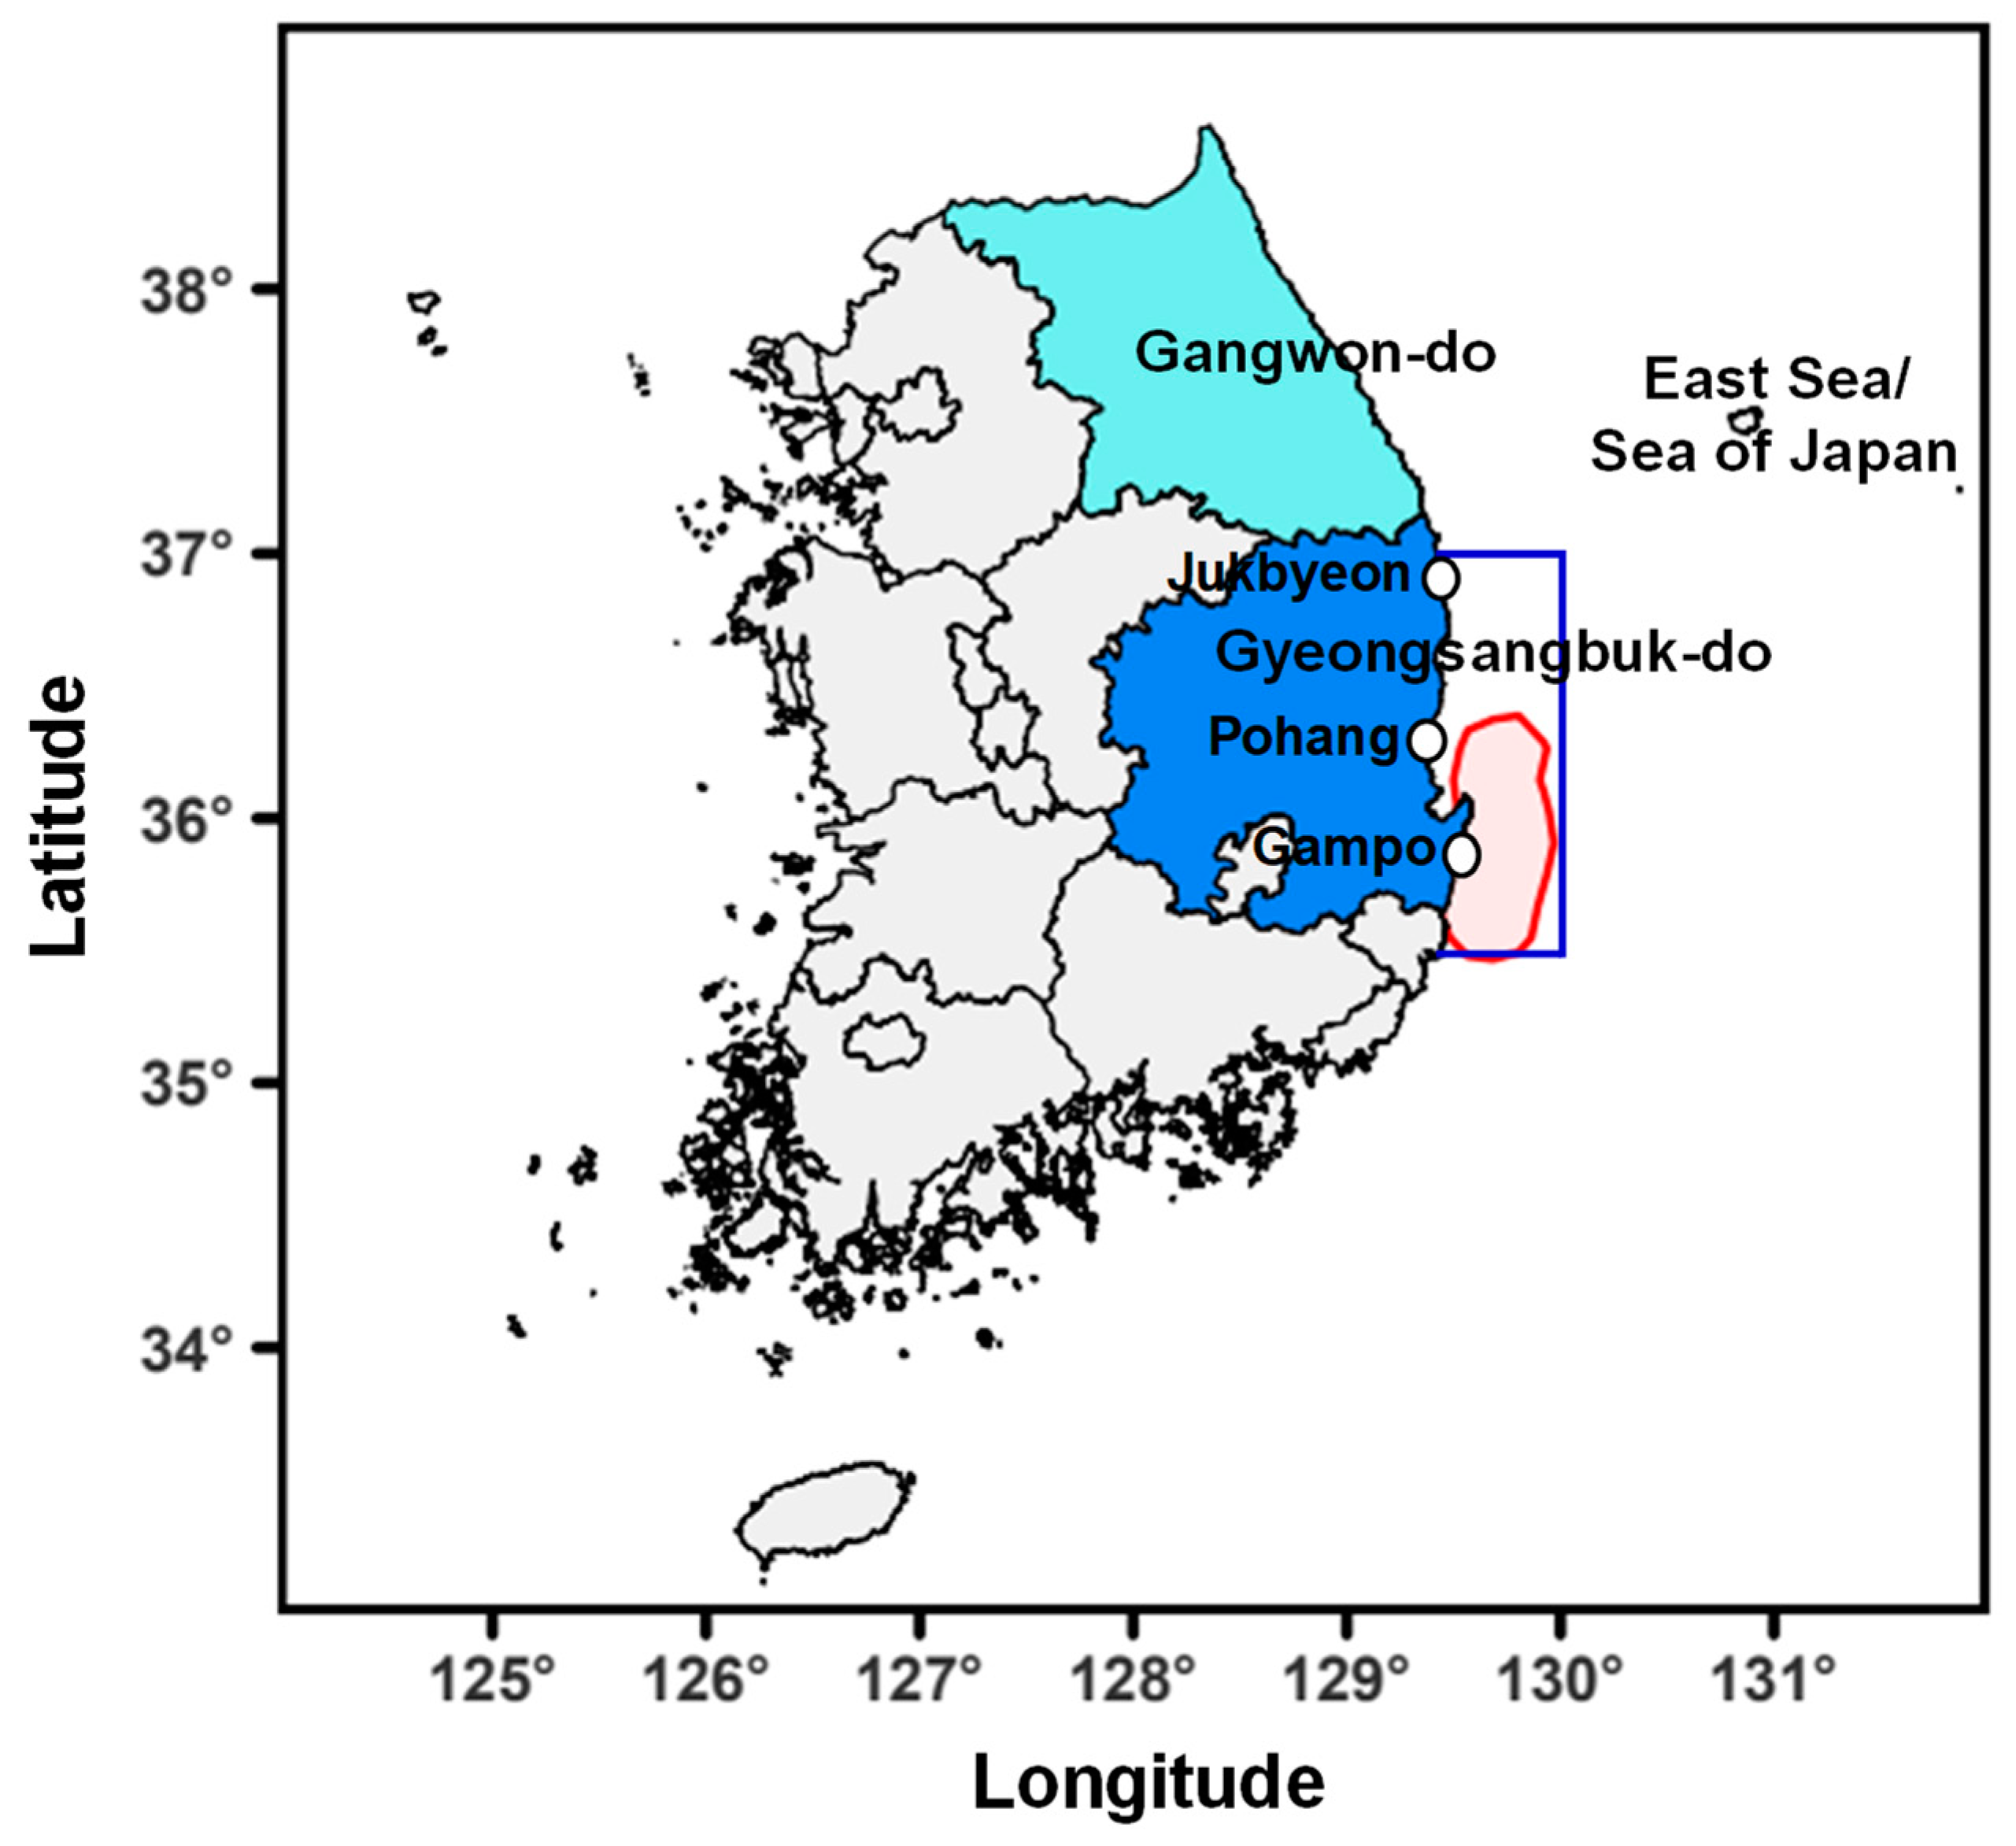
Figure 1. Map of the study area. The red line indicates the widest hotspot of common dolphins in Korean waters, as delineated in a previous paper [4]. The blue rectangle indicates the spatial range of satellite observations used to estimate chlorophyll-a concentration.
Jmse 12 00525 g001
Figure 2. Annual changes in the BPUE (individuals/number of gears) of common dolphins against set nets in the coastal region of Gyeongsangbuk-do, which is located in the southern area of the East Sea/Sea of Japan (ES), from 2011 to 2021.
Jmse 12 00525 g002
Figure 3. Heatmap of the monthly BPUE (individuals/number of gears) of common dolphins in the coastal region of Gyeongsangbuk-do from 2011 to 2021.
Jmse 12 00525 g003
Figure 4. Correlation between the annual averaged BPUE and the averaged BPUE for March–April from 2011 to 2021. rho indicates the Spearman correlation coefficient.
Jmse 12 00525 g004
Figure 5. Correlations among individual variables averaged for March–April from 2011 to 2021. r and rho indicate Pearson and Spearman correlation coefficients, respectively.
Jmse 12 00525 g005
Figure 6. Relationship between the actual BPUE (black line) and predicted BPUE (red line) from a gamma GLM from 2011 to 2021. The gray shadow represents 95% confidence intervals for predictions from the gamma GLM. rho indicates the Spearman correlation coefficient.
Jmse 12 00525 g006
Table 1. Model selection based on the BIC for the gamma GLM.
Model (Variables)BIC
Herring catch + Chlorophyll-a concentration−10.54
Herring catch + Squid catch + Chlorophyll-a concentration−10.15
Herring catch + Squid catch + Chlorophyll-a concentration + SST−7.95
Table 2. Summary of the estimation results of the gamma GLM with two variables selected through the stepwise BIC procedure.
VariableCoefficientp-Value95% Confidence Interval [46,47]
Intercept11.462<0.01[7.454, 16.660]
Herring catch−0.004<0.05[−0.006, −0.001]
Chlorophyll-a concentration−4.209<0.05[−7.262, −1.422]
Disclaimer/Publisher’s Note: The statements, opinions and data contained in all publications are solely those of the individual author(s) and contributor(s) and not of MDPI and/or the editor(s). MDPI and/or the editor(s) disclaim responsibility for any injury to people or property resulting from any ideas, methods, instructions or products referred to in the content.