Article

Experimental Study of Wake Evolution under Vertical Staggered Arrangement of Wind Turbines of Different Sizes

1
School of Energy and Power Engineering, Northeast Electric Power University, Jilin 132011, China
2
Key Laboratory of Smart Grid of Ministry of Education, Tianjin University, Tianjin 300072, China
3
Longyuan (Beijing) New Energy Engineering Technology Co., Ltd., Beijing 100032, China
4
National Environmental Protection Research Institute for Electric Power Co., Ltd., State Environmental Protection Key Laboratory of Atmospheric Physical Modeling and Pollution Control, Nanjing 210031, China
*
Author to whom correspondence should be addressed.
J. Mar. Sci. Eng. 2024, 12(3), 434; https://doi.org/10.3390/jmse12030434
Submission received: 29 January 2024 / Revised: 25 February 2024 / Accepted: 26 February 2024 / Published: 29 February 2024
(This article belongs to the Section Coastal Engineering)

Abstract

:
During the expansion of a wind farm, the strategic placement of wind turbines can significantly improve wind energy utilization. This study investigates the evolution of wake turbulence in a wind farm after introducing smaller wind turbines within the gaps between larger ones, focusing on aspects such as wind speed, turbulence intensity, and turbulence integral length scale. The flow field conditions are described using parameters like turbulence critical length and power spectral density, as determined through wind tunnel experiments. In these experiments, a single large wind turbine model and nine smaller wind turbine models were used to create a small wind farm unit, and pressure distribution behind the wind turbines was measured under various operating conditions. The results indicate that downstream wind speed deficits intensify as the number of small wind turbines in operation increases. The impact of these smaller turbines varies with height, with a relatively minor effect on the upper blade tip and increasingly adverse effects as you move from the upper blade tip to the lower blade tip. Through an analysis of power spectral density, the contribution of vortex motion to wake turbulence kinetic energy is further quantified. In the far wake region, the number of small wind turbines has a relatively small impact on wind speed fluctuations.

1. Introduction

With the ongoing rejuvenation of aging wind farms, the installed capacity [1], rated power, and dimensions of wind turbine units are continuously on the rise [2]. This results in the coexistence of turbines with different models, sizes, and rated powers within a single wind farm. Therefore, it is imperative to place greater emphasis on the wake interactions among turbines of varying sizes. Such attention to detail is poised to contribute significantly to enhancing overall performance and efficiency in wind farms.
The wake effect of wind turbines [3] is recognized as a crucial factor influencing the performance of downstream turbines [4]. The wake effect results in an uneven distribution of wind speed within the wind farm, impacting the operational conditions of each turbine and subsequently affecting the overall operational state and power output of the wind farm [5]. Relevant studies indicate that wake-induced average power losses range from 10% to 23% of the total output power of the wind farm. If downstream units are entirely situated within the wake of upstream turbines, power output can decrease by 30% to 40% [6,7]. Moreover, wakes also contribute to an increase in fatigue loads on downstream turbines, consequently reducing the overall lifespan of the turbines [8].
The wake of wind turbines can be studied through wind tunnel experiments [9], and scaled-down wind tunnel experiments can simulate wind turbine wakes. Fu et al. [10] used a wind tunnel to collect wake data from floating offshore wind turbines and they discussed the influence of parameters like pitch and yaw oscillations on instantaneous power output and wake characteristics. Zhao et al. [11] investigated the combination of wind turbine pitch and yaw control and found that the yaw load of the unit was reduced significantly under the combined effect of both, and the total power was increased by about 1.7%. Heisel et al. [12] conducted wind tunnel experiments to study the meandering characteristics of wakes at the hub height of wind turbines. Bastankhah and Porté-Agel [13] pointed out that, in wind tunnel experiments, a high-speed region appears on the opposite side of the wake meandering. Iungo et al. [14] used wind tunnel experiments to discover that vortices generated near the wake’s end in the near wake region cause oscillations in the wake meandering. Abraham et al. [15] experimentally investigated the effectiveness of different types of rotor asymmetries in wake vortex evolution and proposed a method to mitigate downstream wake effects. Piqué et al. [16] measured the variation in Reynolds number on the velocity field at different flow positions of a horizontal axis wind turbine in wind tunnel experiments. Gao et al. [17] validated the accuracy of the derived wake model through wind tunnel scale experiments and compared it with measurements from actual wind farms. They emphasized the impact of the model wind turbine’s geometric shape on experimental results. This contributes to a better understanding of the relationship between wind tunnel experiments and real wind farms, enhancing the reliability of the experiments.
Optimizing the layout of wind turbines [18] can reduce the impact of wake effects. Standard turbine layouts include series arrangement [19], horizontal offset [20], and vertical offset [21] arrangements. In studies focusing on series arrangements, Dou et al. [19] experimented by adjusting the streamwise spacing between upstream and downstream turbines, concluding that increasing the spacing accelerates wake recovery. The interaction between wakes from multiple turbines is a crucial factor, as shown in Luo et al.’s research [22], which simulated turbine wakes and structures and indicated that downstream turbines are still affected by wake effects in the far wake region. In the literature, a study by Allah et al. [23] confirms that the blending of upstream and downstream multiple wind turbine wake streams can promote the recovery of wind turbine wake streams. The large eddy simulation (LES) study by Meyers and Meneveau [24] illustrates that proper optimization of the flow spacing between upstream and downstream wind turbines can improve the utilization of wind energy. Sun et al. [25] used a genetic algorithm to subdivide the wind farm, taking the wind farm output as the optimization objective, which can simultaneously optimize the number of wind farm units, hub height, and layout, and verified the accuracy of the method in an actual wind farm.
Chamorro et al. [26] conducted wind tunnel experiments to study the wake characteristics of misaligned wind turbines, using data on average wind speed and turbulence intensity in the wake region. They found that, compared to aligned arrangements, misaligned layouts can introduce incoming flow into the turbine wakes, promoting kinetic energy transfer and demonstrating the feasibility of misaligned wind turbine arrays. In the context of misaligned arrangements, Tian et al. [27] proposed various horizontally misaligned wind turbine layouts and found that horizontal misalignment can mitigate the impact of wake effects on downstream turbines. Sun and Yang [28] conducted wind tunnel experiments to validate the impact of hub height variations, emphasizing that optimizing hub heights can effectively tackle challenges in wind farm layout. Wang et al. [29] compared wind turbines with different hub height differences and indicated that a vertically misaligned layout can increase wind farm output power by 2%. Archer et al. [30] validated that vertically misaligned layouts with wind turbines of varying hub heights can improve power output by approximately 6% compared to traditional layouts. Zhang et al. [31] introduced vertical axis wind turbines into conventional arrayed wind farms and found that this vertically misaligned arrangement improved power output by 13.1% compared to traditional layouts. Dai et al. [21] studied horizontally and vertically aligned or misaligned arrangements, and they concluded that layouts with misalignment in both horizontal and vertical directions are most favorable for increasing wind farm power output. Furthermore, the introduction of small wind turbines alters ground roughness, which has a significant impact on wake behavior.
In the integration of theoretical approaches with practical wind farms, Xu et al. [32] enhanced a wind speed prediction model using the optimal weighted Graph Convolutional Network (GCN) and Gated Recurrent Unit (GRU). Their study takes into full consideration the geographical information of wind farm locations. The spatiotemporal prediction model proposed in their research holds significant implications for wind farm site selection and wind turbine layout optimization. Gajendran et al. [33] introduced a symbolic regression method based on machine learning to elucidate wake dynamics using WindSE’s actuator line method (ALM) and large eddy simulation (LES) to obtain high accuracy in wake prediction. Xu et al. [34] introduced a novel wind speed prediction model based on spatial reconstruction and the Broad Learning System (BLS). They validated the effectiveness of this model through experiments conducted in two offshore wind farms. This study provides robust support for improving the operation of wind power generation systems and optimizing the layout of wind farms. Qin et al. [35] used the standard distribution modeling method to extract the change rule of wind speed from the SCADA number of wind farms, analyzed the correlation between the wind speed fluctuation rate and the power fluctuation, and provided a basis for evaluating wind turbine efficiency.
However, it is worth noting that research has primarily focused on horizontally misaligned arrangements with wind turbines at different hub heights, and there needs to be more research on vertically misaligned layouts. This study investigates the influence patterns of small-scale wind turbines on wake flow variations by introducing varying numbers of small wind turbines downstream of a large wind turbine. The primary points of innovation are as follows:
  • We propose a novel wind turbine layout approach incorporating small wind turbines into wind farm units while focusing on large wind turbines. This approach considers the mutual interactions between large and small wind turbines in a combined arrangement.
  • Regarding sensor placement, an equal number of measurement points were evenly distributed at three heights: the upper blade tip, hub center, and lower blade tip. The impact of small wind turbines at various heights was analyzed from multiple perspectives, contributing to a better understanding of the vertical wake distribution within the wind farm.
  • This study employed a comprehensive multi-parameter analysis for the data collected in the experiment. It considered wind speed and included factors such as turbulence integral scale and power spectral density. The study quantified the contribution of vortex motion to wake turbulence energy, providing a more detailed description of wake characteristics. This approach facilitates a comprehensive understanding of the wake evolution process.
The remaining sections of this study are outlined as follows. Section 2 provides a detailed introduction to similarity theory and experimental conditions. Section 3 discusses wake parameters such as velocity deficit, turbulence intensity, and power spectral density in the vertical, streamwise, and crosswind directions to study wake evolution. Finally, Section 4 summarizes the main research findings and conclusions and outlines prospects for future work.

2. Experimental Setup

Similarity theory is the process of quantitatively describing the relationship between actual systems and model systems based on the principle of similarity in physical phenomena. In wind tunnel scaling experiments, three types of similarity are usually involved: geometric similarity, motion similarity, and dynamic similarity.
According to the similarity theory [36], similarity between wind turbine scaled models and prototypes should simultaneously satisfy geometric similarity, kinematic similarity, and dynamic similarity. During large-scale wind tunnel experiments, the inability to alter the medium may lead to changes in Reynolds number by several orders of magnitude while maintaining similarity in geometric shape and tip speed ratio. This situation presents a challenging task of concurrently meeting geometric, kinematic, and dynamic similarity in experiments.
Therefore, in experimental research, it is typically necessary to balance various factors [37]. To achieve a more comprehensive similarity, researchers often prioritize maintaining geometric similarity while adjusting experimental conditions to approximate kinematic and dynamic similarity as closely as possible. This may involve adjusting experimental parameters such as fluid density, velocity, wind tunnel dimensions, and operational status to ensure that the obtained experimental results can reflect the behavior of the prototype system to some extent.
Overall, achieving complete similarity may pose challenges in practical implementation. Hence, researchers need to balance and adjust according to specific circumstances to emulate the desired similarity standards as closely as possible. Additionally, when interpreting and generalizing experimental results, the limitations and potential biases of similarity should also be taken into account.

2.1. Introduction of Experimental Equipment

The experiment was conducted in the recirculating boundary layer wind tunnel at the Key Laboratory for Atmospheric Physics and Pollution Control of the National Environmental Protection in China. The wind tunnel primarily comprises a dynamic section, a rectifying section, and a testing section. The dimensions of the experimental section are 24 m in length, 4 m in width, and 3 m in height, with adjustable wind speeds ranging from 0 to 30 m/s. Additionally, the wind tunnel can generate a boundary layer with a thickness of 1.5–2 m. The arrangement of the wind turbines in the experiment is illustrated in Figure 1.
The wind turbine model employed in this experiment was designed proportionally based on similarity theory, with the prototype being the WindPACT 1.5 MW wind turbine [38]. The model was scaled down at a ratio of 1:70, and the smaller-sized turbine was further reduced by three times based on the 1:70 scale. The turbine blades were fabricated using 3D printing technology, and detailed dimensions of the model are provided in Table 1. An XD-3420 24V permanent magnet DC motor served as the driving system for the upstream large wind turbine, with the rotational speed of the model rotor controlled by the motor’s resistance. The inflow wind speed was set at 7 m/s, and Figure 2 illustrates specific parameters, such as inflow wind speed, turbulence intensity, turbulence integral time, and turbulence integral length, with a tip-speed ratio of 5.7. For additional details on the model wind turbine, refer to Zhao [39].

2.2. Experimental Inlet Air Condition and Working Condition Setting

Figure 2 represents the turbulent boundary layer characteristics, where the dashed lines correspond to the hub height positions of the giant wind turbine. In Figure 2a, the wind speed, and in Figure 2b, the turbulence intensity, are non-dimensionalized based on the inflow wind speed at the hub height. Figure 2c presents the non-dimensionalized turbulence integral length based on the wind turbine’s rotor diameter.
Within the 9D region downstream of the giant wind turbine, rows of small wind turbines were added at positions x/D = 3, x/D = 5, and x/D = 7; each small wind turbine is located 500 mm in front of the measurement point. Each row consists of three small wind turbines arranged horizontally, labeled as the first, second, and third rows of small wind turbines. Four conditions were tested: all small wind turbines were off, only the first-row small wind turbines were operating, first and second-row small wind turbines were operating, and all three rows of small wind turbines were operating. Table 2 provides a summary of these conditions. The horizontal analysis discusses the data collected under different conditions and at various positions. The contour plots represent the corresponding wind speed distribution across the entire flow field in the vertical wind speed analysis. For quantitative analysis, two conditions, C0 and C3, were selected, due to their clear patterns.
In the experiment, the Pitot tube was used to collect the measurements, and the data were collected through the DTC Initium system; the sampling frequency was 300 Hz, and the sampling period was 30 s. After the wind tunnel was operated, the average data collected after every 90 s were collected for 15 min (11 times) to simulate the working conditions of the wind farm under various wind speed conditions. Measurement points were positioned in both the X-Y and Y-Z planes at distances of 3D, 5D, and 7D downstream of the large wind turbine. In the Y-Z plane, there are five columns of measurement points aligned at each position of 3D, 5D, and 7D, which are denoted by the designations C3-[1-5], C5-[1-5], and C7-[1-5], respectively, and the column spacing of each row of measurement points is 1.25 d. Each column of measurement points contains 20 points distributed within the height range of [200–2100], with an interval of ∆s = 100 mm. X-Y plane measurement points were located at the tip, hub center, and bottom tip heights of the large wind turbine. Before the start and after the completion of the experiment, Pitot tubes were used in the free-flow region of the wind tunnel to calibrate the hot-wire anemometers, ensuring negligible voltage drift in the data acquisition system. The indoor temperature was maintained at 23 ± 0.5 °C to ensure that measurement errors caused by changes in environmental temperature remained within 0.2% [40].

2.3. Uncertainty Analysis of Experimental Data

In the experiment, the aerodynamic performance of the model wind turbine was evaluated by defining key parameters, such as wind speed (V), turbulence intensity (IT), turbulence integral length (Λ), and assessing their uncertainties [41].
The uncertainties of V, IT, and Λ at the rated wind speed were calculated using the following formulas for the corresponding Tip–Speed Ratio (TSR = 5.7), ensuring that they were each less than or equal to 1.0%, 0.7%, and 3.1%, as follows:
δ R R = R X 2 δ X 1 2 + R X 2 δ X 2 2 + + R X n δ X n 2 R
In the formulas, R represents the calculated variable, δ R R denotes the uncertainty of the computed variable in percentage, X n is the independent variable, and δ X n represents the accuracy of X n .

3. Results and Discussion

In this section, the study focuses on the wake characteristics generated by the giant wind turbine under selected conditions. It involves a comparative analysis of wake parameters behind the big wind turbine at different heights, discussing flow field characteristics such as velocity recovery and turbulence intensity. Additionally, this section provides a detailed discussion of how changes in the number of small wind turbines influence the evolution of wakefield parameters, including turbulence integral length scale and power spectral density, generated by the giant wind turbine.

3.1. Horizontal Direction

3.1.1. Characteristics of the Spreading Wake

After the incident wind passes through the rotating wind turbine, there is a significant velocity change at the interface between the wake and the surrounding ambient airflow. However, as the downstream distance increases, the wake effect diminishes. Due to the influence of viscous shear effects, the velocity loss gradually decreases, and the wake velocity slowly recovers to the inflow wind speed.
As shown in Figure 3, instantaneous wind speeds were extracted during the steady operation of the wind turbines, specifically at the hub height of the giant wind turbine, within the 25–26-s timeframe. The horizontal dashed lines in the figure represent the exact positions of the large and small wind turbines, while the yellow arrows indicate the direction of flow changes. Since the incoming wind in the wind farm exhibits a degree of uniformity in the streamwise direction, the flow velocity distribution in the wind farm with the arrangement of small wind turbines is roughly symmetric about the rotational centerline of the central row of small wind turbines. Subfigures (a), (d), and (g) correspond to measurement points at the 3D position, as shown in Figure 1. At the same time, (b), (e), and (h) represent measurement points at the 5D position, and (c), (f), and (i) correspond to measurement points at the 7D position. From Figure 3a–i, it is evident that after the air works on the wind turbines, the wake velocity rapidly attenuates, creating a low-speed wake behind the wind turbine. In positions directly behind the small wind turbines, the velocity loss exceeds 50%. As the measurement points move downstream, as seen in Figure 3a–f, the wake velocity gradually recovers due to the expansion of the wake and the continuous influx of external environmental fluid, resulting in energy and momentum transfer [42]. Since the inflow for downstream wind turbines in the wind farm is, in reality, the wake from the upstream wind turbines, the wake field of the downstream wind turbines is also influenced by the wake from the upstream wind turbines. The contour plots illustrate that the wake field of the small wind turbines tends to stabilize within the wind farm.
A quantitative analysis of velocity deficits at different downstream positions in the streamwise direction was performed under three other conditions to better compare the differences in average downstream flow velocity deficits with the addition of small wind turbines. This further confirms the impact of small wind turbines on the wake. In Figure 4a, the condition without small wind turbines running provides a reference for comparison. In Figure 4b, which corresponds to the condition with small wind turbines operating at the 3D position, as seen in Figure 3a–c, there is a 22% velocity deficit behind the small wind turbines. By comparing the conditions with the addition of two rows and three rows of small wind turbines, as shown in Figure 4c,d, corresponding to Figure 3d–i, it can be observed that the velocity deficit patterns behind each row of small wind turbines are nearly identical, with a velocity deficit of around 23% for each added row of small wind turbines. As the number of small wind turbines increases, the loss in wake velocity gradually intensifies. In the far wake region, as the wake evolution in the wind farm approaches equilibrium, the velocity differences along the rotor’s streamwise direction decrease.

3.1.2. Characteristics of the Turbulent Intensity Distribution in the Wake Field

Turbulence intensity, which is the primary factor in fatigue failure and is frequently employed as a gauge of the fatigue load on wind turbines, is utilized to quantify the overall change in wake dynamics. Equation (2) through (6) demonstrate how to compute the turbulence intensity given the mean wind speed [43]:
I T , t o t = ( 1 n p w ) I T m + P w i = 1 n I T , m T S i m
P w = 0.06
S i = x D
I T , w = 1 ( 1.5 + 0.3 s i v ) 2 + I T 2
I T = σ v
where n p w is the number of nearby wind turbines NS S i represents the ratio of wind turbine spacing to wind turbine diameter, i.e., Pw is the probability condition of the top wake, D is the wind turbine diameter, v is the mean wind speed, and σ is the standard deviation of the wind speed. IT is the turbulence intensity of the free flow; IT,W is the turbulence intensity of the wake effect; and m is the Waller contrast index of the material of the structural member under consideration. The generation of flow turbulence by the wind turbine wake shear layer, ambient boundary layer turbulence, and blade tip vortex shedding from the wind turbine blades are all related phenomena.
Figure 5 illustrates the turbulence intensity distribution at the hub height of the giant wind turbine in a vertically staggered wind farm configuration. The presence of small wind turbines imparts strong perturbations to the flow field. Influenced by the wake expansion shear layer, the tip vortices experience pronounced disruption. As the number of small wind turbines increases, the unstable tip vortex shedding structures decouple, forming multi-scale turbulent vortex structures. The intense momentum exchange between these structures significantly amplifies the turbulent kinetic energy. Simultaneously, a localized concentration of high turbulence intensity emerges in the wake region behind the small wind turbine rotor tips.
Compared with the C0 condition (as shown in Figure 5b,c,f), the introduction of small wind turbines results in a substantial increase in turbulence intensity in the peripheral inflow to the wind turbine rotor region. The increase is approximately 35% of the incoming turbulence intensity. This suggests that the wind turbine rotor tips may experience more significant dynamic loading, consequently increasing the fluctuation in torque at the turbine input.
Figure 6 further quantifies the turbulence intensity at three downstream positions under different conditions, with dashed lines indicating the tip position of the wind rotor. As the wake progresses downstream, there is a significant increase in the fluctuations in turbulence intensity due to the intense momentum exchange between multi-scale turbulent vortices. Simultaneously, as the wake effect diminishes in the far wake region, the influence of small wind turbines on the wake also decreases. As the measurement points move downstream, turbulence intensity gradually decreases, reaching a deficit of approximately 15%. The following section will introduce further analysis involving the turbulence integral length scale.

3.1.3. Turbulence Integration Scale

The average size of the turbulent vortices in the flow is determined by the turbulence integration length. Equation (7) [44] illustrates how the Taylor turbulence freezing assumption can be used to compute the turbulence integration length from the integration of the autocorrelation function of the main streamwise velocity:
Λ = 1 σ u 2 0 R u 1 u 2 ( x ) d x
where R u 1 u 2 is the intercorrelation function u of velocity u 1 and u 2 ; σ u 2 is the velocity variance, indicating wind speed fluctuations.
Figure 7 shows the horizontal distribution curves of the turbulence integral length for three operating conditions at x/D = 3, 5, and 7. The dashed line in the figure shows the position of the wind turbine’s tip. From Figure 7, it can be seen that the distribution of the horizontal turbulence integral length is not uniform and has poor symmetry about the hub centerline due to factors such as the boundary layer effect and the shading effect of the small wind turbine. The large-scale eddies in the incoming wind lead to the rapid discretization of the turbulent structure after being disrupted by the rotating wind turbine, and the turbulence integral lengths are gradually recovered as the position moves downstream. At the near wake location, the change in the number of small wind turbines has a significant effect on the turbulence integration scale; as the location of the measurement point moves away from the upstream large wind turbines, the impact of the change in the number of small wind turbines on the turbulence integration length gradually becomes smaller. In addition, the turbulence integration scale moves downstream as the position shifts downstream, and the turbulence integration scale at x/D = 7 increases by about 30% compared with that at x/D = 3.

3.1.4. Effect of Small Wind Turbines on Wind Speed at Different Heights

In order to quantitatively analyze the effect of adding small wind turbines on the wind turbine wake region in terms of the spreading velocity deficit, the study chooses two working conditions for comparison: no small wind turbine operation, and all three rows of small wind turbines in operation. The study extracts the average axial velocities at different heights in the horizontal direction of the wind turbine (Z/Zhub = 0.4, Z/Zhub = 1, and Z/Zhub = 1.6). In Figure 8, the vertical coordinates represent the relative positions of the wind turbine in the spreading direction, while the horizontal coordinates represent the average axial velocities, with the dashed line indicating the position of the tip of the wind turbine impeller of the large wind turbine.
In this condition, the velocity is gradually lost from the upper blade tip to the lower blade tip. The comparison results show that the upper blade tip position exhibits a flat wake velocity after adding a small wind turbine, with the velocity variance decreasing by 1%, and the wind speed in the middle section of the blade increasing. At the hub center height, the maximum loss of wind speed after adding a small wind turbine is observed near the root of the blade, resulting in symmetrical wind speeds on both sides. The wake velocity at the hub center and lower blade tip positions experiences varying degrees of loss after adding a small fan. Starting from the 5D region, the impact of the small fan on the lower blade tip increases, with the wind speed in the middle section of the blade reaching the peak and then decreasing sharply, failing to recover to the incoming wind speed. However, at the upper blade tip height and hub center height, the effect of the small wind turbine on the wind speed is similar to the 3D region. Overall, adding a small wind turbine has the smallest and a positive effect on the upper blade tip position in the three regions; the negative effect on the lower blade tip is the largest.

3.1.5. Power Spectrum Density

The power spectral density describes the distribution of wind energy in the frequency domain, and the structural changes associated with the fluctuations in the power spectral density are used to obtain information about the effect of the operation of different numbers of small wind turbines on the output of a wind farm.
Figure 9 displays the power spectral density at heights from the upper blade tip to the lower blade tip at downstream positions x/D = 3, 5 and 7. At the same vertical position, the turbulence intensity at the upper blade tip height is higher than at the lower blade tip position. At different vertical positions, the streamwise variation in the power spectra is not the same.
The observation of power spectral density characteristics at different locations reveals that the wind passing through the rotor generates a dynamic turbulence phenomenon. This turbulence exhibits distinct large-scale energy aggregation regions, inertial ranges, and viscous dissipation ranges. This phenomenon is effectively described by the Kolmogorov-5/3 [45] formula, which is applicable over a range of about one to two orders of magnitude. The character of the power spectral densities changes significantly as the flow field moves downstream, with a consequent increase in the span of the inertial range. At the hub center height within the nacelle, as shown in Figure 9d–f, there are significant differences in power spectral density under different conditions. With an increasing number of small wind turbines, the energy contribution of small-scale vortices to the wake also increases. At the upper blade tip position (as in (a–c)), the inertial subrange widens, indicating an increase in turbulence intensity.
In contrast, at the lower blade tip position (as in (g–i)), the inertial subrange narrows to varying degrees, suggesting a decrease in turbulence intensity. The vertical velocity distribution shows that the influence of blade tip vortices on power spectra is more significant at the lower blade tip. Therefore, the addition of small wind turbines has a particular impact on the power spectral density of the wake.

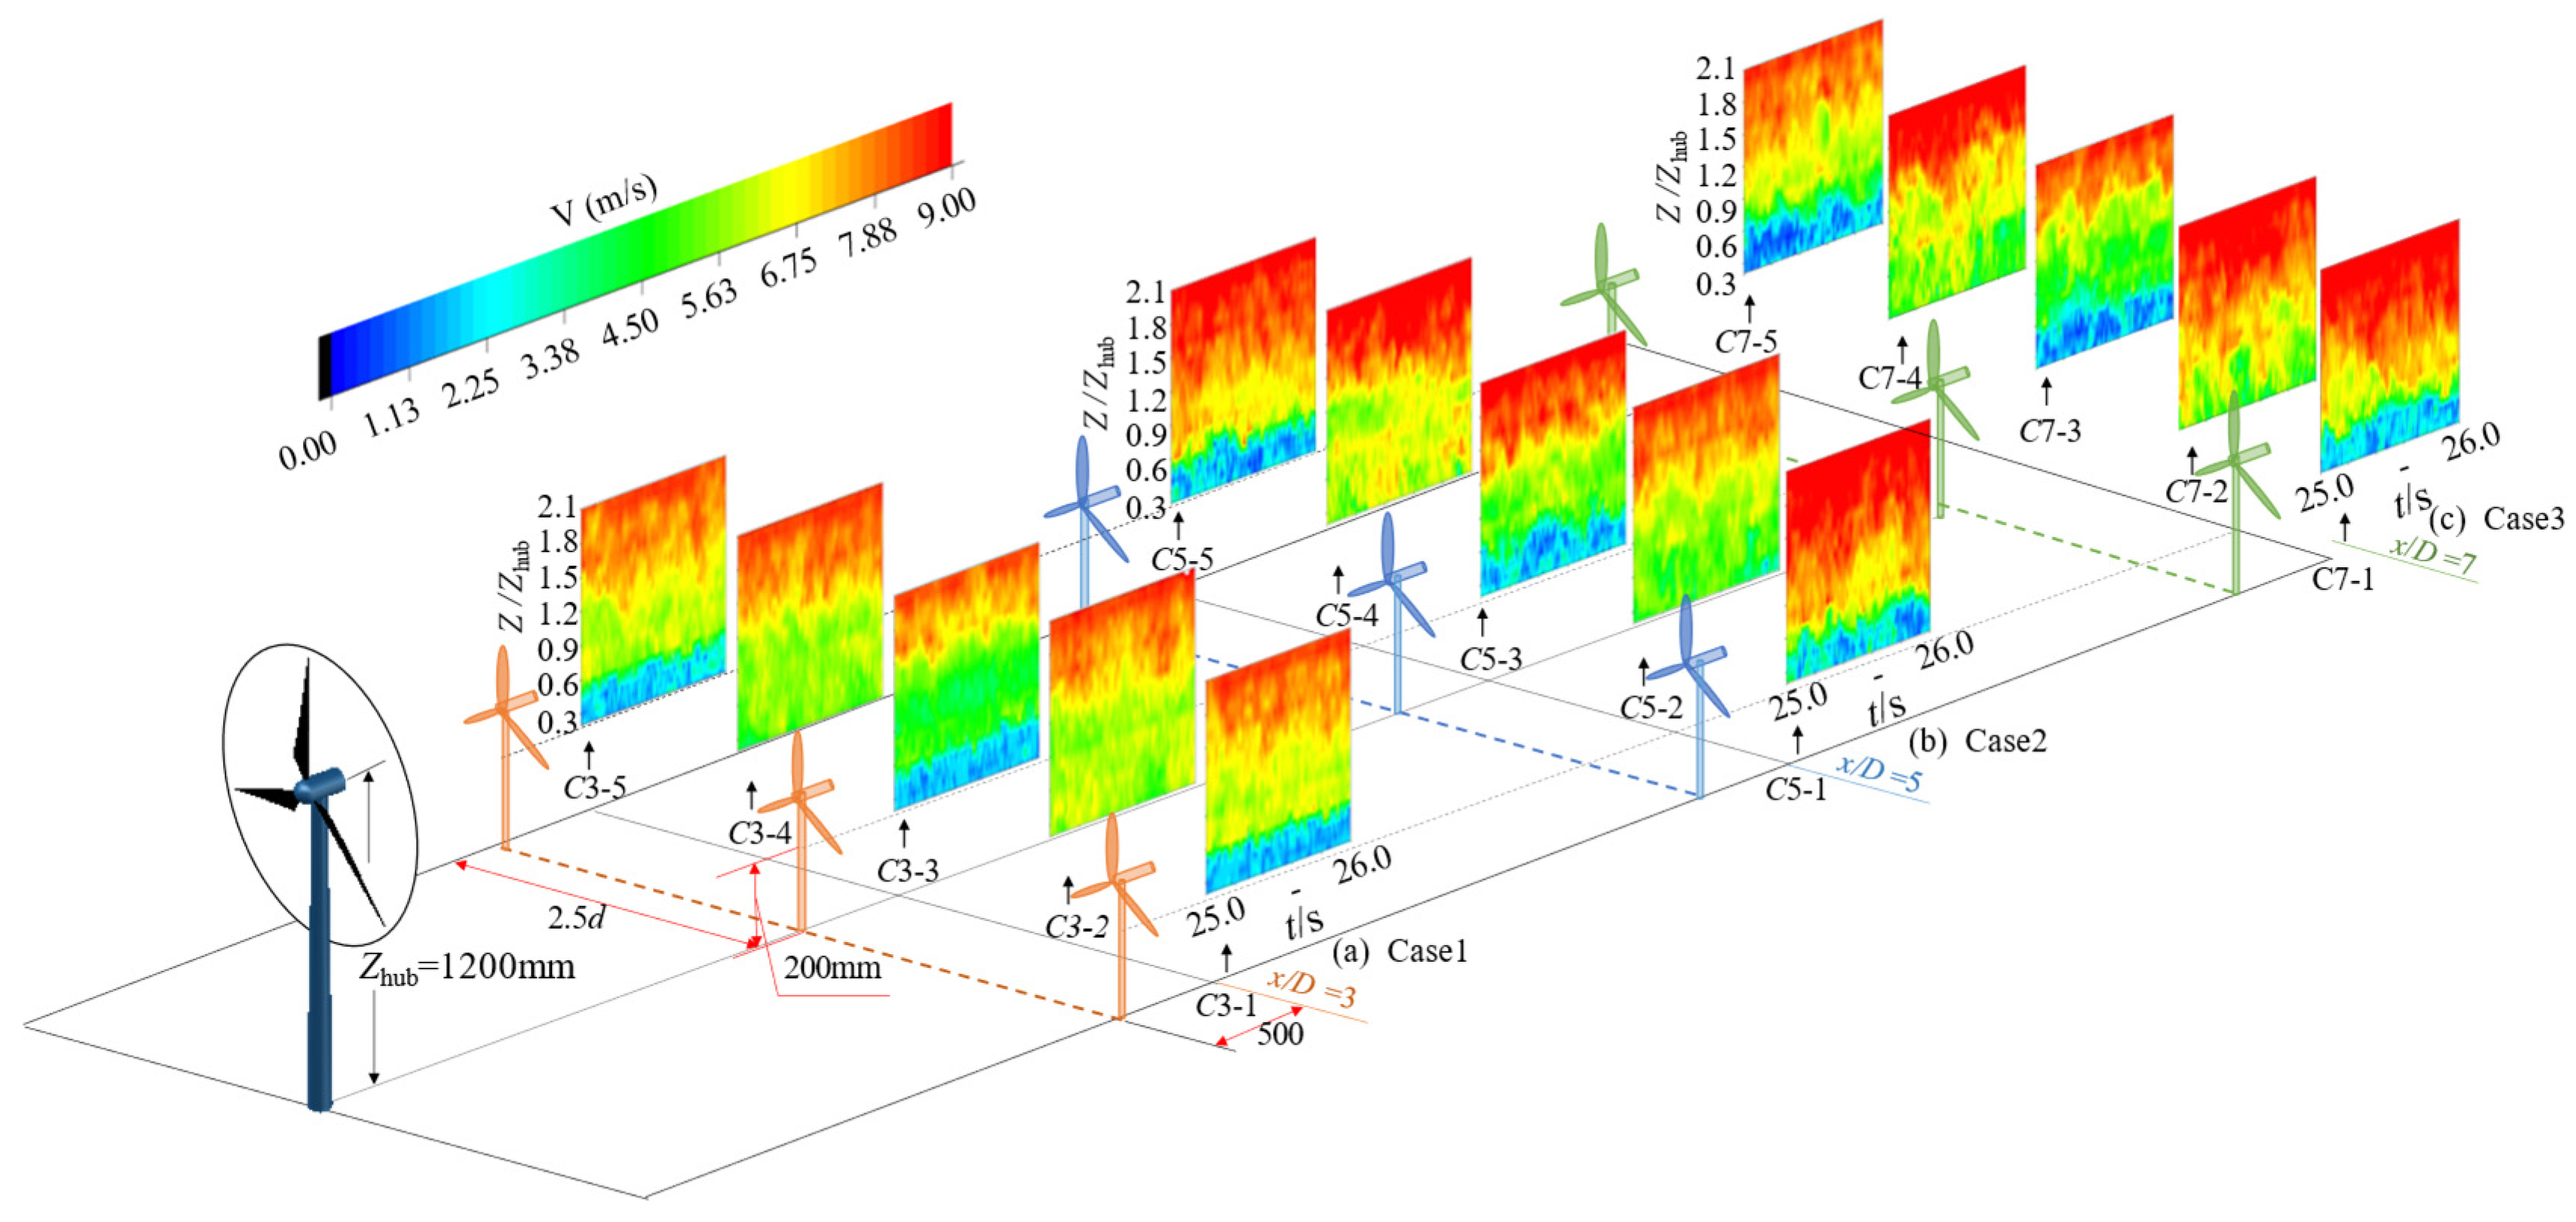
3.2. Vertical Direction

3.2.1. Vertical Wake Characteristics

In this section, wind speed data within the same temporal interval as the horizontal direction are extracted to illustrate the wind speed variation trends behind different numbers of small wind turbines. Figure 10 demonstrates that when small wind turbines are operating, there is a decrease in wind speed within the range of their downstream rotor, but the decline is less pronounced at the measurement locations above. This is because small wind turbines create more resistance to the incoming wind at lower heights, and as the measurement height increases, the wind speed outside the wake of the small wind turbines gradually increases. From the measurement point at 5D, it can be observed that the velocity deficit worsens with an increasing number of small wind turbines in operation. When all three rows of small wind turbines operate, the most significant deficit occurs at the 7D position. The following section will provide a quantitative analysis of velocity deficits under specific conditions.

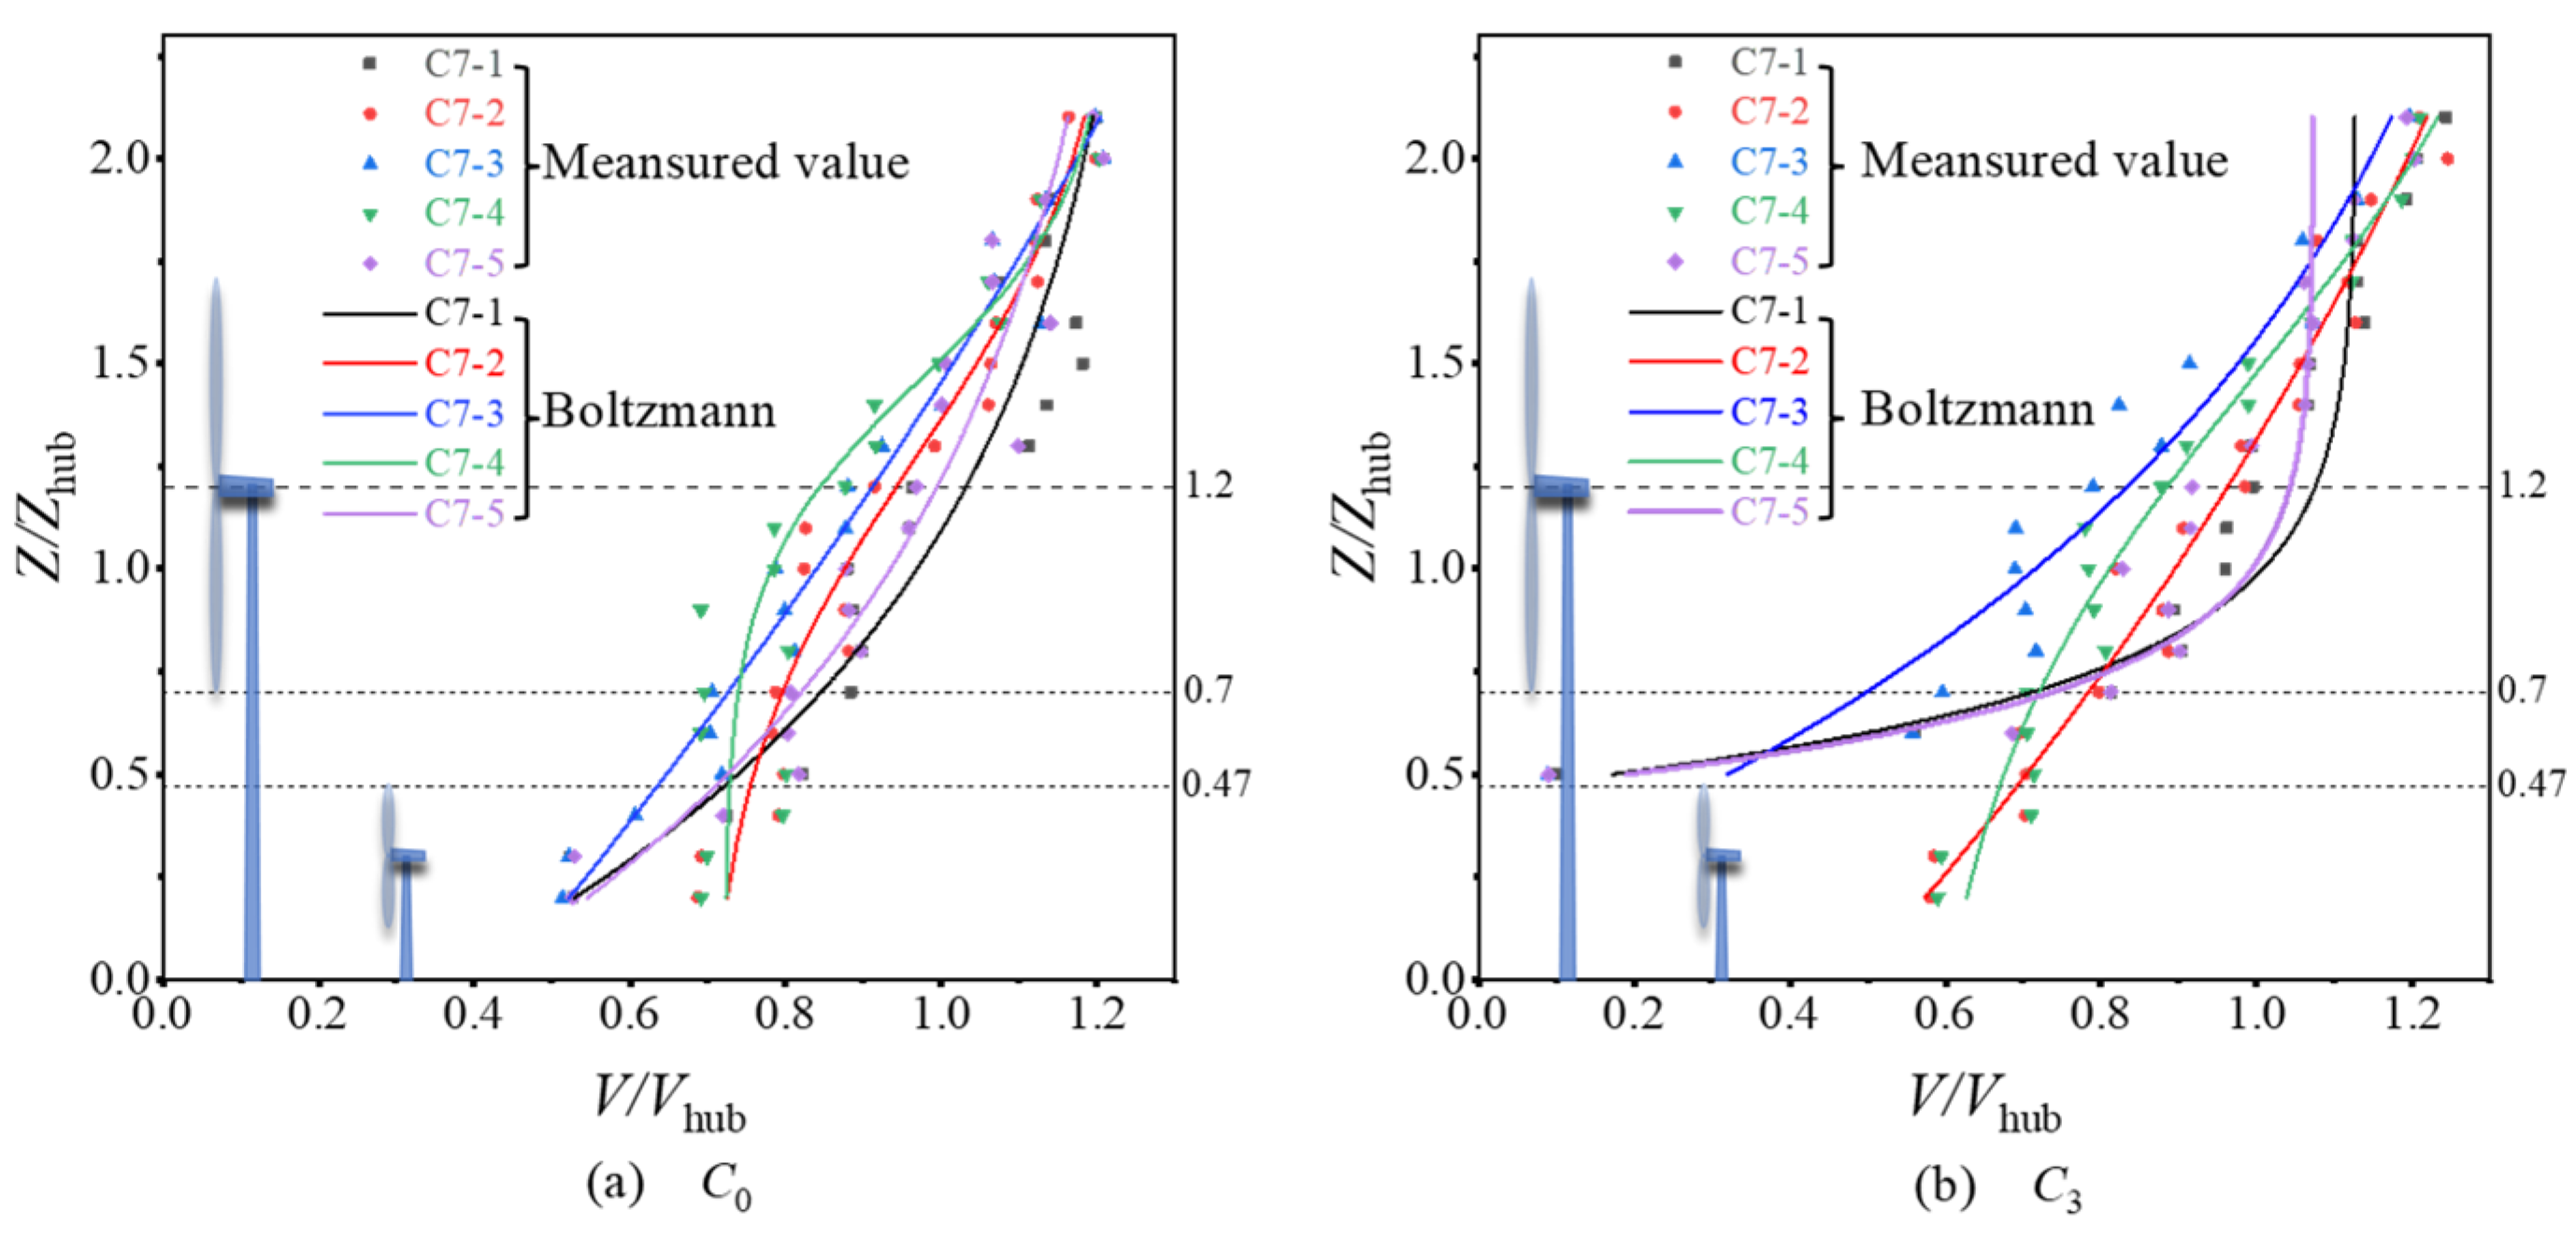
3.2.2. Analysis of Working Conditions

Data collected from the measurement point located downstream of the small wind turbines at the 7D position in the far wake region were extracted for analysis in the vertical direction. Two conditions, C0 and C3, were studied to investigate the wake recovery under these two scenarios. The analysis focused on the wind profiles and turbulence intensity to understand the wake recovery in these conditions.
The Boltzmann curve fitting method, characterized by an S-shaped curve, is commonly employed to model nonlinear relationships where one variable changes in tandem with another [46]. In this study, the wind profile acquired exhibits characteristics akin to this S-shaped nonlinearity. Hence, to enhance the visualization of wind speed distribution subsequent to the blending of wake streams from large and small wind turbines, we opted to utilize this fitting approach.
Figure 11 shows that the presence of small wind turbines increases the surface roughness, resulting in lower streamwise velocities at the lower tip position of the giant wind turbine. Compared to the C0 scenario, in the overlapping region, the C3 scenario experiences a velocity deficit of approximately 20% due to the combined tip effects of the large and small wind turbines. However, as the measurement point moves beyond the upper tip height of the small wind turbines, wind speed gradually recovers. Under the C3 scenario, there is an overall increase in wind speed of approximately 5%. Therefore, adding small wind turbines in the downstream direction is more favorable for enhancing wind speed.

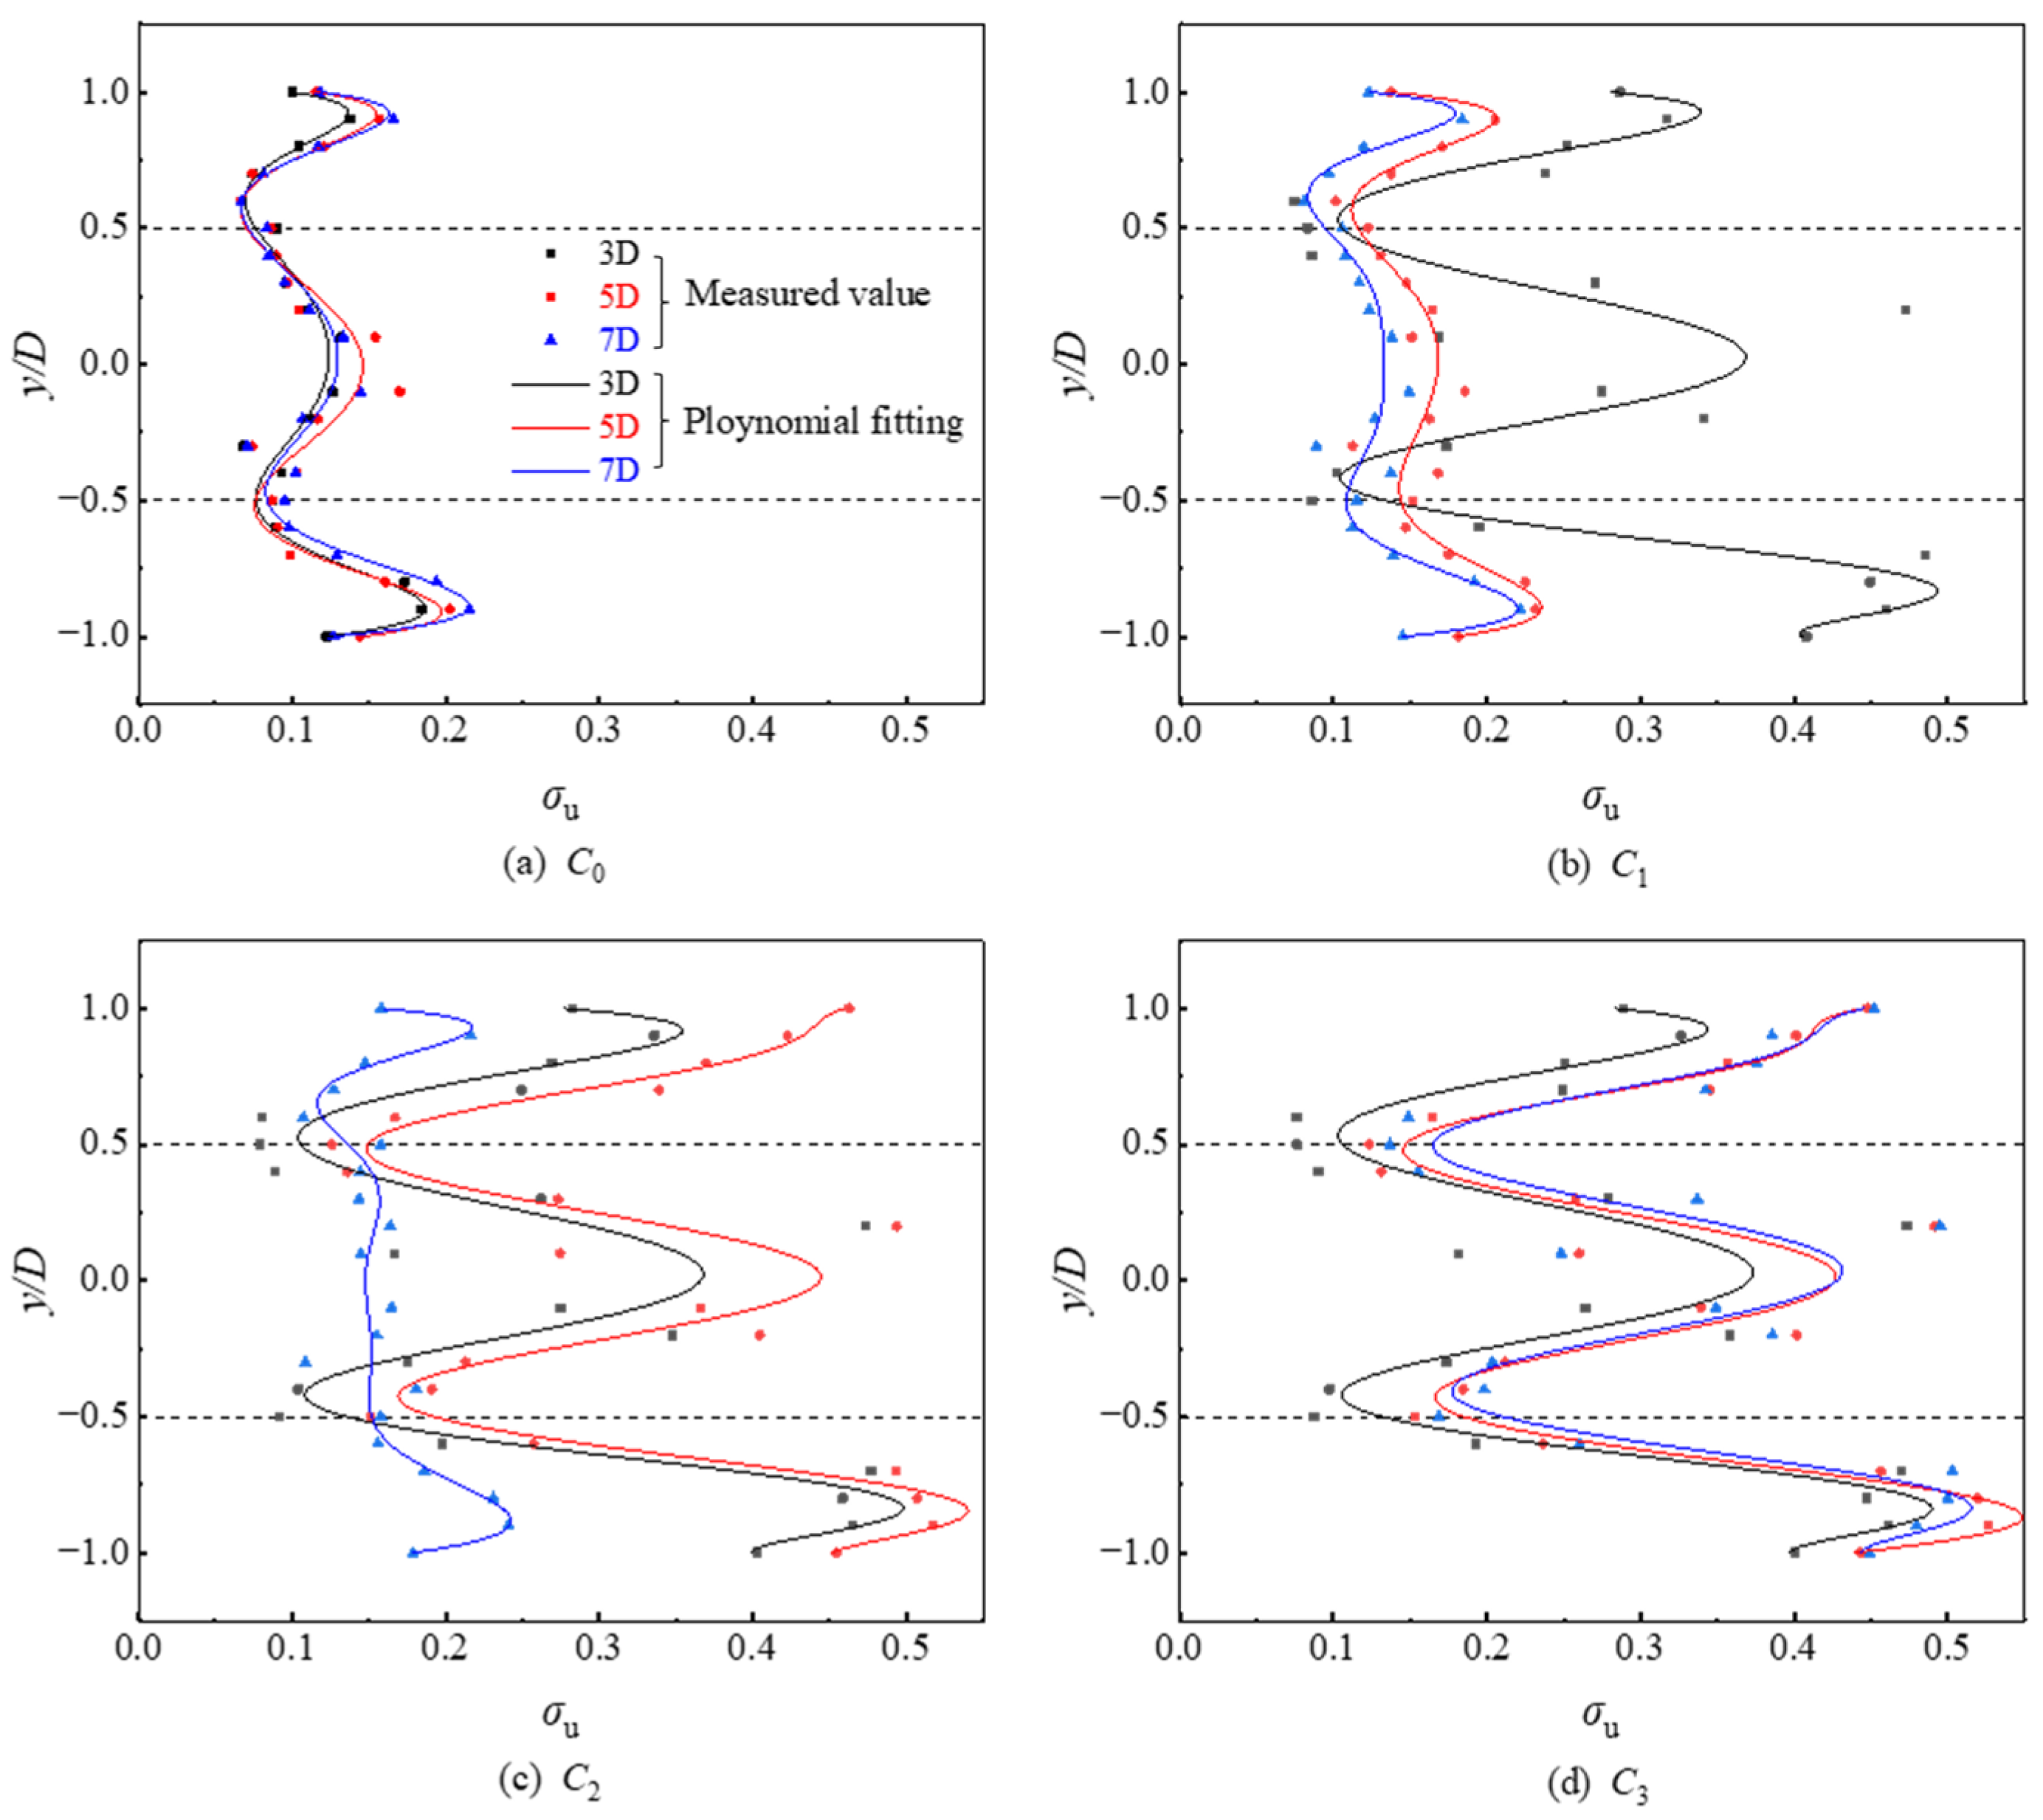
3.2.3. Turbulence Intensity

Figure 12 presents the turbulence intensity distribution in the vertical direction at the 7D position. It can be observed that the rotation of the wind turbines significantly disturbs the flow field. As the flow progresses downstream, the unstable tip vortices decouple, and there is intense momentum exchange between multi-scale turbulent eddies, leading to higher turbulence intensity regions behind the tips. Due to the lower mean flux, turbulence intensity is relatively higher in the near wake region just behind the wind turbine, as shown in Figure 13. Comparing the C3 scenario to the C0 scenario, in the wind turbine wake region, the impact of the small wind turbines results in an approximate 10% increase in turbulence intensity in the immediate wake region behind the small wind turbines (Figure 13a). In the measurement point between the small wind turbines (Figure 13b), turbulence intensity increases somewhat, with approximately 7% enhancement. Therefore, the adding of small wind turbines in the wind farm positively enhances turbulence intensity.

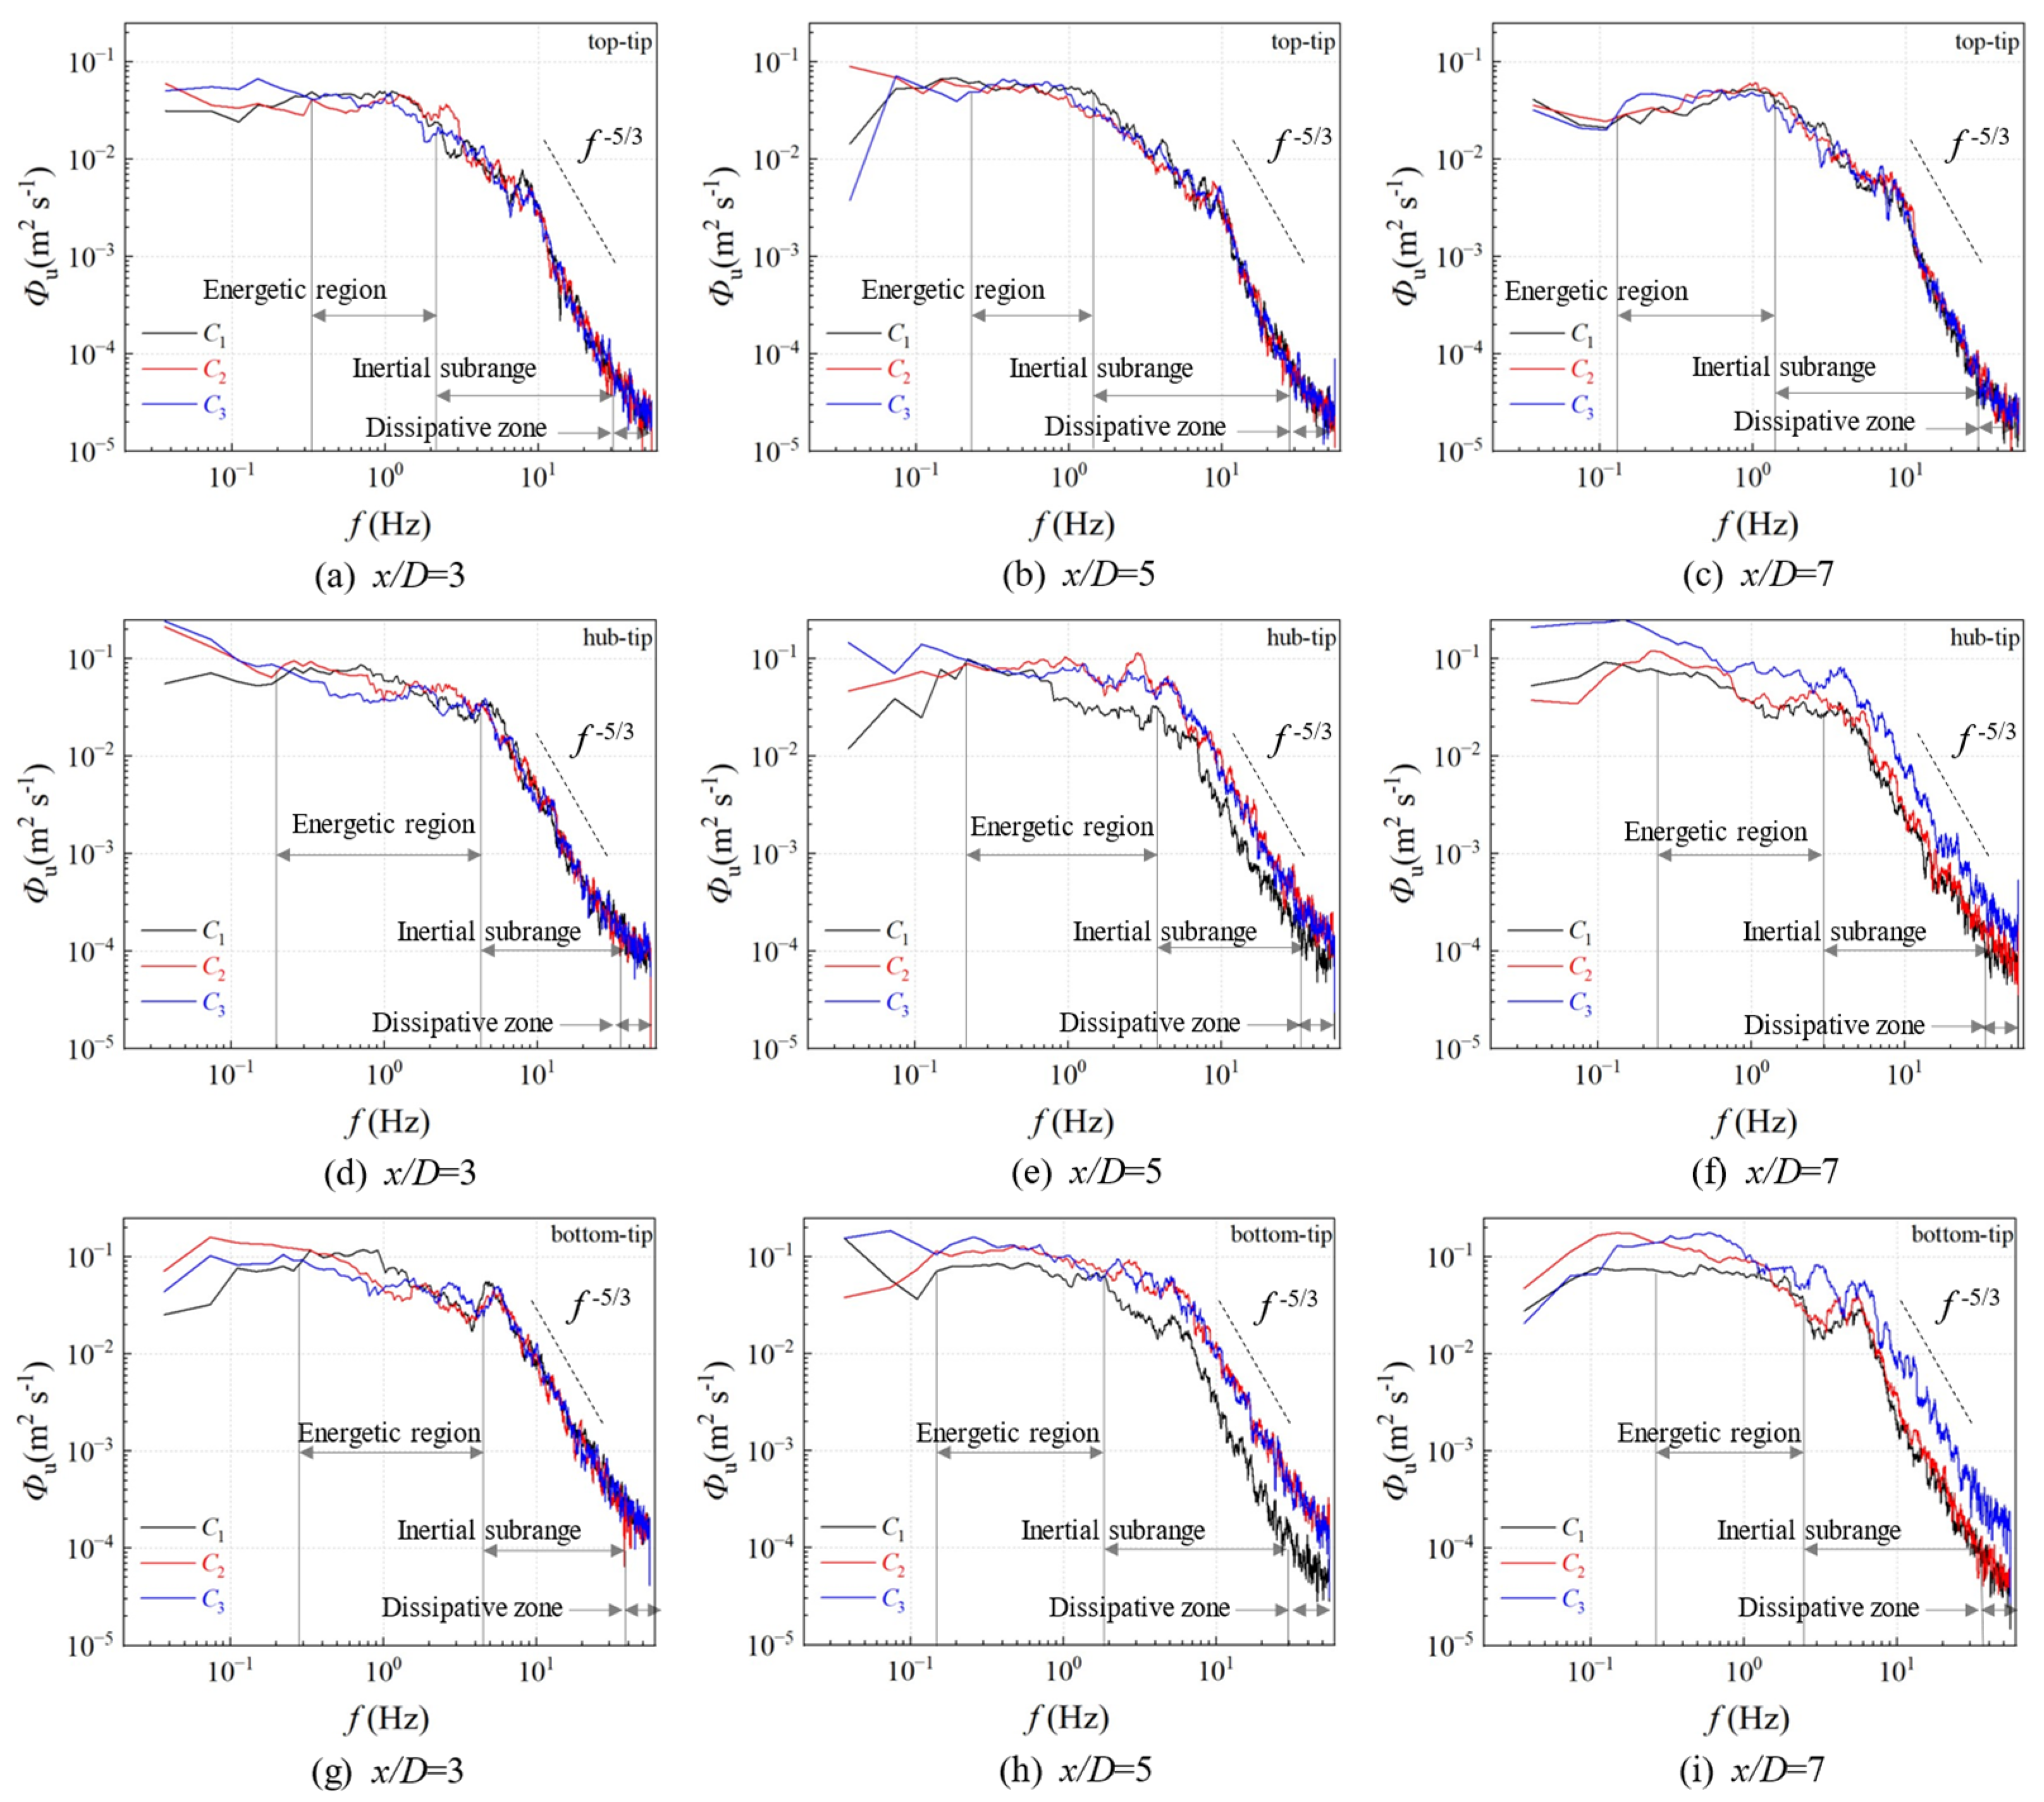
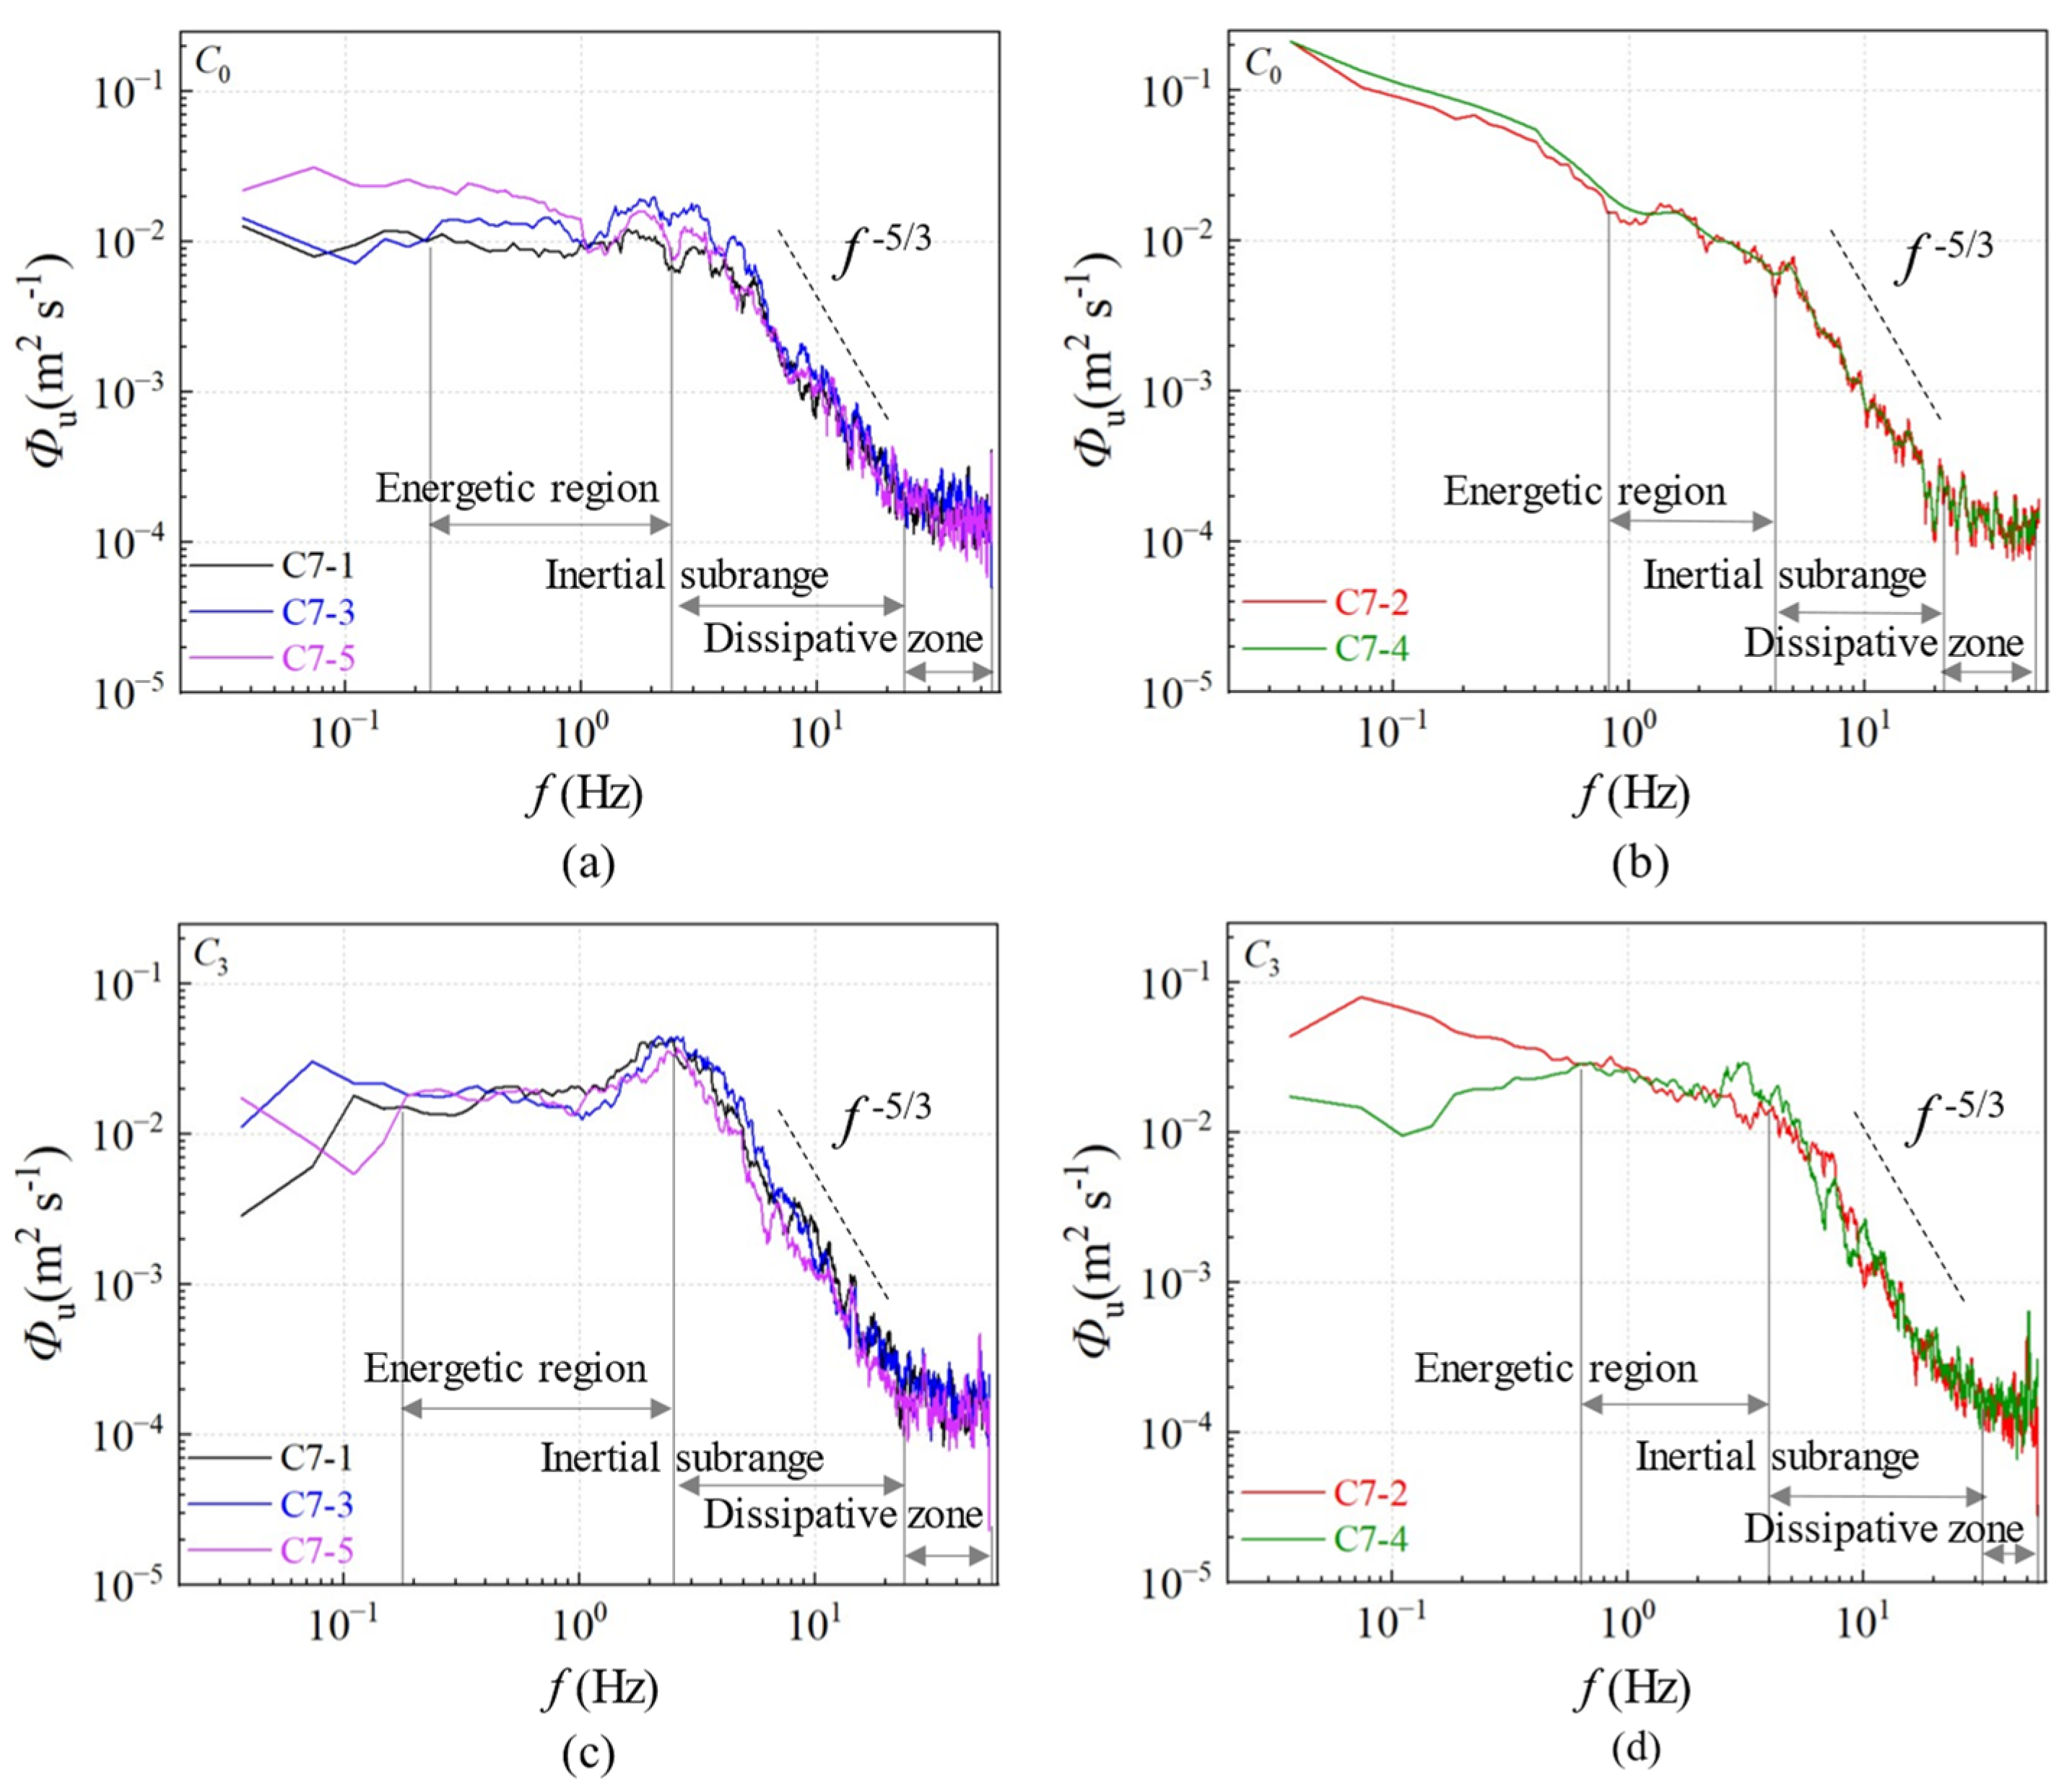
3.2.4. Vertical Power Spectrum Analysis

Pulsating wind speeds are composed of vortices of various scales, each with periodic motion. The power spectra of pulsating winds at different downstream locations in the far wake region at x/D = 7 are shown in Figure 13, with Figure 13a,c representing positions just behind the small wind turbines. As seen in Figure 13, the power spectral density decreases as the frequency increases. In the energy-containing region, when all three rows of small wind turbines are in operation, as shown in Figure 13c,d, the pulsating wind scales and power spectral density are more prominent, indicating a higher energy content.
As the flow progresses, large-scale vortices break down into many small-scale vortices, transferring energy from large-scale vortices to small-scale ones. Small vortices become isotropic at this stage, corresponding to the inertial subrange. In the inertial subrange, the influence of small wind turbine operation on pulsating wind speeds is minimal. Very little energy is dissipated by viscosity, and pulsations mainly serve to transfer power, with large-scale pulsations sharing energy with small-scale ones, conforming to the Kolmogorov-5/3 law.
However, as vortices further develop, they eventually succumb to viscosity, resulting in energy dissipation, corresponding to the dissipative subrange. At this point, the characteristics of pulsating wind speeds almost disappear.
The authors should discuss the results and how they can be interpreted from the perspective of previous studies and of the working hypotheses. The findings and their implications should be addressed in the broadest context possible. Future research directions may also be highlighted.

4. Conclusions

In this study, the parameters of wake characteristics after introducing a small wind turbine downstream of a large wind turbine are measured and analyzed by wind tunnel experiments to study the velocity distribution and turbulence characteristics in the wakefield. The following conclusions are drawn from the comprehensive analysis of the wind tunnel experimental data:
(1)
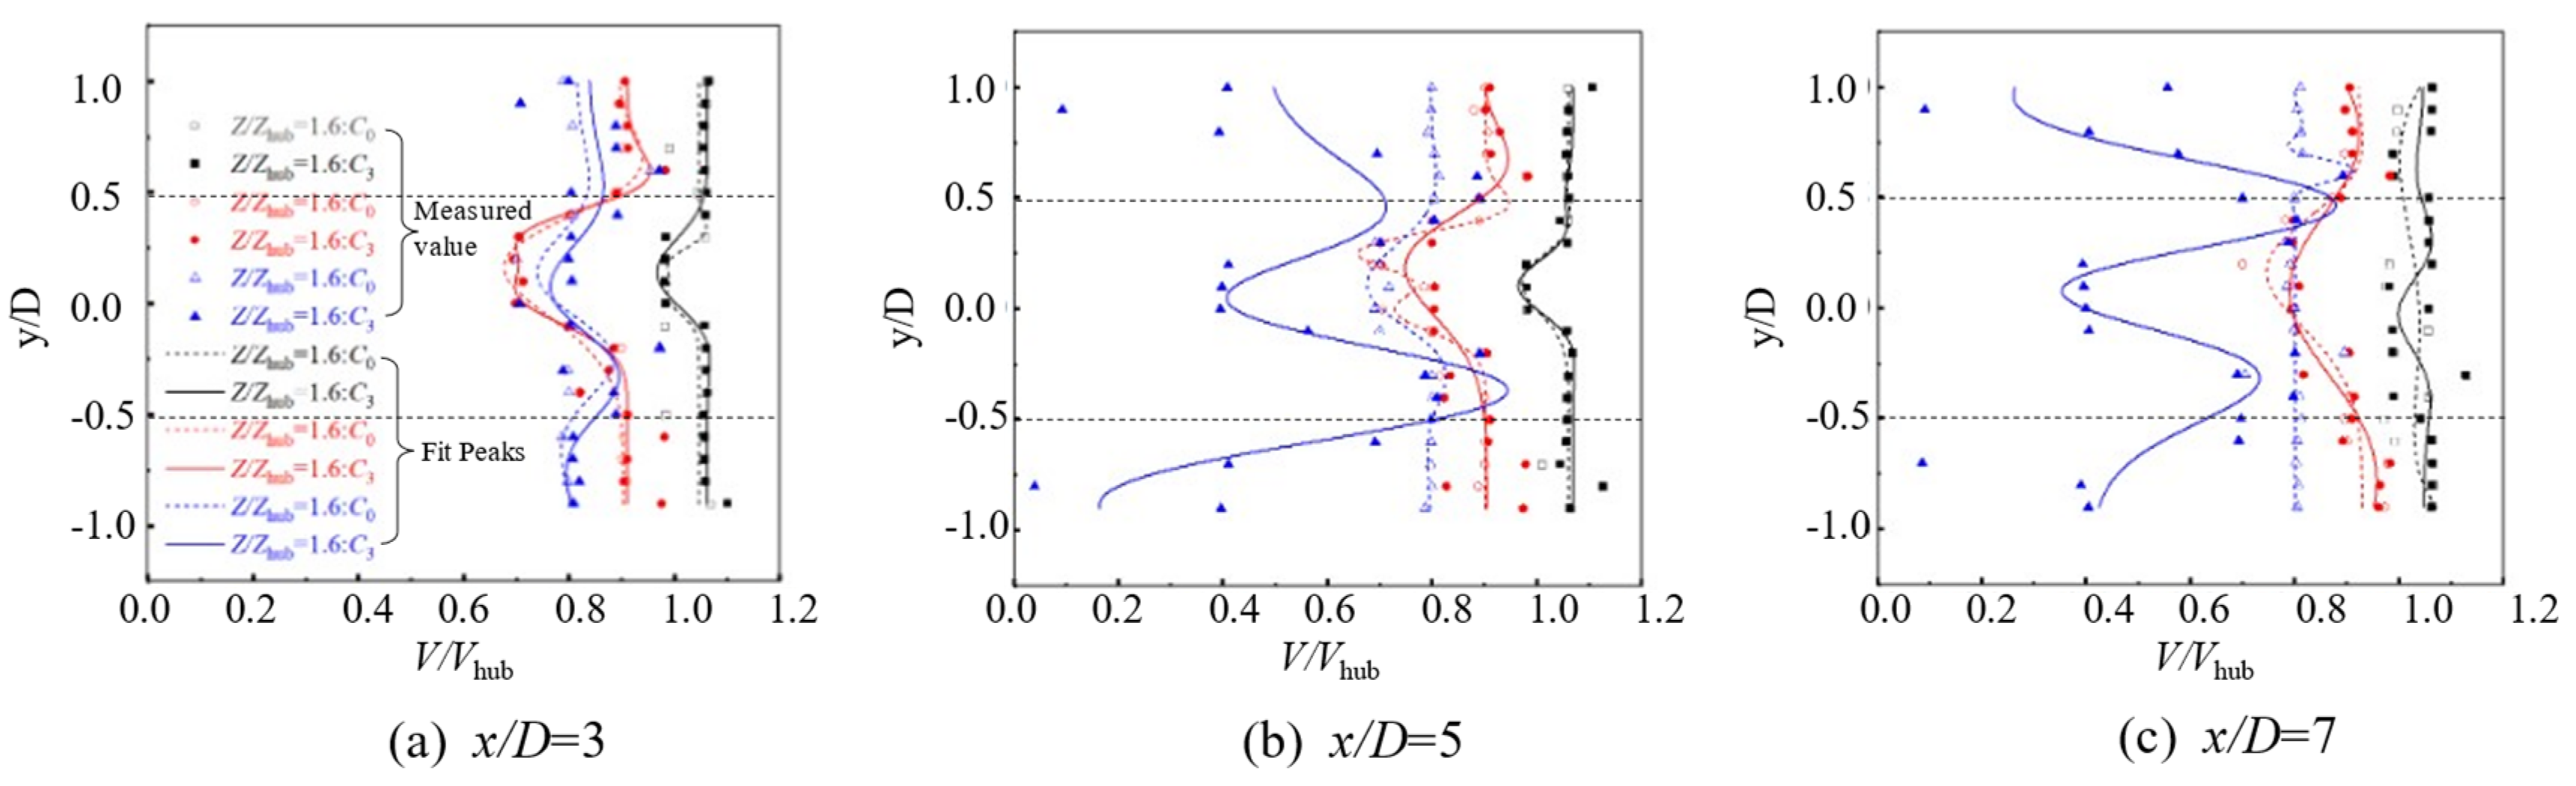
Introducing a small wind turbine downstream of the giant wind turbine significantly reduces wake velocity, with a wind speed deficit of approximately 22%. This effect varies at different heights, with the impact of the small wind turbine becoming more pronounced from the upper to lower positions of the giant wind turbine blades.
(2)
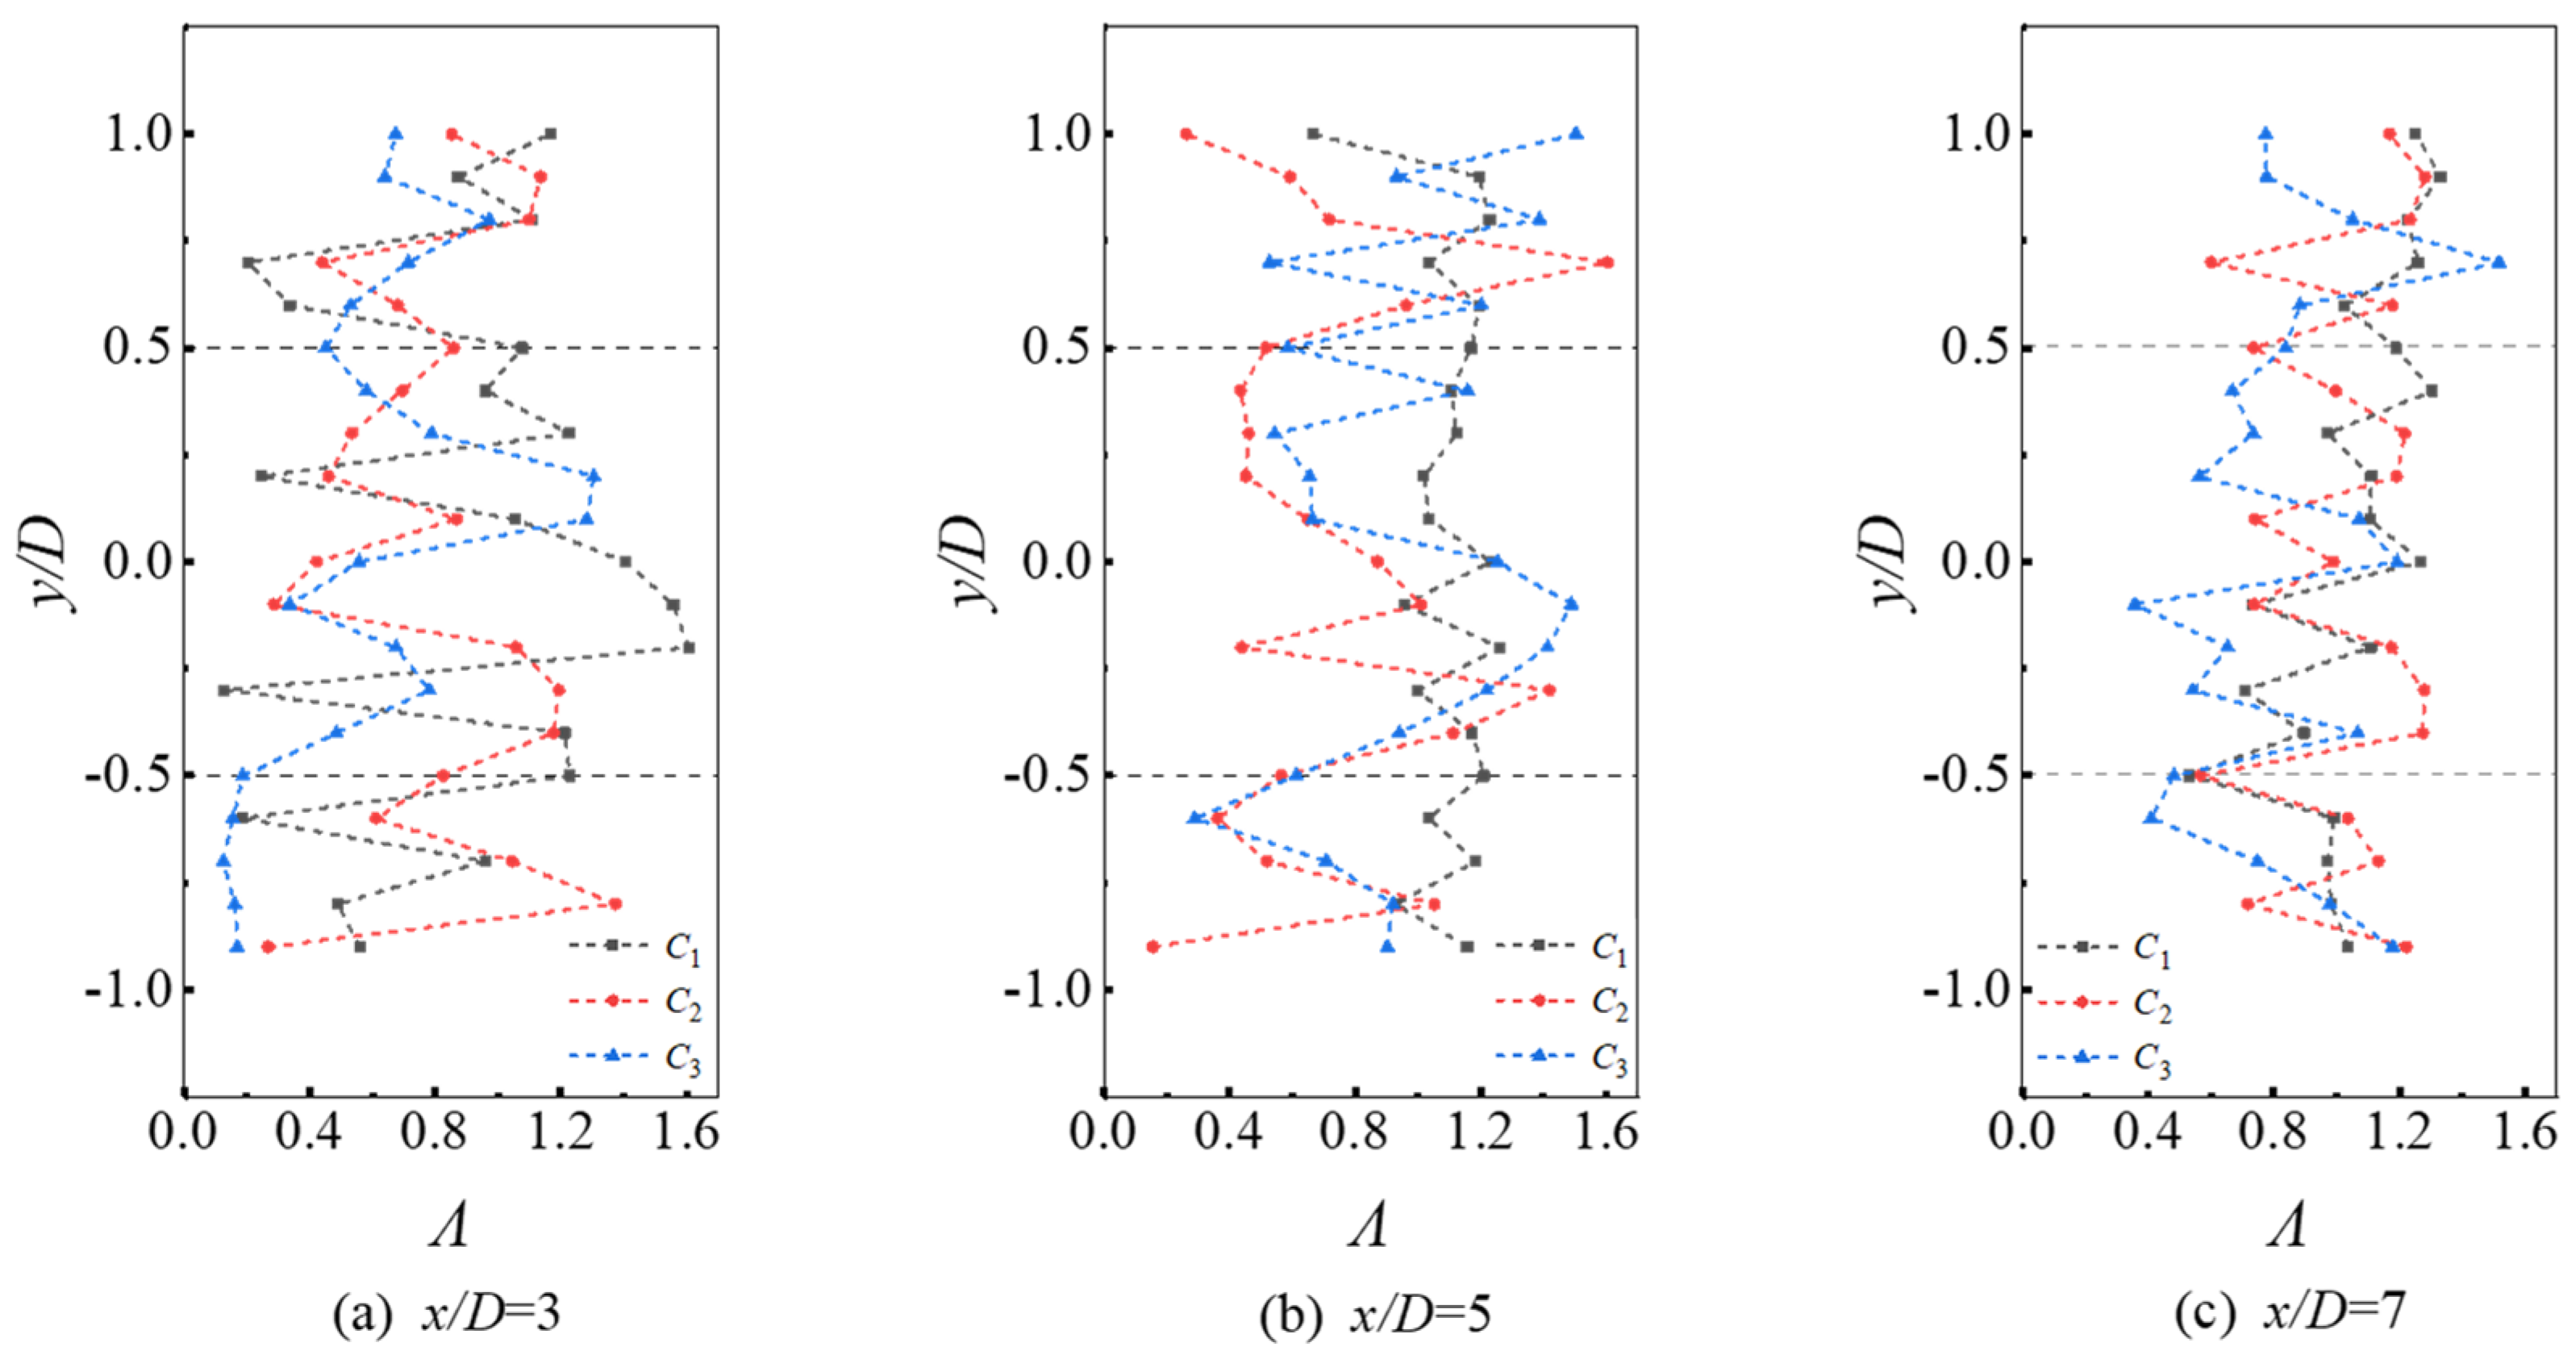
After work is conducted on the wind turbine rotor, the incoming wind causes structural damage to its flow. The extent of this damage is less pronounced in the far wake region, but the addition of the small wind turbine has a notable impact on the turbulence integral scale in the far wake. Under the C3 condition, the turbulence critical scale increases by 2% compared to the C0 condition.
(3)
In the vertical direction, the influence of the operation of the small wind turbine on the wind speed deficit increases gradually from the near wake region to the far wake region, reaching a wind speed deficit of approximately 20% at the 7D position. Simultaneously, a positive impact is observed on the outer region of the small wind turbine rotor, particularly under the C3 condition, where the wind speed at this position increases by 3%.
This experiment contributes to understanding the mixing characteristics of wakes from different-sized wind turbines, offering theoretical insights for optimizing wind farm layouts. In future work, we plan to expand the range of operational conditions by introducing yaw settings for the giant wind turbine. This will allow us to investigate the impact of yawed conditions on wake dynamics in vertically staggered wind farm configurations. Additionally, adjustments to inflow conditions will be explored to study the influence of turbulent winds on inter-row wake interactions within the wind farm.

Author Contributions

Conceptualization, L.Z.; methodology, X.X.; software, W.T.; writing—original draft preparation, Y.Z.; writing—review and editing, Z.F.; supervision, J.F.; project administration, B.Z.; funding acquisition, H.R. All authors have read and agreed to the published version of the manuscript.

Funding

This paper is financially supported by the Key R&D projects of Jilin Provincial Science (20200403141SF) and the Technology Project of Longyuan (Beijing) New Energy Engineering Technology Co., Ltd. (LYH-2021-17).

Institutional Review Board Statement

Not applicable.

Informed Consent Statement

Not applicable.

Data Availability Statement

The data presented in this study are available on request from the corresponding author.

Acknowledgments

The authors extend their profound gratitude to the Key Laboratory for Atmospheric Physics and Pollution Control of the National Environmental Protection in China. Their expertise and support in the development and maintenance of this essential tool have greatly facilitated our research.

Conflicts of Interest

Author Jiangzhe Feng, Huaihui Ren and Bo Zhang were employed by the company Longyuan (Beijing) New Energy Engineering Technology Co., Ltd. Author Wenxin Tian was employed by the company National Environmental Protection Research Institute for Electric Power Co., Ltd., State Environmental Protection Key Laboratory of Atmospheric Physical Modeling and Pollution Control. The remaining authors declare that the research was conducted in the absence of any commercial or financial relationships that could be construed as a potential conflict of interest.

Nomenclature

Symbols
Dlarge wind turbine wheel diameter D (mm)
ddiameter of small wind turbine wheel d (mm)
hsmall wind turbine hub height h (mm)
Iuturbulence intensity
Λturbulent integral length
Vhubhub height inflow wind speed (m/s)
Zhubhub height of large wind turbines
τtime interval
Vaverage flow velocity
uinstantaneous wind speed
Tturbulent integration time
ITfree-flow turbulence intensity
IT,Wturbulent intensity of wake effect
mwaller’s Comparison Index
Nnumber of wind turbines
Pwprobability conditions
Xidistance from wind turbine
σstandard deviation
C0All three rows of small wind turbines are not running
C1Small wind turbines in 3D position operating
C2Small wind turbines running in 3D and 5D positions
C3Small wind turbines running in 3D, 5D, and 7D positions

References

  1. Available online: https://www.Nea.Gov.Cn (accessed on 29 January 2024).
  2. International Energy Agency. Electricity Market Report 2023; IEA: Paris, France, 2023. [Google Scholar]
  3. Hwangbo, H.; Johnson, A.L.; Ding, Y. Spline Model for Wake Effect Analysis: Characteristics of a Single Wake and Its Impacts on Wind Turbine Power Generation. IISE Trans. 2018, 50, 112–125. [Google Scholar] [CrossRef]
  4. Tang, H.; Lam, K.-M.; Shum, K.-M.; Li, Y. Wake Effect of a Horizontal Axis Wind Turbine on the Performance of a Downstream Turbine. Energies 2019, 12, 2395. [Google Scholar] [CrossRef]
  5. Yang, M.; Shi, C.; Liu, H. Day-Ahead Wind Power Forecasting Based on the Clustering of Equivalent Power Curves. Energy 2021, 218, 119515. [Google Scholar] [CrossRef]
  6. Shaler, K.; Kecskemety, K.M.; McNamara, J.J. Benchmarking of a Free Vortex Wake Model for Prediction of Wake Interactions. Renew. Energy 2019, 136, 607–620. [Google Scholar] [CrossRef]
  7. Gao, X.; Yang, H.; Lin, L.; Koo, P. Wind Turbine Layout Optimization Using Multi-Population Genetic Algorithm and a Case Study in Hong Kong Offshore. J. Wind Eng. Ind. Aerodyn. 2015, 139, 89–99. [Google Scholar] [CrossRef]
  8. Uchida, T.; Shibuya, K.; Richmond-Navarro, G.; Calderón-Muñoz, W.R. A Wind Tunnel Investigation of Yawed Wind Turbine Wake Impacts on Downwind Wind Turbine Performances and Wind Loads. Wind Eng. 2023, 47, 655–670. [Google Scholar] [CrossRef]
  9. He, R.; Sun, H.; Gao, X.; Yang, H. Wind Tunnel Tests for Wind Turbines: A State-of-the-Art Review. Renew. Sustain. Energy Rev. 2022, 166, 112675. [Google Scholar] [CrossRef]
  10. Fu, S.; Jin, Y.; Zheng, Y.; Chamorro, L.P. Wake and Power Fluctuations of a Model Wind Turbine Subjected to Pitch and Roll Oscillations. Appl. Energy 2019, 253, 113605. [Google Scholar] [CrossRef]
  11. Zhao, L.; Gong, Y.; Gong, F.; Zheng, B.; Wang, J.; Xue, L.; Xue, Y. Study on Mitigation of Wake Interference by Combined Control of Yaw Misalignment and Pitch. J. Mar. Sci. Eng. 2023, 11, 1288. [Google Scholar] [CrossRef]
  12. Heisel, M.; Hong, J.; Guala, M. The Spectral Signature of Wind Turbine Wake Meandering: A Wind Tunnel and Field-scale Study. Wind Energy 2018, 21, 715–731. [Google Scholar] [CrossRef]
  13. Bastankhah, M.; Porté-Agel, F. A New Miniature Wind Turbine for Wind Tunnel Experiments. Part II: Wake Structure and Flow Dynamics. Energies 2017, 10, 923. [Google Scholar] [CrossRef]
  14. Iungo, G.V.; Viola, F.; Camarri, S.; Porté-Agel, F.; Gallaire, F. Linear Stability Analysis of Wind Turbine Wakes Performed on Wind Tunnel Measurements. J. Fluid Mech. 2013, 737, 499–526. [Google Scholar] [CrossRef]
  15. Abraham, A.; Leweke, T. Experimental Investigation of Blade Tip Vortex Behavior in the Wake of Asymmetric Rotors. Exp. Fluids 2023, 64, 109. [Google Scholar] [CrossRef]
  16. Piqué, A.; Miller, M.A.; Hultmark, M. Laboratory Investigation of the near and Intermediate Wake of a Wind Turbine at Very High Reynolds Numbers. Exp. Fluids 2022, 63, 106. [Google Scholar] [CrossRef]
  17. Gao, X.; Zhang, S.; Li, L.; Xu, S.; Chen, Y.; Zhu, X.; Sun, H.; Wang, Y.; Lu, H. Quantification of 3D Spatiotemporal Inhomogeneity for Wake Characteristics with Validations from Field Measurement and Wind Tunnel Test. Energy 2022, 254, 124277. [Google Scholar] [CrossRef]
  18. Van Haaren, R.; Fthenakis, V. GIS-Based Wind Farm Site Selection Using Spatial Multi-Criteria Analysis (SMCA): Evaluating the Case for New York State. Renew. Sustain. Energy Rev. 2011, 15, 3332–3340. [Google Scholar] [CrossRef]
  19. Dou, B.; Guala, M.; Zeng, P.; Lei, L. Experimental Investigation of the Power Performance of a Minimal Wind Turbine Array in an Atmospheric Boundary Layer Wind Tunnel. Energy Convers. Manag. 2019, 196, 906–919. [Google Scholar] [CrossRef]
  20. Talavera, M.; Shu, F. Experimental Study of Turbulence Intensity Influence on Wind Turbine Performance and Wake Recovery in a Low-Speed Wind Tunnel. Renew. Energy 2017, 109, 363–371. [Google Scholar] [CrossRef]
  21. Dai, X.; Xu, D.; Zhang, M.; Stevens, R.J.A.M. A Three-Dimensional Dynamic Mode Decomposition Analysis of Wind Farm Flow Aerodynamics. Renew. Energy 2022, 191, 608–624. [Google Scholar] [CrossRef]
  22. Luo, K.; Yuan, R.; Dong, X.; Wang, J.; Zhang, S.; Fan, J.; Ni, M.; Cen, K. Large-Eddy Simulation and Experimental Study on the Turbulent Wake Flow Characteristics of a Two-Bladed Wind Turbine. Sci. China Technol. Sci. 2017, 60, 1861–1869. [Google Scholar] [CrossRef]
  23. Amin Allah, V.; Shafiei Mayam, M.H. Large Eddy Simulation of Flow around a Single and Two In-Line Horizontal-Axis Wind Turbines. Energy 2017, 121, 533–544. [Google Scholar] [CrossRef]
  24. Meyers, J.; Meneveau, C. Optimal Turbine Spacing in Fully Developed Wind Farm Boundary Layers. Wind Energy 2012, 15, 305–317. [Google Scholar] [CrossRef]
  25. Sun, H.; Yang, H.; Tao, S. Optimization of the Number, Hub Height and Layout of Offshore Wind Turbines. J. Mar. Sci. Eng. 2023, 11, 1566. [Google Scholar] [CrossRef]
  26. Chamorro, L.P.; Tobin, N.; Arndt, R.E.A.; Sotiropoulos, F. Variable-sized Wind Turbines Are a Possibility for Wind Farm Optimization. Wind Energy 2014, 17, 1483–1494. [Google Scholar] [CrossRef]
  27. Ozbay, A. An Experimental Investigation on Wind Turbine Aeromechanics and Wake Interferences among Multiple Wind Turbines. Ph.D. Thesis, Iowa State University, Ames, IA, USA, 2014. [Google Scholar]
  28. Sun, H.; Yang, H. Study on an Innovative Three-Dimensional Wind Turbine Wake Model. Appl. Energy 2018, 226, 483–493. [Google Scholar] [CrossRef]
  29. Wang, L.; Cholette, M.E.; Fu, Y.; Yuan, J.; Zhou, Y.; Tan, A.C.C. Combined Optimization of Continuous Wind Turbine Placement and Variable Hub Height. J. Wind Eng. Ind. Aerodyn. 2018, 180, 136–147. [Google Scholar] [CrossRef]
  30. Vasel-Be-Hagh, A.; Archer, C.L. Wind Farm Hub Height Optimization. Appl. Energy 2017, 195, 905–921. [Google Scholar] [CrossRef]
  31. Chen, J.; Zhang, Y.; Xu, Z.; Li, C. Flow Characteristics Analysis and Power Comparison for Two Novel Types of Vertically Staggered Wind Farms. Energy 2023, 263, 126141. [Google Scholar] [CrossRef]
  32. Xu, X.; Hu, S.; Shao, H.; Shi, P.; Li, R.; Li, D. A Spatio-Temporal Forecasting Model Using Optimally Weighted Graph Convolutional Network and Gated Recurrent Unit for Wind Speed of Different Sites Distributed in an Offshore Wind Farm. Energy 2023, 284, 128565. [Google Scholar] [CrossRef]
  33. Gajendran, M.K.; Kabir, I.F.S.A.; Vadivelu, S.; Ng, E.Y.K. Machine Learning-Based Approach to Wind Turbine Wake Prediction under Yawed Conditions. J. Mar. Sci. Eng. 2023, 11, 2111. [Google Scholar] [CrossRef]
  34. Xu, X.; Hu, S.; Shi, P.; Shao, H.; Li, R.; Li, Z. Natural Phase Space Reconstruction-Based Broad Learning System for Short-Term Wind Speed Prediction: Case Studies of an Offshore Wind Farm. Energy 2023, 262, 125342. [Google Scholar] [CrossRef]
  35. Qin, S.; Liu, D. Distribution Characteristics of Wind Speed Relative Volatility and Its Influence on Output Power. J. Mar. Sci. Eng. 2023, 11, 967. [Google Scholar] [CrossRef]
  36. Stiperski, I.; Calaf, M. Generalizing Monin-Obukhov Similarity Theory (1954) for Complex Atmospheric Turbulence. Phys. Rev. Lett. 2023, 130, 124001. [Google Scholar] [CrossRef]
  37. Yang, W.; Yu, M.; Yan, B.; Huang, G.; Yang, Q.; Zhang, S.; Hong, T.; Zhou, X.; Deng, X. Wind Tunnel Tests of Wake Characteristics for a Scaled Wind Turbine Model Based on Dynamic Similarity. Energies 2022, 15, 6165. [Google Scholar] [CrossRef]
  38. Malcolm, D.J.; Hansen, A.C. WindPACT Turbine Rotor Design Study: June 2000–June 2002 (Revised); National Renewable Energy Lab.: Golden, CO, USA, 2006. [Google Scholar]
  39. Zhao, X.; Hu, T.; Zhang, L.; Liu, Z.; Wang, S.; Tian, W.; Yang, Z.; Guo, Y. Experimental Study on the Characteristics of Wind Turbine Wake Field Considering Yaw Conditions. Energy Sci. Eng. 2021, 9, 2333–2341. [Google Scholar] [CrossRef]
  40. Liu, H.; Hayat, I.; Jin, Y.; Chamorro, L. On the Evolution of the Integral Time Scale within Wind Farms. Energies 2018, 11, 93. [Google Scholar] [CrossRef]
  41. De Zorzi, P.; Belli, M.; Barbizzi, S.; Menegon, S.; Deluisa, A. A Practical Approach to Assessment of Sampling Uncertainty. In Measurement Uncertainty in Chemical Analysis; Springer: Berlin/Heidelberg, Germany, 2003; pp. 131–137. [Google Scholar]
  42. Markfort, C.D.; Zhang, W.; Porté-Agel, F. Turbulent Flow and Scalar Transport through and over Aligned and Staggered Wind Farms. J. Turbul. 2012, 13, N33. [Google Scholar] [CrossRef]
  43. Tronaas Frandsen, S. Turbulence and Turbulence Generated Structural Loading in Wind Turbine Clusters. Ph.D. Thesis, Technical University of Denmark, Kongens Lyngby, Denmark, 2007. [Google Scholar]
  44. Pei, C.; Ma, C.; Wang, J.; Chen, X.; Chen, F. Influence of Turbulence Integral Length Scale on Aerostatic Coefficients of Bridge Sections. Adv. Struct. Eng. 2021, 24, 1510–1525. [Google Scholar] [CrossRef]
  45. Zhou, Y.; Zhou, A.; Sun, D.; Qiang, X.; Feng, S. Development of Differential Image Motion LiDAR for Profiling Optical Turbulence. Infrared Laser Eng. 2016, 45, 1130001. [Google Scholar] [CrossRef]
  46. He, X.; Luo, L.-S. Theory of the Lattice Boltzmann Method: From the Boltzmann Equation to the Lattice Boltzmann Equation. Phys. Rev. E 1997, 56, 6811–6817. [Google Scholar] [CrossRef]
Figure 1. (a) Photographs of the entrance to the experimental section of the wind tunnel and the model wind turbine; (b) schematic diagram of the experimental wind turbine and the arrangement of measurement points, where the point (x, y) = (0, 0) is the origin of the coordinate system.
Jmse 12 00434 g001
Figure 2. Turbulent boundary layer incoming flow conditions.
Jmse 12 00434 g002
Figure 3. Time domain wind speed distribution in the wake area for different working conditions. (ac), (df), and (gi) denote the time-domain wind speeds at positions 3, 5, and 7D for the three working conditions of C1, C2, and C3, respectively.
Jmse 12 00434 g003aJmse 12 00434 g003b
Figure 4. Wind speed deficit under different working conditions. (ad) indicate the four working conditions C0C3, respectively.
Jmse 12 00434 g004
Figure 5. Time domain distribution of horizontal turbulence intensity. (ac), (df), and (gi) denote the turbulence intensity in the time domain at positions 3, 5, and 7D for C1, C2, and C3, respectively.
Jmse 12 00434 g005aJmse 12 00434 g005b
Figure 6. Turbulence intensity at different positions in the horizontal direction.
Jmse 12 00434 g006
Figure 7. Horizontal turbulence integration length.
Jmse 12 00434 g007
Figure 8. Comparison of wind speed at different positions under C0 and C3 working conditions.
Jmse 12 00434 g008
Figure 9. Power spectrum density at different height positions of large wind turbines, (ac) are upper blade tip heights, (df) are hub center heights, and (gi) are lower blade tip height positions.
Jmse 12 00434 g009
Figure 10. Trend of wind speed evolution in the vertical time domain.
Jmse 12 00434 g010
Figure 11. Wind profiles at different locations of measurement points at 7D.
Jmse 12 00434 g011
Figure 12. Turbulence intensity at different locations at 7D in the vertical direction.
Jmse 12 00434 g012
Figure 13. Power spectrum analysis at hub center position: (a,b) are the operating conditions without small wind turbines; (c,d) are the operating conditions with three rows of small wind turbines.
Jmse 12 00434 g013
Table 1. Wind turbine parameters in wind tunnel experiments.
ParameterValue
Large wind turbine wheel diameter D (mm)1000
Large wind turbine hub height Zhub (mm)1200
Diameter of small wind turbine wheel d (mm)340
Small wind turbine hub height h (mm)300
Inlet wind speed (m/s)7
Table 2. Working condition settings.
Working ConditionCodeSmall Wind Turbine Position
Case0C0All three rows of small wind turbines are not running
Case1C1Small wind turbines in 3D position operating
Case2C2Small wind turbines running in 3D and 5D positions
Case3C3Small wind turbines running in 3D, 5D and 7D position
Disclaimer/Publisher’s Note: The statements, opinions and data contained in all publications are solely those of the individual author(s) and contributor(s) and not of MDPI and/or the editor(s). MDPI and/or the editor(s) disclaim responsibility for any injury to people or property resulting from any ideas, methods, instructions or products referred to in the content.

