1. Introduction
Beach nourishment is one of the most popular methods of shore protection used around the world. In order to replenish the natural sand that has been eroded from the beach, suitable sand must be found [
1,
2]. Additionally, the quantity of sand required for beach nourishment must be estimated [
3]. Investigations on the distribution of sand size reveal information about the sand’s origin, depositional environment, and transportation background [
4,
5,
6,
7,
8,
9]. Furthermore, sand size analysis is a crucial technique for categorizing materials and sedimentary environments [
10,
11,
12]. This technique may also be used to forecast how long beach sand will last and how it will respond to storms [
8,
12,
13,
14,
15,
16]. Measurements of the main sand size characteristics, primarily the median grain size (D
50) and the sorting (distribution of sizes around the average, σ), are part of the analysis conducted to investigate coastal processes [
17,
18,
19,
20].
The beach nourishment coordinator is responsible for determining the best location for the sand and for performing quality control on the dumping site. Prior to the sand being pumped to the beach, procedures to determine the sand size parameters must be performed on board the dredger [
21]. Obviously, the sand size parameters must be determined with the highest degree of accuracy. The formulas developed by Folk and Ward [
22,
23] based on Krumbein’s earlier discussions are typically used [
24]. Therefore, accuracy surveys could be performed by analyzing several samples from different locations, conducting multiple analyses of samples taken at the same location, or conducting multiple analyses of the same sample. Researchers have examined and contrasted several kinds of techniques for analyzing sand size particles, including image analysis [
25,
26], sieving [
25,
27,
28], camsizer [
29], microtrac [
30], laser granulometry and sedigraph [
31], laser diffraction [
32], and laser grain size with pipette and sieve [
33]. When carrying out beach nourishment, the sieving method is the most often utilized analysis for determining the essential sand size parameters on board a dredger. There are several limitations on the examination of sand size inside a dredger ship: a restricted workspace, material requirements, an unstable energy source, and the travel time between the borrow and dump locations. As a result, when being performed on board a dredger, the sieving technique must usually be selected based on how economical, fast, and accessible it is. For instance, using a mechanical shaker on board the ship is challenging due to the complications of boarding the dredger in the open sea with cat ladders [
34]. Consequently, the hand-shaking method with small sieves (10 cm diameter as opposed to the typically employed 20 cm) is generally used on board dredgers to analyze the sand grain size. The influence of the hand-shaking method has already been studied by Poullet et al. [
35]. The muffle weight is usually between 70 and 90 kg and its dimensions are approximately 90 × 70 × 60 cm; meanwhile, a common microwave’s weight is 6 kg and its dimensions can be 25 × 45 × 35 cm. In addition to the space constraint, the aforementioned issues also explain why a microwave is employed to dry the sand samples in these circumstances instead of a muffle for a 12 h drying period.
When determining sand characteristics, accuracy is vital [
36]. Numerous studies have assessed sifting efficiency in relation to sieving time [
3,
35,
37,
38,
39]. One of the theories was that longer sieving durations would be necessary for finer materials. In fact, the finer the material, the more sieves the sand has to go through, and the longer the grains must pass through smaller pores [
40,
41]. The most important process before sieving to ensure accurate results is sand-sample drying. Sand porosity depends on sand size and the shape of sample grains [
39]. If the sand sample contains some water inside its interstitial spaces, sieving efficiency would be challenged in terms of the sand ineffectively filtering through the sieve meshes. The humidity from the sand could block the mesh pores or create compact sand balls that would form due to the shaking process. Therefore, choosing the correct method to dry the sand sample as far as possible is extremely important since it may have a relevant impact on the determination of the sand size parameters.
When analyses are carried out in a land laboratory, the sand samples are dried on a muffle at a temperature of 110 °C for 12 h according to established methodologies [
3,
37,
39]. This drying process cannot be used on board a dredger laboratory, as mentioned above. The most common methodology for obtaining dry sand to sieve on a dredge is the use of a commercial microwave. The samples usually undergo about 5 min at the highest power level (about 700–800 w) to attempt to completely dry the sand. Sometimes, during that drying process inside the microwave, the sand starts to blow up, causing loss of part of the initial weight of sand by throwing sediment onto the walls and ceiling.
For beach nourishment purposes, some researchers [
34,
36] suggest that errors of up to 10% can be expected and/or admitted. But, how do all the former circumstances influence the results? How big is the error committed? Is it admissible?
Since essential investigations on sand-drying effectiveness with the use of a microwave have not yet been conducted, the aim of this study was to establish the differences between the size parameter results obtained using a muffle during a 12-h sand-drying process and the results using a microwave. Thus, a methodology was developed to quantify the possible errors and obtain the best results. The tests were carried out with several power levels and durations. Moreover, as the sand porosity depends on the medium grain size, this research was carried out with samples from three beaches with different sand sizes in the south of Spain.
2. Materials and Methods
2.1. Study Area
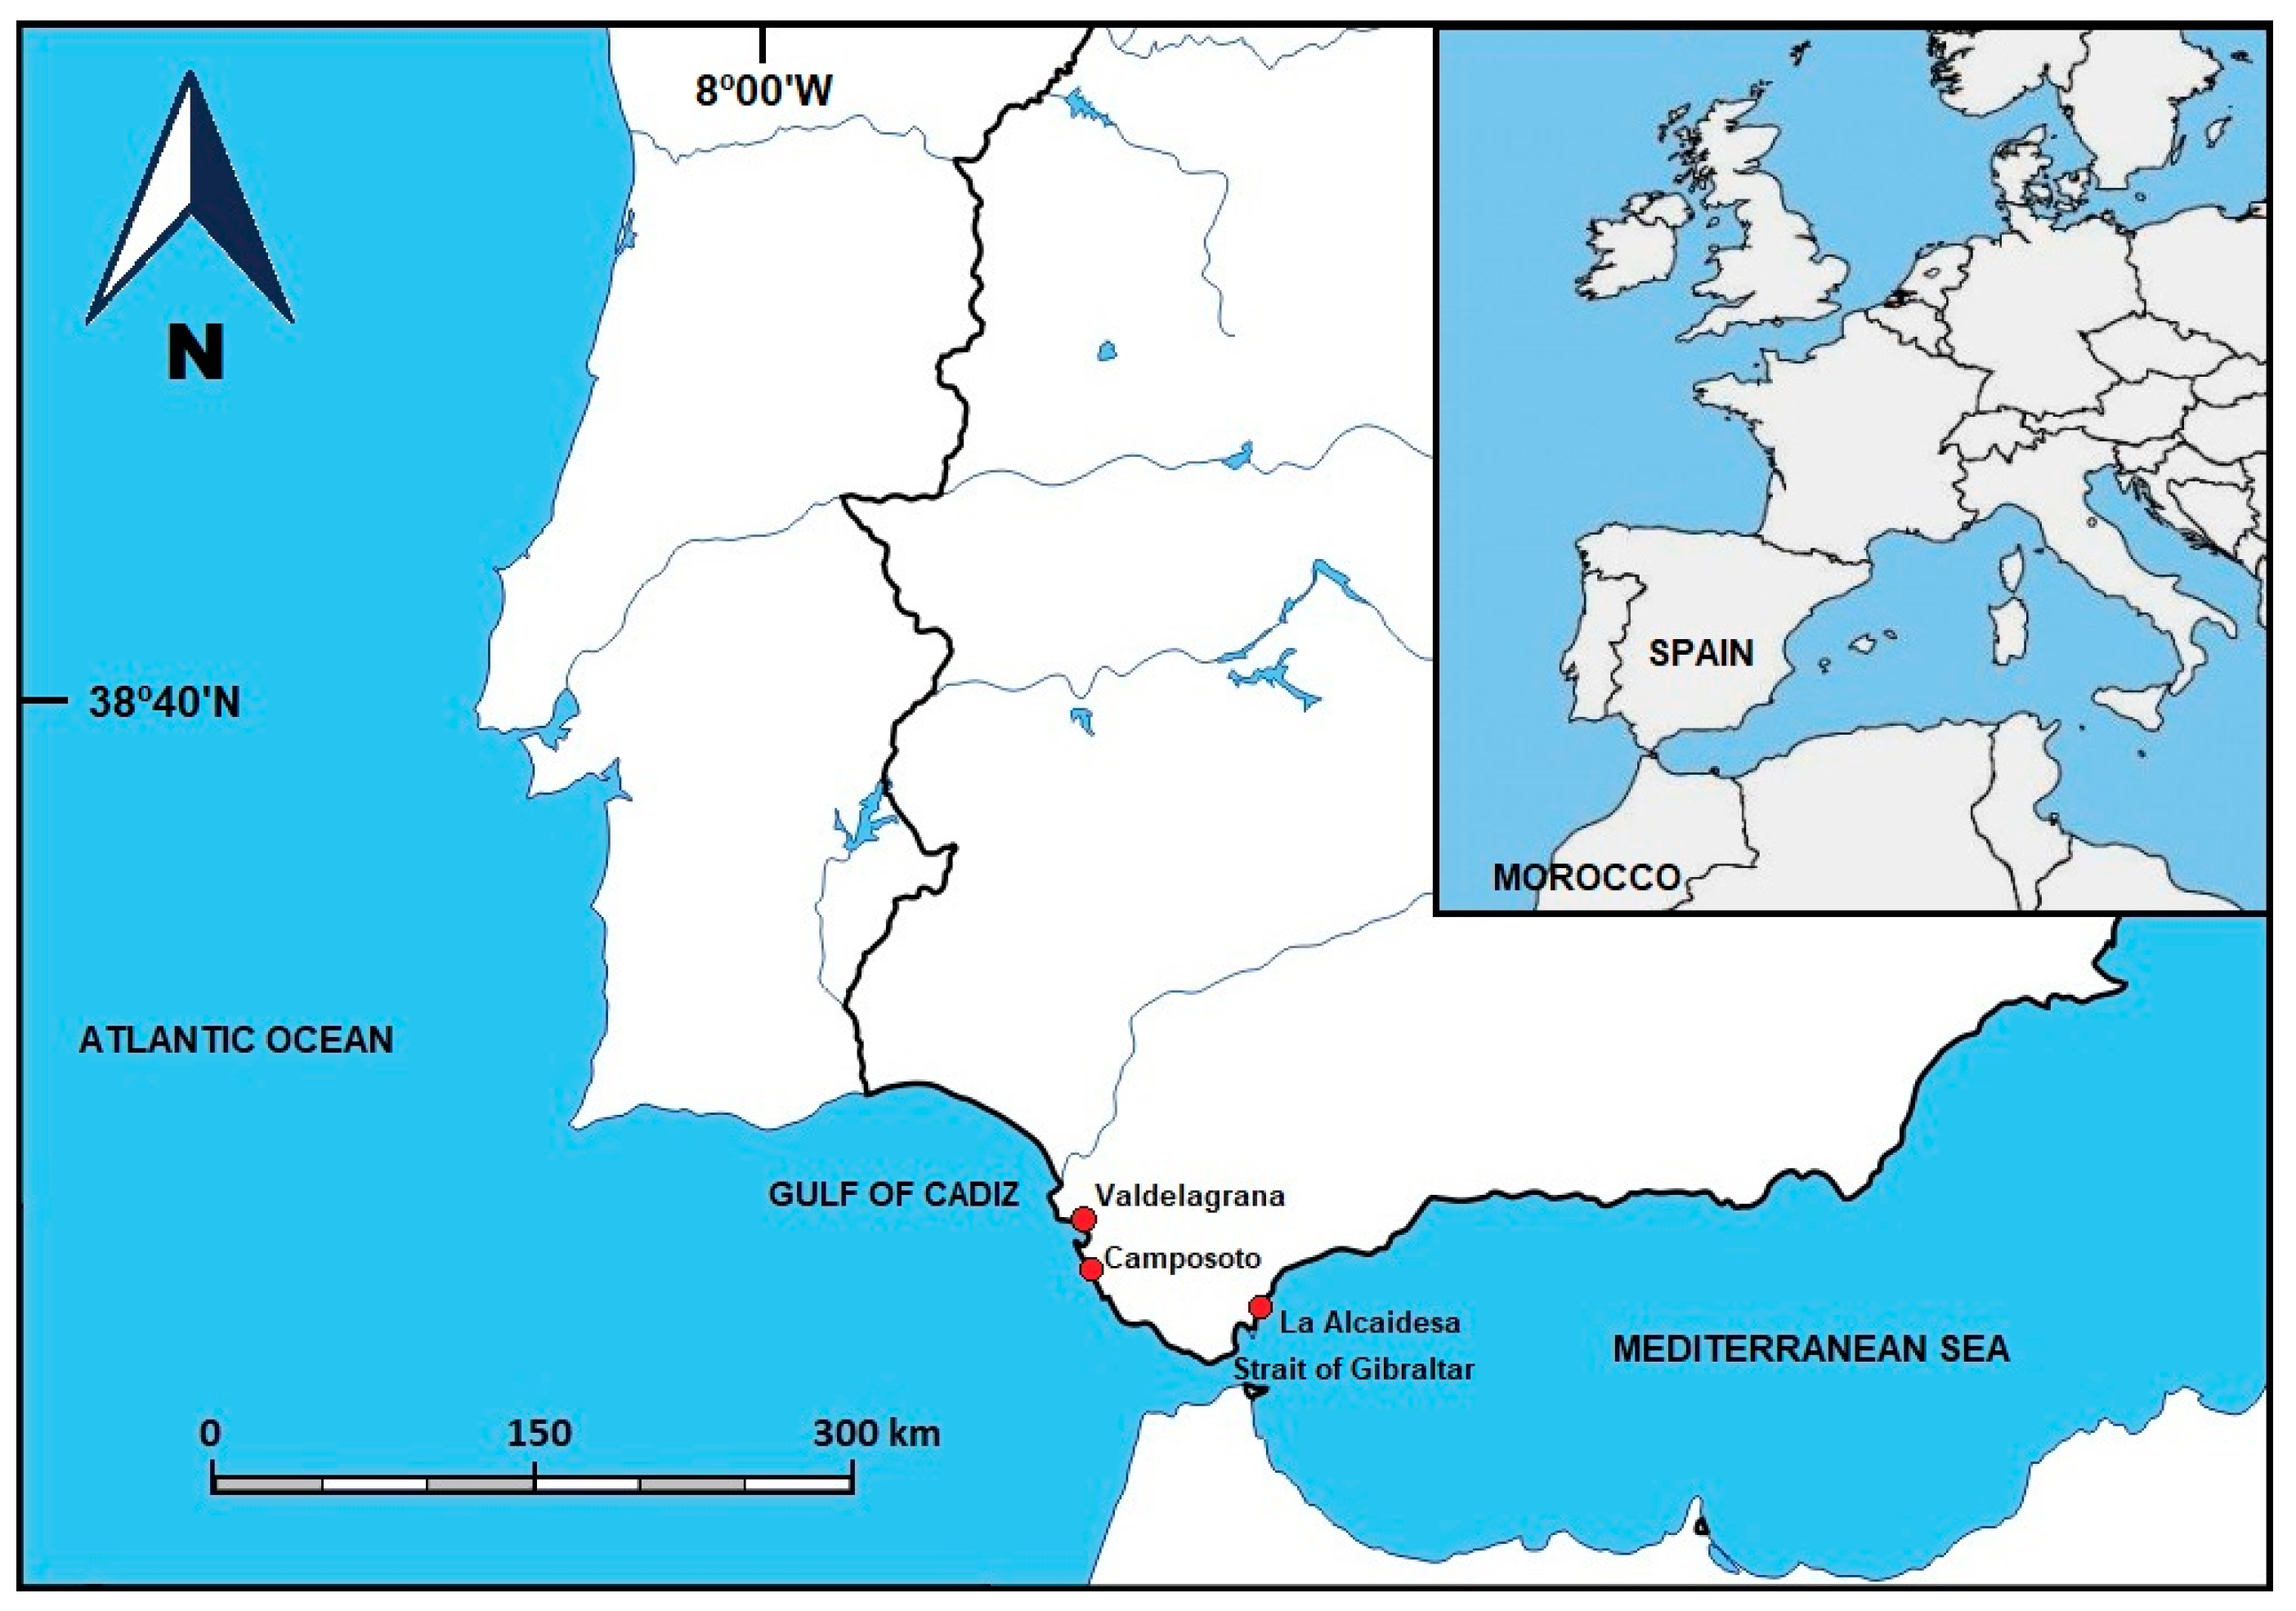
The sand samples analyzed are from three different beaches in the south of Spain. The reason for selecting these particular beaches is their average D
50: 0.11 mm for Valdelagrana beach, 0.21 mm for Camposoto beach, and 0.81 mm for La Alcaidesa beach [
42]. The beaches are located near the Strait of Gibraltar (
Figure 1), with La Alcaidesa situated on the coast of the Mediterranean Sea, whereas Valdelagrana and Camposoto are located on the coast of the Gulf of Cadiz (Atlantic Ocean). The west coast of Cadiz facing the Atlantic Ocean is a mesotidal area, with a tidal range of about 4 m and waves from the W-SW quadrant. A more significant wave (Hs) is expected in the Gulf of Cadiz than on the Mediterranean coast, thus these more energetic events explain why the sand particles are finer.
2.2. Sampling
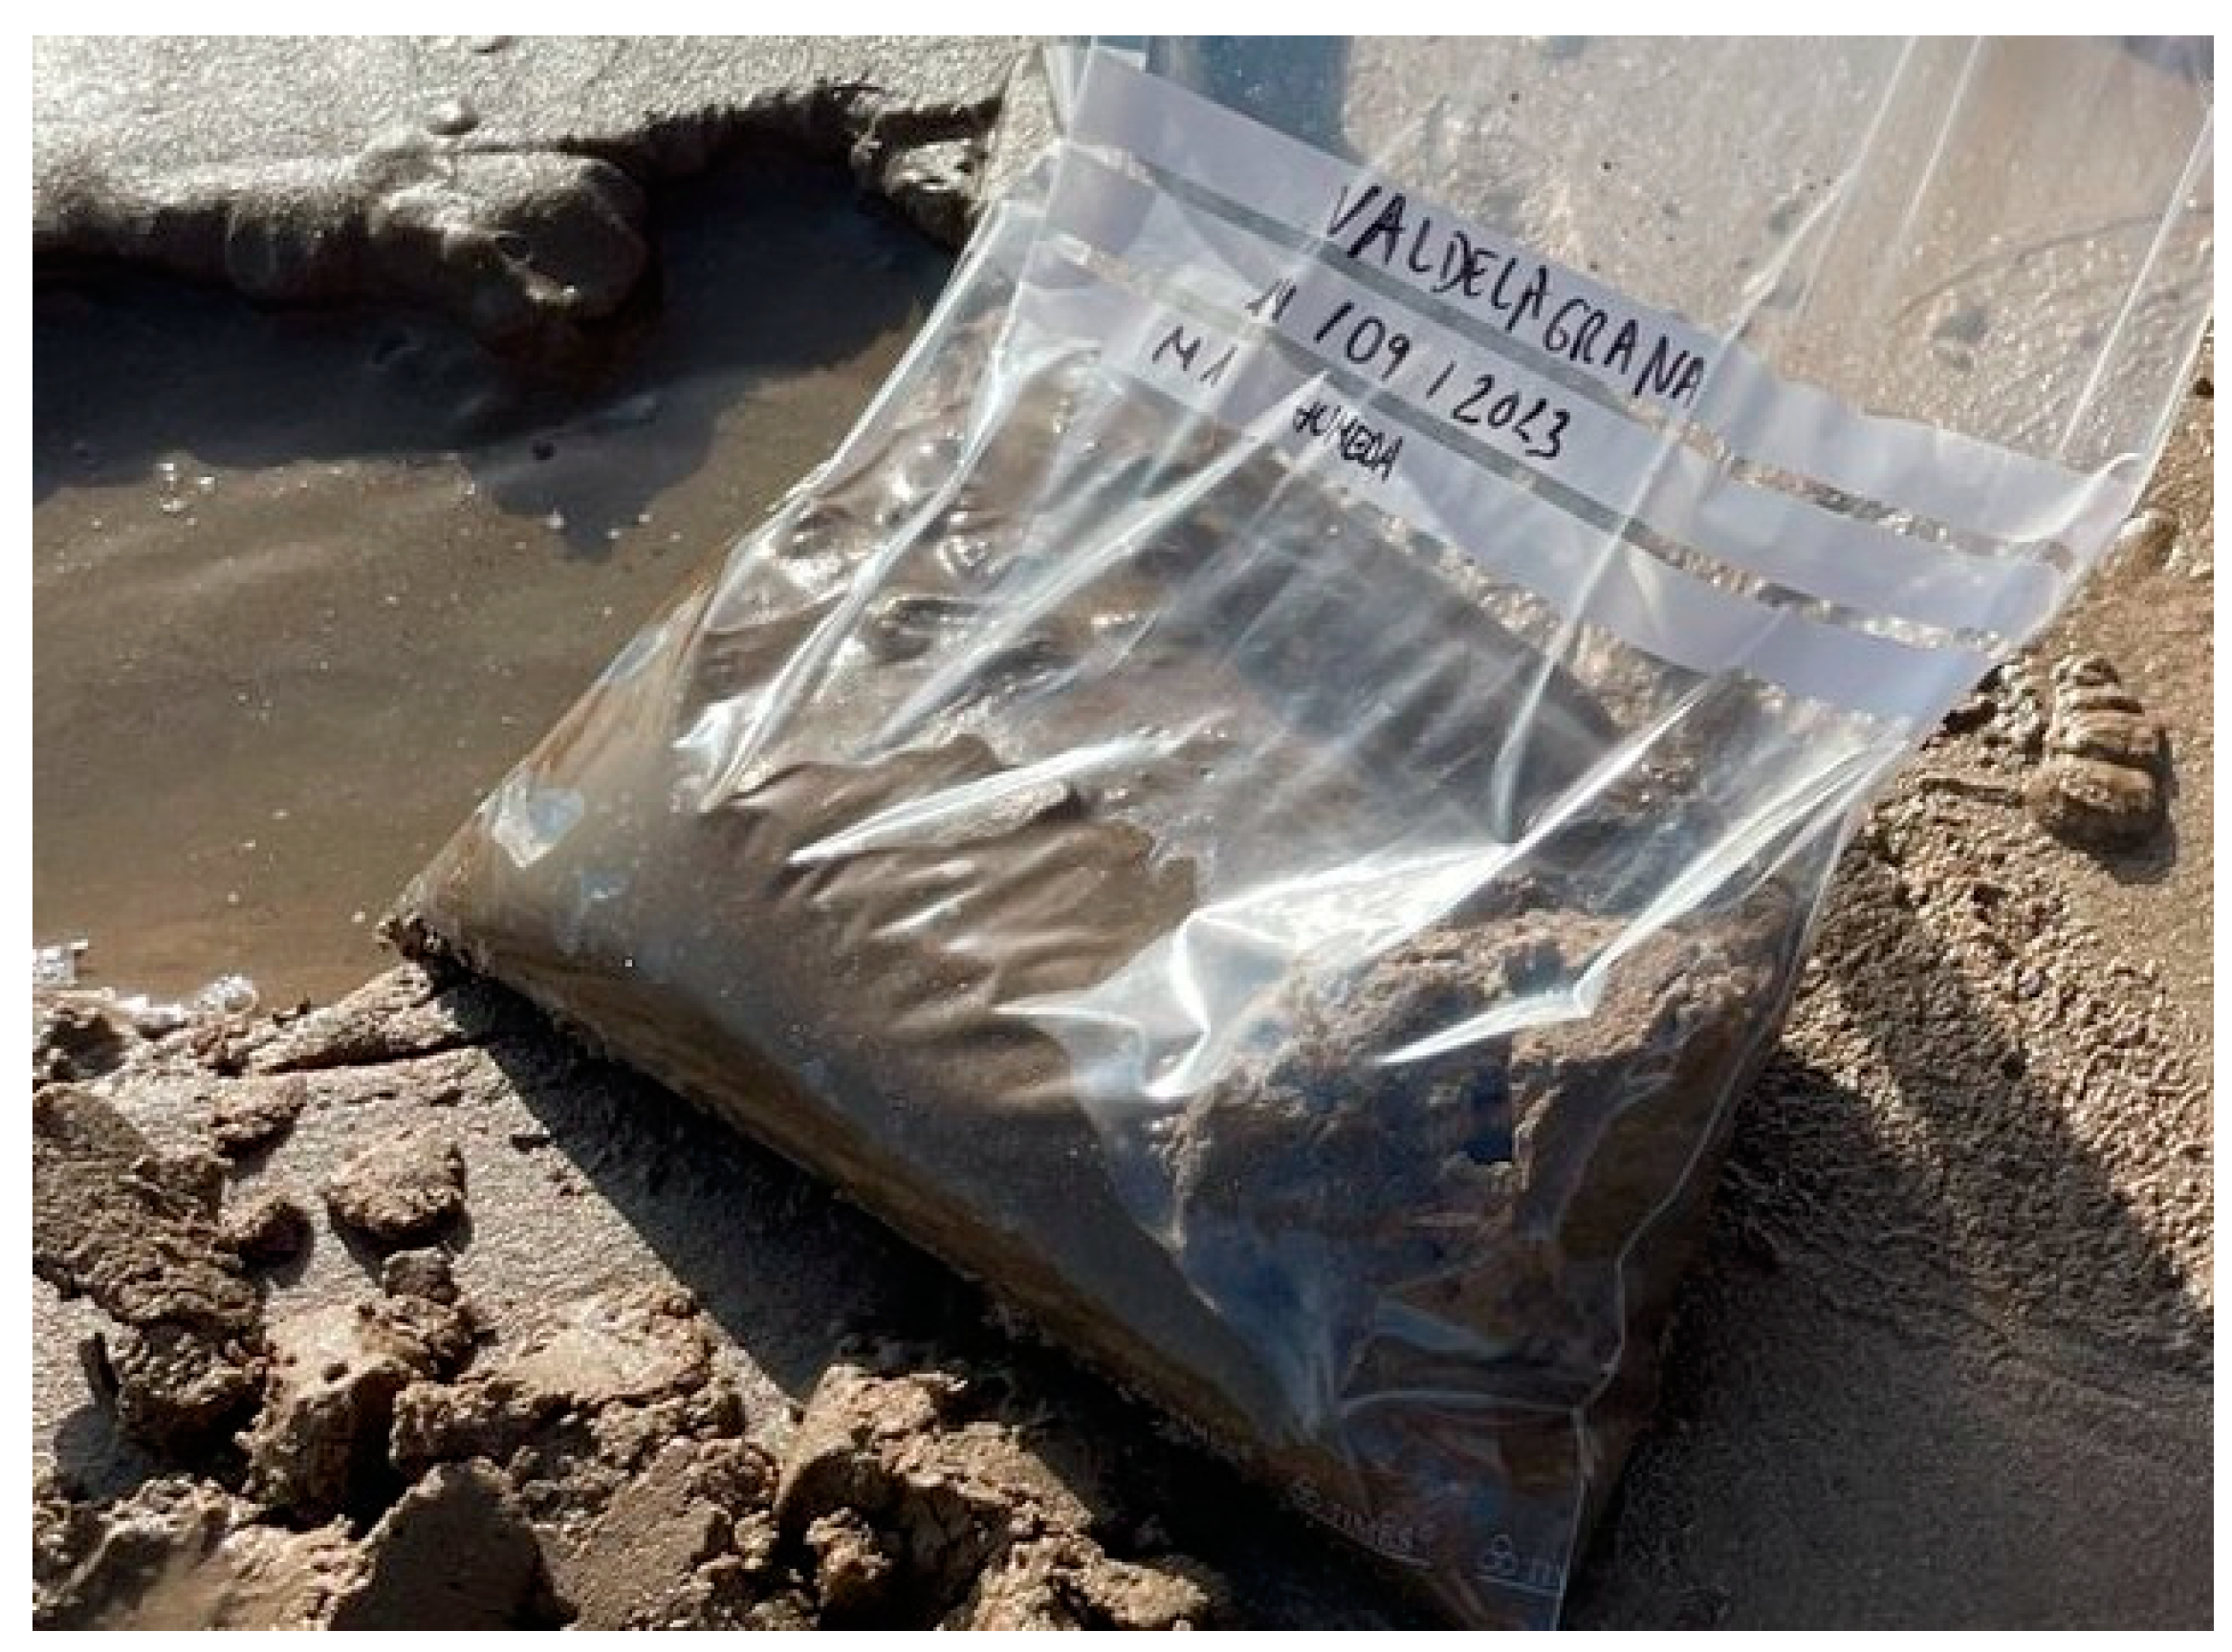
Ten samples were collected in the low-tide zone for each beach. The intention was to simulate wet sand extracted from the borrow site, inside a dredge ship. Every one of the samples contained a mix of sand and water (example in
Figure 2). The weight of each sample was around 800 g. Afterward, each sample was separated into 5 subsamples of about 130 g each (including an excess of 150 g to prevent loss).
2.3. Granulometric Analysis
The usual approach outlined by Syvitski [
37] was used to analyze the size of the sand, with some minor modifications stated by Roman-Sierra et al. [
39]. Below is a summary of the sand-sample analysis methodology.
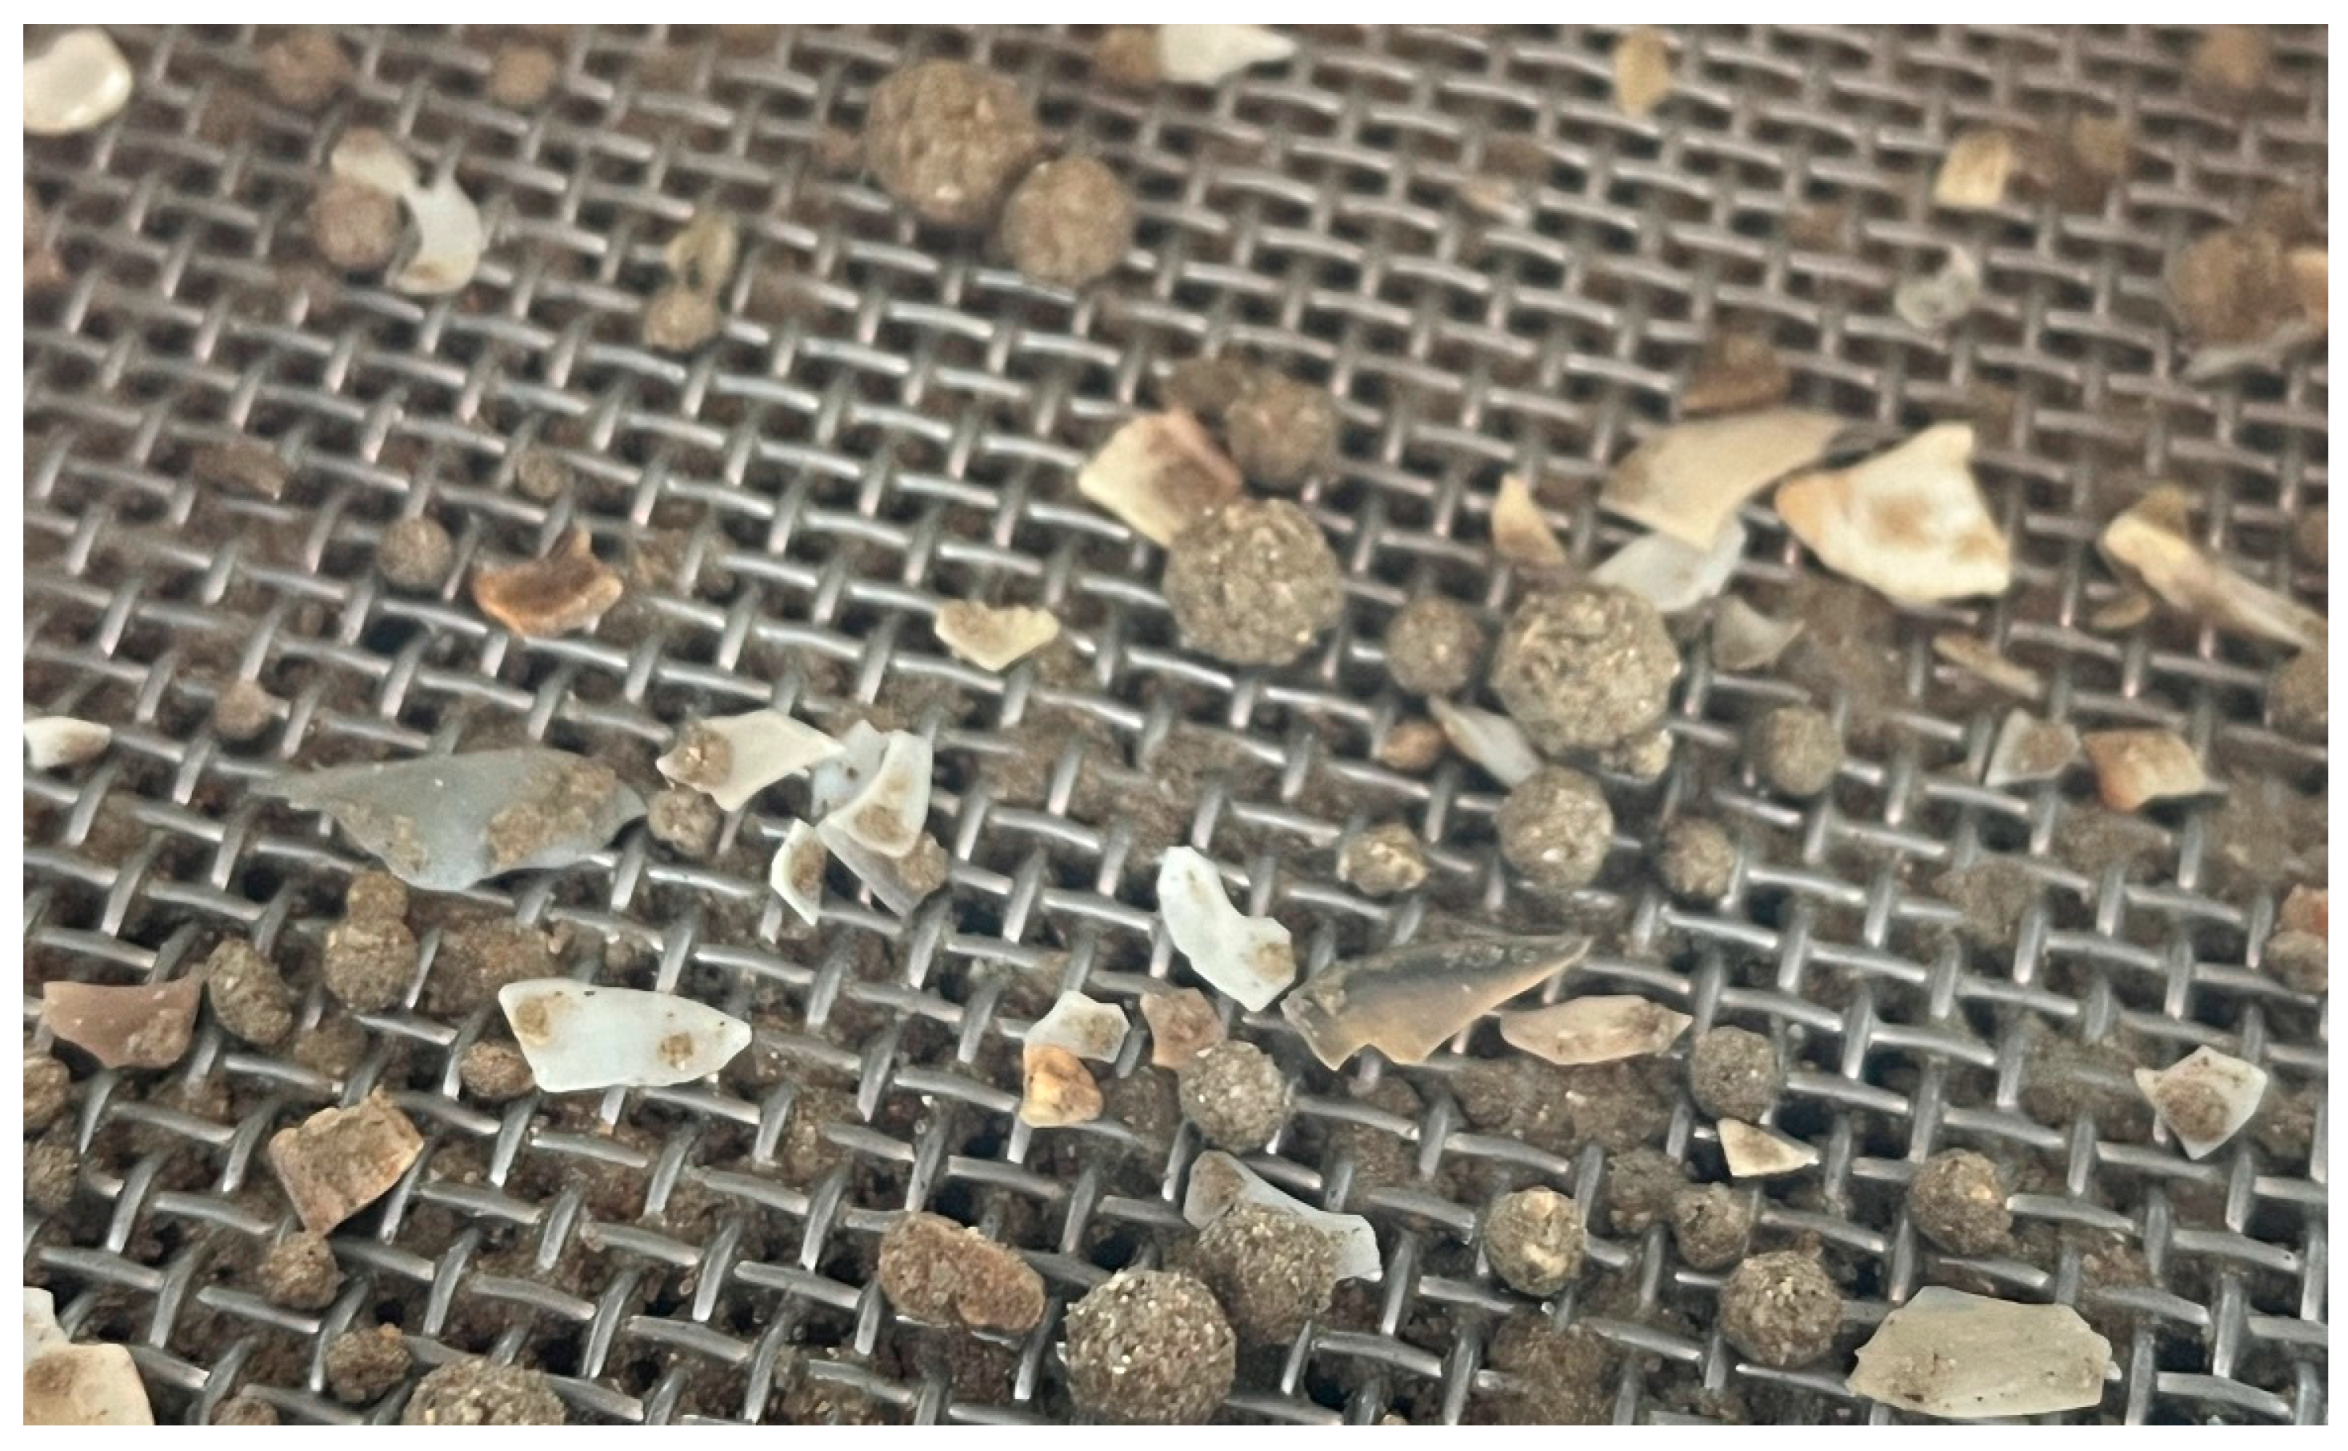
The steps to obtain the sand size parameters consist of drying the sand, sieving, and parameter calculation. Before sieving the samples, the sand must be as dry as possible in order to sift it properly through the meshes. If the sand is not dry enough, the sample could end up compacted into small balls in the sieves (
Figure 3), which prevents sand grains from being correctly sieved. The aforementioned main reason for this research is to determine an accurate microwave drying methodology that could be used on board a dredger for beach nourishment purposes. The following drying procedures were performed to identify the method that provides the most effective results with a microwave, taking muffle drying as the standard and most accurate methodology against which to compare the results.
2.3.1. Muffle Drying Procedure
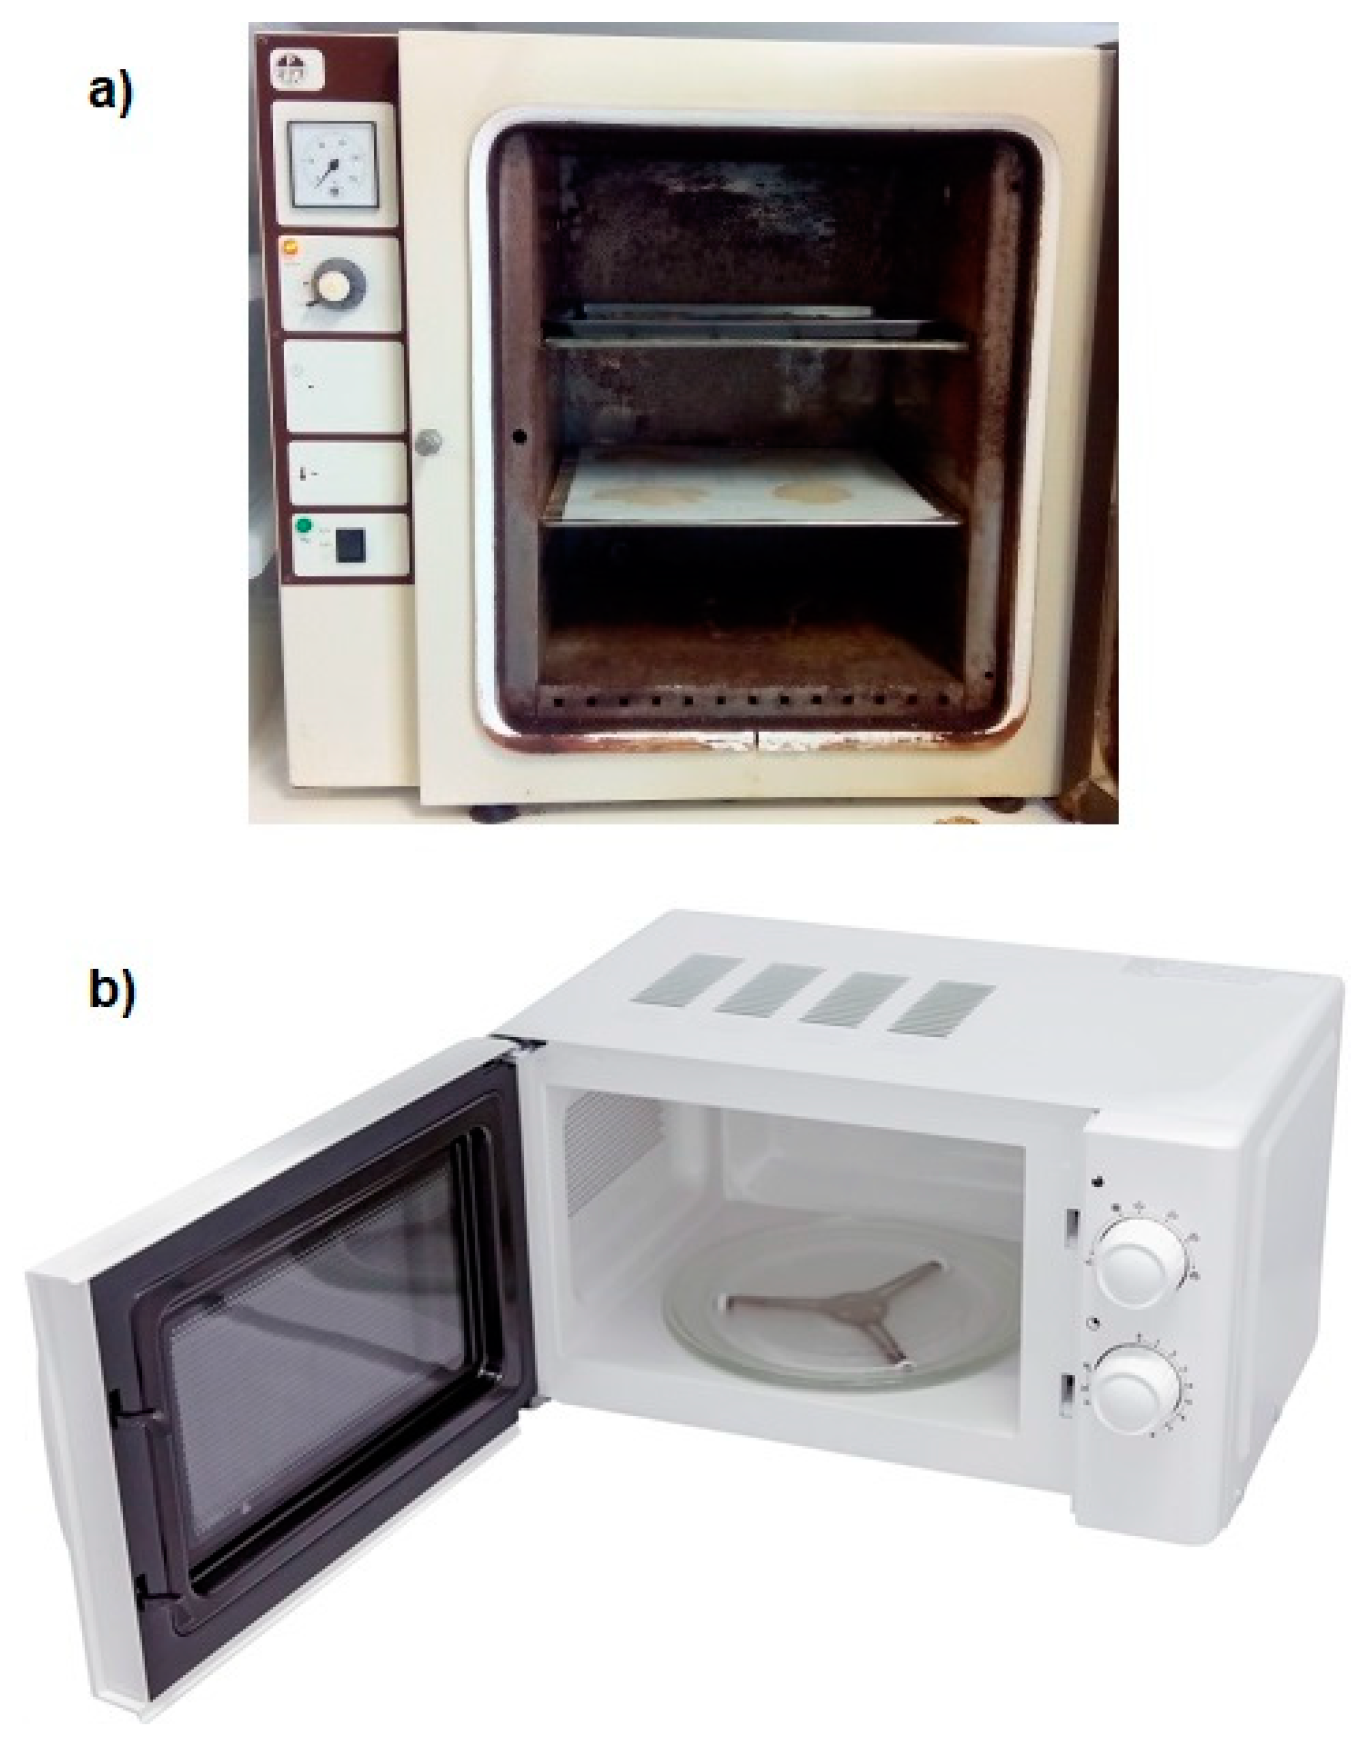
The samples weighing 130 g each were dried in the muffle for 12 h at the laboratory (
Figure 4). This specific weight was chosen to facilitate the passage of the samples through the meshes, since adding a larger volume of sediment could result in their accumulation. Following that, each sample was weighed with a laboratory weighing balance, whose accuracy was within 0.01 g.
2.3.2. Microwave Drying Procedure
The selection criteria for the sand container to be used in the microwave are crucial. The container needs to have walls on the edges but not be too tall, and it must have a wide enough base for the sand to be spread sufficiently (depending on the microwave plate interior size; therefore, the container should be as wide as possible, taking into account the need to spin properly). The container material must be plastic due to its lightness and, obviously, microwave safe. The precision of the used scale was 0.01 g and 230 g was its maximum weight. Therefore, a lightweight sand container was necessary.
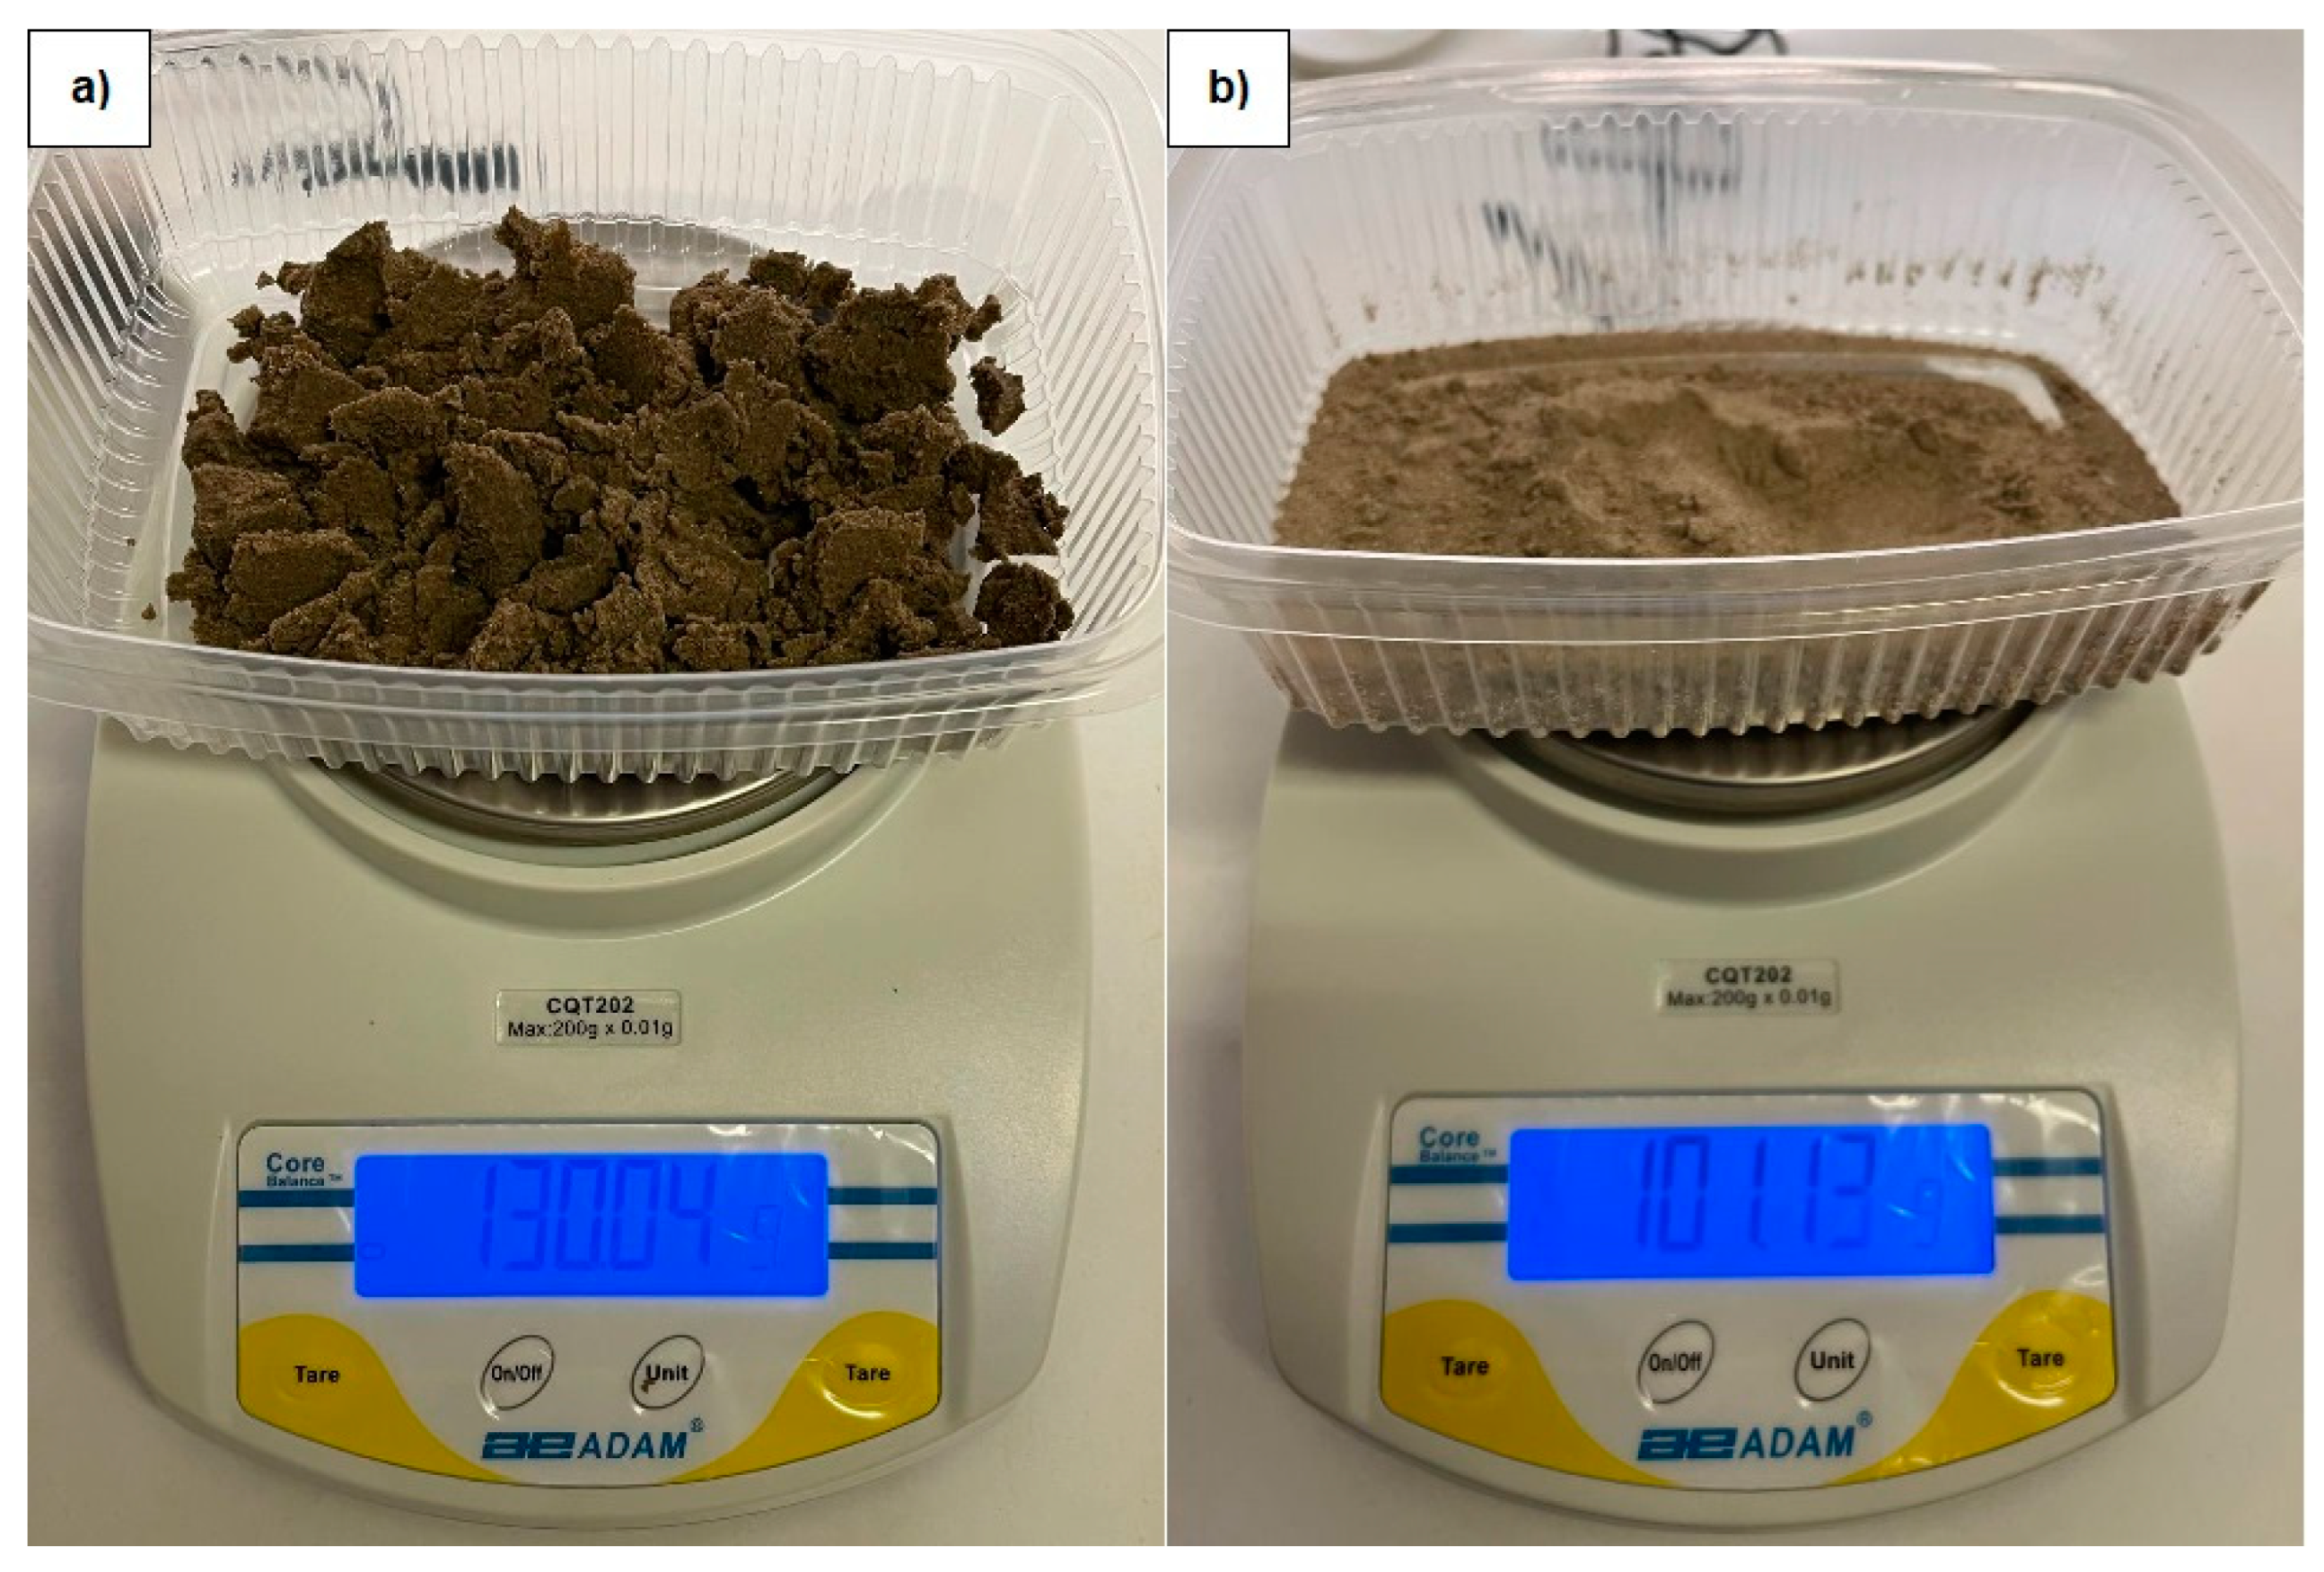
The aim was to obtain a dried sample of about 100 g weight for sieving, as aforementioned in the muffle drying section. First of all, the amount of wet sand that needs to be dried is calculated according to sand porosity and density. Considering that the studied sand was principally composed of quartz (specific density of γ = 2.7 g/mL) [
43] and the sample had a ~40% porosity when filled with seawater (density of γ = 1.025 g/mL), a sample of wet sand weighing 130 g would mathematically result in about 100 g of dry sand. The results of these calculations are shown in
Figure 5a,b. It is critical to take into account the fact that the excess water must be removed from the sample prior to weighing. The excess water can be poured out by overturning the container slightly, or it can be removed with a spoon. Once the 130 g wet sand had been weighed, the sand was completely spread out in the container.
This study tested all the power levels of a conventional microwave, e.g., in this case, 300 w, 462 w, 595 w, and 700 w. The intention was to achieve the fastest way to dry sand at 100% while avoiding grain loss due to explosions that can occur during the microwave drying procedure.
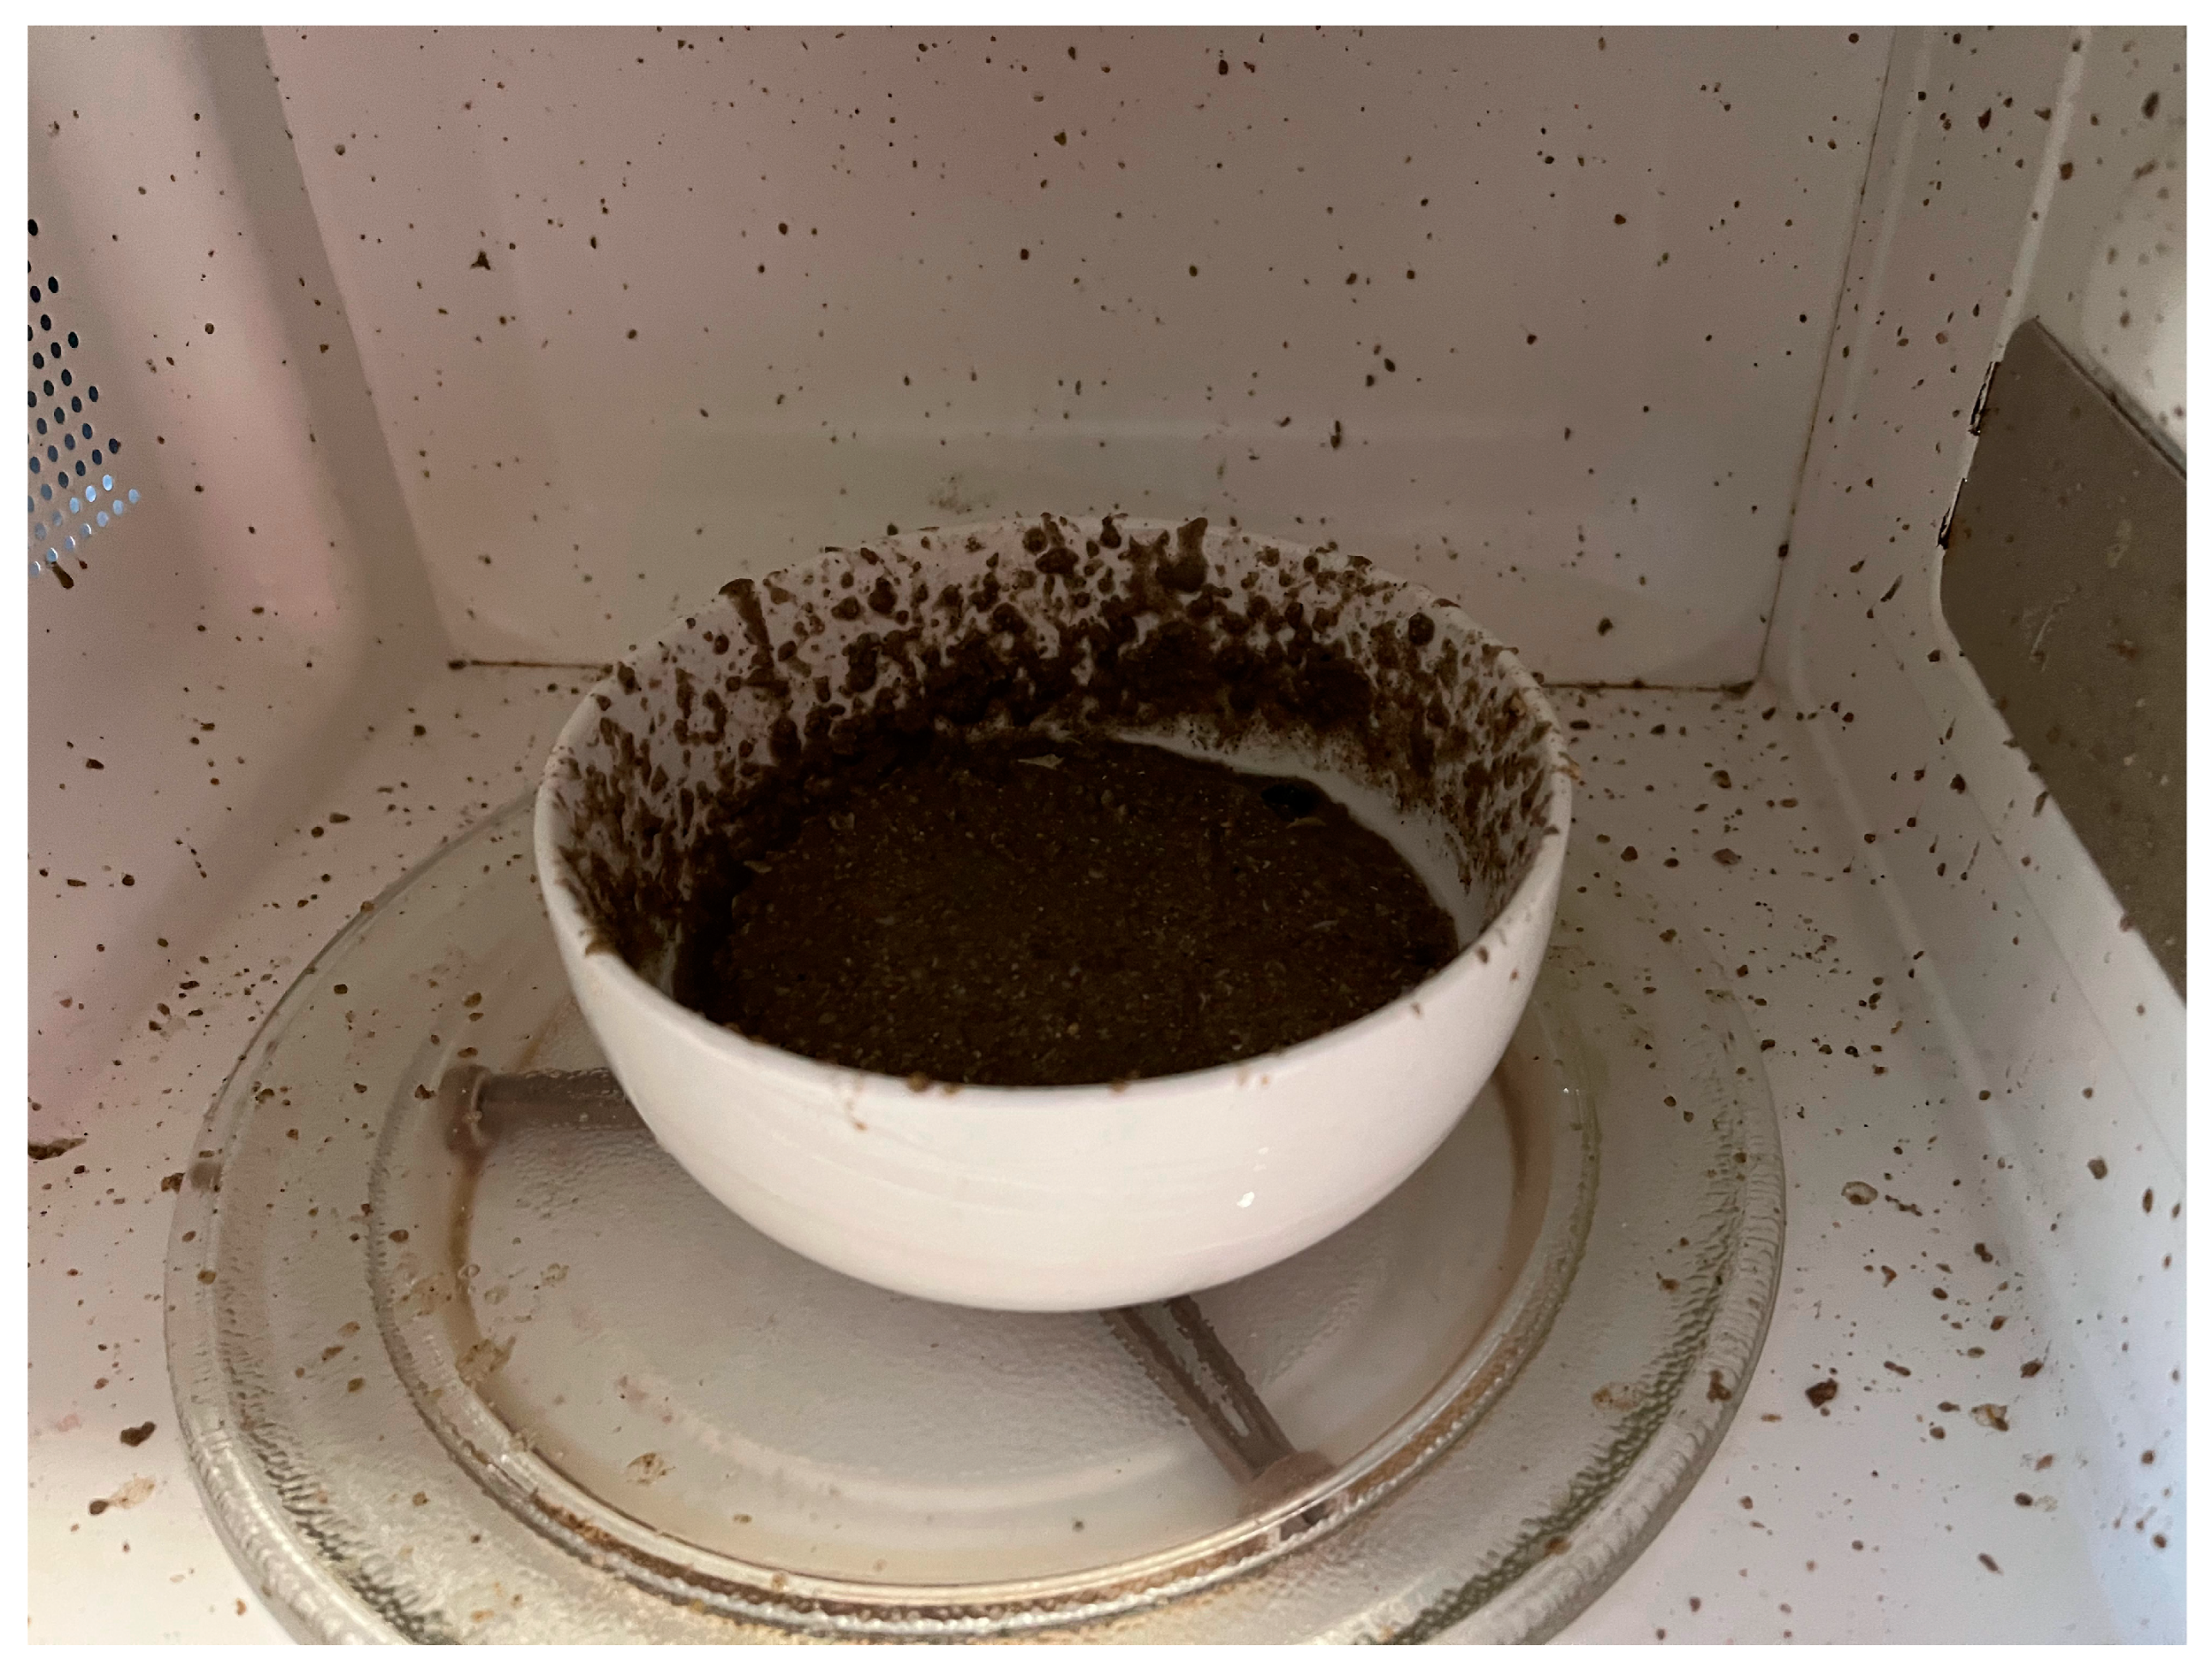
The test and the sample must be rejected if the sand explodes inside the microwave during the drying procedure (
Figure 6). This could occur if the conditions described above are not adhered to.
Therefore, the drying time is specific for each power level. The higher the power applied, the lower the drying time but the greater the possibility of sample explosion. The microwave was paused every 1–2 min to check the following indicators of sand status: the weight control (trying to achieve a weight of 100 g from the initial 130 g); the adhesion of sand grains to a metal spoon (if sand does not stick to the spoon, it is assumed that the sand is sufficiently dry); and visual observation of the color and texture (see example of colors of wet and dry sand samples in
Figure 5a,b). Obviously, a portion of the heated sand’s humidity leaves when the microwave door is opened; therefore, the sample dries faster if the door is repeatedly opened. Likewise, some humidity is attached to the microwave walls; thus, the walls were dried with a paper towel to facilitate the drying method. Once these steps had been carried out, the sample was placed back inside the microwave and the drying procedure was continued. The aforementioned indicator checks were repeated at the appropriate times for each power level in order to completely dry the sand and determine how much drying time was required.
2.3.3. Sieving Procedure
Eight specific mesh sizes were utilized for the sieving process because these sizes are typically required by the Spanish Coastal Administration: 2 mm, 1 mm, 710 μm, 500 μm, 355 μm, 250 μm, 125 μm, and 62.5 μm (
Figure 7).
After a sample weight of approximately 100 g of dried sand was achieved, the sample was put into the upper sieve (2 mm mesh size) of the 20 cm diameter sieve column (
Figure 7). Then, the dry sample was mechanically sieved for 10 min (the necessary time proposed by Lopez-Garcia et al. [
40]). The sand accumulated in each sieve was weighed to obtain the required values of D
50 and sorting (σ). These steps were performed for all drying cases.
2.3.4. Calculations to Obtain Sand Size Parameters
The relevant equations from Folk and Ward [
22] were used to compute the main granulometric parameters (Equations (1) and (2)), where M
φ represents the estimated mean grain size and σ
φ is the estimated sample standard deviation in phi units. Blott and Pye [
17] created an extensive guide for this research. Equation (3) can be applied when converting phi (φ) units to millimeters or vice versa. The equations were developed using the phi unit scale.
The drying procedure was performed ten times per beach in order to identify possible variations in the results. However, the results were always the same.
A previous study [
39] has already established that muffle drying is the preferred method, when possible, for obtaining realistic results and guaranteeing homogeneity of results. Therefore, the relative error (ε), taking the muffle method as the reference, was calculated for D
50 and the sorting parameters following Equations (4) and (5).
3. Results
The results for the different power levels of the microwave, each one needing different drying times, are shown in
Figure 8. The container used for this study during the drying and weighing process (and recommended for similar tests) was a plastic container, 5 cm high, with a 20 × 12 cm area.
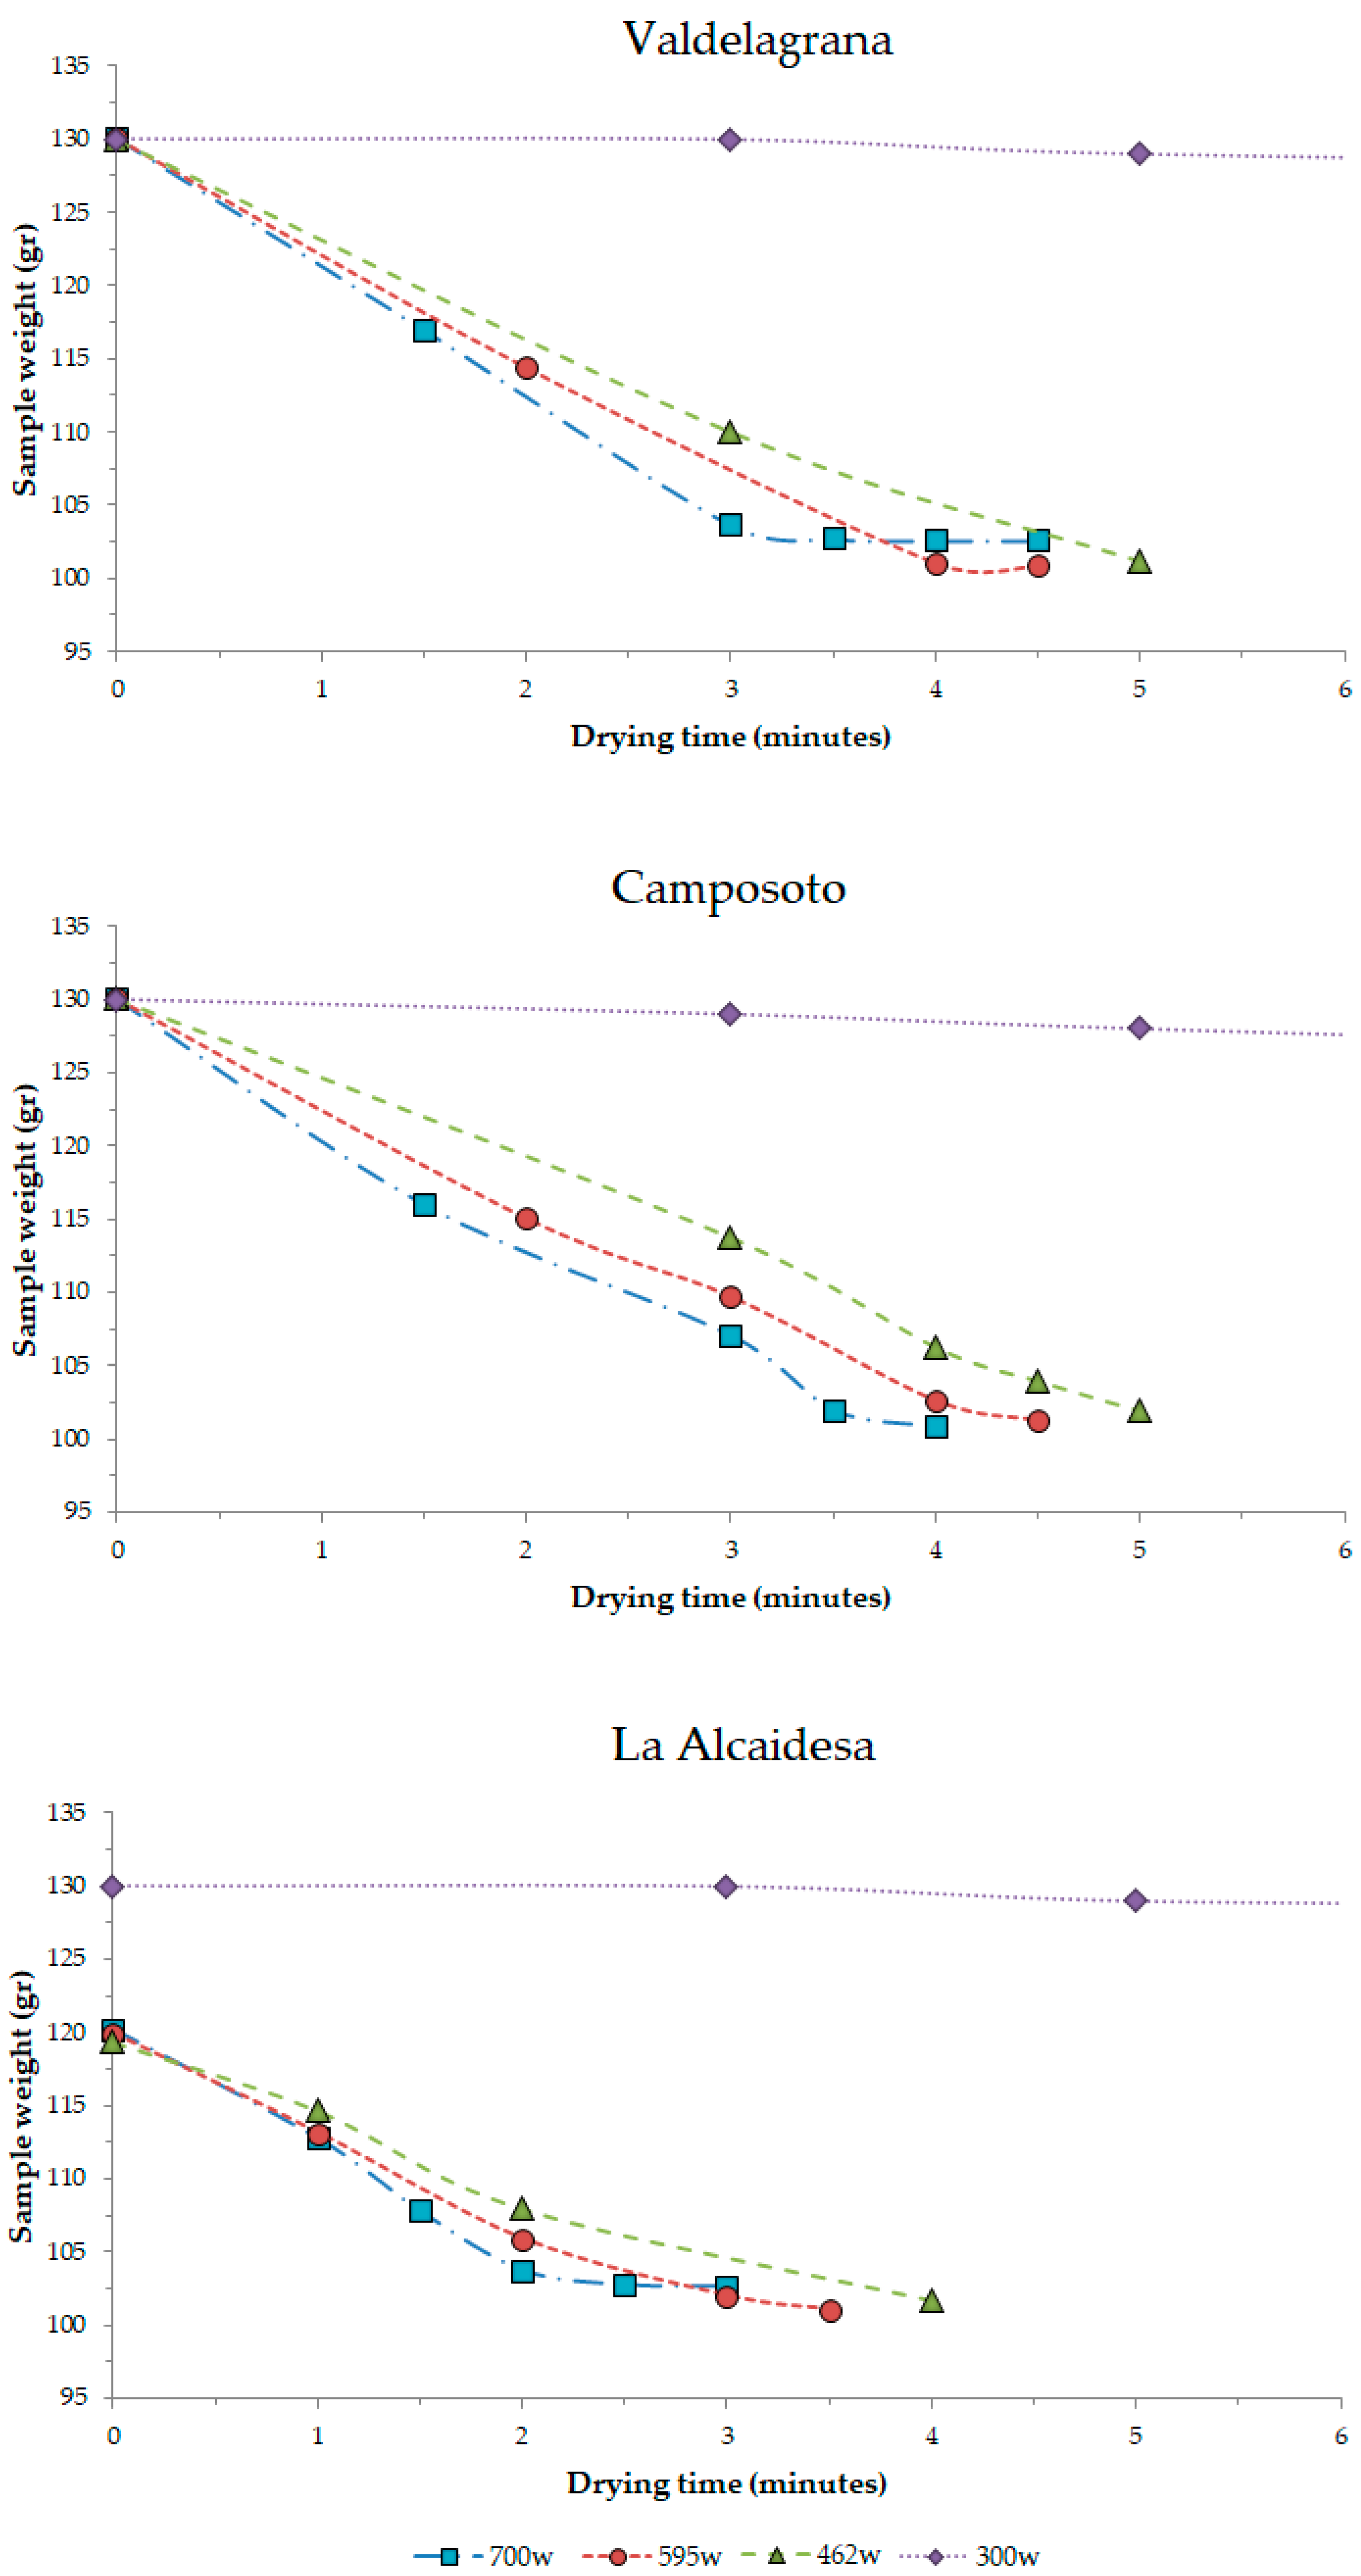
As stated previously, the drying procedure for the wet samples from the finer sand beaches commenced with amounts weighing 130 g (Valdelagrana and Camposoto). Regarding La Alcaidesa, the wet samples weighed 120 g initially to obtain 100 g of dry sand, because the sand has coarser grains and, thus, easier drainage of interstitial water than in the other two beaches. As shown in
Figure 8, the drying process was stopped a few times in order to obtain proof of how dry the sample was and, finally, to determine the minimum time required to obtain a totally dry sample (approximately 100 g of sample). These interruptions were used to remove the humidity inside the microwave and to stir and spread the sand in the container.
All the samples required at most 5 min to be dried at every power level above 462 w. No drying was achieved with 300 w power (even for attempts of 12 min duration). Therefore, this power level was directly rejected.
Table 1,
Table 2 and
Table 3 show the average sand sample results of D
50 (mm) and sorting (σ) that were obtained by drying five sand samples via muffle and the four different microwave power levels. In addition, the weight (grams) contained in each mesh size of the sieve column and other sand parameters were compared (D
95, D
84, D
75, D
25, D
16, and D
5).
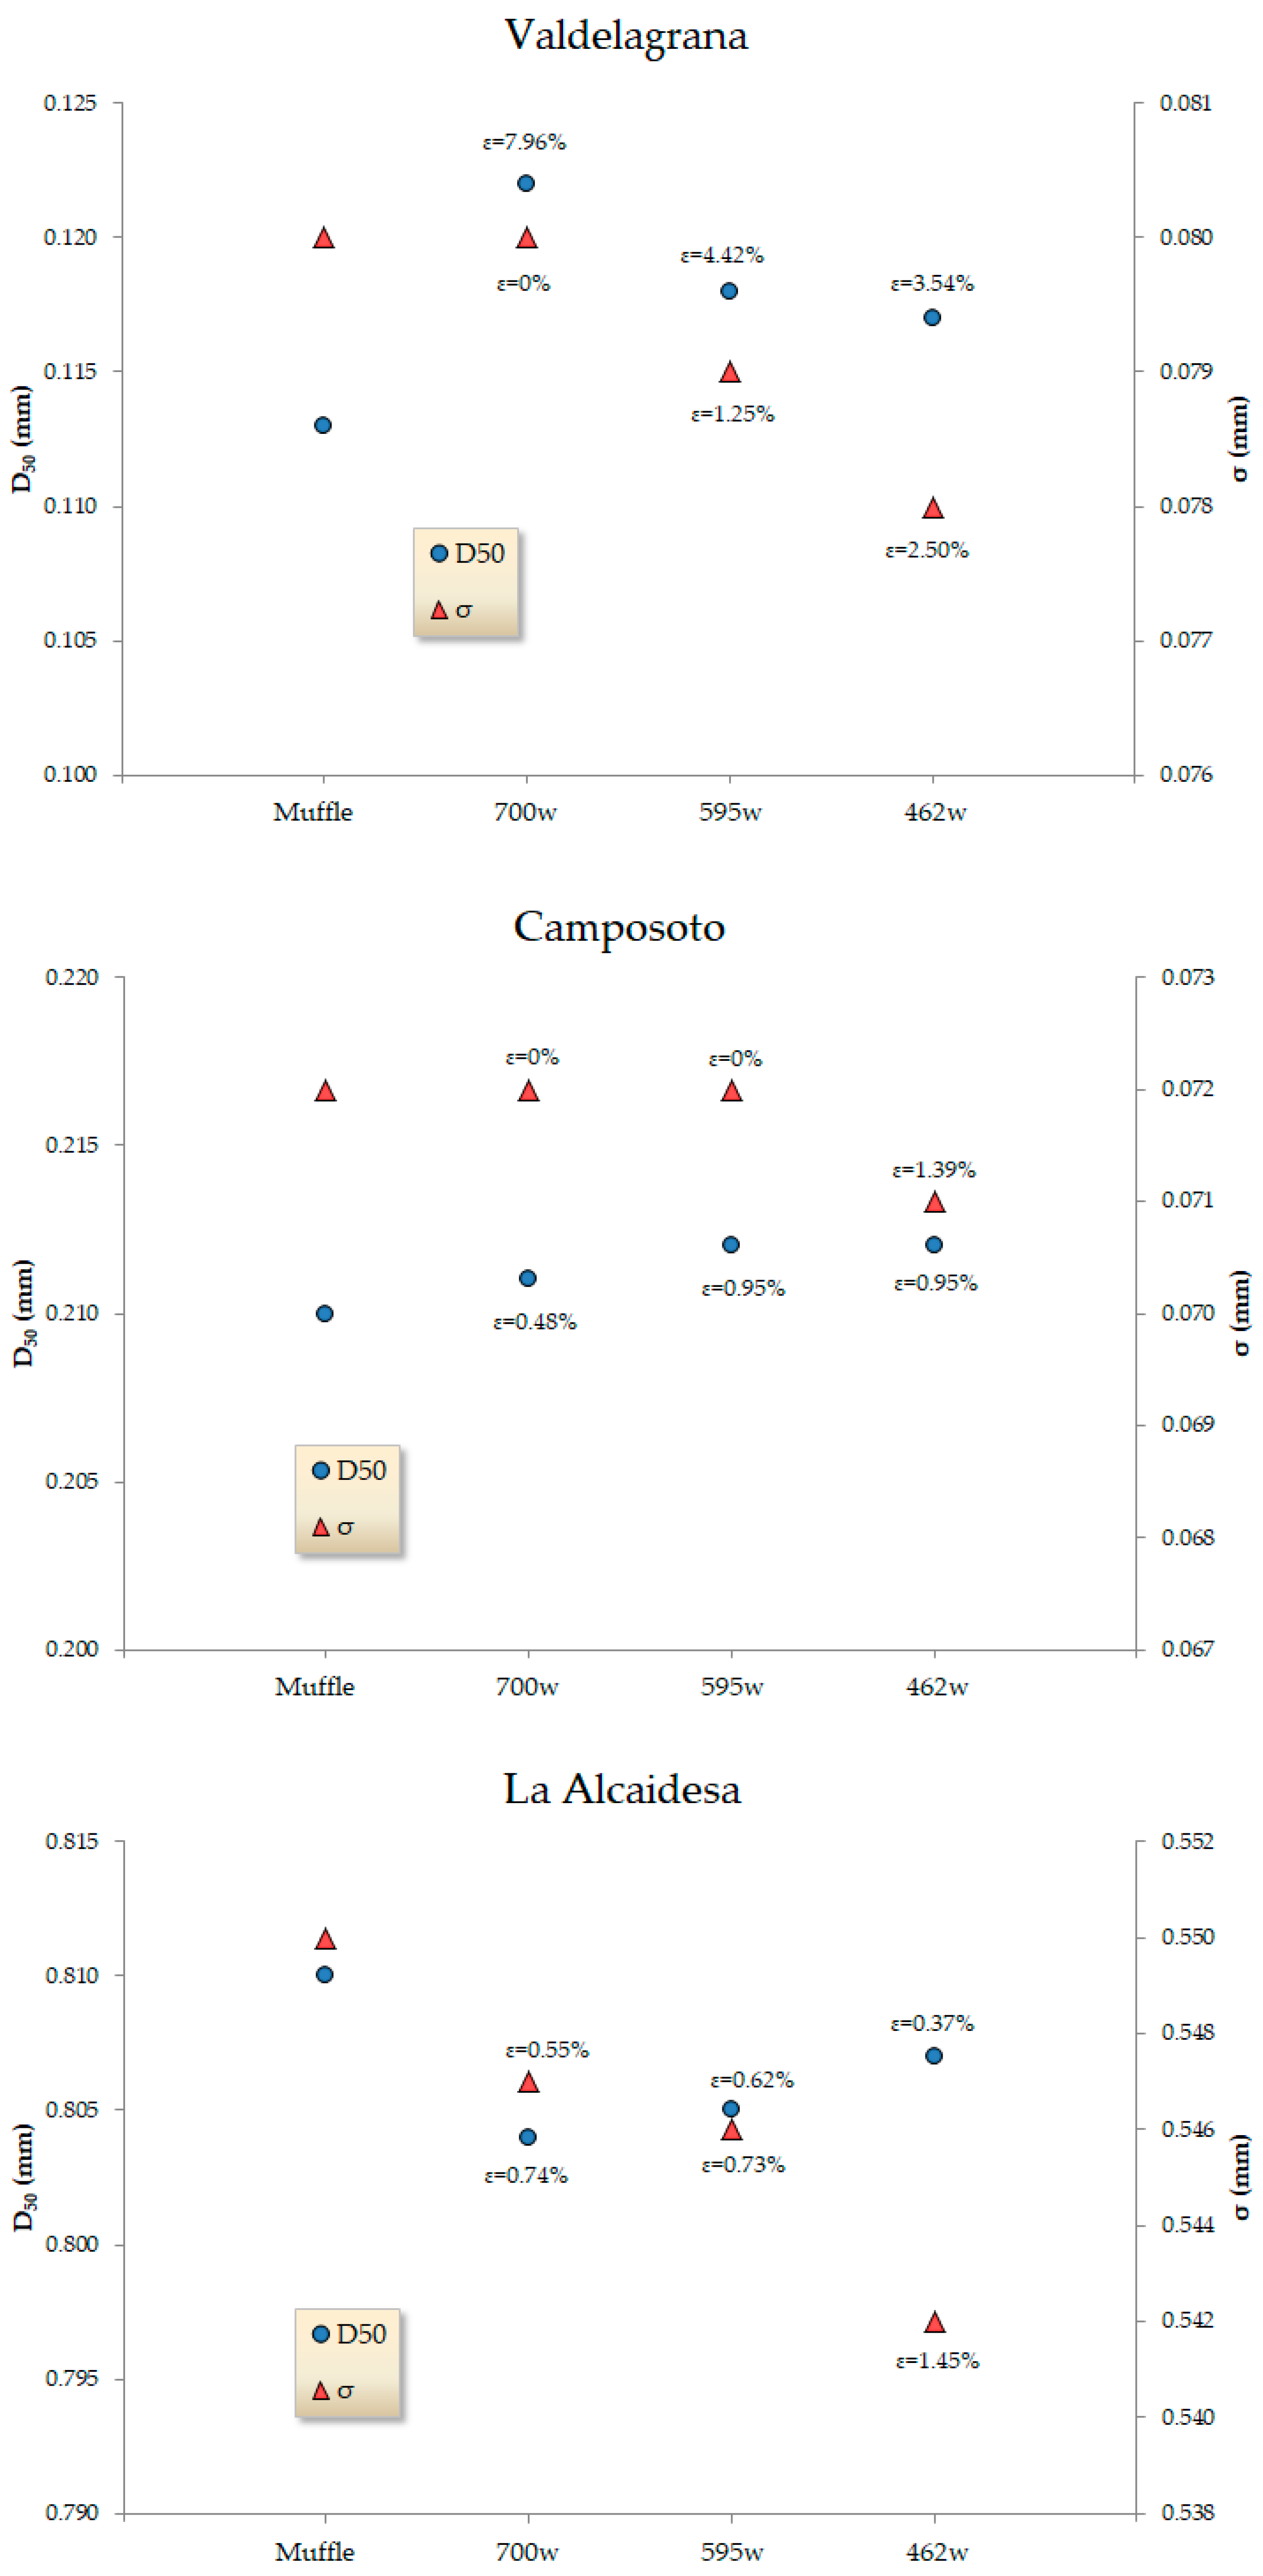
Consequently, it was also possible to observe how each of the methods differed for each parameter, as well as the errors (ε) that resulted from utilizing the muffle drying method as a reference due to its proven accuracy. In addition, the results of D
50, σ and its errors for each beach are represented in
Figure 9.
3.1. Valdelagrana Beach Results (Average D50 = 0.11 mm)
The following results were obtained for Valdelagrana beach, with an average D50 of 0.113 mm and σ of 0.080 mm, according to the muffle test. When the 700 w power level was used, the wet sand required 4 min to become completely dry, and the results were D50 = 0.122 mm and σ = 0.080 mm. The power of 595 w required 4 min and 30 s of drying time, and the results were D50 = 0.118 mm and σ = 0.079 mm. The power of 462 w required 5 min of drying time, and the results were D50 = 0.117 mm and σ = 0.078 mm.
Finally, there was an attempt to dry the samples at the lowest level, 300 w. However, during the process of checking the sand during the drying procedure, the sand was determined to be still wet (proved after a drying time of 12 min). Therefore, the 300 w power level was directly rejected as a drying procedure due to the impossibility of sieving wet sand.
3.2. Camposoto Beach Results (Average D50 = 0.21 mm)
The following results were obtained for Camposoto beach, with an average D50 of 0.210 mm and σ = 0.072 mm. When the 700 w power level was used, the wet sand required 4 min to become completely dry, and the results were D50 = 0.211 mm and σ = 0.072 mm. For the 595 w power level, a drying time of 4 min and 30 s was required, and the results were D50 = 0.212 mm and σ = 0.072 mm. The power of 462 w required 5 min of drying time, and the results were D50 = 0.212 mm and σ = 0.071 mm.
3.3. La Alcaidesa Beach Results (Average D50 = 0.81 mm)
The following results were obtained for La Alcaidesa beach, with an average D50 of 0.810 mm and σ = 0.550 mm. When the 700 w power level was used, the wet sand required 3 min to become completely dry, and the results were D50 = 0.804 mm and σ = 0.547 mm. For the 595 w power level, a drying time of 3 min and 30 s was required, and the results were D50 = 0.805 mm and σ = 0.546 mm. The power of 462 w required 4 min of drying time, and the results were D50 = 0.807 mm and σ = 0.542 mm.
4. Discussion
The horizontal lines in
Figure 8 indicate that the weight of the sample remains constant and, therefore, is already completely dry. The drying duration did not change for the Valdelagrana and Camposoto beaches sand samples, ranging between 4 and 5 min for these beaches in the Gulf of Cadiz, with a D
50 of 0.11 and 0.21 mm, respectively. However, the drying duration of the La Alcaidesa sand samples (D
50 about 0.81 mm) was 1 min less for each microwave power (ranging from 3 to 4 min). Therefore, we can deduce that coarser grains (with easier drainage of interstitial water) demand less drying duration than finer sands. Likewise, the error was 10 times larger for small sand sizes (3.5% for D
50 = 0.11 mm versus 0.37% for D
50 = 0.81 mm).
It can also be observed that the error decreases with the duration of sieving. For example, in the case of Valdelagrana beach, the error in the determination of D50 decreases from 8% to 3.5% when we extend the experiment from 4 to 5 min. Regarding the sorting, the differences are negligible.
Finally, it can be established that the results obtained using the microwave always show slightly higher differences, although not significant, compared with drying with a muffle oven. Therefore, the use of microwaves may be permitted on board a dredger as long as the following are adhered to:
− A light container with a wide base and low height is used;
− The sand is spread uniformly;
− Excess non-interstitial water is removed;
− The power used is greater than 500 w and less than 800 w;
− An intermediate interruption is made to allow the humidity generated by drying to escape, to dry the interior walls of the microwave with absorbent paper, and to stir and spread the sand;
The drying duration is at least 5 min.
5. Conclusions
The most used parameters for sand size characterization are median (D50) and sorting (σ). When beach nourishment is performed, there must be a sand control on board the dredge, right after the sand extraction is finished and previous to the pouring at the beach. It is crucial that the D50 and σ parameters are accurately determined to check if the sand dredged on the sandbank or borrow site is compatible with the native beach.
This checking analysis must be carried out in a limited time period, such as the duration of travel from the borrow site to the pouring zone, which is usually less than 1 h. Moreover, as a muffle oven cannot be used on board a ship because of its dimensions (and weight) and the instability of electric tension, a microwave is usually used instead. However, until now, the necessary time and power of the microwave procedure for drying sand have not been determined. Furthermore, in order to avoid sand explosion inside the microwave and to obtain granulometric parameters as accurately as possible, no procedure had been specified.
Therefore, a series of tests were carried out consisting of multiple analyses with sand samples from different beaches (and consequently different sizes) and microwave drying at various power levels and durations. These microwave results were compared with muffle drying results, considering muffle methodology as the reference to obtain errors in the microwave procedure.
The error results for D50 are less than 3.5% when the drying duration is at least 5 min, which is completely acceptable for beach nourishment purposes. Regarding the power level, 462 w is the ideal power while lower powers, around 300 w, did not achieve complete drying despite durations close to 15 min. Moreover, the sorting (σ) parameter error was absolutely negligible. Finally, drying duration and error were lower for beaches with coarser sand.
Thus, an easy-to-use methodology, generalizable to any other coast, was designed for fast and accurate sand drying.
Among the guidelines provided, it would be worth highlighting the use of a light and wide container with a low height, an intermediate interruption, and a minimum duration of 5 min of drying time.
Author Contributions
Conceptualization, P.L.-G. and J.J.M.-P.; methodology, P.L.-G. and J.J.M.-P.; software, A.C.-d.-V. and F.C.-d.-V.; validation, J.J.M.-P. and B.J.-A.; formal analysis, P.L.-G. and P.D.-C.; investigation, P.L.-G., A.C.-d.-V., B.J.-A., F.C.-d.-V., P.D.-C. and J.J.M.-P.; resources, P.D.-C.; data curation, A.C.-d.-V.; writing—original draft preparation, P.L.-G.; writing—review and editing, A.C.-d.-V., F.C.-d.-V., P.D.-C. and J.R.-C.; visualization, J.R.-C. and P.D.-C.; supervision, J.J.M.-P., A.C.-d.-V., F.C.-d.-V. and B.J.-A.; project administration, B.J.-A.; funding acquisition, J.J.M.-P. All authors have read and agreed to the published version of the manuscript.
Funding
This research was partially funded by CEIMAR and by Junta de Andalucia and European Union (Recovery, Transformation and Resilience Plan), grant number PCM_00124.
Institutional Review Board Statement
Not applicable.
Informed Consent Statement
Not applicable.
Data Availability Statement
All the data are available in the tables included in the article.
Conflicts of Interest
The authors declare no conflicts of interest. The funders had no role in the design of the study; in the collection, analyses, or interpretation of data; in the writing of the manuscript; or in the decision to publish the results.
References
- Pranzini, E.; Anfuso, G.; Muñoz-Perez, J.J. A probabilistic approach to borrow sediment selection in beach nourishment projects. Coast. Eng. 2018, 139, 32–35. [Google Scholar] [CrossRef]
- Saponieri, A.; Valentini, N.; Di Risio, M.; Pasquali, D.; Damiani, L. Laboratory investigation on the evolution of a sandy beach nourishment protected by a mixed soft-hard system. Water 2018, 10, 1171. [Google Scholar] [CrossRef]
- U.S. Army Corps of Engineers. Coastal Engineering Manual-Part III. 2002. Available online: https://www.publications.usace.army.mil/USACE-Publications/Engineer-Manuals/u43544q/ (accessed on 30 April 2002).
- Bernabeu Tello, A.M.; Santamaría, R.M.; Pascual, C.V. An equilibrium profile model for tidal environments. Sci. Mar. 2002, 66, 325–335. [Google Scholar] [CrossRef]
- Singh, M.; Singh, I.B.; Müller, G. Sediment characteristics and transportation dynamics of the Ganga River. Geomorphology 2007, 86, 144–175. [Google Scholar] [CrossRef]
- Fenster, M.S.; Dolan, R.; Smith, J.J. Grain-size distributions and coastal morphodynamics along the southern Maryland and Virginia barrier islands. Sedimentology 2016, 63, 809–823. [Google Scholar] [CrossRef]
- Remo, J.W.F.; Heine, R.A.; Ickes, B.S. Particle size distribution of main-channel-bed sediments along the upper Mississippi River, USA. Geomorphology 2016, 264, 118–131. [Google Scholar] [CrossRef]
- Grottoli, E.; Bertoni, D.; Ciavola, P. Short- and medium-term response to storms on three Mediterranean coarse-grained beaches. Geomorphology 2017, 295, 738–748. [Google Scholar] [CrossRef]
- Hallin, C.; Huisman, B.J.A.; Larson, M.; Walstra, D.J.R.; Hanson, H. Impact of sediment supply on decadal-scale dune evolution—Analysis and modelling of the Kennemer dunes in the Netherlands. Geomorphology 2019, 337, 94–110. [Google Scholar] [CrossRef]
- Steidtmann, J.R. Size-density sorting of sand-size spheres during deposition from bedload transport and implications concerning hydraulic equivalence. Sedimentology 1982, 29, 877–883. [Google Scholar] [CrossRef]
- Roman-Sierra, J.; Navarro, M.; Muñoz-Perez, J.J.; Gomez-Pina, G. Turbidity and Other Effects Resulting from Trafalgar Sandbank Dredging and Palmar Beach Nourishment. J. Waterw. Port Coast. Ocean. Eng. 2011, 137, 332–343. [Google Scholar] [CrossRef]
- de Villar, A.C.; Gómez-Pina, G.; Muñoz-Pérez, J.J.; Contreras, F.; López-García, P.; Ruiz-Ortiz, V. New design parameters for biparabolic beach profiles (SW Cadiz, Spain). Rev. De La Construcción 2019, 18, 432–444. [Google Scholar] [CrossRef]
- Bascom, W.N. The relationship between sand size and beach-face slope. Trans. Am. Geophys. Union 1951, 32, 866. [Google Scholar] [CrossRef]
- Larson, M.; Kraus, N.C. Mathematical modeling of the fate of beach fill. Coast. Eng. 1991, 16, 83–114. [Google Scholar] [CrossRef]
- Aguilera-Vidal, M.; Muñoz-Perez, J.J.; Contreras, A.; Contreras, F.; Lopez-Garcia, P.; Jigena, B. Increase in the Erosion Rate Due to the Impact of Climate Change on Sea Level Rise: Victoria Beach, a Case Study. J. Mar. Sci. Eng. 2022, 10, 1912. [Google Scholar] [CrossRef]
- Mendes, D.; Pais-Barbosa, J.; Baptista, P.; Silva, P.A.; Bernardes, C.; Pinto, C. Beach Response to a Shoreface Nourishment (Aveiro, Portugal). J. Mar. Sci. Eng. 2021, 9, 1112. [Google Scholar] [CrossRef]
- Blott, S.J.; Pye, K. Gradistat: A grain size distribution and statistics package for the analysis of unconsolidated sediments. Earth Surf. Process. Landf. 2001, 26, 1237–1248. [Google Scholar] [CrossRef]
- Kuang, C.; Han, X.; Zhang, J.; Zou, Q.; Dong, B. Morphodynamic Evolution of a Nourished Beach with Artificial Sandbars: Field Observations and Numerical Modeling. J. Mar. Sci. Eng. 2021, 9, 245. [Google Scholar] [CrossRef]
- Romagnoli, C.; Sistilli, F.; Cantelli, L.; Aguzzi, M.; De Nigris, N.; Morelli, M.; Gaeta, M.G.; Archetti, R. Beach Monitoring and Morphological Response in the Presence of Coastal Defense Strategies at Riccione (Italy). J. Mar. Sci. Eng. 2021, 9, 851. [Google Scholar] [CrossRef]
- Li, Y.; Zhang, C.; Cai, Y.; Xie, M.; Qi, H.; Wang, Y. Wave Dissipation and Sediment Transport Patterns during Shoreface Nourishment towards Equilibrium. J. Mar. Sci. Eng. 2021, 9, 535. [Google Scholar] [CrossRef]
- U.S. Army Corps of Engineers. Shore Protection Manual; U.S. Army Coastal Engineering Research Center: Vicksburg, MI, USA, 1984. [Google Scholar]
- Folk, R.L.; Ward, W.C. Brazos River bar: A study in the significance of grain size parameters. J. Sediment. Res. 1957, 27, 3–26. [Google Scholar] [CrossRef]
- Folk, R.L. Petrology of Sedimentary Rocks; Hemphill Publishing Company: Austin, TX, USA, 1974. [Google Scholar]
- Krumbein, W.; Pettijohn, F. Manual of Sedimentary Petrography; D. Appleton-Century Company, Inc.: New York, NY, USA, 1938; p. 549. [Google Scholar]
- Eberhard, L.; Schindler, H.J.; Hellmann, D.; Schmitter, M.; Rammelsberg, P.; Giannakopoulos, N.N. Comparison of particle-size distributions determined by optical scanning and by sieving in the assessment of masticatory performance. J. Oral Rehabil. 2012, 39, 338–348. [Google Scholar] [CrossRef]
- Orrú, C.; Chavarrías, V.; Uijttewaal, W.S.J.; Blom, A. Image analysis for measuring stratigraphy in sand-gravel laboratory experiments. Earth Surf. Dyn. Discuss. 2013, 1, 973–1018. [Google Scholar] [CrossRef]
- Shillabeer, N.; Hart, B.; Riddle, A.M. The use of a mathematical model to compare particle size data derived by dry-sieving and laser analysis. Estuar. Coast. Shelf Sci. 1992, 35, 105–111. [Google Scholar] [CrossRef]
- Pope, L.; Ward, C. Manual on Test Sieving Methods; ASTM: West Conshohocken, PA, USA, 1998. [Google Scholar]
- Luisa Martinez, M.; Silva, R.; Lithgow, D.; Mendoza, E.; Flores, P.; Martínez, R.; Cruz, C. Human Impact on Coastal Resilience along the Coast of Veracruz, Mexico. J. Coast. Res. 2017, 77, 143–153. [Google Scholar] [CrossRef]
- Austin, L.G.; Shah, I. A method for inter-conversion of microtrac and sieve size distributions. Powder Technol. 1983, 35, 271–278. [Google Scholar] [CrossRef]
- Celia Magno, M.; Venti, F.; Bergamin, L.; Pierfranceschi, G.; Romano, E.; Gaglianone, G. A comparison between Laser Granulometer and Sedigraph in grain size analysis of marine sediments. Meas. J. Int. Meas. Confed. 2018, 128, 231–236. [Google Scholar] [CrossRef]
- Blott, S.J.; Pye, K. Particle size distribution analysis of sand-sized particles by laser diffraction: An experimental investigation of instrument sensitivity and the effects of particle shape. Sedimentology 2006, 53, 671–685. [Google Scholar] [CrossRef]
- Konert, M.; Vandenberghe, J. Comparison of laser grain size analysis with pipette and sieve analysis: A solution for the underestimation of the clay fraction. Sedimentology 1997, 44, 523–535. [Google Scholar] [CrossRef]
- Poullet, P.; Muñoz-Perez, J.J.; Lopez, P.; García-Lopez, S.; Martell, R.; Silva, R.; Moreno, L. Sand size variability inside the hopper of a trailing suction dredger for beach nourishment purpose. Geo-Mar. Lett. 2019, 39, 513–520. [Google Scholar] [CrossRef]
- Poullet, P.; Muñoz-Perez, J.J.; Poortvliet, G.; Mera, J.; Contreras, A.; Lopez, P. Influence of different sieving methods on estimation of sand size parameters. Water 2019, 11, 879. [Google Scholar] [CrossRef]
- Grosskopf, W.G.; Kraus, N.C. Guidelines for Surveying Beach Nourishment Projects; U.S. Army Engineering Water Experiment Station: Vicksburg, MI, USA, 1993. [Google Scholar]
- Syvitski, J.P.M. Principles, Methods and Application of Particle Size Analysis; Cambridge University Press: Cambridge, UK, 1991. [Google Scholar] [CrossRef]
- Lund-Hansen, L.C.; Oehmig, R. Comparing sieve and sedimentation balance analysis of beach, lake and eolian sediments using log-hyperbolic parameters. Mar. Geol. 1992, 107, 139–147. [Google Scholar] [CrossRef]
- Román-Sierra, J.; Muñoz-perez, J.J.; Navarro-Pons, M. Influence of sieving time on the efficiency and accuracy of grain-size analysis of beach and dune sands. Sedimentology 2013, 60, 1484–1497. [Google Scholar] [CrossRef]
- Lopez-Garcia, P.; Muñoz-Perez, J.J.; Contreras, A.; Vidal, J.; Jigena, B.; Santos, J.J.; Romero, J.; Contreras, F. Error on the Estimation of Sand Size Parameters When Using Small Diameter Sieves and a Solution. Front. Mar. Sci. 2021, 8, 738479. [Google Scholar] [CrossRef]
- Mizutani, S. A theoretical and experimental consideration of accuracy of sieving analysis. J. Earth Sci. 1963, 11, 1–27. [Google Scholar]
- López-García, P.; Gómez-Enri, J.; Muñoz-Pérez, J.J. Accuracy assessment of wave data from altimeter near the coast. Ocean Eng. 2019, 178, 229–232. [Google Scholar] [CrossRef]
- Santos-Vendoiro, J.J.; Muñoz-Perez, J.J.; Lopez-García, P.; Jodar, J.M.; Mera, J.; Contreras, A.; Contreras, F.; Jigena, B. Evolution of Sediment Parameters after a Beach Nourishment. Land 2021, 10, 914. [Google Scholar] [CrossRef]
Figure 1.
Location of the three beaches analyzed in this study. The Valdelagrana and Camposoto beaches are situated in the Gulf of Cadiz (Atlantic Ocean) and La Alcaidesa beach is located on the coast of the Mediterranean Sea. All of the beaches are located close to the Strait of Gibraltar (Spain, Europe).
Figure 2.
A sample bag (10 bags were collected from each beach) containing 800 g of sand with some excess water. Each sample bag was divided into 5 subsamples: 130 g for muffle, 130 g for each of the four microwave power levels (700 w, 595 w, 462 w, and 300 w), and 150 g extra for possible losses.
Figure 2.
A sample bag (10 bags were collected from each beach) containing 800 g of sand with some excess water. Each sample bag was divided into 5 subsamples: 130 g for muffle, 130 g for each of the four microwave power levels (700 w, 595 w, 462 w, and 300 w), and 150 g extra for possible losses.
Figure 3.
An example of a sieved sand sample that was not sufficiently dry. The sieving machine vibrations created compact sand spheres with the grains. Also, it can be seen how humidity in the sand causes obstructions in the mesh pores.
Figure 3.
An example of a sieved sand sample that was not sufficiently dry. The sieving machine vibrations created compact sand spheres with the grains. Also, it can be seen how humidity in the sand causes obstructions in the mesh pores.
Figure 4.
(a) Laboratory muffle programmed to dry at 110 °C; (b) standard microwave with 700 w, 595 w, 462 w, and 300 w power levels.
Figure 4.
(a) Laboratory muffle programmed to dry at 110 °C; (b) standard microwave with 700 w, 595 w, 462 w, and 300 w power levels.
Figure 5.
(
a) A wet sand sample spread inside the container, weighing 130.00 g. (
b) The same sand sample as in
Figure 5a but completely dry, weighing about 100.00 g.
Figure 5.
(
a) A wet sand sample spread inside the container, weighing 130.00 g. (
b) The same sand sample as in
Figure 5a but completely dry, weighing about 100.00 g.
Figure 6.
View of the inside of a microwave after a sand sample exploded during the drying process.
Figure 6.
View of the inside of a microwave after a sand sample exploded during the drying process.
Figure 7.
Sieving machine with the 8 sieves.
Figure 7.
Sieving machine with the 8 sieves.
Figure 8.
Average results of the sample weight at different power levels versus drying time for Valdelagrana, Camposoto, and La Alcaidesa beaches.
Figure 8.
Average results of the sample weight at different power levels versus drying time for Valdelagrana, Camposoto, and La Alcaidesa beaches.
Figure 9.
Parameters D50 and σ, with the error (ε) for each microwave power, taking the muffle result as the reference (for Valdelagrana, Camposoto, and La Alcaidesa beaches).
Figure 9.
Parameters D50 and σ, with the error (ε) for each microwave power, taking the muffle result as the reference (for Valdelagrana, Camposoto, and La Alcaidesa beaches).
Table 1.
Average results of the different analyses (10 tests for every microwave power) for the Valdelagrana beach samples: (a) the weight (g) for each mesh and its corresponding percentage (%) in the whole sample, and (b) the parameters D50, σ, D95, D84, D75, D25, D16, and D5. The error (ε) for the results of each power represented takes into account the muffle result as the reference.
| (a) Valdelagrana beach |
| Mesh size | Muffle | 700 w (4 min) | 595 w (4:30 min) | 462 w (5 min) | Median
value |
| (mm) | g | % | g | % | ε (%) | g | % | ε (%) | g | % | ε (%) | % |
| 2 | 0.60 | 0.60 | 0.09 | 0.09 | 85.0 | 0.11 | 0.11 | 81.7 | 0.12 | 0.12 | 80.0 | 0.23 |
| 1 | 0.23 | 0.23 | 0.14 | 0.14 | 39.1 | 0.16 | 0.16 | 30.4 | 0.23 | 0.23 | 0.00 | 0.19 |
| 0.710 | 0.21 | 0.21 | 0.10 | 0.10 | 52.4 | 0.13 | 0.13 | 38.1 | 0.20 | 0.20 | 4.8 | 0.16 |
| 0.500 | 0.67 | 0.67 | 0.58 | 0.57 | 13.4 | 0.51 | 0.51 | 23.9 | 0.57 | 0.56 | 15.0 | 0.58 |
| 0.355 | 3.12 | 3.12 | 3.73 | 3.63 | 19.6 | 3.22 | 3.20 | 3.2 | 3.04 | 3.01 | 2.6 | 3.28 |
| 0.250 | 4.95 | 4.95 | 7.06 | 6.88 | 42.6 | 5.95 | 5.91 | 20.2 | 5.52 | 5.46 | 11.5 | 5.87 |
| 0.125 | 28.86 | 28.84 | 36.75 | 35.81 | 27.3 | 34.04 | 33.83 | 18.0 | 33.74 | 33.35 | 17.0 | 33.35 |
| 0.063 | 59.24 | 59.20 | 52.11 | 50.77 | 12.0 | 54.32 | 53.99 | 8.3 | 55.56 | 54.92 | 6.2 | 55.31 |
| <0.062 | 2.18 | 2.18 | 2.07 | 2.02 | 5.1 | 2.18 | 2.17 | 0.0 | 2.18 | 2.16 | 0.0 | 2.15 |
| Total | 100.06 | | 102.63 | | | 100.62 | | | 101.16 | | | 101.12 |
| (b) Valdelagrana beach |
| Parameters | Muffle | 700 w (4 min) | 595 w (4:30 min) | 462 w (5 min) | Median
value |
| (mm) | mm | mm | ε (%) | mm | ε (%) | mm | ε (%) | mm |
| D50 | 0.113 | 0.122 | 7.96 | 0.118 | 4.42 | 0.117 | 3.54 | 0.118 |
| σ | 0.080 | 0.080 | 0.00 | 0.079 | 1.25 | 0.078 | 2.50 | 0.079 |
| D95 | 0.351 | 0.343 | 2.28 | 0.339 | 3.42 | 0.338 | 3.70 | 0.343 |
| D84 | 0.223 | 0.233 | 4.48 | 0.228 | 2.24 | 0.226 | 1.35 | 0.228 |
| D75 | 0.184 | 0.202 | 9.78 | 0.195 | 5.98 | 0.192 | 4.35 | 0.193 |
| D50 | 0.113 | 0.122 | 7.96 | 0.118 | 4.42 | 0.117 | 3.54 | 0.118 |
| D25 | 0.087 | 0.091 | 4.60 | 0.089 | 2.30 | 0.089 | 2.30 | 0.089 |
| D16 | 0.077 | 0.08 | 3.90 | 0.079 | 2.60 | 0.079 | 2.60 | 0.079 |
| D5 | 0.066 | 0.067 | 1.52 | 0.066 | 0.00 | 0.066 | 0.00 | 0.066 |
Table 2.
Average results of the different analyses (10 tests for every microwave power) for the Camposoto beach samples: (a) the weight (g) of each mesh and its corresponding % in the whole sample, and (b) the parameters D50, σ, D95, D84, D75, D25, D16, and D5. The error (ε) for the results of each power represented takes into account the muffle result as the reference.
| (a) Camposoto beach |
| Mesh size | Muffle | 700 w (4 min) | 595 w (4:30 min) | 462 w (5 min) | Medianvalue |
| (mm) | g | % | g | % | ε (%) | g | % | ε (%) | g | % | ε (%) | % |
| 2 | 0.00 | 0.00 | 0.00 | 0.00 | 0.00 | 0.00 | 0.00 | 0.00 | 0.00 | 0.00 | 0.00 | 0.00 |
| 1 | 0.00 | 0.00 | 0.00 | 0.00 | 0.00 | 0.00 | 0.00 | 0.00 | 0.00 | 0.00 | 0.00 | 0.00 |
| 0.710 | 0.00 | 0.00 | 0.00 | 0.00 | 0.00 | 0.00 | 0.00 | 0.00 | 0.00 | 0.00 | 0.00 | 0.00 |
| 0.500 | 0.20 | 0.20 | 0.23 | 0.23 | 14.14 | 0.22 | 0.22 | 8.68 | 0.20 | 0.20 | 1.96 | 0.21 |
| 0.355 | 2.61 | 2.61 | 2.66 | 2.64 | 1.16 | 2.70 | 2.67 | 2.21 | 2.68 | 2.63 | 0.67 | 2.64 |
| 0.250 | 25.80 | 25.81 | 26.02 | 25.84 | 0.10 | 26.88 | 26.57 | 2.94 | 27.13 | 26.61 | 3.09 | 26.21 |
| 0.125 | 67.24 | 67.27 | 68.32 | 67.84 | 0.85 | 68.13 | 67.34 | 0.11 | 69.12 | 67.79 | 0.78 | 67.56 |
| 0.063 | 4.08 | 4.08 | 3.47 | 3.45 | 15.58 | 3.23 | 3.19 | 21.78 | 2.82 | 2.77 | 32.24 | 3.37 |
| <0.062 | 0.03 | 0.03 | 0.01 | 0.01 | 66.91 | 0.01 | 0.01 | 67.07 | 0.01 | 0.01 | 67.32 | 0.01 |
| Total | 99.96 | | 100.71 | | | 101.17 | | | 101.96 | | | |
| (b) Camposoto beach |
| Parameters | Muffle | 700 w (4 min) | 595 w (4:30 min) | 462 w (5 min) | Median
value |
| (mm) | mm | mm | ε (%) | mm | ε (%) | mm | ε (%) | mm |
| D50 | 0.210 | 0.211 | 0.48 | 0.212 | 0.95 | 0.212 | 0.95 | 0.211 |
| σ | 0.072 | 0.072 | 0.00 | 0.072 | 0.00 | 0.071 | 1.39 | 0.072 |
| D95 | 0.346 | 0.346 | 0.00 | 0.347 | 0.29 | 0.346 | 0.00 | 0.346 |
| D84 | 0.301 | 0.302 | 0.33 | 0.303 | 0.66 | 0.303 | 0.66 | 0.302 |
| D75 | 0.265 | 0.265 | 0.00 | 0.268 | 1.13 | 0.267 | 0.75 | 0.266 |
| D50 | 0.210 | 0.211 | 0.48 | 0.212 | 0.95 | 0.212 | 0.95 | 0.211 |
| D25 | 0.164 | 0.165 | 0.61 | 0.165 | 0.61 | 0.166 | 1.22 | 0.165 |
| D16 | 0.147 | 0.148 | 0.68 | 0.149 | 1.36 | 0.149 | 1.36 | 0.148 |
| D5 | 0.127 | 0.128 | 0.79 | 0.128 | 0.79 | 0.129 | 1.57 | 0.128 |
Table 3.
Average results of the different analyses (10 tests for every microwave power) for the La Alcaidesa beach samples: (a) the weight (g) of each mesh and its corresponding % in the whole sample, and (b) the parameters D50, σ, D95, D84, D75, D25, D16, and D5. The error (ε) for the results of each power represented takes into account the muffle result as the reference.
| (a) La Alcaidesa beach |
| Mesh size | Muffle | 700 w (4 min) | 595 w (4:30 min) | 462 w (5 min) | Medianvalue |
| (mm) | g | % | g | % | ε (%) | g | % | ε (%) | g | % | ε (%) | % |
| 2 | 3.90 | 3.89 | 3.96 | 3.85 | 1.54 | 3.98 | 3.94 | 2.05 | 3.55 | 3.50 | 8.97 | 3.80 |
| 1 | 30.78 | 30.68 | 30.88 | 30.06 | 0.32 | 30.69 | 30.41 | 0.29 | 31.05 | 30.63 | 0.88 | 30.44 |
| 0.710 | 23.65 | 23.58 | 24.51 | 23.86 | 3.64 | 23.48 | 23.26 | 0.72 | 24.16 | 23.83 | 2.16 | 23.63 |
| 0.500 | 18.74 | 18.68 | 19.64 | 19.12 | 4.80 | 20.52 | 20.33 | 9.50 | 19.83 | 19.56 | 5.82 | 19.42 |
| 0.355 | 13.31 | 13.27 | 13.77 | 13.40 | 3.46 | 13.20 | 13.08 | 0.83 | 13.42 | 13.24 | 0.83 | 13.25 |
| 0.250 | 7.44 | 7.42 | 7.69 | 7.48 | 3.36 | 7.05 | 6.99 | 5.24 | 7.28 | 7.18 | 2.15 | 7.27 |
| 0.125 | 2.42 | 2.41 | 2.29 | 2.23 | 5.37 | 2.01 | 1.99 | 16.94 | 2.08 | 2.05 | 14.05 | 2.17 |
| 0.063 | 0.07 | 0.07 | 0.00 | 0.00 | 100.0 | 0.00 | 0.00 | 100.0 | 0.00 | 0.00 | 100.0 | 0.02 |
| <0.062 | 0.00 | 0.00 | 0.00 | 0.00 | 0.00 | 0.00 | 0.00 | 0.00 | 0.00 | 0.00 | 0.00 | 0.00 |
| Total | 100.31 | | 102.74 | | | 100.93 | | | 101.37 | | | |
| (b) La Alcaidesa beach |
| Parameters | Muffle | 700 w (4 min) | 595 w (4:30 min) | 462 w (5 min) | Median
value |
| (mm) | mm | mm | ε (%) | mm | ε (%) | mm | ε (%) | mm |
| D50 | 0.810 | 0.804 | 0.74 | 0.805 | 0.62 | 0.807 | 0.37 | 0.81 |
| σ | 0.550 | 0.547 | 0.55 | 0.546 | 0.73 | 0.542 | 1.45 | 0.55 |
| D95 | 1.964 | 1.962 | 0.10 | 1.965 | 0.05 | 1.951 | 0.66 | 1.96 |
| D84 | 1.605 | 1.596 | 0.56 | 1.603 | 0.12 | 1.592 | 0.81 | 1.60 |
| D75 | 1.312 | 1.296 | 1.22 | 1.308 | 0.30 | 1.298 | 1.07 | 1.30 |
| D50 | 0.81 | 0.804 | 0.74 | 0.805 | 0.62 | 0.807 | 0.37 | 0.81 |
| D25 | 0.521 | 0.521 | 0.00 | 0.53 | 1.73 | 0.527 | 1.15 | 0.52 |
| D16 | 0.422 | 0.423 | 0.24 | 0.433 | 2.61 | 0.429 | 1.66 | 0.43 |
| D5 | 0.286 | 0.289 | 1.05 | 0.295 | 3.15 | 0.293 | 2.45 | 0.29 |
| Disclaimer/Publisher’s Note: The statements, opinions and data contained in all publications are solely those of the individual author(s) and contributor(s) and not of MDPI and/or the editor(s). MDPI and/or the editor(s) disclaim responsibility for any injury to people or property resulting from any ideas, methods, instructions or products referred to in the content. |
© 2024 by the authors. Licensee MDPI, Basel, Switzerland. This article is an open access article distributed under the terms and conditions of the Creative Commons Attribution (CC BY) license (https://creativecommons.org/licenses/by/4.0/).


 ,
, 


