Abstract
Establishing muscle lineage cell lines from fish will provide a great opportunity to study muscle development, which can eventually contribute to the improvement of the fish quality in the aquaculture industry. However, there has been a lack of the development of proper fish muscle lineage cell lines so far. Here, we report the establishment of a skeletal muscle-derived myogenic cell line from black sea bream (Acanthopagrus schlegelii). For this, we first attempted to find the optimal conditions for the primary explant culture of A. schlegelii muscle tissues and then established muscle-derived cell lines. After that, cell lines were characterized for their muscle-specific gene expression, growth, and myogenic differentiation. We found that the primary explant culture was effective when the tissue fragments were cultured in Dulbecco’s Modified Eagle Medium supplemented with fetal bovine serum and antibiotics on gelatin-coated dishes. Additionally, we confirmed that the addition of basic fibroblast growth factor was necessary to establish the cell lines. One of three cell lines established was capable of long-term culture, expressed three major myogenic regulatory genes including Pax7, MyoD, and Myog, and differentiated to myotubes in the condition using low concentration of horse serum, demonstrating that this cell line was a skeletal muscle-derived myogenic cell line.
1. Introduction
Muscle tissue is of great importance as a food ingredient for humans. Understanding muscle growth at the cellular and molecular levels provides an opportunity to improve the production of high-quality animal muscles in the aquaculture and livestock industries [1,2]. In addition, this can lead to the development of the field of artificial cultured meat, which has been actively studied and developed in recent years [3,4]. Similar to cultured meat from livestock animals, cultured meat from fish also has a significant potential as an eco-friendly food that can solve the future issue of marine food resource depletion by providing an alternative to existing fish meat [5]. The challenges will be the establishment of a sustainable production system with low cost and high safety, optimizing detailed technologies such as the culture of muscle lineage cells and scaffold manufacture. Muscles are formed through a series of processes involving proliferation and differentiation of muscle lineage cells, including muscle satellite cells and myoblasts [6]. Thus, the establishment of muscle lineage cell lines will provide a valuable model for better understanding the mechanisms involved in muscle growth [7].
Previously, it was reported that a number of muscle lineage cell lines were established in mammals. For example, the rat L6 and the mouse C2C12 myoblast cell lines were established in 1968 and 1977 [8,9], respectively, and they have been used as important experimental models to identify pathogenic and pathophysiological mechanisms in various neuromuscular diseases, as well as in therapeutic drug discovery approaches [10,11]. In pigs, the establishment of a porcine myoblast cell line with a proven differentiation capacity to myotubes was reported [12], along with the isolation of pure muscle satellite cells and their characterization [13]. Similarly, several studies targeting bovine muscle satellite cells demonstrated the feasibility of their isolation, culture, and in vitro differentiation [14,15]. In the case of teleost, it was reported that several studies used the primary cells derived from muscle tissues for the study of myogenic regulatory mechanism [16,17,18,19] and for in vitro system development [20]. For cell lines, the establishment of myoblast cell lines of olive flounder (Paralichthys olivaceus) [21], black rockfish (Sebastes schlegelii) [22], silver seabream (Chrysophrys auratus) [23], and Atlantic mackerel (Scomber scombrus) [24] was reported. Recently, Xu et al. reported the establishment and characterization of muscle satellite cell lines in large yellow croaker (Larimichthys crocea) and demonstrated the feasibility of manufacturing artificial cultured meat using the established cell lines [25].
Despite these efforts to target teleost muscle lineage cell lines, there is still a lack of culture cases compared to mammalian studies, and the information regarding culture technology is not well organized. This indicates that further research should be carried out to establish and characterize cell lines of the muscle lineage of teleost. Especially, considering the biological diversity of teleost according to various aquatic environments, it will be important to develop species-specific culture techniques for various species. In this study, we focused on black sea bream (Acanthopagrus schlegelii) which is one of the major aquaculture species in China, Japan, Korea, and many parts of Southeastern Asia [26]. As a high-value fish in the market with a good taste, its demand and productivity increase continuously [27]. Thus, establishing muscle lineage cell lines from this fish and utilizing them as a research model will be valuable for the research and to improve the quality of this fish as a food. Therefore, the study to establish A. schlegelii muscle lineage cell lines was performed here. For this, we first evaluated the efficiencies of the primary explant culture of A. schlegelii muscle tissues and the following first subculture, depending on different types of substrates, media, and serum with or without growth factors. After that, muscle-derived cell lines were established and their characteristics and differentiation potential were investigated. Finally, we attempted to find efficient conditions for differentiation into the myotubes of the cell line according to serum types and concentrations.
2. Materials and Methods
2.1. Fish
Black sea bream (A. schlegelii) of 12 months old were managed in a 1-ton tank installed in the Laboratory of Cell Biotechnology, Pukyong National University (Busan, Republic of Korea). They were fed 2 times a day with blue chip No. 4 (Woosung, Daejeon, Republic of Korea), ad libitum, until apparent satiation. Water temperature and salinity were maintained at 18 °C and 33 psu, respectively. All procedures dealing with animals complied with the guidelines provided by Pukyong National University, and the Institutional Animal Care and Use Committee (IACUC) of Pukyong National University approved our research proposal (approval No. PKNUIACUC-2021-32).
2.2. Primary Explant Culture and Subculture
For the primary explant culture, fish were sacrificed via anesthesia with 2-phenoxyethanol (Sigma-Aldrich, St. Louis, MO, USA) and wiped with 70% (v/v) ethanol. After removing the skin, almost all skeletal muscle tissues including white and red muscle were isolated from the fish body, washed 3 times with 1X Dulbecco’s phosphate buffered saline (DPBS; Gibco, Grand Island, NY, USA), and cut into small pieces of 1–2 mm size using a surgical blade. In this study, the type of muscle was not distinguished. Then, 10 to 15 tissue fragments were seeded on a well of 6-well plate (SPL Life Sciences, Pocheon, Republic of Korea) coated with 0.1% gelatin (Sigma-Aldrich) or Matrigel (Corning Life Sciences, Bedford, MA, USA) and covered with cover glass. Three different basal media were used in this study: Leibovitz’s L-15 medium (L15; Gibco), Dulbecco’s Modified Eagle Medium (DMEM; Gibco), and Minimum Essential Medium α (α-MEM; Gibco). All media included 1% (v/v) penicillin and streptomycin (P/S; Gibco) for preventing microbial contamination and 20 mM HEPES was added in DMEM and α-MEM for buffering. Depending on experimental design, either 20% (v/v) fetal bovine serum (FBS; Corning Life Sciences) or 20% (v/v) knockout serum replacement (KSR; Gibco) was added in each basal media and 10 ng/mL human basic fibroblast growth factor (bFGF; Gibco) was added or not. The primary explant culture was performed in a 28 °C incubator with air atmosphere and culture media were exchanged every 3 days. In this experiment, due to frequent microbial contamination during the primary explant culture, five independent experiments were performed for all experimental groups for the purpose of securing at least three replicates, and the replicates where microbial contamination occurred were excluded from the population. The tissue fragments were removed after culturing for 7 days. When the grown cells reached 80–90% confluency, subculture was conducted. For this, the cells were washed with DPBS 2 times and dissociated with 0.05% trypsin-EDTA (Gibco). After trypsin inactivation with one volume of DMEM containing 10% FBS, the cells were collected by centrifugation (400 g, 4 min). Then, the cells were suspended with culture media and seeded in 1:2 ratio on 0.1% gelatin-coated dishes. Cell culture was performed in same conditions with those of the primary explant culture. Cell morphology was observed under an inverted microscope (TS-100F; Nikon, Tokyo, Japan).
2.3. Analysis of the Growth Characteristics of Cell Lines
For measurement of cell growth rate, 3 × 10⁴ cells per well at passage 30–35 were seeded on 10 wells of 0.1% gelatin-coated 24 well culture dish (SPL Life Science) filled with DMEM supplemented with 20% FBS, 10 ng/mL bFGF, and 1% P/S and cultured for 9 days in a 28 °C incubator with air atmosphere. Culture media were changed every 3 days. The cells from two wells were individually sampled at culture days 1, 3, 5, 7 and 9, respectively, by trypsinization and cell numbers were counted with a hemocytometer (Marienfeld-Superior, Lauda-Königshofen, Germany). The mean value of two cell numbers from the same culture day was used as a result of one replicate. This experiment was repeated 3 times in an independent manner. The formula for cell doubling time was as follows: doubling time = duration × log(2)/{log(final concentration) − log(initial concentration)}. Cell growth status was observed under an inverted microscope every day. To investigate anchorage dependency of the cell lines, 6 × 10⁴ cells of each cell lines at passage 30–35 were seeded on 0.1% gelatin-coated 35 mm culture dishes or non-coated 35 mm petri dishes and cultured in DMEM supplemented with 20% FBS, 10 ng/mL bFGF, and 1% P/S under a 28 °C incubator with air atmosphere. After 7 days, adhesive and non-adhesive cells were individually collected, and cell numbers were counted with a hemocytometer after trypan blue (Gibco) staining. Cell viability was calculated as the percentage of live cells among all cells.
2.4. Induction of Differentiation
For differentiation induction, cells at passage 30–35 were cultured in 35 mm culture dishes at a density of 1.5 × 10⁵ cells/mL with culture media. On day 3 of culture when the cells reached 80–90% confluency, the medium was changed with differentiation medium consisting of DMEM supplemented with low concentration of serum and 1% P/S. For serum, horse serum (HS; Gibco) or FBS of 1% (v/v) or 2% (v/v) was used, according to the experiments. After culturing the cells for 4 days under differentiation medium, the cells were either analyzed for morphology and fusion index or sampled for gene expression analysis. As a comparative group of analyses of differentiation (marked as ‘growth medium’ group), the cells before differentiation induction that were cultured for 3 days in culture media were used. Media were changed every 2 days.
2.5. Measurement of Fusion Index
After differentiation induction, the cells were stained with Live/Dead Viability/Cytotoxicity kit (Molecular Probes, Eugene, OR, USA) to confirm survival and to clearly distinguish myotubes. In addition, nuclei were stained with Hoechst 33342 (Invitrogen, Waltham, MA, USA) which were diluted 1:2000 in DPBS. After staining, fusion index was calculated as the percentage of the number of nuclei within the myotubes out of the total number of nuclei. Fluorescent signals were detected with a TS-100F inverted microscope equipped with fluorescent unit. This experiment was repeated three times in an independent manner.
2.6. Reverse Transcription Polymerase Chain Reaction (RT-PCR) and Quantitative RT-PCR (qRT-PCR)
For RT-PCR, total RNA was extracted from the samples using RNeasy Mini Kit (Qiagen, Valencia, CA, USA) and cDNA was synthesized using GoScriptTM reverse transcription system (Promega, Madison, WI, USA) from 1 μg total RNA treated with DNase I (Sigma-Aldrich) according to the manufacturer’s instructions. Then, the synthesized cDNA was subjected to PCR analysis. PCR conditions were as follows: initial denaturation (95 °C for 3 min) followed by 30 cycles of amplification (denaturation: 95 °C for 30 s; annealing: 57 °C for 30 s; and elongation: 72 °C for 45 s). The PCR products were size-fractionalized on a 1.2% agarose (Young Sciences, Bucheon, Republic of Korea) gel and visualized by ethidium bromide (EtBr: Bioneer, Daejeon, Republic of Korea) staining. For qRT-PCR, cDNA was prepared as described above. The qRT-PCR was carried out using Applied Biosystems™ StepOne™ Real-Time PCR System (Applied Biosystems, Waltham, MA, USA) with AccuPower 2× GreenStarTM qPCR Master Mix (Bioneer). PCR conditions were as follows: initial denaturation (95 °C for 3 min) and 40 cycles of amplification (denaturation: 95 °C for 30 s; annealing: 57 °C for 30 s; and elongation: 72 °C for 30 s). The relative mRNA expression of each gene was quantified by the comparative 2−ΔΔCt method, where Ct = threshold cycle for target amplification, ΔCt = Cttarget gene − Ctinternal reference (GAPDH), and ΔΔCt = ΔCtsample − ΔCtcalibrator [28]. All primer sequences used in this study were presented in Table 1.

Table 1.
Sequences of primers used in this study.
2.7. Statistical Analysis
Significance analysis between experimental results was performed using SPSS (IBM SPSS Statistics 27; SPSS Inc., Chicago, IL, USA) or Statistical Analysis System (SAS; Cary, NC, USA) statistical programs. The doubling times, qRT-PCR results, and fusion indices were analyzed by an independent samples t-test or one-way analysis of variance (ANOVA) followed by Duncan’s post-hoc test using the SPSS statistical program. The results of the primary explant culture were analyzed using the generalized linear model of the SAS program. Significant differences among treatments were defined by a p < 0.05.
3. Results
3.1. Outcomes of Primary Explant Culture of A. schlegelii Muscle Tissues
To find an effective condition to secure primary cells from muscle tissues, the primary explant culture was conducted in various culture conditions that varied substrates (gelatin or Matrigel), media (L15, DMEM, or α-MEM), and serum (FBS or KSR) with or without bFGF (Table 2). After that, the efficiencies of primary cell adherence and first subculture were evaluated. Primary cell adherence was observed in all culture conditions, except for the condition that used L15 supplemented with KSR and bFGF on Matrigel, even though there were differences in its efficiency. Overall efficiency regardless of the culture conditions was found to be 73% (62 out of 85 replicates). For first subculture, the efficiency varied widely depending on culture conditions, and overall efficiency regardless of the culture conditions was identified to be 41% (35 out of 85 replicates) (Table 2). As shown in Table 3, use of DMEM or α-MEM resulted in higher efficiencies in both primary cell adherence and first subculture than use of L15, although no statistical differences have been identified (75–84% vs. 58%, for primary cell adherence and 39–57% vs. 27%, for first subculture). For sera components, it was observed that FBS was significantly more effective than KSR in both primary cell adherence (84% vs. 62%, p = 0.0235) and first subculture (65% vs. 17%, p < 0.0001). In the case of substrates and bFGF treatment, no significant difference was detected in either primary cell adherence or first subculture. When observed morphologically, cells that proliferated and spread out began to be identified around muscle tissue fragments from day 5 of culture and they proliferated continuously with a mixture of cells consisting of the two major cell types that showed myotube-like and fibroblast-like shapes (a picture of day 10 shown in Figure 1). Here, myotube-like cells meant long cylindrical cells, and fibroblast-like cells meant elongated cells of bipolar or multipolar shape. Around day 18 of culture, when the density of the cells increased by more than 70% confluency, most cells showed myotube-like shape. However, after first subculture, most cells showed fibroblast-like shape and myotube-like shape was rarely observed (Figure 1). Average time to reach 80–90% confluency was 20 ± 1.1 days. Collectively, these results indicated that the appropriate selection of media and sera was critical for the successful primary explant culture of A. schlegelii muscle tissues. For further experiments, we used gelatin, DMEM, and FBS as substrate, basal medium, and serum, respectively, by comprehensively considering culture efficiency and cost.
Table 2.
Outcomes of the primary explant culture of black sea bream (Acanthopagrus schlegelii) muscle tissue fragments.
Table 3.
Factors affecting outcomes of the primary explant culture.
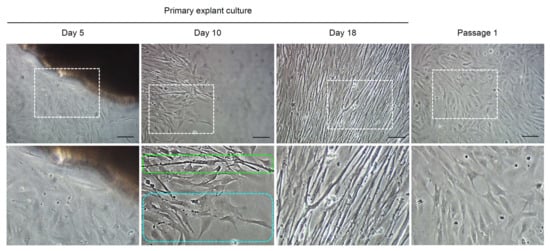
Figure 1.
Representative pictures showing the cells derived from the primary explant culture of muscle tissues. The pictures below are enlarged ones of the white dotted boxes in the pictures above. The green dotted box indicates myotube-like cells and the sky-blue dotted box indicates fibroblast-like cells. Scale bars = 100 µm.
3.2. Derivation of Cell Lines from A. schlegelii Muscle Tissues
As the next experiment, attempts to establish the cell lines from A. schlegelii muscle tissues were conducted. Previously, bFGF did not show any treatment effect in the primary explant culture. However, bFGF is a well-known factor that promotes the growth of muscle lineage cells in mammalian studies [29]. Therefore, the treatment effect of bFGF on cell line establishment was also investigated in this experiment. Above all, primary cells were secured from the primary explant culture of muscle tissue fragments cultured in DMEM supplemented with 20% FBS and 1% P/S in the presence or absence of 10 ng/mL bFGF on gelatin-coated dishes. Then, those cells were continuously subcultured in the same media and the efficiencies of subculture were observed. As shown in Figure 2A, although all cell populations tested were able to be subcultured to passage 10, regardless of bFGF treatment, 40% (2 out of 5) of cell lines cultured without bFGF died before passage 20 and later the others also died before passage 25. Unlike this, 60% (3 out of 5) of cell lines cultured with bFGF were able to be subcultured to passage 25 and these three cell lines (designated as cell lines 4, 7, and 10) were subcultured stably more than 35 times before being frozen. When the cellular morphology of cell lines was observed every 5 passages until passage 20, all cell lines, regardless of passage number and bFGF treatment, possessed a large number of cells showing a flat fibroblast-like shape and most cells had a single nucleus (Figure 2B). In morphological observation of cell lines 4, 7, and 10 at passage 30, it was observed that all three cell lines predominantly possessed fibroblast-like cells and contained a small number of epithelial cell-like cells. However, the proportion of epithelial cell-like cells was relatively higher in cell lines 7 and 10 than in cell line 4 (Figure 2C).
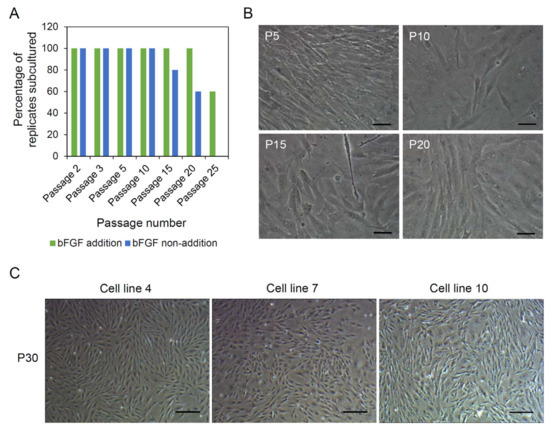
Figure 2.
Establishment of cell lines from muscle tissues. (A) Effect of basic fibroblast growth factor (bFGF) on cell line establishment. The primary explant culture and subculture were performed in the presence or absence of bFGF. Only the cell lines cultured with bFGF were able to be subcultured beyond passage 25. (B) Representative pictures showing the morphology of cell lines until passage 20. The cell lines contained large numbers of flat fibroblast-like cells. Most cells had a single nucleus. Scale bars = 40 µm. (C) Morphology of three cell lines (designated as cell lines 4, 7, and 10) at passage 30. All three cell lines predominantly possessed fibroblast-like cells, but more epithelial cell-like cells were shown in cell lines 7 and 10 than in cell line 4. Scale bars = 200 µm.
3.3. Characterization of A. schlegelii Muscle-Derived Cell Lines
Three cell lines at passage 30 were evaluated for the expression of three genes including Pax7, MyoD, and Myog that are known to be expressed in muscle lineage cells. As shown in Figure 3A, all three cell lines expressed Pax7 specific for muscle satellite cells but the expression of MyoD specific for myoblasts and Myog specific for myotubes was detected only in cell line 4 and not in cell lines 7 and 10. The growth rate of cell line 4 was highest among three cell lines but all proliferated continuously until day 9 of culture (Figure 3B,C). So, cellular doubling time was fastest in cell line 4 (62.1 ± 0.4 h, 87.5 ± 3.8 h, and 77.8 ± 3.9 h for cell lines 4, 7, and 10, respectively, p < 0.05). Experimental results of evaluating anchorage dependency of the cell lines showed that all cell lines adhered and grew when cultured in tissue culture-treated dishes (adhesive condition), whereas they did not adhere and grow when cultured in petri dishes (non-adhesive condition) (Figure 3D). In addition, the adhered cells from all cell lines showed the high cell viabilities of more than 92.5 ± 7.7%, unlike non-adhered cells that showed the cell viabilities of less than 50% (Figure 3E). Collectively, these results indicated that the established cell lines were anchorage dependent for their growth and survival.
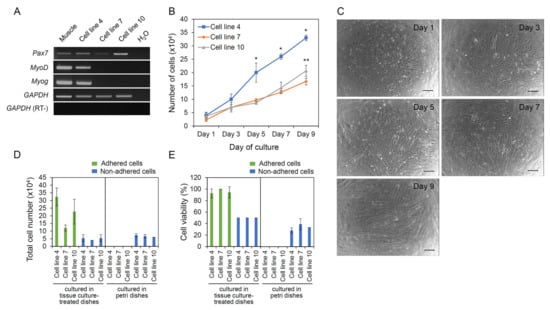
Figure 3.
Characterization of the established cell lines. Three muscle-derived cell lines were characterized for their gene expression and growth characteristics. (A) Results of RT-PCR analysis for the expression of Pax7 specific for muscle satellite cells, MyoD specific for myoblasts, and Myog specific for myotubes. (B) Growth rate of the cell lines. (C) Representative pictures of cells growing for 9 days. Scale bars = 200 µm. (D,E) Anchorage dependency test of the cell lines. Three cell lines were individually cultured on either tissue culture-treated dishes or petri dishes for 7 days, and total cell number (D) and cell viability (E) were measured. The values for (B,D,E) are expressed as mean ± standard deviation of at least three independent experiments. *,** Asterisks indicate significant differences (p < 0.05).
3.4. Evaluation of Differentiation Capacity of A. schlegelii Muscle-Derived Cell Lines
To investigate the differentiation capacity of the cell lines, three cell lines were cultured in differentiation medium consisting of DMEM supplemented with 2% HS and 1% P/S. As the results, morphological changes of the cells to myotubes were observed only in cell line 4. While culturing in the differentiation medium, the myogenic cells rapidly fused and formed a number of multinucleated myotubes at day 2 of culture, and after that they detached one by one from the dishes. At day 4 of culture, a relatively small number of myotubes was observed compared to day 2. In contrast to this, cell lines 7 and 10 did not form myotubes (Figure 4A). After 4 days of culture in the differentiation media, alteration of the mRNA levels of Pax7, MyoD, and Myog were examined in the cell lines, comparing with those before differentiation. For cell line 4, a significant increase was detected in Myog, but MyoD did not show significant difference. In the case of Pax7, there was no statistical difference, but a relatively high decrease of 2.7-fold was observed after differentiation induction. For cell lines 7 and 10, MyoD decreased significantly after differentiation induction in both cell lines, whereas Myog increased in both cell lines, although there was no statistical difference. Expression of Pax7 was significantly decreased in cell line 7 and significantly increased in cell line 10 after differentiation induction (Figure 4B).
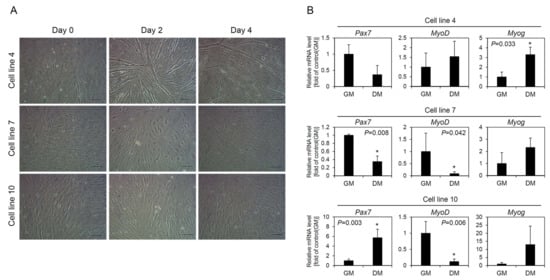
Figure 4.
Differentiation of muscle-derived cell lines. For differentiation induction, three cell lines were cultured in growth medium (GM) for 3 days and then cultured in differentiation medium (DM) using low concentration of horse serum for 4 days. (A) Morphological observation of cells after culture in DM for 4 days. Myotube formation was observed only in cell line 4 and not in cell lines 7 and 10. Scale bars = 100 µm. (B) Changes in expression of Pax7, MyoD, and Myog genes after differentiation induction of the cell lines. The mRNA levels of the cells cultured in DM for 4 days were compared to those of the cells cultured in GM for 3 days before differentiation induction. Different gene expression patterns were observed for each cell line. The values are expressed as mean ± standard deviation of three independent experiments. * Asterisks indicate significant differences (p < 0.05).
3.5. Effects of Serum Type and Concentration on Differentiation
To investigate the optimal serum type and concentration for differentiation, cell line 4 was induced to differentiate in four different media consisting of DMEM supplemented with 1% P/S and 1% HS, 2% HS, 1% FBS, or 2% FBS. No significant difference was detected in morphological observation among the groups. Myogenic cells in all media conditions rapidly formed myotubes through the fusion of each other on day 2 of culture after differentiation induction, and afterward they were detached from the dishes little by little. Live/dead staining showed that all myotubes formed were alive and the presence of multi-nuclei in myotubes was clearly observed. In the negative control that was cultured in growth media, myotube formation was not detected (Figure 5). The qRT-PCR analysis showed that there was no significant difference in Pax7 expression among treatment groups (Figure 6A1). However, a significant increase in MyoD expression was observed in the cells differentiated in 1% FBS compared to the control (cells cultured in growth media) (Figure 6A2). In the case of Myog, the expression was significantly increased in 2% HS, 1% FBS, and 2% FBS groups compared to the control (Figure 6A3). As a result of measuring the fusion index, a significantly higher fusion index was observed in 2% HS group compared to the other groups (40.1 ± 3.6% for 2% HS vs. 33.8 ± 2.1%, 31.5 ± 4.3%, and 32.3 ± 3.1% for 1% HS, 1% FBS, and 2% FBS, respectively, p < 0.05) (Figure 6B).
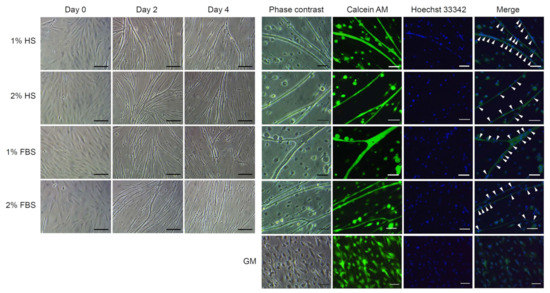
Figure 5.
Morphological observation after differentiation induction of cell line 4 depending on different serum types and concentrations. For differentiation induction, cell line 4 was cultured in growth medium (GM) for 3 days and then cultured in differentiation media containing 1% or 2% of horse serum (HS) or fetal bovine serum (FBS) for 4 days. During differentiation induction, morphological changes of the cells were observed through a microscope and on day 4, multinucleation of myotubes was confirmed by live/dead and Hoechst 33342 staining. No significant difference was detected in morphological observation among treatment groups. Arrowheads indicate nuclei. Scale bars = 100 µm for day 0, day 2, and day 4; 40 µm for phase contrast, calcein AM, Hoechst 33342, and merge.
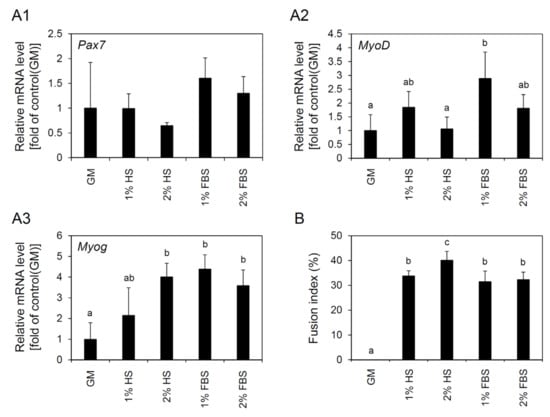
Figure 6.
Changes in gene expression and fusion index after differentiation induction of cell line 4 depending on different serum types and concentrations. For differentiation induction, cell line 4 was cultured in growth medium (GM) for 3 days and then cultured in differentiation media containing 1% or 2% of horse serum (HS) or fetal bovine serum (FBS) for 4 days. (A1–A3) Results of qRT-PCR analysis for the expression of Pax7 (A1), MyoD (A2), and Myog (A3) genes depending on differentiation conditions. No significant difference in Pax7 expression was observed among treatment groups. In contrast, expression levels of MyoD and Myog were observed differently according to the differentiation conditions. (B) Fusion index depending on differentiation conditions. The highest fusion index among the groups was observed under the condition using 2% HS. The values are expressed as mean ± standard deviation of three independent experiments, and abc different letters indicate significant differences (p < 0.05).
3.6. Differentiation of a Muscle Satellite Cell Line after Long-Term Culture
On the basis of the above experimental results, we defined cell line 4 as a skeletal muscle-derived myogenic cell line. To evaluate whether this skeletal muscle-derived myogenic cell line is able to retain its unique characteristics even after long-term culture, the cell line at passage 128, which was the passage we cultured for the longest time so far, was characterized for its differentiation capacity and the expression of myogenic regulatory genes after differentiation. As shown in Figure 7A,B, the skeletal muscle-derived myogenic cell line formed multinucleated myotubes after differentiation induction in spite of long-term culture, and the fusion index was found to be 25.7 ± 5.8% indicating that this cell line still maintained its differentiation capacity. Expression of Pax7 did not show a statistical difference between before and after differentiation. In the case of MyoD and Myog, the expression was significantly increased after differentiation (Figure 7C).
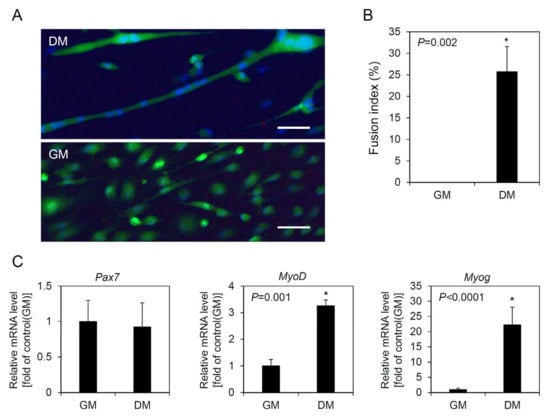
Figure 7.
Differentiation of a muscle satellite cell line after long-term culture. A muscle satellite cell line at passage 128 was cultured in growth medium (GM) for 3 days and then cultured in differentiation medium (DM) for 4 days to induce differentiation. (A) Picture showing a multinucleated myotube. Cells were stained with live/dead and Hoechst 33342 staining. Scale bars = 40 µm. (B) Fusion index. (C) Relative mRNA levels of myogenic regulatory genes between before and after differentiation. The values are expressed as mean ± standard deviation of three independent experiments. * Asterisks indicate significant differences (p < 0.05).
4. Discussion
In this study, we sought to establish stable muscle cell lines from black sea bream (A. schlegelii) that can be used for understanding muscle growth mechanisms and/or producing artificial meat. In order to establish cell lines stably, it is important to increase the success rate of the primary culture to secure the seed cells for cell line establishment. Therefore, we first investigated the effects of several well-known factors involved in cell culture on the primary explant culture of A. schlegelii muscle tissues. Among them, treatments of different types of substrates (gelatin and Matrigel) and basal media (L15, DMEM, and α-MEM) did not show a statistical difference for the efficiency of the primary culture. In addition, no difference was observed in its efficiency depending on bFGF treatment. However, the use of different types of serum (FBS and KSR) significantly influenced the results of the primary culture. When FBS was used, significantly higher efficiencies in both primary cell adherence and first subculture were observed compared to when KSR was used. FBS, as a well-known growth-promoting factor in cell culture, is usually added to the culture media at a concentration of 5 to 20% when culturing fish cell lines, indicating that this factor is essential for fish cell culture [30,31]. Likewise, it was demonstrated from this study that FBS was essential for culturing A. schlegelii muscle-derived cells. Moreover, many studies that cultured muscle-derived cells have included FBS in the culture media regardless of species ([32] for murine; [33] for human; [14] for bovine; [34] for porcine; [35] for chicken; and [22] for fish). These indicate that FBS plays a key role in in vitro growth of muscle-derived cells and is still an essential element for culturing them at the current technology level. However, it is important to find alternatives to FBS because it has several issues regarding cost and safety [36]. As one alternative to FBS, KSR has usually been used for culturing many different kinds of cell lines [37,38]. For muscle-derived cells, Choi et al. has reported that KSR induced the proliferation of muscle cells similar to FBS [3]. Unlike this, our results showed that KSR was less effective than FBS in the primary explant culture of A. schlegelii muscle tissues, suggesting the need to find other alternatives to FBS. On the other hand, because several primary cell populations (seed cells) were obtained from the media containing KSR, the availability of KSR may need to be evaluated in more depth through additional optimization processes.
Although bFGF did not exert any significant effects in the primary explant culture, it seemed to have a great influence on the continuous culture of the cell lines derived from A. schlegelii muscle tissues. The cell lines cultured in the media without bFGF did not grow beyond passage 25, whereas 60% (3 out of 5) of cell lines cultured in bFGF-containing media continuously grew until no longer cultured (cultured to 128, 80, and 35 passages for cell lines 4, 7, and 10, respectively). These results indicated that bFGF could give a suitable proliferation environment for A. schlegelii muscle-derived cell lines. This positive effect of bFGF on the culture of muscle-derived cell lines is also consistent with the results of several previous studies that cultured muscle cells from fish and mammals [23,29].
Muscle stem cells, called muscle satellite cells, exist in a quiescent state between the muscle fiber and the surrounding basement membrane, and are responsible for skeletal muscle regeneration [39,40]. Under injury, these muscle satellite cells become activated, proliferate, and make new skeletal muscle [41,42]. In the process of differentiation, muscle satellite cells differentiate into myoblasts and subsequently they generate myotubes via cell-to-cell fusion of myocytes differentiated from myoblasts [6]. It is known that quiescent muscle satellite cells highly express Pax7, myoblasts express MyoD and Myf5, and myocytes/myotubes express Myog [34,43,44]. Similarly, in fish, it was reported that the expression of Pax7, MyoD, and Myog was confirmed in muscle satellite cells, proliferating myoblasts, and differentiated myotubes of zebrafish (Danio rerio), respectively [45]. Through RT-PCR analysis of Pax7, MyoD, and Myog genes in three cell lines (cell lines 4, 7, and 10) at passage 30 (Figure 3A), we found that the expression of Pax7 was detected in all cell lines, indicating that all three cell lines included muscle satellite cells. In contrast, the expression of MyoD and Myog was detected only in cell line 4 but not in cell lines 7 and 10. However, because weak signals of MyoD and Myog expression were also detected in cell lines 7 and 10 from another experiment using 40 cycles of qRT-PCR (Figure 4B), it is speculated that all three cell lines contained all of the muscle satellite cells, myoblasts, and myocytes, and the proportion of each cell would be different from cell line to cell line. On the other hand, because Pax7 expression is not limited to muscle satellite cells but is also present in neuronal tissues [46], the cell lines established in this study might include other cell types from different lineage than muscle.
Under differentiation-inducing conditions that exposed the cells to a low concentration of serum, only cell line 4 formed myotubes and the other cell lines did not show significant changes in morphology. These results seem to be related to the above gene expression results that showed different expression of MyoD and Myog in three cell lines. Previously, it was shown that inhibition of MyoD resulted in transcriptional downregulation of its downstream genes including Myog, MRF4, Myf5, and MHC with no myotube formation [47]. Thus, the lack of MyoD and Myog expression in cell lines 7 and 10 might have led to the failure of differentiation induction. Detailed mechanisms for this need to be verified in further studies.
Generally, the differentiation of myoblasts involves the processes by which proliferating myoblasts exit the cell cycle and form myotubes through cell-to-cell fusion [48]. In the case of in vitro culture, serum starvation is a method usually used for myogenic differentiation of myoblasts. Serum that contains various growth factors promotes the proliferation of myoblasts, but when the serum is removed, the cell cycle arrests and myogenic differentiation is induced in vitro [49]. Until now, low concentrations of HS or FBS have been used for serum starvation to induce myogenic differentiation [14,34], and thus we tried to determine the optimal serum type and its concentration for myogenic differentiation of cell line 4. As the results, all treatment groups using 1% or 2% of HS or FBS formed myotubes but the efficiency of myotube formation was highest when 2% HS was used. Although this finding coincides with those from previous studies [22,34], it has not been clearly demonstrated why HS is effective in inducing myogenic differentiation. Further challenges should be to clarify the reason for this and ultimately find an efficient and safe differentiation-inducing substance, not serum.
5. Conclusions
From this study, we established black sea bream (A. schlegelii) skeletal muscle cell lines and analyzed their cellular characteristics. A cell line, designated as cell line 4, grew well continuously, expressed major myogenic regulatory genes including Pax7, MyoD, and Myog, and differentiated to form myotubes under serum starvation. Furthermore, it maintained its differentiation capacity to myotubes even after long-term culture. Based on these characteristics, we defined this cell line as a skeletal muscle-derived myogenic cell line. This cell line will not only be used as a great in vitro model for understanding the mechanisms involved in muscle growth in marine fish, but also provide a valuable cell source for the production of fish artificial cultured meat.
Author Contributions
Conceptualization, S.P.G.; methodology, D.H.H. and S.P.G.; validation, D.H.H. and S.P.G.; formal analysis, D.H.H.; investigation, D.H.H.; data curation, S.P.G.; writing—original draft preparation, D.H.H. and S.P.G.; writing—review and editing, S.P.G.; supervision, S.P.G.; funding acquisition, S.P.G. All authors have read and agreed to the published version of the manuscript.
Funding
This research was supported by Basic Science Research Program through the National Research Foundation of Korea (NRF) funded by the Ministry of Education (2021R1I1A3041760) and Busan Techno Park funded by the government (Busan) in 2023 (2023 Field-Based R&D Technology Development Project for Innovative Growth of Processed Fishery Foods).
Institutional Review Board Statement
The animal study protocol was approved by the Institutional Animal Care and Use Committee (IACUC) of Pukyong National University (approval No. PKNUIACUC-2021-32 and date of approval, 14 July 2021).
Informed Consent Statement
Not applicable.
Data Availability Statement
Data are contained within the article.
Conflicts of Interest
The authors declare no conflicts of interest.
References
- Koganti, P.; Yao, J.; Cleveland, B.M. Molecular mechanisms regulating muscle plasticity in fish. Animals 2020, 11, 61. [Google Scholar] [CrossRef]
- Mohammadabadi, M.; Bordbar, F.; Jensen, J.; Du, M.; Guo, W. Key genes regulating skeletal muscle development and growth in farm animals. Animals 2021, 11, 835. [Google Scholar] [CrossRef]
- Choi, K.H.; Yoon, J.W.; Kim, M.; Lee, H.J.; Jeong, J.; Ryu, M.; Lee, C.K. Muscle stem cell isolation and in vitro culture for meat production: A methodological review. Compr. Rev. Food Sci. Food Saf. 2021, 20, 429–457. [Google Scholar] [CrossRef]
- Lee, D.Y.; Lee, S.Y.; Jung, J.W.; Kim, J.H.; Oh, D.H.; Kim, H.W.; Hur, S.J. Review of technology and materials for the development of cultured meat. Crit. Rev. Food Sci. Nutr. 2023, 63, 8591–8615. [Google Scholar] [CrossRef]
- Potter, G.; Smith, A.S.; Vo, N.T.; Muster, J.; Weston, W.; Bertero, A.; Rostain, A. A more open approach is needed to develop cell-based fish technology: It starts with zebrafish. One Earth 2020, 3, 54–64. [Google Scholar] [CrossRef]
- Chal, J.; Pourquie, O. Making muscle: Skeletal myogenesis in vivo and in vitro. Development 2017, 144, 2104–2122. [Google Scholar] [CrossRef]
- Braun, T.; Gautel, M. Transcriptional mechanisms regulating skeletal muscle differentiation, growth and homeostasis. Nat. Rev. Mol. Cell Biol. 2011, 12, 349–361. [Google Scholar] [CrossRef] [PubMed]
- Yaffe, D. Retention of differentiation potentialities during prolonged cultivation of myogenic cells. Proc. Natl. Acad. Sci. USA 1968, 61, 477–483. [Google Scholar] [CrossRef] [PubMed]
- Yaffe, D.; Saxel, O.R.A. Serial passaging and differentiation of myogenic cells isolated from dystrophic mouse muscle. Nature 1977, 270, 725–727. [Google Scholar] [CrossRef] [PubMed]
- Jugran, A.K.; Rawat, S.; Devkota, H.P.; Bhatt, I.D.; Rawal, R.S. Diabetes and plant-derived natural products: From ethnopharmacological approaches to their potential for modern drug discovery and development. Phytother. Res. 2021, 35, 223–245. [Google Scholar] [CrossRef]
- Zschüntzsch, J.; Meyer, S.; Shahriyari, M.; Kummer, K.; Schmidt, M.; Kummer, S.; Tiburcy, M. The evolution of complex muscle cell In vitro models to study Pathomechanisms and drug development of neuromuscular disease. Cells 2022, 11, 1233. [Google Scholar] [CrossRef] [PubMed]
- Mau, M.; Oksbjerg, N.; Rehfeldt, C. Establishment and conditions for growth and differentiation of a myoblast cell line derived from the semimembranosus muscle of newborn piglets. In Vitro Cell. Dev. Biol. Anim. 2008, 44, 1–5. [Google Scholar] [CrossRef] [PubMed]
- Ding, S.; Wang, F.; Liu, Y.; Li, S.; Zhou, G.; Hu, P. Characterization and isolation of highly purified porcine satellite cells. Cell Death Discov. 2017, 3, 17003. [Google Scholar] [CrossRef] [PubMed]
- Ding, S.; Swennen, G.N.M.; Messmer, T.; Gagliardi, M.; Molin, D.G.M.; Li, C.; Post, M.J. Maintaining bovine satellite cells stemness through p38 pathway. Sci. Rep. 2018, 8, 10808. [Google Scholar] [CrossRef] [PubMed]
- Will, K.; Schering, L.; Albrecht, E.; Kalbe, C.; Maak, S. Differentiation of bovine satellite cell-derived myoblasts under different culture conditions. In Vitro Cell. Dev. Biol. Anim. 2015, 51, 885–889. [Google Scholar] [CrossRef] [PubMed]
- Montserrat, N.; Gabillard, J.C.; Capilla, E.; Navarro, M.I.; Gutiérrez, J. Role of insulin, insulin-like growth factors, and muscle regulatory factors in the compensatory growth of the trout (Oncorhynchus mykiss). Gen. Comp. Endocrinol. 2007, 150, 462–472. [Google Scholar] [CrossRef]
- Bower, N.I.; Johnston, I.A. Paralogs of Atlantic salmon myoblast determination factor genes are distinctly regulated in proliferating and differentiating myogenic cells. Am. J. Physiol. Regul. Integr. Comp. Physiol. 2010, 298, 1615–1626. [Google Scholar] [CrossRef]
- Seiliez, I.; Sabin, N.; Gabillard, J.C. Myostatin inhibits proliferation but not differentiation of trout myoblasts. Mol. Cell. Endocrinol. 2012, 351, 220–226. [Google Scholar] [CrossRef]
- Codina, M.; Capilla, E.; Jiménez-Amilburu, V.; Navarro, I.; Du, S.J.; Johnston, I.A.; Gutiérrez, J. Characterisation and expression of myogenesis regulatory factors during in vitro myoblast development and in vivo fasting in the gilthead sea bream (Sparus aurata). Comp. Biochem. Physiol. Part A. Mol. Integr. Physiol. 2014, 167, 90–99. [Google Scholar]
- Gabillard, J.C.; Sabin, N.; Paboeuf, G. In vitro characterization of proliferation and differentiation of trout satellite cells. Cell Tissue Res. 2010, 342, 471–477. [Google Scholar] [CrossRef]
- Peng, L.M.; Zheng, Y.; You, F.; Wu, Z.H.; Tan, X.; Jiao, S.; Zhang, P.J. Comparison of growth characteristics between skeletal muscle satellite cell lines from diploid and triploid olive flounder Paralichthys olivaceus. PeerJ 2016, 4, e1519. [Google Scholar] [CrossRef] [PubMed]
- Kong, X.; Wang, X.; Li, M.; Song, W.; Huang, K.; Zhang, F.; Zhang, Q.; Qi, J.; He, Y. Establishment of myoblast cell line and identification of key genes regulating myoblast differentiation in a marine teleost, Sebastes schlegelii. Gene 2021, 802, 145869. [Google Scholar] [CrossRef] [PubMed]
- Chong, G.L.; Böhmert, B.; Lee, L.E.; Bols, N.C.; Dowd, G.C. A continuous myofibroblast precursor cell line from the tail muscle of Australasian snapper (Chrysophrys auratus) that responds to transforming growth factor beta and fibroblast growth factor. In Vitro Cell. Dev. Biol. Anim. 2022, 58, 922–935. [Google Scholar] [CrossRef] [PubMed]
- Saad, M.K.; Yuen, J.S., Jr.; Joyce, C.M.; Li, X.; Lim, T.; Wolfson, T.L.; Kaplan, D.L. Continuous fish muscle cell line with capacity for myogenic and adipogenic-like phenotypes. Sci. Rep. 2023, 13, 5098. [Google Scholar] [CrossRef] [PubMed]
- Xu, E.; Niu, R.; Lao, J.; Zhang, S.; Li, J.; Zhu, Y.; Liu, D. Tissue-like cultured fish fillets through a synthetic food pipeline. NPJ Sci. Food 2023, 7, 17. [Google Scholar] [CrossRef] [PubMed]
- Chen, Y.; Sagada, G.; Xu, B.; Chao, W.; Zou, F.; Ng, W.K.; Sun, Y.; Wang, L.; Zhong, Z.; Shao, Q. Partial replacement of fishmeal with Clostridium autoethanogenum single-cell protein in the diet for juvenile black sea bream (Acanthopagrus schlegelii). Aquac. Res. 2019, 51, 1000–1011. [Google Scholar] [CrossRef]
- Wang, L.; Zhang, W.; Gladstone, S.; Ng, W.K.; Zhang, J.; Shao, Q. Effects of isoenergetic diets with varying protein and lipid levels on the growth, feed utilization, metabolic enzymes activities, antioxidative status and serum biochemical parameters of black sea bream (Acanthopagrus schlegelii). Aquaculture 2019, 513, 734397. [Google Scholar] [CrossRef]
- Livak, K.J.; Schmittgen, T.D. Analysis of relative gene expression data using real-time quantitative PCR and the 2−ΔΔCT method. Methods 2001, 25, 402–408. [Google Scholar] [CrossRef]
- Park, J.; Lee, J.; Song, K.D.; Kim, S.J.; Kim, D.C.; Lee, S.C.; Shim, K. Growth factors improve the proliferation of Jeju black pig muscle cells by regulating myogenic differentiation 1 and growth-related genes. Anim. Biosci. 2021, 34, 1392. [Google Scholar] [CrossRef]
- Freshney, R.I. Culture of Animal Cells; Wiley-Blackwell: Hoboken, NJ, USA, 2010; pp. 107–114. [Google Scholar]
- Lakra, W.S.; Swaminathan, T.R.; Joy, K.P. Development, characterization, conservation and storage of fish cell lines: A review. Fish. Physiol. Biochem. 2011, 37, 1–20. [Google Scholar] [CrossRef]
- Feige, P.; Rudnicki, M.A. Isolation of satellite cells and transplantation into mice for lineage tracing in muscle. Nat. Protoc. 2022, 15, 1082–1097. [Google Scholar] [CrossRef] [PubMed]
- Martin, N.R.; Passey, S.L.; Player, D.J.; Khodabukus, A.; Ferguson, R.A.; Sharples, A.P.; Lewis, M.P. Factors affecting the structure and maturation of human tissue engineered skeletal muscle. Biomaterials 2013, 34, 5759–5765. [Google Scholar] [CrossRef] [PubMed]
- Choi, K.W.; Yoon, J.W.; Kim, M.S.; Jeong, J.S.; Ryu, M.K.; Park, S.K.; Jo, C.R.; Lee, C.K. Optimization of culture conditions for maintaining pig muscle Stem cells In vitro. Food Sci. Anim. Resour. 2020, 40, 659–667. [Google Scholar] [CrossRef] [PubMed]
- Zhang, G.; Chen, F.; Wu, P.; Li, T.; He, M.; Yin, X.; Dai, G. MicroRNA-7 targets the KLF4 gene to regulate the proliferation and differentiation of chicken primary myoblasts. Front. Genet. 2020, 11, 842. [Google Scholar] [CrossRef]
- Van der Valk, J.; Bieback, K.; Buta, C.; Cochrane, B.; Dirks, W.; Fu, J.; Gstraunthaler, G. Fetal bovine serum (FBS): Past–present–future. Altex 2018, 35, 99–118. [Google Scholar] [CrossRef] [PubMed]
- Liu, K.; Wang, F.; Ye, X.; Wang, L.; Yang, J.; Zhang, J.; Liu, L. KSR-based medium improves the generation of high-quality mouse iPS cells. PLoS ONE 2014, 9, e105309. [Google Scholar] [CrossRef] [PubMed]
- Zhang, X.; Wang, L.; Zhang, X.; Ren, L.; Shi, W.; Tian, Y.; Zhang, T. The use of KnockOut serum replacement (KSR) in three dimensional rat testicular cells co-culture model: An improved male reproductive toxicity testing system. Food Chem. Toxicol. 2017, 106, 487–495. [Google Scholar] [CrossRef]
- Zammit, P.; Beauchamp, J. The skeletal muscle satellite cell: Stem cell or son of stem cell? Differentiation 2001, 68, 193–204. [Google Scholar] [CrossRef]
- Montarras, D.; L’honore, A.; Buckingham, M. Lying low but ready for action: The quiescent muscle satellite cell. FEBS J. 2013, 280, 4036–4050. [Google Scholar] [CrossRef]
- Bischoff, R.; Heintz, C. Enhancement of skeletal muscle regeneration. Dev. Dyn. 1994, 201, 41–54. [Google Scholar] [CrossRef]
- Shi, X.; Garry, D.J. Muscle stem cells in development, regeneration, and disease. Genes. Dev. 2006, 20, 1692–1708. [Google Scholar] [CrossRef]
- Kim, M.J.; Hwang, S.H.; Lim, J.A.; Froehner, S.C.; Adams, M.E.; Kim, H.S. α-Syntrophin modulates myogenin expression in differentiating myoblasts. PLoS ONE 2010, 5, e15355. [Google Scholar] [CrossRef]
- Ganassi, M.; Badodi, S.; Ortuste Quiroga, H.P.; Zammit, P.S.; Hinits, Y.; Hughes, S.M. Myogenin promotes myocyte fusion to balance fibre number and size. Nat. Commun. 2018, 9, 4232. [Google Scholar] [CrossRef]
- Berberoglu, M.A.; Gallagher, T.L.; Morrow, Z.T.; Talbot, J.C.; Hromowyk, K.J.; Tenente, I.M.; Amacher, S.L. Satellite-like cells contribute to pax7-dependent skeletal muscle repair in adult zebrafish. Dev. Biol. 2017, 424, 162–180. [Google Scholar] [CrossRef] [PubMed]
- Thompson, J.A.; Ziman, M. Pax genes during neural development and their potential role in neuroregeneration. Prog. Neurobiol. 2011, 95, 334–351. [Google Scholar] [CrossRef] [PubMed]
- Testa, S.; D’Addabbo, P.; Fornetti, E.; Belli, R.; Fuoco, C.; Bernardini, S.; Gargioli, C. Myoblast myogenic differentiation but not fusion process is inhibited via MyoD tetraplex interaction. Oxid. Med. Cell. Longev. 2018, 2018, 7640272. [Google Scholar] [CrossRef]
- Schmidt, M.; Schüler, S.C.; Hüttner, S.S.; von Eyss, B.; von Maltzahn, J. Adult stem cells at work: Regenerating skeletal muscle. Cell. Mol. Life Sci. 2019, 76, 2559–2570. [Google Scholar] [CrossRef]
- Zhang, P.; Wong, C.; Liu, D.; Finegold, M.; Harper, J.W.; Elledge, S.J. p21CIP1 and p57KIP2 control muscle differentiation at the myogenin step. Genes. Dev. 1999, 13, 213–224. [Google Scholar] [CrossRef] [PubMed]
Disclaimer/Publisher’s Note: The statements, opinions and data contained in all publications are solely those of the individual author(s) and contributor(s) and not of MDPI and/or the editor(s). MDPI and/or the editor(s) disclaim responsibility for any injury to people or property resulting from any ideas, methods, instructions or products referred to in the content. |
© 2024 by the authors. Licensee MDPI, Basel, Switzerland. This article is an open access article distributed under the terms and conditions of the Creative Commons Attribution (CC BY) license (https://creativecommons.org/licenses/by/4.0/).