Article

The Application of Cryogenic Carbon Capture Technology on the Dual-Fuel Ship through the Utilisation of LNG Cold Potential

by
Sergejus Lebedevas
and
Audrius Malūkas
*
Faculty of Marine Technologies and Natural Sciences, Klaipeda University, Bijunu str. 17, 91225 Klaipeda, Lithuania
*
Author to whom correspondence should be addressed.
J. Mar. Sci. Eng. 2024, 12(2), 217; https://doi.org/10.3390/jmse12020217
Submission received: 14 December 2023 / Revised: 11 January 2024 / Accepted: 17 January 2024 / Published: 25 January 2024

Abstract

:
The International Maritime Organization (IMO) has set targets to reduce carbon emissions from shipping by 40% by 2030 (IMO2030) and 70% by 2040 (IMO2050). Within the framework of decarbonising the shipping industry, liquefied natural gas (LNG) fuel and carbon capture technologies are envisioned as a transitional option toward a pathway for clean energy fuels. The aim of the complex experimental and computational studies performed was to evaluate the CO2 capture potential through the utilisation of LNG cold potential on the FSR-type vessel within a dual-fuel propulsion system. Based on the experimental studies focused on actual FSRU-type vessel performance, the energy efficiency indicators of the heat exchanging machinery were determined to fluctuate at a 0.78–0.99 ratio. The data obtained were used to perform an algorithm-based systematic comparison of energy balances between LNG regasification and fuel combustion cycles on an FSRU-type vessel. In the due course of research, it was determined that LNG fuel combustion requires 18,254 kJ/kg energy to separate and capture CO2 in the liquid phase to form exhaust gas; meanwhile, low sulfur marine diesel oil (LSMDO) requires 13,889 kJ/kg of energy. According to the performed calculations, the regasification of 1 kg LNG requires 1018 kJ/kg energy, achieving a cryogenic carbon capture ratio of 5–6% using LNG as a fuel and 7–8% using LSMDO as a fuel. The field of carbon capture in the maritime industry is currently in its pioneering stage, and the results achieved through research establish an informative foundation that is crucial for the constructive development and practical implementation of cryogenic carbon capture technology on dual-fuel ships.

1. Introduction

The maritime industry is part of the decarbonisation strategy because, despite technological advances in recent years, the maritime sector is almost entirely dependent on fossil fuels. In recent years, several measures have been adopted to ensure that the International Maritime Organization (IMO) targets to reduce greenhouse gas (GHG) emissions will be achieved. Compared to 2008 levels, the IMO targets include a 20% reduction in GHG by 2030 and a 70% reduction by 2040 [1].
The measures taken by international organisations reflect on financial liabilities, wherein vessel operators following the adopted European Union Emission Trading System (EU ETS) regulation will be obligated to pay taxes for the emitted CO2 emissions during the voyages that begin or end at a port under the jurisdiction of an EU member state. According to the adopted EU ETS (Directive 2003/87/EC), it will cover maritime transport emissions from 1 January 2024 [2]. The regulation principle for maritime transport will remain the same as for other ETS sectors. Shipping companies will have to monitor their own emissions and then purchase and surrender ETS emission allowances for each tonne of emitted GHG at the end of the year. It must be highlighted that the complete EU ETS implementation into the maritime transport sector will be achieved through several stages: from 2024, shipping companies will have to cover 40% of emission generated throughout 2024 and 70% of GHG emission generated in 2025 and then from 2026, must cover 100% of surrendered emissions. In addition, implementation will be scaled by type and size of ship: ships over 5000 gross tonnage (GT) carrying cargo or passengers on commercial voyages will be covered by the EU ETS from 2024; then, from 2025, the EU Monitoring, Reporting and Verification (MRV) will apply to general cargo ships between 400 and 5000 GT on commercial voyages. Following the established European climate law and the FuelEU maritime initiative, the financial EU ETS model is expected to be one of the key factors in reducing EU emissions by up to 80% by 2050 to encourage the uptake of renewable and low-carbon fuels in shipping. In general terms, since the EU ETS was introduced in 2005, EU emissions have fallen by a solid 41%, according to the European Council of the European Union [3]. According to the long-term forecast of the European price of carbon allowances, the price of a unit could potentially reach EUR 150 per tonne of CO2 by the year 2030.
To achieve the objectives of the strategy, the IMO has introduced the measures through requirements under MARPOL Annex VI: Energy Efficiency Design Index (EEDI)—applicable to new ships only; Energy Efficiency Existing Ships Index (EEXI)—applicable to all ships; Carbon Intensity Indicator (CII)—applicable to all ships. Moreover, in 2022, during the 79th session of the IMO’s Marine Environmental Protection Committee (MEPC 79) confirmed the adoption of a Sulphur Emission Control Area (SECA) in the Mediterranean Sea from 1 May 2023. In such a zone, the limit for sulphur in fuel oil on board ships is 0.10% mass by mass [4].
The Energy Efficiency Design Index (EEDI) quantifies the energy efficiency per capacity mile for various ship types and sizes (in grams of CO2 per tonne-mile). This regulation, introduced in 2011, aimed to expedite the adoption of energy-efficient and pioneering technologies in ships, including propulsion optimisation, engine enhancement, energy efficiency technologies, and carbon capture implementation. Starting 1 April 2022, the EEDI Phase 3 took effect with the regulation that ships built from April 2022 onward exhibit a carbon intensity at least 30–50% lower than the established baseline [5].
On 1 November 2022, the amendments to Annex VI of the International Convention for the Prevention of Pollution from Ships came into force. The amendment delegates ships to enhance their energy efficiency, aiming to reduce CO2 emissions. Following the amendment, from 1 January 2023, it will be mandatory for all ships to calculate their EEXI and, at the same time, initiate the collection of data for the reporting of the annual operational carbon intensity indicator (CII) and rating. The EEXI represents the minimum energy efficiency standards for ships already in service and applies to all cargo and passenger ships over 400 GT falling under MARPOL Annex VI, with the exception that the EEXI does not apply to ships built to EEDI Phase 2 or Phase 3 requirements [6]. As part of the IMO regulations, the EEXI stands out as a key initiative to encourage the adoption of environmentally friendly technologies to reduce the carbon footprint of the maritime sector. Similar to the EEDI, the EEXI assessment is based on ship design parameters, including equipment specifications and technical data. Neither index calculation method included carbon capture technologies as an index minimising factor, which is why the International Chamber of Shipping submitted a formal request to the IMO’s Marine Environment Protection Committee in September 2022 to include carbon capture technologies in the IMO’s regulatory framework to reduce greenhouse gas emissions from ships. The proposed amendment to the EEDI formula is presented in Equation (1) [7].
j = 1 n f j × i = 1 n M E P M E i × C F M E i × S F C M E i + P A E × C F A E × S F C A E + j = 1 n f j × i = 1 n P T I P P T I i i = 1 n e f f f e f f i × P A E e f f i × C F A E × S C F A E i = 1 n e f f f e f f i × P e f f i × C F M E × S F C M E i = 1 n C C S f c a p t u r e i × Q C C S i f c × f i × f l × C a p a s i t y × f w × f m × V r e f
where Q C C S ( i ) is the quantity in tonnes of CO2 captured and stored onboard per hour of operation at the shaft power of the engine.
f c a p t u r e = C O 2 c a p a s i t y i = 1 n C F i × F u e l o n b o a r d i
where C O 2   c a p a s i t y is the total available storage volume of CO2 in tonnes; Fuelonboard is 50% of fuel’s total storage tank capacity in tonnes.
Another measure introduced by the IMO is the CII, which measures emissions in grams of CO2 emitted per cargo-carrying capacity and nautical mile. Based on the CII assessment, ships are classified as A, B, C, D or E. If a ship has a D rating for three consecutive years or an E rating for one year, it must provide a reduction strategy in the Ship Energy Efficiency Management Plan (SEEMP Part III) [8]. This plan should include steps to achieve the required C-rating or better. Due to the characteristics of LNG fuel and the advantages over Low Sulphur Marine Diesel Oil (LS-MDO) in the CII classification, LNG-fuelled ships are classified above Class A. The measures implemented are in line with decarbonisation strategies and are seen as an acceleration point for the integration of LNG fuel in the maritime sector, considering LNG as a transition fuel on the way to clean energy with the capability to reduce CO2 emissions by 25% compared to low-sulphur marine diesel oil. In DNV’s 2023 Maritime Forecast to 2050 report, it was highlighted that new technologies and fuel production will need to be developed for shipping to meet its decarbonisation targets. DNV’s observation can be seen through the CII measure, where it is foreseen that around 2030, the LNG-fuelled ships will need to introduce additional technologies to remain compliant with the carbon intensity standards [9]. Figure 1 illustrates the comparison of LNG-fuelled ships according to the CII classification and the decarbonisation target towards 2050, where the Carbon Capture, Storage, and Utilization (CCSU) could serve as a potential solution. According to the National Energy Technology Laboratory’s database, 397 carbon capture and storage projects are registered worldwide as of 2023. In relation to the growing potential of CCS, in September 2023, the DNV released class guideline No. DNV-CG-0667 for CCS implementation onboard ships [10].
Carbon capture technologies encompass various methods aimed at capturing carbon dioxide (CO2) emissions from industrial processes or directly from the atmosphere. The field of carbon capture and storage (CCS) technology has become a more discussed topic. The principle of this technology is to eliminate CO2 before it is emitted into the atmosphere. The CO2 capture technologies can be grouped into three main types: pre-combustion capture, oxy-fuel combustion capture and post-combustion capture [12].
Pre-combustion capture is based on a method of removing CO2 before the fuel combustion cycle. In the pre-combustion process, fossil fuels are gasified and reformed by air and water vapour through steam reforming reactions and water-gas shift reactions prior to combustion. Finally, the CO2 and H2 are separated in a gas separator, where the H2 is used as hydrogen fuel, and the CO2 is captured for storage and further utilisation. This technology allows for low energy consumption and a CO2 capture efficiency of close to 90% [13]. However, the implementation of pre-combustion technology on existing ships would require the retrofitting of engines with hydrogen-fuelled engines, which would be too costly, and therefore, this technology is not considered compatible with ships in service. The schematical layout of pre-combustion technology is presented in Figure 2.
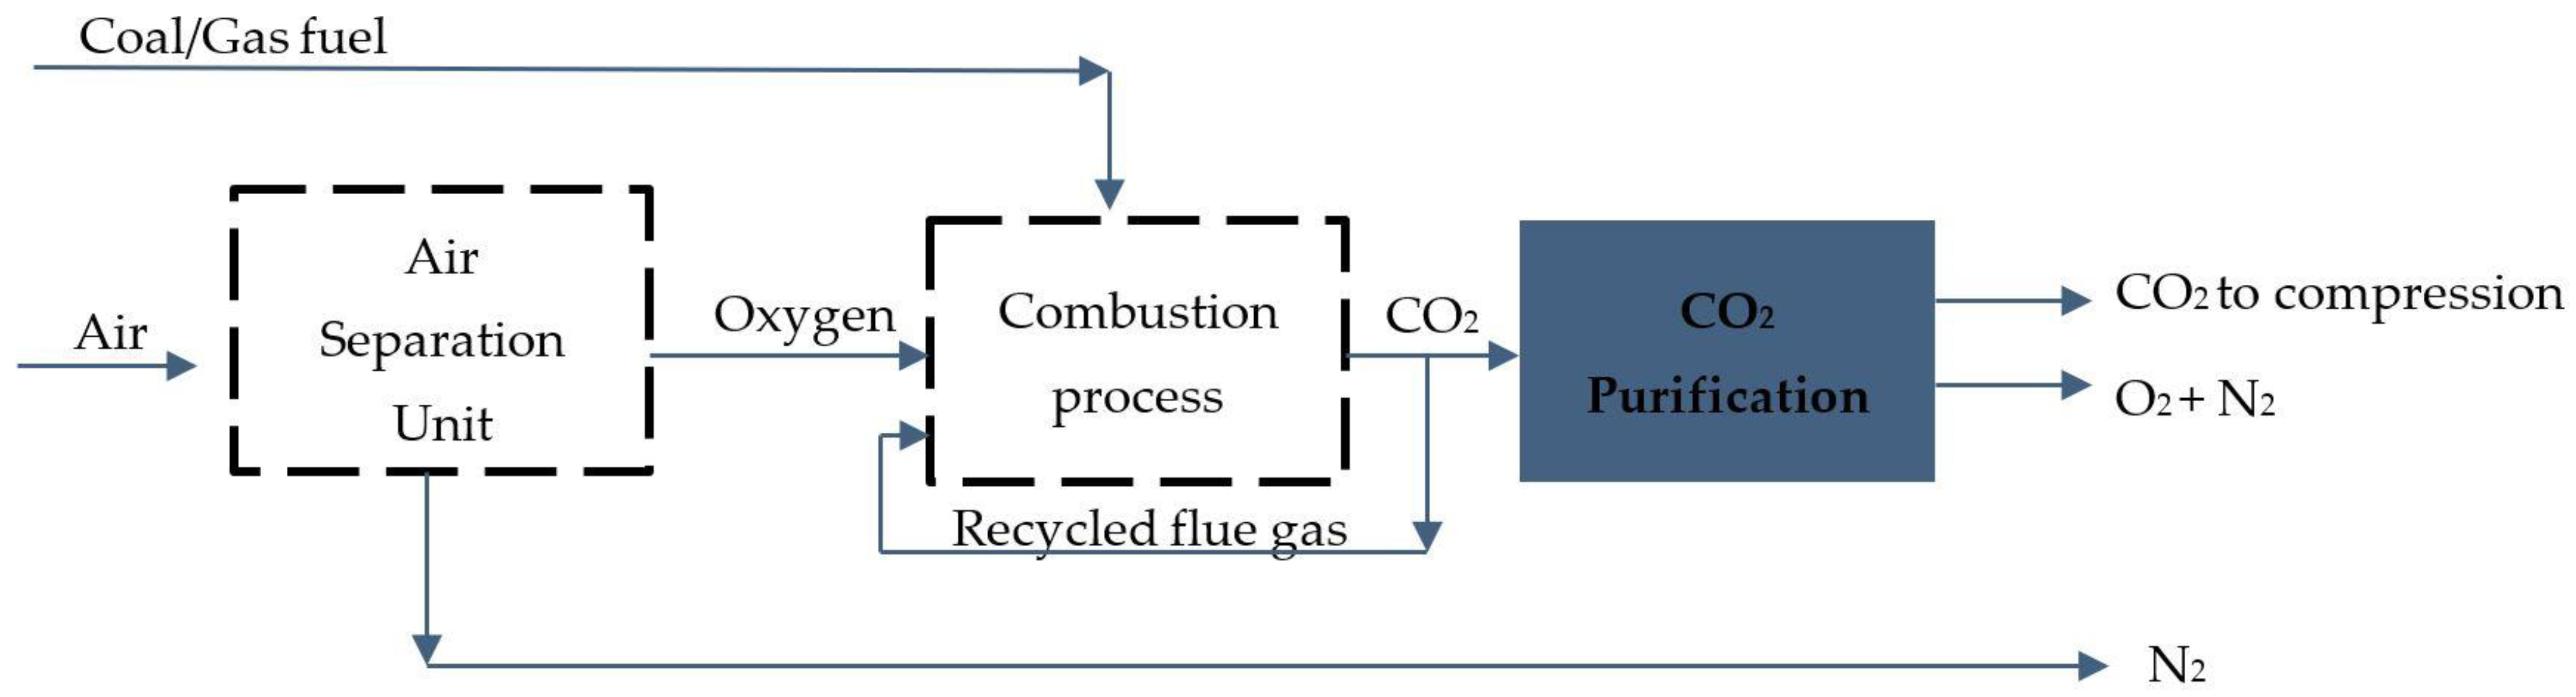
Oxy-fuel combustion carbon capture is based on the fossil fuel combustion cycle where pure oxygen is added to the combustion process instead of air, resulting in CO2 and water vapour after combustion, which means fuel is burnt to have zero carbon emission. The CO2 and H2O vapours are then separated by a condensation cycle. The implementation of oxy-fuel combustion capture on the ship would require a huge amount of pure oxygen supply, so ship technology would require extensive modification and investment in an air separation unit and additional power supply to produce pure oxygen in the first stage and after the combustion cycle to perform H2O separation in the CO2 drying process. For these reasons, the technology is not considered to be an effective solution for reducing GHG emissions from ships [15]. The schematical layout of oxy-combustion technology is presented in Figure 3.
Post-combustion capture is based on the method of capturing CO2 from the flue gas after the combustion cycle of fossil fuel in exhaust flow [16]. This technology stands out from others due to its installation possibility, which does not require wide modification and compatibility with existing equipment. The main technological intervention relates to modifying exhaust gas and integrating additional equipment into it. Due to this main advantage, compared to other types of carbon capture technologies, post-combustion capture is the technology most compatible with maritime transport. Moreover, the post-combustion technologies are even more compatible with LNG plants where the LNG cryogenic cold potential could be combined with carbon capture technology without major modification to the existing facility. Moreover, there is a good amount of experience with post-combustion capture technologies in power plans that provide confidence in the effectiveness of the technology and in the event of failure of the carbon capture facility, the performance of the ship’s engines or associated essential equipment will not be affected as the exhaust gas can be diverted to the atmosphere. [17]. The schematical layout of post-combustion technology is presented in Figure 4.
In 2021, the Oil and Gas Climate Initiative (OGCI), together with Sena Bulk and the Netherlands Organisation for Applied Scientific Research (TNO), conducted a feasibility study to assess the feasibility of carbon capture on ships. A published report compared carbon capture technologies, with post-combustion cryogenic carbon capture and chemical absorption technologies being the most compatible with ships. The chemical absorption process based on liquid amine solution was selected as the most compatible solution for LSMDO-fuelled Suezmax-type vessels due to its high level of maturity. The cryogenic capture approach was highlighted as the most compatible solution for LNG-fuelled vessels due to the availability of LNG cold temperature potential of −160 °C in cogeneration cycles to bring the exhaust gas down to temperature condition equal to the liquid phase of CO2 at a relatively low 4% concentration. The advantage of cryogenic carbon capture technology against the other towards CO2 capture is made considering the amount of energy potential from the LNG vapourisation process of LNG supply as fuel to engines; therefore, it is necessary to highlight that such an amount of energy is negligible compared to available energy potential on the Floating Storage Regasification Unit (FSRU) [18].
Table 1 contains the assessment criteria of technology that has the highest effectiveness towards carbon capture. One of the main criteria is the carbon capture ratio, where the chemical absorption method and cryogenic separation method stand as leading options against the other two. The cryogenic separation requires cryogenic temperature when the exhaust gas is being cooled down to the CO2 liquefaction phase. Meanwhile, membrane separation is based on the filtration method. Khalilpour et al. [19] explain that the membrane separation method has selective permeability, allowing CO2 molecules to pass through more easily than other gases due to their size and chemical properties. This allows the CO2 to separate from the rest of the gases. The absorption is different as well, where the method engages sorbents in the process of separation. Heidari et al. [20] performed a study of the practical application of CaO-based sorbents practical application which is considered the most advantageous type of sorbent due to various benefits, such as high theoretical sorption capacity and ability to capture CO2 at temperatures above 500 °C.
The FSRUs carry out the regasification process of LNG, which is a natural gas whose main composition is methane with some mixture of ethane, which has been cooled to the liquid phase and has a temperature of −160 °C. The FSRU is classified as a tanker-class vessel designed for regasification operations. Although the FSRU vessel is considered a convenient alternative to a land-based LNG terminal, it is not exempt from the IMO’s decarbonisation targets [22]. Regardless of the propulsion complex type, the LNG regasification cycle is theoretically identical when the cargo is transferred from the LNG tanks to the high-pressure booster pump, whose purpose is to increase the LNG pressure before entering the LNG vapouriser where the LNG is heated and sent to the grid [23]. The thermal energy for LNG regasification is extracted from the seawater, which is used as a heat source to raise the temperature of the refrigerant, which is then in direct contact with the LNG in the vapouriser. The regasification of FSRU vessels can be operated in one of three ways:
  • Closed-loop mode, in which the seawater in a closed system is heated by the steam produced from FSRU regasification boilers;
  • In open-loop mode, the warm water is drawn in through the FSRU’s sea chest. The warm seawater is used as a heat source to heat the regasification agent;
  • A combined mode is used in which the colder water is drawn in and then heated by steam from FSRU regasification boilers to provide sufficient heat for the regasification of the LNG [23].
Due to the heat exchange operation on the FSRU vessel, the cryogenic carbon capture technology can be technically compatible with LNG regasification methods by strategically integrating processes to mitigate energy demands. Considering various regasification modes, such as combined and closed-loop configurations, the higher energy consumption necessitates a balance that incorporates additional steam production. The introduction of LNG carbon capture technology can be facilitated through meticulous heat exchange operations, ensuring minimal energy input and maintaining the efficiency of the LNG infrastructure and compliance with environmental regulations [24].
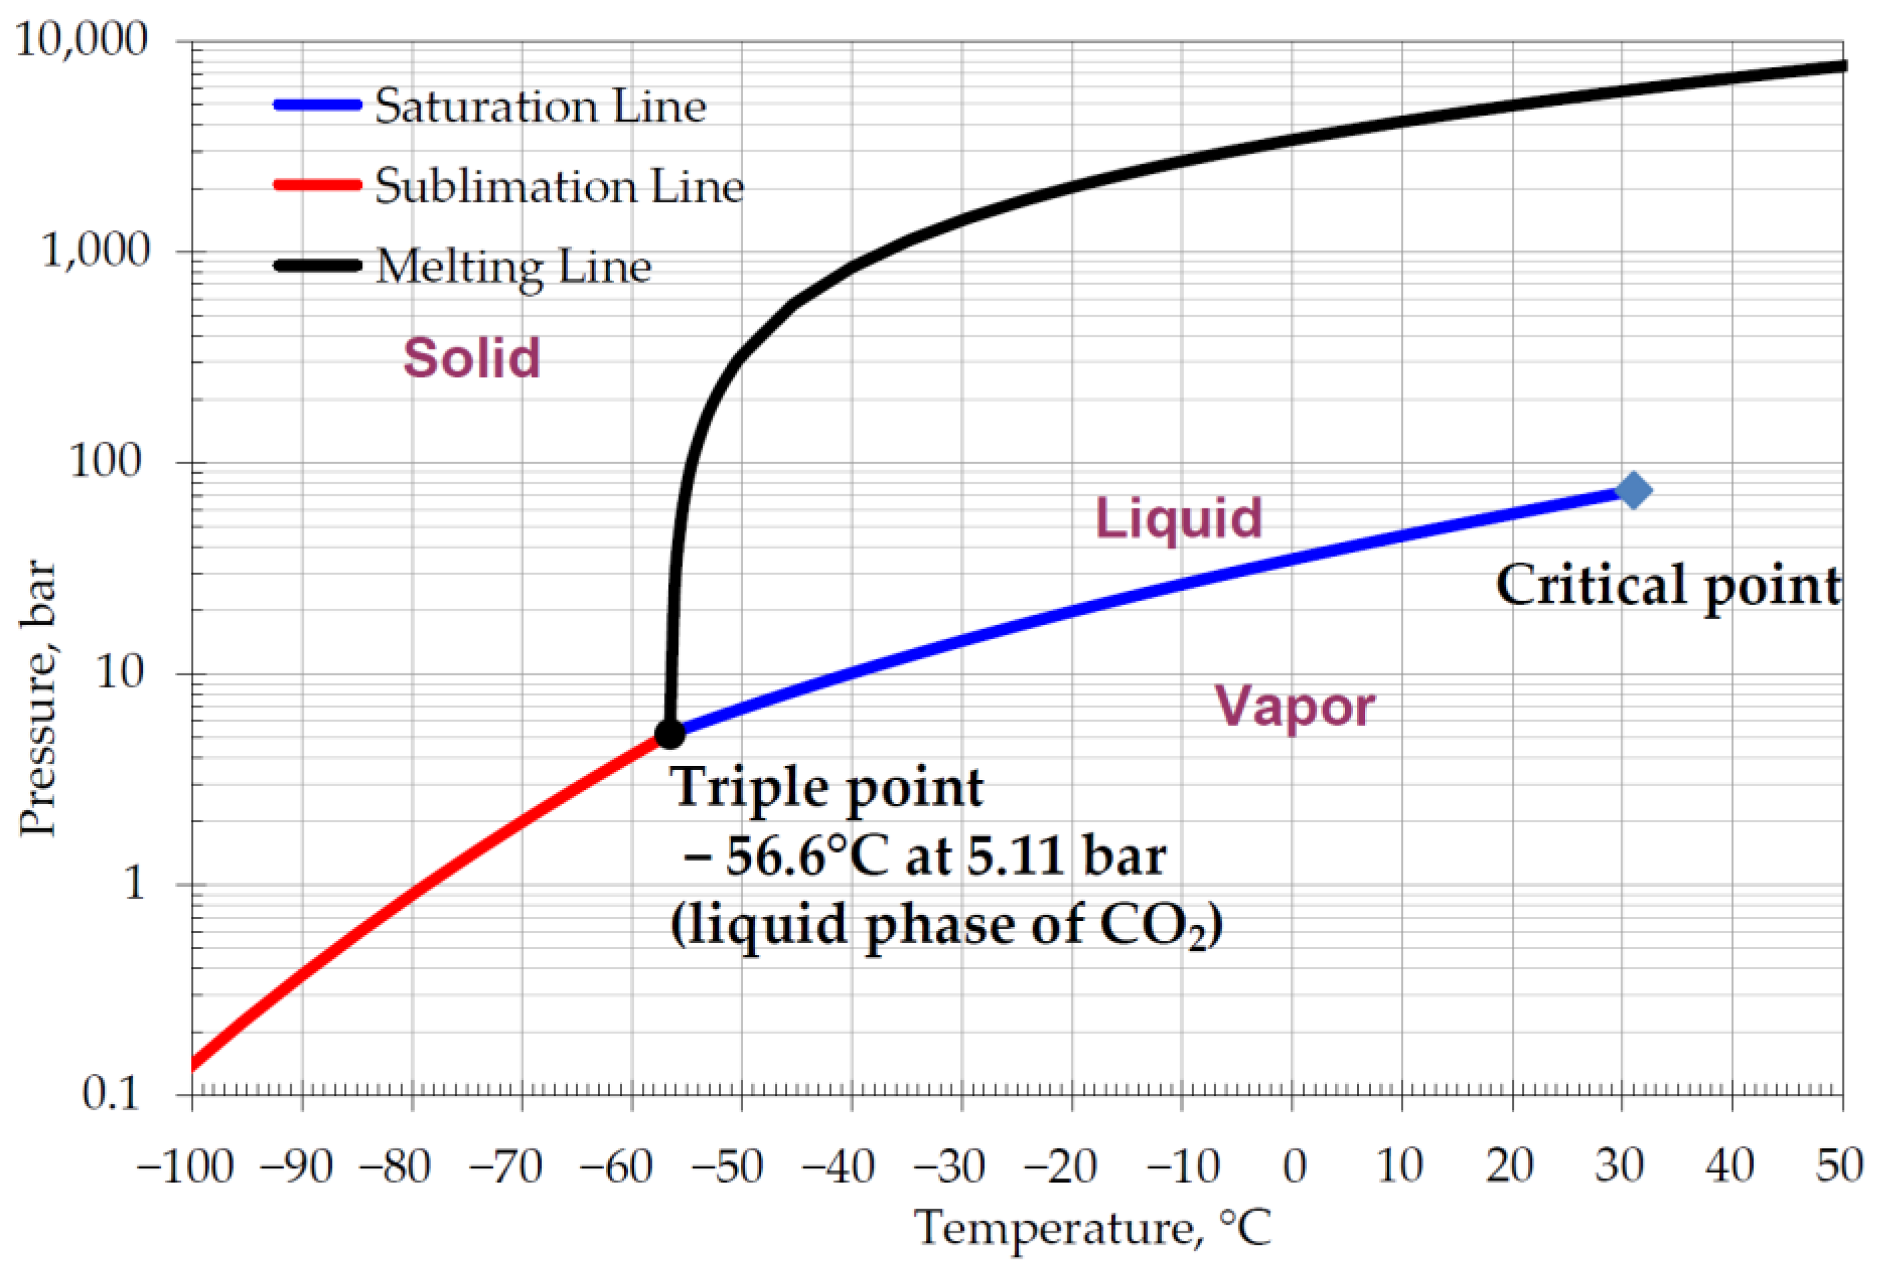
The concept of cryogenic carbon capture is based on the cold potential of LNG as a kind of energy source to reduce the exhaust gas temperature while at the same time absorbing heat for the regasification processes so that the cold temperature acts as a separating force for the separation of carbon dioxide. The separated CO2 is typically compressed and align-cooled to −56.6 °C at 5.11 bar pressure, at which point CO2 converts into the liquid phase for further utilisation in carbon capture and storage (CCS) projects for injection and storage in a depleted offshore oil and gas field or underground reservoir. The liquid CO2 can also be converted into a solid phase called “dry ice”; in order to reach the liquid phase of carbon dioxide, it must be cooled to −78.5 °C at temperature and 1 bar pressure. The density of the liquid phase of CO2 is 1156 kg/m3, and the solid phase is 1562 kg/m3 [25]; hence, the high-density potential allows for CO2 to be stored onboard before disposal, contributing to the chain of CCS logistic projects. The cryogenic carbon capture cycle follows four main stages [9]:
(1)
First stage—Exhaust gas drying. In this stage, the H2O has to be removed from the exhaust gas in the condensate phase. Meanwhile, the exhaust gas is cooled down from 350 °C (the average exhaust gas temperature from the engines) to 0 °C, reaching a condensation temperature of H2O;
(2)
Second stage—Separation of H2O;
(3)
Third stage—Cooling down of oxygen and nitrogen remaining in exhaust gas;
(4)
Fourth stage—Liquefaction of CO2. At this stage, dry exhaust gas is cooled down to −56.6 °C and 5.2 bar pressure;
(5)
Fifth stage—Capture of CO2.
In 2016, Bezyukov et al. [26] proposed a carbon dioxide separation method by utilising LNG cryogenic cold potential to convert carbon dioxide into a solid phase of dry ice. Since natural gas consists of more than 95% methane (CH
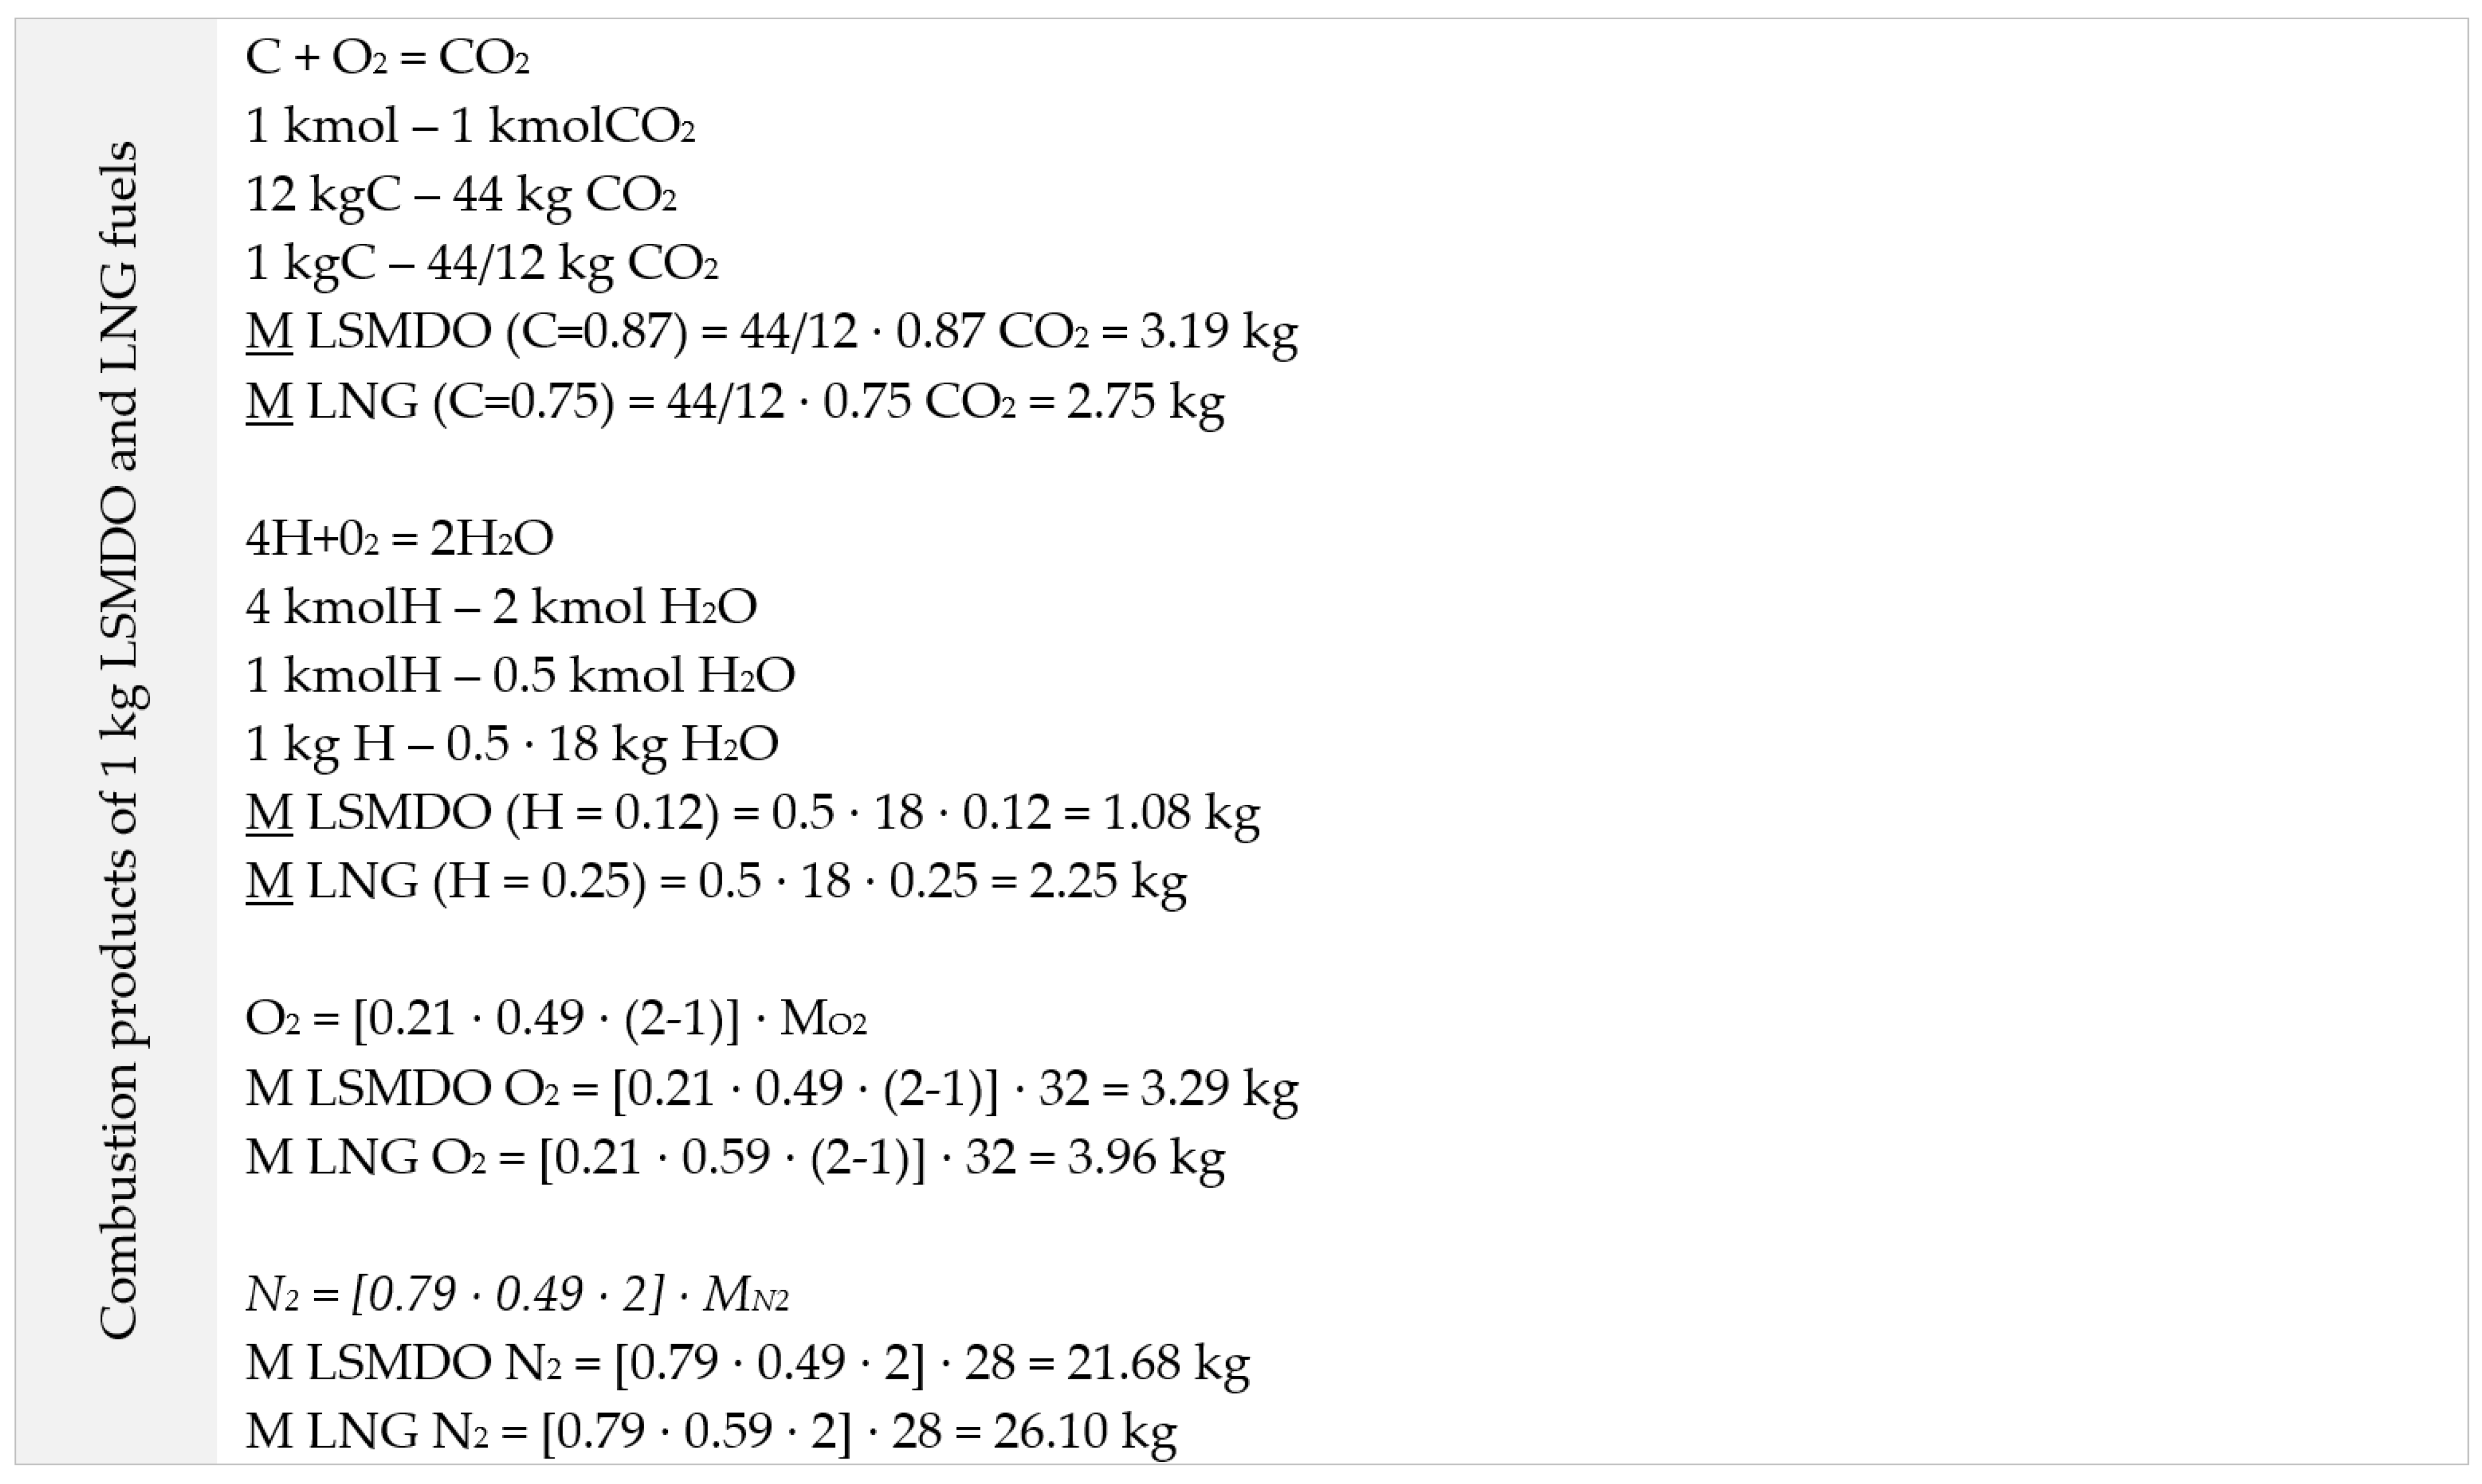
4), the methane properties are considered to be LNG properties in the study. The following fuel combustions are considered in the study: excess air ratio (α) for boiler plans is applicable at a 1.1 ratio, and for diesel engines 1.8–2.1, specific heat Cp = 1. According to the study results, LNG regasification requires about 750–800 kJ/kg of thermal energy to achieve a gas temperature for combustion injection. During combustion, 2.75 kg of CO2 is produced from 1 kg of burnt LNG fuel. Converting CO2 into a solid phase requires 650 kJ/kg energy or 1787.5 kJ/1 kg LNG fuel, which allows it to achieve a 40–44% CO2 capture ratio. However, the authors analysed the general gas of the diesel combustion cycle, where the air and nitrogen ratio were not considered as products of combusted gas.
The evaluation studies of the implementation of carbon capture technologies in ships can be observed in the literature. In 2022, Jasper et al. [27] released the study results of the implementation of ship-based carbon capture technology onboard LNG-fuelled ships. The technology is based on solvent-based CO2 capture in a post-combustion cycle through the exhaust gas heat integration into the LNG vapourisation cycle. The study’s results showed that a 50% carbon capture ratio can be achieved at an exhaust gas temperature of 250 °C before treatment. An alternative carbon capture technology method was analysed by Awoyomi et al. [28], who performed a study of ship-based carbon capture (SBCC) technology implementation on a LNG-fueled vessel of a LNG carrier with the propulsion of a Wartsila 9L46 DF marine diesel engine. The technology method is based on post-combustion technology with the introduction of solvent. According to the study authors, the carbon capture ratio can be 60%.
In terms of the implementation of carbon capture technologies on the vessels, it can be stated that it is still in the pioneering stage; in the past, few carbon capture technologies were installed on ships for trials. In the marine sector, a significant milestone was achieved in 2021 when the world’s first CO2 capture plant was installed onboard a vessel for a six-month voyage. The pioneering system found its home on the bulk carrier Corona Utility (IMO: 9748021). The announcement of the successful trial underscored the system’s ability to demonstrate the feasibility of capturing carbon dioxide from the exhaust gas of marine engines. This groundbreaking achievement signifies that research and development efforts in the realm of implementing CO2 capture technologies within the marine sector are still in their nascent stages [29]. In 2021, Wärtsilä Corporation made a statement that Wärtsilä Exhaust Treatment and Solvang ASA made an agreement on a full-scale pilot retrofit installation of a carbon capture and storage system on one of 21,000 m3 size ethylene carriers—Clipper Eos with the expectation to completed retrofit by 2023 [30]. The market interest in carbon capture technologies on the vessels can also be noticed in 2023: the TotalEnergies-owned LNG carrier was undergoing maintenance in July and retrofitted with ship-based carbon capture (SBCC) technology prototype for a trial duration of 125 days or 3000 h. For purposes of the trial, the set plan was to collect 10 metric tons of CO2 in the liquid phase with storage in a pressurized tank [31].
From a literature perspective, only a limited number of studies have been conducted and published to analyse the integration of cryogenic carbon capture technology and its actual performance efficiency on dual fuel vessels. To bridge this gap, further research is essential to comprehensively evaluate cryogenic carbon capture technology application’s effectiveness, feasibility, and economic viability on dual fuel vessel structures. The necessity for such research is particularly apparent when considering the long-term perspective of IMO environmental targets where, due to tightening regulations on emission norms, even the LNG-fuelled ships will not comply with the CII norms as of 2030; therefore, the additional technologies integration on ship structures align the LNG fuel is foreseen.
In order to contribute to and supplement the research gap, the primary objective of this research is to employ an experimental methodology for analysing the performance of an FSRU-type vessel equipped with a dual-fuel propulsion system under real operational conditions. The core focus lies in evaluating the feasibility of leveraging the cryogenic properties of LNG for a cogeneration process aimed at both exhaust gas treatment and the subsequent separation and liquefaction of CO2 onboard the vessel. This investigation aligns with the vessel’s dual-fuel engine setup, which offers the flexibility to run on either diesel or LNG fuel, prompting a comparative analysis of the carbon dioxide capture efficiency associated with each fuel type.
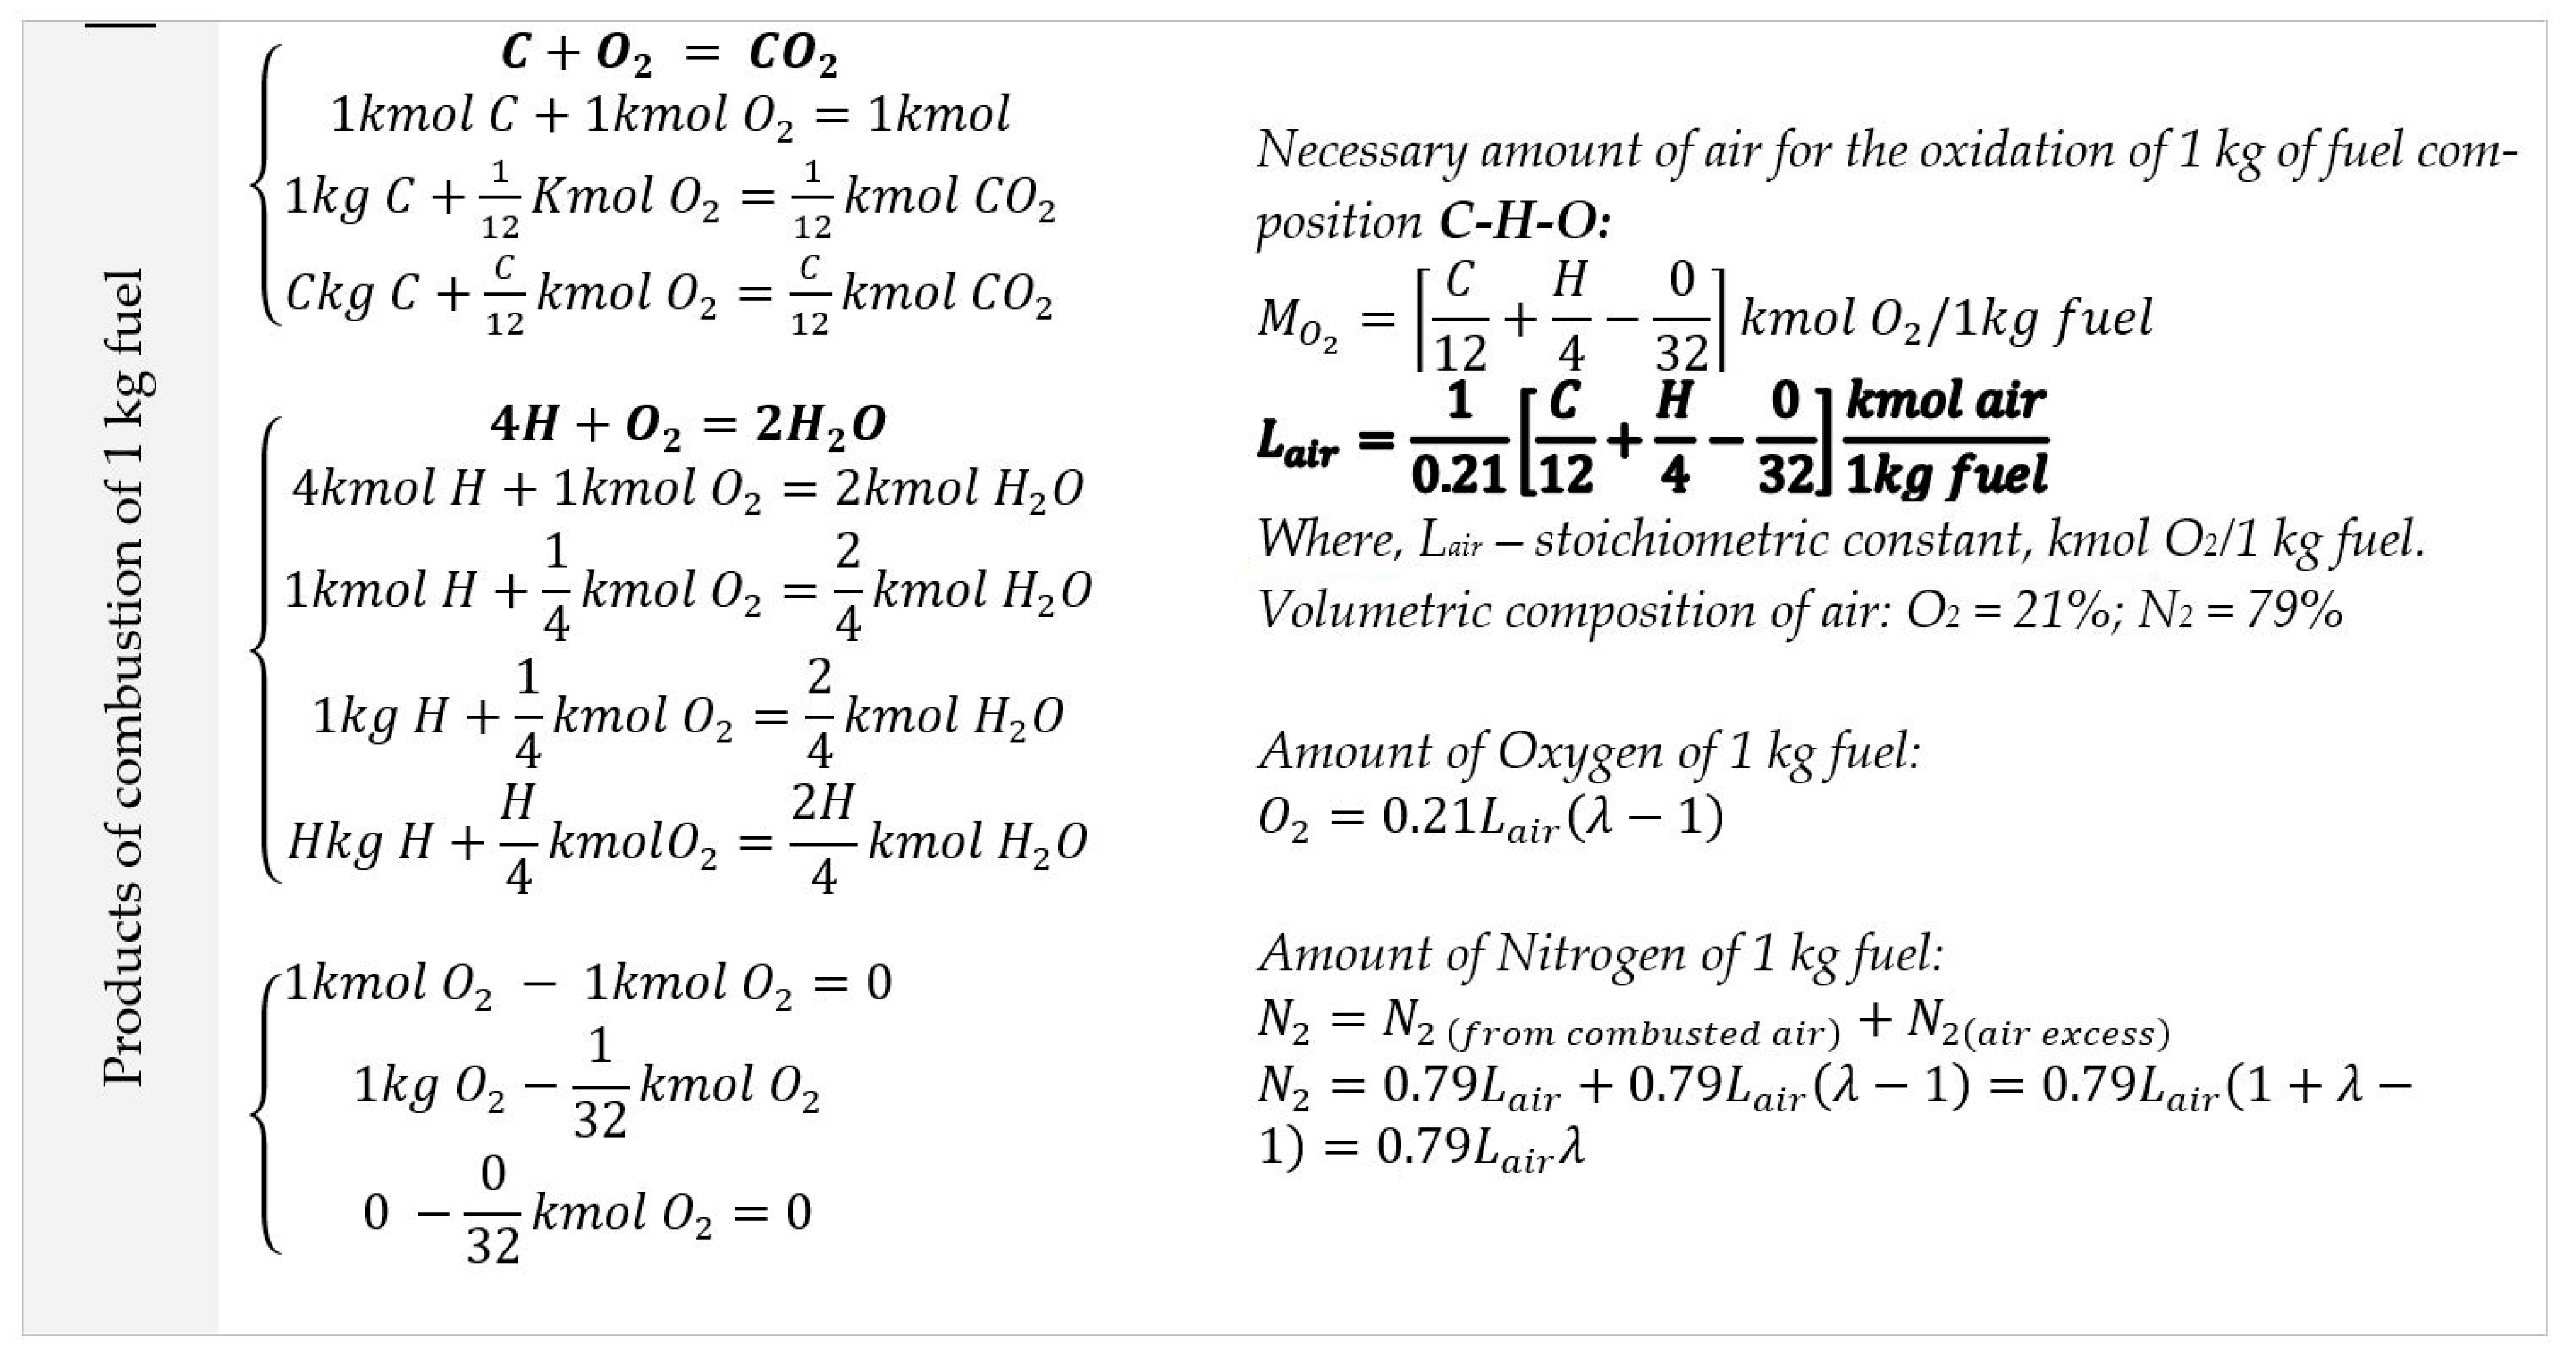
In the framework of the study, an energy balance equation model has been integrated for the examination of energy exchanges existing at individual heat exchangers through performance efficiency. In addition, the study is based on incorporating a suite of thermodynamic equations into research. These equations serve the crucial purpose of estimating energy exchange volumes, which is crucial for the separation of CO2 from exhaust gases and its subsequent conversion into a liquid state. Importantly, the analysis takes into account not only the fuel types but also their distinct chemical compositions, crucial in determining the necessary energy volumes, exhaust gas temperatures at different FSRU operational conditions and air-to-fuel ratios based on the equipment where fuel is combusted.

2. Research Methodology

2.1. LNG Regasification Process Description

The LNG regasification cycle can be segregated into four individual loops. Figure 5 represents a schematical relation of three different fluids circulation in the LNG regasification cycle. A scheme was made by the author during the process of experimental research conducted on the FSRU vessel that is capable of performing regasification in open- and closed-loop regimes. In scheme three, individual loops can be observed: LNG regasification loop, R290 loop and seawater loop. The performance and systematic interconnectedness through the heat exchangers is present in all three loops:
(1)
LNG loop;
(2)
Heat transfer loop: Glycol, propane or another type of refrigerant. For safety, the seawater (SW) is not used for direct contact with LNG as it could otherwise result in the SW freezing in the system;
(3)
SW loop in the open and closed loop: In the regasification process, the SW provides the heat source for vaporising LNG by the transfer of heat into the intermediate refrigerant loop, then the refrigerant is used to vaporize the LNG;
(4)
Steam supply loop/condensate return loop.
LNG is stored in cargo tanks where the average temperature of LNG in the liquid phase is −160 °C, and the LNG vapour temperature fluctuates around −130 °C. Each cargo tank is equipped with LNG regasification feed pumps that supply LNG to a buffer tank known as the suction drum. In the suction drum, the average LNG pressure is 0.46 MPa. From there, the LNG is transferred to the high-pressure pump, called the Booster Pump (BP), where its pressure is increased nearly twentyfold to 8 MPa. The LNG is conveyed from the BP to the LNG vaporizer, passing through the LNG recondenser on the way. The recondenser in the LNG regasification cycle controls the Boil-Off Ratio (BOR) in the cargo tank: the boil-off gas (−130 °C) is directed to the recondenser, where the LNG, at −160 °C, condenses the BOG and absorbs heat from it. Therefore, the recondenser operates based on heat exchanger principles. Consequently, the LNG is heated to −146 °C at the recondenser and transferred to the main LNG vaporizer. The LNG enters the vaporizer at −146 °C and 5.4 MPa pressure, exiting at −44 °C and 5.24 MPa pressure. During this process, the LNG undergoes heat exchange with the refrigerant R-290, converting it from a liquid to a gas phase. R-290, selected for its thermodynamic properties to withstand temperature fluctuations and low freezing point, enters the vaporizer at 5.94 °C and exits at −6.6 °C [32].
Following the LNG vaporizer, the natural gas (NG) is directed to the Trim Heater to raise its temperature to 14 °C. R-290 facilitates this increase: entering the Trim Heater at 16 °C and exiting at −13 °C. In the LNG regasification cycle, R-290 is heated by seawater (SW) twice:
(1)
At R-290 Pre-heater. SW: inlet temperature 18 °C, outlet temperature 14.4 °C. R-290: inlet temperature −6.6 °C, outlet temperature 16 °C;
(2)
At R-290 Evaporator. SW: inlet temperature 18 °C, outlet temperature 11.5 °C. R-290: inlet temperature −13 °C, outlet temperature 5.94 °C.
The FSRU-type vessel can operate in two distinct regasification loops: open and closed loops [33]. In the open loop, seawater (SW) is taken from the sea via seawater pumps and injected into the R290 pre-heater and evaporator for heat exchange. Following the heat exchange process, the SW is returned to the sea. Conversely, regasification boilers are integrated into the LNG regasification cycle in the closed loop regime. These boilers generate steam, which is then transferred to the steam heaters to heat the SW. The SW enters the heaters at a temperature of 14 °C and exits at 18 °C. Simultaneously, the steam, with an inlet temperature of 110 °C, condenses with an outlet temperature of 40 °C.
On the FSRU vessel, another piece of equipment is used to supply gas fuel to the regasification boilers and the engines. Fuel gas is supplied to the engines under pressure by the low-duty (LD) compressors, and then the LNG vaporizer feeds the regasification boilers. When regasification boilers are on low load, the LD compressor supplies gas to the engines and regas boilers at the time. The boil-off gas in the cargo tank produces excessive pressure inside each of the tanks, so it has to be continually removed to allow the tank pressure to be maintained near atmospheric pressure. The boil-off gas from the cargo tanks enters the vapour header line. It is then directed, via a pre-cooler, to the NBO mist separator, then to one of the compressors, which then transfers gas to the fuel gas heaters, having first passed through an after-cooler. After the gas heaters, gas is supplied to the engines and regasification boilers. If the boil-off gas is insufficient to meet the demands of the main generator engines or regas boilers, then the LNG vaporizer is utilized. The LNG vaporizer on the FSRU vessel is in operation when regasification is running in a closed loop regime, and regasification demand requires a high steam supply to the SW steam heaters. On the LNG carriers (LNG/C), the LNG vaporizer is used as well to supply a sufficient volume of gas fuel to the engines during a voyage.

2.2. Energy Analysis

The amount of energy needed to liquefy CO2 hinges on the type of fuel used for the combustion. The composition of the fuel significantly influences this process, as different fuel types result in varying chemical compositions within the exhaust gas and the concentration of carbon dioxide in it. The evaluation starts with the identification of the gas combustion cycle. Figure 6 represents the combustion cycle, which is separated into two parts; at first, on the left side is presented the expression of a chemical reaction. On the right side is the expression of volumetric air for the oxidation process in stoichiometric conditions. The composition of LSMDO consists of carbon (C molar mass—12 g/mol), hydrogen (H molar mass—1 g/mol), oxygen (O2 molar mass—32 g/mol), where 1 kg equals 0.87 kg—C; 0.12 kg—H; 0.001 kg—O. During the LS-MDO combustion, the process causes an oxidation cycle, which creates an exhaust gas consisting of CO2, H2O, O2, and N2. To estimate the air injection volume necessary for the combustion, the volumetric composition of air is considered, where O2—0.21 and N2—0.79. The complete combustion of fuel requires a certain amount of oxygen to ensure a complete combustion of fuel for this purpose. During the non-stoichiometric combustion condition, an excess of air (λ) injection into combustion is required; therefore, an additional volume of nitrogen is generated during the combustion cycle. The nitrogen composition consists of the volume generated per two cycles: from the combustion of air and the injection of excess air for the combustion.
Figure 7 illustrates the mass of exhaust gas products after the combustion of 1 kg of fuel. Overall, during the combustion of 1 kg LNG, it creates 35.06 kg of exhaust gas; during the combustion of 1 kg LNG, it creates 29.24 kg of exhaust gas. In calculation, the composition of 1 kg of LNG fuel is considered to be equal to 0.75 kg—C and 0.25 kg H. The lower volumetric mass of carbon in LNG fuel generates 2.75 kg CO2; when compared to LSMDO, it generated 3.2 kg per 1 kg of combusted fuel. The hydrogen composition in the LNG fuel is twofold higher than in LSMDO; therefore, the LNG fuel exhaust gas contains a higher composition of water: LSMDO—1.08 kg, when LNG—2.25 kg per 1 kg of combusted fuel. Likewise, a higher composition of oxygen is found in LNG fuel: LNG—3.96 kg, while LSMDO—3.29 kg per 1 kg combusted fuel. The higher nitrogen composition in the exhaust gas of LNG is also being observed in the calculations: 26.1 kg is generated from burned 1 kg LNG fuel, versus 21.68 kg is emitted from combustion of 1 kg LSMDO.
After the volumetric volumes are expressed in the equations, the specific heat has to be determined to estimate the energy necessary to cool down the exhaust gases to the condensation phase of H2O in order to dry the exhaust gas (3).
C p C O 2 + H 2 O + O 2 + N 2 , C p = C v + R ,
where Cp—specific heat capacity at constant pressure, the amount of the energy required to change the temperature of a substance by one degree Celsius while the pressure remains constant, measured in J/g·°C or J/mol·°C units; Cv—specific heat capacity at constant volume, amount of energy required to change the temperature of a substance by one degree Celsius while keeping its volume constant. Cv is measured in J/g·°C or J/mol·°C, interpolation of figures presented in Table 2; R—gas constant, a fundamental constant in thermodynamics, value for all ideal gases 8314 kJ/kmol·°C.
The composition of exhaust gas consists of different products with individual specific heat capacities at constant volume. The specific heat capacity at a constant volume of exhaust gas mixture can be expressed through the sum of the exhaust gases elements: volumetric specific heat of elements (Equation (4)), multiplied by the figure of mole content divided by the sum of moles (Equation (5)).
C v m i x t u r e = i = 1 n c v i ×   r i ,
r i = M i i = 1 n M ,
where Mi is the element of exhaust gas composition, divided by the sum of all elements in the exhaust gas mixture. The specific heat capacity at constant volume (Cv) can be estimated using the formula for interpolations presented in Table 2.
After the specific heat capacity at constant pressure is estimated, the volume of energy that is required to capture carbon dioxide in the liquid phase can be performed in the following four stages (Equation (6)):
Q = Q 1 + Q 2 + Q 3 + Q 4 ,
Q 1 = m × C p × t C p × t ,
Q 2 = m H 2 O × λ H 2 O ,
Q 3 = C p × Δ T × M O 2 + M N 2 + M C O 2 ,
Q 4 = m C O 2 × λ C O 2 ,
where, Q1—energy to cool down exhaust gas to H2O vapourisation temperature; Q2—H2O condensation stage, to remove water from exhaust gas; Q3—dried exhaust gas is cooled down to −56.6 °C; Q4—condensation of carbon dioxide. Figure 8 represents the phase change of H2O in relation to pressure and temperature.

2.3. Heat Balance Analysis

LNG handling, whether as fuel or cargo for regasification purposes on vessels, often involves cogeneration cycles. In this process, heat exchangers transfer thermal energy between fluids, often involving materials in various phases, typically combining thermal energy exchange between liquids and gases. Hence, different equations might be involved in estimating the heat balances depending on the phase of the material. The analysis of heat balances allows us to measure the efficiency of performance and calculate the amount of energy required to perform heat exchange.
Q = M × C p × Δ T ,
where M—mass flow rate of fluid, kg/s; Cp—specific heat capacity of the substance; △T—temperature differential (fluid outlet and inlet temperatures). Equation (7) is the equation used to calculate the amount of heat (Q) required to change the temperature of a substance with mass (m) by a certain temperature difference ( Δ T), following the specific heat capacity (Cp) of the fluid.
Q = ( ( M × h 1 C p t × M ,
where in Equation (8): h1—enthalpy of fluid at inlet, kJ/kg; M—mass flow rate, kg/s; Cp—specific heat capacity of the substance, kJ/°C; t—temperature of fluid (outlet temperature), °C.
Q = M h 2 h 1 s u b   c o o l e d   l i q u i d + M h 3 h 2 t w o p h a s e + ( M h 4 h 3 ) s u p e r h e a t e d   v a p o r ,
Equation (9) allows for the estimation of the amount of thermal energy exchange between materials when the material changes its physical phase (i.e., from gas to liquid and vice versa).
The evaluation of energy exchange efficiency at heat exchangers is estimated using the following Equation (10).
η = H e a t   t r a n s f e r   i n   h e a t   e x c h a n g e r c o l d   s i d e H e a t   t r a n s f e r   i n   h e a t   e x c h a n g e r w a r m   s i d e ,

3. Results

The experimental method was performed to analyse the selected FSRU-type vessel in 170,000 m3 capacity of cargo tanks and regasification capability to regasify 740 m3 of LNG/h. The regasification performance is based on closed-loop operations in the cold season and open-loop regime operations in the warm season when the seawater temperature reaches >13 °C. The regasification unit has three individual regasification trains consisting of 1 × seawater steam heater, 1 × propane pre-heater, 1 × propane evaporator, 1 × LNG vaporiser, and 1 × trim heater. In addition to the regasification unit on the deck of the FSRU vessel, the vessel is equipped with two units of regasification boilers designated to supply seawater steam to a seawater steam heater. The main propulsion is based on Wärtsilä dual-fuel engines (3 × 8L50DF and 1 × 6L50DF). The exhaust gas was treated in an economizer before it was released into the atmosphere; the machinery details are presented in Table 3.

3.1. Energy Balance

In the closed-loop system, the first heat exchange appears in the steam SW steam heater, where steam enters the heater in the vapour phase of 120 °C and transfers heat to the cold seawater. During the heat exchange, the steam is cooled down to condensate condition. The amount of heat energy is estimated using the following formulas: Equation (11) for steam side heat transfer and Equation (12) for seawater side heat transfer.
Q S t e a m   s i d e = ( ( M × h 1 C p t × M ,
Q S t e a m   s i d e = 41045 × ( 2718 4.186 × 80 = 27170   k W ,
where h1 = 2718 kJ/kg (enthalpy of steam at 120.9 °C and 1.0 bar); Cp = 4.186 kJ/kg (specific heat of water kJ/°C); M = 41,045 kg/h (mass of steam flow rate).
Q S e a   w a t e r   s i d e = ( M × h 2 h 1 ,
Q S e a   w a t e r   s i d e = M × h 2 h 1 = 1221652 × 105.38 25.818 = 26999   k W ,
where h2 = 25.818 kJ/kg (enthalpy at 25 °C and 6.0 bar); h1 = 105.38 kJ/kg (enthalpy at 25 °C and 6.0 bar); M = 1,221,652 kg/h (mass of steam flow rate, kg).
After the seawater is heated to a sufficient temperature, the water flows to propane pre-heater. The amount of heat energy is estimated using the following formulas: (13)—for the propane side of pre-heater; (14)—for the seawater side of pre-heater.
Q p r o p a n e   s i d e = 276000 × 2.456 × 31 = 5837   k W ,
where M = 276,000 kg/hour (mass of propane flow rate); Cp = 2.456 kJ/kg °C (specific heat of propane); Δ T = 31 °C (temperature change of propane).
Q s e a   w a t e r   s i d e = 718515 × 4.18 × 7.4 = 6173   k W ,
where M = 718,515 kg/h (mass of seawater flow rate); Cp = 4.18 kJ/kg °C (specific heat of seawater); Δ T = 7.4 °C (temperature change of propane).
The heated propane, after pre-heater, flows to the LNG trim heater, where the regasified gas is heated up to the temperature of the gas that is being sent to the grid. Calculations of heat energy are estimated based on Formula (15) for the propane side of the trim heater and (16) for the LNG side of the trim heater.
Q p r o p a n e   s i d e = 276000 × 2.456 × 18.77 = 3329   k W ,
where M = 276,000 kg/h (mass of propane flow rate); Cp = 2.456 kJ/kg °C (specific heat of propane); Δ T = 18.77 °C (temperature change of propane).
Q N G = M h 2 h 1 = 84000 × 50 191 = 3290   k W ,
where h2 = −191 kJ/kg (enthalpy of methane at 14.7 °C and 4.96 MPa); h1 = −50 kJ/kg (enthalpy of methane at −37.5 °C and 5.19 MPa); M = 84,000 kg/h (mass of methane gas flow rate).
After the trim heater is cooled, propane flows to the propane evaporator where seawater evaporates the propane from the liquid phase to the gas phase. Calculations for heat energy are estimated based on Formula (17) for the propane side of the evaporator and (18) for the seawater side of the evaporator.
Q = ( ( M × h 1 C p t × M ,
Q p r o p a n e   s i d e = 260000 × ( 198.25 1.7729 × 11.2 = 12883   k W ,
where h1 = 198.25 kJ/kg (enthalpy of propane at −0.73 °C and 0.592 MPa); Cp = 1.7729 kJ/kg (specific heat of propane at 11.2 °C and 0.516 MPa); M = 260,000 kg/h (mass of propane flow rate).
Q = M × C p × Δ T ,
Q s e a w a t e r   s i d e = 2441236 × 4.18 × 4.7 = 13322   k W ,
Heated propane in the vapour phase flows to the LNG vaporizer. Calculations of heat energy are estimated based on formulas: (19)—for the propane side of the LNG vaporizer; (20)—for the LNG side of the LNG vapouriser.
Q = ( M h 1 h 2 ) s u p e r h e a t e d   v a p o r + M h 2 h 3 t w o p h a s e ,
Q p r o p a n e   s i d e = ( 276000 × 592.72 581.72 ) + ( 276000 × 581.72 208.33 = 29466   k W ,
where M = 276,000 kg/h (mass of propane flow rate); h1 = 592.68 kJ/kg (enthalpy of propane at 11.22 °C and 0.519 MPa); h2 = 581.72 kJ/kg (enthalpy of propane at 5 °C and 0.519 MPa); h3 = 581.72 kJ/kg (enthalpy of propane at 5 °C and 0.519 MPa).
Q = M h 2 h 1 c o o l e d   l i q u i d + M h 3 h 2 t w o p h a s e + ( M h 4 h 3 ) s u p e r h e a t e d ,
Q L N G = 122573 635 + 870 + 122573 370 + 635 + 122573 191 + 370 = 23118   k W ,
where M = 122,573 kg/hour (mass of LNG flow rate); h2 = −635 kJ/kg (enthalpy of methane vapour at −96 °C and 5.33 MPa); h1 = −870 kJ/kg (enthalpy of methane at −150.10 °C and 5.33 MPa); h3 = −370 kJ/kg (enthalpy of methane vapour at −96 °C and 5.33 MPa); h4 = −191 kJ/kg (enthalpy of methane at −37.5 °C and 5.19 MPa).
The summarized results of performed energy balance calculations are presented in Table 4. The highest performance efficiency ratio is observed at seawater steam heaters machinery, slightly lower ratio reflects on LNG vapouriser performance.

3.2. Carbon Capture from LS-MDO Fuel Combustion

Estimating the necessary volume of air to perform fuel combustion at stoichiometric conditions:
L a i r   1 k g   d i e s e l   f u e l = 1 0.21 C 12 + H 4 0 32 = 1 0.21 0.87 12 + 0.12 4 0.01 32 = 0.490   K m o l / 1   k g ,
Estimating the percentage composition of elements in combustion, Equations (22)–(26):
r C O 2 = M i C 12 + H 2 + 0.21 L a i r λ 1 + 0.79 L a i r λ ,
r C O 2 = C 12 C 12 + H 2 + 0.21 L a i r λ 1 + 0.79 L a i r λ = 0.87 12 0.87 12 + 0.12 2 + 0.21 × 0.49 2 1 + 0.79 × 0.49 × 2 = 0.07 ,
r H 2 O = H 2 O 2 C 12 + H 2 O 2 + + 0.21 L a i r λ 1 + 0.79 L a i r λ = 0.12 2 0.87 12 + 0.12 2 + 0.21 × 0.49 × 2 1 + 0.79 × 0.49 × 2 = 0.06 ,
r O 2 = 0.21 L a i r λ 1 C 12 + H 2 O 2 + + 0.21 L a i r λ 1 + 0.79 L a i r λ = 0.21 × 0.49 × 2 1 0.87 12 + 0.12 2 + 0.21 × 0.49 × 2 1 + 0.79 0.49 2 = 0.10 ,
r N 2 = 0.79 L a i r λ C 12 + H 2 O 2 + + 0.21 L a i r λ 1 + 0.79 L a i r λ = 0.79 × 0.49 × 2 0.87 12 + 0.12 2 + 0.21 × 0.49 × 2 1 + 0.79 × 0.49 × 2 = 0.77 ,
Estimating specific heat capacity at constant volume of individual element and exhaust gas temperature at 263 °C, Equations (27)–(31):
C V C O 2 = 27.941 + 0.019 × 263 0.000005487 × 263 2 × 0.072 = 2.34 ,
C V H 2 O = 24.953 + 0.005359 × 263 × 0.06 = 1.58 ,
C V O 2 = 20.930 + 0.004641 × 263 0.00000084 × 263 2 × 0.10 = 2.21 ,
C V N 2 = 20.398 + 0.0025 × 263 × 0.77 = 16.21 ,
C V m i x = 2.34 + 1.58 + 2.21 + 16.21 = 22.35 ,
Estimating specific heat capacity at constant pressure:
C p ( 263 ° C ) = C v + R = 22.35 + 8.31 = 30.66 k J K m o l · ° C ,
Converting the result of the estimated specific heat capacity into kJ/kg, the molar mass of each element is multiplied by the composition percentage estimated in Equations (27)–(31):
C p ( 263 ° C ) = 30.66 0.07 × 44.01 + 0.06 × 18.02 + 0.10 × 32 + 0.77 × 28 = 1.06 k J k g ,
Estimating the volume of energy that captures CO2. Exhaust gas temperature after combustion: 263   ° C , then is cooled down to 100 °C (vapourisation temperature of H2O), which is drying of the exhaust gas stage, where λ of H2O is 2260 kJ/kg and λ of CO2 is 571 kJ/kg. The estimated Cp is presented above, and individual estimation has to be performed for the exhaust gas cooled down to a temperature of 100 °C. The calculations are presented in Equation (34).
Q 1 = m C p 263   ° C × 263 C p 100 ° C × 100 = 29.24 × 278 103 = 5117   k J ,
Q 2 = m H 2 O × λ H 2 O = 1.08 × 2257 = 2438   k J ,
Q 3 = C p × Δ T × M O 2 + M N 2 + M C O 2 = 1.02 × 156.6 × 28.16 = 4513   k J ,
Q 4 = m C O 2 × λ C O 2 = 3.19 × 571 = 1822   k J ,
Q = 5177 + 2438 + 4513 + 1822 = 13889 k J 1   k g   L S M D O   f u e l ,

3.3. Carbon Capture from LNG Fuel Combustion

Estimating the necessary volume of air to perform fuel combustion at stoichiometric conditions:
L a i r   1 k g   d i e s e l   f u e l = 1 0.21 C 12 + H 4 = 1 0.21 0.755 12 + 0.246 4 = 0.59   K m o l / 1   k g ,
Estimating the percentage composition of elements in combustion, Equations (36)–(40):
r C O 2 = M i C 12 + H 2 + 0.21 L a i r λ 1 + 0.79 L a i r λ ,
r C O 2 = C 12 C 12 + H 2 + 0.21 L a i r λ 1 + 0.79 L a i r λ = 0.755 12 0.755 12 + 0.245 2 + 0.21 × 0.59 × 2 1 + 0.79 × 0.59 × 2 = 0.05 ,
r H 2 O = H 2 O 2 C 12 + H 2 O 2 + + 0.21 L a i r λ 1 + 0.79 L a i r λ = 0.245 2 0.755 12 + 0.245 2 + 0.21 × 0.59 × 2 1 + 0.79 × 0.59 × 2 = 0.10 ,
r O 2 = 0.21 L a i r λ 1 C 12 + H 2 O 2 + + 0.21 L a i r λ 1 + 0.79 L a i r λ = 0.21 × 0.49 × 2 1 0.755 12 + 0.245 2 + 0.21 × 0.59 × 2 1 + 0.79 × 0.59 × 2 = 0.10 ,
r N 2 = 0.79 L a i r λ C 12 + H 2 O 2 + + 0.21 L a i r λ 1 + 0.79 L a i r λ = 0.79 × 0.59 × 2 0.755 12 + 0.245 2 + 0.21 × 0.59 × 2 1 + 0.79 × 0.59 × 2 = 0.75 ,
Estimating specific heat capacity at constant volume of the individual element, Equations (41)–(44):
C V C O 2 = 27.941 + 0.019 × 263 0.000005487 × 263 2 × 0.05 = 1.63 ,
C V H 2 O = 24.953 + 0.005359 × 463 × 0.10 = 2.64 ,
C V O 2 = 20.930 + 0.004641 × 263 0.00000084 × 263 2 × 0.10 = 2.21 ,
C V N 2 = 20.398 + 0.0025 × 263 × 0.75 = 15.79 ,
C V m i x = 1.65 + 2.60 + 2.21 + 15.81 = 22.26 ,
Estimating specific heat capacity at constant pressure:
C p ( 263 ° C ) = C v + R = 22.26 + 8.31 = 30.57   k J / K m o l · ° C ,
Converting the result of the estimated specific heat capacity into kJ/kg, the molar mass of each element is multiplied by the composition percentage estimated in Equations (41)–(44):
C p ( 263 ° C ) = 30.57 0.05 × 44.01 + 0.10 × 18.02 + 0.10 × 32 + 0.75 × 28 = 1.084 k J k g
Estimating the volume of energy that captures CO2. Exhaust gas temperature after combustion: 263 °C, then is cooled down to 100 °C (vapourisation temperature of H2O), which is the stage of drying of the exhaust gas, where λ of H2O is 2260 kJ/kg and λ of CO2 is 571 kJ/kg. The estimated Cp is presented above, and individual estimation has to be performed for the exhaust gas cooled down to a temperature of 100 °C. Calculations are presented in Equation (48).
Q 1 = m × C p 263   ° C × 263 C p 100   ° C × 100 = 35.07 × 307 106 = 6267   k J ,
Q 2 = m H 2 O × λ H 2 O = 2.25 × 2257 = 5078   k J ,
Q 3 = C p × Δ T × M O 2 + M N 2 + M C O 2 = 1.038 × 156.6 × 32.82 = 5338   k J ,
Q 4 = m C O 2 × λ C O 2 = 2.75 × 571 = 1570   k J ,
Q = 6267 + 5078 + 5338 + 1570 = 18254 k J k g ,

3.4. Energy for LNG Regasification

Estimating the volume of energy that 1 kg of LNG requires for regasification from temperature −160 °C to +5 °C. In Equation (26), the energy that is necessary to regulate LNG is calculated. As the main composition of the LNG consists of methane, the methane properties are considered for calculations. H2—enthalpy of methane at +5 °C and 52 bar pressure; H1—enthalpy of methane at −160 °C and 52 bar pressure.
Q L N G   r e g a s i f i c a t i o n = 1 × H 2 H 1 = 1 × 806.28 12.60 = 793.68 k J k g ,

3.5. Comparison of CO2 Capture Ratio

Figure 9 visually represents a comparison of energy that is needed to separate CO2 in the liquid phase from the exhaust gas of LNG versus LSMDO fuel. Due to LNG composition, during combustion, LNG fuel produces a higher volume of H2O concentration in flue gas; for this reason, LNG exhaust gas requires a higher volume of energy to separate CO2 composition from them.
The 1 kg of LNG fuel’s exhaust gas requires 18,254 kJ of energy, while LSMDO requires 13,889 kJ (24% less energy). Compared to the LNG regasification cycle, 1 kg of LNG fuel requires 1018 kJ of energy to convert it to the gas phase. Hence, the result leads to a cryogenic carbon capture ratio of 5–6% using LNG as a fuel and 7–8% using LSMDO as a fuel. The percentage of capture rate indicates that a proportional part of exhaust gas after combustion would have to be directed to the cryogenic carbon capture system, and the rest of the gas is discharged into the atmosphere when the ship is operating in sailing mode. The schematic representation is shown in Figure 10, which illustrates the achieved result of the amount of energy that the cryogenic carbon capture method requires throughout the exhaust gas treatment in order to capture CO2 in its liquid phase.
Energy volume for CO2 capture in liquid phase after combustion of 1 kg LSMDO fuel and 1 kg of LNG fuel. In the Q1 stage, exhaust gas is cooled down to 100 °C; in the Q2 stage, H2O is condensed and separated from exhaust gas; in the Q4 stage, remaining exhaust gas in the composition of O2, N2, and CO2 is cooled down to −56.6 °C; in the Q4 final stage, CO2 is liquefied.
Due to the higher volumetric composition of H2 in LNG fuel, the combustion process results in a higher proportion of water composition in the exhaust product. Consequently, this necessitates more energy for separation. The CO2 capture ratio is linked to the exhaust gas temperature before separation. Table 5 presents the interpolation of potential carbon capture rates at different exhaust gas temperatures: 350 °C, 263 °C, and 20 °C. The interpolation demonstrates that the carbon capture ratio increases as the exhaust gas temperature decreases. The most efficient result occurs at 20 °C, where the capture ratio for LSMDO fuel is 49.13%, and for LNG fuel on a dual fuel vessel is 57%. However, the 100% capture ratio can potentially be achieved on FSRU-type vessel due to negligible higher cryogenic cold temperature potential where the demand of LNG volume equal to 122,573 kg/h that requires 23,118 kW or 83,224,800 kJ of heat energy to regasify and reach the gas phase of 5 °C temp.

4. Discussion/Conclusions

In the past several years, international organisations have adopted strict environmental regulations as a measure to achieve the goal of decarbonising the shipping industry by 2050. In the timeframe towards the goal, LNG fuel is being identified as a transition fuel upon the infrastructure of green fuel technologies being established in the maritime field. Considering that the CII regulation applicable for the vessels, even with the LNG-fuelled propulsion complex, will require the adoption of additional technologies to comply with regulation, as of the performed analysis, the cryogenic carbon capture technology can be accepted as the most convenient and compatible option to be introduced on dual-fueled vessels. From the performed literature analysis, it can be observed that the minimum evaluation studies of CCC technology implementation on the FSRU-type vessel have been performed, even when the cryogenic capture approach was highlighted as the most compatible solution for LNG-fueled vessels due to the availability of LNG cold temperature potential. On the LNG-fueled vessel, the amount of LNG energy is negligible compared to the available energy potential on the FSRU. Hence, the aim of the research became to perform the experimental study on the FSRU-type vessel to monitor its actual performance related to the heat exchanger operations in the regasification cycle and, furthermore, to provide an overview of the potential possibilities to combine exhaust gas heat and LNG cold temperature potentials over cogeneration cycle in order to utilise the cold potential of the LNG through cooling down stages of the exhaust gases and in parallel to absorb/transfer the exhaust gas heat to LNG for regasification purpose and achieve common advantage: optimisation of the LNG regasification cycle while minimizing the CO2 emissions.
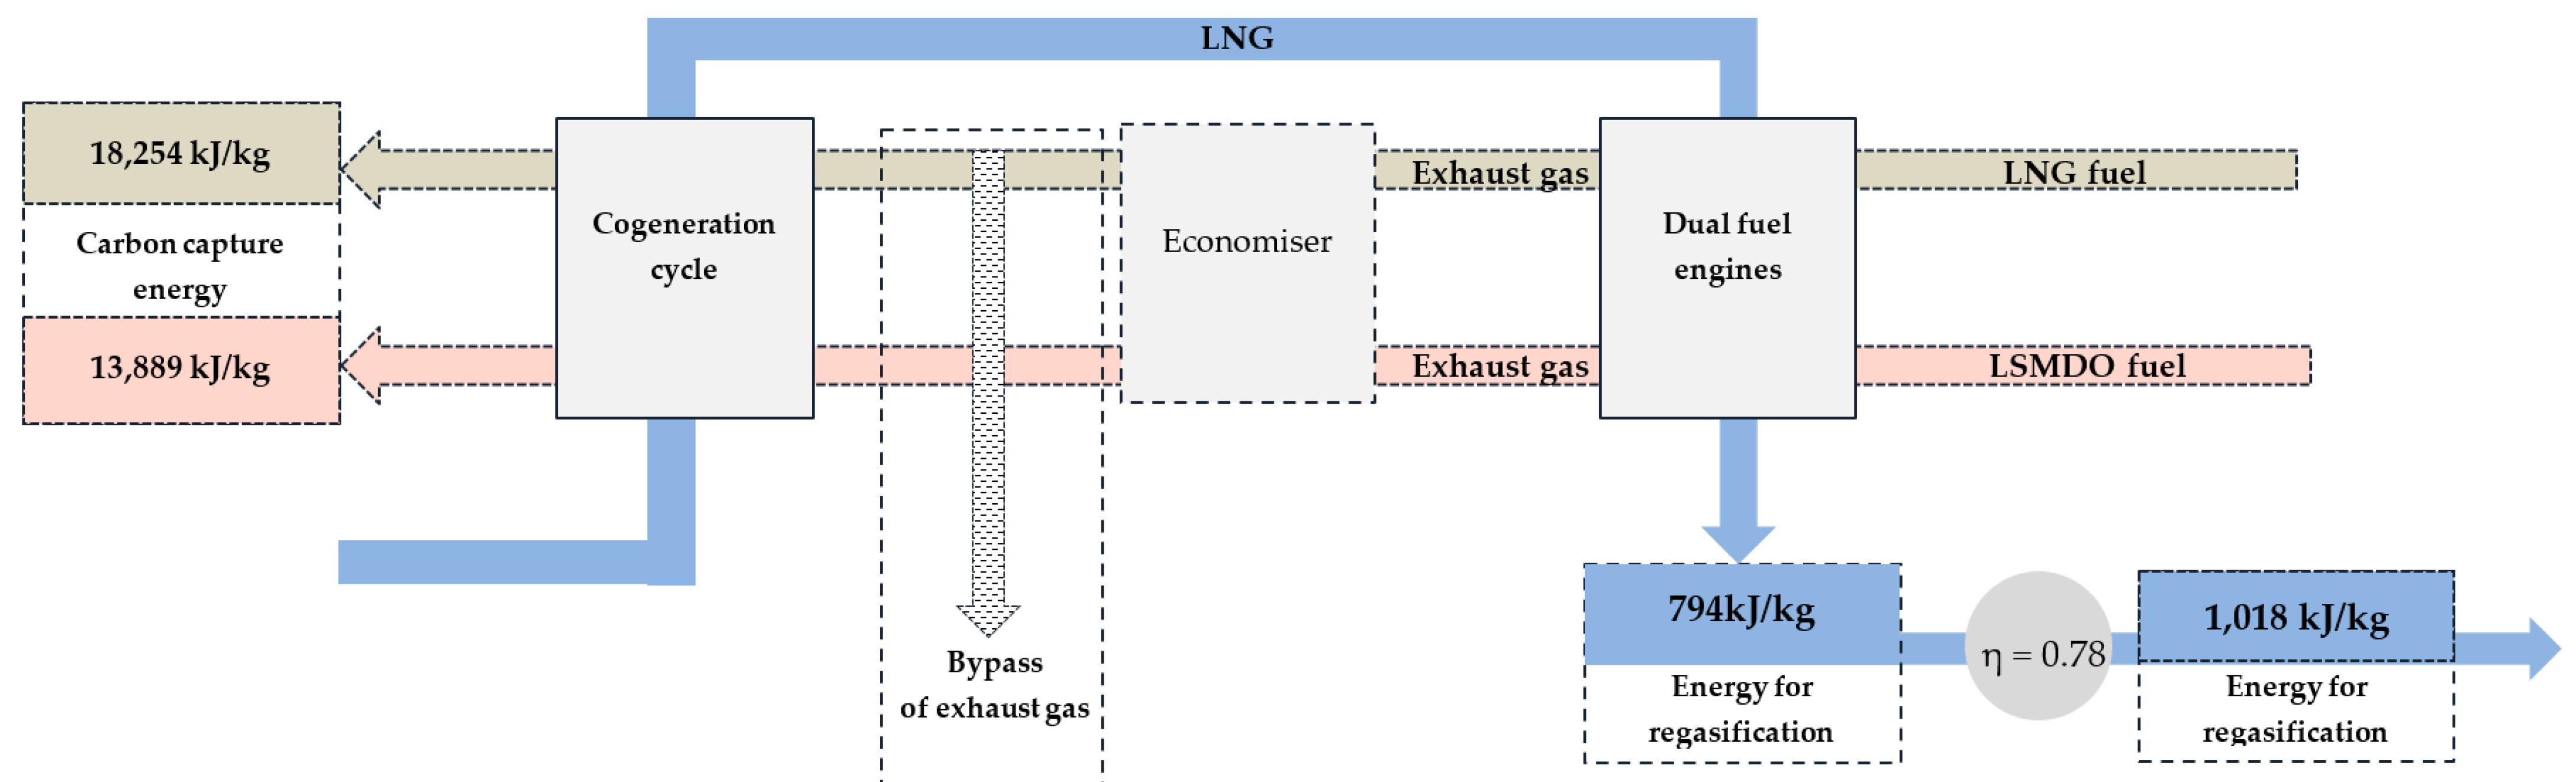
During the research, it was estimated that on the FSRU-type vessel, when exhaust gas is discharged to the atmosphere at the average temperature of 263 °C, the LNG fuel combustion requires 18,254 kJ/kg of energy to separate and capture CO2 in the liquid phase from the exhaust gas. However, despite LSMDO fuel containing a higher CO2 concentration in its exhaust gas, it requires less energy to separate CO2 in the liquid phase, which is 13,889 kJ/kg. Apparently, regardless of the CO2 concentration in the exhaust gas, the H2O removal stage requires most of the energy to dry the exhaust gas. At the time when 1 kg of LNG required 1018 kJ/kg of energy for regasification into its gas phase, considering the estimated LNG vaporizer performance efficiency coefficient of 0.78, the cryogenic carbon capture cycle through LNG cold potential utilisation would allow for the achievement of a carbon capture ratio of 5–6% using LNG as a fuel and 7–8% using LSMDO as a fuel.
Considering the results obtained, an interpolation was made to estimate the carbon capture rate at different exhaust gas temperatures, as shown in Table 5. The interpolation result showed that within range of reduced exhaust gas temperature, the capture rate is increasing and eventually, when exhaust gas is treated before the cryogenic carbon capture unit, considering that an economizer or alternative machinery such as exhaust gas scrubber could reduce the temperature of exhaust gas down to 20 °C, the CO2 capture rate to be increased up to 57% (for LNG fuel) and 49% (for LSMDO fuel). This major efficiency rate could be achieved because the exhaust gas drying stage at the cryogenic carbon capture unit is being eliminated. During this stage, the exhaust gas is cooled down through the wet drying” method. The exhaust gas passes through the scrubber-type machinery, where the exhaust gas comes into contact with the sprayed water. The exhaust gas is washed, and the H2O composition from the exhaust gas is removed in the liquid phase at the outlet of injected water. This method offers an advantage for the cryogenic carbon capture process as wet drying decreases the need for the LNG cold potential, thereby enabling a higher carbon capture rate. In general, the cryogenic carbon capture method is supplemented with additional cold energy taken from the water. Furthermore, from the benchmark perspective, comparing the achieved results to results in other studies where the average carbon capture rate fluctuates between 40–60%, we can state that the competitive cryogenic carbon capture separation requires exhaust gas temperature treatment before it is injected into the separation unit.
Another potential enhancement could be achieved in FSRU-type vessels by introducing exhaust gas treatment into LNG regasification cycles. Given the available cold potential of LNG, where the mass flow rate of LNG to the vaporizer reaches 122,573 kg/h, that requires 23,118 kW or 83,224,800 kJ of heat energy to regasify LNG from the liquid phase at −150.1 °C to gas phase prior trip heater at −37.5 °C. Meanwhile, the cryogenic carbon capture method requires 18,254 kJ of energy per 1 kg combusted LNG fuel. The tremendous cryogenic potential of LNG on the FSRU-type vessel led to the statement that 100% of CO2 could be captured due to proportional higher LNG volume and the heat demand that the regasification process requires.
In the next stage of the study on the application of cryogenic carbon capture technology for a dual-fuel ship by utilising LNG cold potential, the authors intend to simulate the attained results using Thermoflow version No. 31 software. This simulation aims to facilitate a comprehensive thermal analysis of exhaust gas and LNG regasification configurations and evaluate potential possibilities to perform optimisation of existing energy management systems towards decarbonisation goals by implementing cryogenic carbon capture systems on dual fuel vessels.

Author Contributions

Conceptualisation, S.L.; methodology, S.L.; formal analysis, A.M.; investigation, A.M.; resources, A.M.; data curation, A.M.; writing—original draft preparation, A.M.; writing—review and editing, A.M. and S.L.; visualisation, A.M.; supervision, S.L.; project administration, A.M. All authors have read and agreed to the published version of the manuscript.

Funding

The project was financed by Research Council of Lithuania and the Ministry of Education, Science and Sport Lithuania (Contract No. S-A-UEI-23-9).

Institutional Review Board Statement

Not applicable.

Informed Consent Statement

Not applicable.

Data Availability Statement

Data are contained within the article.

Conflicts of Interest

The authors declare no conflict of interest.

Correction Statement

This article has been republished with a minor correction to the Funding statement. This change does not affect the scientific content of the article.

References

  1. Hua, W.; Sha, Y.; Zhang, X. Research progress of carbon capture and storage (CCS) technology based on the shipping industry. Ocean Eng. 2023, 281, 114929. [Google Scholar] [CrossRef]
  2. Chua, Y.; Soudagar, I.; Ng, S.; Meng, Q. Impact analysis of environmental policies on shipping fleet planning under demand uncertainty. Transp. Res. Part D Transp. Environ. 2023, 120, 103744. [Google Scholar] [CrossRef]
  3. Wang, S.; Zhen, L.; Psaraftis, H.; Yan, R. Implications of the EU’s Inclusion of Maritime Transport in the Emissions Trading System for Shipping Companies. Engineering 2021, 7, 554–557. [Google Scholar] [CrossRef]
  4. Abreu, H.; Santos, T.; Cardoso, V. Impact of external cost internalization on short sea shipping–The case of the Portugal-Northern Europe trade. Transp. Res. Part D Transp. Environ. 2023, 144, 103544. [Google Scholar] [CrossRef]
  5. Talaat, W.; Banawan, A.; El-Gohary, M.; Ahmed, Y. An EEDI based method to better the selection of form and propulsion parameters and improve energy efficiency during preliminary designs of single screw seagoing general/bulk cargo ship. Ocean Eng. 2023, 228, 116012. [Google Scholar] [CrossRef]
  6. Baldi, F.; Coraddu, A. Towards halving shipping GHG emissions by 2050: The IMO introduces the CII and the EEXI. In Sustainable Energy Systems on Ships; Elsevier: Amsterdam, The Netherlands, 2022; pp. 513–517. [Google Scholar]
  7. International Maritime Organization. Proposal for Including Carbon Capture Technologies in the IMO Regulatory Framework to Reduce GHG Emissions from Ships. 2022. Available online: https://www.ics-shipping.org/wp-content/uploads/2022/09/MEPC-79-7-4-Proposal-for-including-carbon-capture-technologies-in-the-IMO-regulatory-framework-to-redu...-Liberia-and-ICS.pdf (accessed on 17 November 2023).
  8. Yuan, Q.; Wang, S.; Peng, J. Operational efficiency optimization method for ship fleet to comply with the carbon intensity indicator (CII) regulation. Ocean Eng. 2023, 286, 115487. [Google Scholar] [CrossRef]
  9. Alsanousie, A.; Attia, A.; Elhelw, M.; Elsamni, O. Towards nearly zero emissions natural gas-fired power plants using cryogenic carbon dioxide capture technology. Int. J. Greenh. Gas Control 2023, 127, 103928. [Google Scholar] [CrossRef]
  10. DNV. DNV Has Launched New Guidelines for Onboard Carbon Capture Systems on Board Ships. 9 October 2023. Available online: https://www.dnv.com/news/dnv-has-launched-new-guidelines-for-onboard-carbon-capture-systems-on-board-ships-247921 (accessed on 20 November 2023).
  11. DNV. Energy Transition Outlook 2023: Maritime Forecast to 2050. 2023. Available online: https://www.dnv.com/maritime/publications/maritime-forecast-2023/index.html (accessed on 17 November 2023).
  12. Cachola, C.; Ciotta, M.; Santos, A.; Peyerl, D. Deploying of the carbon capture technologies for CO2 emission mitigation in the industrial sectors. Carbon Capture Sci. Technol. 2023, 7, 100102. [Google Scholar] [CrossRef]
  13. Meng, L.; Kai, T.; Nakao, S.; Yogo, K. Modeling of pre-combustion carbon capture with CO2-selective polymer membranes. Int. J. Greenh. Gas Control 2023, 123, 103830. [Google Scholar] [CrossRef]
  14. Ravanchi, M. Carbon Capture With Oxy-Fuel Combustion Technology. In Reference Module in Earth Systems and Environmental Sciences; Elsevier: Amsterdam, The Netherlands, 2023. [Google Scholar]
  15. Goen, A.; Erdemir, D.; Dincer, I. Comprehensive review and assessment of carbon capturing methods and technologies: An environmental research. Environ. Res. 2024, 240, 117503. [Google Scholar]
  16. Akeeb, O.; Wang, L.; Xie, W. Post-combustion CO2 capture via a variety of temperature ranges and material adsorption process: A review. J. Environ. Manag. 2022, 313, 115026. [Google Scholar] [CrossRef] [PubMed]
  17. Valappil, J. Dynamic Simulation to Verify Operability of LNG Plants with Post Combustion Carbon Capture. In Computer Aided Chemical Engineering; Elsevier: Amsterdam, The Netherlands, 2023; Volume 52, pp. 3183–3189. [Google Scholar]
  18. Naveiro, M.; Gomez, M.; Fernandez, I.; Insua, A. Thermodynamic and environmental analyses of a novel closed loop regasification system integrating ORC and CO2 capture in floating storage regasification units. Energy Convers. Manag. 2022, 257, 115410. [Google Scholar] [CrossRef]
  19. Organization of Oil and Gas Climate Initiative. Is Carbon Capture on Ships Feasible? 2021. Available online: https://safety4sea.com/wp-content/uploads/2021/11/OGCI-STENA-Is-carbon-storage-technically-feasible-2021_11.pdf (accessed on 28 October 2023).
  20. Khalilpour, R.; Mumford, K.; Zhai, H.; Abbas, A.; Stevens, G.; Ruhin, E. Membrane-based carbon capture from flue gas: A review. J. Clean. Prod. 2015, 103, 286–300. [Google Scholar] [CrossRef]
  21. Heidari, M.; Tahmasebpoor, M.; Antzaras, A.; Lemonidou, A. CO2 capture and fluidity performance of CaO-based sorbents: Effect of Zr, Al and Ce additives in tri-, bi- and mono-metallic configurations. Process Saf. Environ. Prot. 2020, 144, 349–365. [Google Scholar] [CrossRef]
  22. Mietkiwicz, R. LNG supplies’ security with autonomous maritime systems at terminals’ areas. Saf. Sci. 2021, 142, 105397. [Google Scholar] [CrossRef]
  23. Naveiro, M.; Gomez, M.; Fernandez, I.; Insua, A. Energy efficiency and environmental measures for Floating Storage Regasification Units. J. Nat. Gas Sci. Eng. 2021, 96, 104271. [Google Scholar] [CrossRef]
  24. Malukas, A.; Lebedevas, S. The Comparison and Potential of CO2 Capture Technologies Implementation on the Marine Transport. In TRANSBALTICA XIII: Transportation Science and Technology; Springer International Publishing: Cham, Switzerland, 2023; Volume 257. [Google Scholar]
  25. The Engineering toolbox. Carbon Dioxide—Thermophysical Properties. Available online: https://www.engineeringtoolbox.com/carbon-dioxide-d_1000.html (accessed on 8 November 2023).
  26. Bezyukov, K. Uses of a hladopotentsial of the liquefied natural gas for decrease in emissions of carbon dioxide heat power installations. Ship Power Plants Syst. Devices 2016. [Google Scholar] [CrossRef]
  27. Ros, J.; Skylogianni, E.; Doedee, V.; Akker, J.; Vredeveldt, A. Advancements in ship-based carbon capture technology on board of LNG-fuelled ships. Int. J. Greenh. Gas Control 2022, 114, 103575. [Google Scholar] [CrossRef]
  28. Awoyomi, A.; Patchigolla, K.; Anthony, E. Process and Economic Evaluation of an Onboard Capture System for LNG-Fueled CO2 Carriers. Int. Eng. Chem. Res. 2019, 59, 6951–6960. [Google Scholar] [CrossRef]
  29. Kawasaki Kisen Kaisha. World’s First CO2 Capture Plant on Vessel Installed on Coal Carrier CORONA UTILITY Launch of the CC-OCEAN Project Demonstration, 2021. Available online: https://www.kline.co.jp/en/news/csr/csr7601431474845700352/main/0/link/210805EN.pdf (accessed on 22 September 2023).
  30. Wartsila Corporation. Wärtsilä and Solvang to Collaborate on Retrofitting Carbon Capture and Storage System on Clipper Eos. 2021. Available online: https://www.wartsila.com/media/news/20-10-2021-wartsila-and-solvang-to-collaborate-on-retrofitting-carbon-capture-and-storage-system-on-clipper-eos-2992717#:~:text=The%20land%2Dbased%20unit%20will,the%20shipping%20industry%27s%20decarbonisation%20pathway (accessed on 8 August 2023).
  31. Offshore Energy. TotalEnergies Equips LNG Carrier with EverLoNG’s Carbon Capture System. 2023. Available online: https://www.offshore-energy.biz/totalenergies-equips-lng-carrier-with-everlongs-carbon-capture-system/ (accessed on 5 November 2023).
  32. National Refrigerants. Safety Data Sheet of R290 Propane. 2021. Available online: https://refrigerants.com/wp-content/uploads/2019/12/SDS-R290-Propane.pdf (accessed on 18 October 2023).
  33. Lee, D.; Ha, M.; Kim, S.; Shin, S. Research of design challenges and new technologies for floating LNG. Int. J. Nav. Archit. Ocean Eng. 2014, 6, 307–322. [Google Scholar] [CrossRef]
  34. Shen, M.; Tong, L.; Yin, S.; Liu, C. Cryogenic CO2 Capture as a Cost-Effective CO2 Capture Process. 2009. Available online: https://www.researchgate.net/publication/264875049_Cryogenic_CO2_Capture_as_a_Cost-Effective_CO2_Capture_Process (accessed on 15 November 2023).
Figure 1. Carbon Intensity Indicator (CII) and LNG-fueled vessel compliance with the regulations. The figure is excluding grade E-rating boundary due the inferior performance level [11].
Jmse 12 00217 g001
Figure 2. Pre-combustion carbon capture cycle [14].
Jmse 12 00217 g002
Figure 3. Oxy-combustion carbon capture cycle [14].
Jmse 12 00217 g003
Figure 4. Post-combustion carbon capture cycle [14].
Jmse 12 00217 g004
Figure 5. Simplified scheme of the LNG regasification cycle from the liquid phase to the gas phase. R1—LNG regas vaporizer; R2—NG trim heater; E1—R290 pre-heater; E2—R290 evaporator; S1—SW steam from regas boilers; S2—seawater heater.
Jmse 12 00217 g005
Figure 6. Combustion process of 1 kg LSMDO fuel at stoichiometric conditions.
Jmse 12 00217 g006
Figure 7. Products of combustion of 1 kg fuels: LSMDO and LNG.
Jmse 12 00217 g007
Figure 8. Phase change diagram of CO2 p = f(t) [34].
Jmse 12 00217 g008
Figure 9. Comparison of cryogenic carbon capture intensity ratio.
Jmse 12 00217 g009
Figure 10. Breakdown of indication of energy volumes at different stages.
Jmse 12 00217 g010
Table 1. Assessment criteria of carbon separation technologies [21].
Comparison
Criteria
Chemical
Absorption
AbsorptionMembrane
Separation
Cryogenic
Separation
Technology maturityHighLowLowMedium
CO2 purity99%Purity and capture rate are
linked. In general, CO2 purity is
low (80% for adsorption, 60% for
membranes)
99.9%
CO2 capture rate potential90–99%90–99%
Sensitivity to impuritiesNOx and SOxH2O, NOx and SOxNOx and SOxPotentially SOX, H2O
Table 2. The equation to estimate the average molar heat capacity of individual elements at constant volume. The equation is based on the interpolation of exhaust gas temperature and its application to the presented range [26].
Gas TypeMcv, kJ/kmol °C
0–1500 °C1501–2800 °C
Air20,600 + 0.002638·t22,387 + 0.001449·t
Oxygen O220,930 + 0.004641·t − 0.00000084·t223,723 + 0.001550·t
Nitrogen N220,398 + 0.002500·t23,723 + 0.001457·t
Hydrogen H220,684 + 0.000206 + 0.000000588·t219,678 + 0.001758·t
Carbon oxide CO20,597 + 0.002670·t22,490 + 0.001430·t
Carbon dioxide CO227,941 + 0.019·t − 0.000005487·t239,123 + 0.003349·t
Water H2O24,953 + 0.005359·t26,670 + 0.004438·t
Table 3. Machinery of FSRU-type vessel.
SpecificationEngineEngineRegas Boiler
Wärtsilä, Dual Fuel 8L50DFWärtsilä, Dual Fuel 6L50DFDual Fuel Marine Boiler, with Evaporation Rate
65,000 kg/h
No. of equipment312
Exhaust gas treatmentExhaust Gas Economizers (individual)
Exhaust gas temp. before treatment, °C337337292
Exhaust gas temp. after treatment, °C262262103
Excess air ratio (α)2.02.01.1
Table 4. Summarized results: heat balance in kW and the coefficients of efficiency performance.
Seawater
Steam Heater
Propane
Pre-Heater
Trim
Heater
Propane
Evaporator
LNG
Vapouriser
SteamSWSWPropanePropaneNGPropaneSWPropaneLNG
27,17026,999617358373329329012,88313,32229,46623,118
η = 0.99η = 0.95η = 0.98η = 0.97η = 0.78
Table 5. Comparison of amounts of energy necessary to capture CO2 in liquid phase at different ranges of temperatures and the percentage of carbon capture ratio from the exhaust gas.
t = 350 °Ct = 263 °Ct = 20 °CFSRU Mode
LSMDO fuel16,702 kJ/6.1%13,889 kJ/7.3%2072/49.13%-/100%
LNG fuel21,695 kJ/4.7%18,254 kJ/5.6%1787/57.0%-/100%
Disclaimer/Publisher’s Note: The statements, opinions and data contained in all publications are solely those of the individual author(s) and contributor(s) and not of MDPI and/or the editor(s). MDPI and/or the editor(s) disclaim responsibility for any injury to people or property resulting from any ideas, methods, instructions or products referred to in the content.

