Article

The Distribution Characteristics and Influencing Factors of the CO2 Fluxes Across the Sea–Air Interface in the Artificial Reefs Area of Sanheng Island

1
Ocean Research Center of Zhoushan, Zhejiang University, Zhoushan 316021, China
2
College of Oceanography and Ecological Science, Shanghai Ocean University, Shanghai 201306, China
*
Author to whom correspondence should be addressed.
J. Mar. Sci. Eng. 2024, 12(12), 2272; https://doi.org/10.3390/jmse12122272
Submission received: 21 October 2024 / Revised: 28 November 2024 / Accepted: 2 December 2024 / Published: 11 December 2024
(This article belongs to the Section Marine Ecology)

Abstract

In order to study the impact of artificial reef construction on marine carbon sinks, a one-year monitoring and analysis were carried out in the Sanheng artificial reef areas of Shengsi Island. The main parameters observed were sea surface temperature, salinity, pH, total alkalinity (TA), and dissolved inorganic carbon (DIC). The partial pressure of CO2 (pCO2w) in the surface water and the CO2 flux (FCO2) across the sea–air interface were calculated and analyzed. The results showed that the annual range of surface water pCO2w was 34.48~501.53 μatm, and the partial pressure of CO2 decreases in the following order: winter, spring, autumn, summer. The FCO2 was significantly negatively correlated with temperature and significantly positively correlated with salinity and TA. The FCO2 in the four seasons decreases in the following order: winter, spring, autumn, summer. The annual sea–air flux in the survey area ranged from −108.79 to 41.74 mmol m−2 d−1. In winter, both the reef area and the control area displayed positive FCO2 values, indicating a source of CO2, while in the other three seasons, CO2 flux values were negative, indicating an overall CO2 sink. Additionally, in autumn, the reef area exhibited a stronger CO2 sink than the control area. The results indicated that the construction of artificial reefs has a certain carbon sink effect, with no significant difference in effectiveness between different artificial reef construction models.

1. Introduction

Indeed, oceans cover 71% of the Earth’s surface and play a crucial role as an essential sink for carbon dioxide (CO2). It is estimated that oceans absorb approximately 20% to 40% of the CO2 emitted by human activities during the industrial era [1]. Jiao [2] pointed out that implementing “negative emissions” in the ocean is a key pathway to achieving carbon neutrality, and there is increasing reporting on the contribution of the oceanic carbon cycle by the biologically driven pump centered around marine organisms.
By expanding biological carbon sequestration through fisheries production and enhancing the ocean‘s role in the carbon cycle, it is crucial to leverage the ocean’s capacity for climate regulation [3]. As an environmentally friendly method of marine fisheries production, marine ranching creates habitats for aquatic organisms through engineering techniques such as deploying artificial reefs, constructing algae reefs and seaweed beds, and stock enhancing and releasing fish stocks [4,5,6]. This initiative not only enhances the biodiversity and resource abundance of marine ranches, but also increases carbon sequestration by marine organisms in the sea and extends the transfer of carbon within the food chain [7,8,9]. Macroalgae are the dominant primary producers in the coastal zone with a global net primary production (NPP) of 1521 TgC yr−1 [10].
With the continuous rise in global CO2 concentration and the ongoing degradation of marine ecosystems, countries around the world are increasingly emphasizing the need to enhance biological carbon sinks to reduce CO2 levels and protect marine ecosystems. In 2009, blue carbon was first proposed in a joint report of the United Nations Environment Program; Food and Agriculture Organization of the United Nations (FAO); and Intergovernmental Oceanographic Commission of the United Nations Educational, Scientific and Cultural Organization (IOC–UNESCO) [11].
In around 2010, the Chinese scholar in [12] first proposed the concept of “carbon sink fisheries”, which has garnered significant attention and gradually gained acceptance worldwide in recent years [13]. In 2014, China officially launched the “Chinese Blue Carbon Initiative” [14]. China is currently the largest developing country and the largest carbon emitter globally. Accelerating The pace of China’s emission reduction is of great positive significance to the world’s response to climate change [15,16]. In response, China proposed the concept of the ‘3060 target’ in September 2020, in which regional carbon emissions will strive to peak by 2030 and peak again by 2060. This highlights the urgent need to strengthen carbon reduction in China [17,18].Current research on CO2 exchange flux (FCO2) at the sea–air interface is mainly focused on the open ocean and the continental shelf margins where human activities are concentrated [19]. The East China Sea has complex biogeochemical conditions [20]. Ye [21] conducted shipboard observations to explore the surface CO2 partial pressure (pCO2W) and distribution characteristics, as well as seasonal variations in the East China Sea region. They found that the CO2 partial pressure in the East China Sea region exhibits differential characteristics of “coastal area—continental shelf area—offshore area”, with overall seasonal trends showing CO2 uptake. Peng [22] studied the spatial and temporal variations in the CO2 exchange flux at the sea–air interface in the Kaozhou oyster farming area and found that the peak farming season in the marine farming area is a CO2 source, while the off-peak farming season overall acts as a weak CO2 sink.
Fodrie [23] conducted research on the carbon source–sink functions of intertidal and subtidal oyster reefs and found that oyster reefs exhibit different source–sink characteristics in different distribution areas. Currently, there is limited research on the source–sink characteristics of artificial reefs, which are an important component of marine ranches.
Artificial reef areas, as nearshore artificially restored and regulated ecosystems, not only enhance the quality of aquatic products and protect the marine environment but also increase the carbon sequestration capacity of the sea area [5]. The ecological effects of reef construction and related technologies are continuously receiving attention. Coastal regions throughout China are actively engaging in the construction of artificial reefs. Although researchers both domestically and internationally have conducted extensive studies on marine biological carbon sequestration, there is relatively little research on the expansion of marine carbon sinks through artificial reefs [24,25].
Sanheng Island is located in Shengsi, Zhoushan, Zhejiang Province. As early as 2004, Shengsihas carried out the construction of artificial reefs, and the first artificial reef area is located in the sea area west of Ma’an Archipelago and southeast of Lvhua Island, known as Dongkushan. At the end of 2020, Shengsi Ma’an Archipelago Marine Ranch had cumulatively deployed 164,750 cubic meters of artificial reefs. The confirmed sea area of the ranching zone covers approximately 1060 hectares. This study takes the artificial reef zone and the control area of Sanheng Island in the Shengsi Ma’an Archipelago Marine Ranching as the research objects. It estimates and analyzes the seawater CO2 partial pressure (pCO2) and CO2 exchange flux (FCO2) from indicators such as sea surface temperature (SST), salinity (S), dissolved inorganic carbon (DIC), pH, and total alkalinity (TA), aiming to provide a reference for comprehensively evaluating the carbon sink effect of island and reef waters and the construction of artificial reefs.

2. Materials and Methods

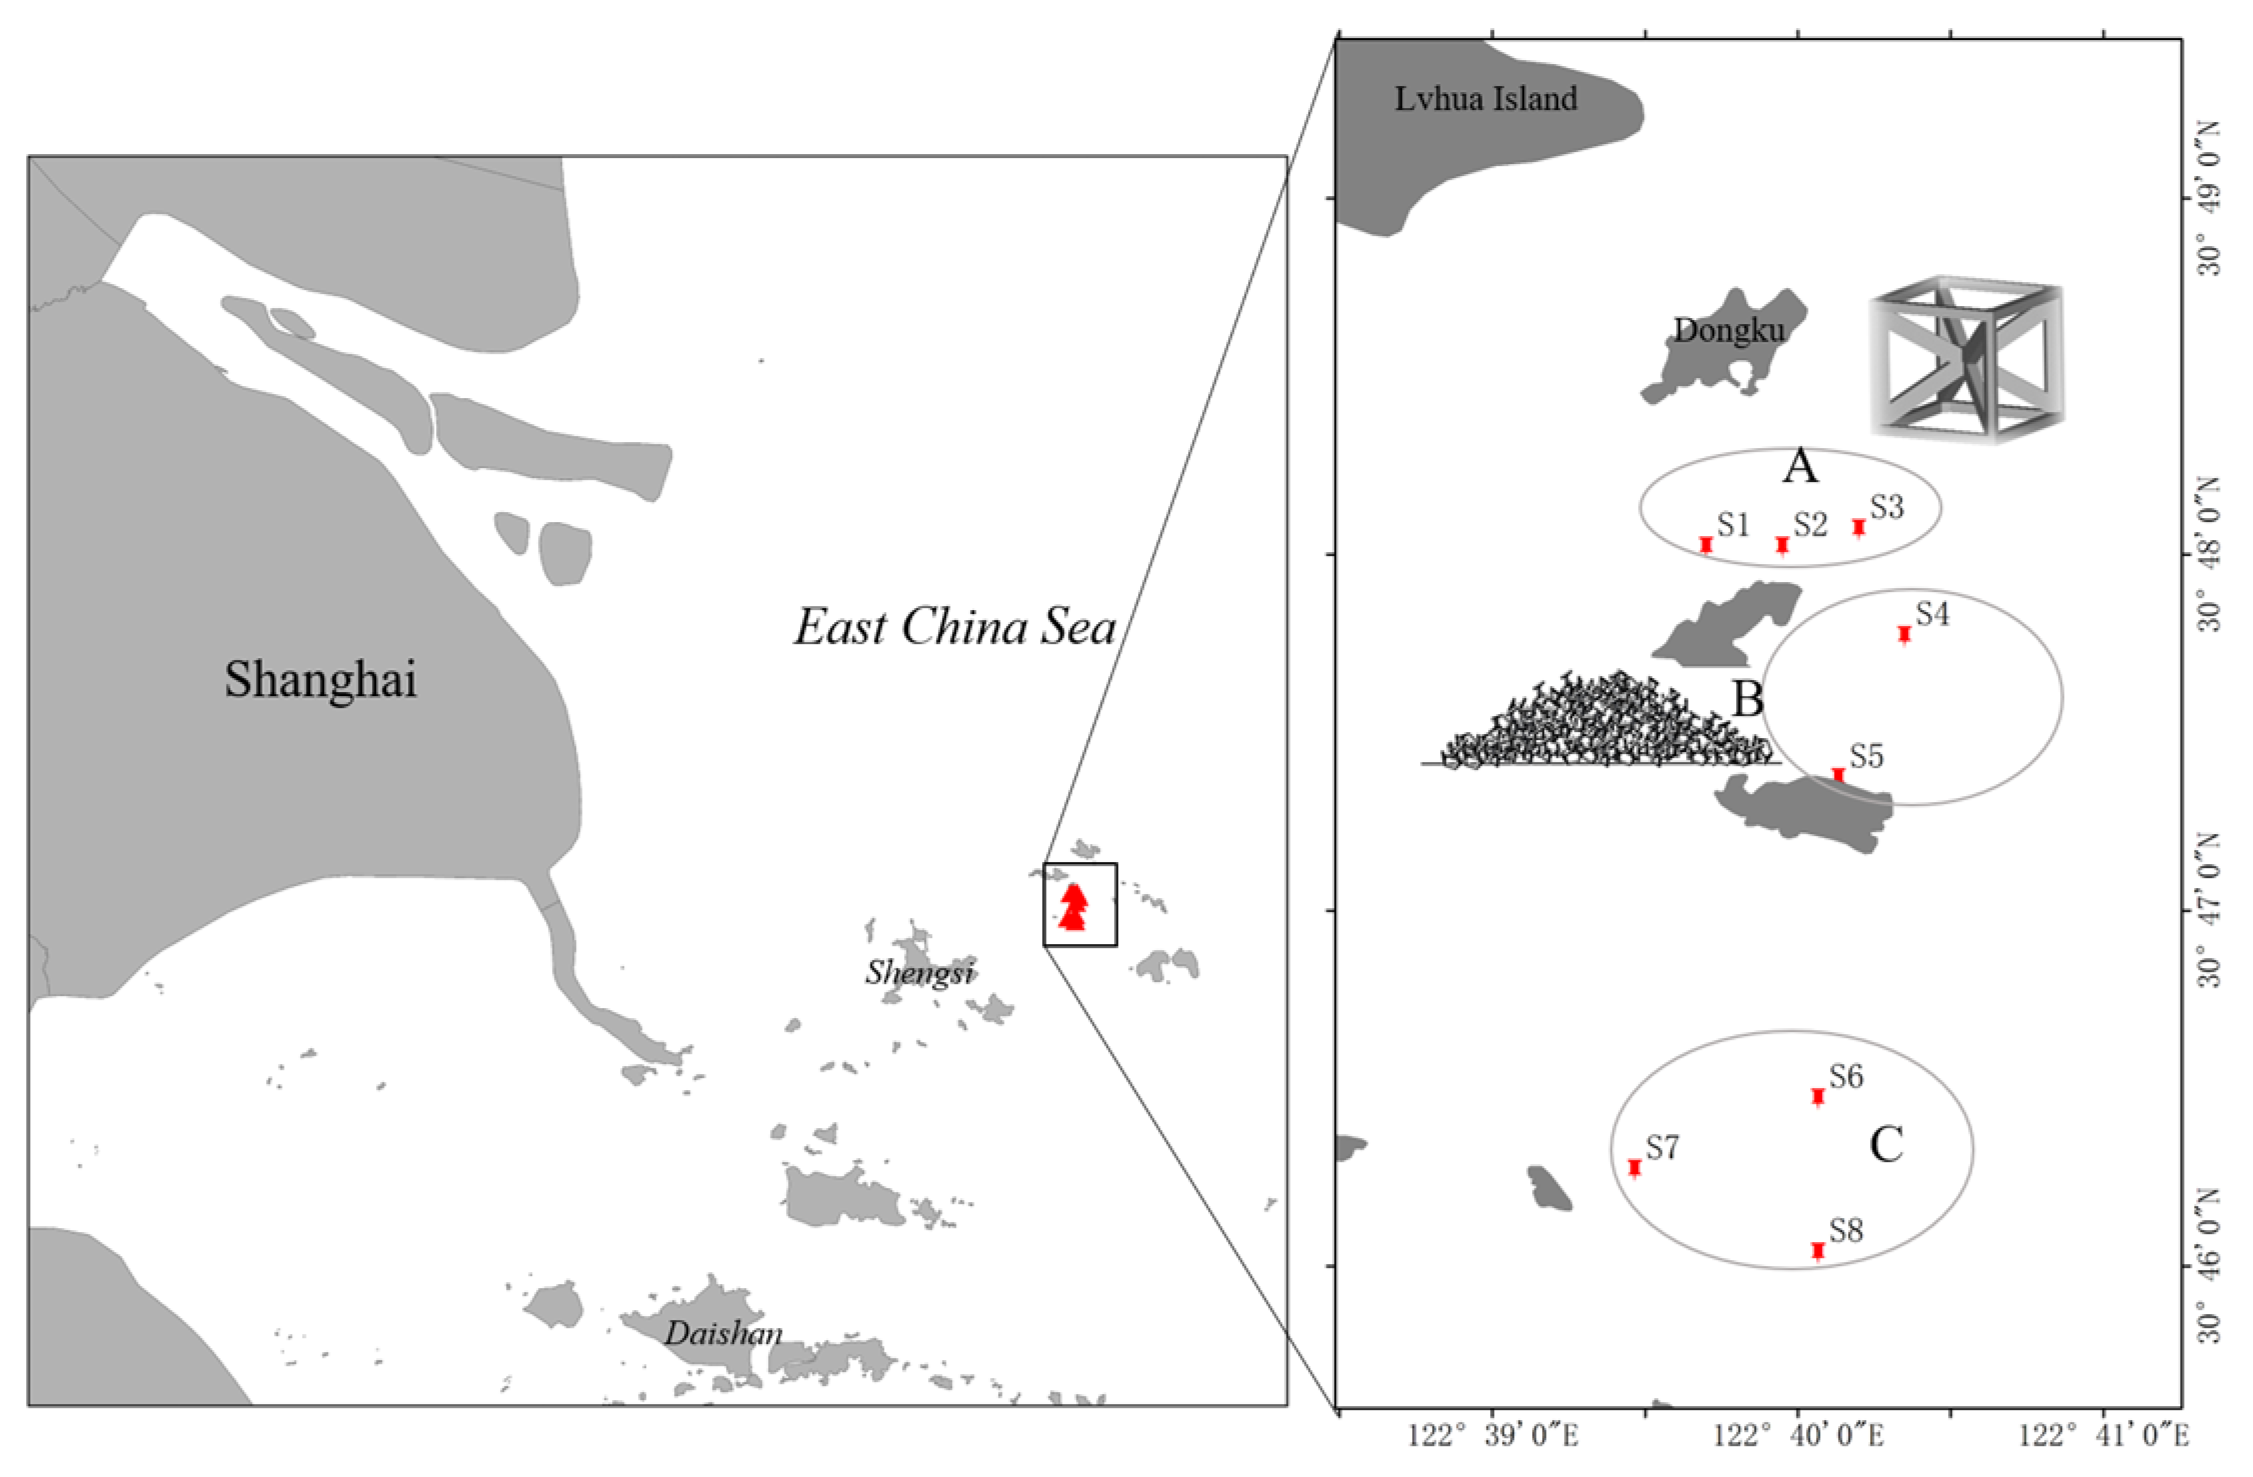
2.1. Study Area and Sampling Sites

The main study area is the Sanheng-Dongku National Marine Ranch (Figure 1), where pCO2W analysis was conducted in the artificial reef and control zones to explore the carbon sequestration effect of artificial reef areas.

2.2. Sample Collection and Processing

This study conducted sampling and monitoring of the artificial reef area and the control area in the Sanheng Marine Ranching area in summer and autumn of 2022, as well as winter and spring of 2023, respectively. On-site measurements were taken using a multiparameter water quality probe (SBE19plus, Sea-bird, Bellevue, Washington, America) to directly determine dissolved oxygen (DO), sea surface temperature (SST), salinity (S); pH was measured on-site using a Mettler pH meter, and Total Alkalinity (TA) was measured using the pH method. Water samples are collected on-site and filtered through glass fiber filters (Whatman GF/F). The filtered water samples are then transferred into brown glass bottles (pre-burned at 450 °C for 6 h), where a 0.02% saturated HgCl2 solution is added to fix and store the samples in the dark [26]. Subsequently, the Dissolved Inorganic Carbon (DIC) is determined using the Total Organic Carbon Analyzer (TOC-L, Himadzu, Kyoto, Japan) [27].

2.3. Estimation of Carbon Flux

The estimation of carbon flux in this study is based on the relationship equation provided by Dickson and Miller [28]
This formula is applicable for estimating carbon flux in seawater with salinity ranging from 20 to 40 and SST ranging from 2 to 35 °C [28].
The conversion formula between pHNBS (America National Bureau of Standards: ANSI) and pHSWS (Potential of hydrogen) used in this study with the NBS scale is as follows [29]:
p H S W S = p H N B S + p K 1 S W S ( M ) p K 1 N B S ( M )
p K 1 S W S M = 3670.7 T 62008 + 9.7944 l n T 0.0118 × S + 0.000116 × S 2
p K 1 N B S M = 13.7201 + 0.031334 × T + 3235.76 T + 0.000013 × T × S 0.1032 × S 0.5
T k = t ° C + 273.15
In the equation, T represents absolute temperature (K); S represents salinity; t represents temperature in degrees Celsius.
In this study, we assumed the CO2 system to be in equilibrium in the artificial reef area. The pCO2W is determined based on parameters such as temperature, salinity, pH, and total alkalinity (TA) of the seawater.
p C O 2 = C A × α H + 2 α s × k 1 × α H + + 2 K 2
C A = T A B T × K B α H + + K B
l n K B = 8966.90 2890.51 S   0.5 77.942 S + 1.726 S 1.5 0.0993 S   2 / T + 148.0248 + 137.194 S 0.5 + 1.62247 S 24.4344 + 25.085 S 0.5 + 0.247 S × l n T + 0.053105 S 0.5 × T
In the equation, CA represents carbonate alkalinity; α H + represents hydrogen ion activity; k 1 and k 2 are the apparent dissociation constants of carbonic acid; K B is the first apparent dissociation constant of boric acid; B T is the total boron concentration in seawater; and B T = 0.000416 (S/35) mol kg−1. TA is in units of mmol dm3. The value of K B is calculated using the value provided by Dickson [30], and α s is the solubility coefficient [mol kg−1·atm−1], calculated using the value provided by Weiss [31].
The FCO2 at the air–sea interface refers to the net exchange of CO2 between the atmosphere and the ocean per unit area per unit time, expressed in units of mmol m−2·d−1. The calculation formula is as follows:
F C O 2 = k × a s × p C O 2 = k × a s × p C O 2 W p C O 2 a i r ;
k = 0.31 × U 10 2 × S c 660 0.5 ;
In the equations above, k (m s−1)represents the gas transfer velocity, calculated using the formula provided by Wanninkhof [32] with a coefficient of 0.31; α s (mol kg−1 atm−1) is the solubility coefficient of CO2 in seawater; and ΔpCO2 is the partial pressure difference of CO2 between the surface seawater and the atmosphere. The atmospheric CO2 partial pressure (pCO2w) is based on the monitoring results from the Global Monitoring Laboratory-Earth System Research Laboratories of NOAA, and in this study, a value of 413.42 μatm is used for atmospheric CO2 concentration. U 10 2 (m s−1) is the wind speed at 10 m above sea level, based on daily and monthly average wind speeds provided by Shengsi Meteorological Station (58472). Sc is the Schmidt coefficient, which is a function of temperature, Sc = 2073.1 − 125.62 T + 3.6276 T2 − 0.043219 T3. When F > 0, it indicates seawater releasing CO2 to the atmosphere; when F < 0, it indicates seawater absorbing CO2 from the atmosphere.

2.4. Data Analysis

All data were expressed as mean ± standard error, and SPSS is used for correlation analysis. When p < 0.01, the difference is extremely significant; when p < 0.05, the difference is significant. Data visualization was carried out using ArcGIS 10.8.

3. Results and Analysis

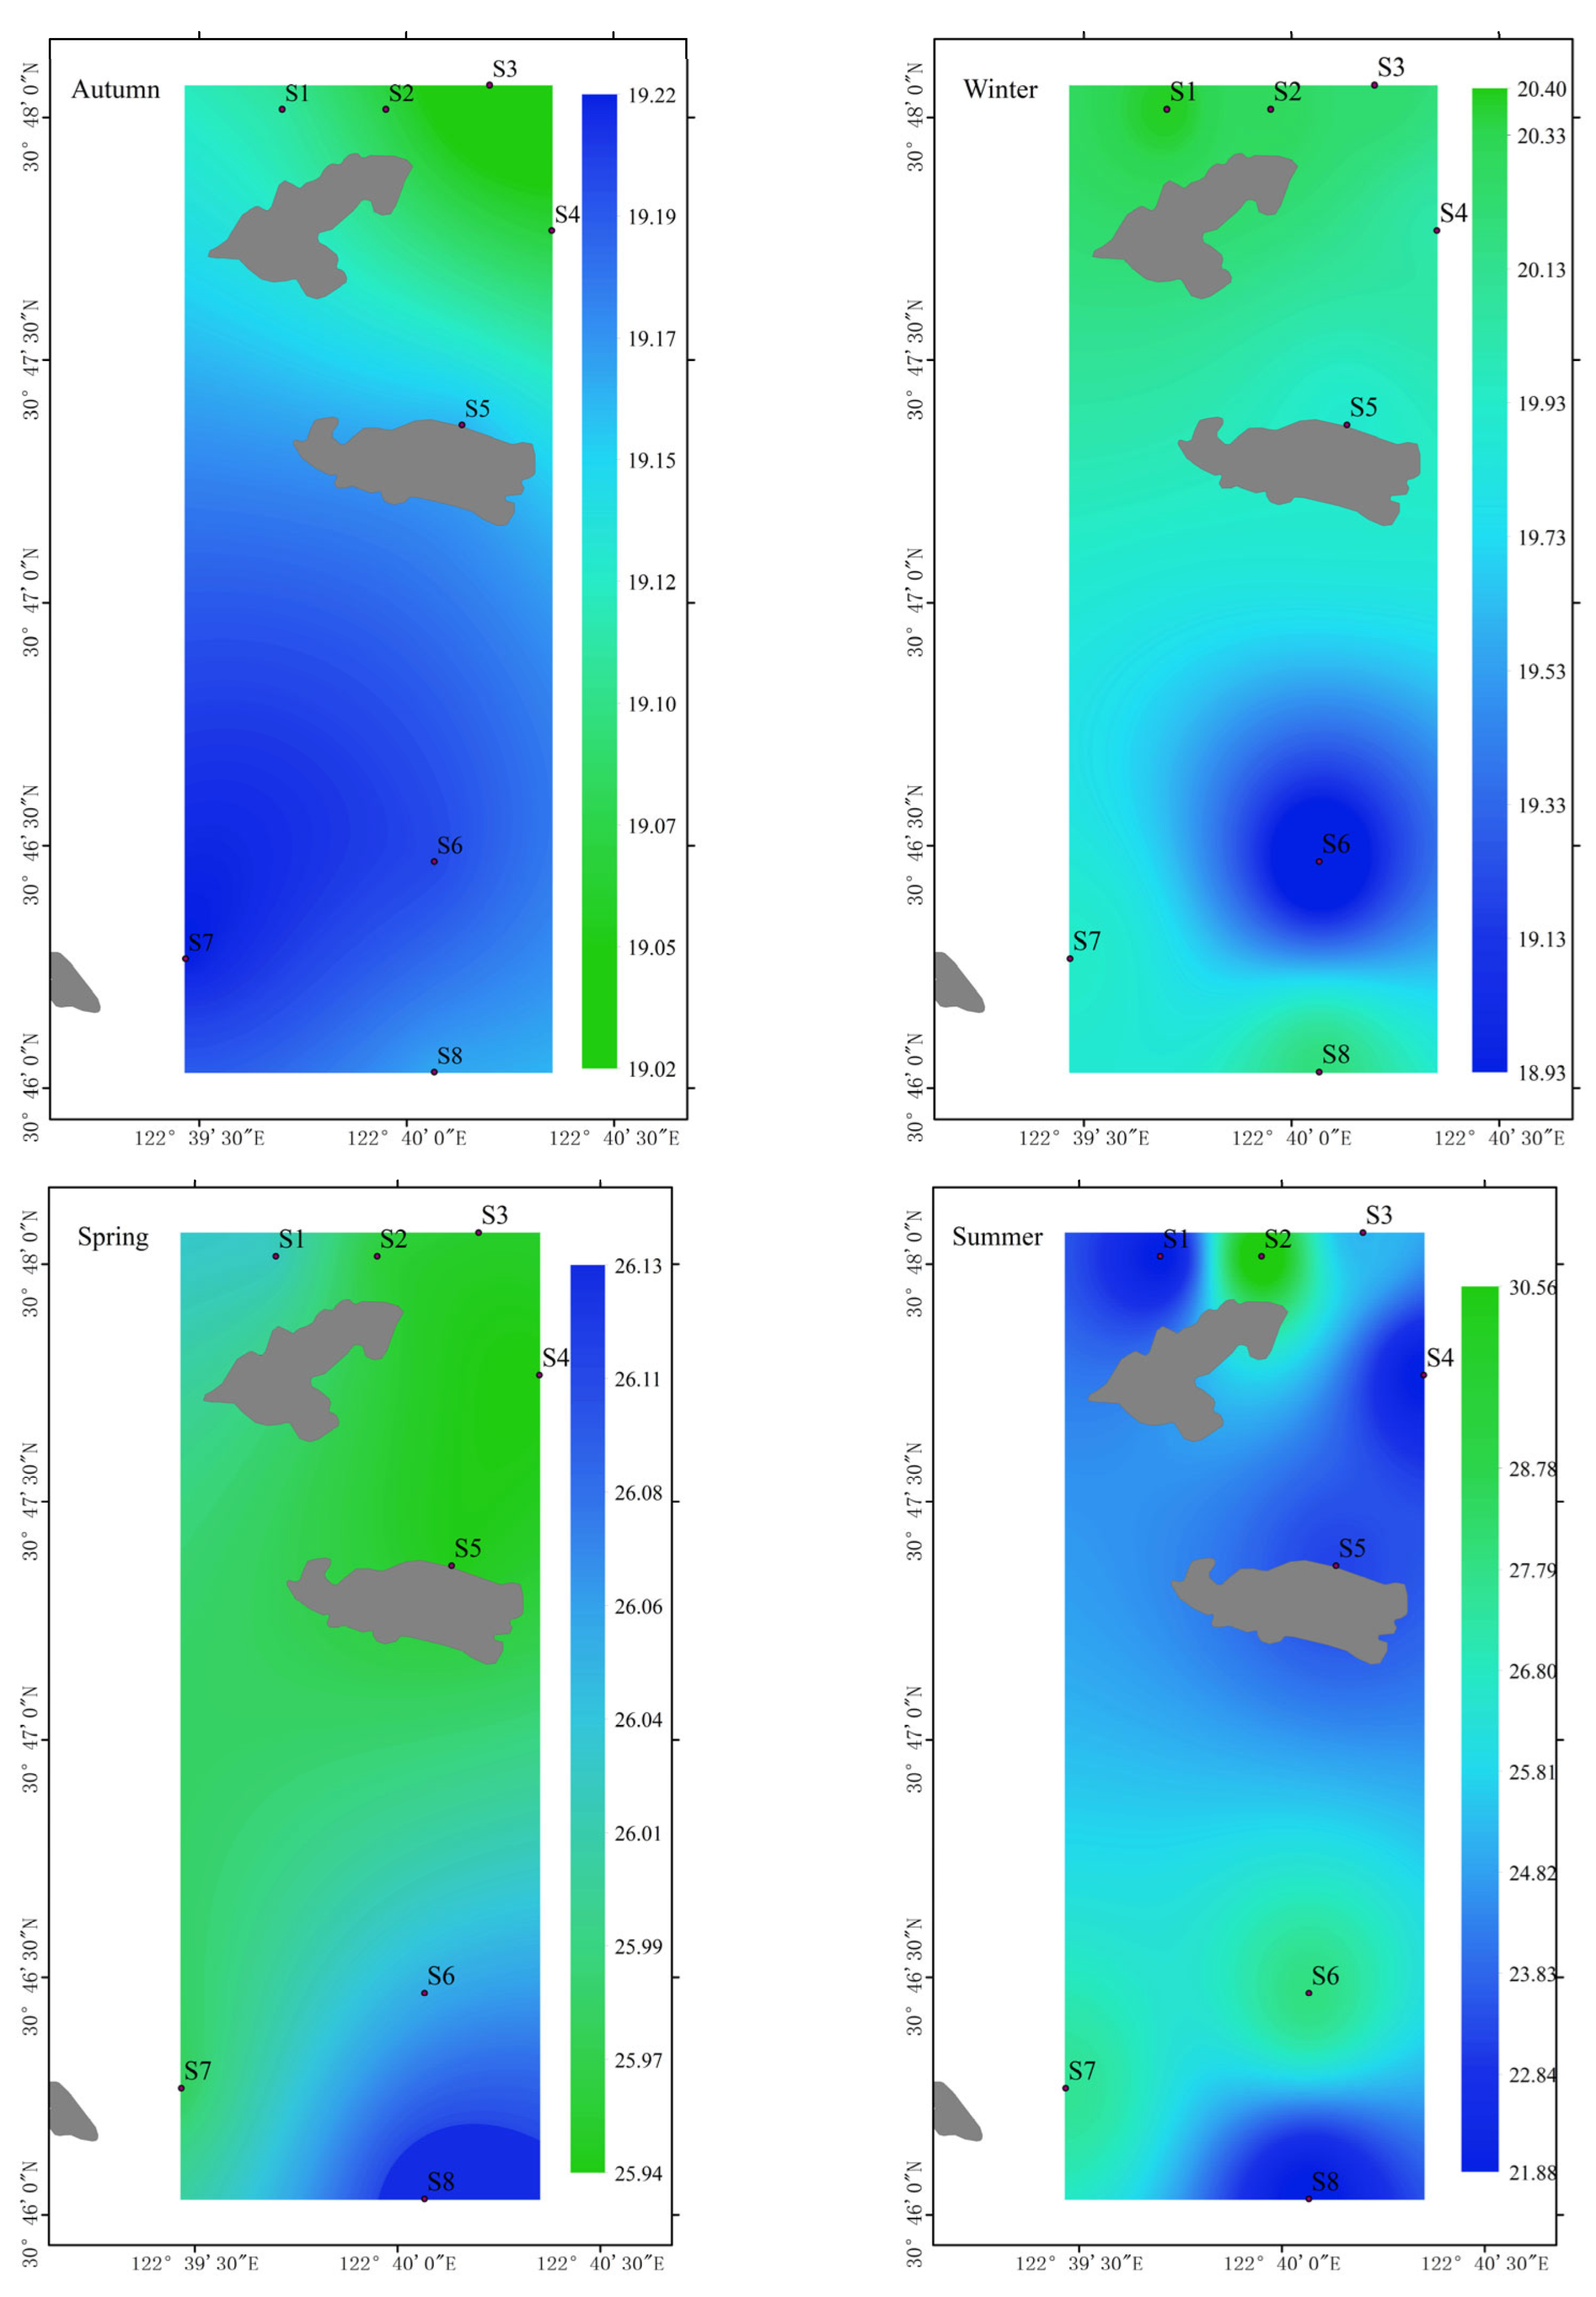
3.1. Surface Seawater Environment Characteristics

The basic environment parameters of surface seawater in different seasons in the study area in Table 1. The annual SST in the study area ranges from 11.10 °C to 27.48 °C, with the highest temperatures in summer and the lowest in winter. The differences between the highest and lowest temperatures in the four seasons of summer, autumn, winter, and spring are 0.62 °C, 1.90 °C, 2.14 °C, and 1.90 °C, respectively.
The pH of surface seawater ranges from 7.80 to 8.41, with the highest pH in summer and the lowest pH in winter. From the perspective of distribution area, the overall performance is that the pH in the artificial reef is higher than that in the control area in autumn, while in other seasons, the pH in the control area is higher than that in the artificial reef area.
There are significant differences in total alkalinity (TA) of surface seawater among different seasons (p < 0.05). The highest values were observed in winter and the lowest in summer. Except for autumn, the performance in the artificial reef was consistently greater than in the control area. Additionally, the TA differences between united artificial reefs and artificial seamount were not significant.
The entire study area showed a relatively small range of salinity variations. However, there were significant seasonal differences, with the highest salinity in winter and the lowest in summer. Except for autumn, the salinity in the artificial reef area was generally higher than the control area. Additionally, the difference in TA (total alkalinity) between the united artificial reefs and the artificial seamount was not significant.
The annual average DIC concentration for the entire area was 22.16 ± 3.08 mg/L. Seasonally, the DIC concentration was higher in spring and summer than in autumn and winter (Figure 2). In Figure 2, S1–S3 are united artificial reefs area while S5, S6 are artificial seamount area and S6–S8 are control area. From a spatial perspective, the DIC concentration in the artificial reef area and the control area was basically the same in autumn and winter, while in spring and summer, the DIC concentration observed in the unite artificial reefs area and the control area is similar, with lower DIC concentrations observed in the artificial seamount area.

3.2. Surface Seawater pCO2w and FCO2

The amplitude of annual values of pCO2w (Figure 3a) in the surveyed was 467.05 μatm, with the lowest average value in summer (73.33 ± 30.23 μatm) and the highest in winter (477.36 ± 21.74 μatm). Overall, except for autumn when the control area’s partial pressure was higher than the artificial reef area, in the other seasons, the pCO2w in the artificial reef area was generally higher than in the control area. However, the difference between the two types of artificial reef areas was not significant.
The pCO2w in surface seawater shows a pattern of winter > spring > autumn > summer. In winter, both the artificial reef area and the control area exhibit positive FCO2 values, indicating a source of CO2. In autumn, spring, and summer, the FCO2 values are negative, indicating an overall CO2 sink, with the artificial reef area showing a stronger CO2 sink than the control area, particularly in autumn. See Table 2.
The FCO2 showed the same distribution pattern as pCO2w (Figure 3b). In summer, the FCO2 value was the lowest (−104.83 ± 5.00) mmol m−2 d−1, with an average of −98.61 ± 8.22 mmol m−2 d−1, indicating a CO2 sink from the atmosphere. In autumn, it was (−86.3 ± 21.99) mmol m−2 d−1, in spring, it is −66.86 ± 6.59 mmol m−2 d−1, and in winter, it was the highest at 25.89 ± 9.62 mmol m−2 d−1. The annual range of the sea–air interface FCO2 was −104.83~30.16 mmol m−2 d−1.
The results of two-way ANOVA showed that there is a significant difference in pCO2w, and FCO2 values in the study area of Sanheng Island across the four seasons (p < 0.01).

3.3. The Relationship Between Surface Seawater pCO2w and Environmental Factors

Correlation analysis of SST, salinity, DIC, TA, and pH in surface seawater across four seasons (Table 3), it was found that pCO2w and FCO2 were both significantly negatively correlated with SST and pH, pCO2w was significantly positively correlated with salinity and TA (p < 0.01), whereas FCO2 was significantly positively correlated with TA and positively correlated with salinity.

4. Discussion

4.1. The Main Environmental Factors of Island Reef Areas Affecting the Surface Seawater pCO2w

The pCO2w is influenced by multiple factors such as water temper, salinity (mixed with saltwater and freshwater), and the activities of mariculture organisms [33]. Sea surface temperature is usually one of the main controlling factors for pCO2w.
Temperature usually has a dual effect on the pCO2w of seawater: on one hand, changes in temperature affect the solubility of CO2 in seawater and the dissociation equilibrium of carbonates, meaning that an increase in temperature decreases the solubility of CO2, leading to an increase in pCO2w; on the other hand, temperature can influence the metabolic activities of marine organisms (such as microbial respiration, photosynthesis, coral metabolism, etc.), thereby regulating changes in pCO2w showing higher levels in the reef area compared to the control area, except in autumn. Song [34] pointed out that in open ocean areas, the pCO2w is positively correlated with salinity, while in water mass mixing areas, the increase in salinity due to the mixing of fresh and saltwater leads to a decrease in the pCO2w of seawater, resulting in a negative correlation. From Table 3, we can see that pCO2w had the significant negative correlation with SST.
In summer, the SST reaches the highest level throughout the year, leading to a decrease in CO2 solubility, which facilitates the transfer of CO2 from water to the atmosphere. Additionally, with the higher water temperature, nutrient species brought in by the freshwater plume from the Yangtze River stimulate the growth of phytoplankton, resulting in a significantly higher standing stock of phytoplankton compared to other seasons [35,36]. The photosynthesis of phytoplankton can reduce pCO2 in seawater by 25–27 ppm, which may also be a reason for the lower pCO2 in the surface seawater during summer compared to other seasons.
Additionally, Zhai [37] found a significant negative correlation between surface pCO2 and salinity outside the Yangtze River estuary, which is consistent with the results of this study. This is likely due to the strong water exchange and mixing in the study area located at the mouth of the Yangtze River. This study found that there was a significant negative correlation between air–sea flux and temperature. Hu [38] also observed similar conclusions on the sea–air flux in the East China Sea and the Southern Yellow Sea.
Furthermore, the presence of a thermocline in summer effectively hinders vertical mixing of the water column, preventing dissolved inorganic carbon (DIC) and other substances generated by the decomposition of particulate organic carbon (POC) at the bottom from rising to the surface [39,40,41]. Overall, the complexity of the relationships with environmental factors indicates that the CO2 exchange flux is the result of the coupled effects of physiological and ecological processes of aquaculture organisms and plankton, as well as physical processes in the marine environment. The sources and sinks of CO2 at the air–sea interface are mainly caused by the distribution changes in surface water CO2 partial pressure, and are influenced by physical, chemical, and biological factors such as hydrodynamic processes, sea surface temperature, acidity, and biological activity [42,43].
Although the study area acts as a carbon sink in spring, summer, and autumn, the high intensity of carbon sources in winter causes the entire research area to function as a carbon source throughout the year.

4.2. The Carbon Flux and Carbon Sequestration Capacity in Marine Ranching

Marine ranching infrastructure can alter the surrounding abiotic environment, leading to changes in the biotic environment. The flow field effects of engineered facilities such as artificial reefs can modify the fluid dynamics in the vicinity, generating upwelling that transports bottom-layer nutrients to the mid-upper water column, promoting the growth of phytoplankton and enriching the marine ranching biological. This, in turn, facilitates bait attraction, drawing more marine organisms to aggregate in the ranching area, thereby enhancing marine biodiversity and biomass in the area [4,44,45]. The improvement of the physicochemical environment of marine ranching and adjacent waters can increase primary productivity, thereby enhancing the conversion of CO2 by photosynthesis. The placement of artificial reefs has significantly increased the biomass and density of fishery resources in marine ranching and the surrounding waters [46,47].
Through investigations into the artificial reefs area and control area near Xiao shidao in Xi gang, Yangaodao in Mu ping, Xun shan in Weihai, and Qian shan in Rizhao, it was found that the number of fish species in the artificial reefs area was 1.8 times higher than that in the control areas. The average quantity and resource volume increased by 3.5 times and 1.9 times, respectively [48]. Feng [49] conducted trawl surveys of fishery resources in the artificial reef area of Wailingding Island, Zhuhai, and found that after the reef was deployed, the fishery resources in the reef area were 4.35 times that of the control area. Zhang [50] conducted a biological resource survey of the artificial reefs in Haizhou Bay and found that after the artificial reef was deployed, both biodiversity and evenness increased, and the CPUE in the reef area increased by one compared to before reef deployment. According to the definition of fishery carbon sink, the carbon fixed by the growing fish in the marine ranch comes from the natural sea area, playing an important role in biological carbon sequestration. Wang [51] conducted a survey on fish and large invertebrates in different habitats of the Sanheng sea area, and found that the total number of species in the artificial reef habitat was 2.06 times that of the muddy habitat, and the abundance was also significantly higher than that of the natural habitat. In addition, other scholars have studied the communities of attached mollusks in fish reef and rock reef habitats, finding that the species richness and diversity of rock reefs are significantly higher than those of artificial reef habitats, but the distribution density of certain species on artificial reefs is much higher than that on natural reefs [52,53].
The improvement of the physical and chemical environment in marine ranching areas and adjacent waters can increase primary productivity, thereby enhancing the conversion of CO2 through photosynthesis. Filter-feeding bivalves attached to the reef structure can also sequester carbon over time. The deployment of artificial reefs significantly increases the biomass and density of fishery resources in marine ranching and adjacent radiated areas.
Research has found that, as an important component of artificial reefs, it can enhance the diversity and abundance of zooplankton, benthic organisms, and fish, thereby increasing carbon sink fisheries [54,55]. Additionally, oysters and other bivalves attached to the reef, during their growth process, produce feces and excretions that serve as nutrients for benthic organisms, acting as organic fertilizer for other blue carbon ecosystems. Studies have shown that the biomass, primary productivity, and total productivity of reefs communities and seagrass meadow co-ecosystems are 44.04 times, 5.03 times, and 5.34 times those of single systems, respectively [54,55].
Additionally, the research has found that seaweed, as an important component of marine ranching, exhibits a strong carbon sequestration effect in seaweed farming areas compared to non-farming areas, with an average decrease in CO2 partial pressure of 58.7 ± 15.9 μatm, indicating a certain carbon sink capacity [56].
Overall, the construction of artificial reefs and marine ranching significantly improves the resource status within the marine environment, increases the biomass in the area, and effectively enhances the carbon sequestration capacity within the marine environment.

5. Conclusions

The main findings of this research were (1) the annual variation range of the partial pressure of CO2 (pCO2w) in the surface seawater of the Sanheng artificial reef area was found to be 34.48 to 501.53 μatm, and the partial pressure of CO2 (pCO2w) decreases in the following order: winter, spring, autumn, summer; (2) and the CO2 flux (FCO2) exhibited a highly significant negative correlation with sea surface temperature and a highly significant positive correlation with salinity and total alkalinity. Similarly, the CO2 flux (FCO2) in the surface seawater decreases in the following order: winter, spring, autumn, summer. (3) During winter, both the reef area and the control area served as sources of CO2. However, in the other three seasons, the FCO2 values were negative, indicating an overall sink for CO2, with a more pronounced effect reef area compared to the control area in the autumn.
While this study concludes that the construction of artificial reefs contributes to carbon sequestration, the precise quantification of this effect remains unclear. Additionally, the primary factors and mechanisms driving variations in carbon sequestration across different marine regions are not yet well understood. Further research is needed to elucidate these aspects.
A comprehensive assessment of their ecological benefits and contribution to the low-carbon economy, in order to better serve the blue carbon strategy, still requires long-term and extensive monitoring.

Author Contributions

Data curation, M.Z., K.W., X.Z., L.C. and H.Z.; Formal analysis, K.W. and L.D.; Funding acquisition, L.D.; Investigation, M.Z., X.Z., L.C. and H.Z.; Methodology, M.Z., K.W. and L.D.; Software: M.Z. and X.Z.; Writing—original draft, M.Z.; Writing—review and editing, L.C. All authors have read and agreed to the published version of the manuscript.

Funding

This research was financially supported by Zhoushan Science and Technology Bureau (No. 2022C51002).

Institutional Review Board Statement

Not applicable.

Informed Consent Statement

Not applicable.

Data Availability Statement

The original contributions presented in the study are included in the article, further inquiries can be directed to the corresponding author.

Conflicts of Interest

The authors declare no conflicts of interest.

References

  1. Ciais, P.; Sabine, C.; Bala, G.; Bopp, L.; Brovkin, V.; House, J.I. Carbon and Other Biogeochemical Cycles; Cambridge University Press: New York, NY, USA, 2013. [Google Scholar]
  2. Jiao, N. Developing Ocean Negative Carbon Emission Technology to Support National Carbon Neutralization. Bull. Chin. Acad. Sci. 2021, 36, 179–187. [Google Scholar]
  3. Feng, C.; Ye, G.; Jiang, Q.; Zheng, Y.; Chen, G.; Wu, J.; Feng, X.; Si, Y.; Zeng, J.; Li, P.; et al. The contribution of ocean-based solutions to carbon reduction in China. Sci. Total Environ. 2021, 797, 149168. [Google Scholar] [CrossRef] [PubMed]
  4. Reeds, K.A.; Smith, J.A.; Suthers, I.M.; Johnston, E.L. An ecological halo surrounding a large offshore artificial reef: Sediments, infauna, and fish foraging. Mar. Environ. Res. 2018, 141, 30–38. [Google Scholar] [CrossRef] [PubMed]
  5. Zhou, X.; Zhao, X.; Zhang, S.; Lin, J. Marine Ranching Construction and Management in East China Sea: Programs for Sustainable Fishery and Aquaculture. Water 2019, 11, 1237. [Google Scholar] [CrossRef]
  6. Shi, X.; Wang, T.; Luo, K.; Wang, J.; Gu, X. The mechanism of constructing marine ranching industrial ecosystem based on grounded theory: A case study of Yantai, China. Reg. Stud. Mar. Sci. 2023, 68, 103214. [Google Scholar] [CrossRef]
  7. Hill, R.; Bellgrove, A.; Macreadie, P.I.; Petrou, K.; Beardall, J.; Steven, A.; Ralph, P.J. Can macroalgae contribute to blue carbon? An Australian perspective. Limnol. Oceanogr. 2015, 60, 1689–1706. [Google Scholar] [CrossRef]
  8. Zhang, S.Y.; Liang, J.; Wang, Z.H.; Wang, K. Distribution characteristics of benthic algae in intertidal zone of Ma’an Archipelago of ZheJiang Province. Chin. J. Appl. Ecol. 2008, 10, 2299–2307. [Google Scholar]
  9. Ma, H.; Qin, C.; Chen, P.; Feng, X.; Yuan, R.; Li, X.; Lin, H. Study of biomass carbon storage in Zhelin Bay marine ranch of South China Sea. South China Fish. Sci. 2017, 13, 56–64. [Google Scholar] [CrossRef]
  10. Duarte, C.M.; Cebrian, J. The fate of marine autotrophic production. Limnol. Oceanogr. 1996, 41, 1758–1766. [Google Scholar] [CrossRef]
  11. Wang, S.; Yan, D.; Wang, C.; Wu, L.; Huang, Y. A bibliometric analysis of blue carbon (1993–2023): Evolution of research hot topics and trends. Front. Mar. Sci. 2024, 11, 1430545. [Google Scholar] [CrossRef]
  12. Tang, Q. Fisheries carbon sinks: Faster and better development of modern fisheries. Jiangxi Fish. Sci. Technol. 2011, 5–7. [Google Scholar] [CrossRef]
  13. Chen, X.; Sun, Z.; Di, Q.; Liang, C. Marine fishery carbon emission reduction and changing factors behind marine fishery eco-efficiency growth in China. Ecol. Inform. 2024, 80, 102478. [Google Scholar] [CrossRef]
  14. Shen, J.; Liang, R. Study on the blue carbon sink pricing of marine ranch. Resour. Sci. 2018, 40, 1812–1821. [Google Scholar] [CrossRef]
  15. Shi, C.; Zhi, J.; Yao, X.; Zhang, H.; Yu, Y.; Zeng, Q.; Li, L.; Zhang, Y. How can China achieve the 2030 carbon peak goal—A crossover analysis based on low-carbon economics and deep learning. Energy 2023, 269, 126776. [Google Scholar] [CrossRef]
  16. Zhang, Y.J.; Wang, A.D.; Da, Y.B. Regional allocation of carbon emission quotas in China: Evidence from the Shapley value method. Energy Policy 2014, 74, 454–464. [Google Scholar] [CrossRef]
  17. Chen, X.; Di, Q.; Jia, W.; Hou, Z. Spatial correlation network of pollution and carbon emission reductions coupled with high-quality economic development in three Chinese urban agglomerations. Sustain. Cities Soc. 2023, 94, 104552. [Google Scholar] [CrossRef]
  18. Yang, Y.; Li, H. Spatiotemporal dynamic decoupling states of eco-environmental quality and land-use carbon emissions: A case study of Qingdao City, China. Ecol. Inform. 2023, 75, 101992. [Google Scholar] [CrossRef]
  19. Na, R.; Rong, Z.; Wang, Z.A.; Liang, S.; Liu, C.; Ringham, M.; Liang, H. Air-sea CO2 fluxes and cross-shelf exchange of inorganic carbon in the East China Sea from a coupled physical-biogeochemical model. Sci. Total Environ. 2024, 906, 167572. [Google Scholar] [CrossRef]
  20. Liu, K.K.; Peng, T.H.; Shaw, P.T.; Shiah, F.K. Circulation and biogeochemical processes in the East China Sea and the vicinity of Taiwan: An overview and a brief synthesis. Deep Sea Res. Part II Top. Stud. Oceanogr. 2003, 50, 1055–1064. [Google Scholar] [CrossRef]
  21. Ye, L.; Zhang, H.; Zhu, Z.; Liu, L.; Zhou, S. Distribution characteristics of p(CO2) in the sea-atmosphere interface in the East China Sea. Environ. Sci. Technol. 2019, 42, 121–127. [Google Scholar]
  22. Peng, P.; Ma, Y.; Shi, R.; Wang, D.; Xu, X.; Yan, B. Temporal and spatial variation in the sea–air CO2 flux in the oyster aquaculture area of Kaozhou Bay. Mar. Sci. 2022, 46, 140–149. [Google Scholar]
  23. Fodrie, F.J.; Rodriguez, A.B.; Gittman, R.K.; Grabowski, J.H.; Lindquist, N.L.; Peterson, C.H.; Piehler, M.F.; Ridge, J.T. Oyster reefs as carbon sources and sinks. Proc. R. Soc. B Biol. Sci. 2017, 284, 20170891. [Google Scholar] [CrossRef] [PubMed]
  24. Li, X.; Yang, J.; Zhao, Y.; Zhou, S.; Wu, Y. Prediction and assessment of marine fisheries carbon sink in China based on a novel nonlinear grey Bernoulli model with multiple optimizations. Sci. Total Environ. 2024, 914, 169769. [Google Scholar] [CrossRef] [PubMed]
  25. Wang, Y.; Yang, Y.; Hu, X. The evolution and effectiveness of China’s marine carbon sink fishery policies. Ocean Coast. Manag. 2024, 259, 107470. [Google Scholar] [CrossRef]
  26. Dickson, A.G.; Sabine, C.L.; Christian, J.R. Guide to Best Practices for Ocean CO2 Measurements; PICES Special Publication; North Pacific Marine Science Organization: Sidney, BC, Canada, 2007. [Google Scholar]
  27. Zhou, J.H.; Guo, Y.Z.; Zhao, X.; Yu, J.C.; Zhou, J.; Lin, J.; Huang, H. Impacts of shellfish and macroalgae mariculture on the seawater carbonate system and air-sea CO2 flux in Haizhou Bay, China. Mar. Environ. Res. 2024, 202, 106774. [Google Scholar] [CrossRef] [PubMed]
  28. Dickson, A.G.; Miller, F.J. A comparison of the equilibrium constants for the dissociation of carbonic acid in seawater media. Deep Sea Res. Part A Oceanogr. Res. Pap. 1987, 34, 1733–1743. [Google Scholar] [CrossRef]
  29. Cai, W.J.; Dai, M.; Wang, Y.; Zhai, W.; Huang, T.; Chen, S.; Zhang, F.; Chen, Z.; Wang, Z. The biogeochemistry of inorganic carbon and nutrients in the Pearl River estuary and the adjacent Northern South China Sea. Cont. Shelf Res. 2004, 12, 1301–1319. [Google Scholar] [CrossRef]
  30. Dickson, A.G. Thermodynamics of the dissociation of boric acid in synthetic seawater from 273.15 to 318.15 K. Deep Sea Res. Part A Oceanogr. Res. Pap. 1990, 5, 755–766. [Google Scholar] [CrossRef]
  31. Weiss, R.F. Carbon dioxide in water and seawater: The solubility of a non-ideal gas. Mar. Chem. 1974, 2, 203–215. [Google Scholar] [CrossRef]
  32. Wanninkhof, R. Relationship between wind speed and gas exchange over the ocean revisited. Limnol. Oceanogr. Methods 2014, 6, 351–362. [Google Scholar] [CrossRef]
  33. Zhang, Z.; Yang, B.; Cui, Z.; Lin, Z.; Xie, Z.; Zheng, H.; Liao, B.; Xiao, B.; Zhu, C. Distribution characteristics of pCO2 and source-sink conversion mechanism of CO2 in a subtropical coral reef water during the dry season: A case study of the Yangmeikeng Sea area in Shenzhen, China. Mar. Sci. 2023, 47, 45–56. [Google Scholar]
  34. Song, J.M.; Li, X.G.; Yuan, H.M.; Zheng, G.X.; Yang, Y.F. Carbon Fixed by Phytoplankton and Cultured algae in China Coastal Seas. Acta Ecol. Sin. 2008, 2, 551–559. [Google Scholar]
  35. Craig, S.E.; Thomas, H.; Jones, C.T.; Li, W.K.; Greenan, B.J.; Shadwick, E.H.; Burt, W.J. The effect of seasonality in phytoplankton community composition on CO2 uptake on the Scotian Shelf. J. Mar. Syst. 2015, 147, 52–60. [Google Scholar] [CrossRef]
  36. Kako, S.I.; Nakagawa, T.; Takayama, K.; Hirose, N.; Isobe, A. Impact of Changjiang River Discharge on Sea Surface Temperature in the East China Sea. J. Phys. Oceanogr. 2016, 46, 1735–1750. [Google Scholar] [CrossRef]
  37. Zhai, W.; Dai, M. On the seasonal variation of air-sea CO2 fluxes in the outer Changjiang (Yangtze River) Estuary, East China Sea. Mar. Chem. 2009, 117, 2–10. [Google Scholar] [CrossRef]
  38. Hu, D.; Gao, G.; Zhai, H.; Zhang, C. Seasonal Variability of Shipboard Air-Sea CO2 Flux in the East China Sea and South Yellow Sea. Adv. Mar. Sci. 2016, 34, 474–485. [Google Scholar]
  39. Li, G.; Qiao, L.; Dong, P.; Ma, Y.; Xu, J.; Liu, S.; Liu, Y.; Li, J.; Li, P.; Ding, D.; et al. Hydrodynamic condition and suspended sediment diffusion in the Yellow Sea and East China Sea. J. Geophys. Res. Ocean 2016, 121, 6204–6222. [Google Scholar] [CrossRef]
  40. Liu, S.; Qiao, L.; Li, G.; Li, J.; Wang, N.; Yang, J. Distribution and cross-front transport of suspended particulate matter over the inner shelf of the East China Sea. Cont. Shelf Res. 2015, 107, 92–102. [Google Scholar] [CrossRef]
  41. Zhang, Z.; Zhou, M.; Zhong, Y.; Zhang, G.; Jiang, S.; Gao, Y.; Zhang, R.; Smith, W.O., Jr. Spatial Variations of Phytoplankton Biomass Controlled by River Plume Dynamics Over the Lower Changjiang Estuary and Adjacent Shelf Based on High-Resolution Observations. Front. Mar. Sci. 2020, 7, 587539. [Google Scholar] [CrossRef]
  42. Cao, Z.; Yang, W.; Zhao, Y.; Guo, X.; Yin, Z.; Du, C.; Zhao, H.; Dai, M. Diagnosis of CO2 dynamics and fluxes in global coastal oceans. Natl. Sci. Rev. 2020, 7, 786–797. [Google Scholar] [CrossRef]
  43. Qu, B.; Song, J.; Yuan, H.; Li, X. Advances of seasonal variations and controlling factors of the sea-air CO2 flux in the East China Sea. Adv. Earth Sci. 2013, 28, 783–793. [Google Scholar]
  44. Koike, S.; Otake, S. The Effect to the Flow around the Artificial Reef in the Different Arrangement in Situ. Fish. Eng. 2017, 53, 139–147. [Google Scholar]
  45. Gong, P.; Li, J.; Guan, C.; Li, M. Estimation and experiment of carbon sequestration by oysters attached to the enhancement artificial. Chin. J. Appl. Ecol. 2014, 25, 3032–3038. [Google Scholar]
  46. Fang, L.; Chen, P.; Chen, G.; Tang, Y.; Yuan, H.; Feng, X. Preliminary Evaluation on Resources Enhancement of Artificial Reef in the East Corner of Zhelang Shanwei. Asian Agric. Res. 2013, 5, 111–115. [Google Scholar]
  47. Chen, Y. Analysis of Ecological Effects of Southern Dalajia Island Artificial Area in Daya Bay, Guang Dong, China. Ph.D. Thesis, Jinan University, Guangzhou, China, 2009. [Google Scholar]
  48. Jiao, J.J.; Pan, Y.X.; Sun, L.Y.; Yang, B.Q.; Qiu, S.Y. Effect of Artificial reefs on Fish Multiplication. Fish. Sci. 2011, 2, 79–82. [Google Scholar]
  49. Feng, X.; Fan, J.T.; Sun, X.; Hong, J.Z.; Chen, P.M. The stock enhancement effect evaluation of artificial reef in Wailingding, Zhuhai. J. South. Agric. 2021, 52, 3228–3236. [Google Scholar]
  50. Zhang, H.; Zhu, K.W.; Tang, J.H. The effect of fishery resource enhancement in the artificial reef area in the Haizhou Gulf. Mar. Fishries 2005, 1, 38–43. [Google Scholar]
  51. Wang, Z.; Zhang, S.; Wang, K. Fish and macroinvertebrates community structure in artificial habitat around Sanheng Island, Shengsi, China. Acta Ecol. Sin. 2010, 30, 2026–2935. [Google Scholar]
  52. Champion, C.; Suthers, I.M.; Smith, J.A. Zoo planktivory is a key process for fish production on a coastal artificial reef. Mar. Ecol. Prog. Ser. 2015, 541, 1–14. [Google Scholar] [CrossRef]
  53. Badalamenti, F.; Chemello, R.; D’anna, G.; Ramos, P.H.; Riggio, S. Are artificial reefs comparable to neighboring natural rocky areas? A mollusk case study in the Gulf of Castellammare (NW Sicily). ICES J. Mar. Sci. 2002, 59, S127–S131. [Google Scholar] [CrossRef]
  54. Crawford, C.M.; Edgar, G.J.; Gillies, C.L.; Heller-Wagner, G. Relationship of biological communities to habitat structure on the largest remnant flat oyster reef (Ostrea angasi) in Australia. Mar. Freshw. Res. 2020, 71, 972–983. [Google Scholar] [CrossRef]
  55. Grabowski, J.H.; Brumbaugh, R.D.; Conrad, R.F.; Keeler, A.G.; Opaluch, J.J.; Peterson, C.H.; Piehler, M.F.; Powers, S.P.; Smyth, A.R. Economic Valuation of Ecosystem Services Provided by Oyster Reefs. Bioscience 2012, 62, 900–909. [Google Scholar] [CrossRef]
  56. Xiao, X.; Agustí, S.; Yu, Y.; Huang, Y.; Chen, W.; Hu, J.; Li, C.; Li, K.; Wei, F.; Lu, Y.; et al. Seaweed farms provide refugia from ocean acidification. Sci. Total Environ. 2021, 776, 145192. [Google Scholar] [CrossRef] [PubMed]
Figure 1. Sampling area. A—unite artificial reefs (site: S1–S3); B—artificial seamount (site: S4,S5); C—control area (site: S6–S8).
Jmse 12 02272 g001
Figure 2. The seasonal distribution characteristics of DIC.
Jmse 12 02272 g002
Figure 3. The seasonal variation characteristics of pCO2 (a) and FCO2 (b) in artificial areas and control areas. (A—united artificial reefs; B—artificial seamount; C—control area).
Jmse 12 02272 g003
Table 1. Basic parameters of surface seawater in different seasons.
SeasonRegionSST (°C)Salinity (pSU)pHTA (mg/L)DIC (mg/L)
AutumnA20.7832.208.33134.5919.05
B20.9832.758.24132.9719.13
C20.3733.38.07146.9819.21
WinterA11.3132.137.82153.7720.33
B11.1532.157.81152.9520.01
C11.2631.507.81146.3619.37
SpringA19.9328.808.06133.8726.10
B19.3529.108.04136.5222.00
C18.9729.58.07132.2926.49
SummerA27.1827.548.2797.6525.88
B27.4828.848.2587.9422.55
C27.4127.938.3680.0325.75
A—united artificial reefs (site: S1–S3); B—artificial seamount (site: S4, S5); C—control area (site: S6–S8).
Table 2. The pCO2w (μatm) and FCO2 in the artificial reef area in different seasons.
ItemAreaAutumnWinterSpringSummer
pCO2wTotal area159.32 ± 67.13477.36 ± 21.74228.55 ± 17.0373.33 ± 30.23
united artificial reefs130.50 ± 73.31487.12 ± 25.51230.57 ± 8.5491.65 ± 32.22
artificial seamount109.22 ± 11.79486.31 ± 21.53243.18 ± 18.8379.19 ± 8.79
control area221.54 ± 64.34461.63 ± 13.31216.79 ± 17.0351.10 ± 18.49
FCO2Total area−86.3 ± 21.9925.89 ± 9.62−66.86 ± 6.59−98.61 ± 8.22
united artificial reefs−95.94 ± 24.3930.16 ± 11.24−65.45 ± 6.07−93.95 ± 10.69
artificial seamount−102.22 ± 4.3829.93 ± 9.68−61.79 ± 4.00−95.26 ± 1.43
control area−66.06 ± 20.9618.94 ± 9.62−71.67 ± 6.61−104.83 ± 5.00
Table 3. The correlation between the partial pressure of carbon dioxide (pCO2) in surface seawater, air–sea CO2 flux, and environmental factors.
SSTSalinitypHDICTApCO2wFCO2
SST1
Salinity−0.60 **1
pH0.89 **−0.39 *1
DIC0.44 *−0.73 **0.291
TA−0.83 **0.68 **−0.70 **−0.36 *1
pCO2w−0.95 **0.47 **−0.97 **−0.340.75 **1
FCO2−0.91 **0.42 *−0.95 **−0.320.67 **0.99 **1
** Significant at the 0.01 level (two-tailed). * Significant at the 0.05 level (two-tailed).
Disclaimer/Publisher’s Note: The statements, opinions and data contained in all publications are solely those of the individual author(s) and contributor(s) and not of MDPI and/or the editor(s). MDPI and/or the editor(s) disclaim responsibility for any injury to people or property resulting from any ideas, methods, instructions or products referred to in the content.

