Article

Design Optimization of a Marine Propeller Shaft for Enhanced Fatigue Life: An Integrated Computational Approach

1
Department of Mechanical Engineering, Universidad de La Frontera, Temuco 4811230, Chile
2
Department of Mechanics and Advanced Materials, Campus Monterrey, School of Engineering and Sciences, Tecnológico de Monterrey, Av. Eugenio Garza Sada 2501 Sur, Tecnológico, Monterrey 64849, Nuevo León, Mexico
3
Laboratoire des Systèmes Complexe, Ecole Supérieure en Génie Electrique et Energétique, Chemin Vicinal 9, Oran 31000, Algeria
4
Department of Materials Engineering, Faculty of Engineering, Universidad de Concepcion, Edmundo Larenas 315, Concepcion 4070138, Chile
*
Author to whom correspondence should be addressed.
J. Mar. Sci. Eng. 2024, 12(12), 2227; https://doi.org/10.3390/jmse12122227
Submission received: 12 November 2024 / Revised: 23 November 2024 / Accepted: 3 December 2024 / Published: 5 December 2024
(This article belongs to the Section Ocean Engineering)

Abstract

:
This study investigates the design and potential failure modes of a marine propeller shaft using computational and analytical methods. The aim is to assess the structural integrity of the existing design and propose modifications for improved reliability and service life. Analytical calculations based on classification society rules determined acceptable shaft diameter ranges, considering torsional shear stress limits for SAE 1030 steel. A Campbell diagram analysis identified potential resonance issues at propeller blade excitation frequencies, leading to a recommended operating speed reduction for a safety margin. Support spacing was determined using both the Ship Vibration Design Guide and an empirical method, with the former yielding more conservative results. Finite element analysis, focusing on the keyway area, revealed stress concentrations approaching the material’s ultimate strength. A mesh sensitivity analysis ensured accurate stress predictions. A round-ended rectangular key geometry modification showed a significant stress reduction. Fatigue life analysis using the Goodman equation, incorporating various factors, predicted infinite life under different loading conditions, but varying safety factors highlighted the impact of these conditions. The FEA revealed that the original keyway design led to stress concentrations exceeding allowable limits, correlating with potential shaft failure. The proposed round-ended rectangular key geometry significantly reduced stress, mitigating the risk of fatigue crack initiation. This research contributes to the development of more reliable marine propulsion systems by demonstrating the efficacy of integrating analytical methods, finite element simulations, and fatigue life predictions in the design process.

1. Introduction

Marine propeller shafts are critical components in the propulsion system of vessels, responsible for transmitting engine power to the propeller [1]. Marine propeller shafts are subjected to complex loading conditions [2], including bending, torsional, and axial stresses, as well as environmental factors such as corrosion and marine fouling [3]. Failures in these shafts can have catastrophic consequences, leading to significant downtime and costly repairs. Previous studies have reported various failure modes in marine propeller shafts, including torsional fatigue [2,4,5], stress corrosion cracking [6], and corrosion fatigue [7,8]. Load fluctuations affect shaft stability and can also cause bearing damage [9]. To better understand the failure mechanisms, improve the design of marine propulsion systems, and minimize the risk of failure, finite element analysis has become a widely used tool allowing for detailed stress analysis under static [10,11] and dynamic [12] loadings, including fatigue life predictions of propellers [13] and shafts [4,14,15,16,17]. This method enables engineers to predict stress and fatigue life accurately, facilitating the optimization of shaft design and reducing failure risk [18]. Other analytical techniques also provide valuable information on marine shafts such as those based on a classical stress- life approach [19] including operation patterns [20], the modal dynamic response including bifurcation analysis [21] or the loose coupling method for the simultaneous integration of modal dynamic and vibration fatigue based on crack morphology measurements [22].
In this context, this research presents a comprehensive failure analysis of a marine propeller shaft using finite element analysis and fatigue life calculations to assess shaft performance under various operating patterns. A comprehensive evaluation of shaft performance is performed by combining integrated analytical–computational techniques.
The design of marine propeller shafts for strength and fatigue follows a systematic approach. First, material selection according to the shaft properties is performed to ensure sufficient load-bearing capacity during operating patterns. An analytical approach provides preliminary design, and finite element-based computational analysis predicts the overall and local shaft behavior. Optimizations of the shaft geometry to improve performance ensuring safe conditions during operation is the last stage. In this context, numerous studies have highlighted the critical issue of keyway failures in the design and analysis of marine propeller shafts, often attributed to inadequate considerations and load transfer assumptions. Failures in propeller shaft keyways are often a result of high-stress concentrations. Vizentin et al. [23] suggest that these concentrations are particularly prominent in areas where the cross-section of the shaft changes abruptly. This can be due to factors such as improper keyway design or insufficient calculations for torsional or flexural loads [15]. Further studies have emphasized the importance of analyzing the stress distribution in keyways to prevent failures in marine propeller shafts [14]. Additionally, research on fatigue failure analysis of keyways in applications such as reduction gear input shafts has provided insights into the detrimental effects of vibration-induced fatigue failure [24,25]. Understanding the impact of torsional vibrations on keyways is crucial in designing propeller shafts that can withstand operational conditions effectively [24,26]. Shafting vibration is a complex phenomenon affected by several factors, including hydrodynamic loads [27], damaged blades [28,29,30], and bearing conditions [31]. The vibration fatigue or traditional fatigue approach yields close predictions [32], indicating that including adequate design factors could provide reliable results. Also, transient torsional loads can be estimated to prevent shaft fatigue failure [33]. By taking into account these different approaches, it is possible to avoid keyway failures in marine propeller shafts [20] and to provide the correct design directions from the analysis of the local stress distribution and varying load conditions.
This research aims to perform a comprehensive failure analysis of a marine propeller shaft by evaluating its behavior under fatigue and stress loading conditions. A combination of computational and analytical approaches is employed to address critical aspects of shaft performance, including dimensional and speed range determination, static and dynamic response, service life prediction, and torsional load analysis, alongside exploring potential design modifications.
Preliminary analysis indicates that variable operational stresses contributed to the failure of the propeller shaft, necessitating a redesign. The investigation assesses localized stresses in the keys and keyways to determine whether they exceed allowable material limits under fatigue loading, adhering to Lloyd’s Register design standards [34]. Computational tools such as ShaftDesigner (2020) and SolidWorks (2020) are employed to evaluate the shaft’s mechanical behavior, providing a foundation for improving design reliability and extending the lifespan of marine propulsion systems.

Configuration and Components of the Propulsion System

The propulsion system under investigation is shown in Figure 1. Power is transmitted from a 565 hp engine operating at 1800 rpm via a reverse-reduction gearbox with hydraulically operated clutches and a 3.519:1 gear ratio, with an estimated transmission loss of 3%. The vessel has two symmetrical propulsion systems with counter-rotating lines to maintain trajectory stability and reduce steering load.
The high carbon steel SAE 1030 propeller shaft studied is 4033.4 mm long, 114 mm in diameter, and 2°58′ in pitch. Critical components include SAE 1045 steel coupling sleeves, a stuffing box for sealing, and horns to provide abrasion resistance and durability under high loads. The flying buttress, located at the base of the stern tube, supports the weight of the propeller and acts as a vertical displacement restrainer. The 0.9876 pitch, 1200 mm diameter fixed pitch propellers are made of a nickel–aluminum–bronze alloy.
This study focuses on investigating material detachment, specifically delamination, in the keyseats of the propulsion shafts (Figure 2). The keyseats are critical areas where stress concentration is significant, potentially leading to shaft failure. Delamination, observed as a separation between material layers in the keyseat, can compromise the structural integrity of the shaft and lead to operational failure.

2. Materials and Methods

2.1. Methods for Calculating the Propeller Shaft Line

To evaluate the mechanical performance of a marine propulsive shaft, a structured approach was implemented, consisting of five stages:
  • Direct theoretical calculations to define the dimensions and operational speed ranges of the shaft.
  • Simulation of the propeller line using ShaftDesigner software to analyze its dynamic behavior under operational conditions.
  • Post-simulation evaluation in ShaftDesigner to estimate the service life of the propeller shaft.
  • Analysis of torsional behavior using SolidWorks 2020 to evaluate the shaft’s performance under pure torsional loads.
  • Simulations of proposed modifications or redesigns to assess improvements in load-bearing capacity.
In stage 1, the design of the propulsion line was evaluated based on Lloyd’s Register standards [34], determining the shaft diameter and operational speeds. The propeller shaft is subjected to a combination of stresses during operation, including torque transmitted by the motor, axial loads from propeller thrust, and bending loads caused by self-weight and potential misalignment during installation [25]. These conditions generate two primary stress types: axial stresses from bending moments and shear stresses from torsional moments. The propulsive thrust amplifies axial stresses due to bending, resulting in a combined stress effect that must be accounted for in the design. To ensure reliability, the maximum equivalent stress experienced by the shaft under various operating conditions was required to remain below the static strength and fatigue limits of the shaft material.
According to the Rules and Regulations for the Classification of Naval Ships, Volume 2, Part 3, Chapter 2, Section 4, Clause 4.2: Intermediate Shaft [34], the design of the shaft under operational loads must incorporate a minimum safety factor of 1.5 and adhere to a fatigue failure criterion. Based on these guidelines, Equation (1) is utilized to calculate the outer diameter of the marine propeller shafts.
d = F l k P l n 560 σ u + 160 3

2.2. Vibration Analysis on the Marine Propeller Shaft

One method used to verify whether the shaft design will be able to withstand the variable loads during operation is vibration analysis. Different types of vibration modes can be generated in a propulsion system, which can be classified as axial or longitudinal, torsional, or lateral. The longitudinal vibration is caused by the propeller blades of the propulsion propeller [35]. If these axial vibrations exceed the limits that the propulsion system can withstand, damage to the thrust bearings and/or gearboxes could occur. Torsional vibrations are those that can be excited by a pair of alternating stresses produced by the propeller and/or engine harmonics in a diesel propulsion system. In general, the resonances produced by this vibration do not usually generate serious problems, but they should be verified in the shaft and gearbox components. Lateral vibration tends to be excited by the imbalance of the propeller masses and when resonance is generated. Additionally, the natural frequency of the system is significantly limited by the distance between the supports and the stiffness of the supports.
The resonance phenomenon can occur when the excitation frequency is close to the natural frequency of the structure. Under natural frequency, a structure continues to vibrate in one of its modes after being excited. When a body generates an excitation frequency close to or similar to its natural frequency, amplified vibrations are generated that could be harmful either to the structure that is vibrating or to any other adjacent element that is influenced by these vibrations. To comply with a safe design, these frequencies should not be in the same range.
Therefore, a safety range of 20% must be taken into account to prevent the generated excitation frequency of the shaft from approaching its natural frequency. Considering that in marine shafts, the propeller mass is the component that tends to generate the excitation frequency, the way to calculate this frequency must be based on the propeller configuration (number of blades), the working speed, and the safety margin previously mentioned, resulting in Equation (2).
f e x i t a t i o n = n 60 n b l a d e s 1.2  
To obtain the natural frequency of the propulsive shaft, Equation (3) is applied [36].
f N a t u r a l = A n 2 π E I G L A 4             o r           f N a t u r a l = A n 8 π L A 2 E D 2   ρ
Lateral vibrations are characterized by oscillations in the plane passing through the neutral axis of the shaft. This vibration can be considered a combination of amplitudes in the rotational planes and is related to the rotational speed. To calculate the critical velocity of the shaft, the empirical formulation indicated in Equation (4) is applied [37].
v C = 300 78.3 E J G L A 4                     o r                   v C = 300 78.3 E D 2 8 ρ L A 4

2.3. Fatigue Life Cycles

Fatigue is an important failure mechanism, where damage accumulation occurs during each cycle of dynamic loading below the immediate failure threshold. Fatigue crack formation occurs in two stages: an initial shear crack and then growth perpendicular to the applied stress. A five-stage fatigue failure process, which includes nucleation, microstructural and physical propagation, long propagation and final crack fracture. Fatigue failure depends on several factors, such as stress distribution, residual stresses, loading history, proper design, environmental effects, and manufacturing quality. In addition to fatigue, corrosion is also an aging effect that should be considered in marine structures. However, this paper focuses primarily on the mechanical causes of failure that affect structures with reduced strength; even if the reduction could be due to corrosion, this effect is included for fatigue analysis with a life or strength reduction factor.

2.3.1. Fatigue Strength Limit

For preliminary prototype design and failure analysis of components resistant to alternating loads, strength limits are estimated using Equation (5).
S e = S e k a k b k c k d k e k f
where S e is the fatigue strength limit of a rotating beam under ideal conditions (Equation (6)).
S e =   0.5   S u t                                   S u t 1400   MPa 700   MPa                               S u t > 1400   MPa
The different factors (k) are described below. k a depends on the type of manufacturing of the part by means of Equation (7). The factor a and exponent b are obtained as a function of the manufacturing process (Table 1).
K a = a S u t b
The size factor k b is fully dependent on the shaft diameter and is applicable for bending and torsion (Equation (8)).
k b = 1.24 · d 0.107                                                   2.79 < d < 51 1.51 · d 0.157                                                   51 < d < 254
The load factor k c modifies the resistance when the analyzed parts are subjected to axial and torsional loads (Equation (9)).
k c =     1                         B e n d i n g     0.58                       A x i a l           0.59                       T o r s i o n  
Other factors that affect fatigue strength include temperature, reliability, and other effects such as fretting corrosion. The fretting corrosion phenomenon is the result of microscopic movements of press-fit parts or structures. These include bolted joints, bearing race fits, wheel masses, and any assembly of press-fit parts. The process involves surface discoloration, pitting, and, ultimately, fatigue. The fretting factor k f depends on the materials being bonded and varies from 0.24 to 0.90 [38].

2.3.2. Variable and Fluctuating Stresses

In fatigue analysis, there are two different approaches. The first is fatigue due to alternating stresses, characterized by a stress interval ranging from a maximum to a minimum, with mean stress equal to zero. The second approach is fluctuating stress fatigue for non-zero mean stress, where the maximum or minimum stress could have a value equal to zero (Figure 3). Equation (10) is applied to calculate the alternating and mean stresses. The amplitude and stress ratios are defined in Equation (11).
σ m = σ m á x + σ m i n 2                 ;                   σ A = σ m á x σ m i n 2
A R = σ a σ m                       ;                     R R = σ m i n σ m á x

2.3.3. Fatigue Failure Under Fluctuating Combined Stresses

Given the characteristic load cycle of marine propeller shafts, the Goodman method is applied. This criterion uses the mean ( σ m ) and alternating stresses ( σ a ) at a critical point to guarantee the infinite life. Two conditions must be met: Goodman expression (Equation (12)) must be satisfied, and the total stress at the point analyzed must remain below the yield strength of the material.
  σ a S e + σ m S u t < 1
While traditional fatigue analysis methods typically consider only one type of loading at a time, approaches such as the combined loading mode method allow fatigue to be evaluated in more real scenarios. This is important for components such as propeller shafts, which experience a combination of axial, torsional, and bending loads. Equations (13) and (14) considered the specific load combination method applied in this study.
σ a = K f f l e x i ó n σ A f l e x i ó n + K f a x i a l σ A a x i a l 0.85 2 + 3 K f s t o r s i ó n τ a t o r s i ó n 2 1 2
σ m = K f f l e x i ó n σ m f l e x i ó n + K f a x i a l σ m a x i a l 2 + 3 K f s t o r s i ó n τ m t o r s i ó n 2 1 2
Once the mean and alternating stresses are obtained, the chosen Goodman failure criterion is applied, with the design safety factor of the shaft given by Equation (15).
  F S = 1 σ a S e + σ m S u t

2.4. Component Analysis: Resistance and Failure in Operational Conditions

2.4.1. Keys and Keyseats

Keyways are susceptible to two primary failure modes: shear failure and bearing failure. Shear failure occurs when the key is sheared across its width at the interface between the shaft and hub. The average shear stress is calculated using Equation (16).
τ x y = F C A c o r t a n t e
From Rules and Regulations for the classification of naval ships, Volume 2, Part 3, Chapter 2, Section 4, 4.12.4 [34], the minimum shear area for connections between the propeller shaft and key is determined using Equation (17).
A c o r t ,   m i n = 155 d 3 σ u k d 1
Bearing failure, also known as contact pressure failure, arises from excessive compressive stresses on the keyway flanks within the shaft or hub. The average bearing stress is calculated using Equation (18).
σ x = F C A C o n t a c t o
Since compressive stresses generally do not cause fatigue failure, bearing stresses are considered static. The factor of safety is determined by comparing the maximum bearing stress with the compressive yield strength of the material. Similarly, the minimum required area for bearing pressure is calculated using Equation (19), also based on the Rules and Regulations for the classification of naval ships, Volume 2, Part 3, Chapter 2, Section 4, 4.12 [34].
A c o n t ,   m i n = 24 d 3 σ y d 1

2.4.2. Shaft Fatigue Life

The fatigue life of the propeller shaft was evaluated using stress data obtained from dynamic simulations performed in Shaftdesigner. The maximum bending and torsional stresses extracted from the simulations corresponded to the critical region between the propeller and the shaft support. Torsional moment values reflected the maximum permissible shaft speeds. Three distinct stress cycles were considered: (a) constant torsion with alternating bending, (b) fluctuating torsion with fluctuating bending, and (c) alternating torsion with alternating bending. The modified Goodman criterion for combined loading was then applied to determine the fatigue life and factor of safety for each scenario.

2.4.3. Computational Simulations of Shaft Strength Using Finite Elements

The finite element analysis was carried out using SolidWorks software. First, a CAD model of the propeller line was generated. This model was then evaluated under pure torsional loading using the finite element method. The main objective of this simulation was to determine the local stress values to verify the dimensions of the propeller shaft and the geometry of the key seats. The assembly of the components was achieved by means of positional relationships, mainly concentricity and coincidence. The assembled propulsion line was assigned physical and mechanical properties to the materials of each component. Static analyses were performed, with boundary conditions of fixed support to the propeller blades and a torque applied to the flanges in the opposite direction of propeller rotation. The connection between components was considered a fixed connection.
The simulations consider static loads and a linear elastic isotropic material model. The non-coupled von Mises maximum stress is the selected failure criterion. The modeled assembled components are the couplings, propeller, propeller shaft, and the keys in the propeller and coupling sides with an assumed dry friction coefficient of steel–steel of 0.5 [39]. This value clearly changes with surface quality and pressure, and it can vary over time, as shown in former studies [40,41,42]. A sensitivity analysis could provide interesting insights into the effect of friction coefficient on the stress response of the shaft; however, due to the complexity of this particular topic, this stage of research is not analyzed but requires future attention. The boundary conditions consider propeller constraints to rotational movements and the external torque loads of 6416.9 Nm applied on the flange. The established mesh is based on combined curvature with high-order quadratic elements.
Mesh convergence analysis was performed, which included varying the element refinement size in corners and fillets with minimum element sizes of 6, 3, 2, 1.5, 1, 0.5, 0.25, and 0.1 mm (Figure 4). Acceptable meshing sensitivity was achieved when the maximum stresses in the propeller shaft had a difference of less than 5% between successive mesh refinements. The definitive meshing configuration was then defined for the remaining simulations. The mesh sensitivity study provided a minimum element size of 1.0 mm, maintaining a balance between the quality and variation of the stress results in the shaft, as well as the computational time required for the simulations. This mesh size was applied to all components, and an additional mesh control was added to the upper edges of the keyway channels to generate a larger number of elements in that area.

3. Results and Discussion

3.1. Direct Calculations of Shaft Diameter

The Rules and Regulations for the classification of naval ships, Volume 2, Part 3, Chapter 2, Section 4, 4.2 Intermediate shaft [34] proposes that for the design of loads, the minimum factor of safety is 1.5 based on the fatigue failure criterion. In addition, to determine the outer diameter of the propeller shafts, Equation (1) is used. This equation allows obtaining a range of diameters as a reference to compare these values with the direct strength calculation method, considering the torsional moment as the preponderant load τ m a x = F s 16 M T π D 3 . For this direct calculation, a power of 428.8 kW at a working speed of 511 rpm is considered. This gives a torsional moment of 7765 kNm. The stress limit that the SAE 1030 material can withstand in the shear conditions for a safe operation according to the design rule is limited to a value of 52.8 MPa, obtained from the product of elastic limit and ultimate elongation of the material [34]. This value is much lower than the actual limit stress and includes a design safety factor of 1.5. The results obtained are shown in Table 2.
The diameter of the propeller shaft by direct calculation without stress concentrations is within the safe design range. Special attention and detailed analysis of stress concentrations in engineering design are always recommended [43]. Therefore, considering a constant of k = 1.2, a value close to the original design is obtained. The direct calculation with k = 1.1, according to the design guide, corresponds to a cylindrical shaft with keyseats. Therefore, a design diameter greater than 106 mm is acceptable. This is of interest if recovering damaged shaft surface for extending operating life by reducing the diameter is required.

3.2. Support Spacing Determination from Natural Frequency Calculations

Two methods were employed to determine the natural frequency of the marine propeller shaft and subsequently inform the appropriate spacing between bearing supports: the method outlined in the Ship Vibration Design Guide [34] and a critical speed calculation method [37]. Table 3 summarizes the relevant parameters used in these calculations.

3.2.1. Support Spacing from Natural Frequency Using the Ship Vibration Design Guide

The natural frequency of a shaft supported at both ends is calculated using Equation (3) from the Ship Vibration Design Guide. The propeller blade excitation frequency, calculated using Equation (2), is 30.69 Hz. A safety margin of 20% was applied to this excitation frequency to mitigate resonance risks, consistent with previous research demonstrating prediction errors within 10% [44,45]. By equating the adjusted excitation frequency with the natural frequency from Equation (3), the maximum permissible spacing between supports to avoid resonance is determined (Equation (20)):
F n = A n 8 π L A 2 E D 2   ρ     L A = A n 8 π f E x i t a c i ó n 2 E D 2 p 4 L A = 9.87 8 π 30.69   [ H z ] 2 1.9 10 11 N m 2 106   m m 1 1000 m m m 2 7850   k g m 3 4   = 2.583   m L A = 9.87 8 π 30.69   [ H z ] 2 1.9 10 11 N m 2 114   m m 1 1000 m m m 2 7850   k g m 3 4   = 2.679   m
This yields maximum support spacings of 2.583 m and 2.679 m for shaft diameters of 106 mm and 114 mm, respectively.

3.2.2. Support Spacing Using Empirical Calculation Method

Lateral shaft vibrations can be represented as oscillations in the plane of the shaft’s neutral axis. The critical speed, calculated using an empirical formula (Equation (4)) [37], must exceed the excitation frequency (Equation (21)).
v c 60 > f E x c i t a t i o n
Applying the 20% safety margin, the excitation frequency of 30.69 Hz corresponds to 1841 rpm. Equating this value with the empirical critical speed formula (Equation (4)) yields the maximum permissible support spacing (Equation (22)).
v C = 300 78.3 E D 2 8 ρ L A 4         L A = 300 1841.4 2   78.3 E D 2 8 ρ 4 L A = 300 1841.4 2   78.3 1.9 10 11 N m 2 106   m m 1 1000 m m m 2 8 7850   k g m 3 4   =     2.899   m L A = 300 1841.4 2   78.3 1.9 10 11 N m 2 114   m m 1 1000 m m m 2 8 7850   k g m 3 4   =     3.007   m
The resulting maximum support spacings are 2.899 m and 3.007 m for shaft diameters of 106 mm and 114 mm, respectively.
While the current support spacing complies with both methods (the Ship Design Guide for natural frequency and the empirical critical speed), the empirical critical speed method allows for greater spacing being less conservative. This is because the Ship design guide of the natural frequency method employs more conservative assumptions about factors like stiffness or damping, leading to a lower predicted critical speed and, thus, a smaller allowable spacing to avoid resonance.

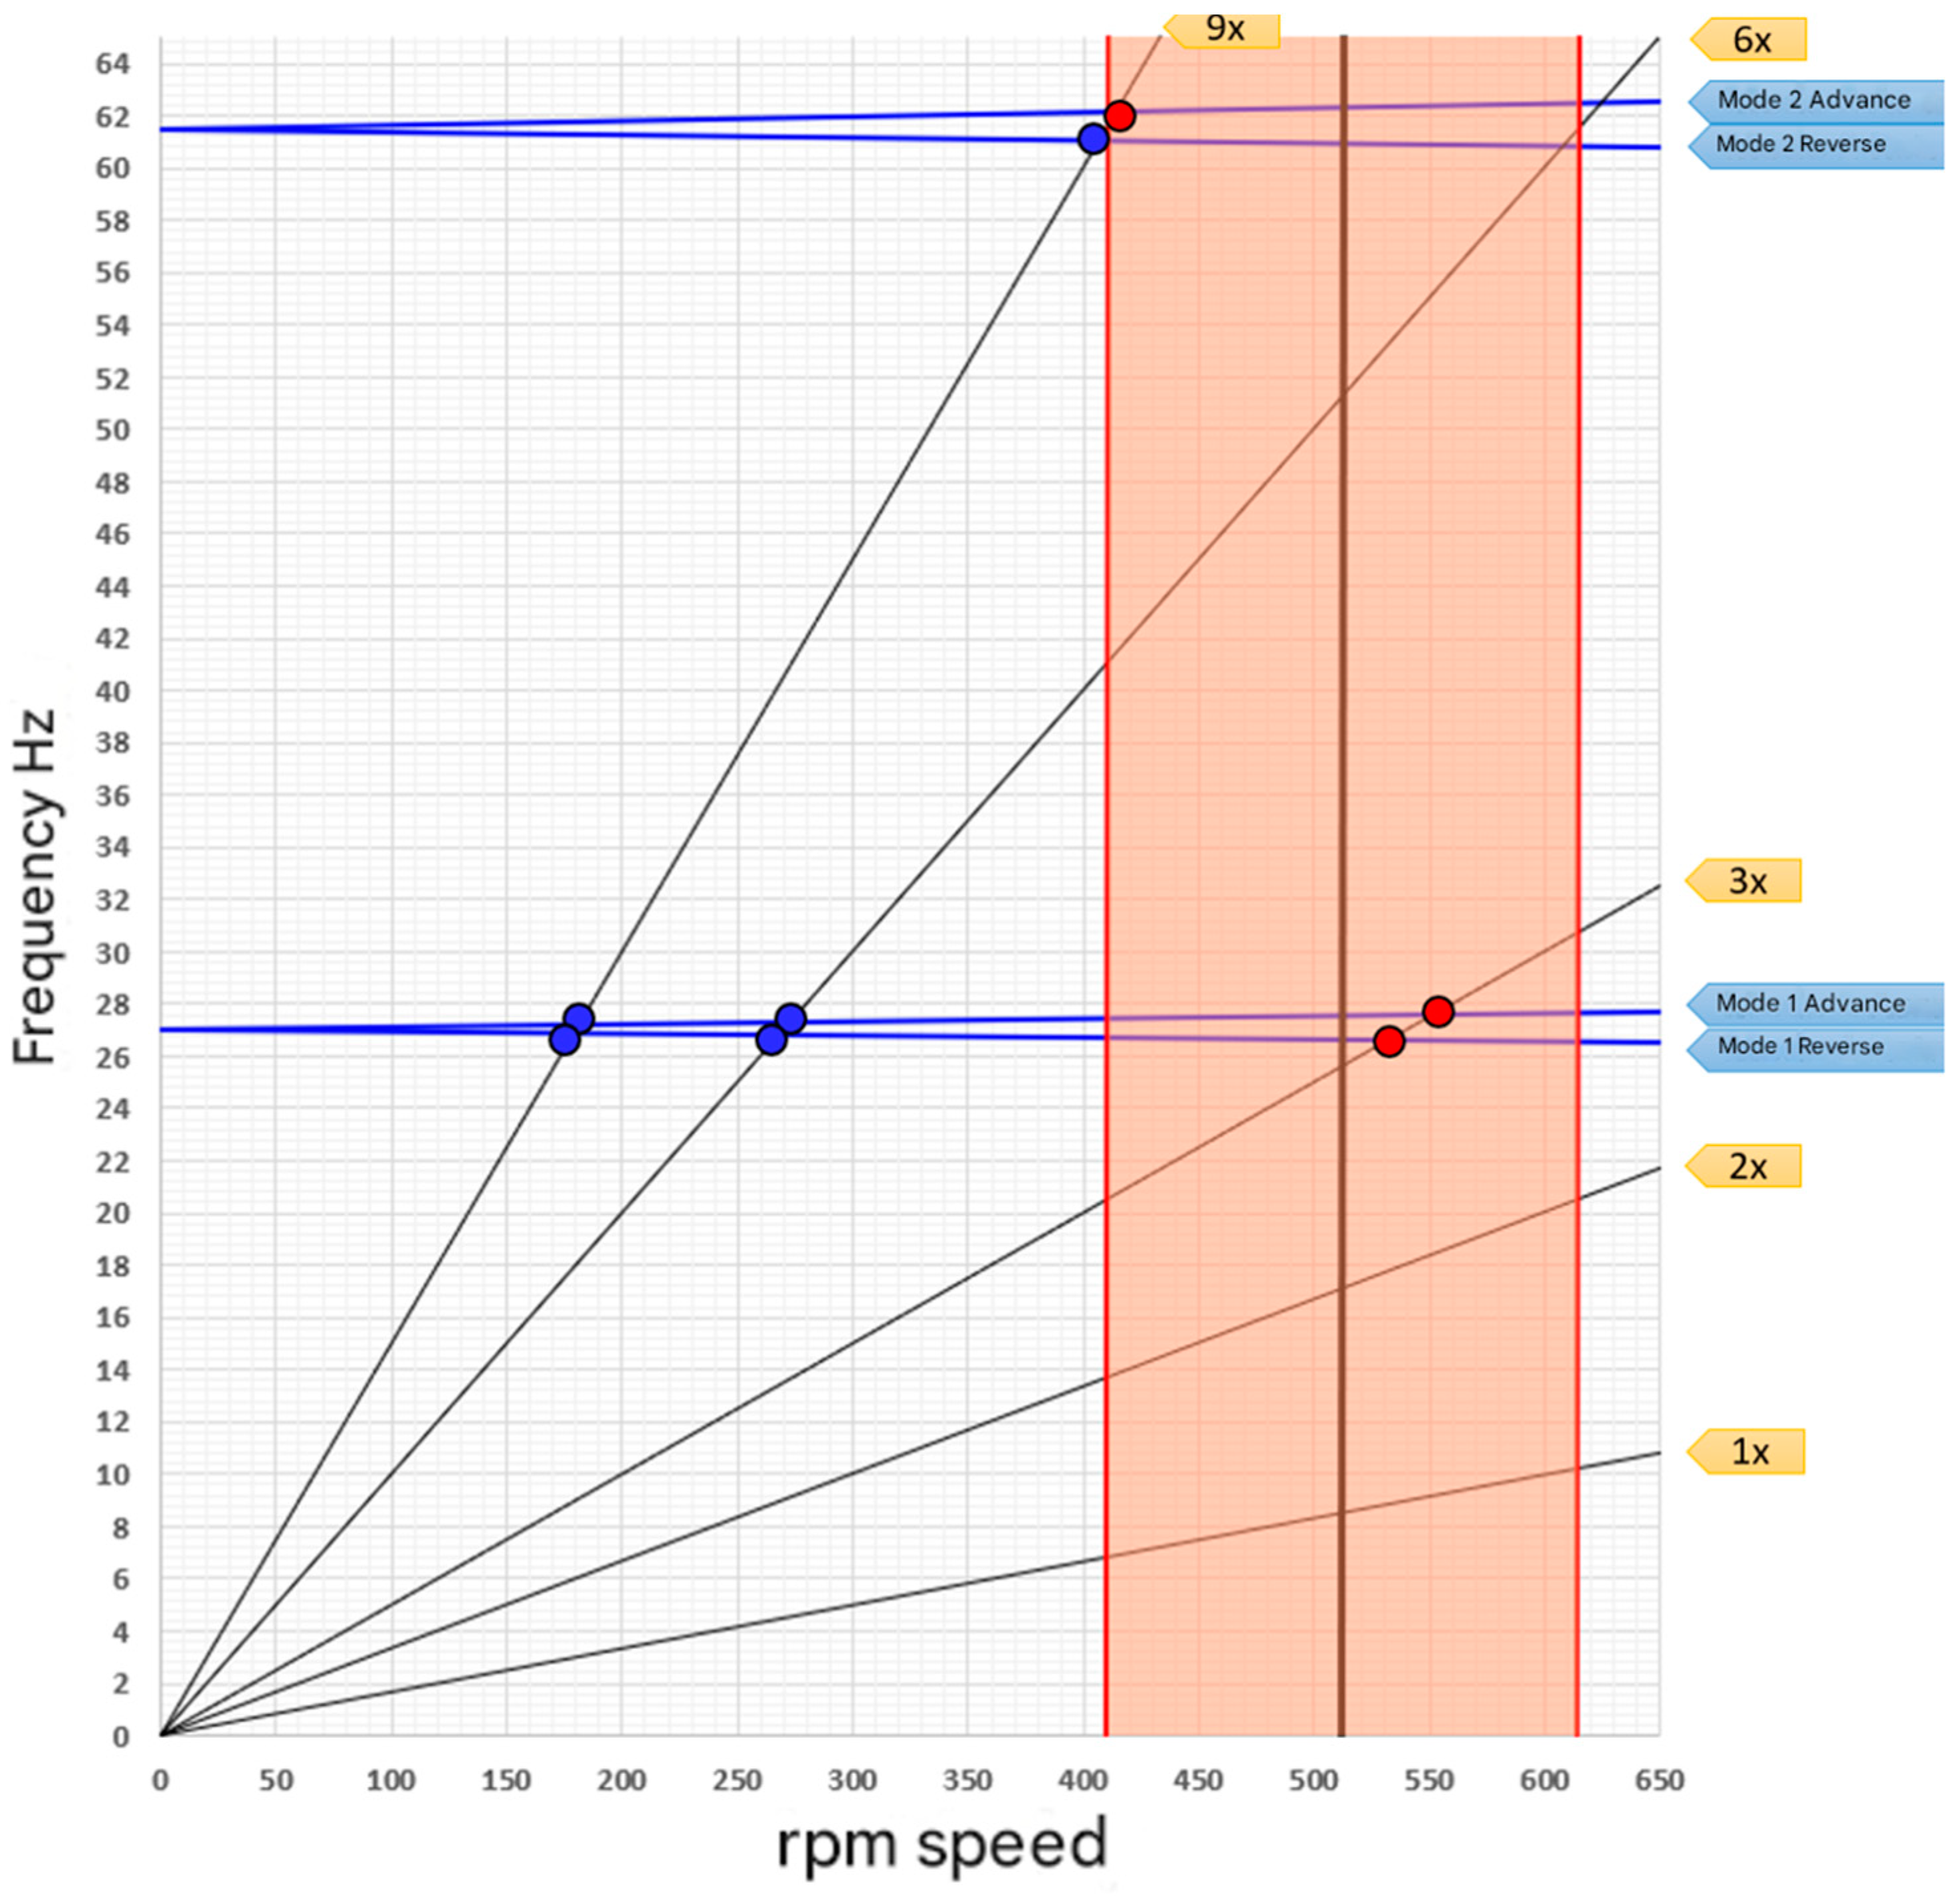
3.3. Whirling Vibrations Analysis

A Campbell diagram analysis was conducted to assess potential resonance conditions in the propeller shaft system (Figure 5). The diagram plots the excitation frequencies generated by the propeller blades against the natural frequencies of the shaft for various vibration modes. The three-bladed propeller introduces a primary excitation frequency at 3× the shaft rotational speed (3× spectrum). Additional excitation frequencies corresponding to higher-order harmonics (6× and 9×) were also considered. Two critical speeds associated with the 3× excitation frequency and the first vibration mode were obtained: 530.7 rpm (26.5 Hz) for reverse and 555.6 RPM (27.8 Hz) for forward rotation. As shown in Figure 5, the 3× spectrum intersects the first natural frequency of the shaft during both forward and reverse operation, confirming the potential for resonance. While the maximum operating speed of 511.5 rpm is below the identified critical speeds, a reduced operating speed of 442.3 rpm is recommended to maintain a 20% safety margin. This recommended speed is within 1% of the 447.1 rpm calculated using a direct analytical method, validating the Campbell diagram approach. Reducing the shaft diameter is not advisable, as it would further lower the maximum permissible operating speed.

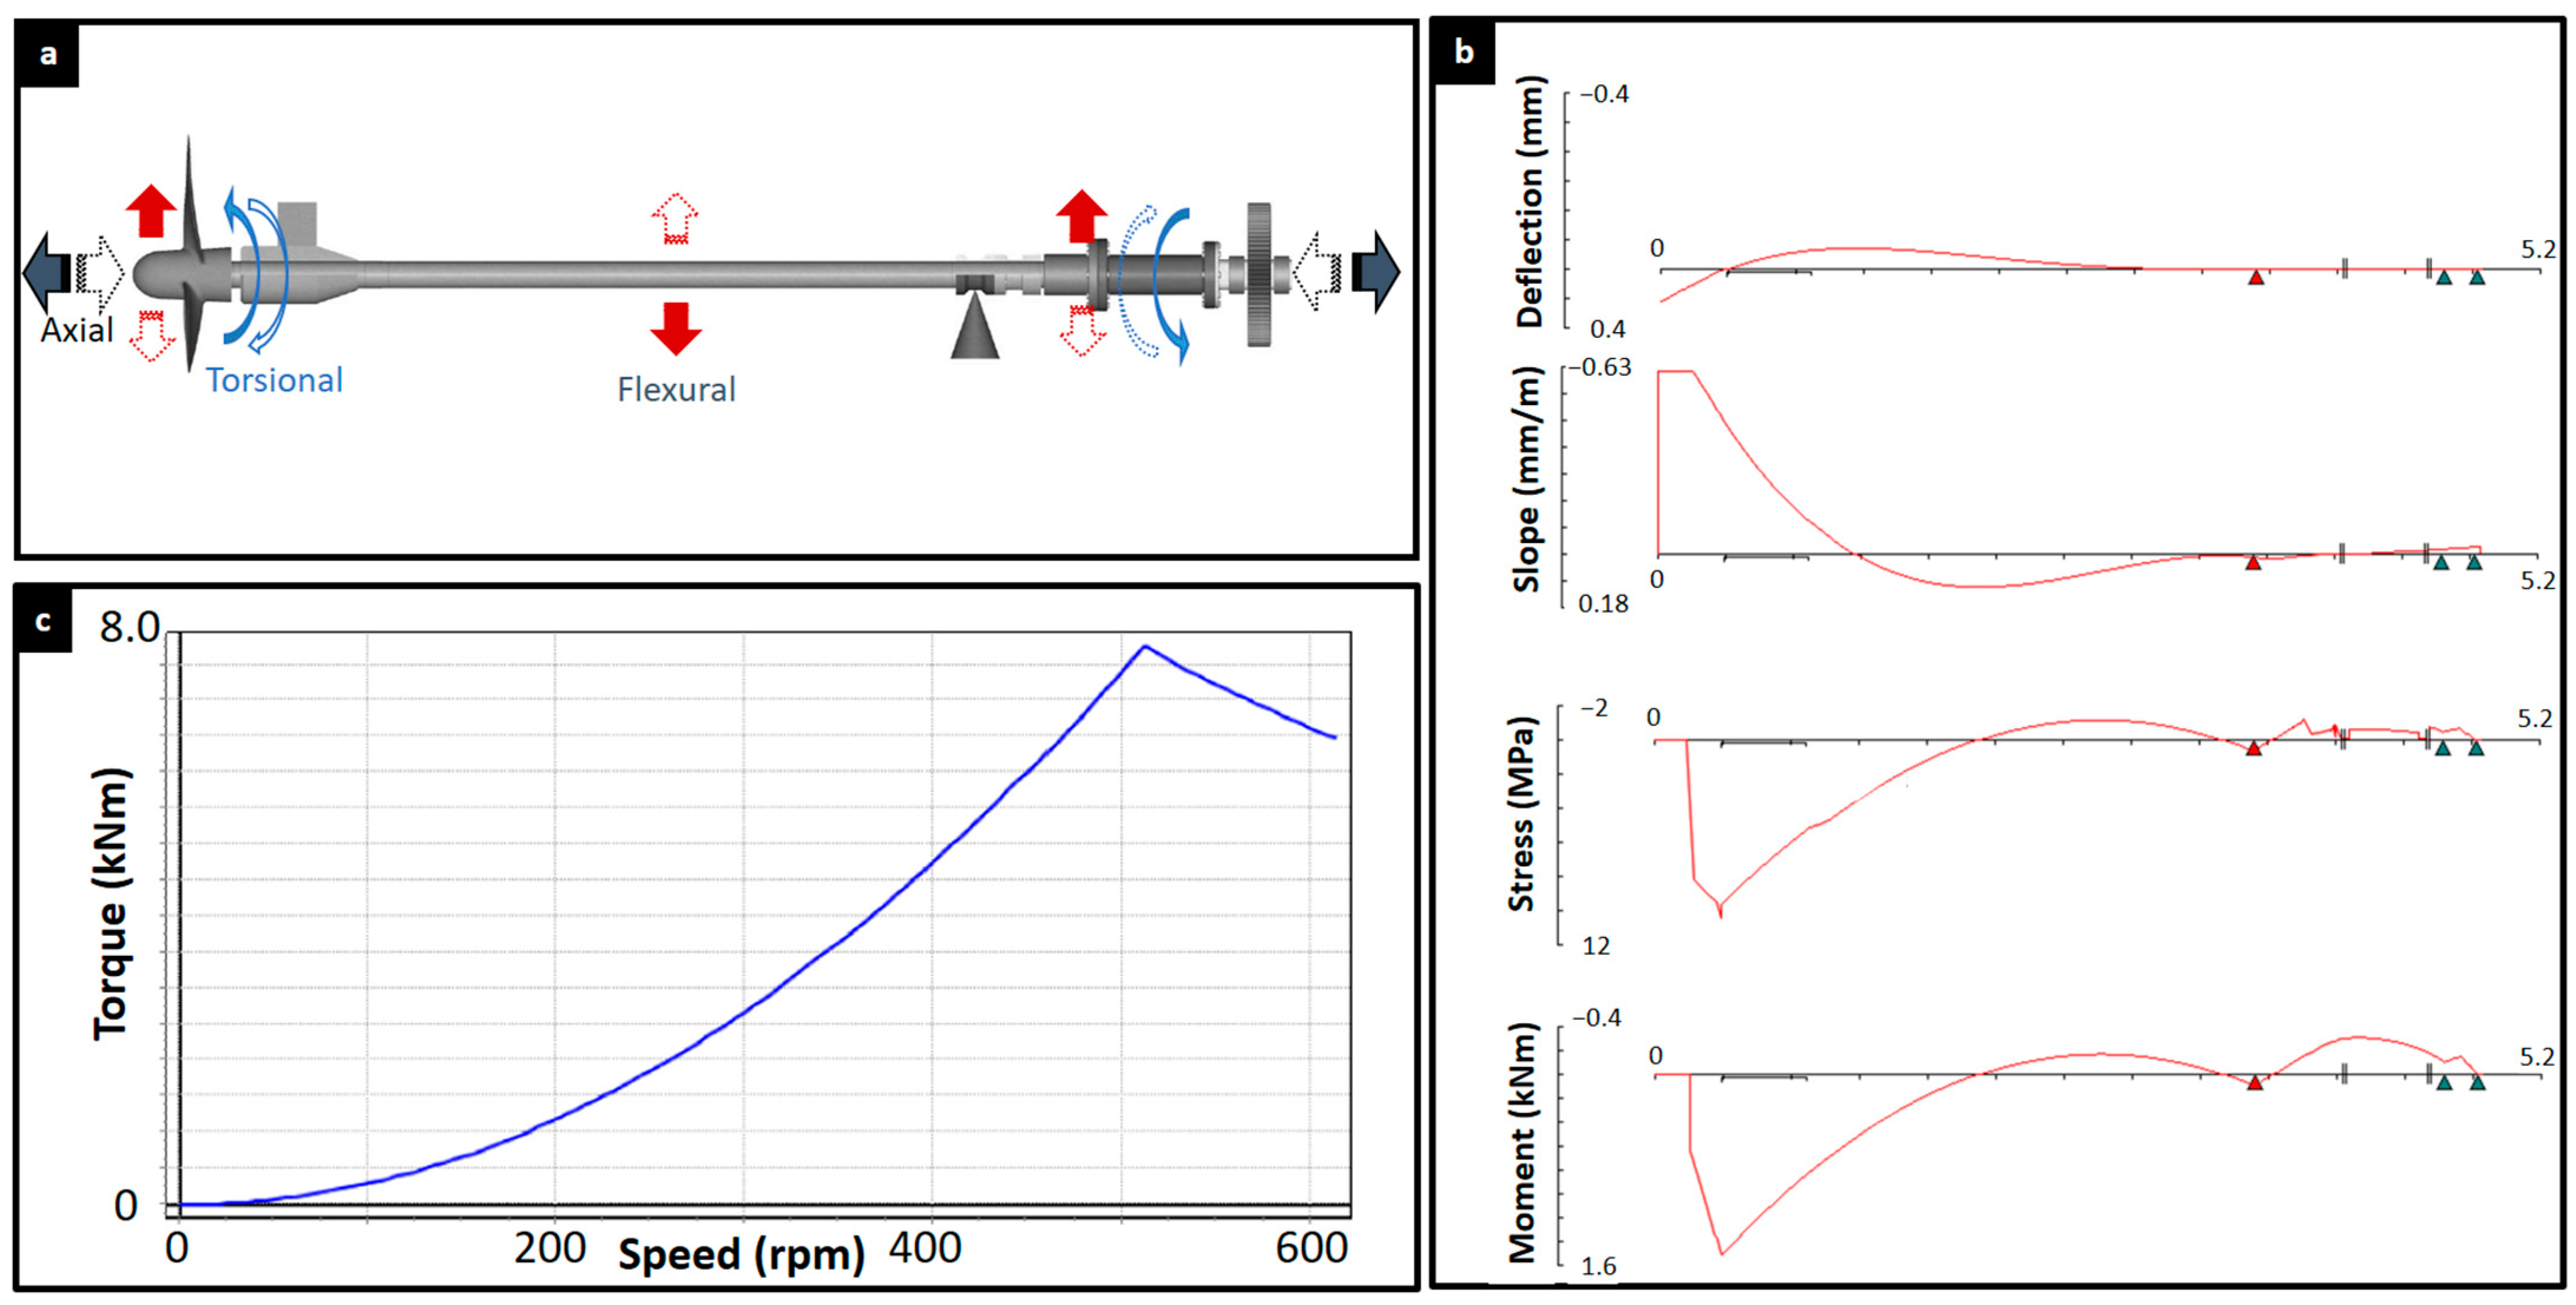
3.4. Dynamic Torsional and Bending Load Analysis

The computational model (Figure 6a) developed using the shaftdesigner software enabled the determination of the dynamic bending (Figure 6b) and torsional (Figure 6c) behavior for the marine propeller shaft. The torsional moment profile exhibits a strong dependence on operating speed, reaching a maximum of 7.7647 kNm at 511.5 rpm. This simulated value closely matches the 7.7653 kNm obtained through direct calculation. The simulation results (Figure 6b) illustrate the shaft’s deflection, bending moments, and stresses under dynamic loading. The maximum bending moment and stress occur near the shaft support (flying buttress), identifying this region as the most critical for potential failure. These maximum values, along with the maximum torsional load (Figure 6c), serve as inputs for the fatigue life predictions.

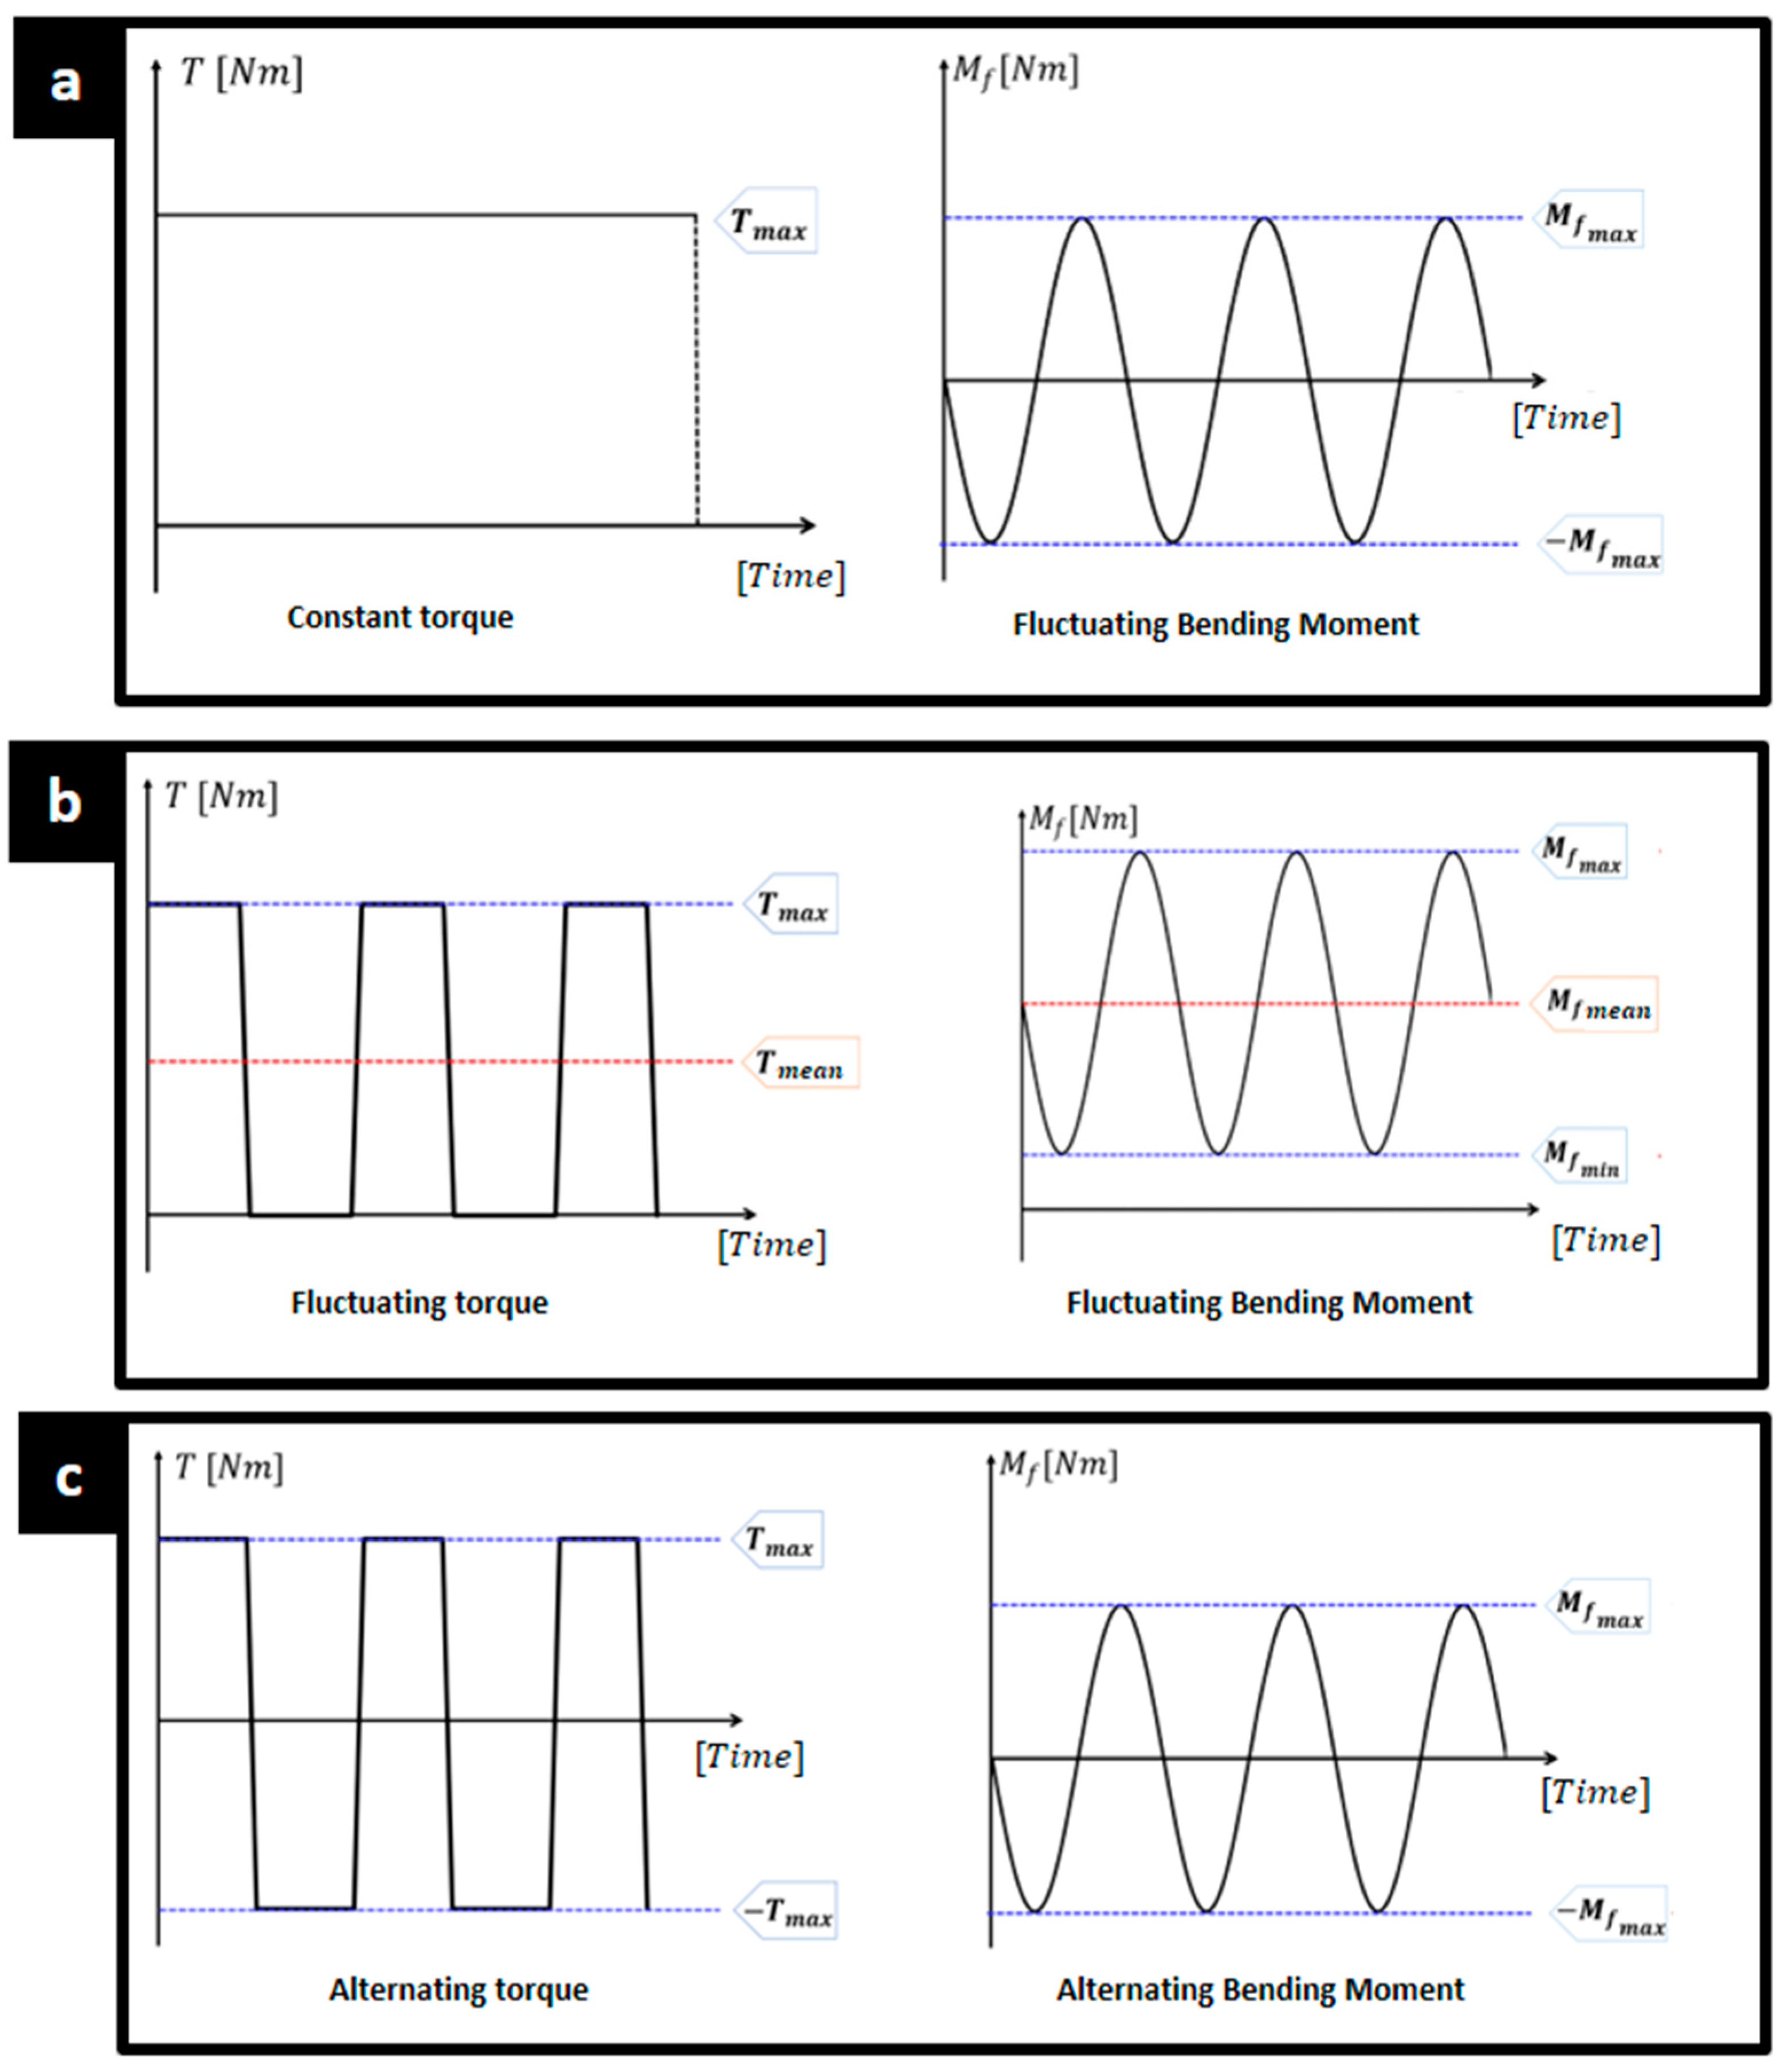
3.5. Fatigue Life Analysis

This section presents the fatigue life calculations for the propeller shaft under various operating conditions, considering bending moments and torques obtained from simulations. Calculations incorporate a safety factor to account for additional loads like rudder effects [26,46].
For a shaft of 114 mm diameter constructed from SAE 1030 steel (ultimate tensile strength: 525 MPa), a fatigue strength limit of 90.2 MPa for infinite life was calculated using the Goodman equation. This calculation incorporated a fatigue strength limit of 262.5 MPa, a surface finish factor of 0.8577, a size factor of 0.7178, a load factor of 1, a reliability factor of 0.62, and a miscellaneous effects factor of 0.9.
Three operational cases were analyzed:
  • Case 1: Continuous Operation at Constant Speed (Figure 7a).
  • Constant torsional moment, alternating bending moment. Results indicate a safety factor of 3.06 and a life cycle of 373 × 106, suggesting infinite life.
  • Case 2: Alternating Stationary and Operating Moments (Figure 7b).
  • Fluctuating stresses. Safety factor of 2.59 and life cycle of 85.8 × 10⁶. Reduced life compared to Case 1 due to increased fatigue from continuous operation.
  • Case 3: Forward and Reverse Operation Cycles (Figure 7c).
  • Torsional moment varies from maximum positive to maximum negative, bending moment alternates between ±1523.4 Nm. Safety factor of 1.5 and life cycle of 5.43 × 10⁶, indicating higher loads and reduced safety.
Table 4 summarizes the safety factors and fatigue lives for all three cases. All designs maintain a safety factor above 1, ensuring infinite life even under demanding conditions, according to the Goodman criterion.
Note that the reliability factor of 0.62 chosen in the fatigue calculations includes the probability that a component will not fail due to fatigue under the considered loading conditions. In other words, it represents the confidence level that the component will survive the fatigue loading with a 62% chance and, conversely, a 38% chance it will fail. This factor is essential for designing components with an acceptable level of risk. Higher reliability factors indicate a lower risk of fatigue failure but often come at the cost of increased material usage or more conservative design choices.

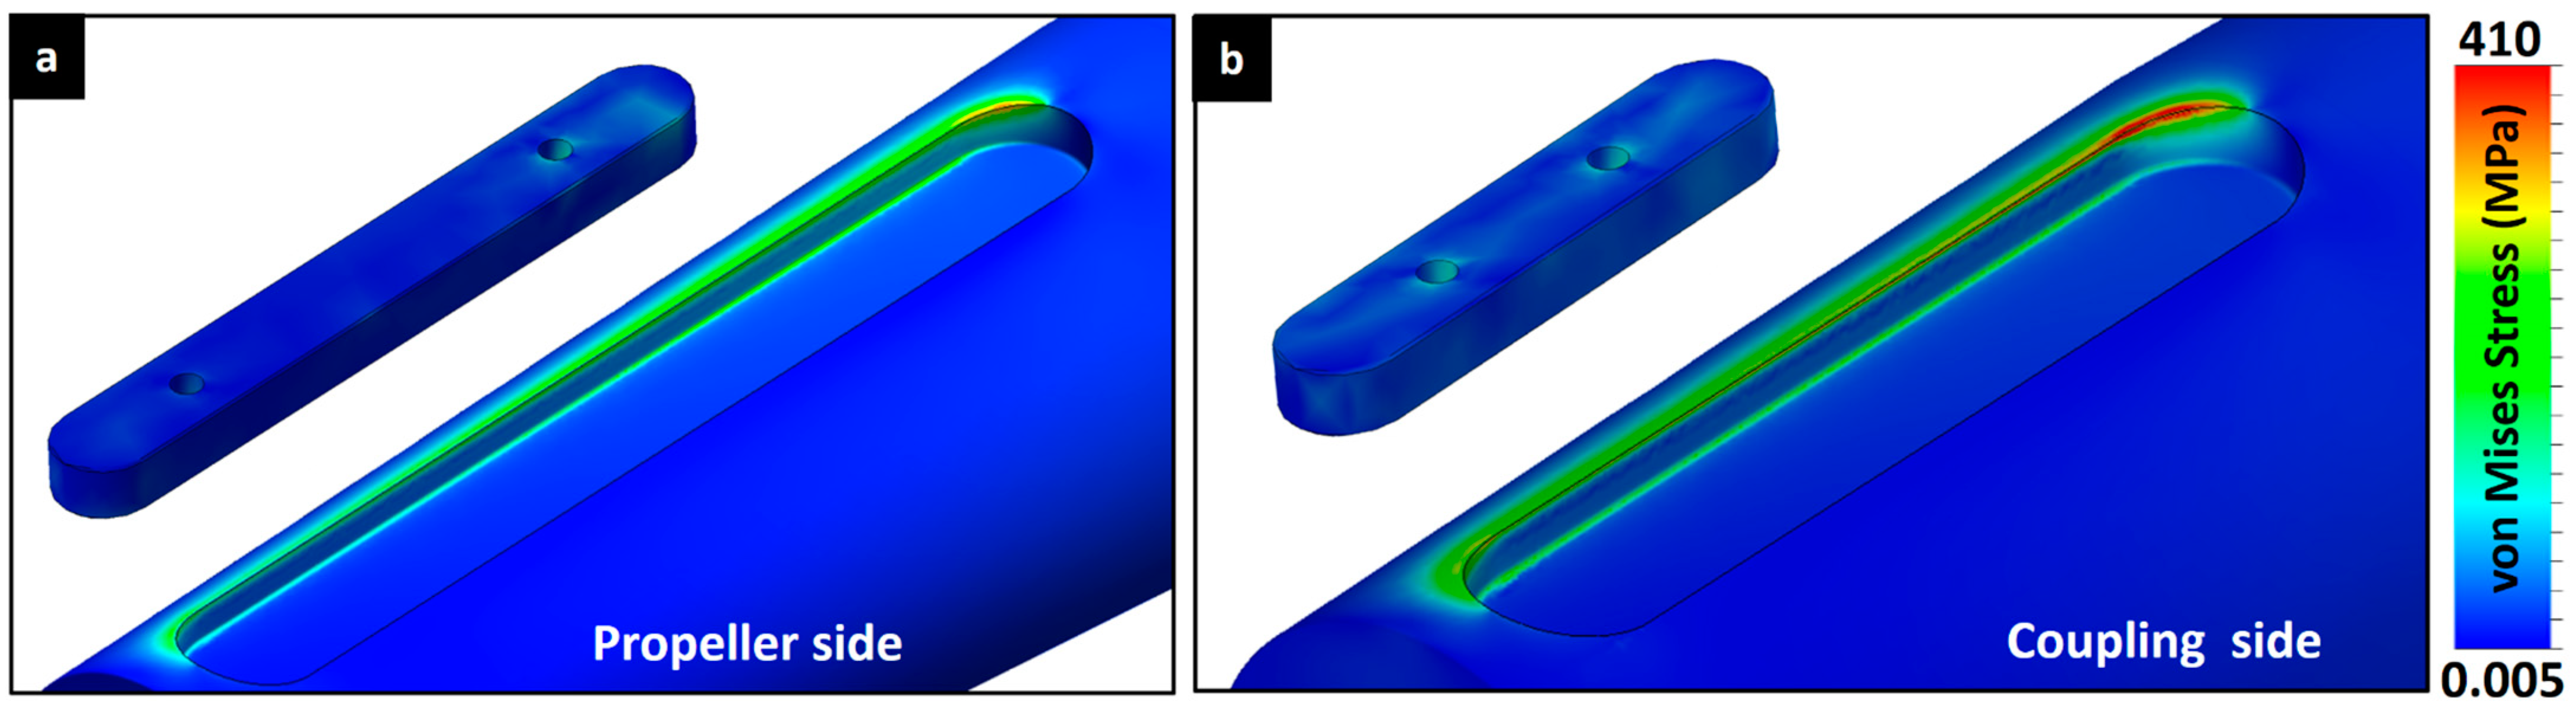
3.6. Local Stress from Finite Element Simulations

Failure analysis often reveals that critical locations in engineering components experience localized stresses, leading to crack initiation and propagation. Finite element analysis offers a powerful tool to investigate these stress concentrations and predict potential failure points [47].

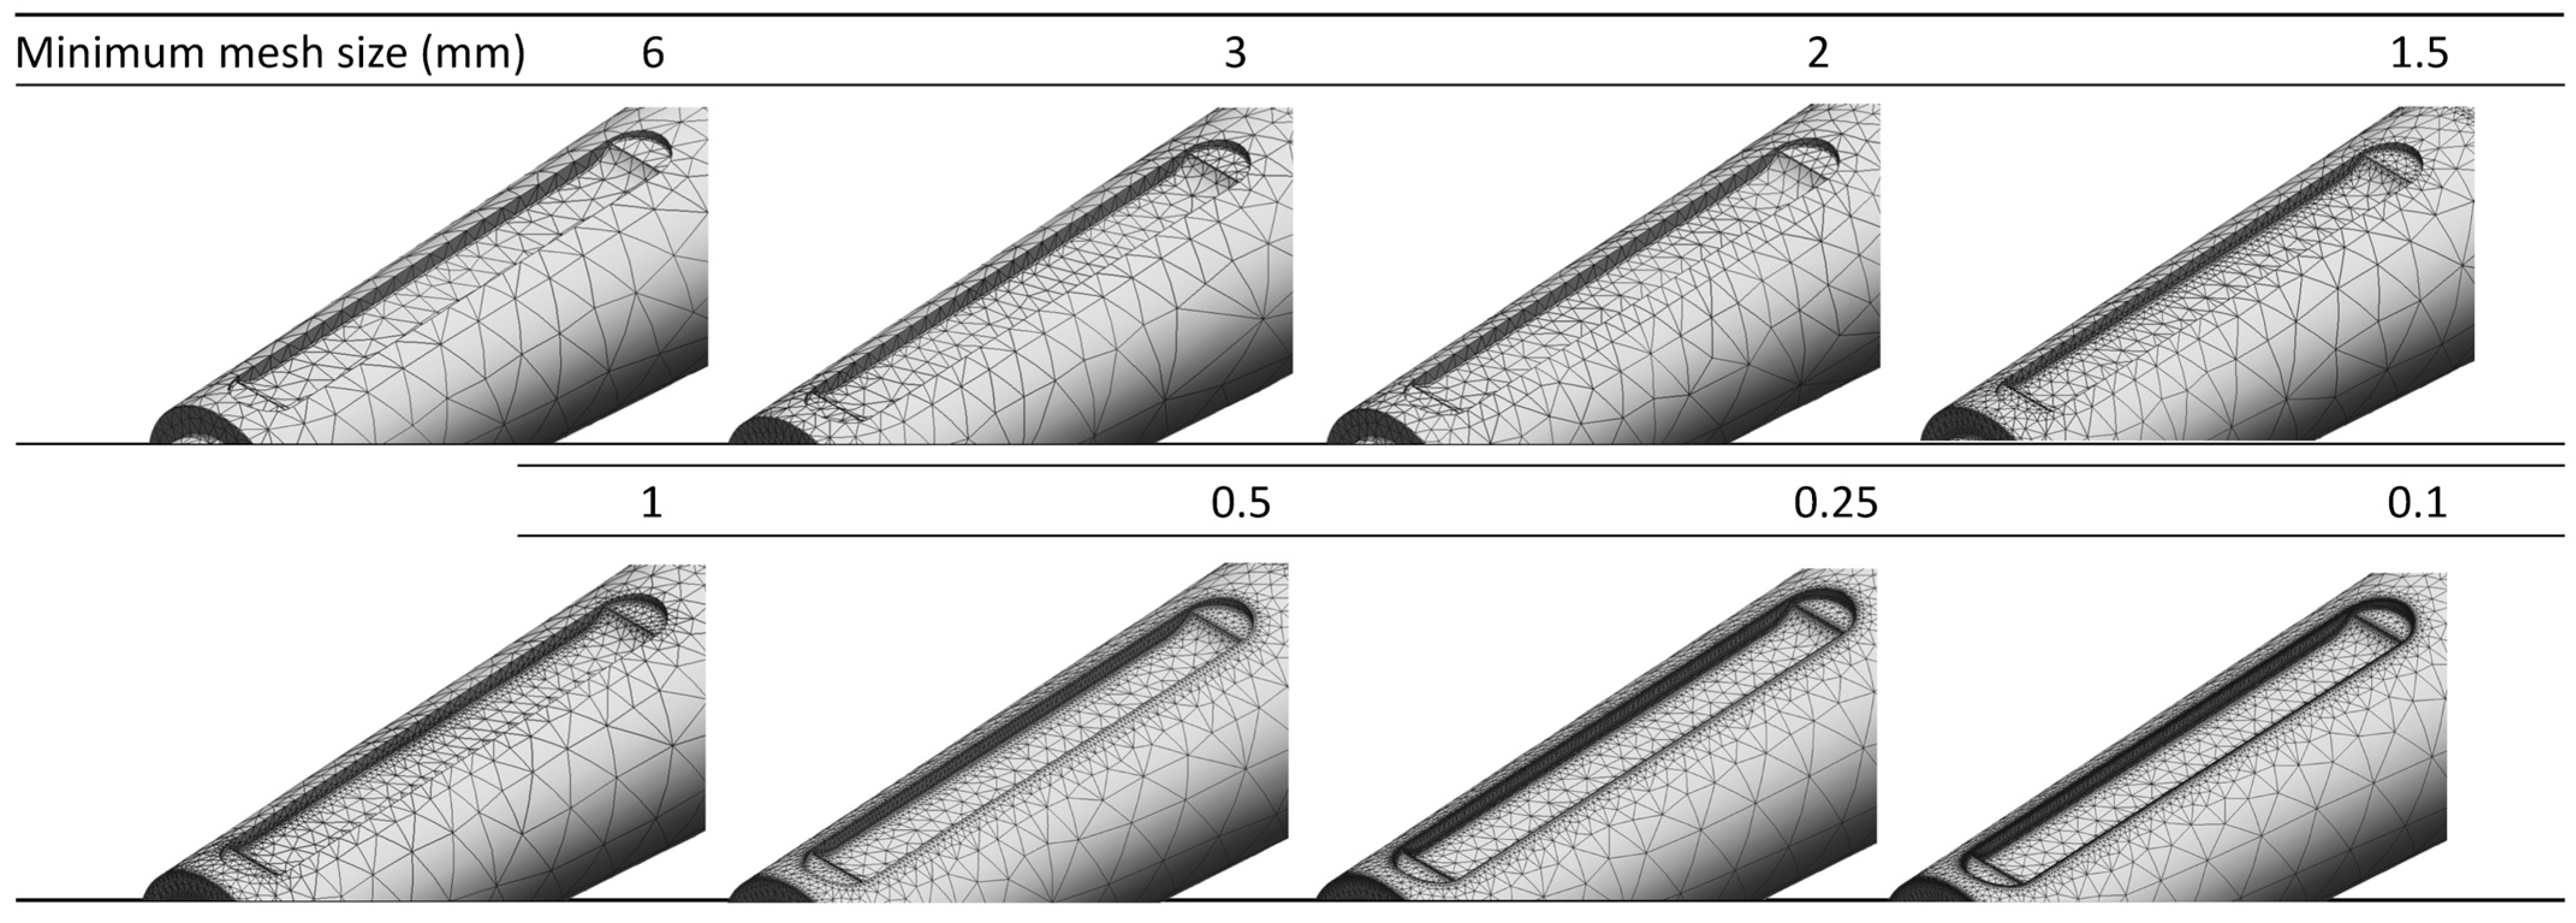
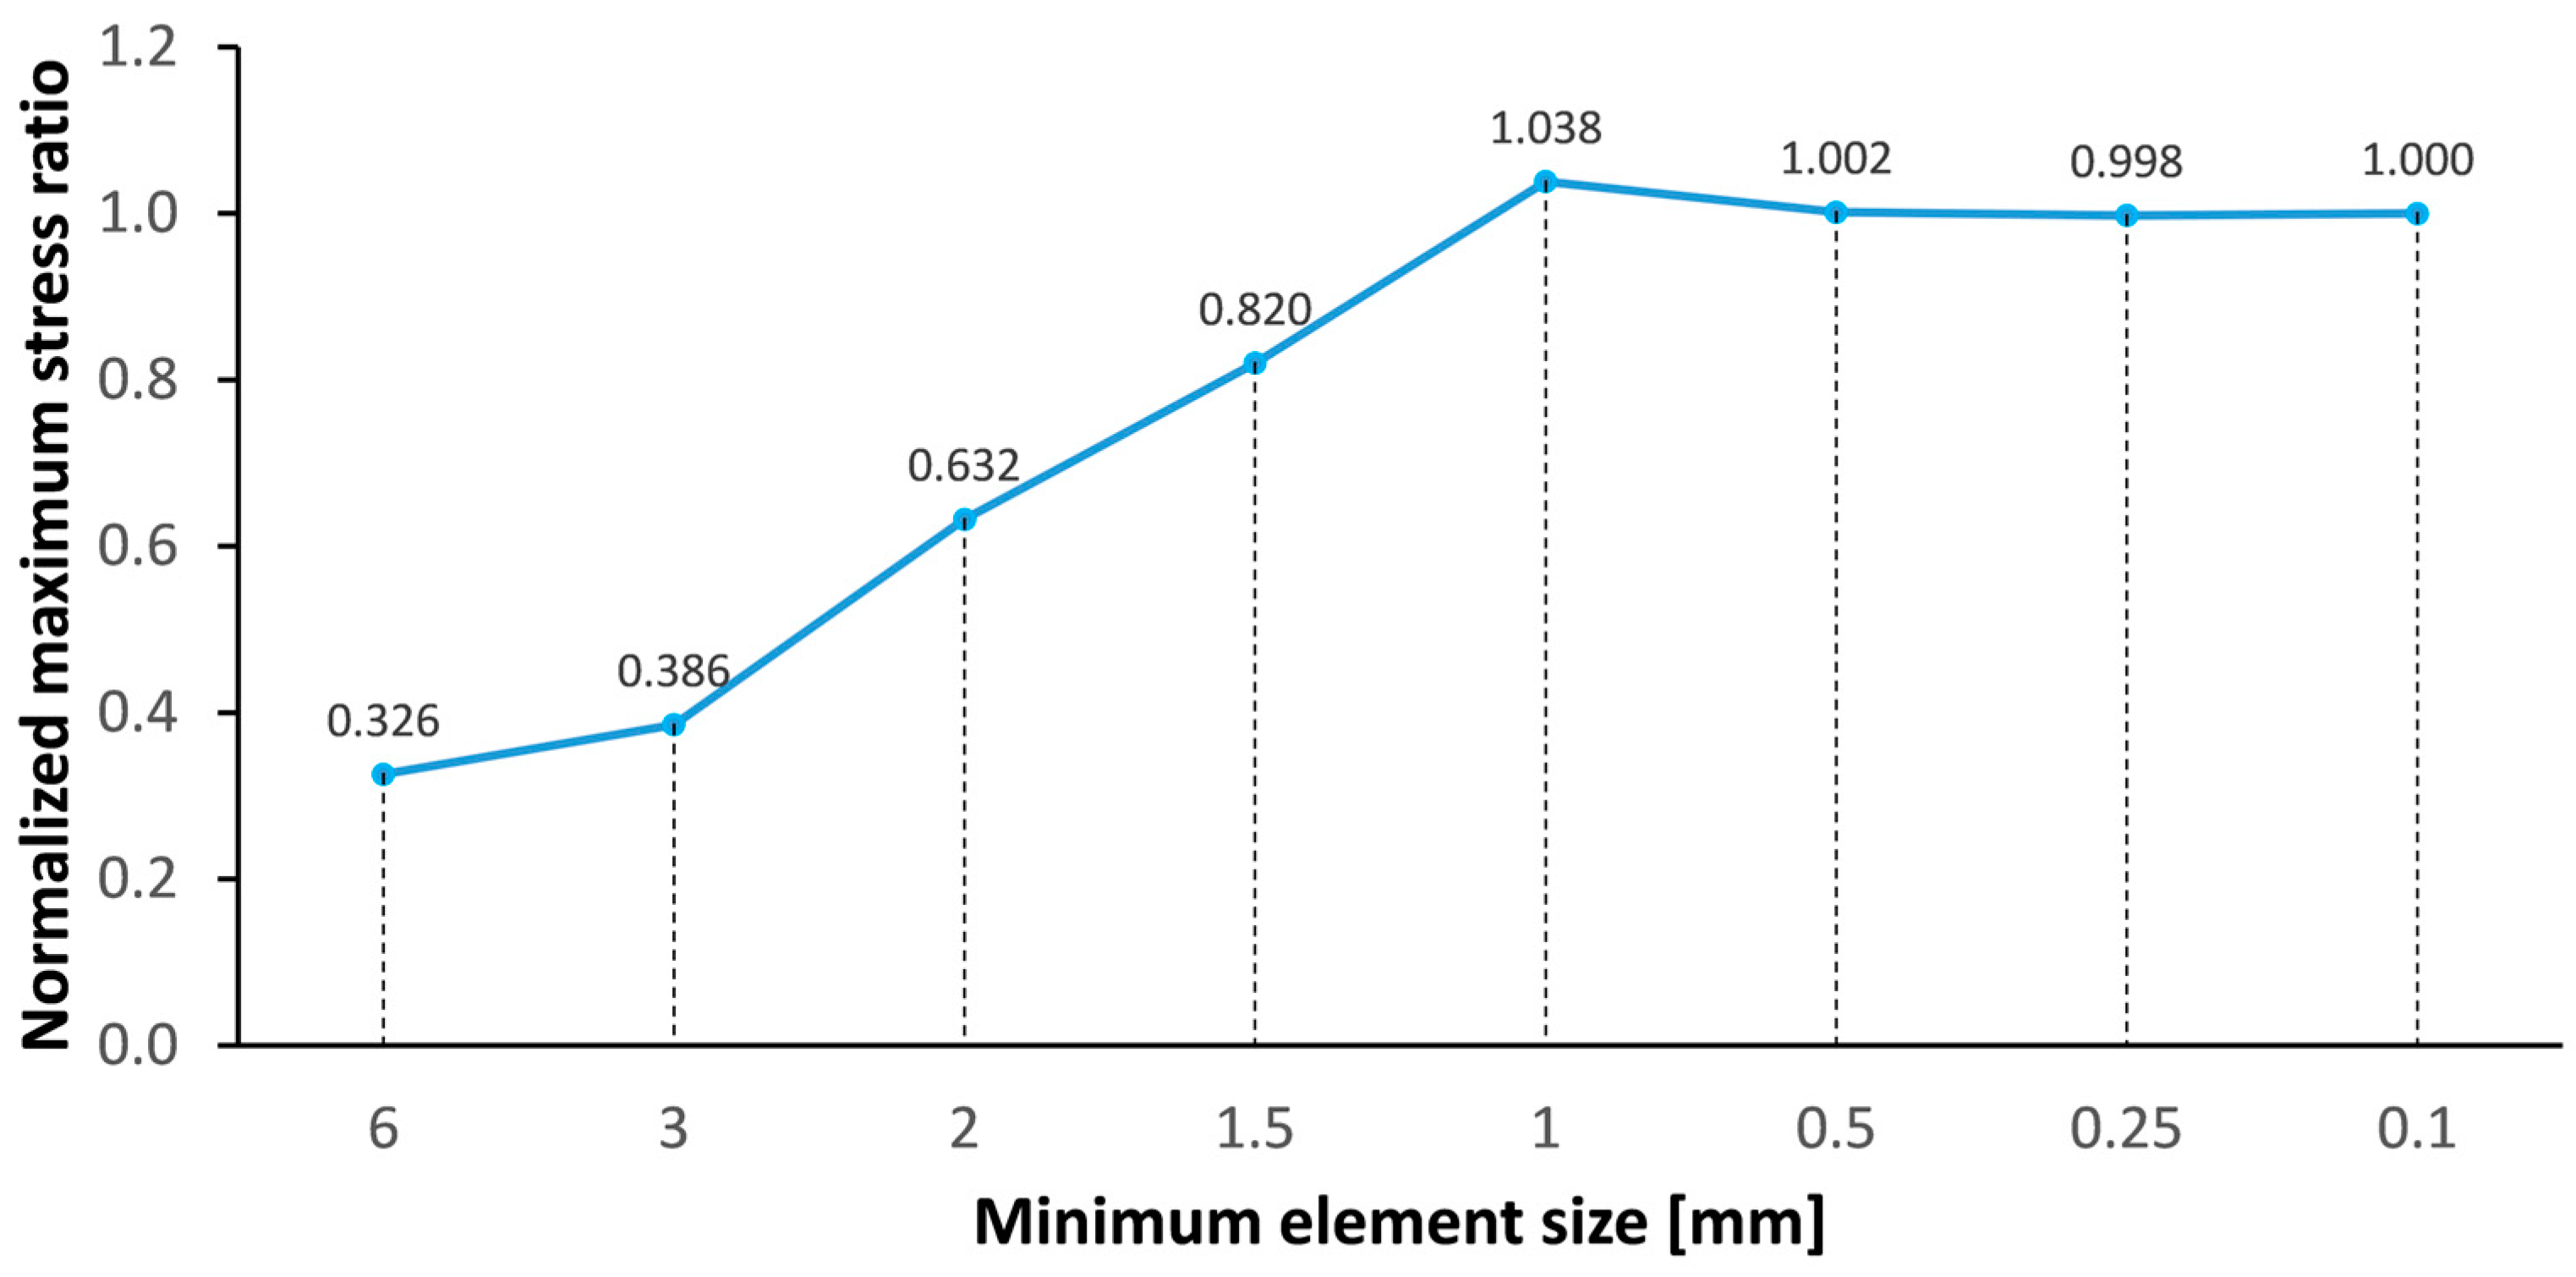
3.6.1. Meshing Sensitivity Analysis for Local Stresses

To ensure the accuracy and reliability of the computational results, a mesh sensitivity analysis was performed [48,49,50,51,52,53,54]. Simulations on a shaft with linear elastic material using various mesh refinement configurations shown in Table 5 revealed that maximum stress values stabilized when the minimum mesh size was reduced to 1.0 mm (Figure 8). This level of refinement was sufficient to achieve reliable stress predictions non-dependent on the mesh size.

3.6.2. Maximum Stresses in Keyseats

The actual loading conditions on a marine propeller shaft are dynamic and complex. However, static analysis has a specific purpose: to determine the local stress distribution, especially at critical points such as the keyway. Dynamic analysis, while providing valuable information on overall system behavior, may not provide the level of detail needed to accurately capture stress concentrations in these critical areas. Shaft design software 2020, while useful for dynamic simulations, may not fully resolve the localized stresses that drive fatigue crack initiation. Therefore, this static analysis provides a crucial first assessment of the stress state. However, there are limitations to a purely static approach; the excessively high local stresses identified in the preliminary static analysis warrant further investigation and refinement of the keyway design. If the static analysis indicated acceptable stress levels, a full dynamic fatigue analysis using FEA becomes meaningful.
Figure 9a shows the contour plot of equivalent stress on the shaft. While the shaft generally exhibits low stress levels, significant stress concentrations are evident in the keyseats (Figure 9b). The maximum stresses in these regions exceed the material’s initial yield strength of 440 MPa, indicating that local plastic deformation is likely to occur. The red areas in the keyseat highlight these critical regions. A closer examination of the stress distribution reveals that the higher stresses are concentrated in the shorter wall of the keyseat, where the reduced contact area leads to higher stress concentrations under the applied torsional load. This observation underscores the importance of optimizing the keyway geometry to distribute the load more effectively.
The model employed for this analysis assumes purely elastic material behavior. While this simplification does not capture the evolution of plastic flow, it accurately predicts the onset of plastic deformation using the von Mises yield criterion (indicated by the red zones). The high-stress concentrations predicted by this elastic model, exceeding the material’s yield strength, correlate with the delamination failures observed in the damaged keyseat of the marine propeller shaft. This qualitative agreement between the computational predictions and the observed failure mode validates the use of the elastic model for identifying critical areas and justifies further investigation and design refinement.
One potential solution to strengthen the keyseat wall is surface burnishing [55]. Burnishing can induce compressive residual stresses in the surface layer, which can partially offset the tensile stresses generated by the contact pressure and improve fatigue life. However, the magnitude of stress reduction required to prevent yielding in this case is significant, and it is uncertain whether burnishing alone can achieve the necessary improvement. Further investigation, including perhaps finite element analysis of the burnished keyway, is needed to assess the effectiveness of this approach. It is also important to acknowledge that some degree of localized plastic deformation, or yielding, can occur in high-stress regions. This yielding can lead to strain hardening [56,57], which could redistribute the contact pressure more evenly and reduce peak stresses. However, relying solely on strain hardening to mitigate the high stresses is not recommended. While localized plastic deformation might seem acceptable initially, it can lead to several undesirable consequences. Permanent changes in the keyway geometry, even if localized, can compromise the fit between the shaft and the key. This can result in increased looseness, fretting wear [58], accelerating fatigue crack initiation [59], and potentially leading to premature failure. Therefore, a more robust solution is to redesign the keyway to reduce stress concentrations below the material’s yield strength, ensuring the connection remains within the elastic regime under normal operating conditions.
While a direct, full-scale experimental comparison is not feasible at this time, several steps have been taken to build confidence in the computational model. Although precise numerical validation from a full-scale experiment is lacking, the computational results accurately predict the location of failure observed in the actual marine propeller shaft. The delamination failure in the keyseat, indicative of excessive compressive loads, corresponds to the area of highest stress concentration predicted by the finite element analysis. This qualitative agreement provides strong support for the model’s predictive capabilities.
Furthermore, the use of elastic models in finite element simulations has been extensively validated in previous studies for materials exhibiting linear elastic behavior. These studies have demonstrated high accuracy, with maximum prediction errors of 2.5% for solid materials [49]. Additionally, the method employed for the marine shaft analysis ensures mesh independence, as demonstrated in previous research [11,60] and confirmed by the mesh sensitivity analysis presented here. The combination of these factors—accurate failure location prediction, validated elastic modeling approaches, and mesh independence—provides reasonable confidence in the validity of the computational approach despite the limitations of full-scale experimental validation.

3.6.3. Keyseat Redesign of Shaft

The original design of the propeller shaft keyway exhibited high-stress concentrations, prompting an investigation into alternative designs. Three approaches were evaluated: relocating the keyway axially, increasing the key size, and modifying the keyway geometry. Relocating the keyway proved ineffective, with stress levels exceeding the material’s ultimate strength. While increasing the key size reduced maximum stress, it also compromised the shaft cross-section, presenting an unacceptable trade-off. Therefore, both of these approaches were deemed unsuitable.
The third approach focused on optimizing the keyway geometry. Various key shapes were considered, including square, rectangular, gib head, Woodruff, and spline keys, each with its own strengths and weaknesses. A round-ended rectangular key (parallel feather shaft key) was ultimately selected for its potential to mitigate stress concentrations at the keyway corners while simplifying assembly. Finite element analysis of this design demonstrated a significant reduction in maximum stress to allowable values without compromising the shaft cross-section. This reduction, observed on both the coupling and propeller sides of the keyway (Figure 10), achieved acceptable stress levels and ensured a wide safety margin. Although some stress inhomogeneity remained due to the transmitted torsion, the round-ended rectangular keyway design was deemed the most effective solution, significantly improving the shaft’s structural integrity.

4. Conclusions

This study employed a comprehensive approach to analyze a marine propeller shaft, integrating design rules, static load analysis, and dynamic load considerations. A combined analytical and numerical methodology was utilized to evaluate the shaft’s structural integrity and predict its service life. The key findings are as follows:
The Campbell diagram identified two critical speeds associated with the 3× propeller excitation frequency and the first natural frequency of the shaft: 530.7 rpm (26.5 Hz) for reverse rotation and 555.6 rpm (27.8 Hz) for forward rotation. The intersection of the 3× excitation spectrum with the first natural frequency confirms the potential for resonance. While the maximum operating speed of 511.5 rpm is below these critical speeds, a reduced operating speed of 442.3 rpm is recommended to maintain a 20% safety margin and mitigate resonance risks. This recommendation aligns closely with the analytically calculated operating speed of 447.1 rpm, validating the Campbell diagram approach.
The highest stress values during operation occur between the propeller and the shaft support, highlighting this region as critical for strength verification.
Applying the modified Goodman method for combined fatigue loads, the maximum factor of safety is 3 for constant shaft rotation, while the minimum is 1.5 for alternating torsional and bending moments. This suggests an infinite service life under the analyzed conditions, meeting design guidelines.
Finite element simulations showed original keyway design exhibited localized stress concentrations reaching the material’s ultimate strength (525 MPa for SAE 1030 steel), indicating a potential weakness.
A redesigned keyway featuring a round-ended rectangular key effectively reduced peak stresses, improving the shaft’s structural integrity and consequent fatigue life. This improvement stems from the increased contact area between the key and the propeller shaft, distributing stresses more evenly.
These findings demonstrate the importance of a comprehensive approach encompassing static, dynamic, and fatigue analyses. While the initial design appeared adequate under static loading, the FEA and Campbell diagram revealed potential weaknesses related to stress concentrations and resonance. The proposed keyway redesign and the recommended operating speed enhance the shaft’s reliability and service life.
Further work could explore alternative materials with higher strength or fatigue resistance to enhance the shaft’s performance. While this study focused on SAE 1030 steel, future research could investigate materials like high-strength alloys or composites, considering their respective advantages and disadvantages in marine environments.
While this work did not include experimental testing due to the scale of the investigated component, developing miniaturized or scaled marine propeller shaft procedures for equivalent real conditions in a laboratory setting could offer a cost-effective way to validate the findings and explore different design parameters. This would provide valuable empirical data to further refine the analytical and numerical models.
This comprehensive approach, combining analytical calculations, finite element analysis, and design modifications, significantly improved the propeller shaft’s structural integrity. This integrated methodology can be applied to the computational design and optimization of shaft behavior, contributing to the development of more robust and reliable marine propulsion systems.

Author Contributions

Conceptualization, V.T.; methodology, V.T.; software, D.M.; validation, D.M. and V.T.; formal analysis, D.M., V.T., S.N., A.O. and B.M.; investigation, D.M. and V.T.; resources, V.T.; data curation, D.M.; writing—original draft preparation, V.T. and D.M.; writing—review and editing, V.T., S.N., A.O. and B.M.; supervision, V.T.; project administration, V.T. All authors have read and agreed to the published version of the manuscript.

Funding

This work received no funding.

Institutional Review Board Statement

Not applicable.

Informed Consent Statement

Not applicable.

Data Availability Statement

The original contributions presented in the study are included in the article; further inquiries can be directed to the corresponding author.

Conflicts of Interest

The authors declare no conflicts of interest.

Abbreviations

SymbolDescriptionUnits of Measure
σ a x i a l Tensile and compressive stress.MPa
F Tension or compression load.N
A Shaft cross-sectional area.mm2
δ Displacement of a shaft point.mm
L Original length of the shaft.mm
E Modulus of elasticity of the material.MPa
σ Intermediate bending stress in the shaft.MPa
σ m a x Maximum bending stress in the shaft.MPa
M f Shaft bending moment.Nm
c Intermediate shaft radius.M
I Moment of inertia of the cross-section.mm4
D Intermediate shaft diameter.mm
D Outside diameter.M
ρ Volumetric density of the material.kg/m3
g Acceleration of gravity.m/s2
r Outer radius.M
τ Intermediate shaft shear stress.MPa
τ m a x Maximum shear stress in the shaft.MPa
T Internal torque.Nm
M T Torsional moment on shaft surface. Nm
J Polar moment of inertia of the cross-section.mm4
P Power.kW
n Revolutions per minute.RPM
ω Angular velocity.Rad/s
F l Drive motor factor: 95 for electric drives and 100 for others.
k Shaft component factor: 1.0 for shaft with integral flange, 1.1 with keyway or cylindrical connections, and 1.2 for shafts with longitudinal notches.
P l Power delivered to the shaft.kW
σ u Ultimate stress of the material.N/mm2
σ y Elastic limit of the material.N/mm2
f N a t u r a l Natural frequency.Hz
f E x c i t a t i o n Excitation frequency.Hz
n b l a d e s Number of propeller blades.
A n Vibration mode constant.
G Mass per unit length.kg/m
L A Distance between supports.m
v C Critical operating speed.RPM
S e Fatigue resistance limit at critical location.MPa
S e Fatigue resistance limit at the rotating beam.MPa
k a Modification factor for surface condition.
k b Modification factor for size.
k c Modification factor for load.
k d Modification factor for temperature.
k e Reliability factor.
k f Modification factor for miscellaneous effects.
S u t   Minimum tensile strength.MPa
d Shaft outside diameter.mm
f Fatigue strength fraction.
σ F True stress–true strain.kpsi; MPa
b Constant to obtain the fatigue strength fraction.
N c Number of cycles to obtain the fatigue strength fraction.
N Number of life cycles.
a Constant to determine the failure cycles.
b Constant to determine the failure cycles.
σ r e v Fully reversed stress.MPa
K f Fatigue stress concentration factor for bending or fatigue.
K t Stress concentration factor.
a Neuber’s constant.Pulg.
r c Notch radius.mm
σ m Average stress.MPa
σ a Alternating stressMPa
σ m a x Maximum stress. MPa
σ m i n Minimum stress.MPa
A R Ratio of amplitude.
R R Stress ratio
K f f l e x i o n   Fatigue concentration factor for bending loads.
K f a x i a l Fatigue concentration factor for axial loads.
K f s t o r s i o n Fatigue concentration factor for torsional loads.
σ A f l e x i o n Alternating stress bending loads.MPa
σ m f l e x i o n Average stress bending loads.MPa
σ A a x i a l Alternating stress due to axial loads.MPa
σ m a x i a l Average stress due to axial loads.MPa
τ a t o r s i o n Shear stress due to torsional loads.MPa
τ m t o r s i o n Shear stress due to torsional loads.MPa
σ a Alternating von Mises stress.MPa
σ m Average von Mises stressMPa
τ x y Average shear stress due to direct shear.MPa
F C Applied force.N
A s h e a r Shear area.mm2
A s h e a r ,   m i n Minimum shear area.mm2
d 1 Shaft diameter at the center of the key.Mm
σ x Average contact pressure stress.MPa
A C o n t a c t Lateral contact area of key with shaft keyway.mm2
A c o n t ,   m i n Minimum pressure area.mm2
σ u k Ultimate stress of key.MPa

References

  1. Choi, S.-P.; Lee, J.-U.; Park, J.-B. Application of Deep Reinforcement Learning to Predict Shaft Deformation Considering Hull Deformation of Medium-Sized Oil/Chemical Tanker. J. Mar. Sci. Eng. 2021, 9, 767. [Google Scholar] [CrossRef]
  2. Arisoy, C.F.; Başman, G.; Şeşen, M.K. Failure of a 17-4 PH Stainless Steel Sailboat Propeller Shaft. Eng. Fail. Anal. 2003, 10, 711–717. [Google Scholar] [CrossRef]
  3. Zou, D.; Zhang, J.; Ta, N.; Rao, Z. The Hydroelastic Analysis of Marine Propellers with Consideration of the Effect of the Shaft. Ocean Eng. 2017, 131, 95–106. [Google Scholar] [CrossRef]
  4. Han, H.S.; Lee, K.H.; Park, S.H. Estimate of the Fatigue Life of the Propulsion Shaft from Torsional Vibration Measurement and the Linear Damage Summation Law in Ships. Ocean Eng. 2015, 107, 212–221. [Google Scholar] [CrossRef]
  5. Sitthipong, S.; Towatana, P.; Sitticharoenchai, A. Failure Analysis of Metal Alloy Propeller Shafts. Mater. Today Proc. 2017, 4, 6491–6494. [Google Scholar] [CrossRef]
  6. Vizentin, G.; Vukelic, G.; Murawski, L.; Recho, N.; Orovic, J. Marine Propulsion System Failures—A Review. J. Mar. Sci. Eng. 2020, 8, 662. [Google Scholar] [CrossRef]
  7. Ball, A. The Fracture of a Ship’s Propeller Shaft. Fract. Fract. Mech. 1985, 265–271. [Google Scholar] [CrossRef]
  8. Balyts’kyi, O.I.; Kawiak, M.; Kawiak, P. Assessment of the Fatigue Damage to the Propeller Shaft of a Sea Craft. Mater. Sci. 2013, 49, 130–133. [Google Scholar] [CrossRef]
  9. Lee, J.-W.; Vuong, Q.D.; Jeong, B.; Lee, J. Changes in Propeller Shaft Behavior by Fluctuating Propeller Forces during Ship Turning. Appl. Sci. 2022, 12, 5041. [Google Scholar] [CrossRef]
  10. Tuninetti, V.; Mariqueo, M. Performance of Combined Woven Roving and Mat Glass-Fiber Reinforced Polymer Composites Under Absorption Tower Lifting Loads. Polymers 2024, 16, 2937. [Google Scholar] [CrossRef]
  11. Tuninetti, V.; Fuentes, G.; Oñate, A.; Narayan, S.; Celentano, D.; García-Herrera, C.; Menacer, B.; Pincheira, G.; Garrido, C.; Valle, R. Computational Shape Design Optimization of Femoral Implants: Towards Efficient Forging Manufacturing. Appl. Sci. 2024, 14, 8289. [Google Scholar] [CrossRef]
  12. Tuninetti, V.; Sepúlveda, H. Computational Mechanics for Turbofan Engine Blade Containment Testing: Fan Case Design and Blade Impact Dynamics by Finite Element Simulations. Aerospace 2024, 11, 333. [Google Scholar] [CrossRef]
  13. Motley, M.R.; Nelson, M.; Young, Y.L. Integrated Probabilistic Design of Marine Propulsors to Minimize Lifetime Fuel Consumption. Ocean Eng. 2012, 45, 1–8. [Google Scholar] [CrossRef]
  14. Dong, C.; Yuan, C.; Bai, X.; Yan, X.; Mao, S. Reliability Evaluation of Marine Propulsion Shaft Based on Stress-Strength Interference Theory. In Proceedings of the 34th International Conference on Ocean, Offshore and Arctic Engineering, St. John’s, NL, Canada, 31 May–5 June 2015. [Google Scholar]
  15. Pantazopoulos, G.; Papaefthymiou, S. Failure and Fracture Analysis of Austenitic Stainless Steel Marine Propeller Shaft. J. Fail. Anal. Prev. 2015, 15, 762–767. [Google Scholar] [CrossRef]
  16. Afolabi, S.O.; Oladapo, B.I.; Ijagbemi, C.O.; Adeoye, A.O.M.; Kayode, J.F. Design and Finite Element Analysis of a Fatigue Life Prediction for Safe and Economical Machine Shaft. J. Mater. Res. Technol. 2019, 8, 105–111. [Google Scholar] [CrossRef]
  17. Ding, G.; Yan, X.; Gao, X.; Xiao, J. Experimental and Numerical Studies on Fatigue Characteristics of CFRP Shaft Tube. Appl. Sci. 2022, 12, 8933. [Google Scholar] [CrossRef]
  18. Rao, R.; Mohan, S.; Kumar, G. Determination of Fatigue Life of Surface Propeller by Using Finite Element Analysis. Int. J. Eng. Sci. 2016, 2492, 2492–2503. [Google Scholar]
  19. da Silva, F.A.C.; de Castro, P.M.S.T. Redesign of a Failed Hoisting Shaft of a Vertical Transfer Device. Eng 2023, 4, 1981–2002. [Google Scholar] [CrossRef]
  20. Song, M.H.; Pham, X.D.; Vuong, Q.D. Torsional Vibration Stress and Fatigue Strength Analysis of Marine Propulsion Shafting System Based on Engine Operation Patterns. J. Mar. Sci. Eng. 2020, 8, 613. [Google Scholar] [CrossRef]
  21. Huang, Z.; Wu, R.; Chen, J.; Xu, X.; Xie, Y. Study of Torsional Vibration Bifurcation Characteristics of Direct-Drive Wind Turbine Shaft System. Processes 2022, 10, 1700. [Google Scholar] [CrossRef]
  22. Ma, Y.; Chen, G.; Wu, J.; Ma, K.; Fan, L. Vibration Fatigue Analysis of a Simply Supported Cracked Beam Subjected to a Typical Load. Appl. Sci. 2022, 12, 7398. [Google Scholar] [CrossRef]
  23. Vizentin, G.; Vukelić, G.; Srok, M. Common Failures of Ship Propulsion Shafts. Pomorstvo 2017, 31, 85–90. [Google Scholar] [CrossRef]
  24. Liu, G.; Shao, Y. Fatigue Life Calculation of Shaft System Based on Bend-Torsion Coupling. IOP Conf. Ser. Mater. Sci. Eng. 2019, 569, 022008. [Google Scholar] [CrossRef]
  25. Xu, X.L.; Yu, Z.W. Failure Analysis of a Marine Intermediate Shaft. Eng. Fail. Anal. 2021, 126, 105464. [Google Scholar] [CrossRef]
  26. Song, M.H.; Nam, T.K.; Lee, J.U. Self-Excited Torsional Vibration in the Flexible Coupling of a Marine Propulsion Shafting System Employing Cardan Shafts. J. Mar. Sci. Eng. 2020, 8, 348. [Google Scholar] [CrossRef]
  27. Wang, W.; Shang, Y.; Yao, Z. A Predictive Analysis Method of Shafting Vibration for the Hydraulic-Turbine Generator Unit. Water 2022, 14, 2714. [Google Scholar] [CrossRef]
  28. Zhang, X.; Xu, Q.; Zhang, M.; Xie, Z. Numerical Prediction of Cavitation Fatigue Life and Hydrodynamic Performance of Marine Propellers. J. Mar. Sci. Eng. 2024, 12, 74. [Google Scholar] [CrossRef]
  29. Ju, H.J.; Choi, J.S. Experimental Study of Cavitation Damage to Marine Propellers Based on the Rotational Speed in the Coastal Waters. Machines 2022, 10, 793. [Google Scholar] [CrossRef]
  30. Tadros, M.; Ventura, M.; Guedes Soares, C. Effect of Hull and Propeller Roughness during the Assessment of Ship Fuel Consumption. J. Mar. Sci. Eng. 2023, 11, 784. [Google Scholar] [CrossRef]
  31. He, T.; Xie, Z.; Tao, X.; Yang, K.; Jiao, J.; Huang, M.; Ma, W. Analysis of the Tribological and Dynamic Performance of the Self-Adapting Water-Lubricated Stern Bearing. Lubricants 2022, 10, 245. [Google Scholar] [CrossRef]
  32. Teng, Y.; Xie, L.; Zhang, H. Experimental Study on Vibration Fatigue Behavior of Aircraft Aluminum Alloy 7050. Materials 2022, 15, 7555. [Google Scholar] [CrossRef] [PubMed]
  33. Kwon, W.S.; Vuong, Q.D.; Choi, J.H.; Lee, J.U.; Lee, J.W.; Yoon, S.H.; Nyongesa, A.J.; Park, M.H.; Yang, S.K.; Lee, W.J. Study on the Propeller Rope Cutter Concerning Transient Torsional Vibration Due to Cutting Action. Appl. Sci. 2022, 12, 1628. [Google Scholar] [CrossRef]
  34. Lloyd’s, R. Rules and Regulations for the Classification of Naval Ships; Lloyd’s Register: London, UK, 2018. [Google Scholar]
  35. Zhang, G.; Zhao, Y.; Chu, W. Longitudinal Vibration Transmission Control of Marine Propulsion Shafting with Friction Damper Integrated into the Thrust Bearing. J. Mar. Sci. Eng. 2022, 10, 1555. [Google Scholar] [CrossRef]
  36. Noonan, E.F. Ship Vibration Design Guide; Ship Structure Committee publications; Ship Structure Committee: Washington, DC, USA, 1990. [Google Scholar]
  37. Martínez Muñoz, S. Diseño de La Línea de Ejes de Un Buque Oceanográfico; Universidad Politécnica de Cartagena: Cartagena, Spain, 2017. [Google Scholar]
  38. Budynas, R.G.; Nisbett, J.K. Diseño En Ingeniería Mecánica de Shigley, 9th ed.; McGraw Hill: New York, NY, USA, 2010; ISBN 9781626239777. [Google Scholar]
  39. Rothbart, H.A. Mechanical Design and Systems Handbook, 2nd ed.; McGraw-Hill: New York, NY, USA, 1985. [Google Scholar]
  40. Bhushan, B. Introduction to Tribology, 2nd ed.; John Wiley & Sons, Inc.: New York, NY, USA, 2013; ISBN 9781119944539. [Google Scholar]
  41. Dokos, S.J. Sliding Friction Under Extreme Pressures—1. J. Appl. Mech. 2021, 13, A148–A156. [Google Scholar] [CrossRef]
  42. Pougis, A.; Philippon, S.; Massion, R.; Faure, L.; Fundenberger, J.-J.; Toth, L.S. Dry Friction of Steel under High Pressure in Quasi-Static Conditions. Tribol. Int. 2013, 67, 27–35. [Google Scholar] [CrossRef]
  43. Nassiraei, H.; Rezadoost, P. Stress Concentration Factors in Tubular T/Y-Joints Strengthened with FRP Subjected to Compressive Load in Offshore Structures. Int. J. Fatigue 2020, 140, 105719. [Google Scholar] [CrossRef]
  44. Fang, J.; Li, X.; Zhang, D.; Zhang, X.; Shao, W. Research on Load Reverse Engineering and Vibration Fatigue Analysis Technology of Rapid Box Wagon. Materials 2022, 15, 8322. [Google Scholar] [CrossRef]
  45. Tuninetti, V.; Alzugaray, R.; González, J.; Valenzuela, M.; Jaramillo, A.; Diez, E. Root Cause and Vibration Analysis to Increase Veneer Manufacturing Process Efficiency: A Case Study on an Industrial Peeling Lathe. Eur. J. Wood Wood Prod. 2021, 79, 951–966. [Google Scholar] [CrossRef]
  46. Song, G.; Park, H.; Lee, T. The Effect of Rudder Existence on Propeller Eccentric Force. J. Mar. Sci. Eng. 2019, 7, 455. [Google Scholar] [CrossRef]
  47. Witek, L. Failure Analysis of Turbine Disc of an Aero Engine. Eng. Fail. Anal. 2006, 13, 9–17. [Google Scholar] [CrossRef]
  48. Venegas, I.; Oñate, A.; Pierart, F.G.; Valenzuela, M.; Narayan, S.; Tuninetti, V. Efficient Mako Shark-Inspired Aerodynamic Design for Concept Car Bodies in Underground Road Tunnel Conditions. Biomimetics 2024, 9, 448. [Google Scholar] [CrossRef] [PubMed]
  49. Rilling, S.; Ríos, I.; Gómez, Á.; Valenzuela, M.; Oñate, A.; Tuninetti, V. Optimized Infill Density through Topological Optimization Increases Strength of Additively Manufactured Porous Polylactic Acid. Int. J. Adv. Manuf. Technol. 2023, 129, 3739–3750. [Google Scholar] [CrossRef]
  50. Bustos, F.; Hinojosa, J.; Tuninetti, V. Computational Comparison of Performance of Different Steel Plate Shear Yielding Dampers. Buildings 2023, 13, 793. [Google Scholar] [CrossRef]
  51. Rojas-Ulloa, C.; Tuninetti, V.; Sepúlveda, H.; Betaieb, E.; Pincheira, G.; Gilles, G.; Duchêne, L.; Habraken, A.M. Accurate Numerical Prediction of Ductile Fracture and Micromechanical Damage Evolution for Ti6Al4V Alloy. Comput. Mech. 2024, 73, 177–198. [Google Scholar] [CrossRef]
  52. Rojas-Ulloa, C.; Bouffioux, C.; Jaramillo, A.F.; García-Herrera, C.M.; Hussain, T.; Duchêne, L.; Riu, G.; Josep Roa, J.; Flores, P.; Marie Habraken, A.; et al. Nanomechanical Characterization of the Deformation Response of Orthotropic Ti–6Al–4V. Adv. Eng. Mater. 2021, 23, 2001341. [Google Scholar] [CrossRef]
  53. Duchêne, L.; Bettaieb, A.B.; Tuninetti, V.; Habraken, A.M. Numerical Modeling and Digital Image Correlation Strain Measurements of Coated Metal Sheets Submitted to Large Bending Deformation. Key Eng. Mater. 2013, 554–557, 2424–2431. [Google Scholar] [CrossRef]
  54. Jardin, R.T.; Tuninetti, V.; Tchuindjang, J.T.; Duchêne, L.; Hashemi, N.; Tran, H.S.; Carrus, R.; Mertens, A.; Habraken, A.M. Optimizing Laser Power of Directed Energy Deposition Process for Homogeneous AISI M4 Steel Microstructure. Opt. Laser Technol. 2023, 163, 109426. [Google Scholar] [CrossRef]
  55. Dzionk, S.; Przybylski, W.; Ścibiorski, B. The Possibilities of Improving the Fatigue Durability of the Ship Propeller Shaft by Burnishing Process. Machines 2020, 8, 63. [Google Scholar] [CrossRef]
  56. Tuninetti, V.; Flores, P.; Valenzuela, M.; Pincheira, G.; Medina, C.; Duchêne, L.; Habraken, A.M. Experimental Characterization of the Compressive Mechanical Behaviour of Ti6Al4V Alloy at Constant Strain Rates over the Full Elastoplastic Range. Int. J. Mater. Form. 2020, 13, 709–724. [Google Scholar] [CrossRef]
  57. Flores, P.; Tuninetti, V.; Gilles, G.; Gonry, P.; Duchêne, L.; Habraken, A.M. Accurate Stress Computation in Plane Strain Tensile Tests for Sheet Metal Using Experimental Data. J. Mater. Process. Technol. 2010, 210, 1772–1779. [Google Scholar] [CrossRef]
  58. Kwon, J.D.; Cho, S.J.; Bae, Y.T. A Study on Fretting Fatigue Behavior of Degraded 1Cr-0.5Mo Steel. In Proceedings of the Advances in Fracture and Failure Prevention; Trans Tech Publications Ltd.: Stafa-Zurich, Switzerland, 2004; Volume 261, pp. 1221–1226. [Google Scholar]
  59. Kravchenko, G.N.; Kravchenko, K.G. Assessment of Cyclic Crack Resistance of Surface Hardened Parts. IOP Conf. Ser. Mater. Sci. Eng. 2020, 862, 022042. [Google Scholar] [CrossRef]
  60. Tuninetti, V.; Gómez, Á.; Bustos, F.; Oñate, A.; Hinojosa, J.; Gallo, C.; Habraken, A.; Duchêne, L. Computational Modeling of U-Shaped Seismic Dampers for Structural Damage Mitigation. Appl. Sci. 2024, 14, 10238. [Google Scholar] [CrossRef]
Figure 1. (a) Schematic of the propulsion system with structural details of (b) shaft, (c) keys, (d) propeller, and couplings.
Jmse 12 02227 g001
Figure 2. (a) Propeller shaft showing (b) delamination in the propeller side keyseat.
Jmse 12 02227 g002
Figure 3. Classification of loads producing fatigue; (a) alternating stress; (b) fluctuating stress.
Jmse 12 02227 g003
Figure 4. Different meshing configurations for the sensitivity analysis.
Jmse 12 02227 g004
Figure 5. Campbell diagram of the propeller shaft system, showing the intersection of the 3× propeller excitation frequency with the first natural frequency of the shaft.
Jmse 12 02227 g005
Figure 6. (a) Marine propeller shaft model in Shaftdesigner, showing deformation directions (arrows) corresponding to vibration modes. (b) Bending behavior under dynamic loads at a safe operating speed of 442 rpm. (c) Dynamic torsional load variation with rotational speed.
Jmse 12 02227 g006
Figure 7. Loading cycles of the propeller shaft for three cases: (a) continuous operation at a constant recommended working speed, (b) stationary and operating moments, and (c) forward and reverse operation.
Jmse 12 02227 g007
Figure 8. Mesh sensitivity analysis.
Jmse 12 02227 g008
Figure 9. Simulation results of the propeller shaft. (a) Overall view of equivalent stresses. (b) Local stresses distribution in keyways. Black box showing maximum local values.
Jmse 12 02227 g009
Figure 10. Localized stress distribution in the proposed redesigned keyway channels of the marine propeller shaft. Dimensions: (a) propeller side key—32 mm × 18 mm × 250 mm; (b) coupling side key—30 mm × 18 mm × 160 mm.
Jmse 12 02227 g010
Table 1. Constants for the surface factor according to manufacturing [38].
Manufacturing Process Factor   a (MPa) Exponent   b
Grinding1.58 0.085
Machining or cold rolling5.51 0.265
Hot rolling 57.7 0.718
As-forged272 0.995
Table 2. Marine propeller shaft diameters obtained from different approaches.
Shaft Diameter
Original marine propulsion shaft114
By direct calculation (maximum torsional shear stress)103.8
By Lloyd’s Register [34]:
k = 1.096.3
k = 1.1105.9
k = 1.2115
Table 3. Data for propeller shaft natural frequency calculation.
ParameterValue
Young’s modulus of SAE 1030 steel (GPa)190
Diameters (mm)106 y 114
SAE 1030 steel density (kg/m)37850
Number of blades3
Working speed (RPM)511.5
A n (first mode)9.87
Table 4. Safety factor and fatigue life under three analyzed conditions.
Case (a)Case (b)Case (c)
Safety factor3.12.61.5
Life cycles (× 10 6 )373865.43
Table 5. Mesh convergence analysis of computational results for maximum local stress.
SimulationMaximum Element Size (mm)Minimum Element Size
(mm)
Size Growth CoefficientNormalized Maximum Stress Ratio
#13061.80.33
#23030.39
#33020.63
#4301.50.82
#53011.04
#6300.51.00
#7300.251.00
#8300.11.00
Disclaimer/Publisher’s Note: The statements, opinions and data contained in all publications are solely those of the individual author(s) and contributor(s) and not of MDPI and/or the editor(s). MDPI and/or the editor(s) disclaim responsibility for any injury to people or property resulting from any ideas, methods, instructions or products referred to in the content.

