Article

High-Resolution 3D Geological Modeling of Three-Phase Zone Coexisting Hydrate, Gas, and Brine

1
Guangzhou Marine Geological Survey, China Geological Survey, Guangzhou 510700, China
2
School of Computer Science, Yangtze University, Jingzhou 434000, China
3
School of Petroleum Engineering, China University of Petroleum (East China), Qingdao 266580, China
*
Author to whom correspondence should be addressed.
J. Mar. Sci. Eng. 2024, 12(12), 2171; https://doi.org/10.3390/jmse12122171
Submission received: 22 October 2024 / Revised: 23 November 2024 / Accepted: 25 November 2024 / Published: 27 November 2024
(This article belongs to the Special Issue Advances in Marine Gas Hydrate Exploration and Discovery)

Abstract

:
Three-dimensional geological modeling is essential for simulating natural gas hydrate (NGH) productivity and formulating development strategies. Current approaches primarily concentrate on the single-phase modeling of either hydrate or free gas layers. However, an increasing number of instances suggest that the three-phase coexistence zone, which includes hydrate, gas, and water, is common and has become a focal point of international research, as this type of reservoir may present the most viable opportunities for exploitation. At present, there exists a significant gap in the research regarding modeling techniques for such reservoirs. This study undertakes a comprehensive modeling investigation of the three-phase zone reservoir situated in the sand layer of the Qiongdongnan Basin. By employing deterministic complex geological modeling techniques and integrating existing seismic and logging data, we have developed a three-phase coexistence zone model that precisely characterizes the interactions between geological structures and utilizes them as auxiliary constraints. This approach effectively mitigates the potential impact of complex geological conditions on model accuracy. Through a comprehensive analysis of 105 seismic profiles, we enhanced the model’s accuracy, resulting in the creation of a three-phase coexistence zone model comprising 350,000 grids. A comparison between the modeling results and well data indicates a relatively small error margin, offering valuable insights for future development efforts. Furthermore, this method serves as a reference for modeling hydrates in marine environments characterized by three-phase coexistence on a global scale.

1. Introduction

The persistent increase in global energy demand, coupled with the gradual exhaustion of conventional fossil fuel resources, has rendered the advancement of new clean energy technologies a central element of international energy policy. Among various alternative energy sources, methane hydrate is regarded as one of the most promising due to its substantial reserves and environmentally friendly combustion properties [1,2]. Methane hydrate, an unconventional energy source, typically occurs in deep sea sediments or permafrost regions. Its unique physical and chemical properties complicate the extraction process and present significant risks [3,4,5,6]. Modeling technology serves as a crucial tool for understanding and forecasting the natural gas hydrate extraction process, thereby facilitating the simulation and optimization of mining strategies [7]. By integrating seismic, logging, and geological data, this technology offers a comprehensive subsurface perspective that can enhance production efficiency and improve decision-making processes [8,9].
Hydrate modeling relies on an extensive array of seismic and logging data. How-ever, the scarcity of available data has resulted in a limited number of global reports on hydrate modeling, and the overall research quality remains relatively low. The predominant modeling approaches currently employed are largely derived from traditional oil and gas reservoir modeling techniques [10,11]. Wang et al. studied 74 crude oil and condensate gas samples from the Tarim, Junggar, Beibu Gulf, and Bohai Bay basins in China, analyzing the sedimentary environment and distribution characteristics of source rocks [12]. Jamil et al. investigated the effects of both earthquakes and non-earthquakes on sediment structure in deep sea sedimentary environments [13]. Additionally, Jamil et al. examined the development and distribution of Hybrid Event Beds in deep water sedimentary systems and their potential applications for deep sea energy exploration and development [14]. Argentino et al. analyzed the characteristics and identification of hydrates in sediments, providing important geochemical and geological evidence for the study of hydrates [15]. Ye et al. utilized geostatistical techniques to construct a three-dimensional geological model of hydrates within the W11-17 deposit situated in the Shenhu region of the South China Sea. Their research provided vertical predictions regarding the saturation and permeability of the reservoir, which effectively guided the design of horizontal wells. Similarly, Machiko et al. conducted an investigation in the eastern section of the Nankai Trough in Japan, employing two distinct methodologies to predict and validate the distribution of hydrate saturation [16]. Their results demonstrated that the amalgamation of well data and seismic information significantly enhances the precision of model predictions. It is noteworthy that the modeling approaches employed by these researchers predominantly focus on the single-phase modeling of either hydrate or gas. However, recent investigations into hydrate formations have demonstrated the widespread occurrence of the three-phase zone, which is defined by the coexistence of hydrate and natural gas within natural environments. This three-phase mixed layer has been identified in various geographical locations, including the Qiongdongnan area in the South China Sea [17], the Krishna-Godavari (K-G) Basin in India [18], the Black Sea in the western Atlantic [19], Hydrate Ridge off the coast of Oregon in the United States [20], Borneo in southern China [21], the West Kuranyi subduction zone in New Zealand [22], and a mine pit in Nigeria [23]. These reservoirs may represent promising targets for hydrate development due to their positioning at the boundary of stable conditions, which renders them more susceptible to depressurization and subsequent development. Qing et al. found that the hydrate reservoir is a complex system composed of natural gas hydrate, free gas, and water, based on their study of the Pearl River Mouth Basin. In the hydrate stability zone of the Shenhu District in the South China Sea, it has been confirmed that natural gas hydrates, free gases, and water coexist [24]. However, the three-phase hydrate system exhibits a complex superposition, complicating the characterization of its spatial morphology. At present, there is a deficiency of modeling studies that focus on the intricate spatial distribution of this system, and the existing modeling methodologies are insufficient for application to reservoirs exhibiting three-phase coexistence.
This study focuses on the three-phase coexistence zone within typical sandy reservoirs located in the Qiongdongnan sea area. Notably, drilling conducted at GMGS7 in Qiongdongnan in 2021 revealed the presence of hydrates and gas situated approximately 130 m beneath the seabed. The elevated temperatures within the central region of the gas layer have resulted in the predominant distribution of hydrates surrounding this gas layer, thereby facilitating the development of a three-phase coexistence zone between the gas and hydrate layers [3,17]. Utilizing logging data from nine wells alongside high-resolution 3D seismic data, this research employs a deterministic complex morphological modeling approach to construct a reservoir model of the three-phase zone. Optimization was achieved through rock physics modeling, which enhanced the detailed characterization of the internal properties of the reservoir. Additionally, the implementation of refined interpretation techniques further mitigated errors associated with geological structures. A comparative analysis of the modeling outcomes against well data indicates a minimal level of error.

2. Geological Setting

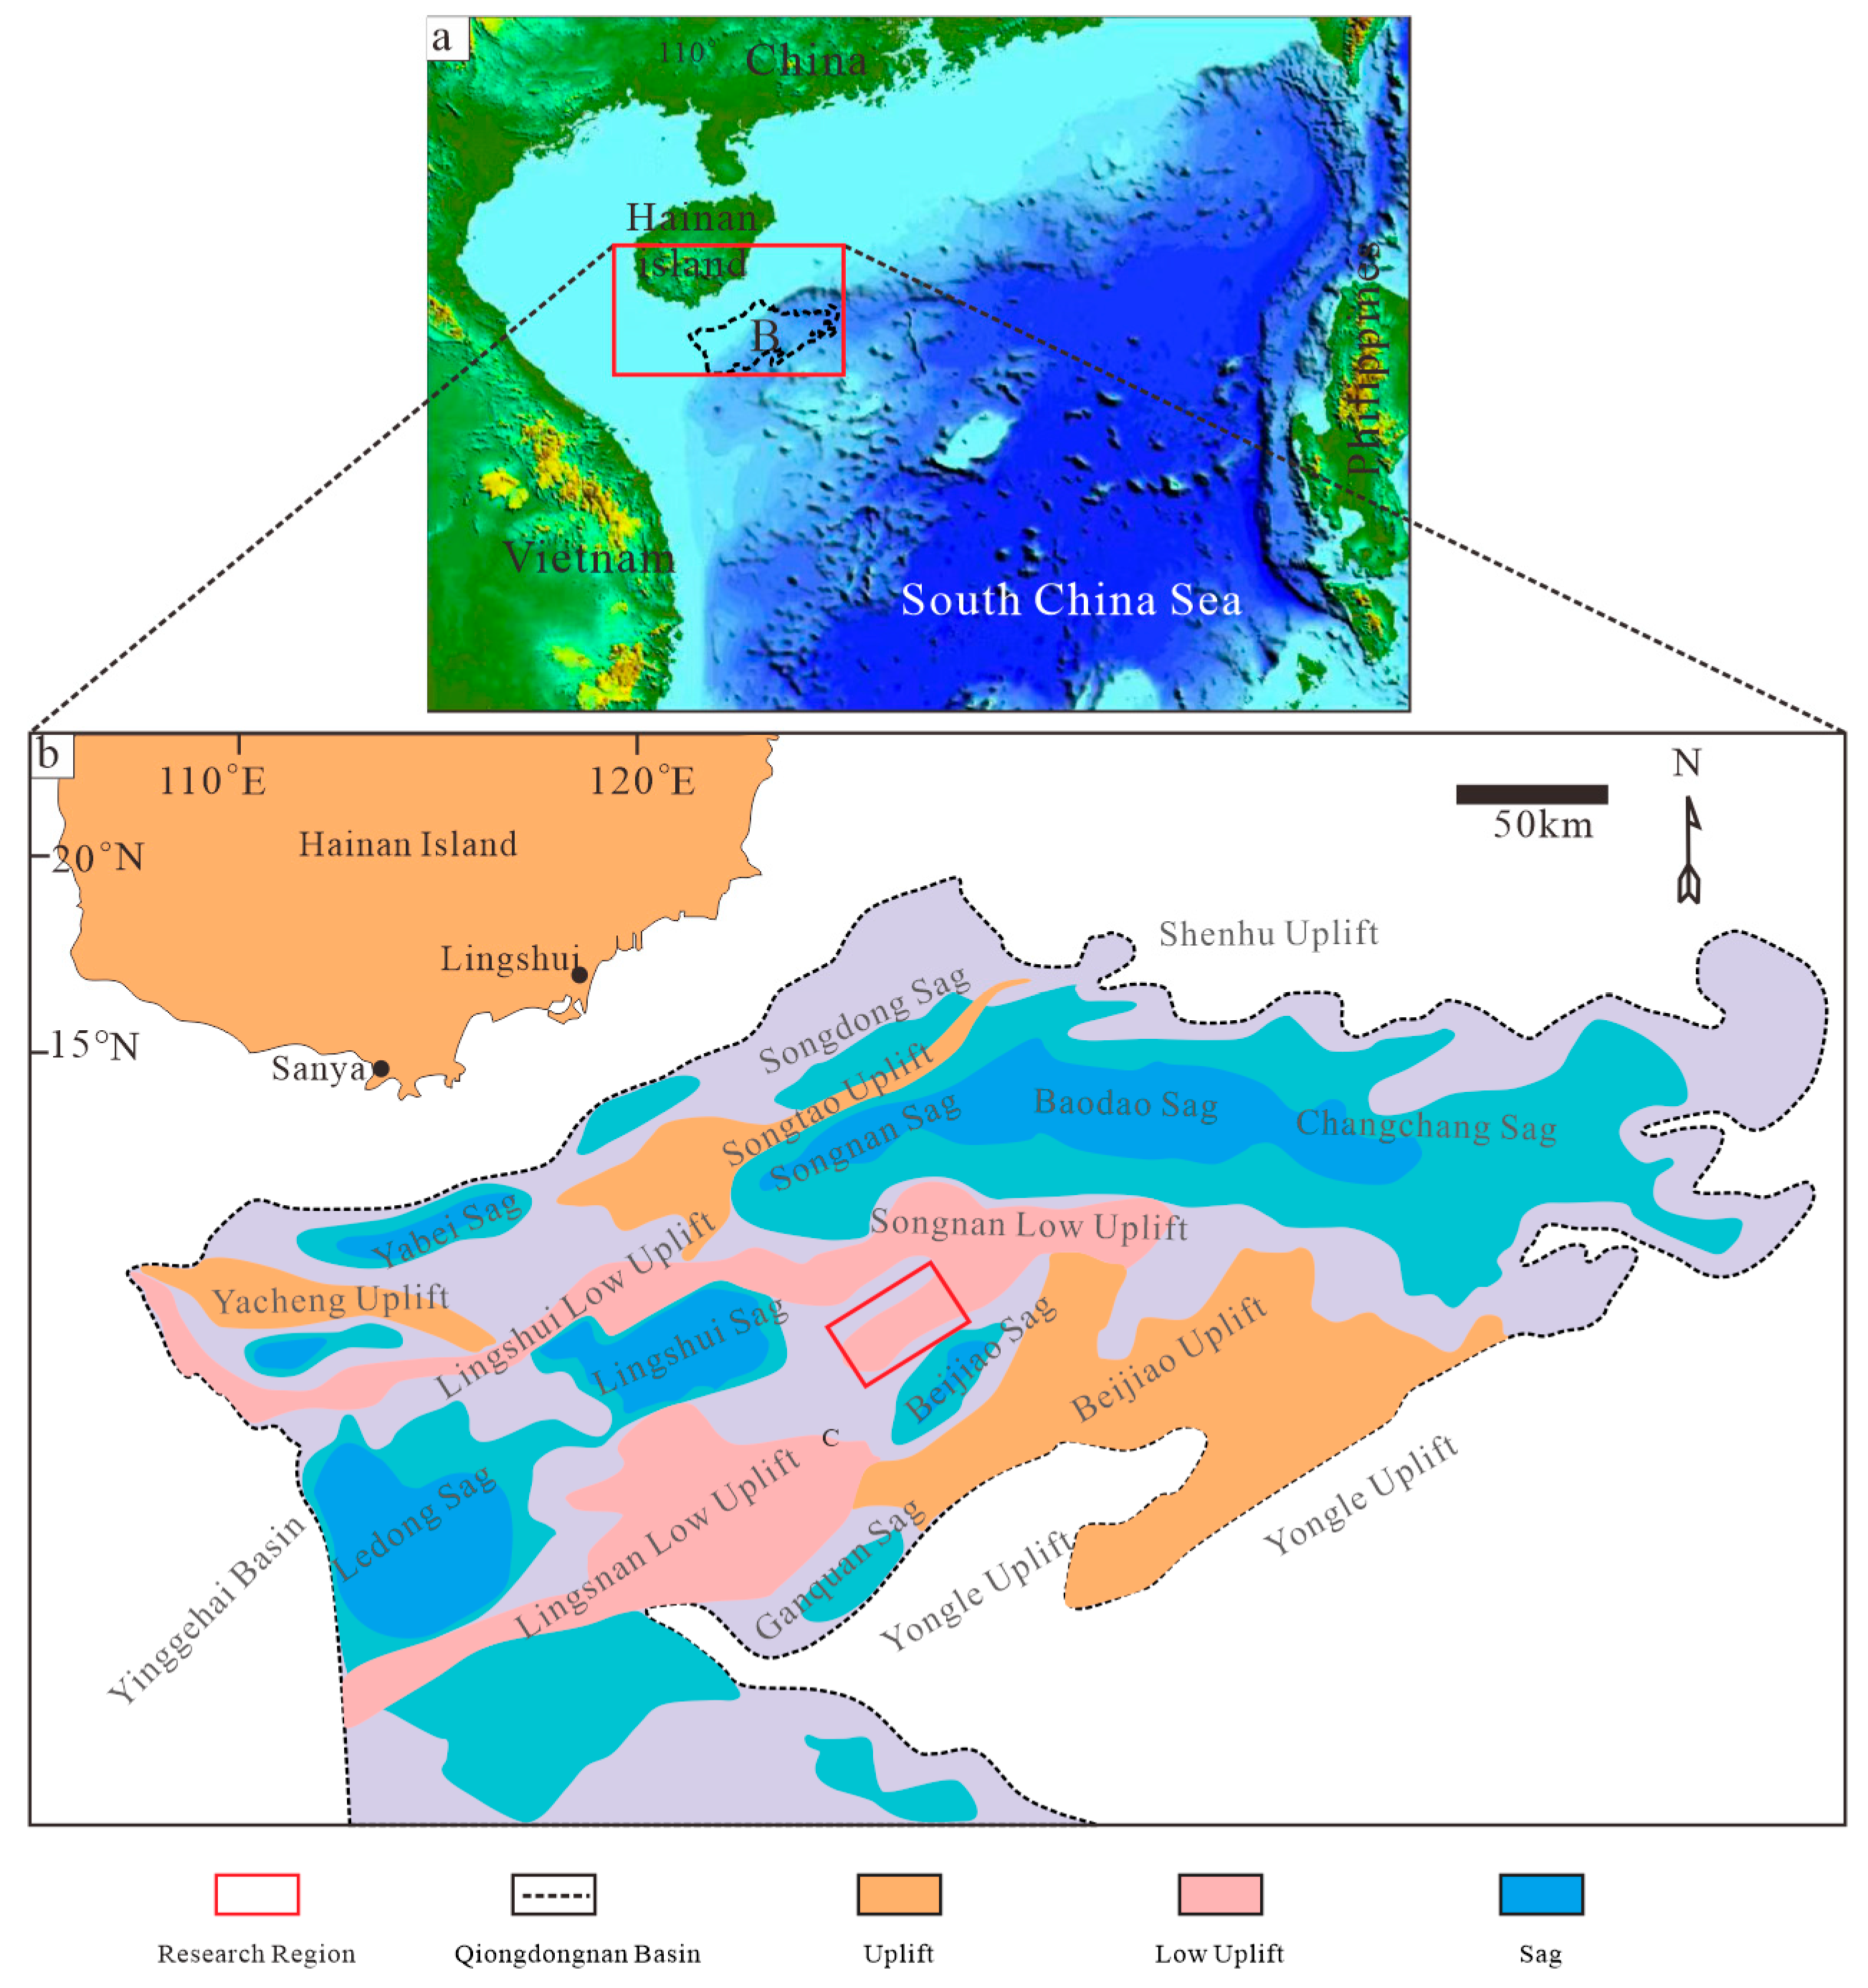
2.1. Geologic Background

The Qiongdongnan Basin is situated across the continental shelf and slope regions, adjacent to the Xisha Islands and the Zhongjiannan Basin to the south, the Shenhu Dark Sand Uplift and the edge of the Yinggehai Basin to the west, and the Hainan Island Uplift to the north [25,26]. The basin extends northeast in an overall direction of approximately NE60°. It is recognized not only as a significant potential region for natural gas hydrates but also as a crucial area for conventional oil and gas accumulation in China [27,28,29]. The structural characteristics of the Qiongdongnan Basin are illustrated in Figure 1. As illustrated in Figure 2, Due to their similar geological backgrounds and tectonic activities, the basin and the Pearl River Mouth Basin exhibit significant similarities in Cenozoic stratigraphic sedimentation. The basin has undergone continuous sedimentary processes, beginning with the Eocene continental Lingtou Formation, followed by the Lower Oligocene transitional Yacheng Formation and the Upper Oligocene shallow marine Lingshui Formation [30]. During the Neogene depression phase, the basin experienced continuous sedimentation variations from shore shallow marine facies to deep sea facies, with an increasing depth of seawater. The sedimentary sequence from this period include the Lower Miocene Sanya Formation, the Middle Miocene Meishan Formation, the Upper Miocene Huangliu Formation, and the Pliocene Yinggehai Formation [31].
The hydrate test area in the Qiongdongnan sea region is situated in the southeastern part of Hainan Island, on the northern slope of the South China Sea, and to the northwest of the Xisha Islands. This region is situated within the Qiongdongnan Basin, characterized by water depths ranging from 300 m to 2600 m, covering an approximate area of 3.28 × 10⁸ km2. The study area is positioned within the Songnan low uplift of the Qiongdongnan Basin, located approximately 646 km from Guangzhou and 177 km from Sanya, Hainan Province. The seabed exhibits a relatively flat profile, with water depths varying between 1600 and 1830 m, gradually increasing from west to east. The overall topography is elevated in the west and distribution towards the east, featuring a gentle slope (Figure 3).
Within this region, well W07 has demonstrated the presence of a sandstone hydrate accumulation zone. Notably, both hydrate and natural gas are found within the same sand layer, approximately 130 m beneath the seabed at well W07, which is characterized by the deposition of a natural river dike. The reservoir is situated in the Songnan low uplift, adjacent to the hydrocarbon-rich sub-depression in the eastern region of the Lingshui depression.
Previous studies have indicated that gas chimneys serve as primary conduits for fluid migration, linking deep gas sources to shallow hydrate layers, with the C2 content in the gas source reaching up to 20%. The gas chimney observed in the southeastern Qiongdongnan Basin is indicative of the upward migration of deep, high-temperature, and high-pressure fluids. This structure represents a novel type of geological structure primarily influenced by fractures formed under tectonic stress. The Qiongdongnan Basin exhibits favorable regional geological conditions for the formation of natural gas hydrates.

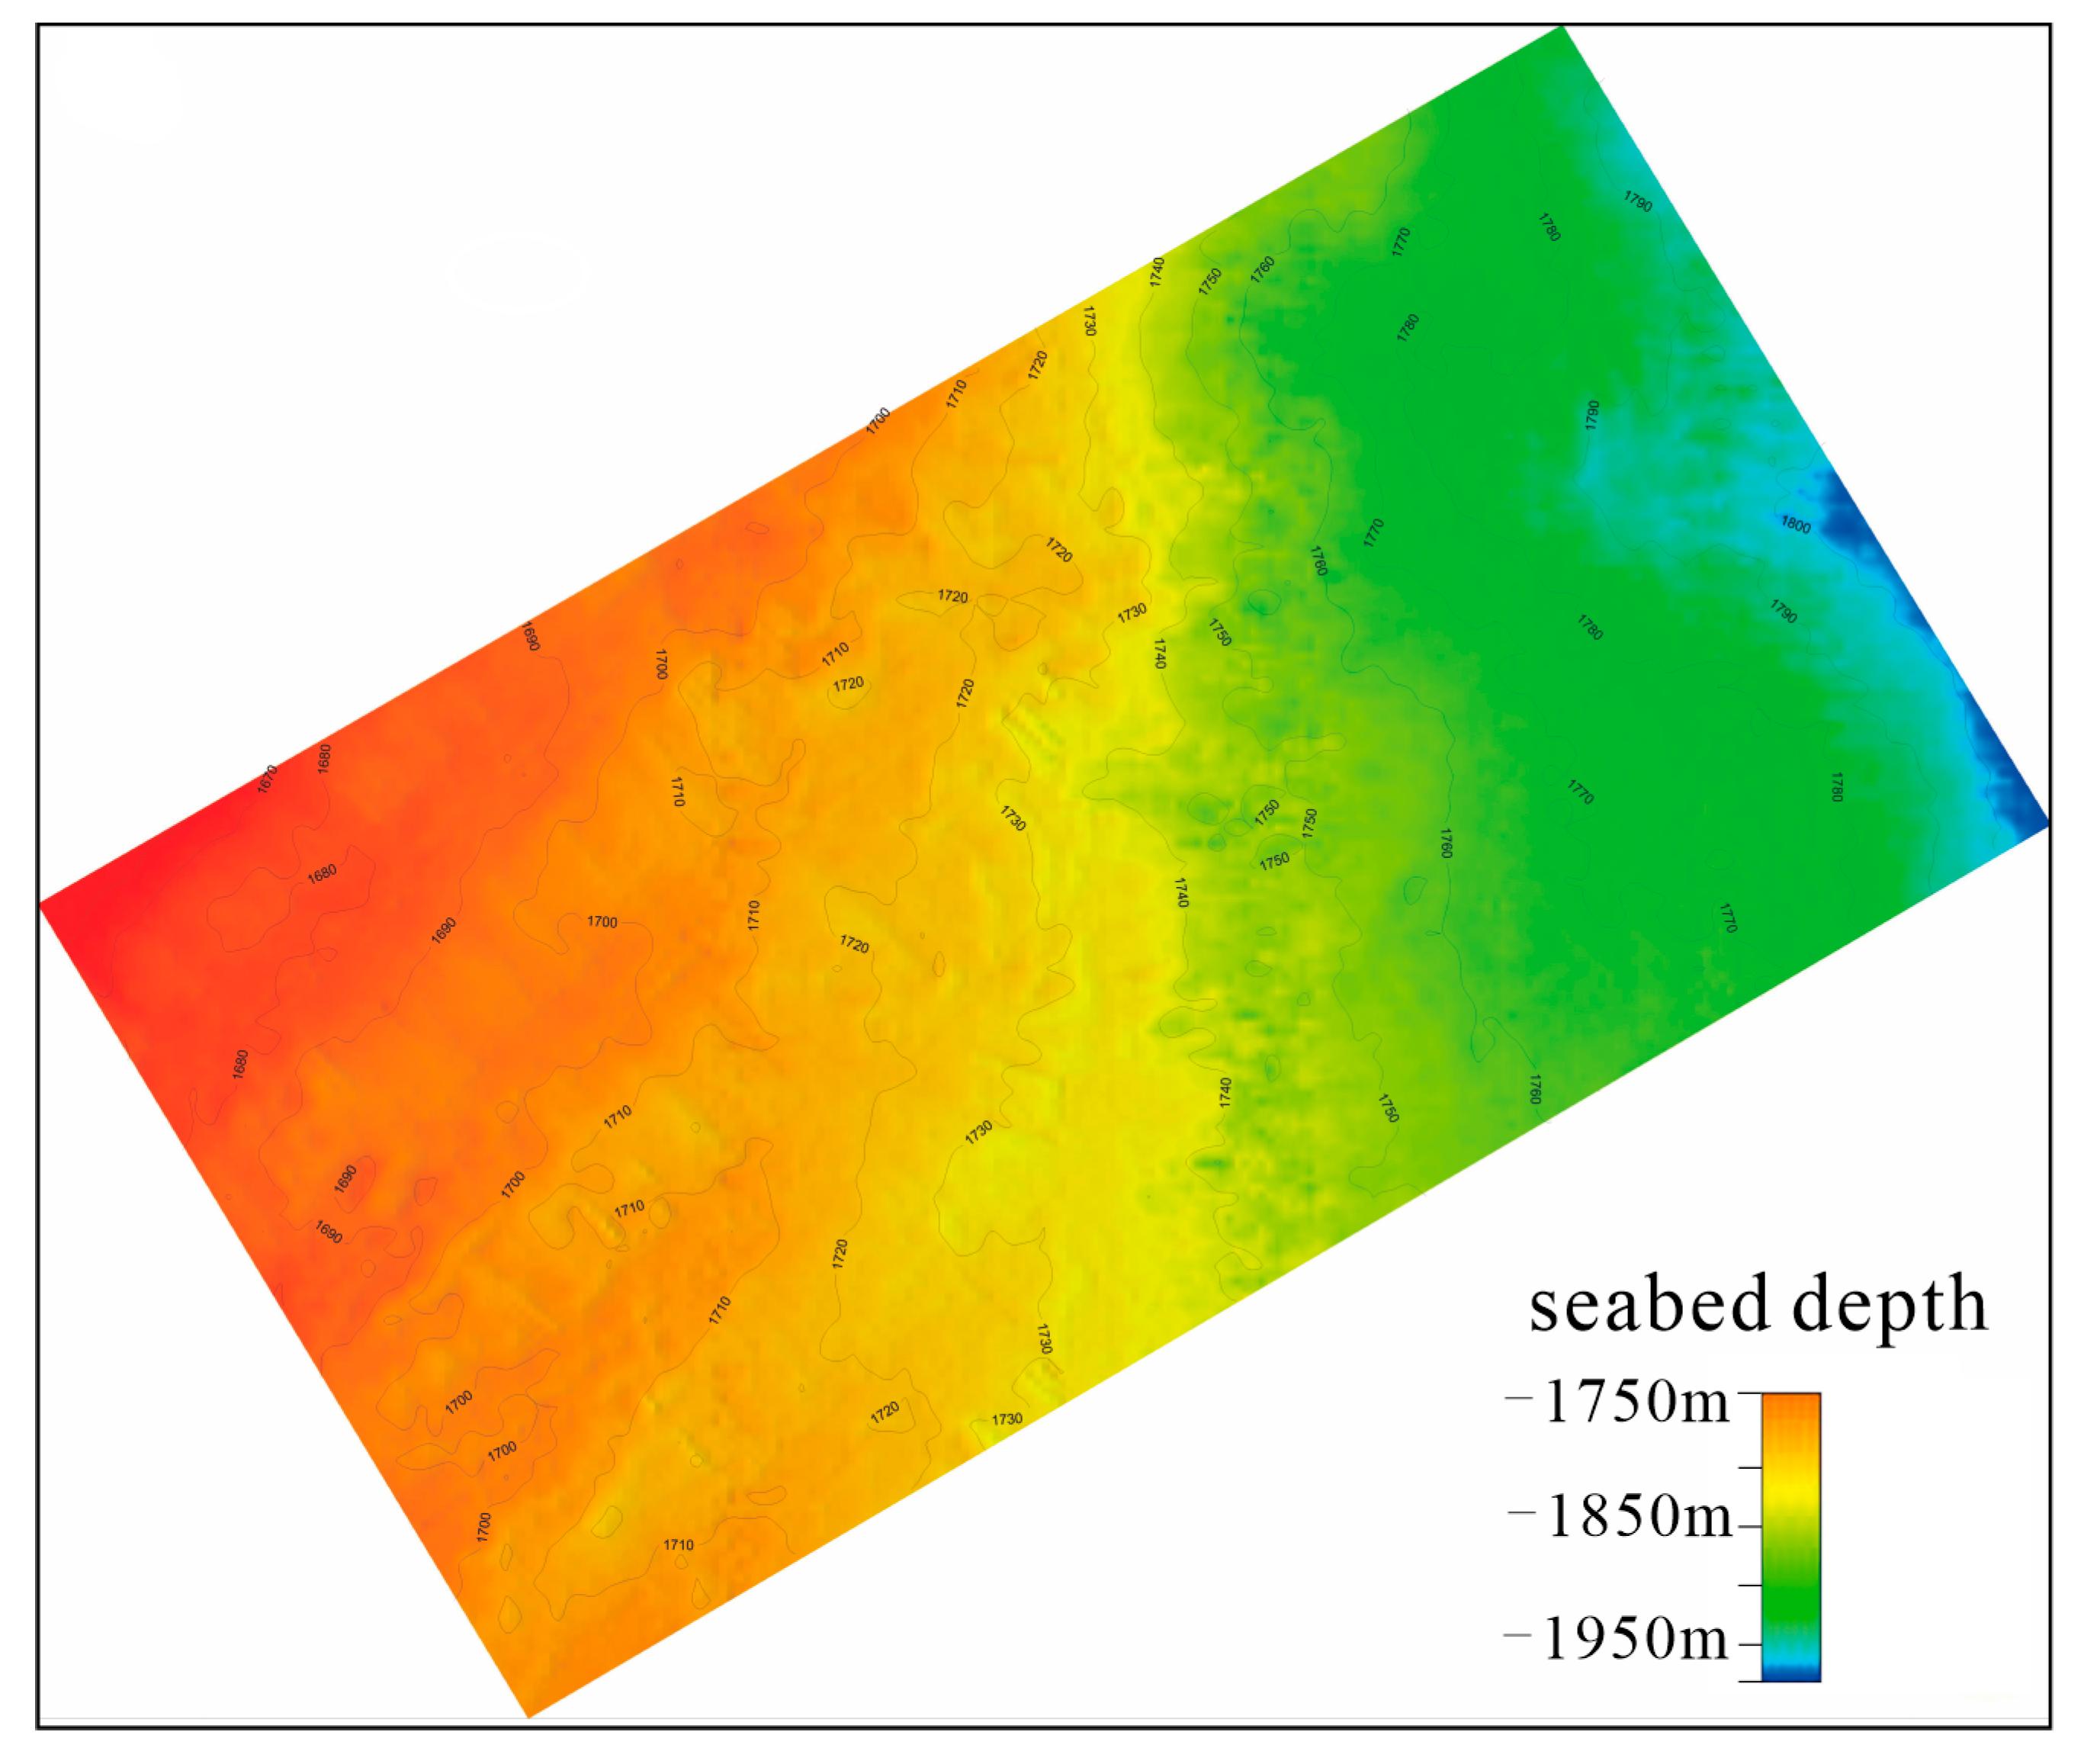
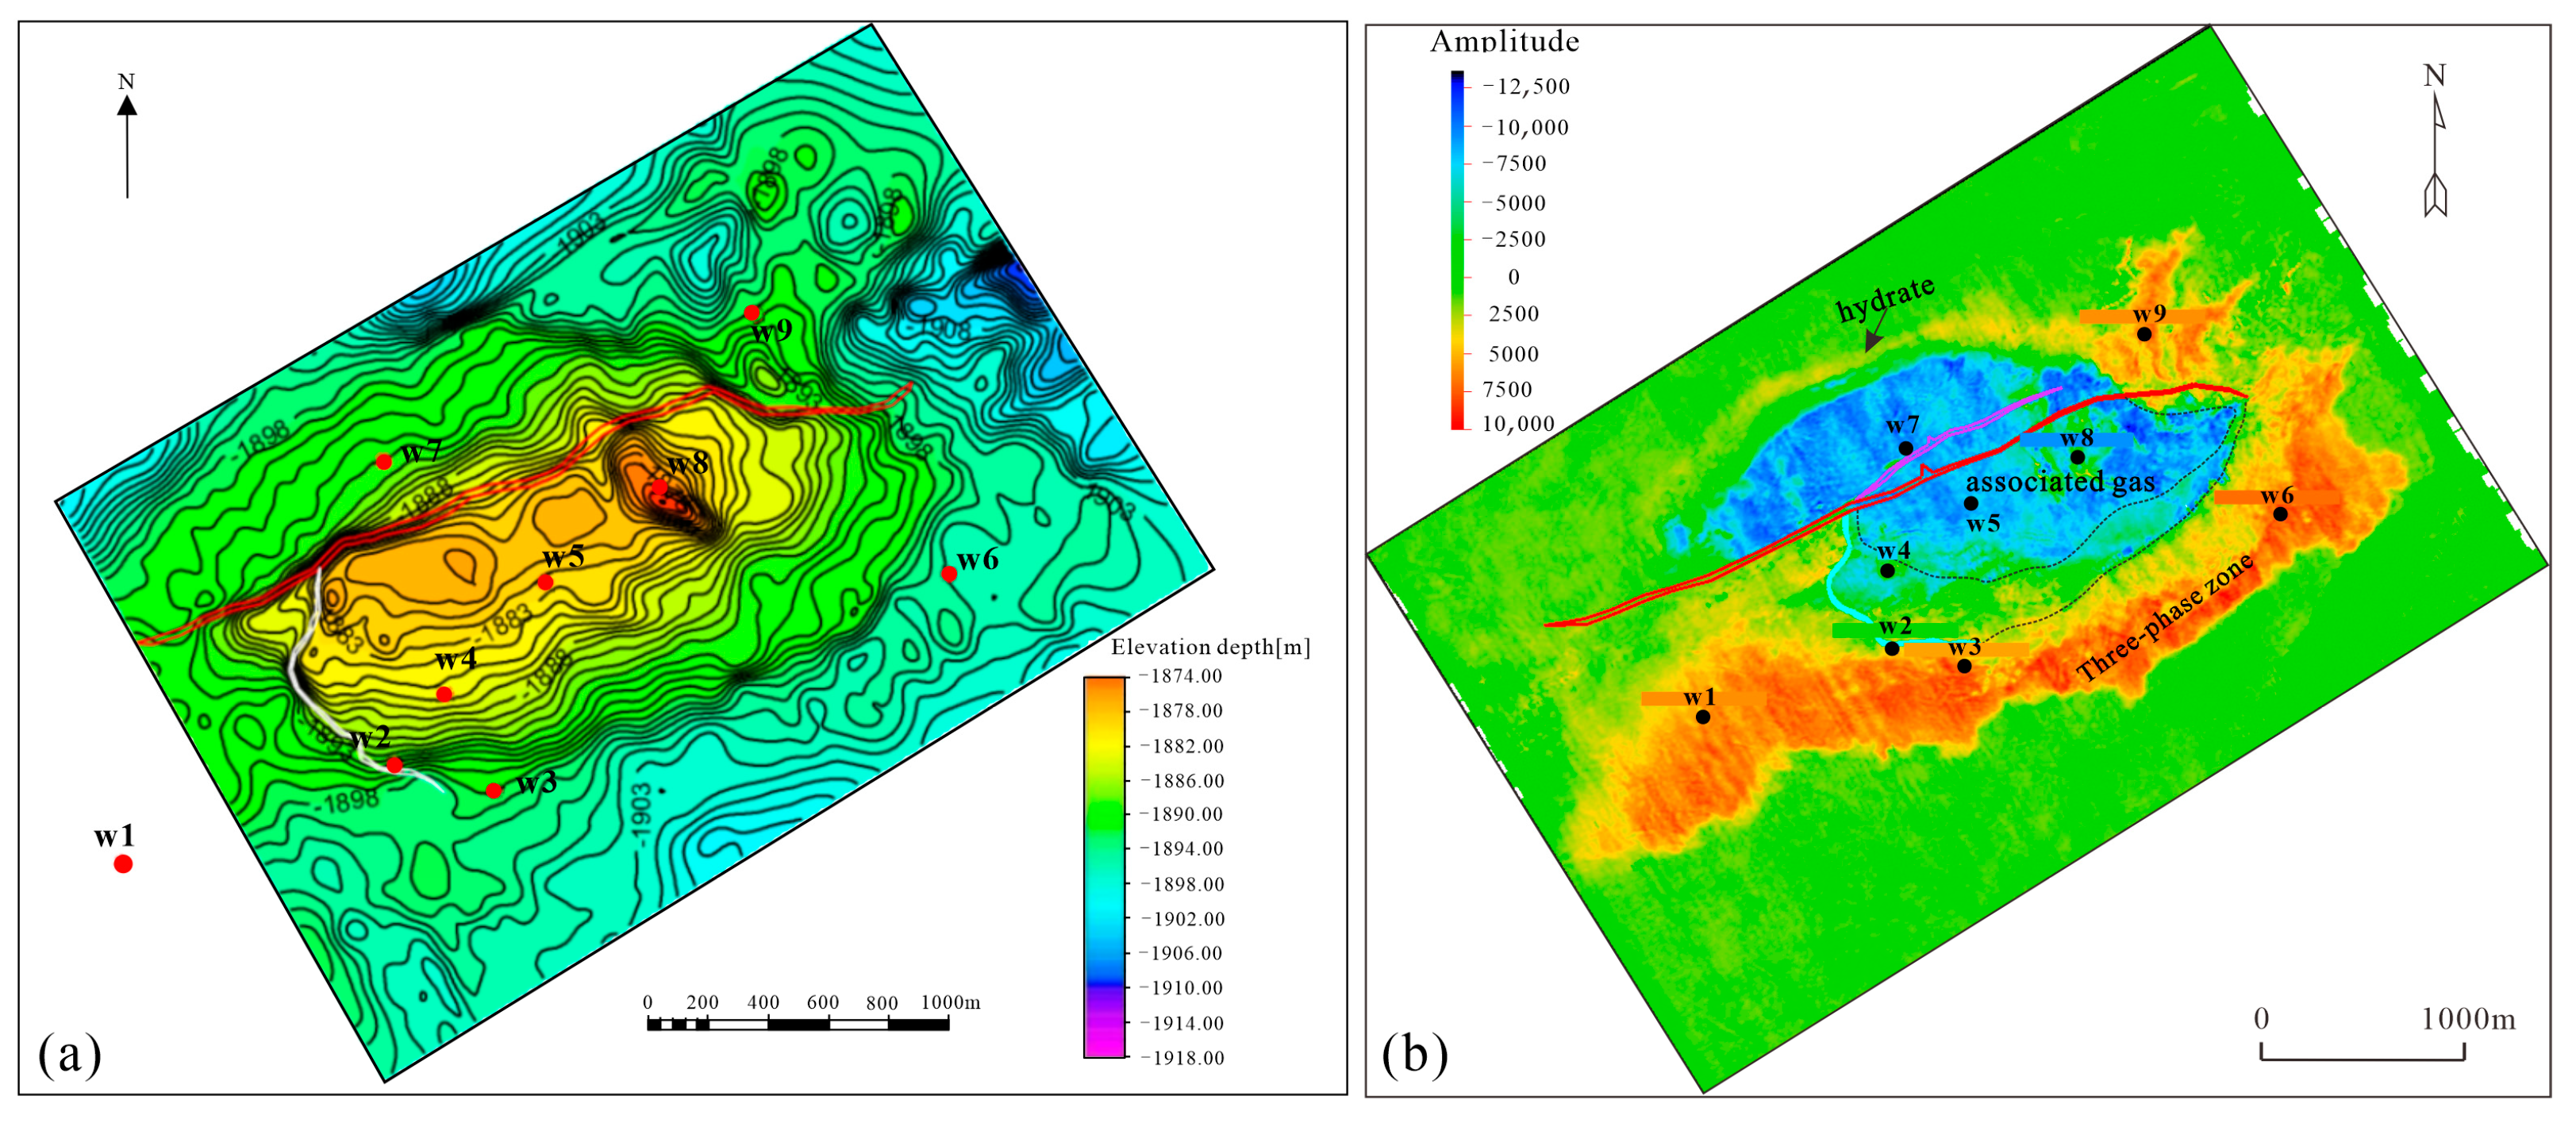
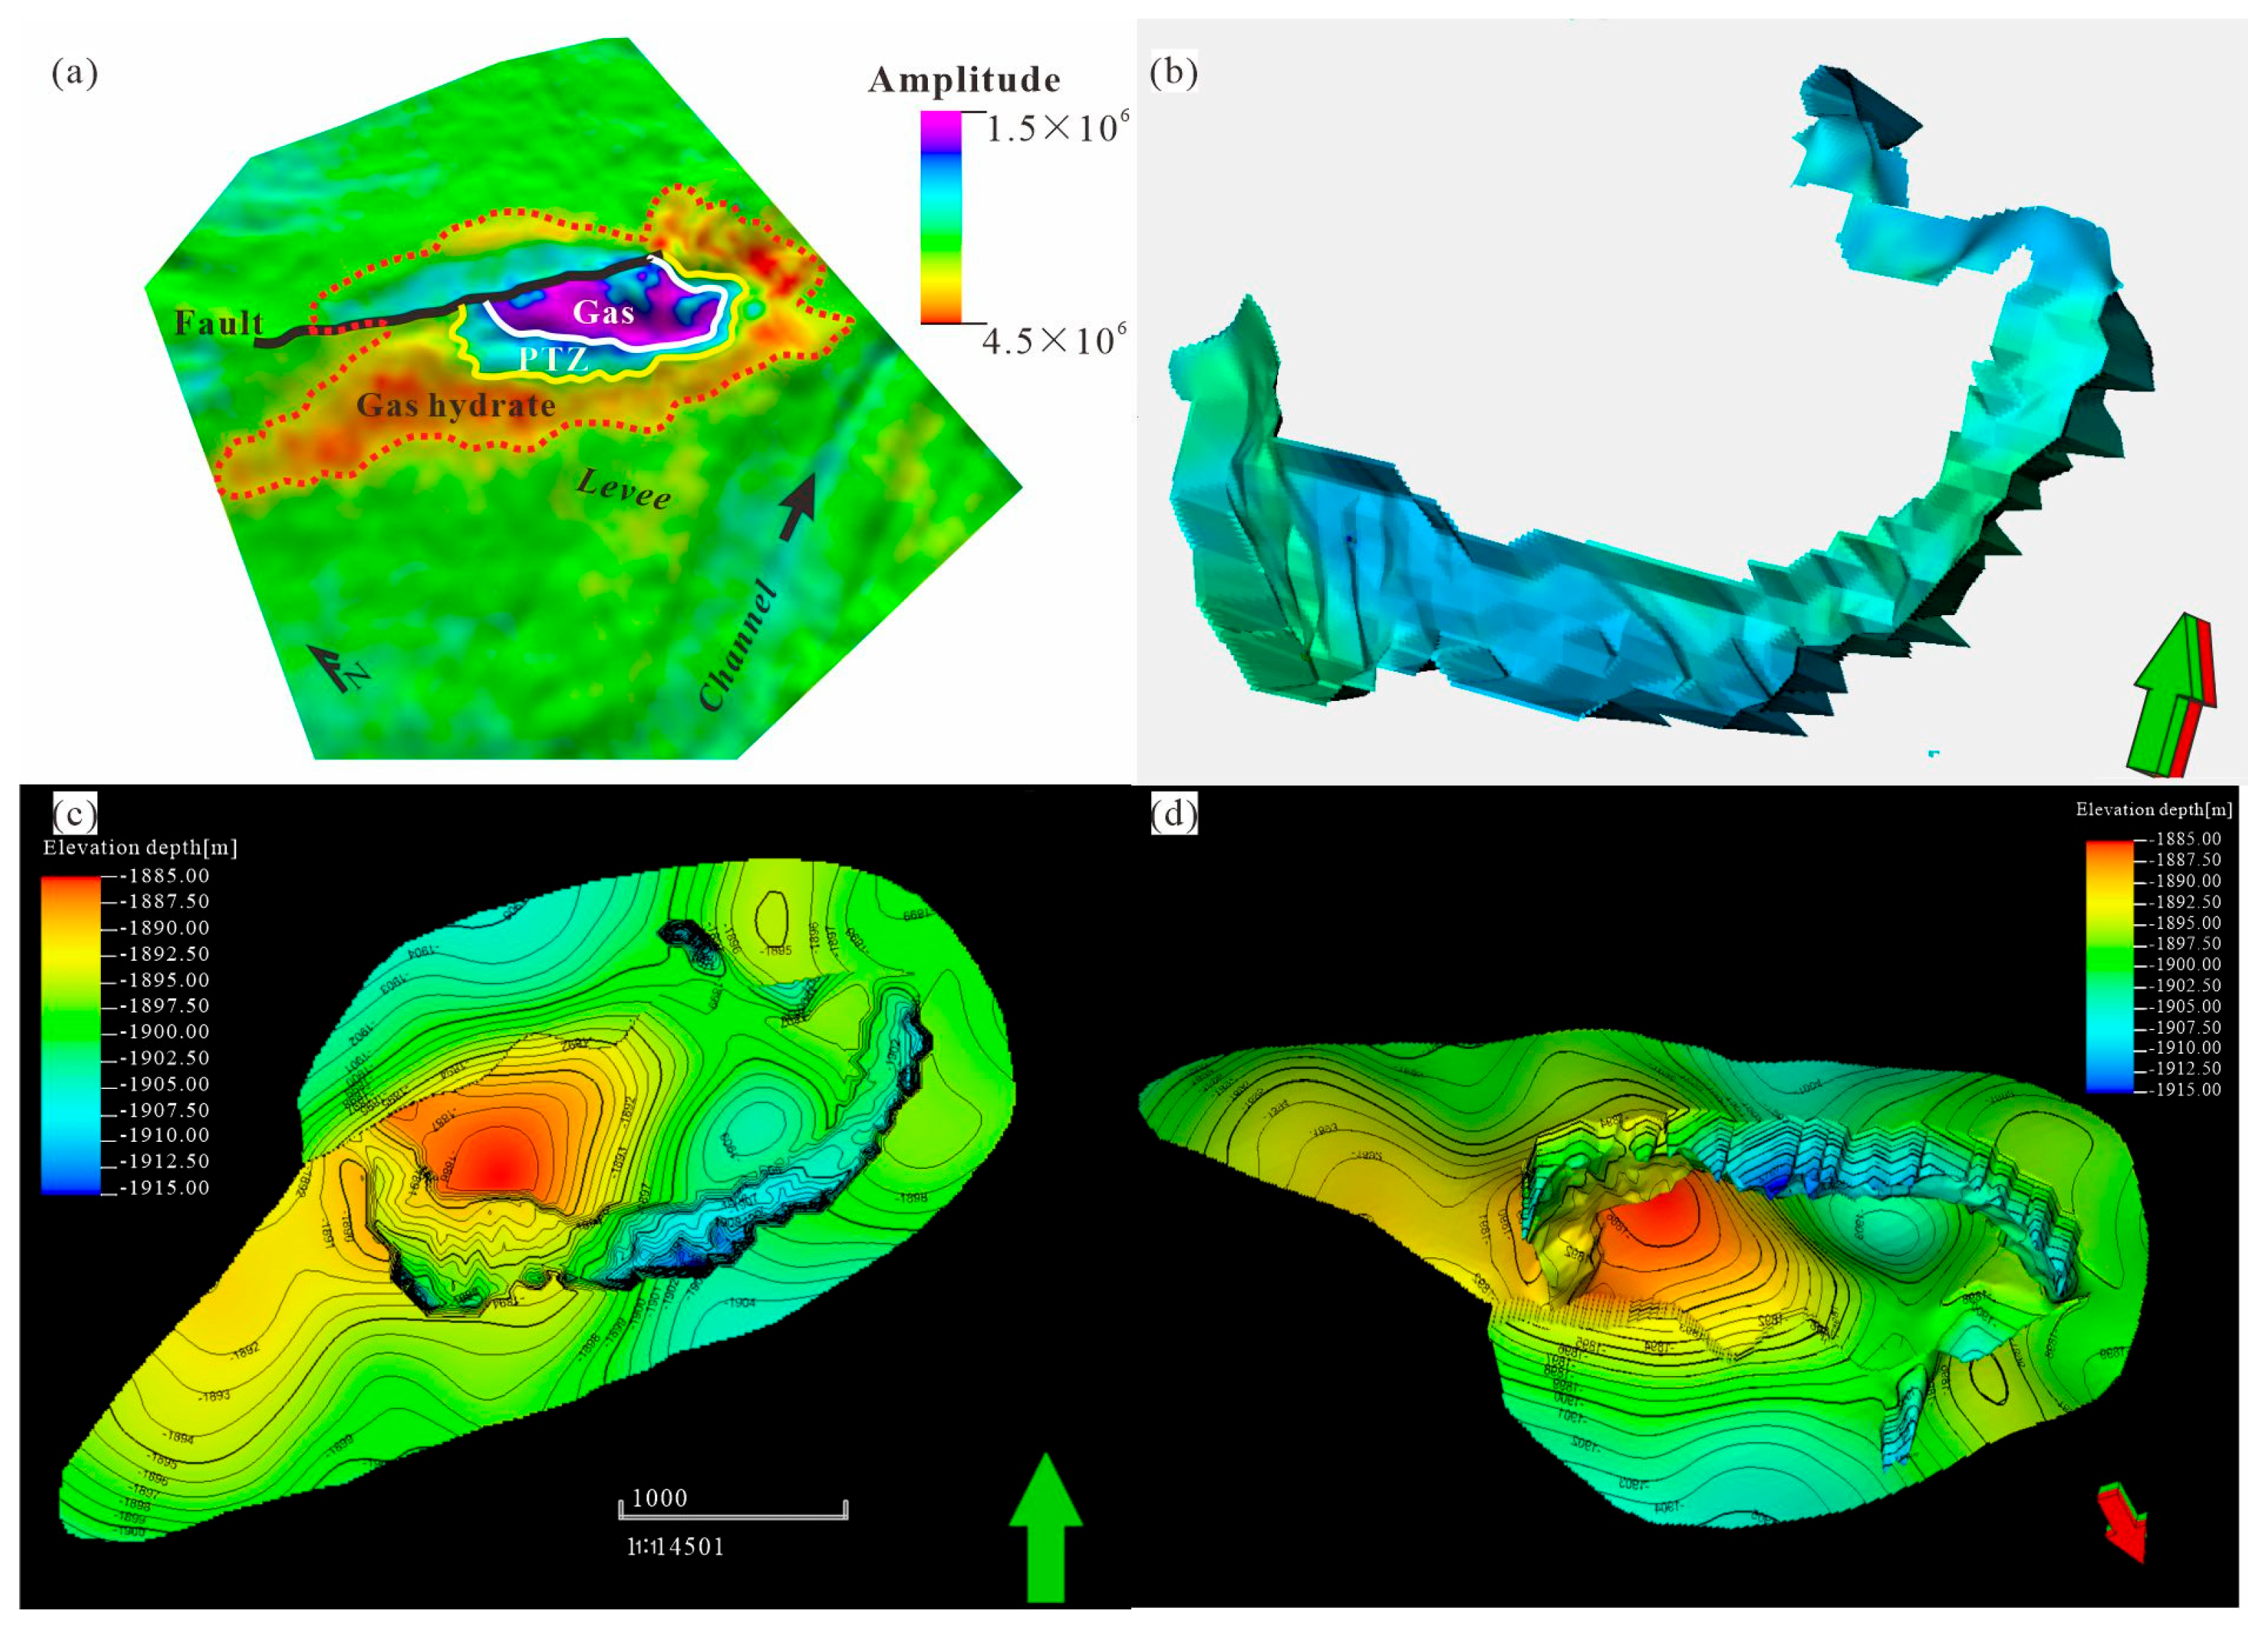
2.2. Distribution of Three-Phase Coexistence Zone

The study area contains a three-phase zone situated between a hydrate reservoir and a natural gas reservoir. The water depth in this region varies from 1745 to 1788 m. The depth of the simulated bottom simulated reflection (BSR) is observed to range from 1874 m to 1918 m, which corresponds to a depth of 97.5 m (mbsf) to 147.5 m (mbsf) below the seafloor. An analysis of the BSR indicates the presence of faults [34]. These faults extend approximately for 2.7 km, and in conjunction with the extinction lines, they create a geological trap with an estimated area of about 1.9 k2 [35] (Figure 4).

3. Material and Methods

3.1. Data

The seismic data utilized in this study was collected by the China National Offshore Oil Corporation (CNOOC) in 2017. This dataset includes offshore 3D seismic data, as well as extensive information gathered using Schlumberger’s SonicScope and proVISIONN (Houston, TX, USA) while drilling logging tools. The data encompass gamma measurements, wellbore diameter, resistivity, high-definition resistivity images, various micro-detection data, density, longitudinal wave time differences, transverse wave time differences, T2 spectrum, and pore structure. A comprehensive evaluation was conducted.

3.2. Method

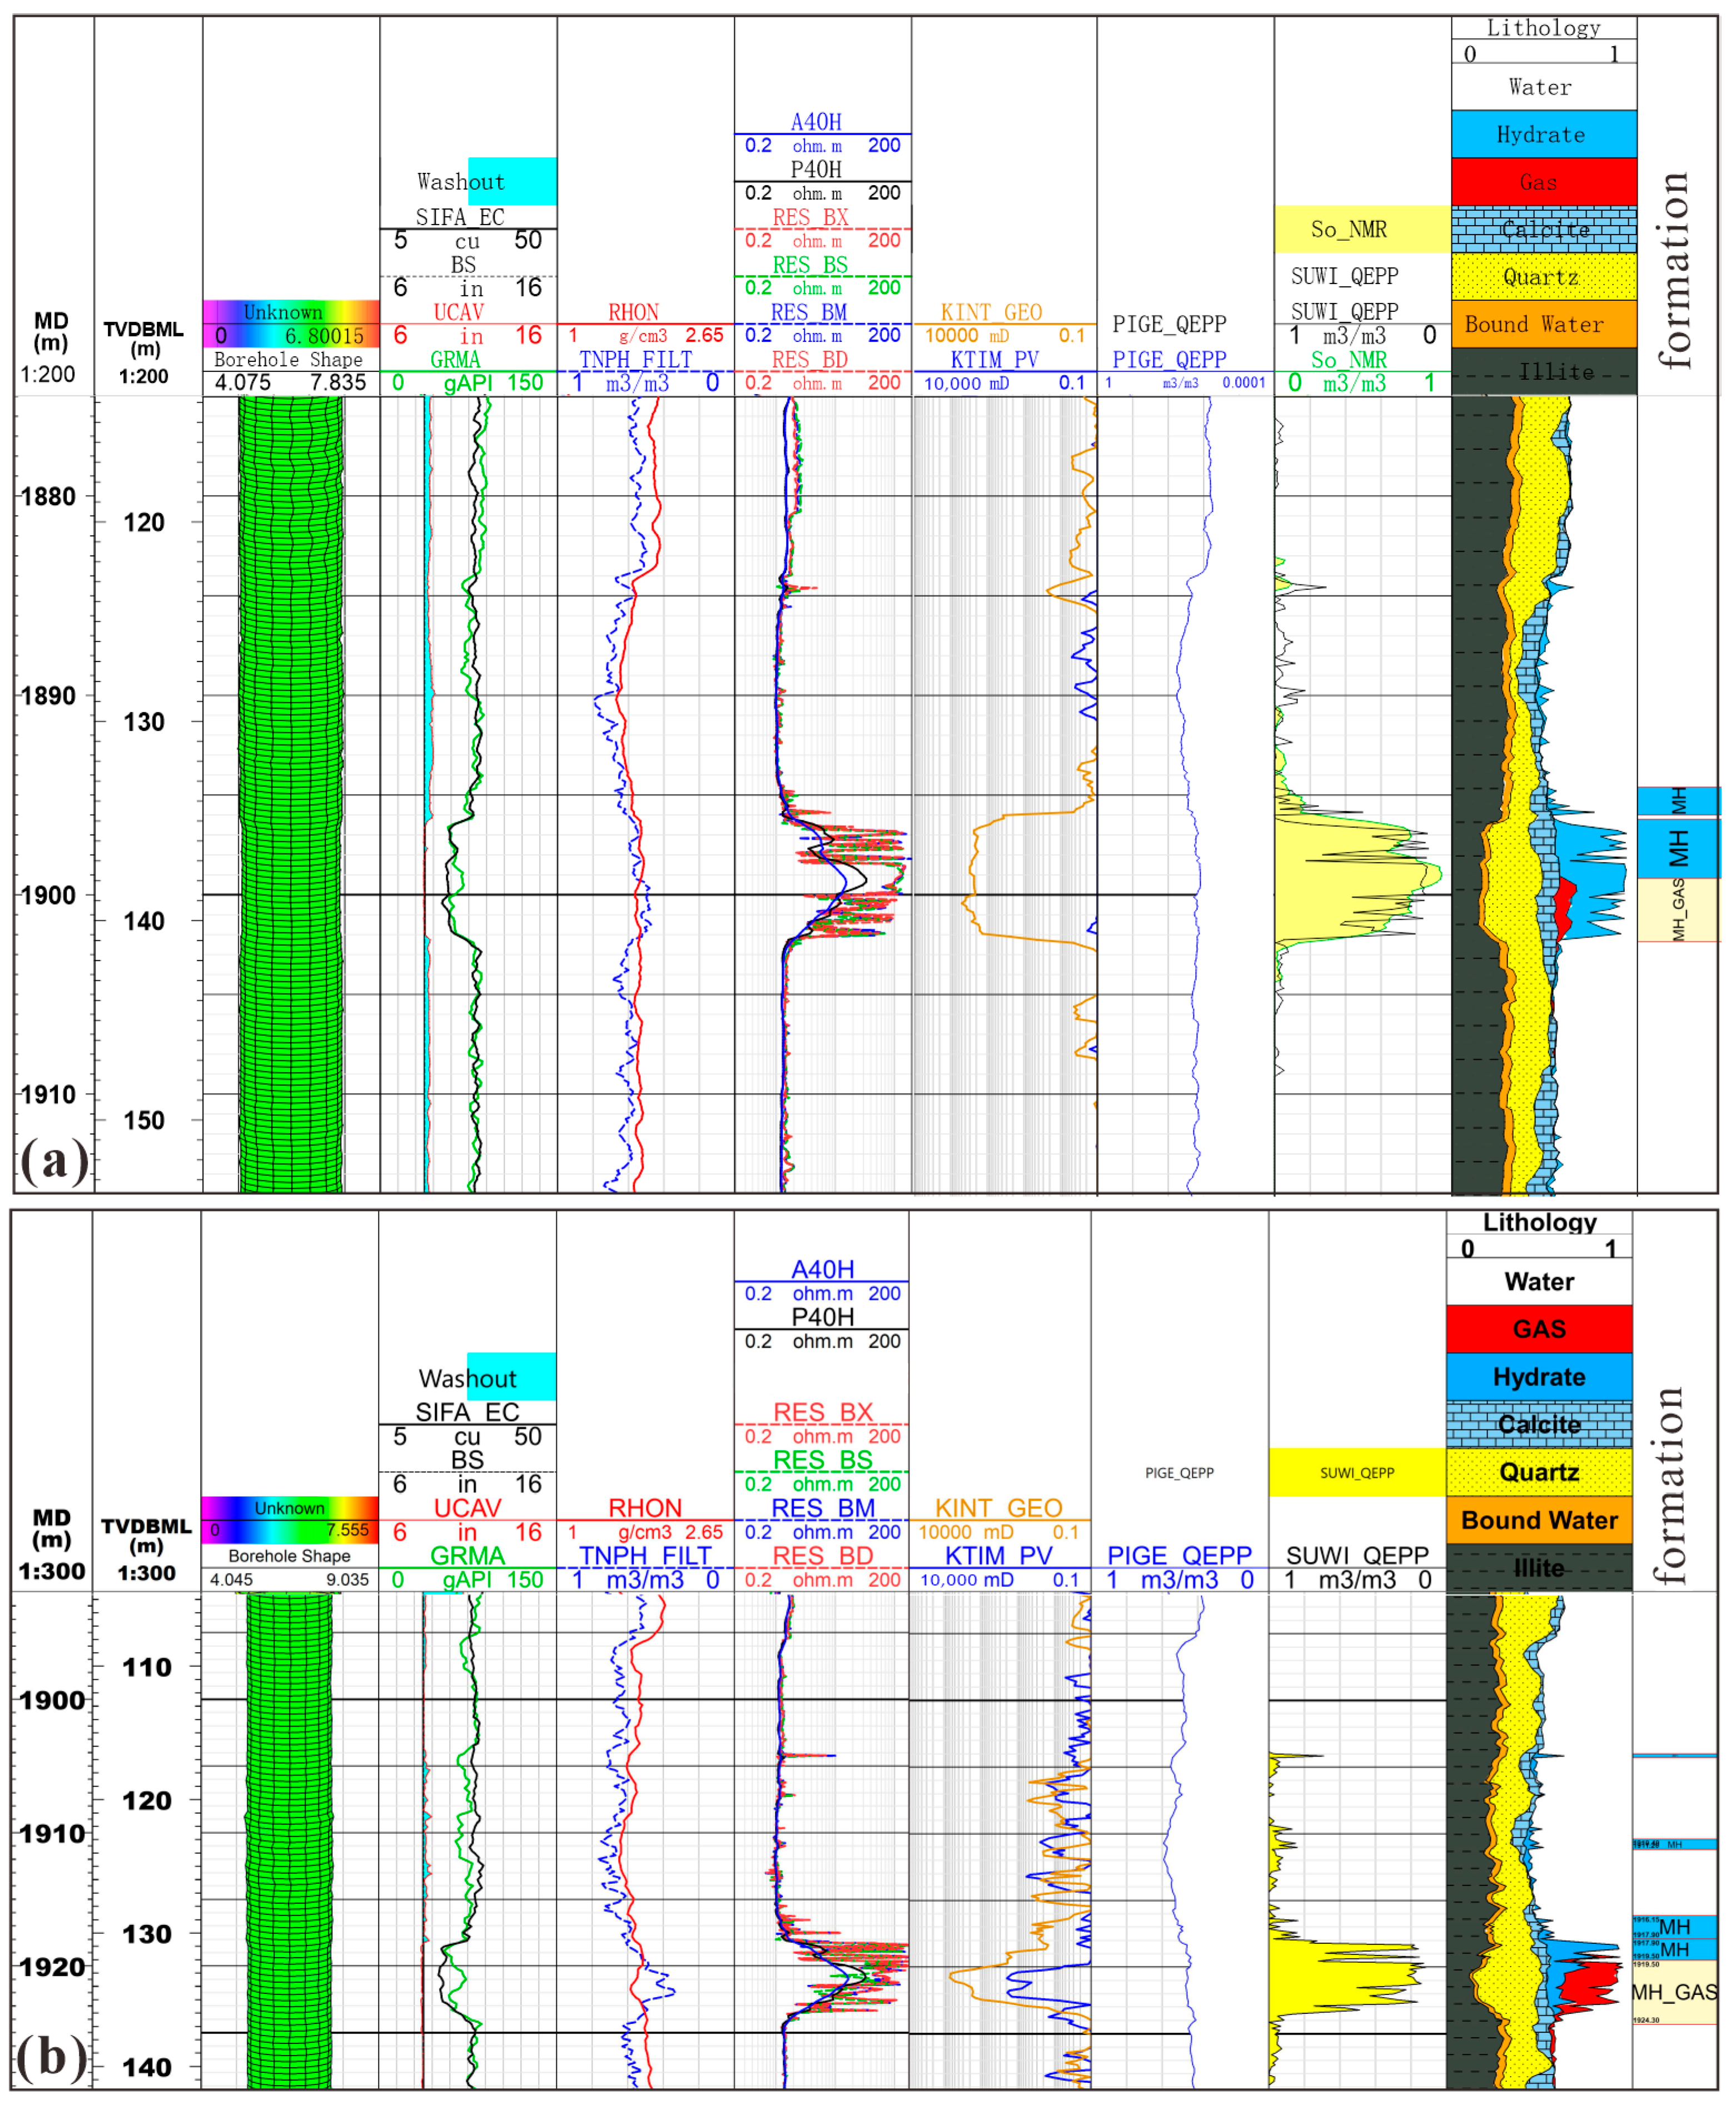
3.2.1. Logging Interpretation

By utilizing MicoScopeHD resistivity imaging for dip angle extraction, ELAN analysis, and acoustic longitudinal wave time difference extraction, we can determine the formation dip angle, as well as the development of fractures and micro faults. Conventional calculations of hydrate saturation and permeability are then performed. Following this, we extract acoustic and transverse wave time differences, conduct element energy spectrum extraction and Sigma processing, and analyze nuclear magnetic data to assess porosity and permeability. An accurate analysis of the ELAN lithology model is based on the element capture energy spectrum, and hydrate saturation is calculated using a combination of density and nuclear magnetic data. This approach not only allows for the identification of the mineral category and dry weight of the formation but also enables precise calculations of hydrate saturation and permeability, thereby enhancing the accuracy of the results.

3.2.2. Seismic Interpretation and Inversion

This study utilized the Geoframe software (2012) to interpret three-dimensional seismic data. Based on the characteristic that the top interface of hydrates produces a positive reflection while the top interface of gas layers generates a negative reflection, the top and bottom interfaces of two sets of sand layers and faults within the ore body were identified. By employing post-stack impedance and pre-stack AVO inversion, the distribution range of hydrates and free gases was clearly delineated.

3.2.3. Geologic Modeling

The geological characteristics of the seabed within the study area are as follows: in this region, only two wells, identified as W2 and W4, exhibit features that suggest the presence of a three-phase zone. In order to enhance the accuracy of the model representing the three-phase coexistence zone, this study employed a deterministic modeling approach that integrates the dense sampling characteristics of seismic and well data in both vertical and horizontal dimensions.
(1)
The logging data from wells W1 to W9 have been subjected to correction processes. A band-pass filtering technique has been applied to reduce errors in the logging data, followed by environmental corrections. In sections lacking a density curve, a phase-controlled density prediction method has been utilized to estimate the density curve for subsequent calibration with seismic data [36].
(2)
A deep time conversion of the logging data has been executed, wherein non-equidistant logging data in the time domain have been interpolated to generate an equidistant curve. Following this resampling, a time sampling reflection coefficient sequence that corresponds with the seismic data has been derived.
(3)
A sand body distribution model has been developed through geostatistical methods, integrating lithological data derived from well information and seismic inversion.
(4)
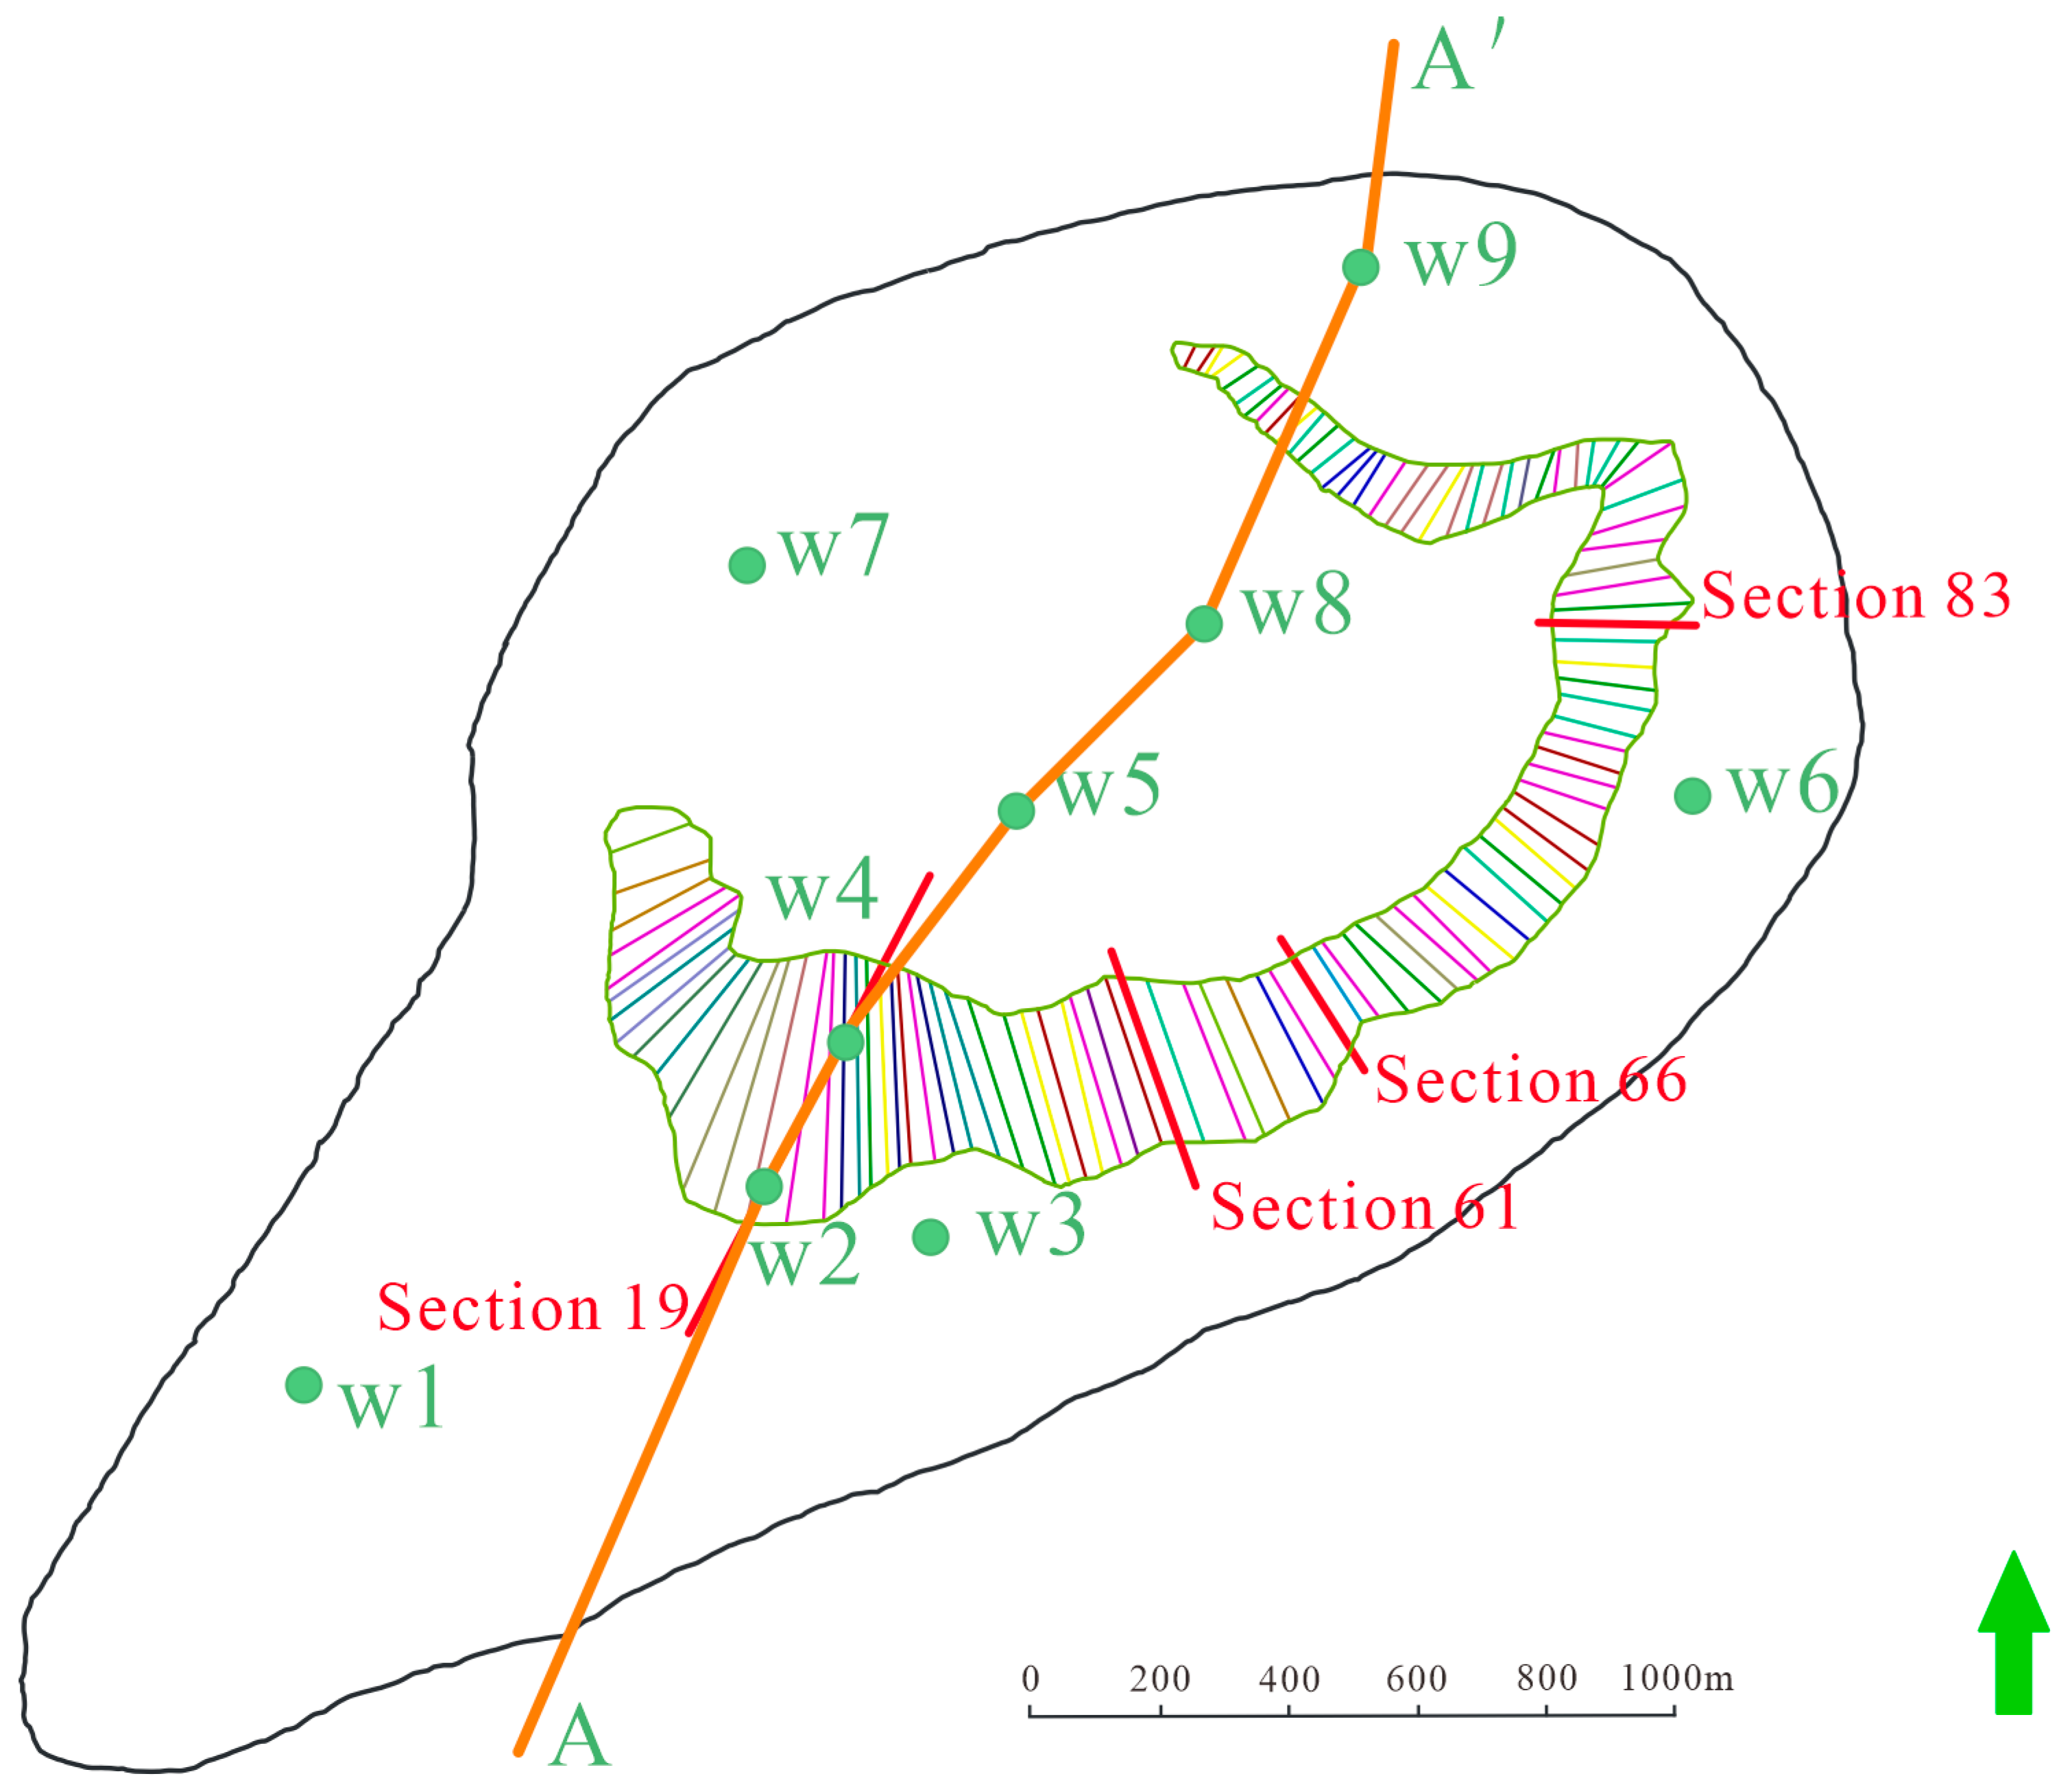
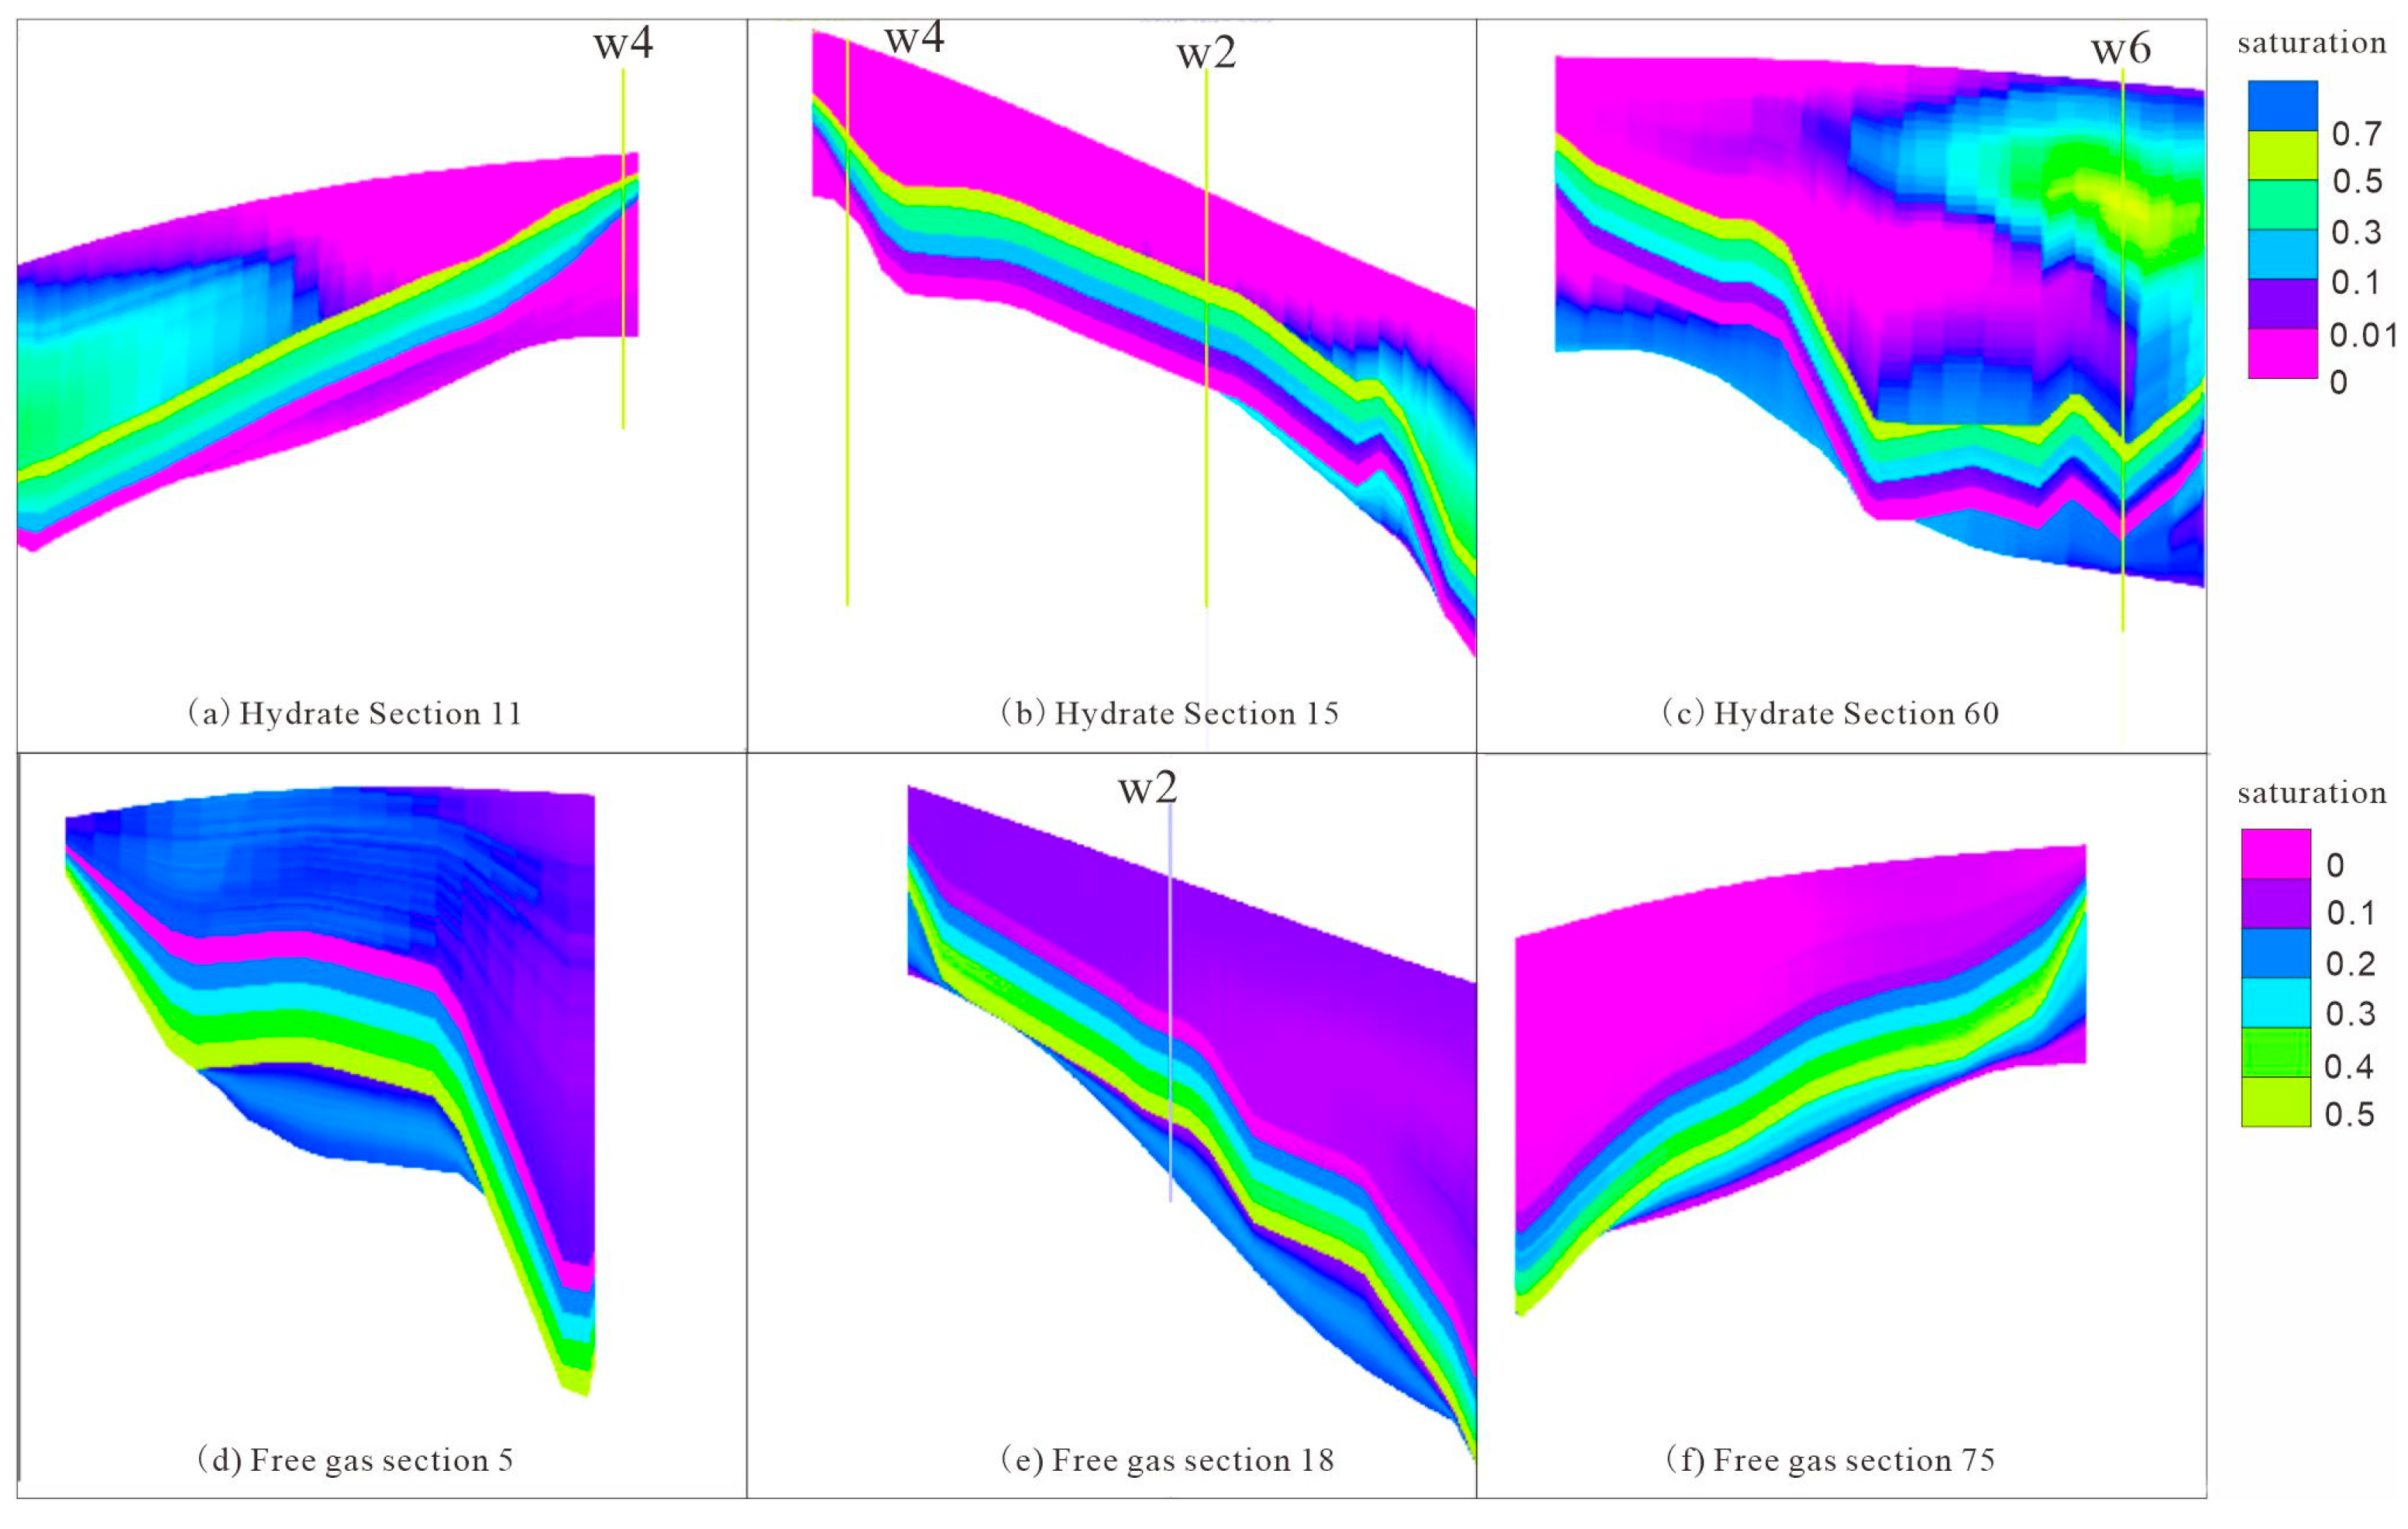
The morphological plane model of the three-phase coexistence zone has been established within the study area. Section interpretation has been employed to mitigate the influence of intricate geological conditions on model accuracy. A total of 105 sections have been examined throughout the three-phase zone, leading to the development of porosity and saturation models for hydrate and free gas.

4. Results

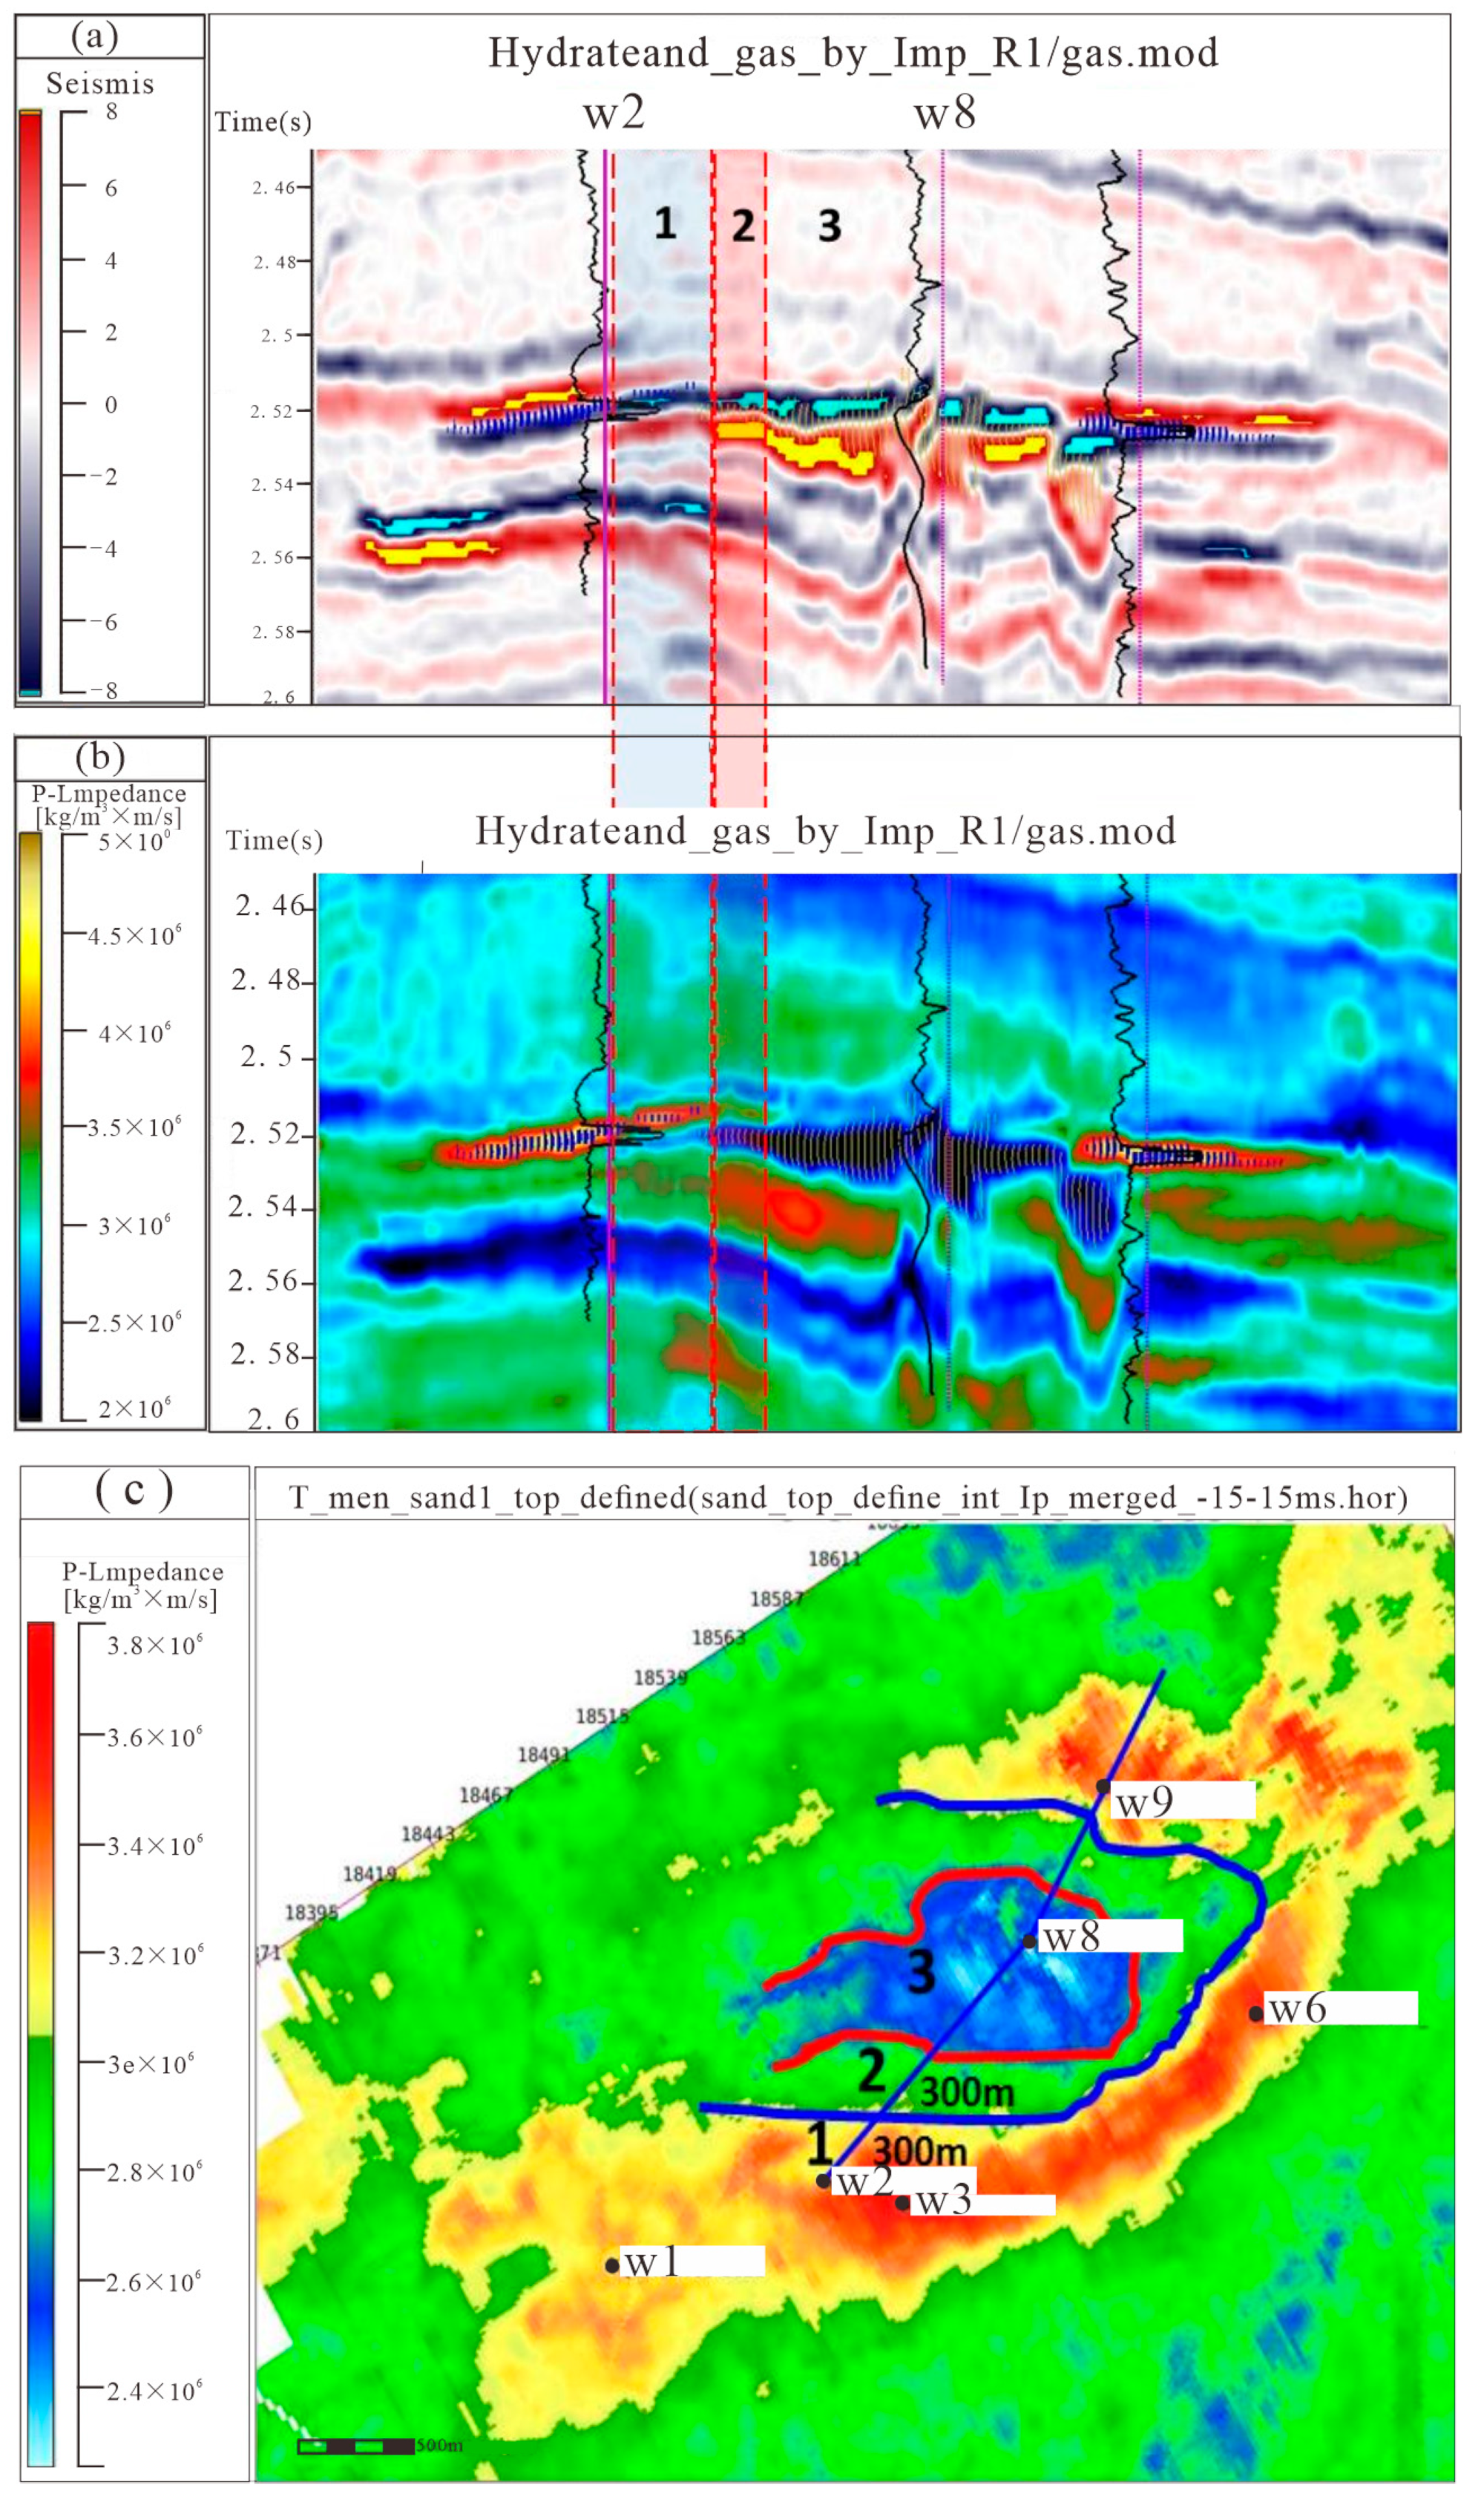
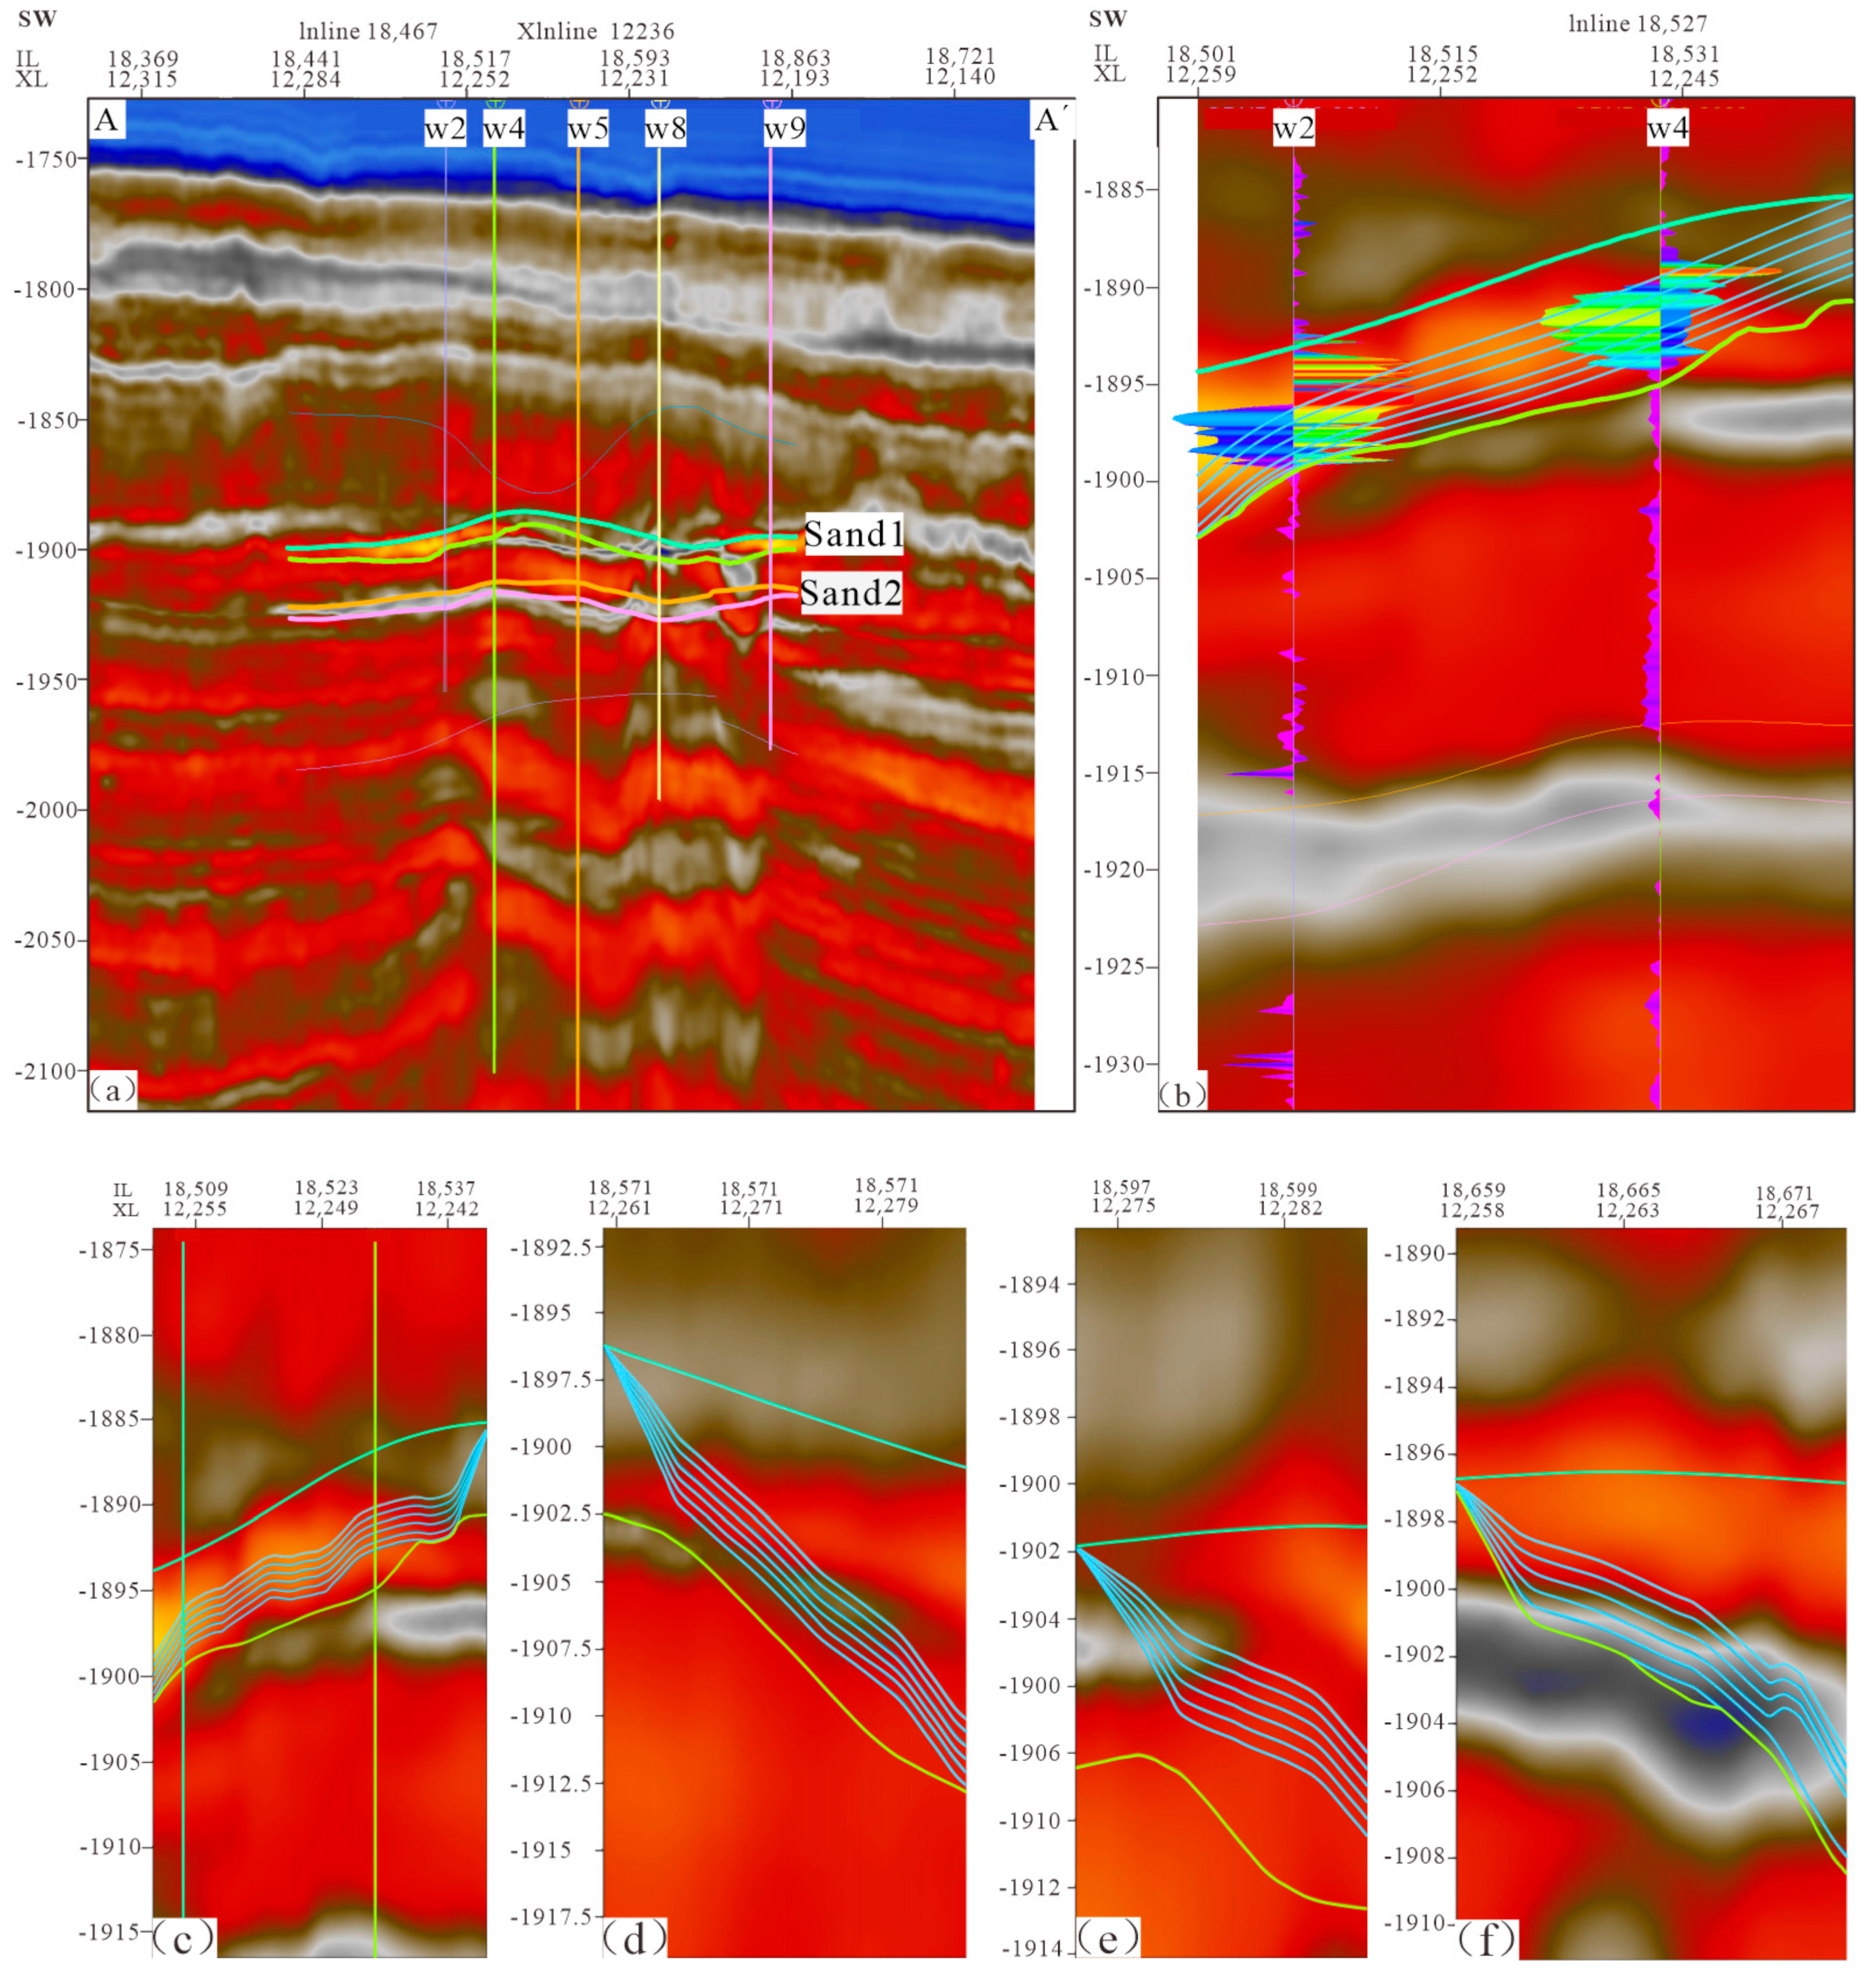
4.1. Well-Seismic Interpretation and Calibration of Three-Phase Coexistence Zone

In the reservoir evaluation map for well W2, the analyzed interval spans from 1899.1 to 1902.3 m. Within this interval, there is an observed increase in resistivity, a decrease in P-wave transit time, a significant reduction in nuclear magnetic porosity, a decline in neutron measurements, a slight decrease in density, an inversion in neutron density, and a reduction in sigma gamma values. Based on a comprehensive analysis, it is concluded that this layer represents a zone of coexisting hydrate and gas. The thickness of this layer is measured at 3.2 m, with an average effective porosity of 43.7%. The average hydrate saturation, as determined by the resistivity method, is calculated to be 54.6%, while the gas saturation is estimated at 16.0% (Figure 5a).
The detailed reservoir evaluation of the W4 well indicates that within the depth range of 1919.5 to 1924.3 m, there is an observed increase in resistivity, a slight decrease in nuclear magnetic resonance, a reduction in neutron measurements, and a minor increase in density. This comprehensive analysis suggests the presence of a layer characterized by the coexistence of hydrates and gas, with a total thickness of 4.8 m and an average effective porosity of 44.8%. Furthermore, the average saturation of hydrates and gas, as determined by the resistivity method, is calculated to be 72.5%, while the average permeability is assessed at 161.7 millidarcies (mD) (Figure 5b).
At present, the research domain in this area encompasses nine drilling wells. The results obtained from wave impedance inversion employing a traditional hard constraint are illustrated in Figure 6a [37].
As depicted in Figure 6b, the inversion results delineate a distinct three-phase coexistence zone of hydrates situated on the plane that demarcates hydrates from the associated gas. The hydrate layer manifests as a ring, positioned at the periphery of the associated gas. The yellow color denotes moderate hydrate saturation, whereas red indicates high hydrate saturation. In Region 1, the impedance slice transitions from red to yellow, signifying a decrease in hydrate quantity. Region 2 demonstrates a further reduction in impedance, while Region 3 is characterized by low impedance. The three-phase coexistence zone is located between curves 1 and 2, with its southwestern boundary being approximately 600 m wider than the eastern and northern boundaries, which are about 400 m narrower. Within the three-phase zone, hydrates are arranged in a wedge-like configuration, with gas situated beneath and hydrates positioned above.
Figure 7 illustrates the average velocity measured on the plane at the upper interface of the hydrate over a period of 15 milliseconds. The hydrate exhibits a pronounced high-value anomaly, with the hydrate layer attaining a maximum thickness of approximately 10 m and being relatively thin, predominantly concentrated in the southeastern and southern regions. The western section of the hydrate layer is comparatively thinner. An analysis of the lowest velocity over a 20 ms interval downward along the hydrate’s upper interface reveals a low velocity anomaly, indicative of gas bearing anomalies. The fault appears to exert a significant influence on the gas layer, characterized by a thicker lower wall and a thinner hanging wall. The sand body exhibits a relatively uniform distribution of gas layers, although a reduction in gas layer thickness is observed within the three-phase zone.

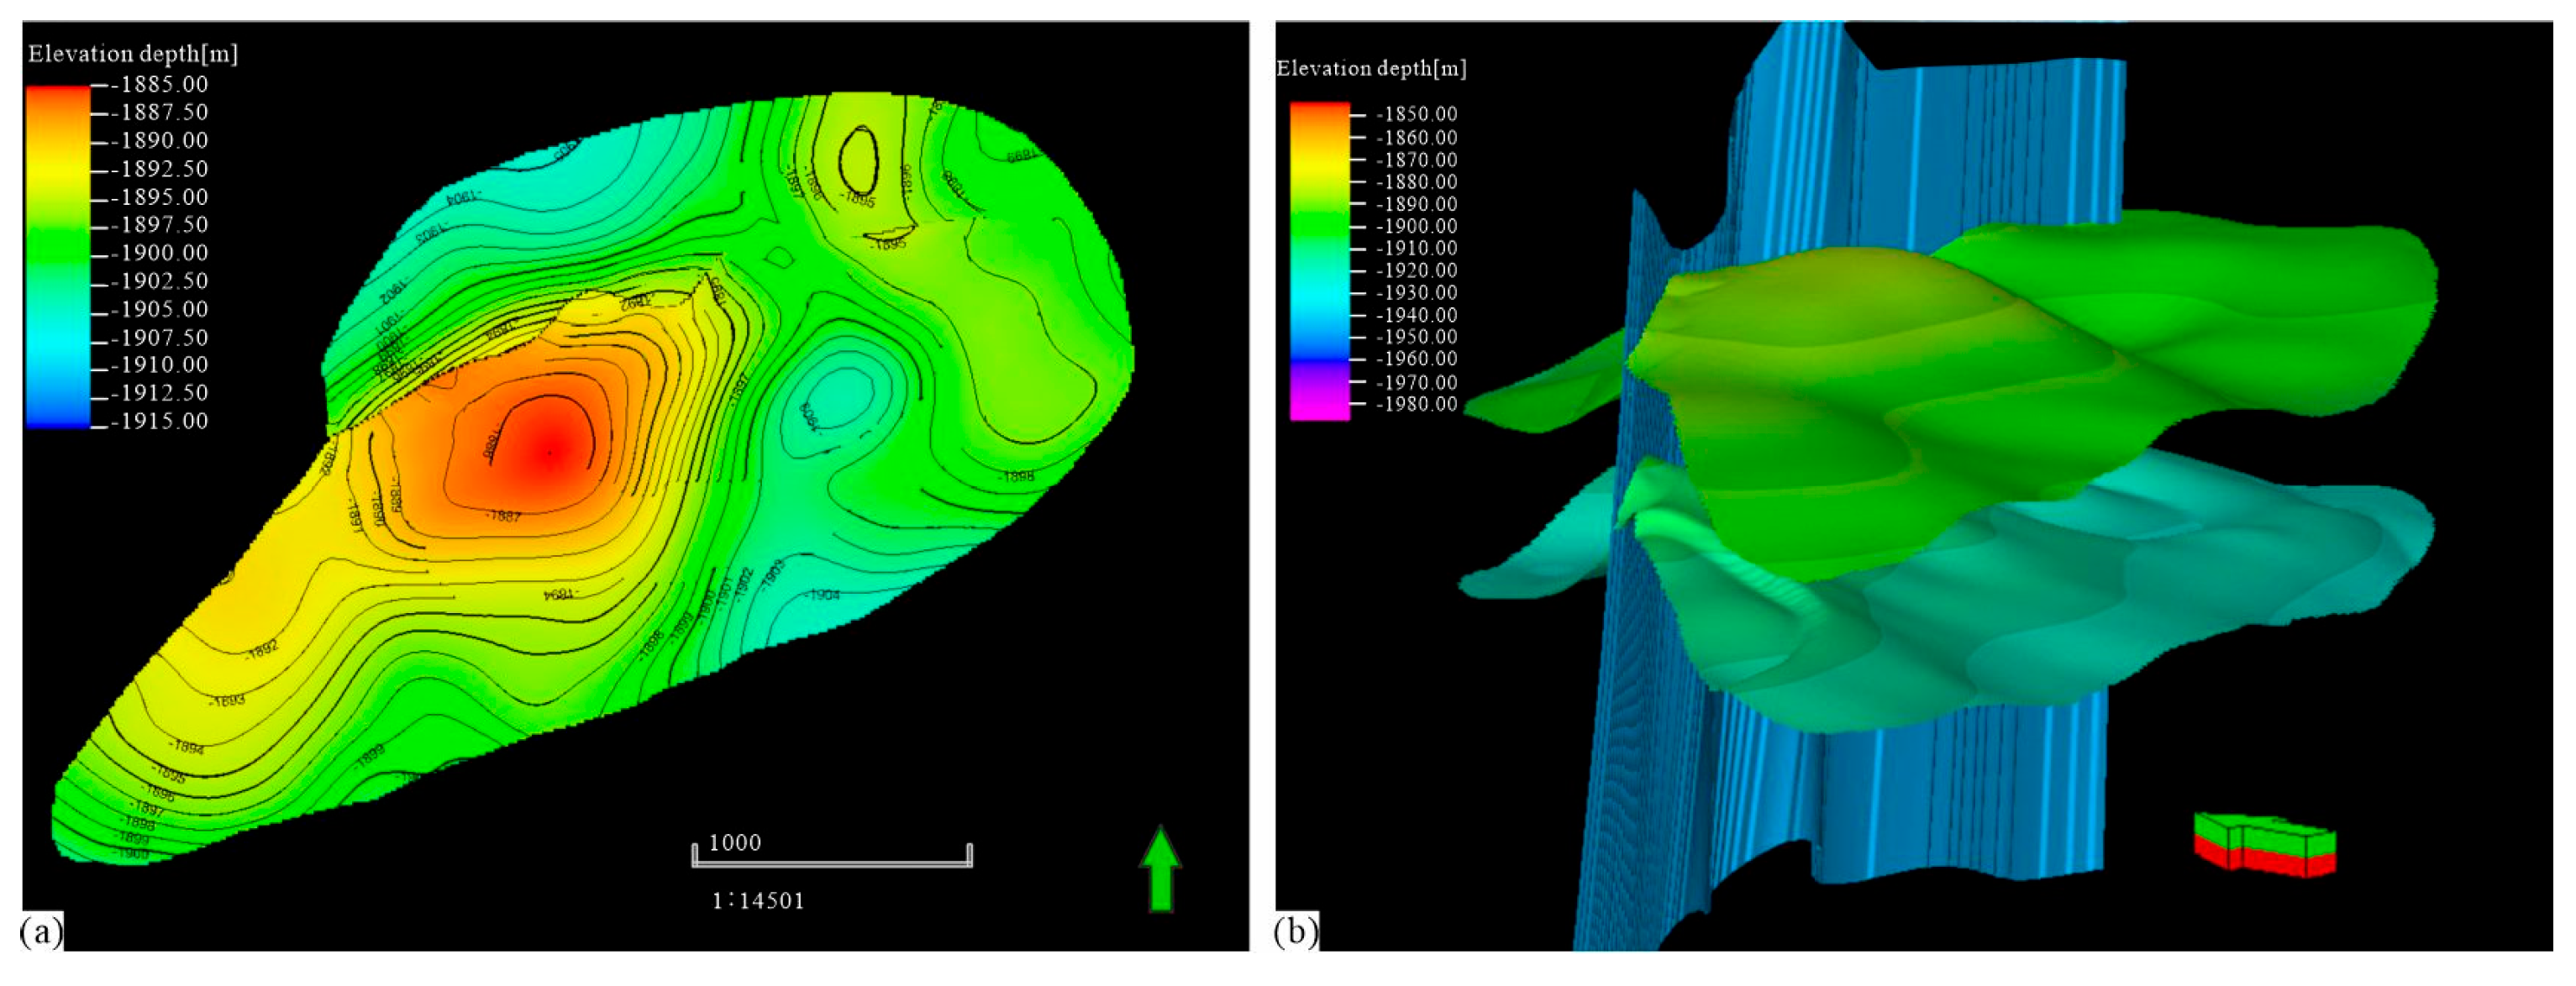
4.2. Structure Model

A three-dimensional geological model of the three-phase coexistence zone was created. The three-phase zone model contains nine wells, with an average spacing of approximately 1 km between them. The three-phase zone model is spatially distributed in an elliptical shape oriented northeast-southwest, measuring about 4 km by 2.5 km (Figure 8a). The vertical logging data spans roughly 100 m. A detailed seismic data interpretation reveals six layers and one fault at the top and bottom interfaces of two sets of sand layers, as well as the upper and lower hosting rock interfaces. Hydrate and free gas are primarily in the first set of sand bodies. A significant fault trending east–west is present in the region (Figure 8b). The fault model illustrates the spatial characteristics of fault distribution, highlighting the displacement of strata and the variations among different fault blocks. Following the outlined procedures, the fault shape was repeatedly adjusted and validated to ensure it accurately reflects the actual conditions and effectively describes its distribution characteristics in three-dimensional space.

4.3. Fine Interpretation

The sand body illustrated in Figure 8a primarily divides the strata into two minor zones, designated as Sand1 and Sand2. The three-phase zone, predominantly situated within the Sand1, exhibits an average thickness of approximately 8 m and is characterized by a structural elevated at the center and decreasing towards the peripheries. Utilizing an interactive interpretation approach that integrates both plane and section views, a total of 105 profiles are evaluated from left to right (Figure 9 and Figure 10a) [38]. Four of these profiles have been selected for in-depth discussion. The W2 and W4 wells, which are situated within the three-phase zone, function as critical control points for this analysis. Each well is linked to a corresponding profile that is interpreted in a unique manner (Figure 10b).
Section 19 is oriented in a north–south direction, as illustrated in Figure 9 and Figure 10c. This section exhibits five distinct layers of stratification within the three-phase zone, which is further categorized into five separate layers. The central layer is defined by an equal distribution model, with its lower boundary interfacing with free gas and its upper boundary in contact with hydrates.
A manual analysis of Section 61 and Section 66, trending from southeast to northwest, indicates that the front of this section displays a downward dip that is nearly parallel to the upper layer of the three-phase zone, a phenomenon attributed to geological constraints (Figure 10d,e).
Likewise, the upper boundary of Section 83, which trends from west to east, shows a downward slope along its trajectory until it reaches the boundary of the section (Figure 10f).
The internal strata of the three-phase coexistence zone are categorized into five discrete sublayers, arranged vertically from the base to the apex [25]. Figure 9 provides a detailed representation of the structural configuration of these sublayers within the three-phase zone. It is noteworthy that within these sublayers, there is a progressive increase in hydrate saturation from the lower to the upper sections (Figure 11a–c), whereas free gas saturation demonstrates a concomitant decrease (Figure 11d–f).

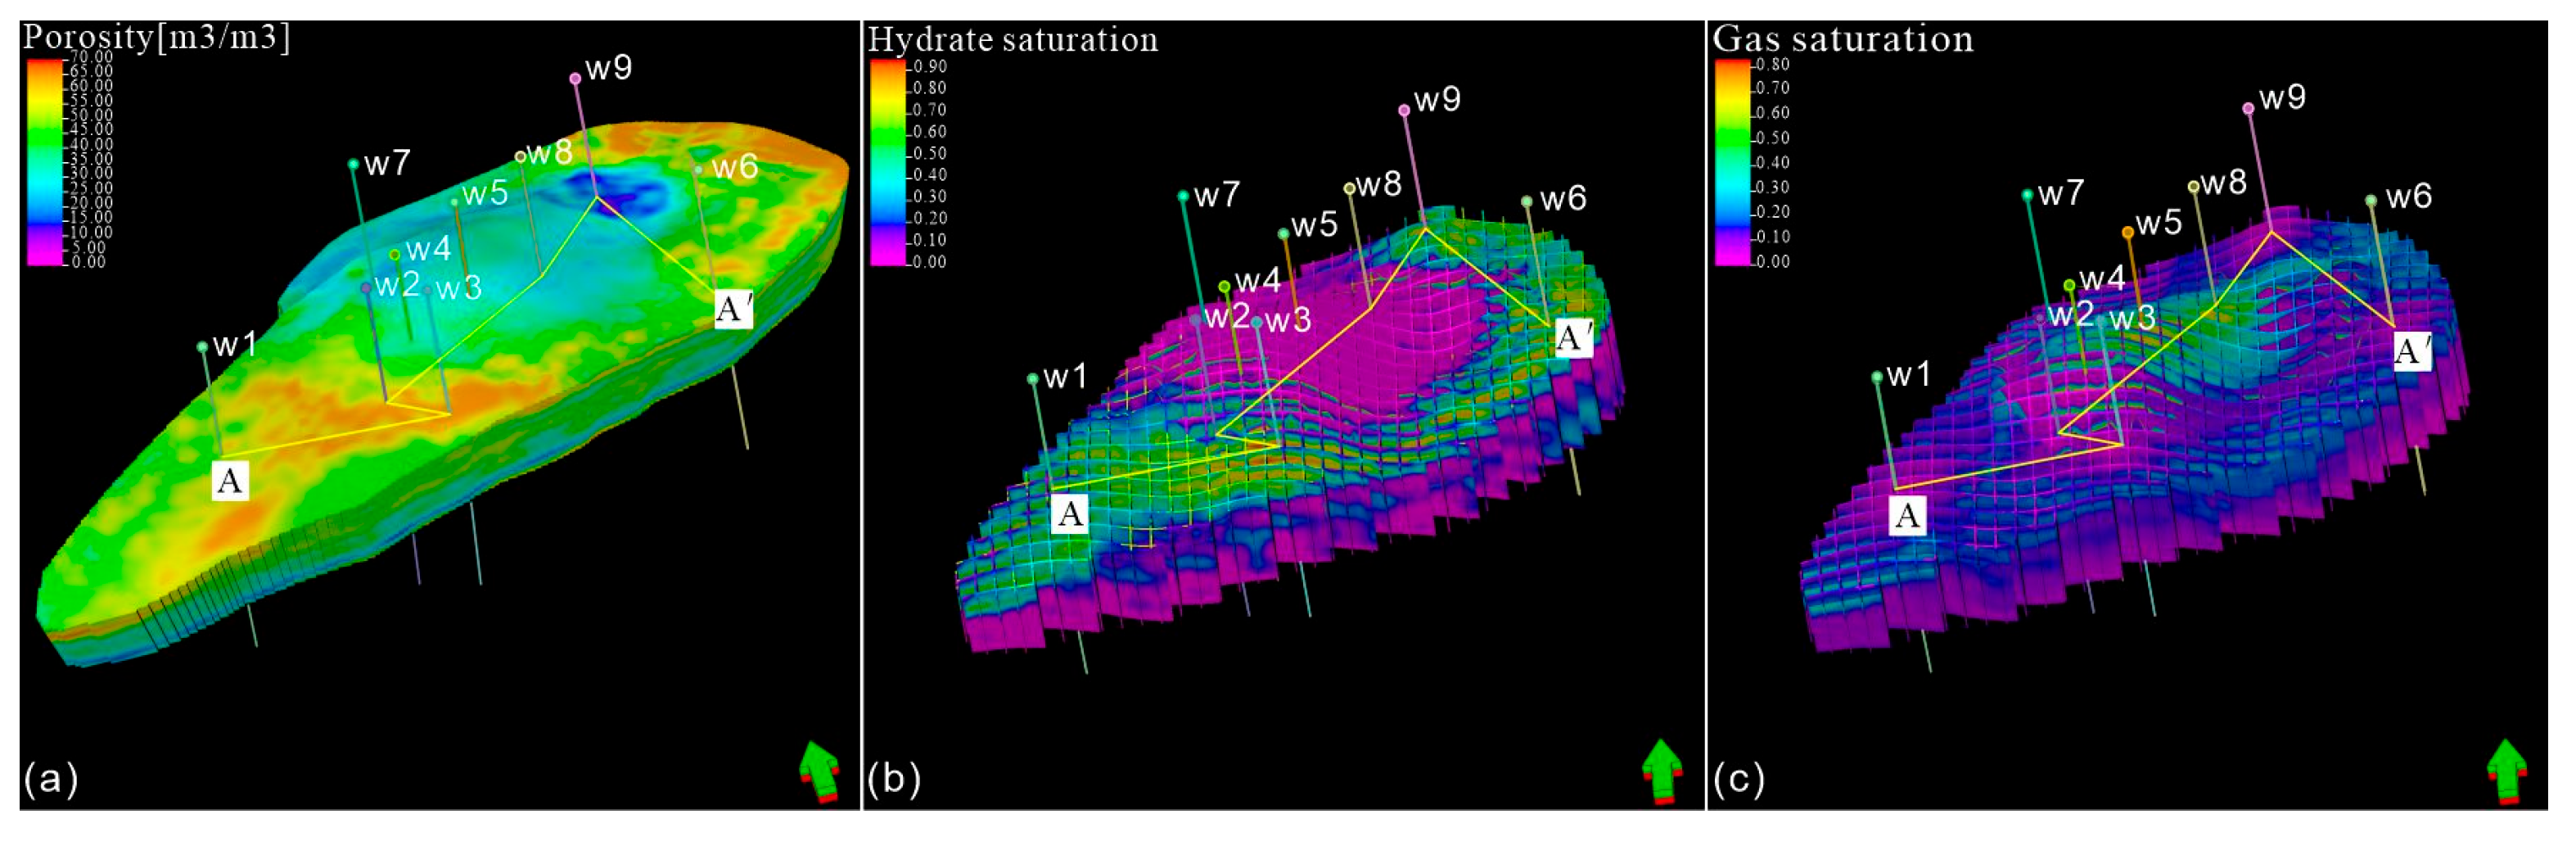
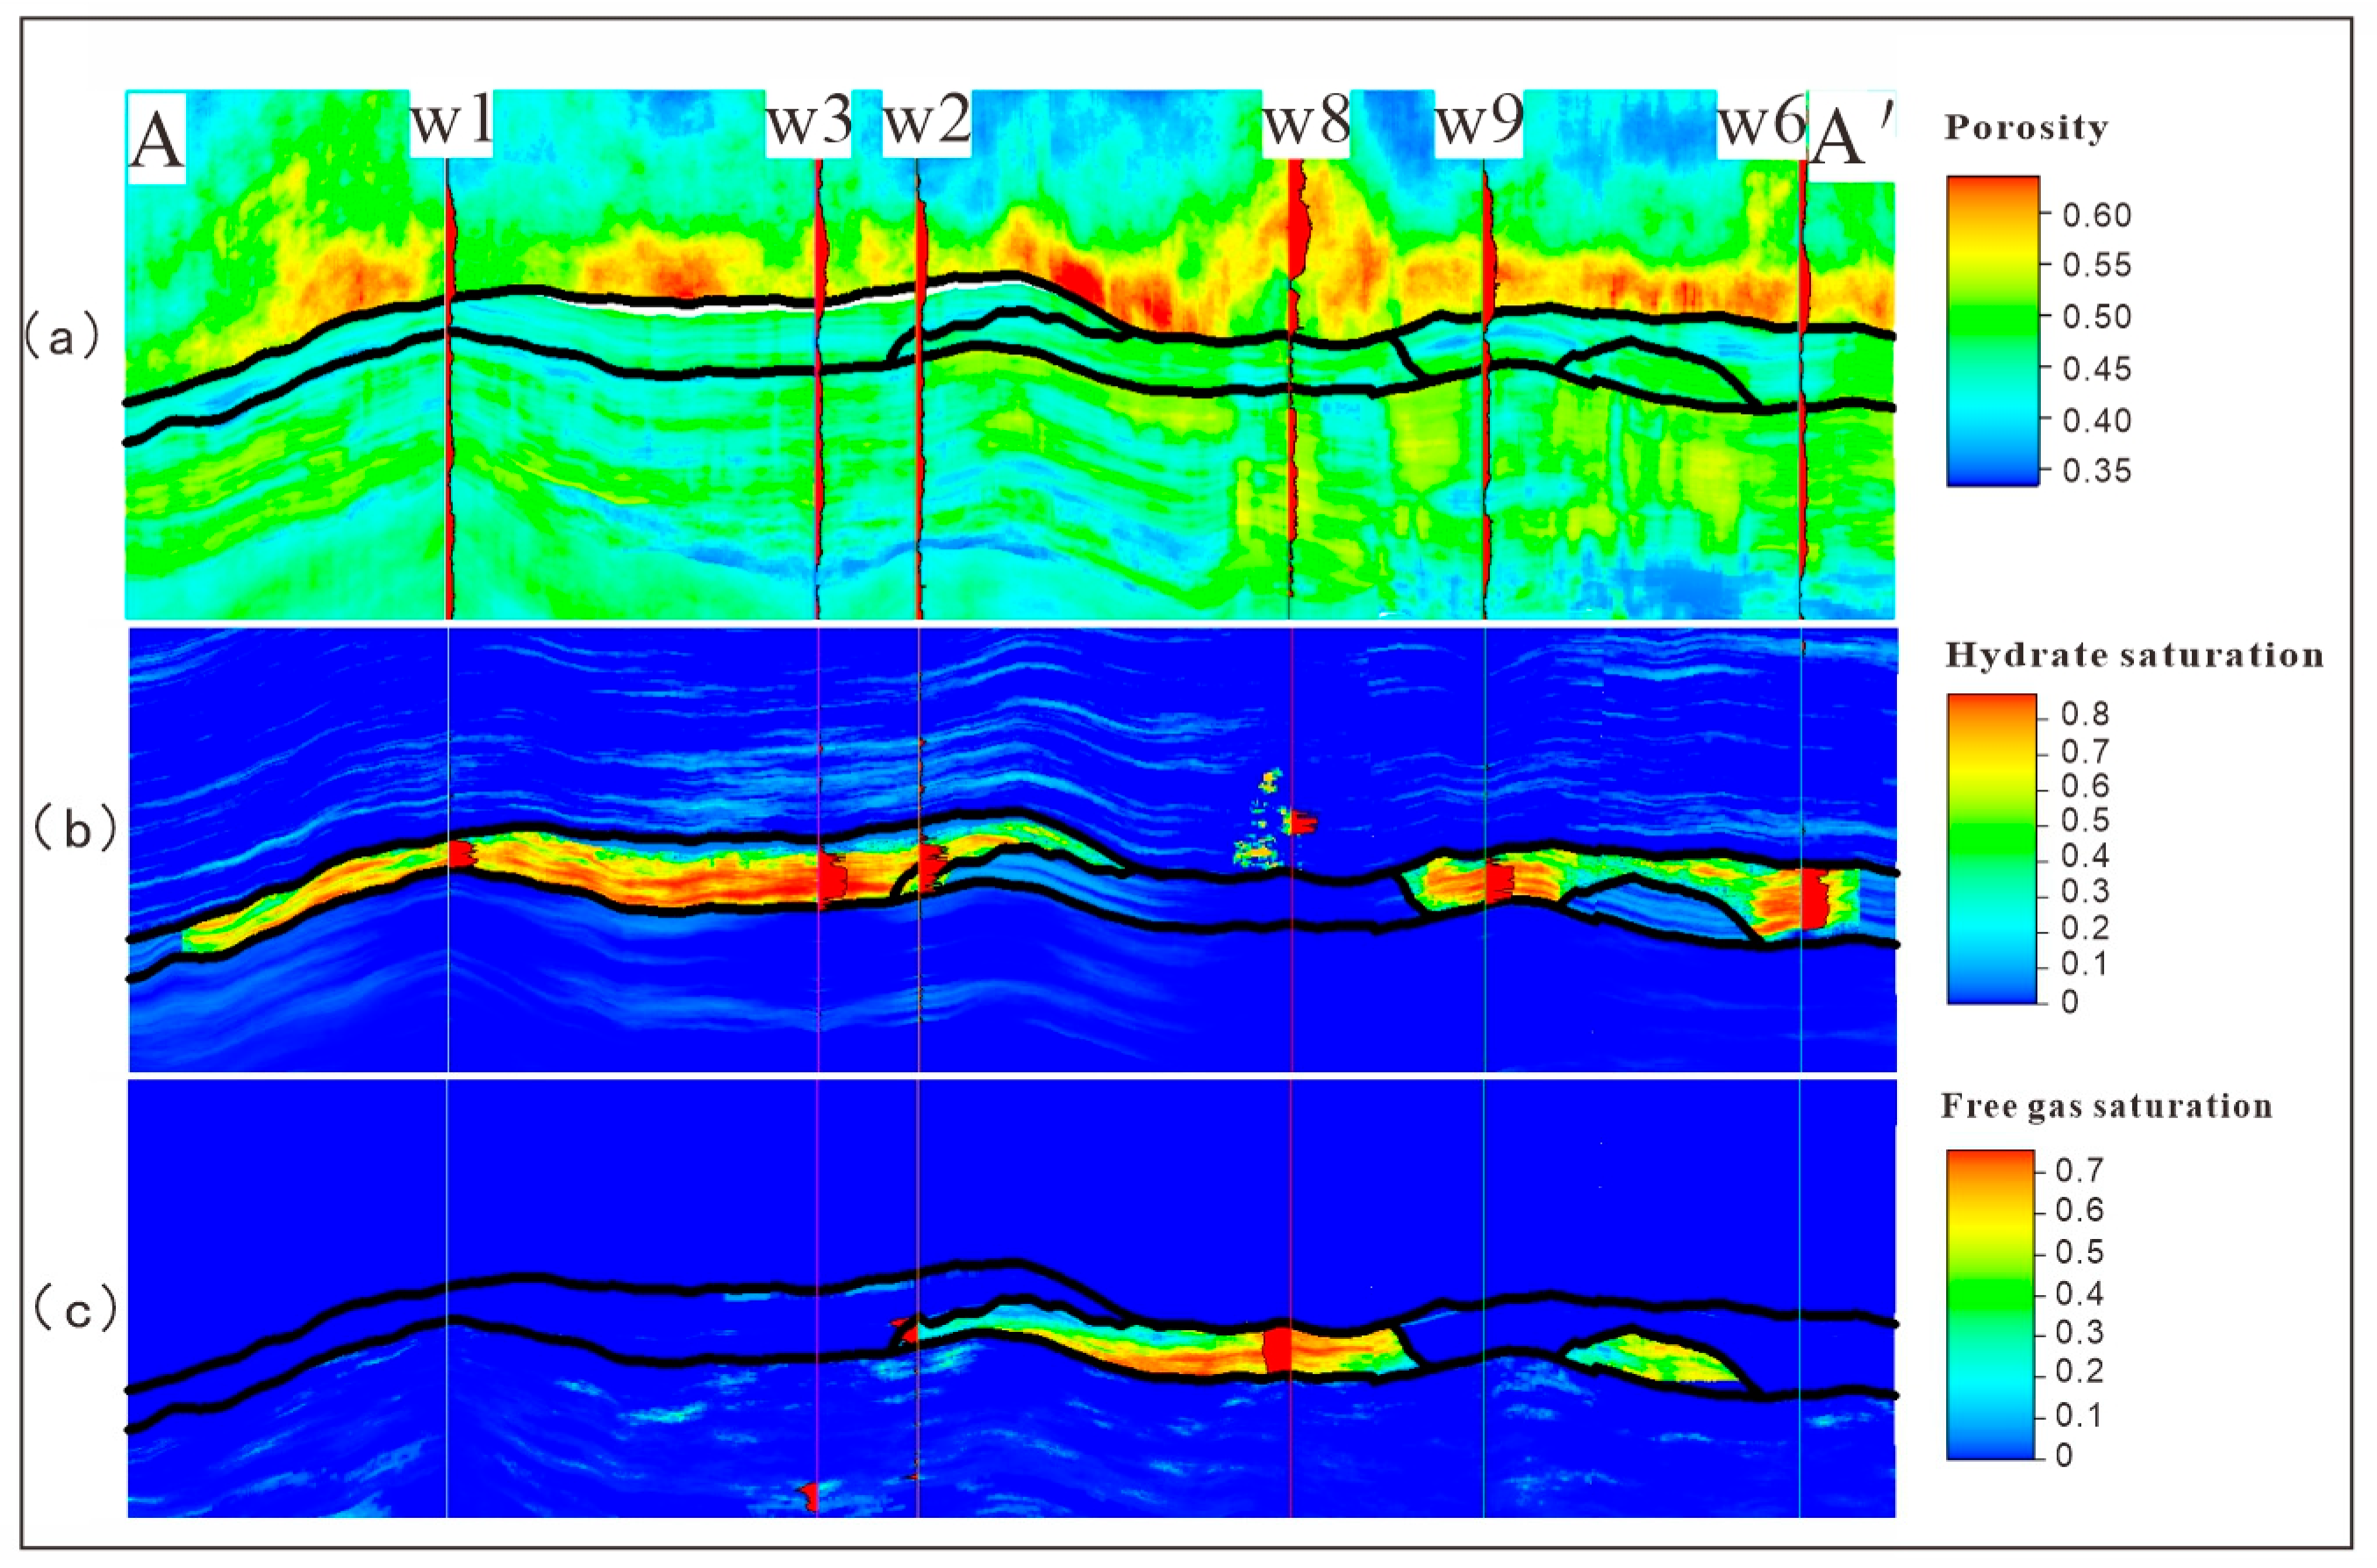
4.4. Attribute Model

To construct models of porosity and saturation, as illustrated in Figure 12, it is essential to utilize variogram analysis based on well data. This process requires the careful selection of suitable parameters for range and azimuth, in addition to integrating seismic calibration results as a supplementary constraint.
The porosity model indicates that the spatial distribution of free gas within the study area is more limited compared to that of hydrate. Notably, there is an increase in porosity values in the upper section of Sand1, which may be attributed to the mass transport deposit (MTD) situated above Sand1, as illustrated in Figure 13a. In contrast, the porosity values within Sand1 exhibit relative uniformity, as depicted in the corresponding well profile in Figure 13a.
The hydrate saturation model reveals that areas of elevated hydrate saturation are predominantly located outside the three-phase zone, forming a “C” shaped distribution, as demonstrated in Figure 12b. The free gas saturation model indicates that the free gas present in the three-phase coexistence zone is characterized by high saturation levels, with a significant concentration of free gas found in the central region of the study area, as shown in Figure 12c. The A-A well profile presented in Figure 12c indicates that well 07 exhibits the highest free gas saturation, which may be correlated with its location at the center of the gas chimney.

5. Discussion

5.1. Error Analysis

The structural model is constructed using a methodology based on the corner grid system. This approach considers the spatial distribution of wells within the study area, the trends in geological structures, and the specific requirements associated with oilfield development. To improve the quality of the planar grid, a resolution of 10 m × 10 m is employed, with trend lines integrated as needed. In terms of vertical mesh generation, an average mesh accuracy of 0.5 m is attained, culminating in the creation of a total of 35,000 meshes.

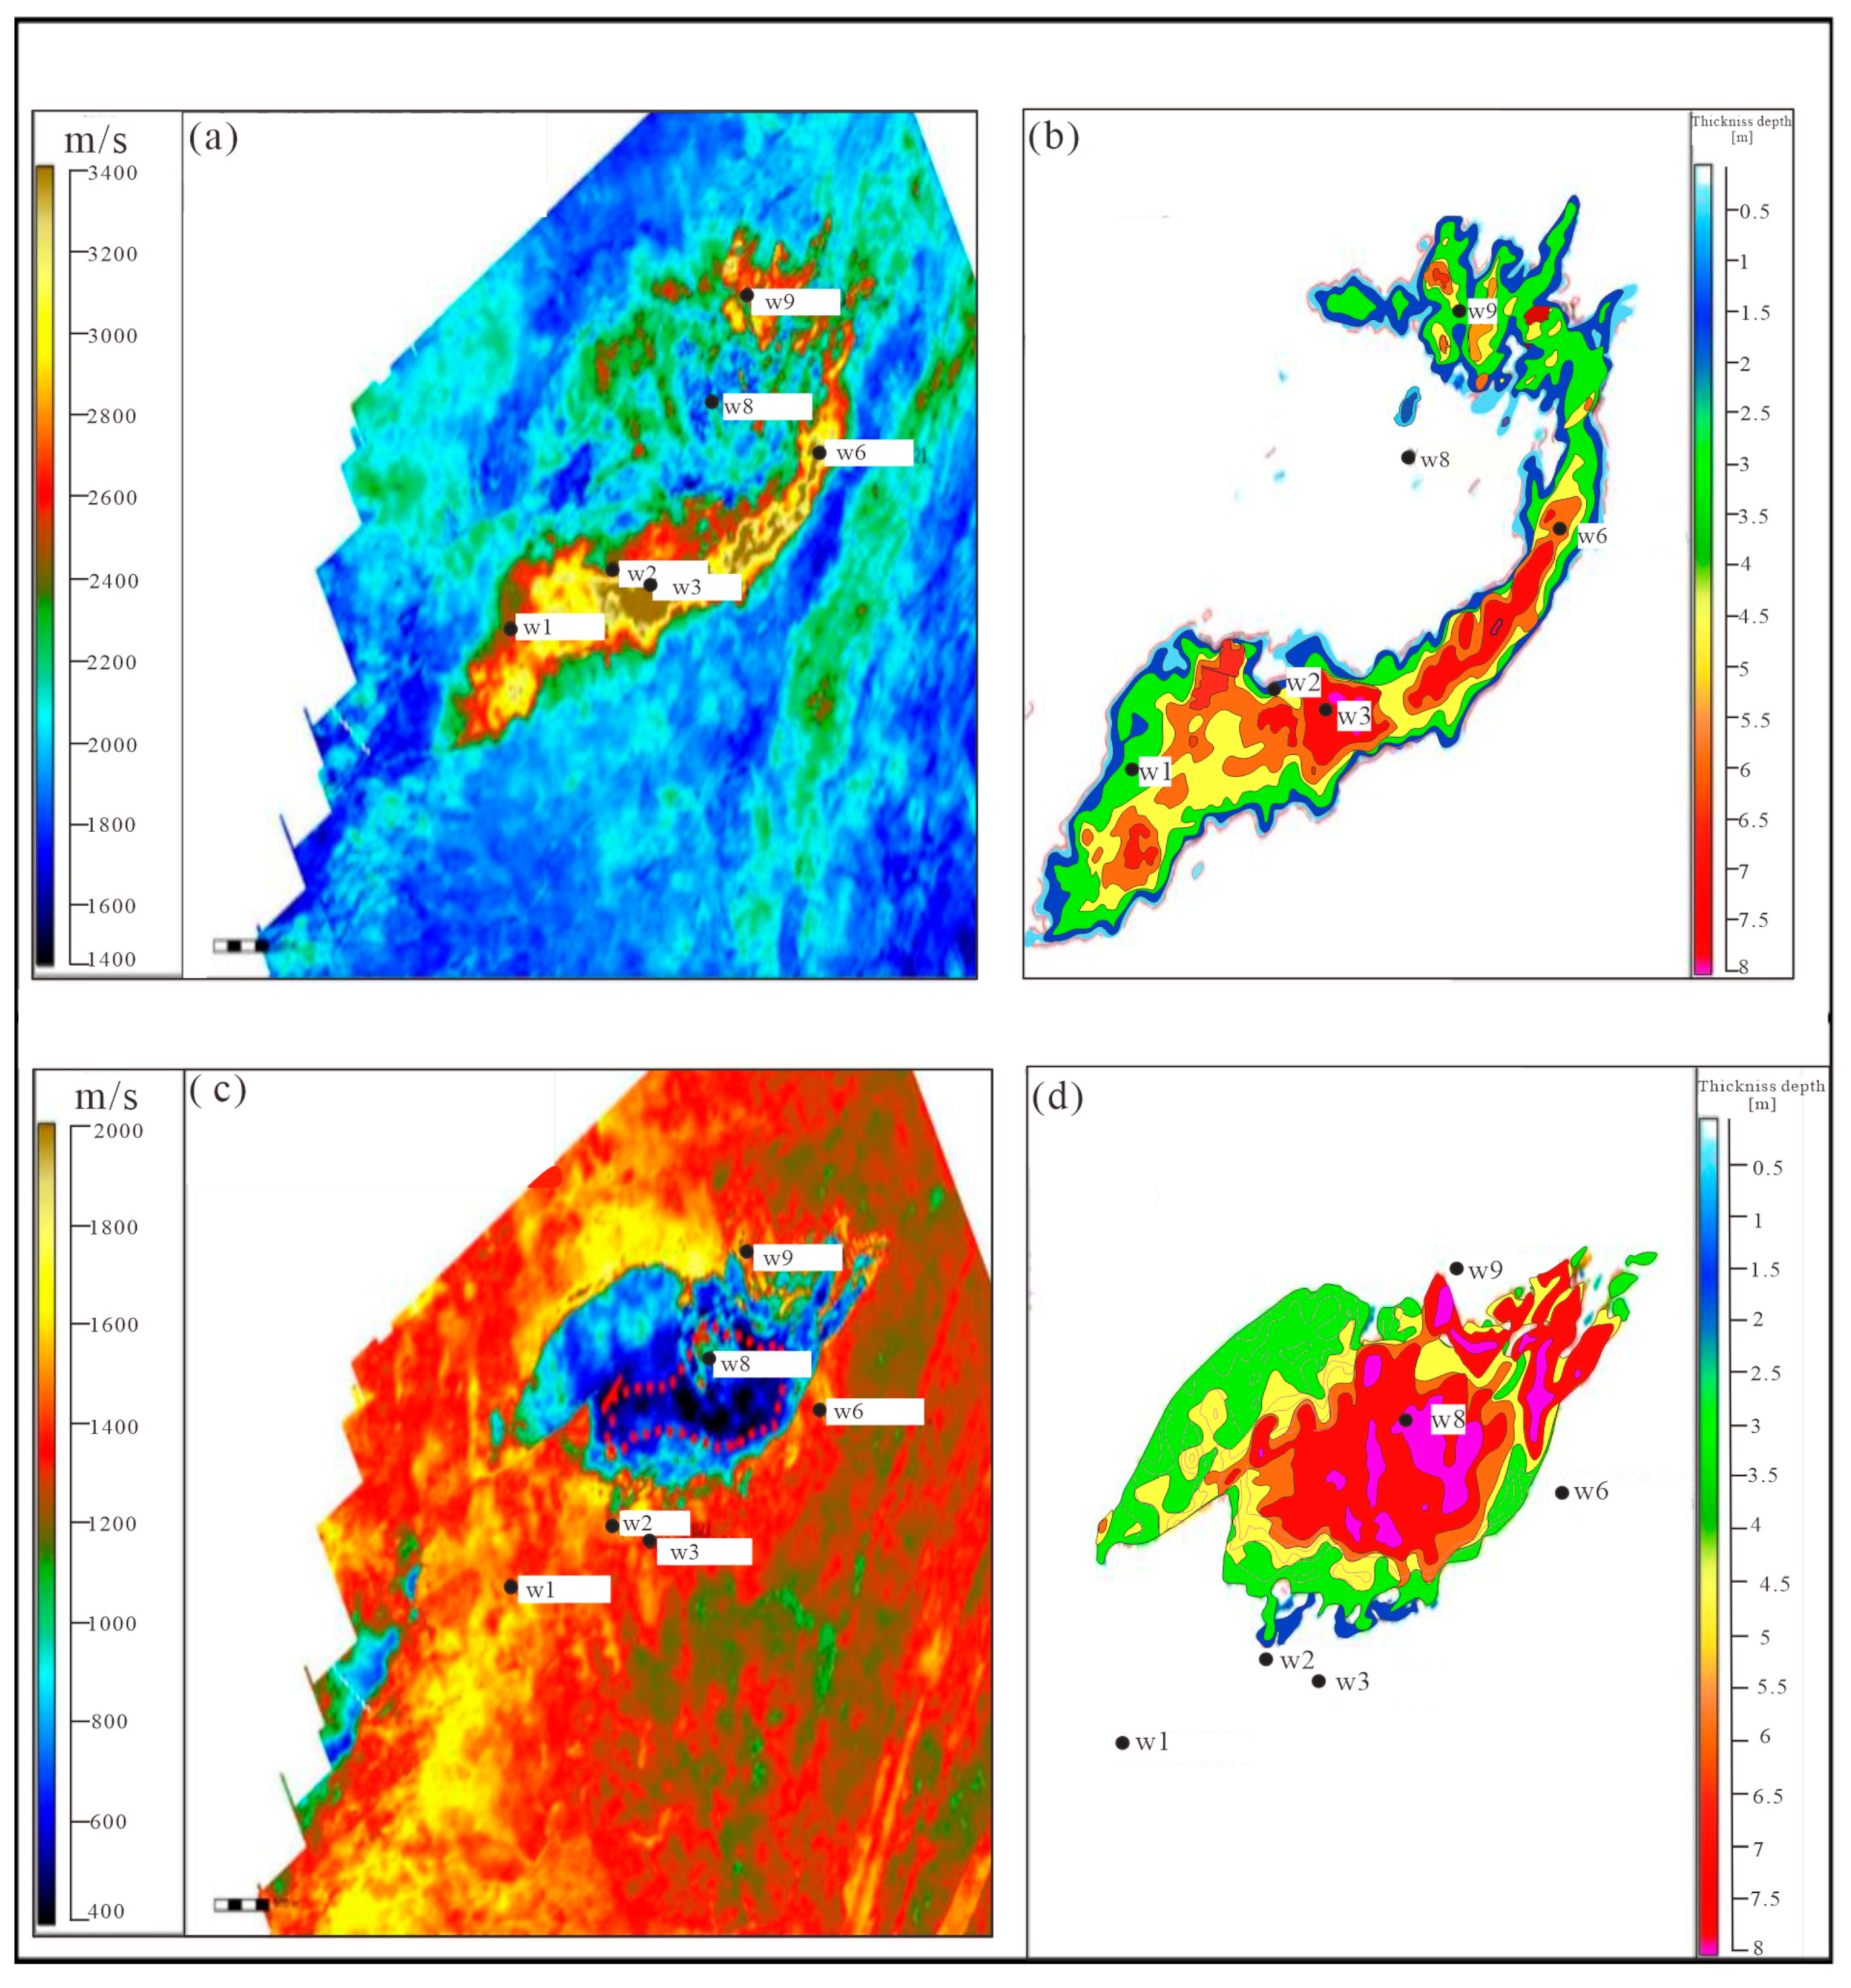
5.1.1. Verification of Distribution Patterns

The three-dimensional distribution of hydrate demonstrates a notable alignment with the trends identified in wave impedance data. Specifically, the hydrate thickness is approximately 8 m in the western region, 5 m in the central region, and 3 m in the eastern region. Figure 14b depicts the three-dimensional structure of a minor layer within the three-phase zone, while Figure 14c,d provide three-dimensional structural maps from various perspectives within the three-phase coexistence zone of the study area.

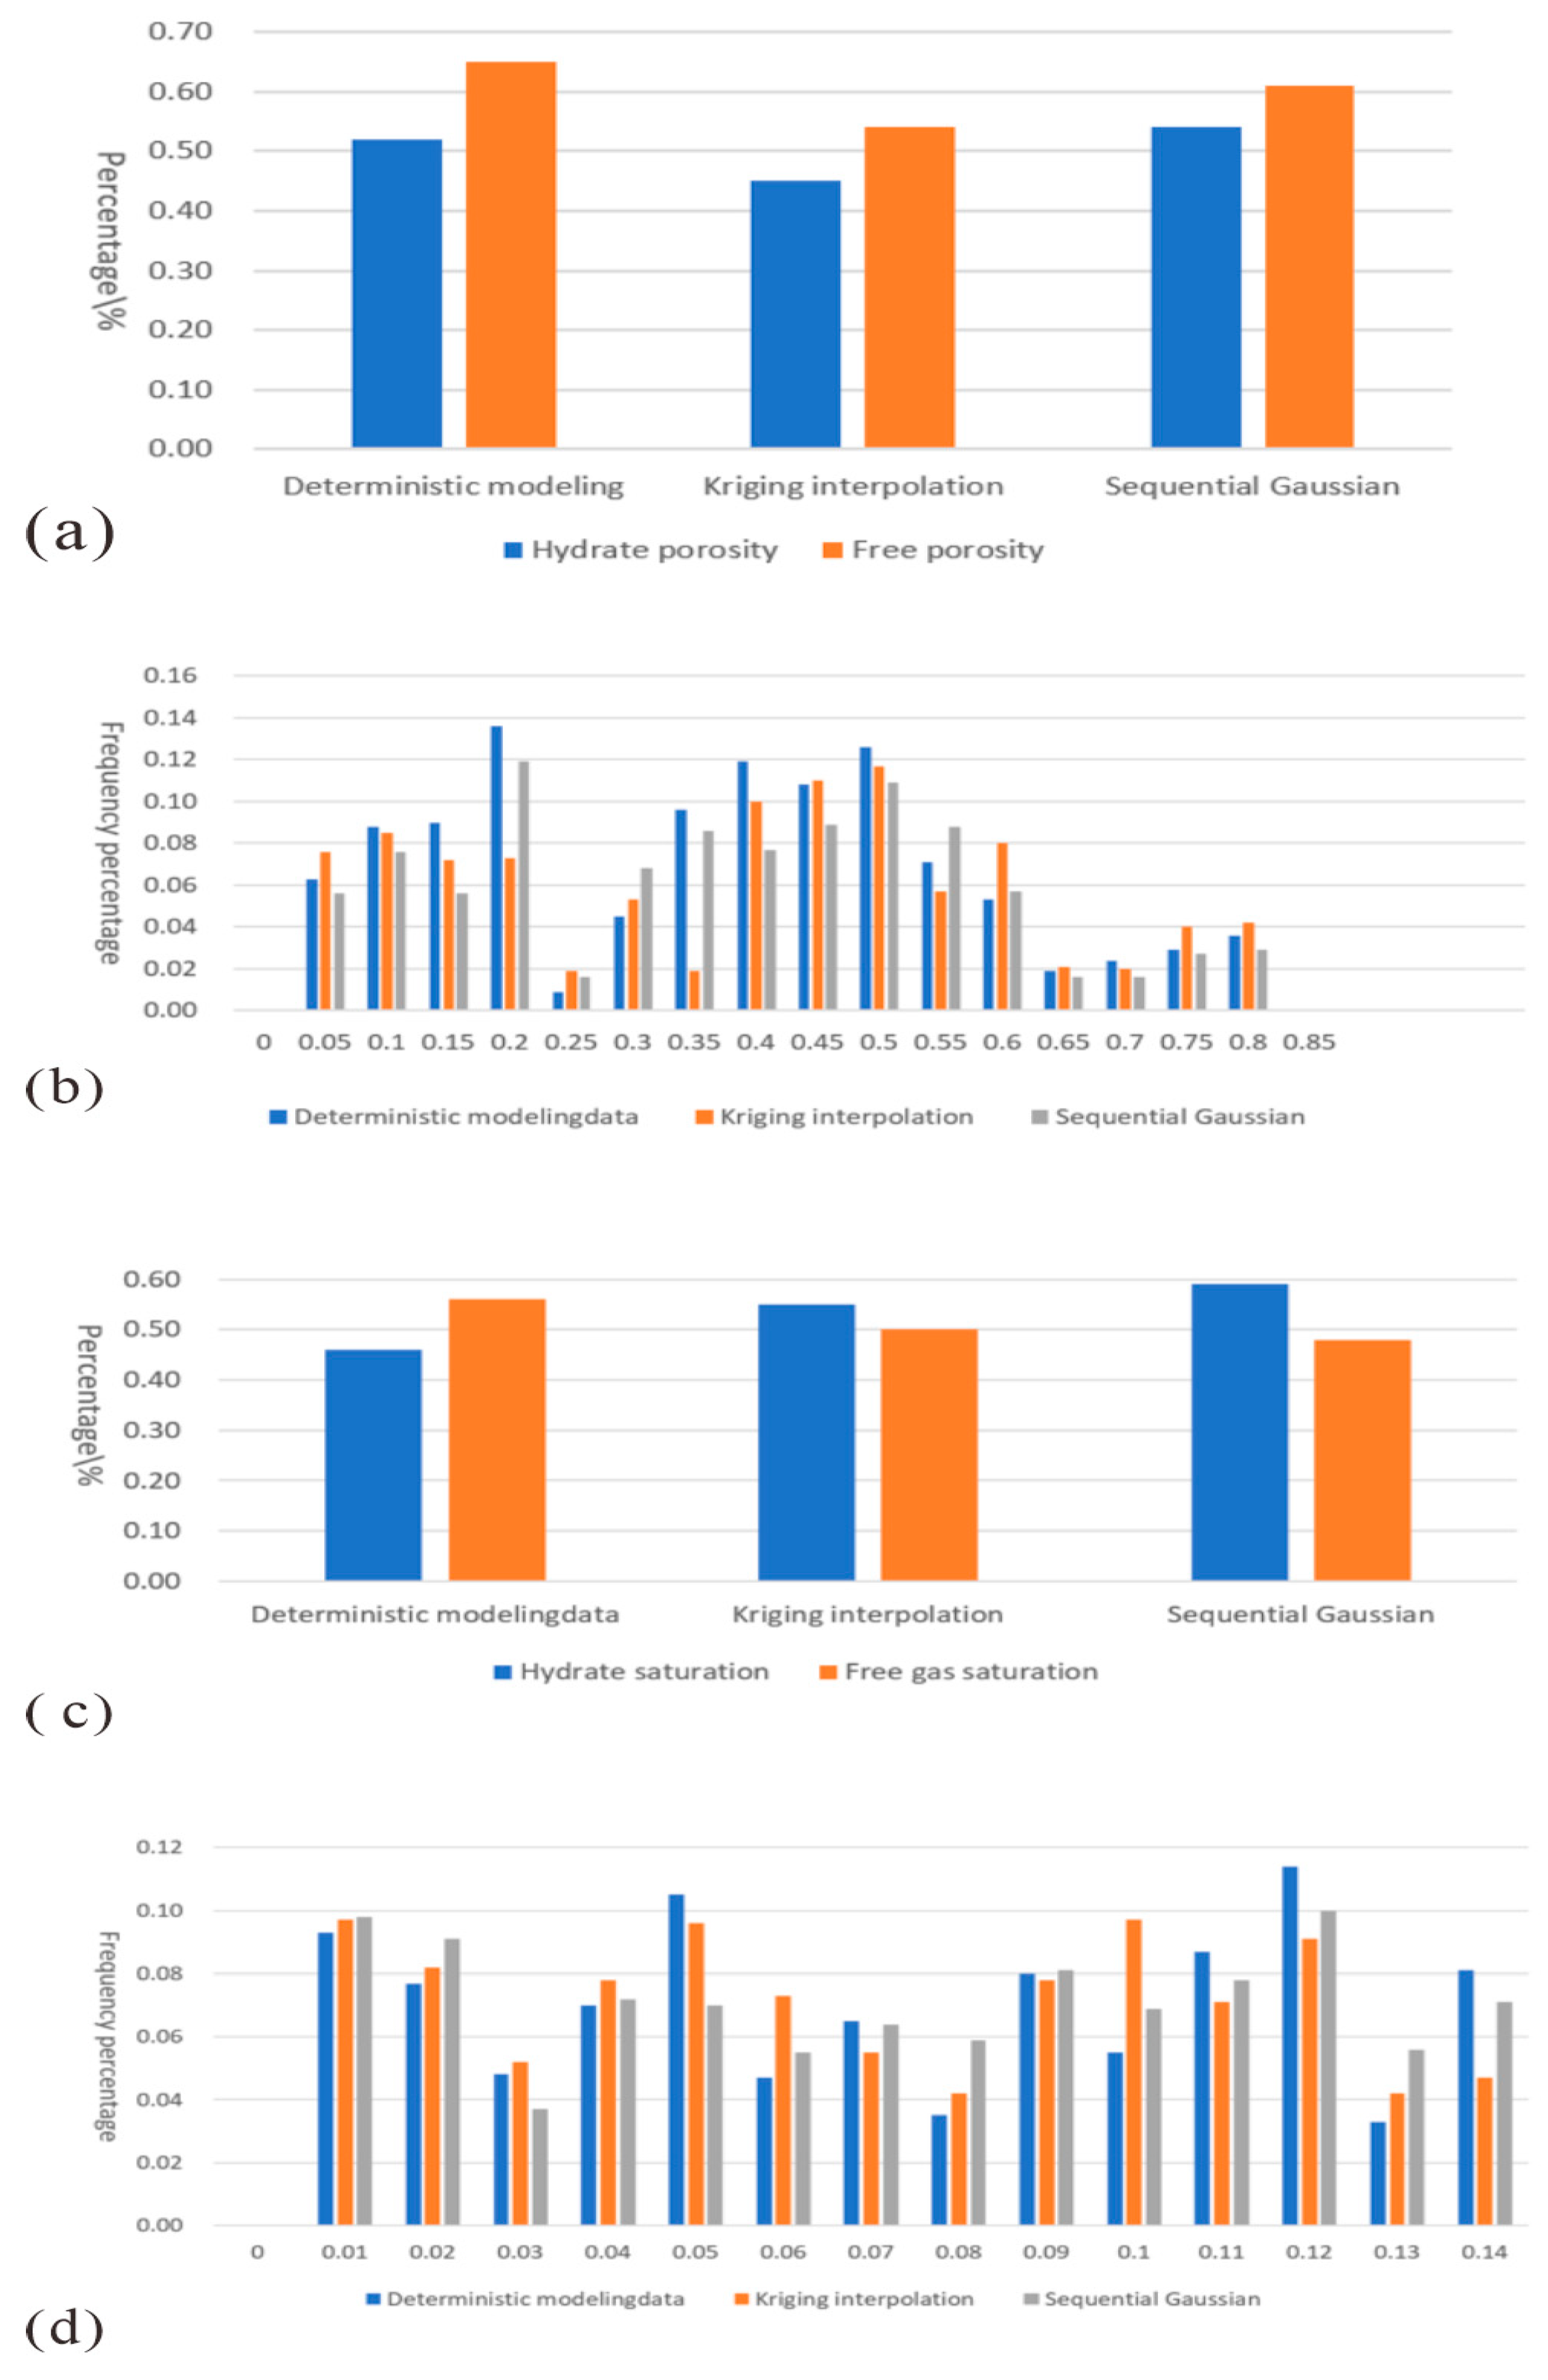
5.1.2. Verification of Spatial Distribution of Parameters

Due to the limited number of control well points intersecting the three-phase zone in the hydrate study area, some discrepancies were observed in the distribution of model data, coarsening data, and original data. Nevertheless, the model effectively captures the regions of high porosity and high saturation, as evidenced by the seismic profile, indicating the general credibility of the model.
In comparing the models generated through three distinct modeling methodologies, values within the same model were selected for analysis. The comparison revealed that the saturation data derived from the deterministic complex morphological geological modeling method aligns closely with the variation range of the well data. In contrast, the porosity values obtained through Kriging interpolation and sequential Gaussian modeling exhibited more significant fluctuations. Figure 15. This analysis demonstrates that the three-dimensional multiscale model developed via deterministic complex morphological geological modeling is largely congruent with the prevailing geological understanding and actual logging data. Furthermore, the results substantiate the superiority of hierarchical modeling over models derived solely from a singular modeling approach.

5.2. Geological Implications

The detailed depiction of the internal morphology and resource distribution patterns of the ore body provides a solid foundation for future production and development activities, such as the construction and advancement of horizontal wells. This modeling study has further clarified the reservoir formation pattern in the QDN area. Unlike the vertical distribution of hydrates and free gas observed in the Shenhu research area of the South China Sea, the hydrates and free gas in the QDN basin are distributed horizontally. As deep gas sources rise to high-permeability sand layers, the lateral migration speed increases, causing the free gas to gradually transform into hydrates as the pressure and temperature change. There is a three-phase coexistence zone of free gas and water between the two phases.

6. Conclusions

This article presents a high-precision model of three-phase coexistence zones by integrating detailed earthquake interpretation, deterministic complex shape modeling, and multiple data fusion techniques. Compared to previous studies, this approach has achieved significant advancements in data processing, spatial modeling, and result verification, offering new insights and methodologies for future hydrate development research. The geological modeling technique for three-phase coexistence zones proposed in this study demonstrates notable improvements and innovations over existing research. Unlike earlier studies that primarily concentrated on single-phase modeling—such as individual natural gas hydrates or free gas layers—the deterministic complex landform modeling method employed in this paper more accurately captures the spatial morphology of three-phase coexistence zones. This modeling framework not only synthesizes seismic and logging data but also incorporates detailed seismic interpretation and statistical geological methods, thereby addressing the limitations of traditional approaches in modeling complex three-phase systems.

Author Contributions

Conceptualization, H.Y. and J.W.; methodology, H.Y., J.W., and W.D; software, J.W. and Z.L; validation, H.Y., J.W., and Z.L.; formal analysis, W.D. and Z.L; investigation, H.Y. and J.W.; resources, Z.L., Z.K., and T.L.; data curation, W.D.; writing—original draft preparation, H.Y., J.W., and W.D.; writing—review and editing, Z.K.; visualization, J.W. and T.L; supervision, Z.K.; project administration, Z.K. and T.L.; funding acquisition, Z.K. All authors have read and agreed to the published version of the manuscript.

Funding

The research works are financially supported by National Key Research and Development Program of China (No. 2021YFC2800901). This work is supported by the National Natural Science Foundation of China (42376058) and the Guangdong Major Project of Basic and Applied Basic Research (2020B0301030003).

Data Availability Statement

In this research work presented in this paper, certain data has been obtained under strict confidentiality agreements and restrictions. The data in question is proprietary and sensitive in nature, and its disclosure is prohibited by the terms of the agreements with the data providers or due to legal and ethical obligations.

Conflicts of Interest

The authors declare no conflicts of interest.

References

  1. Ye, J.-L.; Qin, X.-W.; Xie, W.-W.; Lu, H.-L.; Ma, B.-J.; Qiu, H.-J.; Liang, J.-Q.; Lu, J.-A.; Kuang, Z.-G.; Lu, C.; et al. The second natural gas hydrate production test in the South China Sea. China Geol. 2020, 3, 197–209. [Google Scholar] [CrossRef]
  2. Zeng, X.; Yu, X.; Liang, J.; Kuang, Z.; Wang, J. Geological modeling and favorable area prediction of natural gas hydrate in Shenhu sea area. Mar. Geol. Quat. Geol. 2014, 34, 117–126. [Google Scholar]
  3. Li, J.-F.; Ye, J.-L.; Qin, X.-W.; Qiu, H.-J.; Wu, N.-Y.; Lu, H.-L.; Xie, W.-W.; Lu, J.-A.; Peng, F.; Xu, Z.-Q.; et al. The first offshore natural gas hydrate production test in South China Sea. China Geol. 2018, 1, 5–16. [Google Scholar] [CrossRef]
  4. Yang, S.; Liang, J.; Lu, J.; Qu, C.; Liu, B. New understanding of gas hydrate accumulation characteristics and main controlling factors in Shenhu area, northern South China Sea. Geol. Front. 2017, 24, 1–14. [Google Scholar] [CrossRef]
  5. Wu, N.; Liang, J.; Wang, H.; Su, X.; Song, H.; Jiang, S.; Zhu, Y.; LU, Z. Research progress of marine gas hydrate accumulation system. Mod. Geol. 2008, 3, 356–362. [Google Scholar]
  6. Dale, A.; Van Cappellen, P.; Aguilera, D.; Regnier, P. Methane efflux from marine sediments in passive and active margins: Estimations from bioenergetic reaction–transport simulations. Earth Planet. Sci. Lett. 2008, 265, 329–344. [Google Scholar] [CrossRef]
  7. Liang, J.; Sha, Z.; Meng, M.; Wang, X.; Xu, M.; Fang, Y. Characteristics and distribution of high saturation natural gas hydrate reservoirs in the Shenhu Sea. Geol. J. 2024, 98, 2641–2653. [Google Scholar] [CrossRef]
  8. Wang, X.; Wu, S.; Liu, X.; Yang, S.; Guo, Y.; Li, Q. Estimation of Natural Gas Hydrate Resources in Shenhu Sea Area Based on Logging and Seismic Data. Adv. Geophys. 2010, 25, 1288–1297. [Google Scholar]
  9. Liang, J.; Wang, J.; Yang, C.; Kang, D.; Lu, J.; Liang, J. Geophysical characteristics of gas hydrate-bearing sediments in the eastern Pearl River Mouth Basin. Gas Ind. 2017, 37, 126–133. [Google Scholar]
  10. Fan, J.; Liu, Y.; Zhang, X.; Liu, K.; Zheng, Y. Imulation and Comparison of Seismic Wave Fields in Natural Gas HydrateFormations. Adv. Mar. Sci. 2021, 39, 290–303. [Google Scholar]
  11. Liu, X.; Yin, X.; Luan, X. Seismic rock physical modelling for gas hydrate-bearing sediments. Sci. China Earth Sci. 2018, 61, 1261–1278. [Google Scholar] [CrossRef]
  12. Wang, G.; Cheng, B.; Wang, T.-G.; Simoneit, B.R.; Shi, S.; Wang, P. Monoterpanes as molecular indicators to diagnose depositional environments for source rocks of crude oils and condensates. Org. Geochem. 2014, 72, 59–68. [Google Scholar] [CrossRef]
  13. Jamil, M.; Siddiqui, N.A.; Umar, M.; Usman, M.; Ahmed, N.; Rahman, A.H.A.; Zaidi, F.K. Aseismic and seismic impact on development of soft-sediment deformation structures in deep-marine sand-shaly Crocker fan in Sabah, NW Borneo. J. King Saud Univ.-Sci. 2021, 33, 101522. [Google Scholar] [CrossRef]
  14. Jamil, M.; Siddiqui, N.A.; Ahmed, N.; Usman, M.; Umar, M.; Rahim, H.U.; Imran, Q.S. Facies Analysis and Sedimentary Architecture of Hybrid Event Beds in Submarine Lobes: Insights from the Crocker Fan, NW Borneo, Malaysia. J. Mar. Sci. Eng. 2021, 9, 1133. [Google Scholar] [CrossRef]
  15. Argentino, C.; Conti, S.; Fioroni, C.; Fontana, D. Evidences for Paleo-Gas Hydrate Occurrence: What We Can Infer for the Miocene of the Northern Apennines (Italy). Geosciences 2019, 9, 134. [Google Scholar] [CrossRef]
  16. Tamaki, M.; Suzuki, K.; Fujii, T.; Sato, A. Prediction and validation of gas hydrate saturation distribution in the eastern Nankai Trough, Japan: Geostatistical approach integrating well-log and 3D seismic data. Interpretation 2016, 4, SA83–SA94. [Google Scholar] [CrossRef]
  17. Kuang, Z.; Cook, A.; Ren, J.; Deng, W.; Cao, Y.; Cai, H. A Flat-Lying Transitional Free Gas to Gas Hydrate System in a Sand Layer in the Qiongdongnan Basin of the South China Sea. Geophys. Res. Lett. 2023, 50, e2023GL105744. [Google Scholar] [CrossRef]
  18. Zhou, J.; Wang, X.; Collett, T.S.; Li, S.; Kuang, Z.; Lu, Y.; Deng, W.; Yan, W.; Qian, J.; Jin, J. Characterization of a complex sand-rich gas hydrate reservoir system in the Indian marine continental margin with downhole log and seismic data. Mar. Pet. Geol. 2023, 155, 106370. [Google Scholar] [CrossRef]
  19. Guerin, G.; Goldberg, D.; Meltser, A. Characterization of in situ elastic properties of gas hydrate-bearing sediments on the Blake Ridge. J. Geophys. Res. 1999, 104, 17781–17795. [Google Scholar] [CrossRef]
  20. Milkov, A.V.; Dickens, G.R.; Claypool, G.E.; Lee, Y.J.; Borowski, W.S.; Torres, M.E.; Xu, W.; Tomaru, H.; Tréhu, A.M.; Schultheiss, P. Co-existence of gas hydrate, free gas, and brine within the regional gas hydrate stability zone at Hydrate Ridge (Oregon margin): Evidence from prolonged degassing of a pressurized core. Earth Planet. Sci. Lett. 2004, 222, 829–843. [Google Scholar] [CrossRef]
  21. Paganoni, M.; Cartwright, J.A.; Foschi, M.; Shipp, R.C.; Van Rensbergen, P. Structure II gas hydrates found below the bottom-simulating reflector. Geophys. Res. Lett. 2016, 43, 5696–5706. [Google Scholar] [CrossRef]
  22. Pecher, I.A.; Barnes, P.M.; Leah, I. International Ocean Discovery Program Expedition 372 Preliminary Report Creeping Gas Hydrate Slides and Hikurangi Lwd Disclaimer; Texan A&M University: College Station, TX, USA, 2018. [Google Scholar] [CrossRef]
  23. Sultan, N.; Bohrmann, G.; Ruffine, L.; Pape, T.; Riboulot, V.; Colliat, J.; De Prunelé, A.; Dennielou, B.; Garziglia, S.; Himmler, T.; et al. Pockmark formation and evolution in deep water Nigeria: Rapid hydrate growth versus slow hydrate dissolution. J. Geophys. Res. Solid Earth 2014, 119, 2679–2694. [Google Scholar] [CrossRef]
  24. Qin, X.-W.; Survey, M.O.N.R.C.G.; Lu, J.-A.; Lu, H.-L.; Qiu, H.-J.; Liang, J.-Q.; Kang, D.-J.; Zhan, L.-S.; Lu, H.-F.; Kuang, Z.-G.; et al. Coexistence of natural gas hydrate, free gas and water in the gas hydrate system in the Shenhu Area, South China Sea. China Geol. 2020, 3, 210–220. [Google Scholar] [CrossRef]
  25. Fu, C.; Fan, X.; Yu, X.; Zhao, C.; He, Y.; Liang, J.; Su, P. Hierarchical modeling method and favorable zone prediction of hydrate reservoirs in Shenhu waters in continental slope of northern South China Sea. China Offshore Oil Gas 2019, 31, 83–92. [Google Scholar] [CrossRef]
  26. Su, P.; He, J.; Liang, J.; Zhang, W. Natural gas hydrate migration and accumulation system and its controlling factors on northern deep water slope of the south China Sea. Mar. Geol. Front. 2017, 33, 7. [Google Scholar] [CrossRef]
  27. Li, L.; Lei, X.; Zhang, X.; Sha, Z. Gas hydrate and associated free gas in the Dongsha Area of northern South China Sea. Mar. Pet. Geol. 2013, 39, 92–101. [Google Scholar] [CrossRef]
  28. Li, L.; Lei, X.; Zhang, X.; Zhang, G. Heat flow derived from BSR and its implications for gas hydrate stability zone in Shenhu Area of northern South China Sea. Mar. Geophys. Res. 2012, 33, 77–87. [Google Scholar] [CrossRef]
  29. Wang, X.; Hutchinson, D.R.; Wu, S.; Yang, S.; Guo, Y. Elevated gas hydrate saturation within silt and silty clay sediments in the Shenhu area, South China Sea. J. Geophys. Res. 2011, 116, B05102. [Google Scholar] [CrossRef]
  30. Huang, B.; Xiao, X.; Li, X. Geochemistry and origins of natural gases in the Yinggehai and Qiongdongnan basins, offshore South China Sea. Org. Geochem. 2003, 34, 1009–1025. [Google Scholar] [CrossRef]
  31. Yu, X.; Zhang, Z.; Su, X.; Chen, F.; Li, Y. Primary discussion on accumulation conditions for sedimentation of gas hydrate and its distribution in south China sea. Earth Sci. Front. 2004, 11, 311–315. [Google Scholar] [CrossRef]
  32. Meng, M.; Liang, J.; Kuang, Z.; Ren, J.; He, Y.; Deng, W.; Gong, Y. Distribution characteristics of quaternary channel systems and their controlling factors in the Qiongdongnan Basin, South China Sea. Front. Earth Sci. 2022, 10, 902517. [Google Scholar] [CrossRef]
  33. Xie, W.; Zhang, Y.; Sun, Z.; Jiang, J. Characteristics and Formation Mechanism of Faults in Qiongdongnan Basin. Mar. Geol. Quat. Geol. 2007, 27, 71–78. [Google Scholar]
  34. Ge, J.; Zhao, X.; Fan, Q.; Fang, X.; Song, P.; Xiang, Z. Preliminary study on depositional and reservoir characteristics of high-saturation gas hydrate worldwide. Mar. Geol. Front. 2023, 39, 1–13. [Google Scholar] [CrossRef]
  35. Yu, X.; Wang, J.; Liang, J.; Li, S.; Zeng, X.; Li, W. Depositional characteristics and accumulation model of gas hydrates in northern South China Sea. Mar. Pet. Geol. 2014, 56, 74–86. [Google Scholar] [CrossRef]
  36. Bosch, M.; Carvajal, C.; Rodrigues, J.; Torres, A.; Aldana, M.; Sierra, J. Petrophysical seismic inversion conditioned to well-log data: Methods and application to a gas reservoir. Geophysics 2009, 74, O1–O15. [Google Scholar] [CrossRef]
  37. Bashir, Y.; Siddiqui, N.A.; Morib, D.L.; Babasafari, A.A.; Ali, S.H.; Imran, Q.S.; Karaman, A. Cohesive approach for determining porosity and P-impedance in carbonate rocks using seismic attributes and inversion analysis. J. Pet. Explor. Prod. Technol. 2024, 14, 1173–1187. [Google Scholar] [CrossRef]
  38. Yin, S.; Gao, Y.; Hu, Z.; Xiong, T.; Feng, W.; Zhao, J.; Cheng, L. Multiple-point geostatistical simulation of outcrop based on UAV oblique photographic data: A case study of Shihezi Formation in Pingtou township, Lvliang city, Shanxi. Acta Pet. Sin. 2021, 42, 198–216. [Google Scholar] [CrossRef]
Figure 1. (a) The location of the Qiongdongnan basin in the south China Sea; (b) the tectonic units and location of the research area in the Qiongdongnan basin [32].
Jmse 12 02171 g001
Figure 2. Schematic stratigraphic column of the Qingdongnan Basin [33].
Jmse 12 02171 g002
Figure 3. An overview of the seabed topographical features present in the study area.
Jmse 12 02171 g003
Figure 4. (a) Distribution map of bottom simulating reflection (BSR) for W11-17 deposit; (b) amplitude attribute map within the study area [17].
Jmse 12 02171 g004
Figure 5. Comprehensive evaluation diagram of logging reservoir. Diagram (a) shows well W2, and diagram (b) shows well W4. Blue represents hydrate, red represents free gas, and yellow represents the three-phase zone.
Jmse 12 02171 g005
Figure 6. (a) Three-phase coexistence zone hydrate impedance profiles; (b) three-phase coexistence zone free gas impedance profiles; (c) 15 ms average wave impedance section above and below the hydrate top interface.
Jmse 12 02171 g006
Figure 7. (a) Hydrate layer velocity slicing; (b) Thickness distribution of hydrate layer; (c) Associated gas layer velocity slicing; (d) Thickness distribution of associated gas layer.
Jmse 12 02171 g007
Figure 8. (a) Sand body planar structural features; (b) Sand body fault trend map.
Jmse 12 02171 g008
Figure 9. Distribution of three-phase zones and well locations within the study area.
Jmse 12 02171 g009
Figure 10. Seismic profile characteristics and layer interpretation. (a) A-A′ seismic profile; (b) Seismic profile of W2-W4 well; (c) Section 19; (d) Section 61; (e) Section 66; (f) Section 83.
Jmse 12 02171 g010
Figure 11. Three-phase coexistence zone structural sublayer distribution profile: hydrate (ac) free gas (df).
Jmse 12 02171 g011
Figure 12. (a) Porosity model; (b) hydrate saturation model; (c) free gas saturation model.
Jmse 12 02171 g012
Figure 13. (a) Porosity model A-A′ connected well profile; (b) hydrate saturation model A-A′ connected well profile; (c) free gas saturation model A-A′ connected well profile.
Jmse 12 02171 g013
Figure 14. Comparison of hydrate forms. (a) Wave impedance slice map of the study area; (b) three-phase coexistence zone model small layer structure diagram; (c) top view of 3D model of three-phase coexistence area; (d) bottom view of 3D model of three-phase coexistence area.
Jmse 12 02171 g014
Figure 15. (a) Comparison of saturation data established by 3 modeling methods; (b) histograms of saturation probability distribution established by 3 modeling methods; (c) comparison of porosity data established by 3 modeling methods; (d) histograms of porosity probability distribution established by 3 modeling methods.
Jmse 12 02171 g015
Disclaimer/Publisher’s Note: The statements, opinions and data contained in all publications are solely those of the individual author(s) and contributor(s) and not of MDPI and/or the editor(s). MDPI and/or the editor(s) disclaim responsibility for any injury to people or property resulting from any ideas, methods, instructions or products referred to in the content.

