


Dolphin Health Classifications from Whistle Features

 , , ,
, , ,
Abstract
1. Introduction
2. Materials and Methods
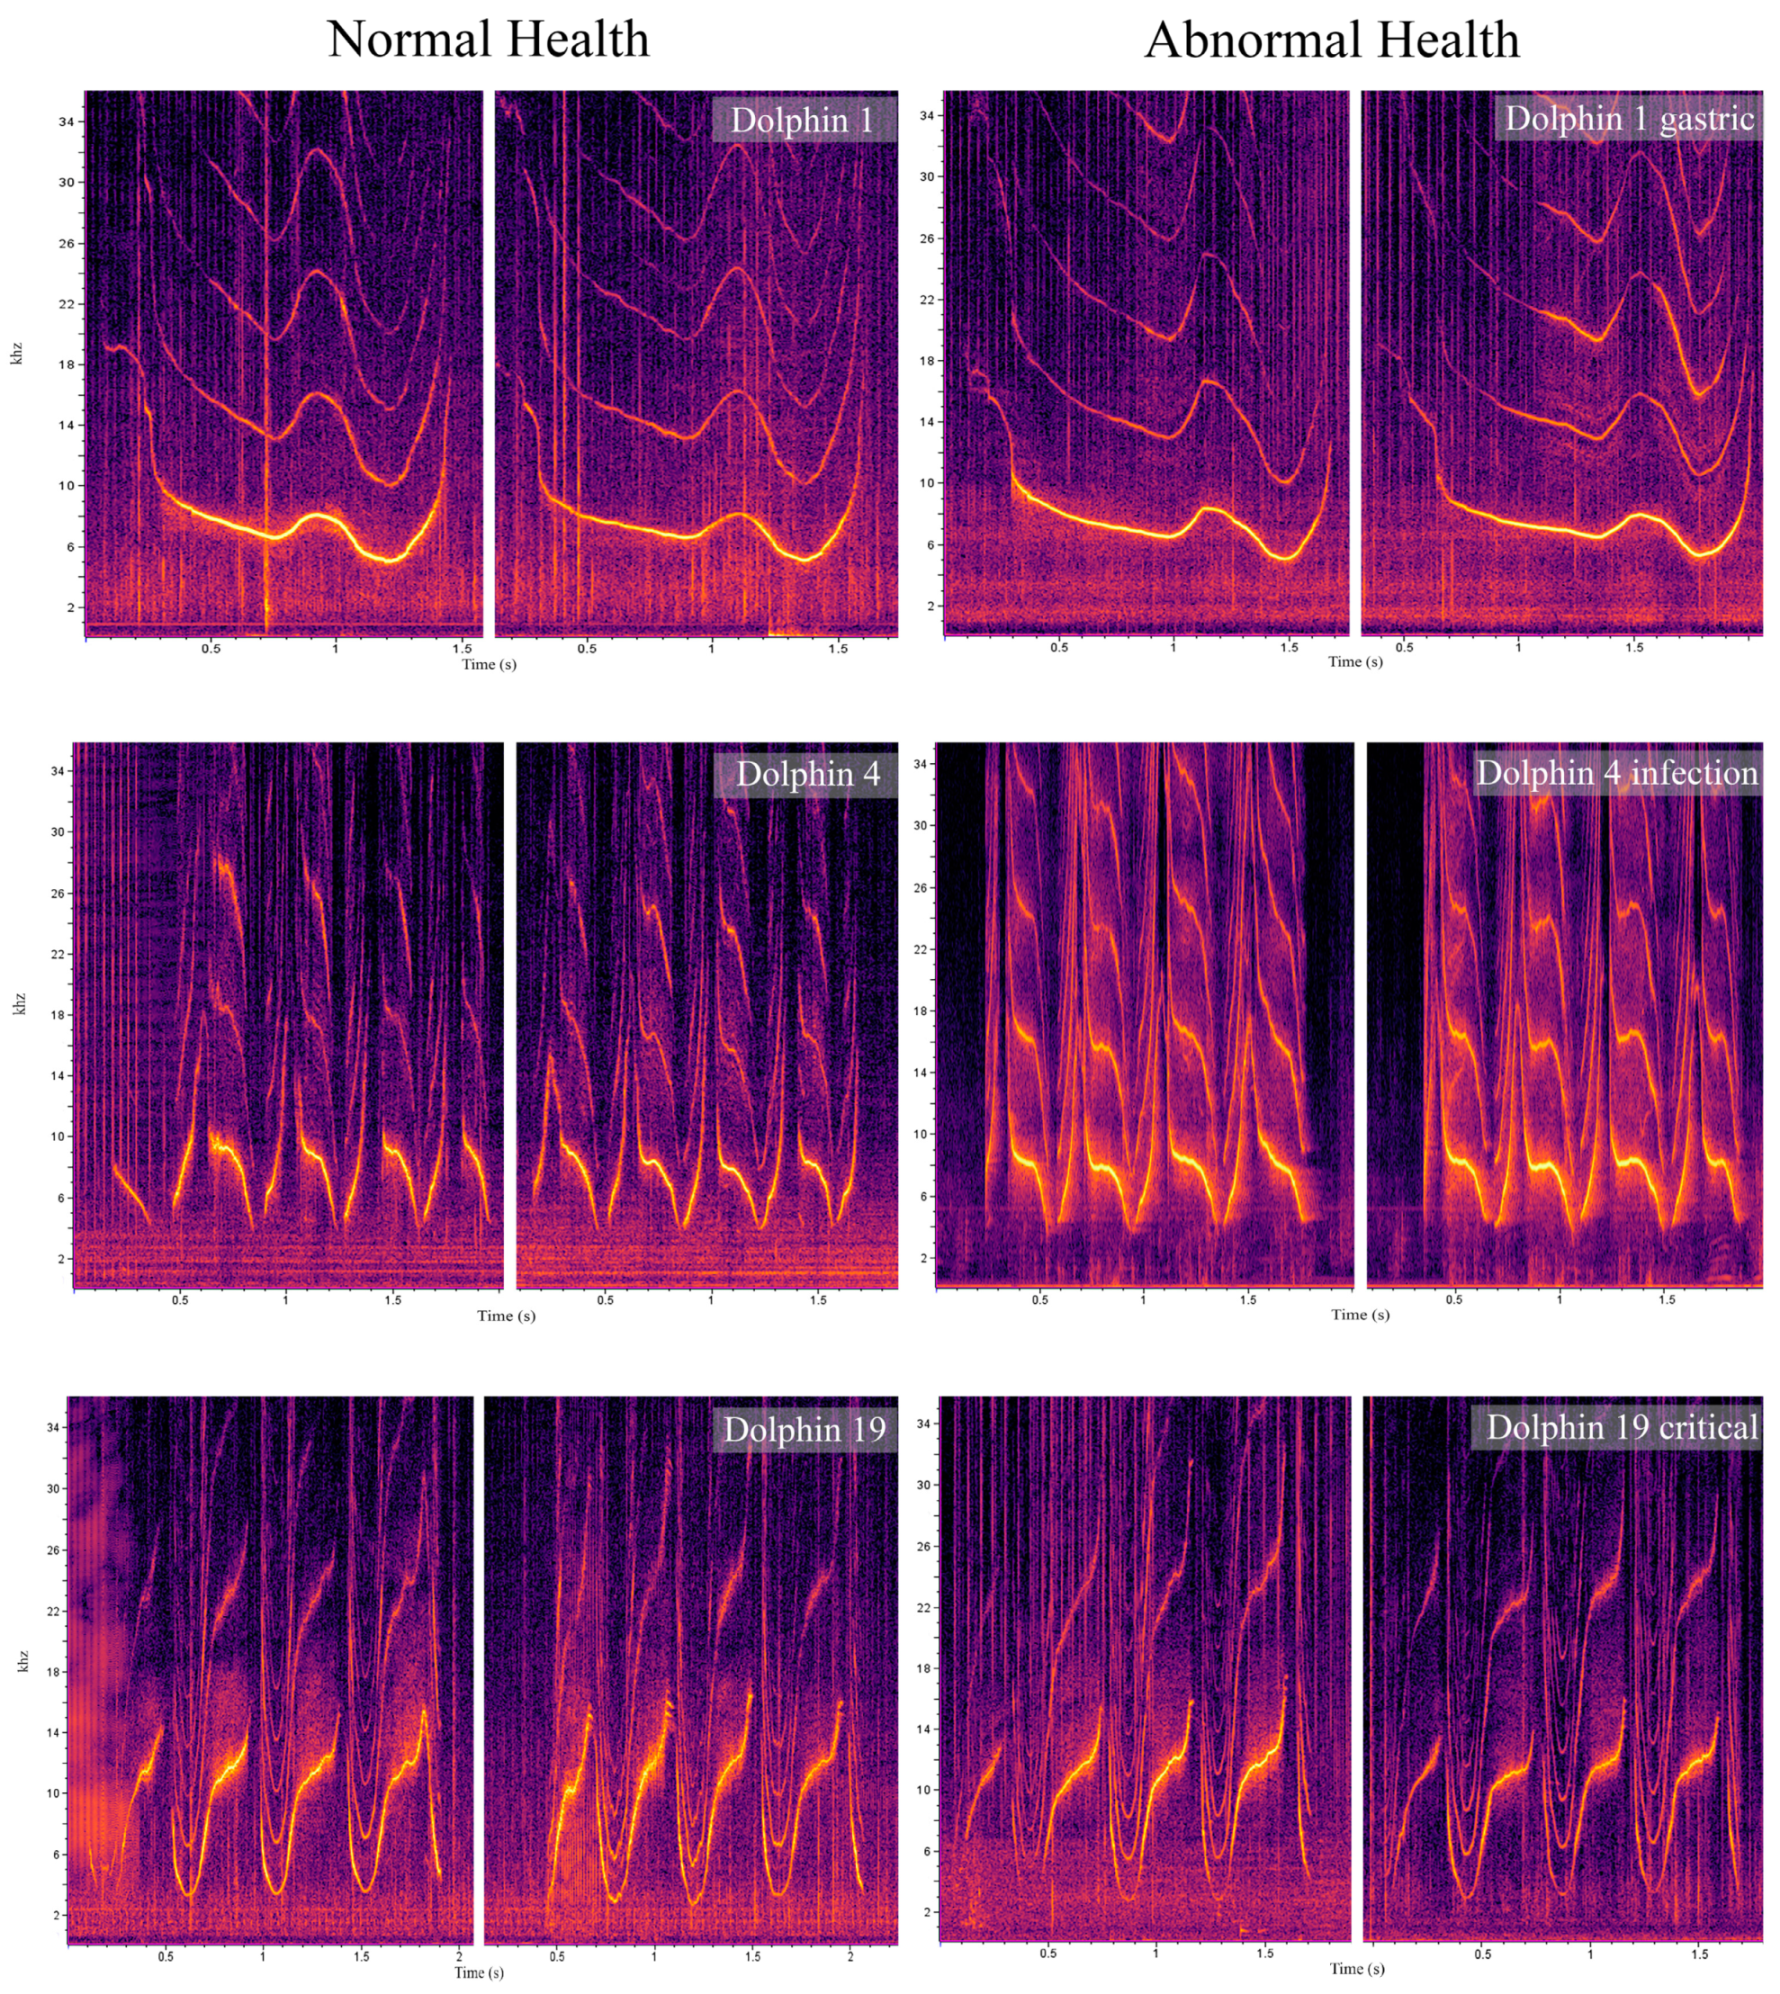
2.1. Acoustic Data
2.2. Health Data
2.3. Features
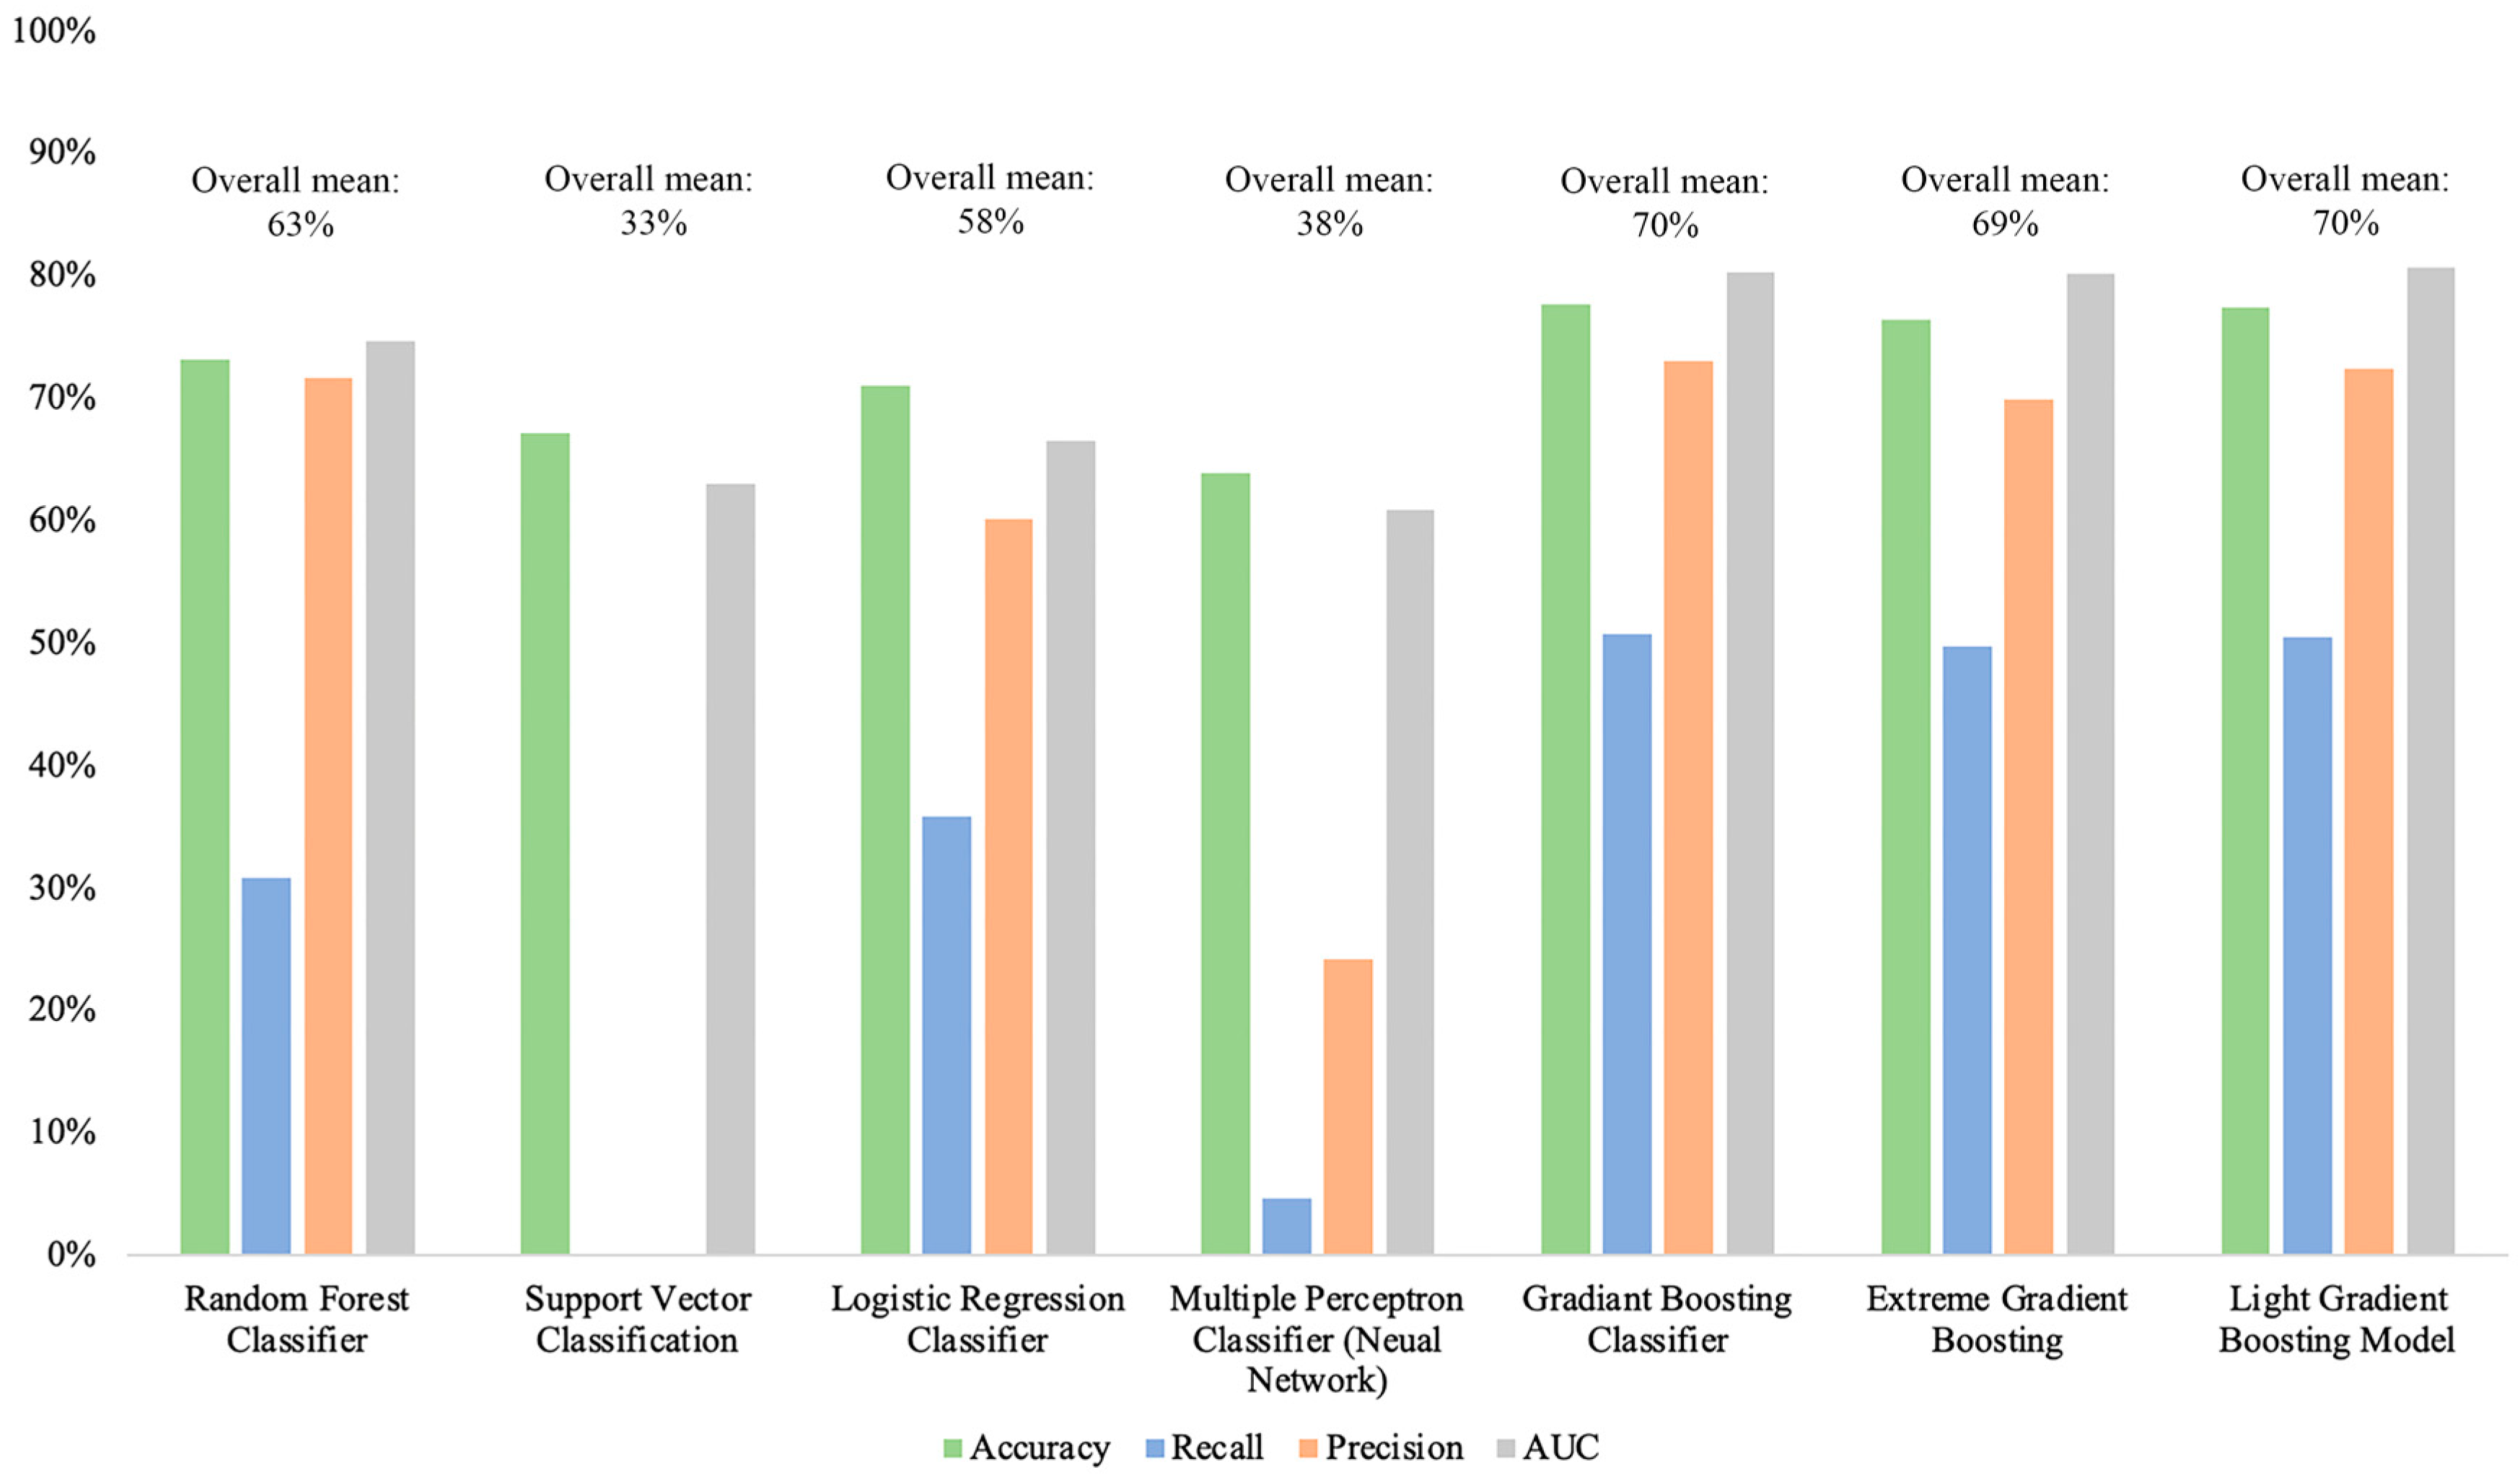
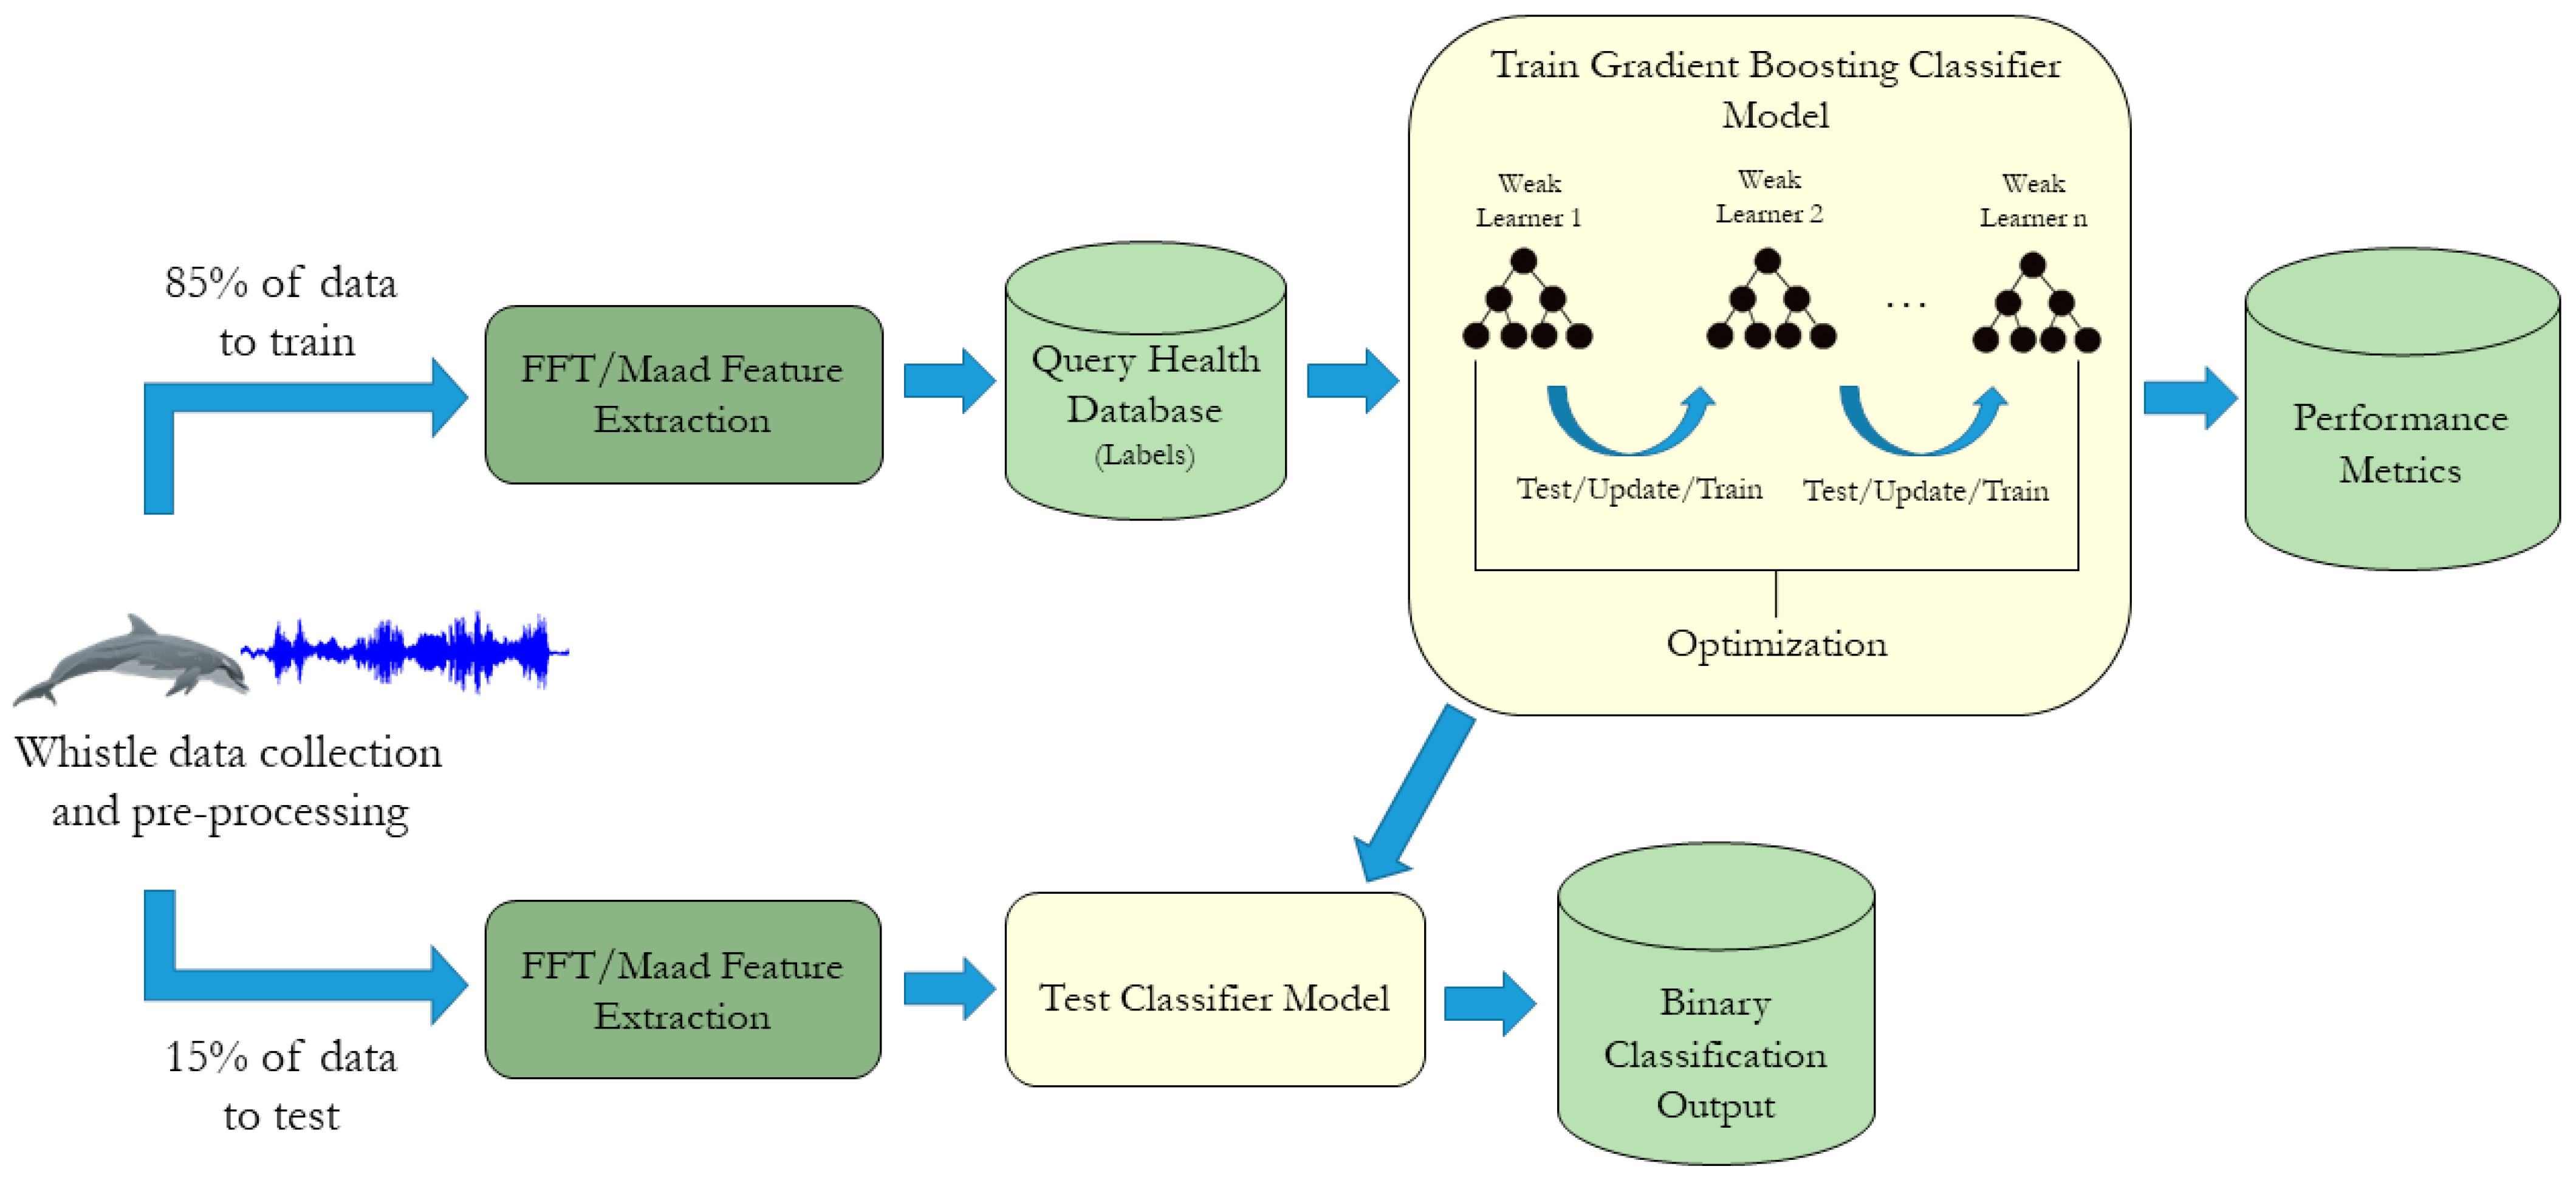
2.4. Model
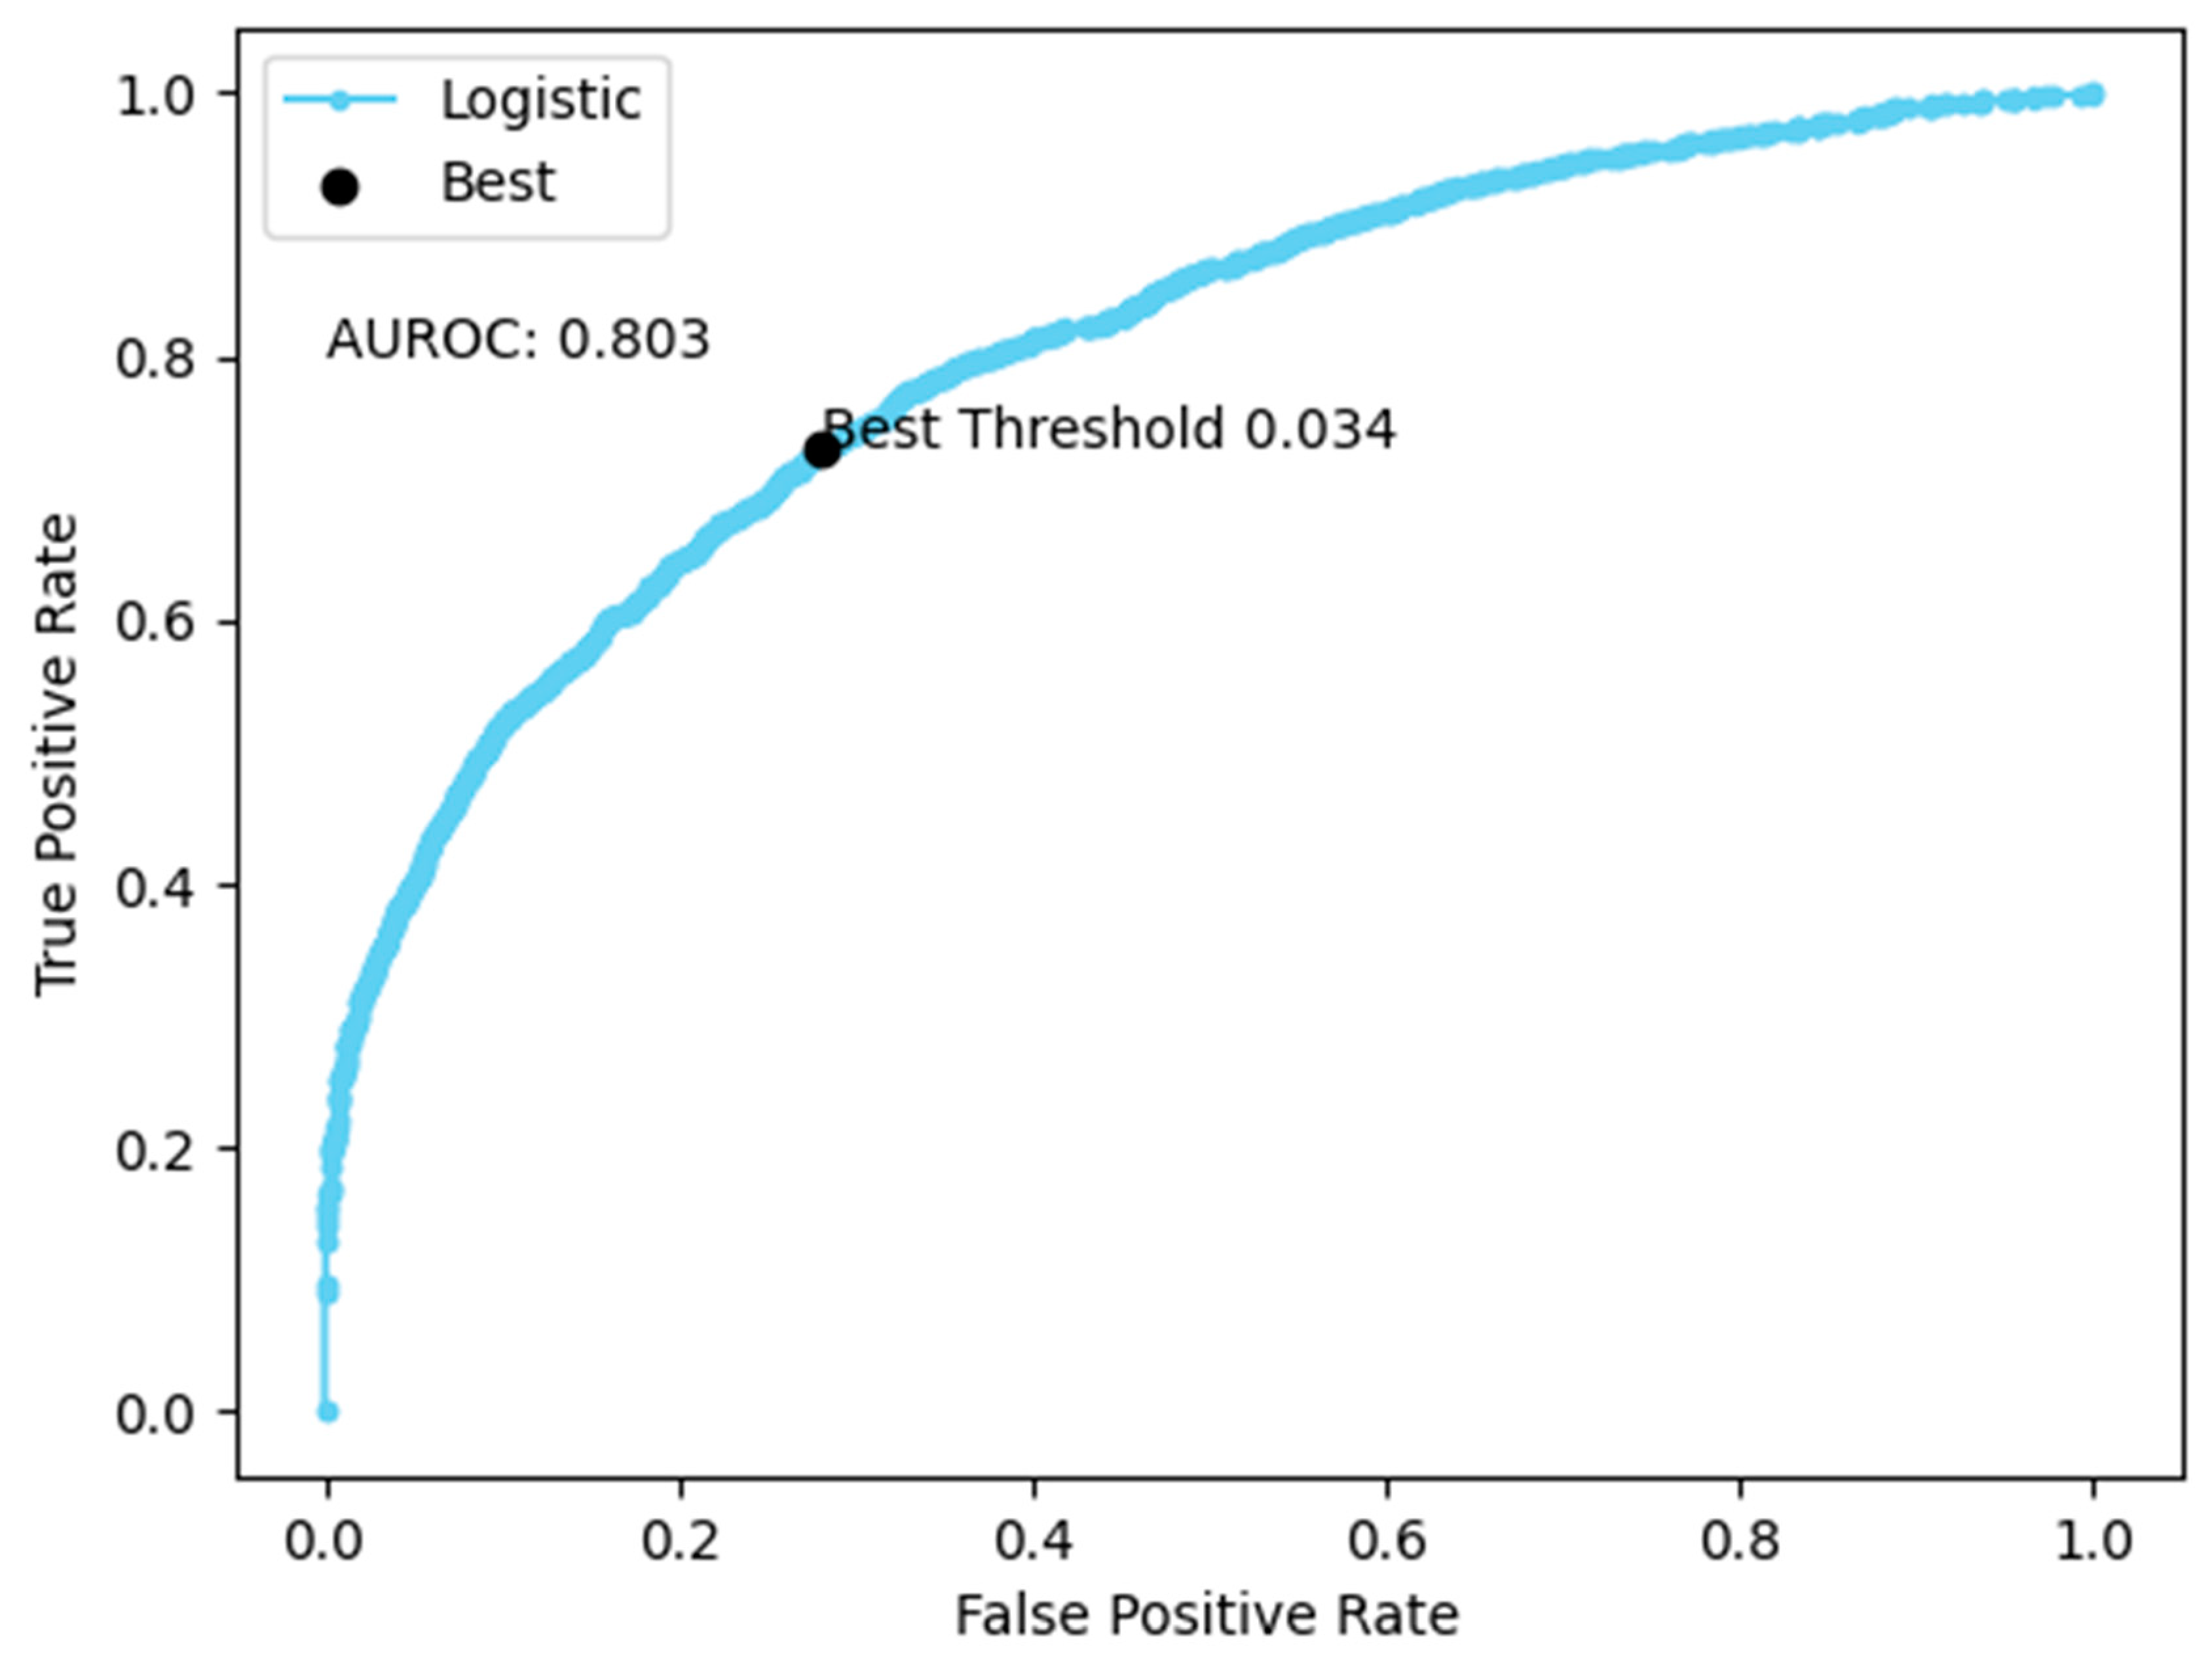
3. Results
4. Discussion
5. Conclusions
Author Contributions
Funding
Institutional Review Board Statement
Informed Consent Statement
Data Availability Statement
Acknowledgments
Conflicts of Interest
References
- Yeates, L.C.; Carlin, K.P.; Baird, M.; Venn-Watson, S.K.; Ridgway, S.H. Nitric oxide in the breath of bottlenose dolphins: Effects of breath hold duration, feeding, and lung disease. Mar. Mam. Sci. 2013, 30, 272–281. [Google Scholar] [CrossRef]
- Fagherazzi, G.; Fischer, A.; Ismael, M.; Despotovic, V. Voice for health: The use of vocal biomarkers from research to clinical practice. Digit. Biomark. 2021, 5, 78–88. [Google Scholar] [CrossRef] [PubMed]
- Rahman, S.M.A.; Ibtisum, S.; Bazgir, E.; Barai, T. The significance of machine learning in clinical disease diagnosis: A review. arXiv 2023, arXiv:2310.16978. [Google Scholar] [CrossRef]
- Aljbawi, W.; Simmons, S.O.; Urovi, V. Developing a multi-variate prediction model for the detection of COVID-19 from crowd-sourced respiratory voice data. arXiv 2022, arXiv:2209.03727. [Google Scholar] [CrossRef]
- Casado, C.Á.; Cañellas, M.L.; Pedone, M.; Wu, X.; López, M.B. Audio-based classification of respiratory diseases using advanced signal processing and machine learning for assistive diagnosis support. arXiv 2023, arXiv:2309.07183. [Google Scholar] [CrossRef]
- Lella, K.K.; Pja, A. A literature review on COVID-19 disease diagnosis from respiratory sound data. AIMS Bioeng. 2021, 8, 140–153. [Google Scholar] [CrossRef]
- Lella, K.K.; Pja, A. Automatic COVID-19 disease diagnosis using 1D convolutional neural network and augmentation with human respiratory sound based on parameters: Cough, breath, and voice. AIMS Public Health 2021, 8, 240–264. [Google Scholar] [CrossRef]
- Suppakitjanusant, P.; Sungkanuparph, S.; Wongsinin, T.; Virapongsiri, S.; Kasemkosin, N.; Chailurkit, L.; Ongphiphadhanakul, B. Identifying individuals with recent COVID-19 through voice classification using deep learning. Sci. Rep. 2021, 11, 19149. [Google Scholar] [CrossRef]
- Calzà, L.; Gagliardi, G.; Favretti, R.R.; Tamburini, F. Linguistic features and automatic classifiers for identifying mild cognitive impairment and dementia. Comput. Speech Lang. 2021, 65, 101113. [Google Scholar] [CrossRef]
- Chen, L.; Dodge, H.H.; Asgari, M. Measures of voice quality as indicators of mild cognitive impairment. Alzheimer’s Dement. 2022, 18, e067393. [Google Scholar] [CrossRef]
- Kong, W.; Jang, H.; Carenini, G.; Field, T.S. Exploring neural models for predicting dementia from language. Comput. Speech Lang. 2021, 68, 101181. [Google Scholar] [CrossRef]
- López-de-Ipiña, K.; Solé-Casals, J.; Eguiraun, H.; Alonso, J.B.; Travieso, C.M.; Ezeiza, A.; Barroso, N.; Ecay-Torres, M.; Martinez-Lage, P.; Beitia, B. Feature selection for spontaneous speech analysis to aid in Alzheimer’s disease diagnosis: A fractal dimension approach. Comput. Speech Lang. 2015, 30, 43–60. [Google Scholar] [CrossRef]
- Bayestehtashk, A.; Asgari, M.; Shafran, I.; McNames, J. Fully automated assessment of the severity of Parkinson’s disease from speech. Comput. Speech Lang. 2015, 29, 172–185. [Google Scholar] [CrossRef] [PubMed]
- Bhattacharjee, S.; Xu, W. VoiceLens: A multi-view multi-class disease classification model through daily-life speech data. Smart Health 2021, 23, 100233. [Google Scholar] [CrossRef]
- Karan, B.; Sahu, S.S.; Orozco-Arroyave, J.R.; Mahto, K. Non-negative matrix factorization-based time-frequency feature extraction of voice signal for Parkinson’s disease prediction. Comput. Speech Lang. 2021, 69, 101216. [Google Scholar] [CrossRef]
- Khan, T.; Lundgren, L.E.; Anderson, D.G.; Nowak, I.; Dougherty, M.; Verikas, A.; Pavel, M.; Jimison, H.; Nowaczyk, S.; Aharonson, V. Assessing Parkinson’s disease severity using speech analysis in non-native speakers. Comput. Speech Lang. 2020, 61, 101047. [Google Scholar] [CrossRef]
- Warule, P.; Mishra, S.P.; Deb, S. Time-frequency analysis of speech signal using Chirplet transform for automatic diagnosis of Parkinson’s disease. Biomed. Eng. Lett. 2023, 13, 613–623. [Google Scholar] [CrossRef]
- Hashim, N.W.; Wilkes, M.; Salomon, R.; Meggs, J.; France, D.J. Evaluation of voice acoustics as predictors of clinical depression scores. J. Voice 2017, 31, 256.e1–256.e6. [Google Scholar] [CrossRef]
- Lee, S.; Suh, S.W.; Kim, T.; Kim, K.; Lee, K.H.; Lee, J.R.; Han, G.; Hong, J.W.; Han, J.W.; Lee, K.; et al. Screening major depressive disorder using vocal acoustic features in the elderly by sex. J. Affect. Disord. 2021, 291, 15–23. [Google Scholar] [CrossRef]
- Lin, D.; Nazreen, T.; Rutowski, T.; Lu, Y.; Harati, A.; Shriberg, E.; Chlebek, P.; Aratow, M. Feasibility of a Machine Learning-Based Smartphone Application in Detecting Depression and Anxiety in a Generally Senior Population. Front. Psychol. 2022, 13, 811517. [Google Scholar] [CrossRef]
- Mundt, J.C.; Vogel, A.P.; Feltner, D.E.; Lenderking, W.R. Vocal acoustic biomarkers of depression severity and treatment response. Biol. Psychiatry 2012, 72, 580–587. [Google Scholar] [CrossRef] [PubMed]
- Ozdas, A.; Shiavi, R.G.; Silverman, S.E.; Silverman, M.K.; Wilkes, D.M. Investigation of vocal jitter and glottal flow spectrum as possible cues for depression and near-term suicidal risk. IEEE Trans. Biomed. Eng. 2004, 51, 1530–1540. [Google Scholar] [CrossRef] [PubMed]
- Silva, W.J.; Lopes, L.; Galdino, M.K.C.; Almeida, A.A. Voice acoustic parameters as predictors of depression. J. Voice 2024, 38, 77–85. [Google Scholar] [CrossRef] [PubMed]
- Sturim, D.; Torres-Carrasquillo, P.A.; Quatieri, T.F.; Malyska, N.; McCree, A. Automatic detection of depression in speech using gaussian mixture modeling with factor analysis. In Proceedings of the 12th Annual Conference of the International Speech Communication Association, Florence, Italy, 28–31 August 2011. [Google Scholar]
- Wasserzug, Y.; Degani, Y.; Bar-Shaked, M.; Binyamin, M.; Klein, A.; Hershko, S.; Levkovitch, Y. Development and validation of a machine learning-based vocal predictive model for major depressive disorder. J. Affect. Disord. 2022, 325, 627–632. [Google Scholar] [CrossRef]
- Weiner, L.; Guidi, A.; Doignon-Camus, N.; Giersch, A.; Bertschy, G.; Vanello, N. Vocal features obtained through automated methods in verbal fluency tasks can aid the identification of mixed episodes in bipolar disorder. Transl. Psychiat 2021, 11, 415. [Google Scholar] [CrossRef]
- France, D.J.; Shiavi, R.G.; Silverman, S.; Silverman, M.; Wilkes, D.M. Acoustical properties of speech as indicators of depression and suicidal risk. IEEE Trans. Biomed. Eng. 2000, 47, 829–837. [Google Scholar] [CrossRef]
- Iyer, R.; Meyer, D. Detection of suicide risk using vocal characteristics: Systematic review. JMIR Biomed. Eng. 2022, 7, e42386. [Google Scholar] [CrossRef]
- Firmino, J.V.; Melo, M.; Salemi, V.; Bringel, K.; Leone, D.; Pereira, R.; Rodrigues, M. Heart failure recognition using human voice analysis and artificial intelligence. Evol. Intell. 2023, 16, 2015–2027. [Google Scholar] [CrossRef]
- Gnyś, P.; Szczęsna, G.; Domínguez-Brito, A.C.; Cabrera-Gámez, J. Automated audio dataset generation tool for classification tasks in marine science. Res. Sq. 2024, preprint. [Google Scholar] [CrossRef]
- Malde, K.; Handegard, N.O.; Eikvil, L.; Salberg, A.B. Machine intelligence and the data-driven future of marine science. ICES J. Mar. Sci. 2019, 77, 1274–1285. [Google Scholar] [CrossRef]
- Oswald, J.N.; Rankin, S.; Barlow, J.; Lammers, M.O. A tool for real-time acoustic species identification of delphinid whistles. J. Acoust. Soc. Am. 2007, 122, 587–595. [Google Scholar] [CrossRef]
- Oswald, J.N.; Erbe, C.; Gannon, W.L.; Madhusudhana, S.; Thomas, J.A. Detection and Classification Methods for Animal Sounds. In Exploring Animal Behavior Through Sound; Erbe, C., Thomas, J.A., Eds.; Springer: Cham, Switzerland, 2022; pp. 269–317. [Google Scholar]
- Roch, M.A.; Brandes, T.S.; Patel, B.; Barkley, Y.; Baumann-Pickering, S.; Soldevilla, M.S. Automated extraction of odontocete whistle contours. J. Acoust. Soc. Am. 2011, 130, 2212–2223. [Google Scholar] [CrossRef]
- Ryazanov, I.; Nylund, A.T.; Basu, D.; Hassellöv, I.-M.; Schliep, A. Deep Learning for Deep Waters: An Expert-in-the-Loop Machine Learning Framework for Marine Sciences. J. Mar. Sci. Eng. 2021, 9, 169. [Google Scholar] [CrossRef]
- Shiu, Y.; Palmer, K.J.; Roch, M.A.; Fleishman, E.; Liu, X.; Nosal, E.-M.; Helble, T.; Cholewiak, D.; Gillespie, D.; Klinck, H. Deep neural networks for automated detection of marine mammal species. Sci. Rep. 2020, 10, 607. [Google Scholar] [CrossRef]
- Bianco, M.J.; Gerstoft, P.; Traer, J.; Ozanich, E.; Roch, M.A.; Gannot, S.; Deledalle, C.-A. Machine learning in acoustics: Theory and applications. J. Acoust. Soc. Am. 2019, 146, 3590–3628. [Google Scholar] [CrossRef]
- Caruso, F.; Dong, L.; Lin, M.; Liu, M.; Gong, Z.; Xu, W.; Alonge, G.; Li, S. Monitoring of a nearshore small dolphin species using passive acoustic platforms and supervised machine learning techniques. Front. Mar. Sci. 2020, 7, 267. [Google Scholar] [CrossRef]
- Ferrari, M.; Glotin, H.; Marxer, R.; Asch, M. Open access dataset of marine mammal transient studies and end-to-end CNN classification. In Proceedings of the HAL Open Science, Glasgow, UK, 19–24 July 2020. [Google Scholar]
- Kong, Q.; Cao, Y.; Iqbal, T.; Wang, Y.; Wang, W.; Plumbley, M.D. PANNs: Large-scale pretrained audio neural networks for audio pattern recognition. arXiv 2019, arXiv:2020.3030497. [Google Scholar] [CrossRef]
- Lai, T.; Ho, T.K.K.; Armanfard, N. Open-Set multivariate time-series anomaly detection. arXiv 2023, arXiv:2310.12294v3. [Google Scholar] [CrossRef]
- Ravanelli, M.; Bengio, Y. Speaker recognition from raw waveform with sincnet. In Proceedings of the 2018 IEEE Spoken Language Technology Workshop, Athens, Greece, 18–21 December 2018; pp. 1021–1028. [Google Scholar] [CrossRef]
- September, M.A.K.; Passino, F.S.; Goldmann, L.; Hinel, A. Extended deep adaptive input normalization for preprocessing time series data for neural networks. arXiv 2023, arXiv:2310.14720. [Google Scholar]
- Li, P.; Liu, X.; Palmer, K.J.; Fleishman, E.; Gillespie, D.; Nosal, E.-M.; Shiu, Y.; Klinck, H.; Cholewiak, D.; Helble, T.; et al. Learning deep models from synthetic data for extracting dolphin whistle contours. In Proceedings of the International Joint Conference of Neural Networks (IJCNN), Glasgow, UK, 19–24 July 2020. [Google Scholar] [CrossRef]
- Nanni, L.; Cuza, D.; Brahnam, S. Building ensemble of resnet for dolphin whistle detection. Appl. Sci. 2023, 13, 8029. [Google Scholar] [CrossRef]
- Usman, A.M.; Ogundile, O.O.; Versfeld, D.J.J. Review of automatic detection and classification techniques for cetacean vocalization. IEEE Access 2020, 8, 105181–105206. [Google Scholar] [CrossRef]
- Roch, M.A.; Soldevilla, M.; Hoenigman, R.; Wiggins, S.M.; Hildebrand, J.A. Comparison of machine learning techniques for the classification of echolocation clicks from three species of odontocetes. Can. Acoust. 2008, 36, 41–47. [Google Scholar]
- Frasier, K.E.; Henderson, E.E.; Bassett, H.R.; Roch, M.A. Automated identification and clustering of subunits within delphinid vocalizations. Mar. Mammal. Sci. 2016, 32, 911–930. [Google Scholar] [CrossRef]
- Frasier, K.E. A machine learning pipeline for classification of cetacean echolocation clicks in large underwater acoustic datasets. PLoS Comput. Biol. 2021, 17, e1009613. [Google Scholar] [CrossRef]
- Jiang, J.; Bu, L.; Duan, F.; Wang, X.; Liu, W.; Sun, Z.; Li, C. Whistle detection and classification for whales based on convolutional neural networks. Appl. Acoust. 2019, 150, 169–178. [Google Scholar] [CrossRef]
- Devi, I.; Dudi, K.; Singh, Y.; Lathwal, S.S. Bioacoustics features as a tool for early diagnosis of pneumonia in riverine buffalo (Bubalus bubalis) calves. Buffalo Bull. 2023, 40, 399–407. [Google Scholar]
- Exadaktylos, V.; Silva, M.; Aerts, J.M.; Taylor, C.J.; Berckmans, D. Real-time recognition of sick pig cough sounds. Comput. Electron. Agric. 2008, 63, 207–214. [Google Scholar] [CrossRef]
- Laurijs, K.A.; Briefer, E.F.; Reimert, I.; Webb, L.E. Vocalisations in farm animals: A step towards positive welfare assessment. Appl. Anim. Behav. Sci. 2021, 236, 105264. [Google Scholar] [CrossRef]
- Manteuffel, G.; Puppe, B.; Schön, P.C. Vocalization of farm animals as a measure of welfare. Appl. Anim. Behav. Sci. 2004, 88, 163–182. [Google Scholar] [CrossRef]
- Marx, G.; Horn, T.; Thielebein, J.; Knubel, B.; Borell, E. von Analysis of pain-related vocalization in young pigs. J. Sound. Vib. 2003, 266, 687–698. [Google Scholar] [CrossRef]
- Mcloughlin, M.P.; Stewart, R.; McElligott, A.G. Automated bioacoustics: Methods in ecology and conservation and their potential for animal welfare monitoring. J. Roy. Soc. Interface 2019, 16, 20190225. [Google Scholar] [CrossRef] [PubMed]
- da Silva, J.P.; de Alencar Nääs, I.; Abe, J.M.; da Silva Cordeiro, A.F. Classification of piglet (Sus Scrofa) stress conditions using vocalization pattern and applying paraconsistent logic Eτ. Comput. Electron. Agric. 2019, 166, 105020. [Google Scholar] [CrossRef]
- Sadeghi, M.; Khazaee, M.; Soleimani, M.R.; Banakar, A. An intelligent procedure for the detection and classification of chickens infected by clostridium perfringens based on their vocalization. Braz. J. Poult. Sci. 2015, 17, 537–544. [Google Scholar] [CrossRef]
- Bergler, C.; Smeele, S.Q.; Tyndel, S.A.; Barnhill, A.; Ortiz, S.T.; Kalan, A.K.; Cheng, R.X.; Brinkløv, S.; Osiecka, A.N.; Tougaard, J.; et al. ANIMAL-SPOT enables animal-independent signal detection and classification using deep learning. Sci. Rep. 2022, 12, 21966. [Google Scholar] [CrossRef]
- Bermant, P.C.; Bronstein, M.M.; Wood, R.J.; Gero, S.; Gruber, D.F. Deep Machine Learning Techniques for the Detection and Classification of Sperm Whale Bioacoustics. Sci. Rep. 2019, 9, 12588. [Google Scholar] [CrossRef]
- Lu, T.; Han, B.; Yu, F. Detection and classification of marine mammal sounds using AlexNet with transfer learning. Ecol. Inform. 2021, 62, 101277. [Google Scholar] [CrossRef]
- Zhong, M.; LeBien, J.; Campos-Cerqueira, M.; Dodhia, R.; Ferres, J.L.; Velev, J.P.; Aide, T.M. Multispecies bioacoustic classification using transfer learning of deep convolutional neural networks with pseudo-labeling. Appl. Acoust. 2020, 166, 107375. [Google Scholar] [CrossRef]
- Zhong, M.; Torterotot, M.; Branch, T.A.; Stafford, K.M.; Royer, J.-Y.; Dodhia, R.; Ferres, J.L. Detecting, classifying, and counting blue whale calls with Siamese neural networks). J. Acoust. Soc. Am. 2021, 149, 3086–3094. [Google Scholar] [CrossRef]
- Janik, V.M.; Sayigh, L.S. Communication in bottlenose dolphins: 50 years of signature whistle research. J. Comp. Physiol. A 2013, 199, 479–489. [Google Scholar] [CrossRef]
- Caldwell, M.C.; Caldwell, D.K. Individualized whistle contours in bottlenosed dolphins (Tursiops truncatus). Nature 1965, 207, 434–435. [Google Scholar] [CrossRef]
- Janik, V.M.; Slater, P.J.B. Context-specific use suggests that bottlenose dolphin signature whistles are cohesion calls. Anim. Behav. 1998, 56, 829–838. [Google Scholar] [CrossRef]
- Jones, B.L.; Daniels, R.; Tufano, S.; Ridgway, S.H. Five members of a mixed-sex group of bottlenose dolphins share a stereotyped whistle contour in addition to maintaining their individually distinctive signature whistles. PLoS ONE 2020, 15, e0233658-15. [Google Scholar] [CrossRef]
- Sayigh, L.S.; Wells, R.S.; Janik, V.M. What’s in a voice? Dolphins do not use voice cues for individual recognition. Anim. Cogn. 2017, 20, 1067–1079. [Google Scholar] [CrossRef]
- Watwood, S.L.; Tyack, P.L.; Wells, R.S. Whistle sharing in paired male bottlenose dolphins, Tursiops truncatus. Behav. Ecol. Sociobiol. 2004, 55, 531–543. [Google Scholar] [CrossRef]
- Madsen, P.T.; Jensen, F.H.; Carder, D.; Ridgway, S.H. Dolphin whistles: A functional misnomer revealed by heliox breathing. Biol. Lett. 2012, 8, 211–213. [Google Scholar] [CrossRef]
- Madsen, P.T.; Siebert, U.; Elemans, C.P.H. Toothed whales use distinct vocal registers for echolocation and communication. Science 2023, 379, 928–933. [Google Scholar] [CrossRef]
- Ridgway, S.; Carder, D. Nasal pressure and sound production in an echolocating white whale, Delphinapterus leucas. In Animal Sonar; Nachtigall, P.E., Moore, P., Eds.; Plenum Publishing Corporation: New York, NY, USA, 1988; pp. 53–60. [Google Scholar]
- Sportelli, J.J.; Jones, B.L.; Ridgway, S.H. Non-linear phenomena: A common acoustic feature of bottlenose dolphin (Tursiops truncatus) signature whistles. Bioacoustics 2022, 32, 241–260. [Google Scholar] [CrossRef]
- Esch, H.C.; Sayigh, L.S.; Blum, J.E.; Wells, R.S. Whistles as potential indicators of stress in bottlenose dolphins (Tursiops truncatus). J. Mammal. 2009, 90, 638–650. [Google Scholar] [CrossRef]
- Eskelinen, H.C.; Richardson, J.L.; Tufano, S. Stress, whistle rate, and cortisol. Mar. Mammal. Sci. 2020, 38, 765–777. [Google Scholar] [CrossRef]
- Kuczaj, S.A.K.; Frick, E.E.; Jones, B.L.; Lea, J.S.E.; Beecham, D.; Schnöller, F. Underwater observations of dolphin reactions to a distressed conspecific. Learn. Behav. 2015, 43, 289–300. [Google Scholar] [CrossRef]
- Ridgway, S.H.; Far, R.R.; Gourevitch, G. Dolphin hearing and sound production in health and illness. In Hearing and Other Senses; Fay, R.R., Gourevitch, G., Eds.; The Amphora Press: Andover, MA, USA, 1983; pp. 247–296. [Google Scholar]
- Watwood, S.L.; Owen, E.C.G.; Tyack, P.L.; Wells, R.S. Signature whistle use by temporarily restrained and free-swimming bottlenose dolphins, Tursiops truncatus. Anim. Behav. 2005, 69, 1373–1386. [Google Scholar] [CrossRef]
- Janik, V.M.; Dehnhardt, G.; Todt, D. Signature whistle variations in a bottlenosed dolphin, Tursiops truncatus. Behav. Ecol. Sociobiol. 1994, 35, 243–248. [Google Scholar] [CrossRef]
- Jones, B.L.; Oswald, M.; Tufano, S.; Baird, M.; Mulsow, J.; Ridgway, S.H. A system for monitoring acoustics to supplement an animal welfare plan for bottlenose dolphins. J. Zool. Bot. Gard. 2021, 2, 222–233. [Google Scholar] [CrossRef]
- Stevens, P.E.; Hill, H.M.; Bruck, J.N. Cetacean acoustic welfare in wild and managed-care settings: Gaps and opportunities. Animals 2021, 11, 3312. [Google Scholar] [CrossRef]
- Winship, K.A.; Jones, B.L. Acoustic monitoring of professionally managed marine mammals for health and welfare insights. Animals 2023, 13, 2124. [Google Scholar] [CrossRef]
- Bossart, G.D.; Romano, T.A.; Peden-Adams, M.M.; Schaefer, A.M.; Rice, C.D.; Fair, P.A.; Reif, J.S. Comparative innate and adaptive immune responses in Atlantic bottlenose dolphins (Tursiops truncatus) with viral, bacterial, and fungal infections. Front. Immunol. 2019, 10, 1125. [Google Scholar] [CrossRef]
- Handin, R.; Lux, S.; Stossel, T. (Eds.) Blood: Principles and Practice of Hematology; Lippincott Williams and Wilkins: Philadelphia, PA, USA, 2003; 2304p. [Google Scholar]
- McFee, B.; Raffel, C.; Liang, D.; Ellis, D.P.W.; McVicar, M.; Battenberg, E.; Nieto, O. librosa: Audio and music signal analysis in python. In Proceedings of the 14th Python in Science Conference, Austin, TX, USA, 6–12 July 2015; pp. 18–24. [Google Scholar] [CrossRef]
- Tosi, S. Matplotlib for Python Developers; Packt: Birmingham, UK, 2009; 293p. [Google Scholar]
- Ulloa, J.S.; Haupert, S.; Latorre, J.F.; Aubin, T.; Sueur, J. scikit-maad: An open-source and modular toolbox for quantitative soundscape analysis in Python. Methods Ecol. Evol. 2021, 12, 2334–2340. [Google Scholar] [CrossRef]
- Ramos, E.A.; Jones, B.L.; Austin, M.; Eierman, L.; Collom, K.A.; Melo-Santos, G.; Castelblanco-Martínez, N.; Arreola, M.R.; Sánchez-Okrucky, R.; Rieucau, G. Signature whistle use and changes in whistle emission rate in a rehabilitated rough-toothed dolphin. Front. Mar. Sci. 2023, 10, 1278299. [Google Scholar] [CrossRef]
- Venn-Watson, S.K.; Jensen, E.D.; Smith, C.R.; Xitco, M.; Ridgway, S.H. Evaluation of annual survival and mortality rates and longevity of bottlenose dolphins (Tursiops truncatus) at the United States Navy Marine Mammal Program from 2004 through 2013. JAVMA 2015, 246, 893–898. [Google Scholar] [CrossRef]

| Health Classification | Case Type | Definition |
|---|---|---|
| ‘Normal’ | Normal | A focal dolphin had an isolated recording on a date where they did not have any administration of an oral pain medication AND did not have a veterinary observation pertaining to injury, trauma, or abnormal body appearance AND did not have any administration of an antimicrobial medication AND were not administered any gastroprotectant or anti-nausea medication AND did not have evidence of gastritis AND did not have any administration of oral analgesics or ophthalmic medications AND did not have a veterinary observation indicating the presence of an injury, trauma, or abnormal eye appearance. |
| ‘Abnormal’ * | Critical case | A focal dolphin had an isolated recording on a date where they had a blood value within 48 h of the recording that had a white blood cell count > 14 × 103/uL (MMP in-house reference ranges) AND/OR the dolphin received intravenous fluids and/or medications via intravenous or subcutaneous routes AND/OR a focal dolphin had an isolated recording on a date where they had an erythrocyte sedimentation rate > 35 mm/h within 48 h of the recording AND received medical intervention from the veterinary team. |
| Infectious case (non-critical) | A focal dolphin had an isolated recording on a date within the first 10 days of treatment with an antimicrobial OR from the beginning to the end of the course of antimicrobial therapy if less than 10 days; antimicrobials are prescribed for clinical signs indicating general malaise and/or inappetence AND bloodwork indicating a likelihood of bacterial and/or fungal infection (specific analytes or combination or analytes outside of the normal reference range [83,84] AND/OR a relevant clinical sample is culture positive for pathogenic microbe(s). | |
| Gastrointestinal case | A focal dolphin had an isolated recording on a date where they had a gastric sample score that was greater than one, indicating gastritis AND/OR the isolated recording was on a date within the first five days of treatment with a gastrointestinal medication (i.e., gastroprotectant, anti-emetic) OR between the start and end date of the course of that treatment if less than five days, but was also not prescribed meloxicam (a dolphin may be prescribed a prophylactic gastroprotectant medication when given meloxicam). |
| Animal ID | Sex | Age | Normal Whistles | Abnormal Whistles | Total Whistles |
|---|---|---|---|---|---|
| 0 | M | 20 | 1565 | 125 | 1690 |
| 1 | F | 45 | 2861 | 934 | 3795 |
| 2 | F | 21 | 1091 | 162 | 1253 |
| 3 | M | 25 | 924 | 197 | 1121 |
| 4 | M | 32 | 778 | 241 | 1019 |
| 5 | M | 25 | 1227 | 85 | 1312 |
| 6 | F | 42 | 4031 | 2146 | 6177 |
| 7 | M | 43 | 4546 | 6837 | 11,383 |
| 8 | M | 20 | 2904 | 208 | 3184 |
| 9 | F | 11 | 503 | 2117 | 2620 |
| 10 | M | 20 | 442 | 24 | 466 |
| 11 | F | 18 | 553 | 160 | 713 |
| 12 | M | 16 | 368 | 19 | 387 |
| 13 | M | 14 | 365 | 22 | 387 |
| 14 | F | 41 | 527 | 46 | 573 |
| Total | 22,685 | 13,395 | 36,080 |
| Metric | Definition | Equation |
|---|---|---|
| Accuracy | Ratio of correct classifications to all classifications | (True Positives + True Negatives)/Total |
| Precision | Ratio of how often an abnormal classification was true | True Positives/ (True Positives + False Alarms) |
| Recall | Ratio of how often the actual abnormals were correctly classified | True Positives/Total Abnormals |
| F1 Score | A metric to describe the balance between precision and recall | 2(Precision × Recall)/Precision + Recall |
| G-Mean | Balanced metric between sensitivity (true positive) and specificity (true negative) | √Sensitivity-Specificity |
| Primary Concern | Whistles Tested | % Correct |
|---|---|---|
| Normal | 3612 | 71.8% |
| Gastrointestinal | 1126 | 63.4% |
| Infection | 49 | 40.8% |
| Critical | 600 | 94.2% |
| Dolphin | Sex | Age | Normal Whistles | Abnormal Whistles | Whistles Tested | % Correct | % True Abnormal | % True Normal | % False Alarm | % Missed Abnormal |
|---|---|---|---|---|---|---|---|---|---|---|
| 0 | M | 20 | 1565 | 125 | 125 | 76.8 | 2.4 | 74.4 | 13.6 | 9.6 |
| 1 | F | 45 | 2861 | 934 | 376 | 75 | 16.76 | 58.24 | 14.36 | 10.64 |
| 2 | F | 21 | 1091 | 162 | 105 | 85.71 | 3.81 | 81.9 | 7.62 | 6.67 |
| 3 | M | 25 | 924 | 197 | 90 | 76.67 | 15.56 | 61.11 | 12.22 | 11.11 |
| 4 | M | 32 | 778 | 241 | 87 | 65.52 | 9.2 | 56.32 | 14.94 | 19.54 |
| 5 | M | 25 | 1227 | 85 | 114 | 89.47 | 8.77 | 80.7 | 7.02 | 3.51 |
| 6 | F | 42 | 4031 | 2164 | 589 | 76.38 | 37.18 | 39.22 | 15.28 | 8.32 |
| 7 | M | 43 | 4546 | 6837 | 1320 | 87.58 | 63.41 | 24.17 | 5 | 7.42 |
| 8 | M | 20 | 2904 | 280 | 280 | 81.77 | 6.43 | 75.36 | 7.86 | 10.36 |
| 9 | F | 11 | 503 | 2117 | 354 | 97.17 | 89.55 | 7.63 | 0 | 2.82 |
| 10 | M | 20 | 442 | 24 | 23 | 91.3 | 0 | 91.3 | 0 | 8.7 |
| 11 | F | 18 | 553 | 160 | 62 | 82.26 | 17.74 | 64.52 | 6.45 | 11.29 |
| 12 | M | 16 | 368 | 19 | 5 | 80 | 0 | 80 | 20 | 0 |
| 13 | M | 14 | 365 | 22 | 18 | 72.22 | 0 | 72.22 | 11.11 | 16.67 |
| 14 | F | 41 | 527 | 46 | 26 | 92.31 | 7.69 | 84.62 | 0 | 7.69 |
| Whistle Type | Whistles Tested | % Correct | % Incorrect | % True Abnormal | %True Normal | % False Alarms | % Missed Abnormal |
|---|---|---|---|---|---|---|---|
| Signature Whistle | 2452 | 82.11 | 17.89 | 30.26 | 51.88 | 8.28 | 9.58 |
| Group Whistle | 962 | 61.63 | 38.37 | 17.15 | 44.49 | 26.61 | 11.75 |
| Shared Whistle | 348 | 55.74 | 44.26 | 10.92 | 44.83 | 39.37 | 4.89 |
| Non-Signature Whistle | 1574 | 67.56 | 32.44 | 21.79 | 45.81 | 25.92 | 6.48 |
| Signature Whistle Copy | 51 | 56.86 | 43.14 | 21.57 | 35.29 | 25.49 | 17.65 |
Disclaimer/Publisher’s Note: The statements, opinions and data contained in all publications are solely those of the individual author(s) and contributor(s) and not of MDPI and/or the editor(s). MDPI and/or the editor(s) disclaim responsibility for any injury to people or property resulting from any ideas, methods, instructions or products referred to in the content. |
© 2024 by the authors. Licensee MDPI, Basel, Switzerland. This article is an open access article distributed under the terms and conditions of the Creative Commons Attribution (CC BY) license (https://creativecommons.org/licenses/by/4.0/).
Share and Cite
Jones, B.; Sportelli, J.; Karnowski, J.; McClain, A.; Cardoso, D.; Du, M. Dolphin Health Classifications from Whistle Features. J. Mar. Sci. Eng. 2024, 12, 2158. https://doi.org/10.3390/jmse12122158
Jones B, Sportelli J, Karnowski J, McClain A, Cardoso D, Du M. Dolphin Health Classifications from Whistle Features. Journal of Marine Science and Engineering. 2024; 12(12):2158. https://doi.org/10.3390/jmse12122158
Chicago/Turabian StyleJones, Brittany, Jessica Sportelli, Jeremy Karnowski, Abby McClain, David Cardoso, and Maximilian Du. 2024. "Dolphin Health Classifications from Whistle Features" Journal of Marine Science and Engineering 12, no. 12: 2158. https://doi.org/10.3390/jmse12122158
APA StyleJones, B., Sportelli, J., Karnowski, J., McClain, A., Cardoso, D., & Du, M. (2024). Dolphin Health Classifications from Whistle Features. Journal of Marine Science and Engineering, 12(12), 2158. https://doi.org/10.3390/jmse12122158