Article

Case Study of Central Outlet Cap Used in Flow-Through Aquaculture Systems by Using Computational Fluid Dynamics

1
Department of Mechanical Design Engineering, Chonnam National University, 50 Daehak-ro, Yeosu-si 59626, Jeollanam-do, Republic of Korea
2
School of Aerospace Engineering, Gyeongsang National University, Jinju-si 52828, Gyeongsangnam-do, Republic of Korea
3
School of Mechanical and Material Convergence Engineering, Gyeongsang National University, Jinju-si 52725, Gyeongsangnam-do, Republic of Korea
4
Smart Aquaculture Research Center, Chonnam National University, 50 Daehak-ro, Yeosu-si 59626, Jeollanam-do, Republic of Korea
5
Department of Smart Fisheries Resource Management, Chonnam National University, 50 Daehak-ro, Yeosu-si 59626, Jeollanam-do, Republic of Korea
6
Department of Marine Production Management, Chonnam National University, 50 Daehak-ro, Yeosu-si 59626, Jeollanam-do, Republic of Korea
*
Authors to whom correspondence should be addressed.
These authors contributed equally to this work as co-first author.
J. Mar. Sci. Eng. 2024, 12(11), 2006; https://doi.org/10.3390/jmse12112006
Submission received: 17 October 2024 / Revised: 5 November 2024 / Accepted: 5 November 2024 / Published: 7 November 2024
(This article belongs to the Section Marine Aquaculture)

Abstract

:
The consumption of aquaculture products and, in turn, the importance of the aquaculture industry are increasing with the depletion of global fishery resources. In the flow-through aquaculture systems used in Korea, olive flounders are overcrowded near the central outlet, causing stress, and the sharp central outlet hole injures the olive flounders. Therefore, in this study, we propose a central outlet cap that can prevent overcrowding and injuries in olive flounders near the central outlet in a flow-through aquaculture system. An L27(35) orthogonal array was constructed using five central outlet cap design variables, and computational fluid dynamics (CFD) analysis was performed for each experimental point. The pressure drop between the tank inlet and the central outlet was evaluated, and the experimental point with the highest pressure drop was identified. In addition, the internal fluid velocity of the experimental point with the highest pressure drop value was confirmed to be improved compared to the initial flow-through aquaculture system. The central outlet cap designed in this study is expected to be economically beneficial to aquaculture by reducing the overcrowding of olive flounder and preventing injury to olive flounder while improving the internal fluid velocity.

1. Introduction

According to the Food and Agriculture Organization (FAO) of the United Nations, fish consumption is increasing worldwide because of rising incomes and technological advances [1]. In 2020, global fish production stood at 178 million tons, of which 88 million tons originated from aquaculture-based production. According to Iber B and Kasan N [2], the aquaculture industry could curb the demand for wild fish and thereby halt overfishing. In addition, with the depletion of global fishery resources, strengthening of international fishery laws, and rising demand for aquaculture products, the aquaculture industry is gaining increasing importance, and fish-farming ecosystems are improving [3]. Therefore, the world is expected to rely primarily on aquaculture to meet the growing demand for fish [4]. Farmed fish are affected by several stressors including overcrowding, water temperature, dissolved oxygen concentration, stocking density, and various water quality parameters. These stressors can significantly affect the physiology and activity of farmed fish, leading to excessive energy consumption and adverse effects on their health and immunity and consequently increasing their mortality rates [5,6]. Stress also causes some components of the immune system to lose their function, making fish susceptible to infections and diseases [7], resulting in economic losses for fish farmers [5]. Therefore, fish stress management is a critical research issue facing the aquaculture industry, as the death of farmed fish can financially destabilize the aquaculture industry and seriously damage its foundation.
Olive flounder is currently farmed in approximately 30.5% of all farms in the aquaculture industry in Korea, making it the most widely farmed species [8]. A field survey of a flow-through aquaculture system for olive flounder farming confirmed that these fish were continuously overcrowded in the central outlet. According to Yin et al. [9], overcrowding is a stressor for farmed fish, and it can lead to increased mortality of olive flounder in a flow-through aquaculture system. In addition, the sharp edges of the central outlet cause injuries to overcrowded olive flounders.
Researchers have analyzed the flow characteristics of various aquaculture systems using computational fluid dynamics (CFD) to optimize them [10,11,12]. In addition, research on various structures, such as net-type structures in water and floating porous nets for aquaculture, has been conducted recently [13,14]. For example, Oca et al. [15] considered the design variables of a circular tank inlet and calculated the optimal values of parameters such as the flow rate, inlet diameter, and water level; further, they analyzed the flow rate inside the tank. An et al. [16] examined the water column diameter and outlet location to optimize the inlet topography according to the flow characteristics of the tank. Although various studies have investigated aquaculture systems, few have aimed to prevent the overcrowding of olive flounder by adding other structures in such systems. Therefore, the authors propose a central outlet cap that can reduce the degree of overcrowding of olive flounder at the central outlet and prevent their injury. We performed a CFD analysis of the flow-through aquaculture system to determine the optimal shape of the central outlet cap based on the pressure drop inside the system.
In this study, the pressure drop is the average total pressure displacement between the tank inlet and the central outlet. Previous studies have shown that the pressure drop increases with increasing fluid velocity [17,18]. Therefore, in a flow-through aquaculture system, the pressure drop caused by friction between the fluid and the central outlet cap is used as a proxy for the fluid velocity. The dissolved oxygen concentration in the tank, which is closely related to the mortality of farmed fish, affects the growth rate of the fish. A low dissolved oxygen concentration can lead to decreased food intake, poor response to stimulation, and lethargy in farmed fish [19]. According to Pastore et al. [20], because dissolved oxygen increases as the current velocity increases, increasing the fluid velocity inside the flow-through aquaculture system can have a positive effect on the tank.
In this study, we attempt to derive a central outlet cap shape that can reduce the overcrowding of olive flounder near the central outlet of a flow-through aquaculture system and prevent the surfacing of olive flounder. The flow chart of this study is shown in Figure 1. Five central outlet cap design variables were selected, and an orthogonal array was created according to the design variables and levels using Minitab 21.4.1 software. CFD analysis was performed for each experimental point of the orthogonal array to derive an experimental point with a high-pressure drop.

2. Model Design and Methods for Numerical Analysis and Simulation

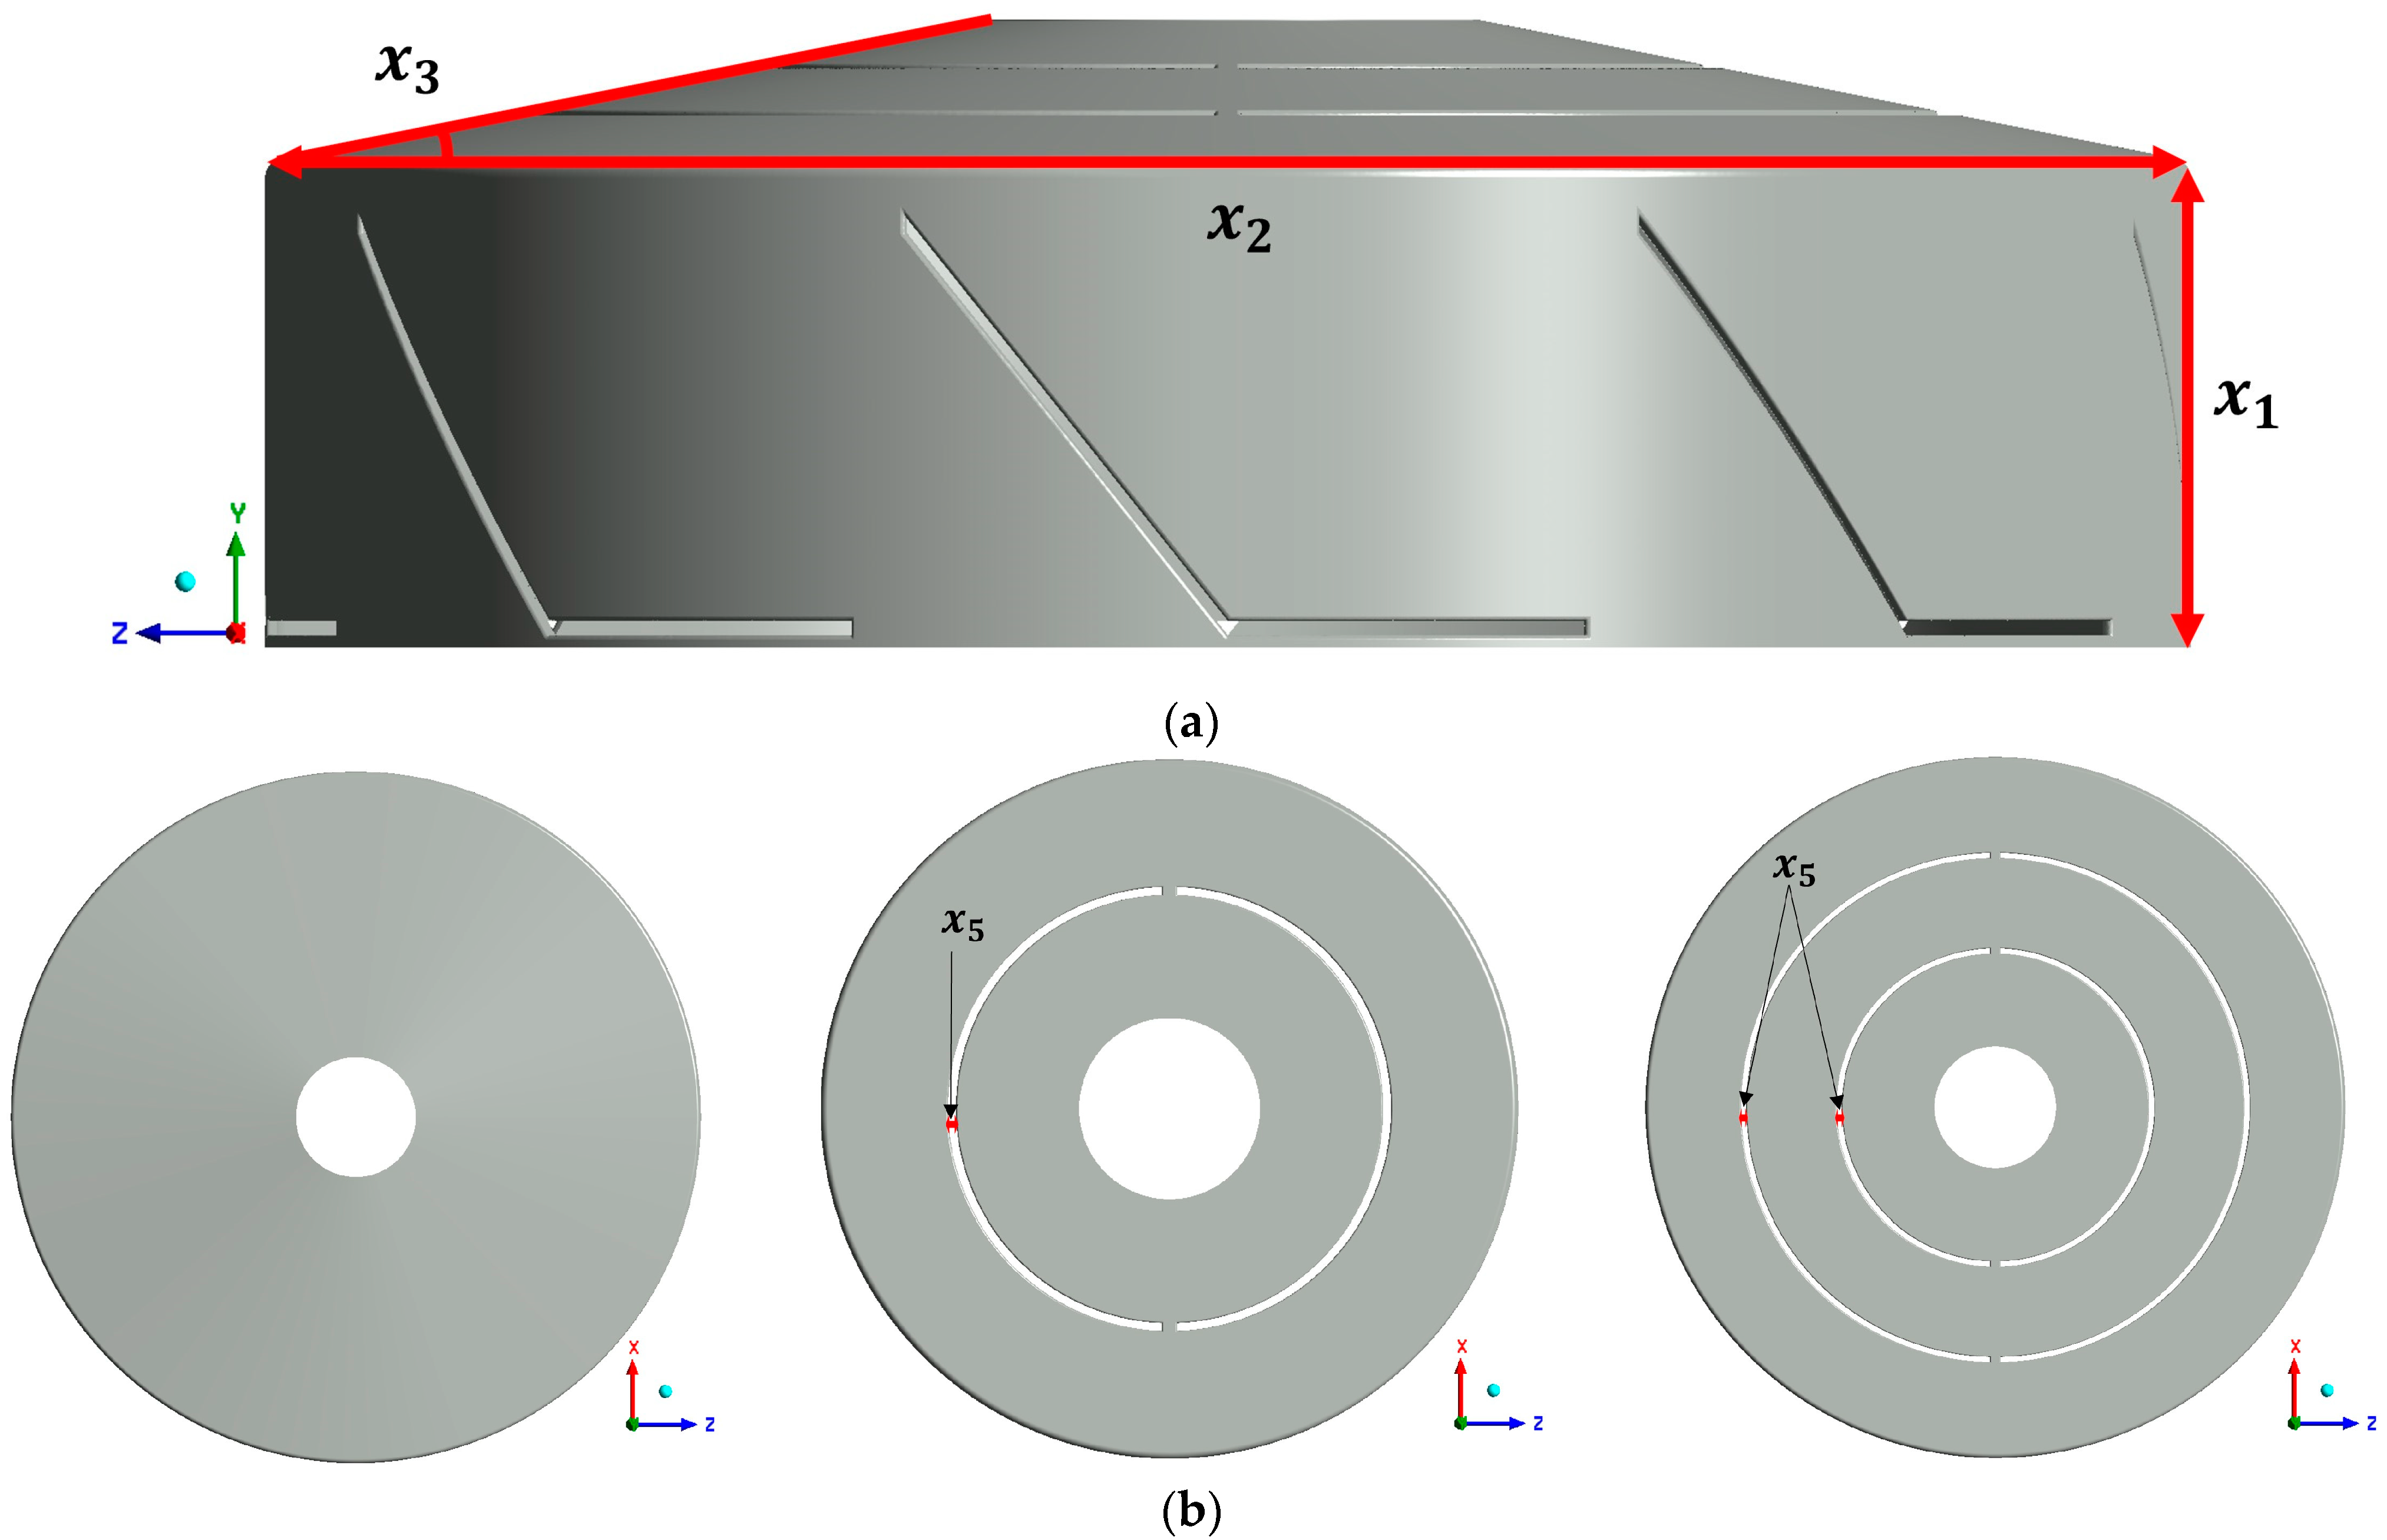
2.1. Geometric Model and Boundary Conditions

KWON I and KIM T [21] determined the optimal shape of the flow-through aquaculture system used in Korea. The present study utilized this optimal shape, as shown in Figure 2. The flow-through aquaculture system has a diameter of 5000 mm, a wall height of 1000 mm, a water depth of 400 mm, and a bottom inclined at 3°. It has four tank inlets, and each tank inlet has six inlet holes. Further, it has one outlet with 10 holes at its center. Water flows into the tank at a flow rate of 4.167 kg/s through the four tank inlets, and atmospheric pressure conditions are created at the central outlet [21]. The tank inlet, central outlet, and central outlet cap are made of polyvinyl chloride (PVC), and the rest of the tank is made of concrete. As shown in Figure 3, the central outlet cap is installed on the central outlet.

2.2. Numerical Model Set Up

ANSYS Fluent 2023 R2 software, based on the finite volume method (FVM), was used to analyze the pressure drop in the flow-through aquaculture system using CFD [22]. The continuity equation and Reynolds-averaged Navier–Stokes (RANS) equation were solved using ANSYS Fluent to calculate the fluid flow in the flow-through aquaculture system, and the governing equations were discretized using the FVM. The steady-state condition was considered, and the shear stress transfer k ω (SST k ω ) model developed by Menter [23] was used to effectively combine the robust and accurate k ω formulation in the near-wall region with the free-flow independence of the k ε formulation in the far-field region [24]. The SST k ω turbulence model has been used to perform CFD analyses in various aquaculture studies [25,26,27,28,29]. The turbulent kinetic energy ( k ) and specific dissipation rate ( ω ) of SST k ω are expressed in Equations (1) and (2), respectively.
t ρ k + x i ρ k u i = x j Γ k k x j + G k Y k + S k
t ρ ω + x i ρ ω u i = x j Γ ω ω x j + G ω Y ω + D ω + S ω
where t is the time, ρ is the fluid density, and u is the fluid velocity. G k denotes the production of turbulence kinetic energy and G ω represents the generation of ω . The calculated values Y k and Y ω represent the dissipation of k and ω , respectively, because of turbulence. D ω is the cross-diffusion term, and S k and S ω are user-defined source terms. Here, the effective diffusivities of k and ω are expressed in Equations (3) and (4), respectively.
Γ k = μ + μ t σ k ,
Γ ω = μ + μ t σ ω
where σ k and σ ω denote the Prandtl numbers of k and ω , and they are expressed in Equations (5) and (6), respectively.
σ k = 1 F 1 σ k , 1 + ( 1 F 1 ) σ k , 2 ,
σ ω = 1 F 1 σ ω , 1 + ( 1 F 1 ) σ ω , 2
The turbulent viscosity is expressed in Equation (7), where S is the magnitude of the strain rate. The low number correction coefficient ( α * ) is expressed in Equation (8), where R e t and α 0 * are expressed in Equations (9) and (10), respectively. Here, β i = 0.072.
μ t = ρ k ω 1 m a x 1 α * , S F 2 ) α 1 ω ,
α * = α * α 0 * + R e t R k 1 + R e t R k
R e t = ρ k μ ω
α 0 * = β i x
The blending functions F 1 and F 2 are given by Equations (11) and (12), respectively:
F 1 = tanh m i n m a x k 0.09 ω y , 500 μ ρ ω y 2 , 4 ρ k σ ω , 2 D ω + y 2 4 ,
F 2 = tanh m a x 2 k 0.09 ω y , 500 μ ρ ω y 2 2
where y is the distance to the next surface, and D ω + , expressed in Equation (13), is the positive portion of the cross-diffusion term.
D ω + = m a x 2 ρ σ ω , 2 ω ω x j , 10 10
The constants of the SST k ω model used in this study are as follows: σ k , 1 = 1.176 ,   σ k , 2 = 1 , σ ω , 1 = 2 ,   a n d   σ ω , 2 = 1.168 .
The CFD analysis performed in this study used a coupled method within the pressure–velocity coupling algorithm that is easy to analyze in the steady state and can solve the momentum- and pressure-based continuity equations simultaneously [24].

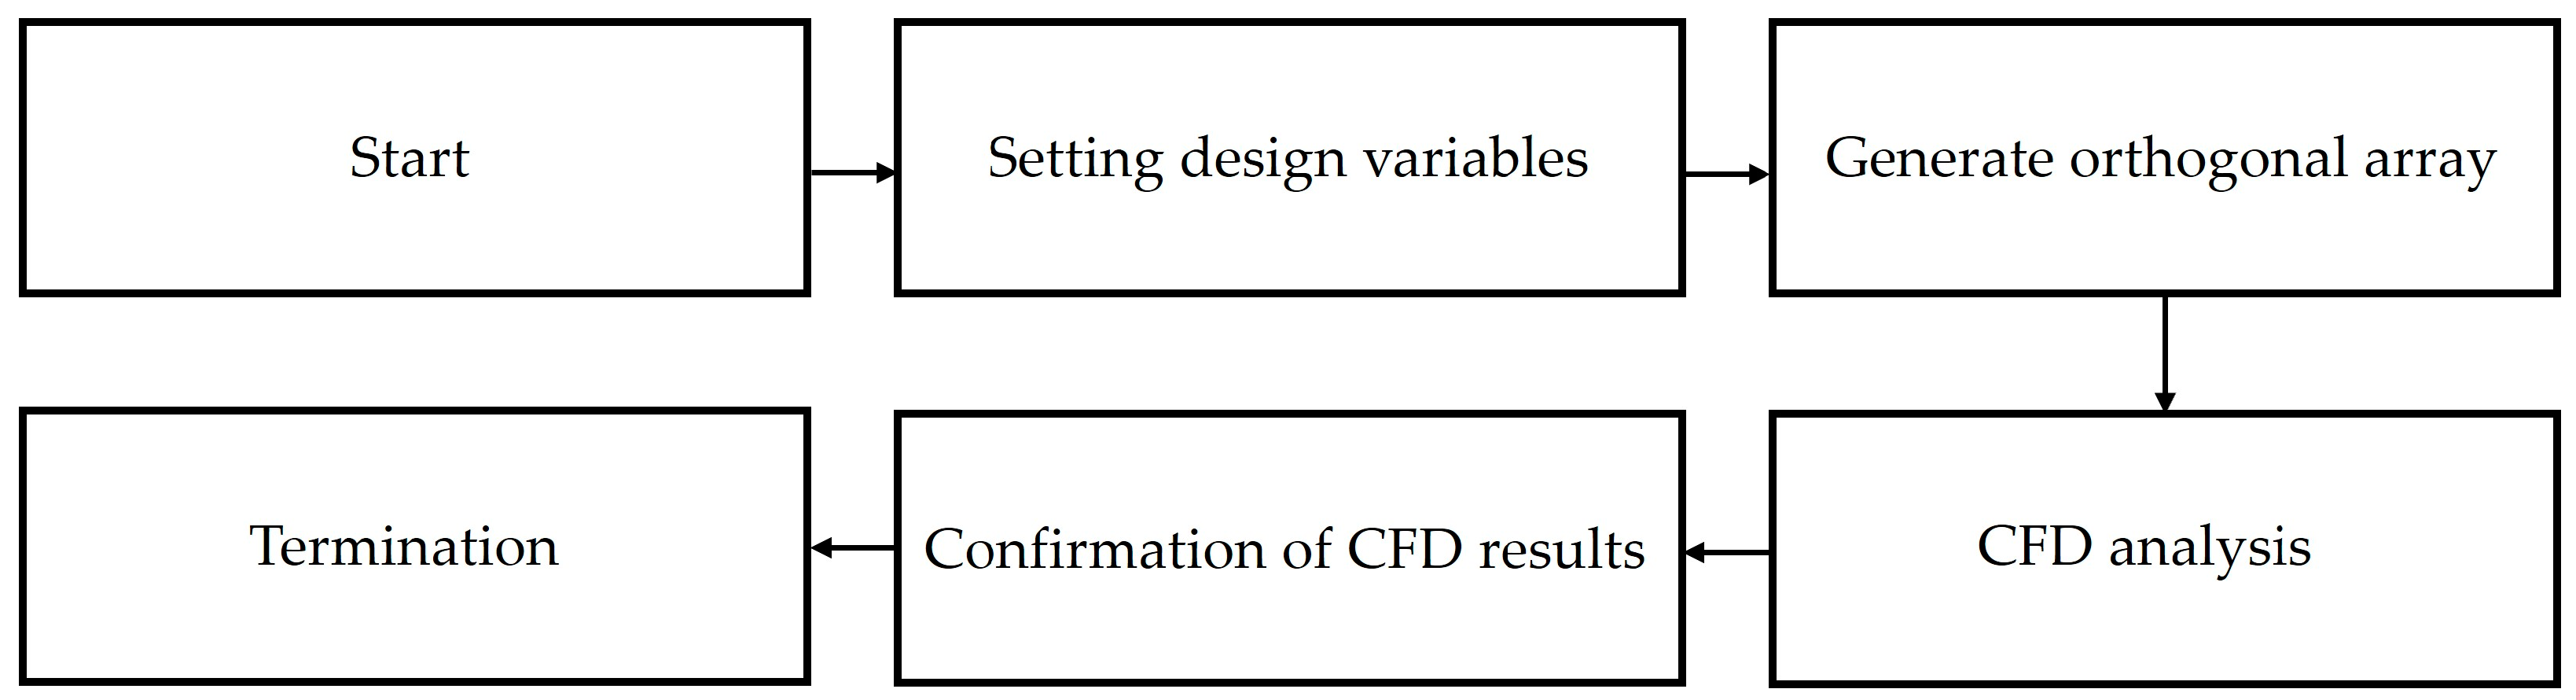
2.3. Definition of Orthogonal Array
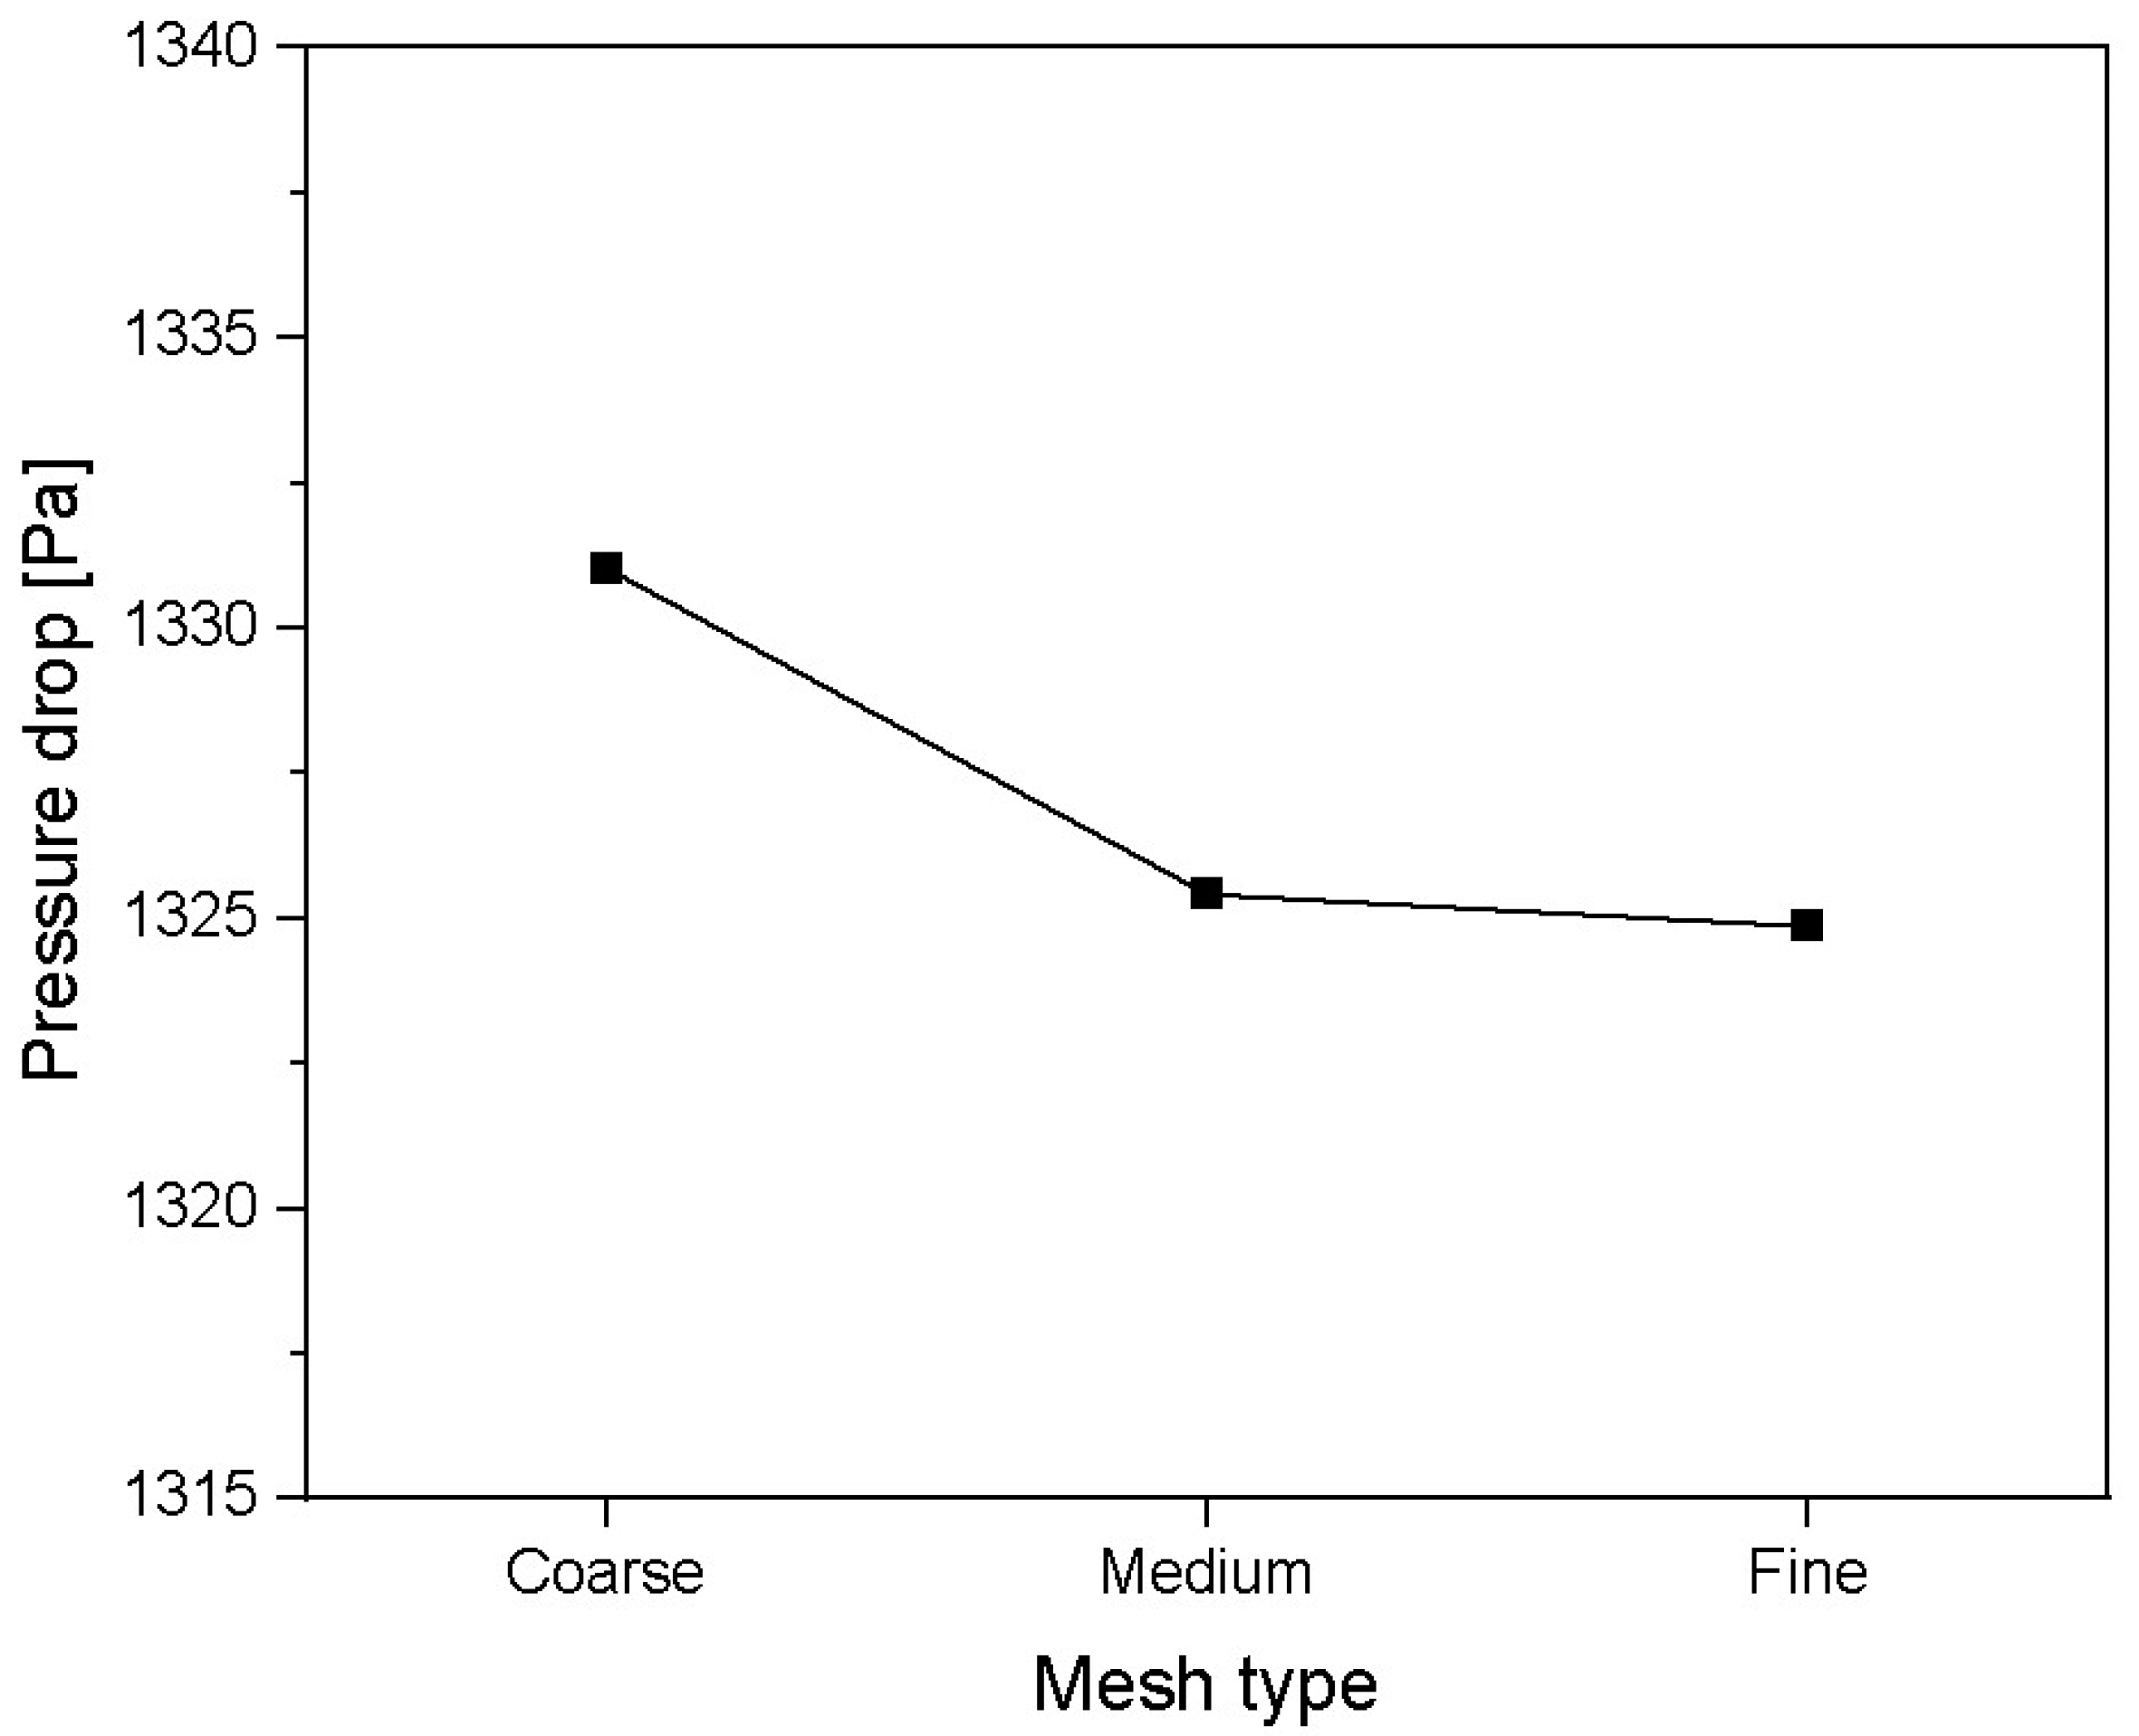
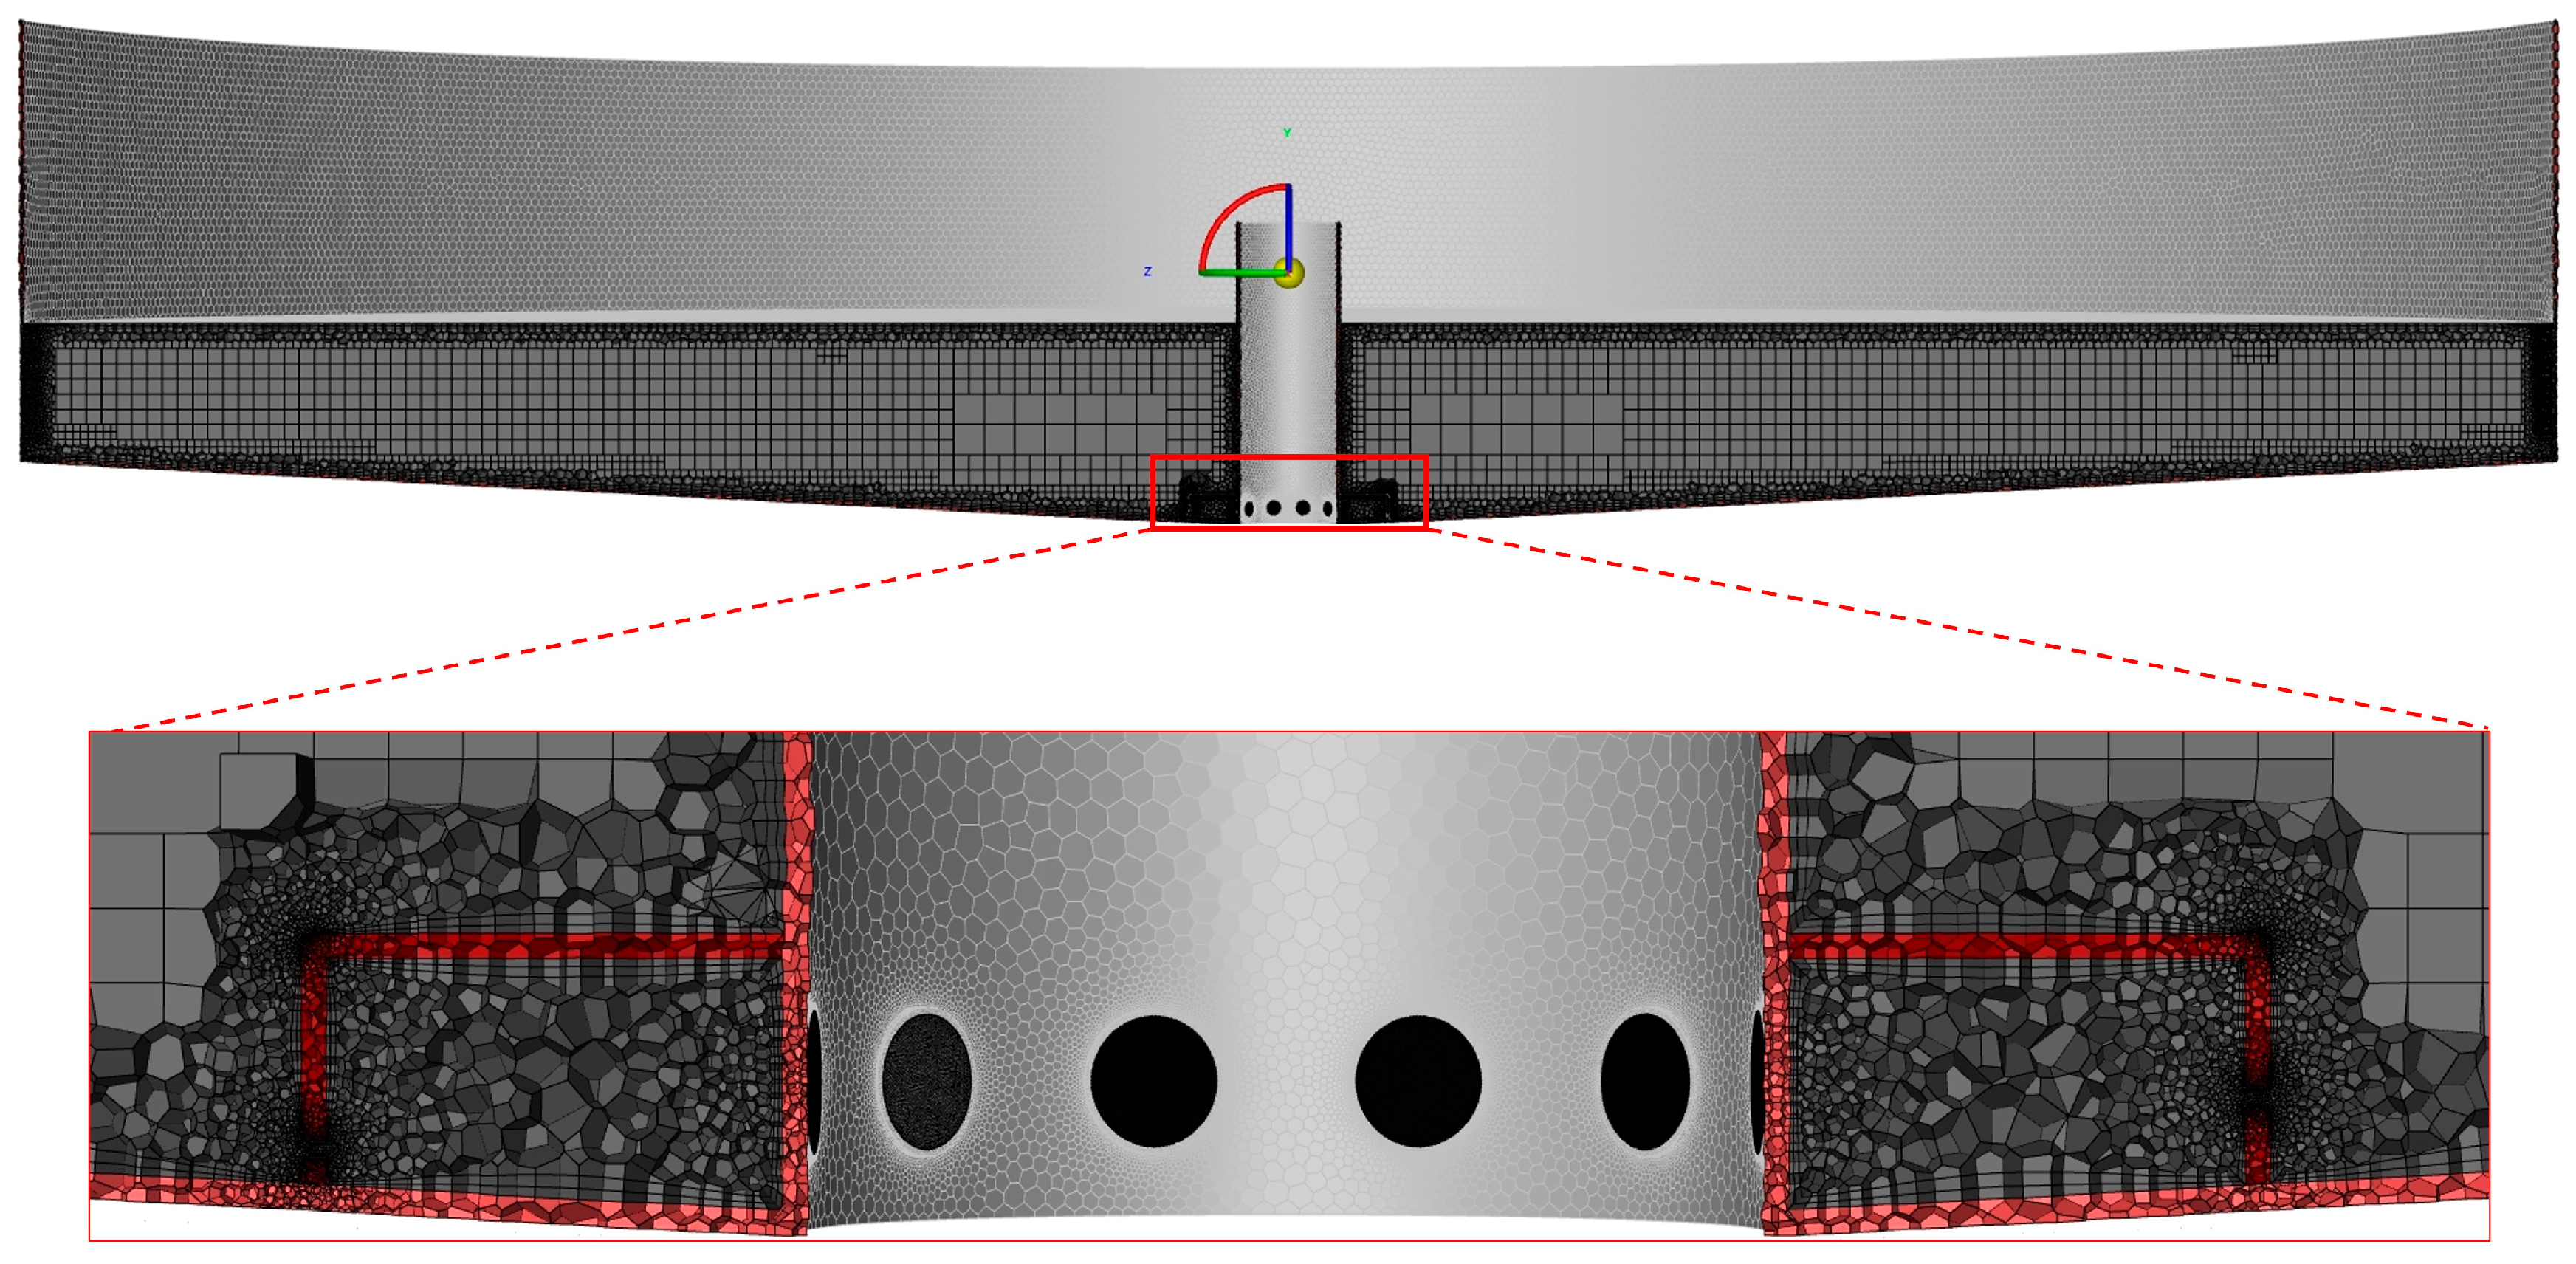
To determine the optimal shape of the central outlet cap, five design variables were selected as follows: vertical length ( x 1 ) [mm], horizontal length ( x 2 ) [mm], upper angle ( x 3 ) [°], number of upper line holes ( x 4 ) [number], and hole width ( x 5 ) [mm]. Figure 4a depicts x 1 , x 2 , x 3 , and x 5 of the central outlet cap, and Figure 4b shows the shapes of the central outlet cap according to the number of upper line holes. In addition, eight holes were created on the side of the central outlet cap for solid discharge in the flow-through aquaculture system.
The values of each design variable of the central outlet cap by level are shown in Table 1. When the number of design variables is 5 and the number of levels of each design variable is 3, the total number of treatment combinations in the full-factorial design (35) is 243, which is very large. Therefore, we reduced the analysis time by using an orthogonal array that can efficiently analyze the central outlet cap without testing all combinations of design variables. An orthogonal array is a numerical matrix in which each row represents a level and each column represents a design variable. This array is called an orthogonal one because each column can be evaluated independently of the other columns [30]. This experimental design considered the interaction effects between x 2 and x 3 and those between x 2 and x 4 based on preliminary information; the results of the orthogonal array analysis are summarized in Table 2. Various optimization studies have used orthogonal arrays to efficiently determine and analyze the combination of factor levels to be used in each experimental run [31,32,33].

2.4. Grid Models

We attempted to create a poly-hexacore grid model of the flow-through aquaculture system and the central outlet cap using ANSYS Fluentmesh to perform CFD analysis. To determine the mesh size of the analysis model, a mesh independence test was performed on experimental number 1, and the results are shown in Figure 5. The mesh independence tests were conducted using coarse (cell count = 1,873,547), medium (cell count = 3,877,453), and fine (cell count = 8,218,916) mesh types. While the pressure drop values of the medium and fine meshes are similar, that of the coarse mesh differs from those of the other two mesh types. In addition, the analysis time efficiency of the fine mesh was low due to the excessively long CFD analysis time compared to those for the coarse and medium meshes. Therefore, in this study, a grid model was created for each experimental point by using the medium mesh to achieve a balance between the mesh accuracy of the central outlet cap and analysis time efficiency. As shown in Figure 6, the tank inlet, central outlet, and central outlet cap were set to cell sizes of 0.5 to 8 mm to obtain accurate analysis results. The number of cells in the experimental points ranges from 2 million to 12 million and varies greatly depending on the shape of the central outlet cap.

3. Result

CFD analysis was performed to investigate the flow in the flow-through aquaculture system. This numerical analysis was performed to determine the pressure drop difference between the inlet and outlet caused by pressure drop and to compare the fluid velocities. The pressure drop values derived using the CFD analysis for the experimental points in Table 2 are summarized in Table 3. The pressure drop of the initial flow-through aquaculture system was 579.46232 Pa; this is the second lowest value when compared to all experimental points. Experimental number 5 had the lowest pressure drop value among the 27 experimental points. By contrast, experimental number 1 produced the highest pressure drop among all experimental points. As shown in Figure 7, experimental number 1 showed a pressure drop value 128.73% higher than that of the initial flow-through aquaculture system. This is because the design variable levels of experimental number 1 are lowest, causing a large flow disturbance and high pressure loss.

4. Discussion

After performing CFD analysis, the fluid velocity inside the flow-through aquaculture system was evaluated. Figure 8 shows a comparison of the fluid velocity contours of the initial flow-through aquaculture system and experimental number 1. Figure 8a shows the initial flow-through aquaculture system, and Figure 8b shows the flow-through aquaculture system with the optimally shaped central outlet cap. Due to the effect of the high pressure drop value, the overall fluid velocity was higher in experimental number 1 than in the initial flow-through aquaculture system, confirming an improvement in the internal fluid velocity. Also, in both flow-through aquaculture systems, the flow velocity generally decreases toward the tank center. In experimental number 1, the fluid velocity appears to be improved mainly near the center of the tank. This is thought to be because the fluid velocity is high, as fluid moves only to the sideline holes of the central outlet cap.
Additionally, there is a problem where various solids, such as olive flounder feed and excrement, are continuously generated inside the flow-through aquaculture system. The accumulation of solids inside the aquaculture tank can create an environment favorable for the survival of fish pathogens [34]. Solids existing in the internal fluid of the tank are deposited at the bottom of the tank, and the deposition is promoted when the flow velocity is low [35]. In this respect, the improved internal fluid velocity of experimental number 1 is expected to be helpful in preventing solid deposition.

5. Conclusions

This study proposes the optimal shape of a central outlet cap that can be used in a flow-through aquaculture system using CFD. The design variables of the central outlet cap were selected to form an orthogonal array, and the pressure drop was evaluated by performing CFD simulations on the experimental points of the orthogonal array. The numerical results between the experimental points were compared, and the pressure drop of experimental number 1 was highest. Also, the internal fluid velocity was improved in experimental number 1 compared to the initial flow-through aquaculture system. Therefore, the design variables of the central outlet cap were derived as follows: level 1 of vertical length, level 1 of horizontal length, level 1 of upper angle, level 1 of the number of upper line holes, and level 1 of hole width.
The case study of the central outlet cap derived in this study is expected to reduce the overcrowding of olive flounder in a flow-through aquaculture system and provide various advantages at higher fluid velocities. In the future, we will conduct an optimal design to determine a more accurate shape of the central outlet cap along with a study on the comparison between the results of CFD simulations and additional experimental results on the lab scale.

Author Contributions

J.L., research paper writing and conducting major research; J.D., case study ideas and conducting research; K.L., joint research on design of experiments; I.K., joint research on the important role of pressure drop in a flow-through aquaculture system; T.K., devising ideas and conducting research on central outlet problem solving in flow-through aquaculture systems; S.K., review and overall responsibility for research and research papers. All authors have read and agreed to the published version of the manuscript.

Funding

This research was supported by Korea Institute of Marine Science & Technology Promotion (KIMST) funded by the Ministry of Oceans and Fisheries (RS-2022-KS221676).

Institutional Review Board Statement

Not applicable.

Informed Consent Statement

Not applicable.

Data Availability Statement

The original contributions presented in the study are included in this article; further inquiries can be directed to the corresponding authors.

Conflicts of Interest

The authors declare no conflicts of interest.

References

  1. Food and Agriculture Organization of the United Nations (FAO). The State of World Fisheries and Aquaculture 2022. Towards Blue Transformation; FAO: Rome, Italy, 2022. [Google Scholar]
  2. Iber, B.T.; Kasan, N.A. Recent Advances in Shrimp Aquaculture Wastewater Management. Heliyon 2021, 7, e08283. [Google Scholar] [CrossRef] [PubMed]
  3. National Assembly Research Service (NARS). Current Status and Future Tasks of the Smart Aquaculture Industry; NARS: Seoul, Republic of Korea, 2019. [Google Scholar]
  4. Hoque, M.S.; Haque, M.M.; Nielsen, M.; Rahman, M.T.; Hossain, M.I.; Mahmud, S.; Mandal, A.K.; Frederiksen, M.; Larsen, E.P. Prospects and Challenges of Yellow Flesh Pangasius in International Markets: Secondary and Primary Evidence from Bangladesh. Heliyon 2021, 7, e08060. [Google Scholar] [CrossRef] [PubMed]
  5. Ciji, A.; Akhtar, M.S. Stress Management in Aquaculture: A Review of Dietary Interventions. Rev. Aquac. 2021, 13, 2190–2247. [Google Scholar] [CrossRef]
  6. Wells, R.M.G.; Pankhurst, N.W. Evaluation of Simple Instruments for the Measurement of Blood Glucose and Lactate, and Plasma Protein as Stress Indicators in Fish. J. World Aquac. Soc. 1999, 30, 276–284. [Google Scholar] [CrossRef]
  7. Yada, T.; Tort, L. Stress and Disease Resistance: Immune System and Immunoendocrine Interactions. In Fish Physiology; Elsevier: Amsterdam, The Netherlands, 2016; Volume 35, pp. 365–403. ISBN 1546-5098. [Google Scholar]
  8. Korean Statistical Information Service (KOSIS). Current Status of Aquaculture by Fish Type by Aquaculture Method. Available online: https://kosis.kr/statHtml/statHtml.do?orgId=101&tblId=DT_1EZ0008 (accessed on 3 December 2023).
  9. Yin, G.; Ong, M.C.; Lee, J.; Kim, T. Numerical Simulation of Oxygen Transport in Land-Based Aquaculture Tank. Aquaculture 2021, 543, 736973. [Google Scholar] [CrossRef]
  10. Xiong, Z.; He, M.; Zhu, W.; Sun, Y.; Hou, X. Analysis of Flow Field Characteristics of Aquaculture Cabin of Aquaculture Ship. J. Mar. Sci. Eng. 2023, 11, 390. [Google Scholar] [CrossRef]
  11. Wang, C.M.; Ma, M.; Chu, Y.; Jeng, D.-S.; Zhang, H. Developments in Modeling Techniques for Reliability Design of Aquaculture Cages: A Review. J. Mar. Sci. Eng. 2024, 12, 103. [Google Scholar] [CrossRef]
  12. Zhang, F.; Cui, M.; Liu, H.; Zhang, C. The Effect of Corner Structure on the Optimisation of Fishable Flow Field in Aquaculture Tanks. J. Mar. Sci. Eng. 2024, 12, 1185. [Google Scholar] [CrossRef]
  13. Mohapatra, S.C.; Guedes Soares, C. A Review of the Hydroelastic Theoretical Models of Floating Porous Nets and Floaters for Offshore Aquaculture. J. Mar. Sci. Eng. 2024, 12, 1699. [Google Scholar] [CrossRef]
  14. Guo, Y.C.; Mohapatra, S.C.; Guedes Soares, C. Review of Developments in Porous Membranes and Net-Type Structures for Breakwaters and Fish Cages. Ocean Eng. 2020, 200, 107027. [Google Scholar] [CrossRef]
  15. Oca, J.; Masalo, I. Flow Pattern in Aquaculture Circular Tanks: Influence of Flow Rate, Water Depth, and Water Inlet & Outlet Features. Aquac. Eng. 2013, 52, 65–72. [Google Scholar] [CrossRef]
  16. An, C.-H.; Sin, M.-G.; Kim, M.-J.; Jong, I.-B.; Song, G.-J.; Choe, C. Effect of Bottom Drain Positions on Circular Tank Hydraulics: CFD Simulations. Aquac. Eng. 2018, 83, 138–150. [Google Scholar] [CrossRef]
  17. Saisorn, S.; Wongwises, S. Flow Pattern, Void Fraction and Pressure Drop of Two-Phase Air–Water Flow in a Horizontal Circular Micro-Channel. Exp. Therm. Fluid Sci. 2008, 32, 748–760. [Google Scholar] [CrossRef]
  18. Okafor, N.A.; Aimikhe, V.J.; Kinigoma, B. Modelling the effect of acceleration term on total pressure drop in horizontal gas pipelines. Pet. Coal 2019, 61, 1314. [Google Scholar]
  19. Mallya, Y.J. The Effects of Dissolved Oxygen on Fish Growth in Aquaculture. In The United Nations University Fisheries Training Programme, Final Project; United Nations University: Reykjavik, Iceland, 2007. [Google Scholar]
  20. Pastore, D.M.; Peterson, R.N.; Fribance, D.B.; Viso, R.; Hackett, E.E. Hydrodynamic Drivers of Dissolved Oxygen Variability within a Tidal Creek in Myrtle Beach, South Carolina. Water 2019, 11, 1723. [Google Scholar] [CrossRef]
  21. KWON, I.; KIM, T. Analysis of Land-Based Circular Aquaculture Tank Flow Field Using Computational Fluid Dynamics (CFD) Simulation. J. Korean Soc. Fish. Ocean Technol. 2020, 56, 395–406. [Google Scholar] [CrossRef]
  22. Ansys, Inc. Ansys Fluent 15.0 User’s Guide; Ansys Inc.: Canonsburg, PA, USA, 2013. [Google Scholar]
  23. Menter, F.R. Two-Equation Eddy-Viscosity Turbulence Models for Engineering Applications. AIAA J. 1994, 32, 1598–1605. [Google Scholar] [CrossRef]
  24. Ansys, Inc. Ansys Fluent Theory Guide; Ansys Inc.: Canonsburg, PA, USA, 2011; Volume 794. [Google Scholar]
  25. Liu, H.-F.; Liu, Y.; Gui, F.; Sun, H.; Zhao, Y.-P. Quantitative Evaluation on the Suitable Flow Region inside the Shielding Device of Submersible Aquaculture Facility. Ocean Eng. 2023, 267, 113270. [Google Scholar] [CrossRef]
  26. Zhao, Y.-P.; Liu, H.-F.; Bi, C.-W.; Cui, Y.; Guan, C.-T. Numerical Study on the Flow Field inside and around a Semi-Submersible Aquaculture Platform. Appl. Ocean Res. 2021, 115, 102824. [Google Scholar] [CrossRef]
  27. Yang, C.; Yuan, H.; Bai, X.; Hao, Z.; Sun, Y.; Wu, D.; Johanning, L. Numerical Investigations on Fluid Characteristics around the Bottom-Fixed Aquacultural Farm. Ocean Eng. 2022, 266, 112689. [Google Scholar] [CrossRef]
  28. Rodrigues, H.C.; Papáček, Š.; Petera, K.; Herskovits, J.; Masaló, I.; Soares, M.; Araújo, A.L.; Oca, J.; Guedes, J.M.; Folgado, J.O. On the Optimization of Recirculated Aquaculture Systems. In EngOpt 2018 Proceedings of the 6th International Conference on Engineering Optimization; Springer Nature: Cham, Switzerland, 2019. [Google Scholar]
  29. Klebert, P.; Volent, Z.; Rosten, T. Measurement and Simulation of the Three-Dimensional Flow Pattern and Particle Removal Efficiencies in a Large Floating Closed Sea Cage with Multiple Inlets and Drains. Aquac. Eng. 2018, 80, 11–21. [Google Scholar] [CrossRef]
  30. Tsai, J.-T.; Chou, J.-H.; Liu, T.-K. Optimal Design of Digital IIR Filters by Using Hybrid Taguchi Genetic Algorithm. IEEE Trans. Ind. Electron. 2006, 53, 867–879. [Google Scholar] [CrossRef]
  31. Vázquez-Sánchez, A.Y.; Aguilar-Zárate, P.; Muñiz-Márquez, D.B.; Wong-Paz, J.E.; Rojas, R.; Ascacio-Valdés, J.A.; Martínez-Ávila, G.C.G. Effect of Ultrasound Treatment on the Extraction of Antioxidants from Ardisia Compressa Kunth Fruits and Identification of Phytochemicals by HPLC-ESI-MS. Heliyon 2019, 5, e03058. [Google Scholar] [CrossRef] [PubMed]
  32. Si, J.; Cheng, G.; Zhu, J. Optimisation of Multisource Injection of Carbon Dioxide into Goafs Based on Orthogonal Test and Fuzzy Comprehensive Theory. Heliyon 2019, 5, e01607. [Google Scholar] [CrossRef]
  33. Teng, D.; Li, Y.; Yang, H.; Wei, Z.; Li, Y. Genetic Algorithm for Sparse Optimization of Mills Cross Array Used in Underwater Acoustic Imaging. J. Mar. Sci. Eng. 2022, 10, 155. [Google Scholar] [CrossRef]
  34. Davidson, J.; Summerfelt, S.T. Solids Removal from a Coldwater Recirculating System—Comparison of a Swirl Separator and a Radial-Flow Settler. Aquac. Eng. 2005, 33, 47–61. [Google Scholar] [CrossRef]
  35. López-Rebollar, B.M.; Salinas-Tapia, H.; García-Pulido, D.; Durán-García, M.D.; Gallego-Alarcón, I.; Fonseca-Ortiz, C.R.; García-Aragón, J.A.; Díaz-Delgado, C. Performance Study of Annular Settler with Gratings in Circular Aquaculture Tank Using Computational Fluid Dynamics. Aquac. Eng. 2021, 92, 102143. [Google Scholar] [CrossRef]
Figure 1. Research procedure to present the shape and concept of the central outlet cap.
Jmse 12 02006 g001
Figure 2. Geometry of flow-through aquaculture system.
Jmse 12 02006 g002
Figure 3. Flow-through aquaculture system with central outlet cap.
Jmse 12 02006 g003
Figure 4. Design variables of central outlet cap: (a) vertical length, horizontal length, upper angle, and hole width of central outlet cap, and (b) shapes of the central outlet cap according to the number of upper line holes.
Jmse 12 02006 g004
Figure 5. Mesh independence test of flow-through aquaculture system.
Jmse 12 02006 g005
Figure 6. Grid model of flow-through aquaculture system.
Jmse 12 02006 g006
Figure 7. Pressure drop comparison between initial flow-through aquaculture system and experimental number 1.
Jmse 12 02006 g007
Figure 8. Contour of flow velocity: (a) XY plane of initial flow-through aquaculture system, and (b) XY plane of experimental number 1.
Jmse 12 02006 g008
Table 1. Magnitudes and levels of design variables of central outlet cap.
Level x 1 [mm] x 2 [mm] x 3 [°] x 4 x 5 [mm]
150400003
21258007.516
320012001529
Table 2. L27(35) orthogonal array.
Experimental NumberVariables Column
x 1 x 2 x 3 x 4 x 5
150 mm400 mm03 mm
250 mm400 mm7.5°16 mm
350 mm400 mm15°29 mm
450 mm800 mm16 mm
550 mm800 mm7.5°29 mm
650 mm800 mm15°03 mm
750 mm1200 mm29 mm
850 mm1200 mm7.5°03 mm
950 mm1200 mm15°16 mm
10125 mm400 mm06 mm
11125 mm400 mm7.5°19 mm
12125 mm400 mm15°23 mm
13125 mm800 mm19 mm
14125 mm800 mm7.5°23 mm
15125 mm800 mm15°06 mm
16125 mm1200 mm23 mm
17125 mm1200 mm7.5°06 mm
18125 mm1200 mm15°19 mm
19200 mm400 mm09 mm
20200 mm400 mm7.5°13 mm
21200 mm400 mm15°26 mm
22200 mm800 mm13 mm
23200 mm800 mm7.5°26 mm
24200 mm800 mm15°09 mm
25200 mm1200 mm26 mm
26200 mm1200 mm7.5°09 mm
27200 mm1200 mm15°13 mm
Table 3. Pressure drop of flow-through aquaculture system.
Experimental NumberPressure Drop [Pa]Experimental NumberPressure Drop [Pa]Experimental NumberPressure Drop [Pa]
11325.4152310659.46519594.73348
2637.1384111596.3701220691.30139
3584.490312668.3444721597.20498
4589.9441713585.3123522630.69791
5577.9895814614.0165323587.17231
6751.9964715606.3919624589.71031
7580.1727916597.235725583.21357
8661.7553817594.4662926587.89079
9585.9179718582.5478327611.24046
Disclaimer/Publisher’s Note: The statements, opinions and data contained in all publications are solely those of the individual author(s) and contributor(s) and not of MDPI and/or the editor(s). MDPI and/or the editor(s) disclaim responsibility for any injury to people or property resulting from any ideas, methods, instructions or products referred to in the content.

