1. Introduction
The transportation of marine oil and gas resources by subsea pipelines is the most economical, fastest, and most reliable form of maritime transportation. Due to the complex operating conditions in the ocean, the costs associated with laying and installing pipelines are high. In traditional pipeline-laying operations, a marine pipeline-laying ship performs defect detection and joint sealing before the pipeline is lowered to the seabed. In recent years, the advent of marine robots has allowed for the process of pipeline laying to be performed by human-controlled marine robots along the pipeline, with the real-time transmission of submarine pipe-laying videos and access to submarine pipe-laying status enabling the adjustment of the direction of the sea pipeline laying in time. However, this still requires human involvement in the control of the marine robots. Since humans themselves have a limited ability to perceive changes in the environment to which the marine robot belongs in real time, such as underwater currents, undercurrent impacts, and undersea obstacles, human control cannot respond to such disturbance factors in time. With the advent of deep learning target detection technology, marine robots can now control their own attention mechanism to detect the location of the seabed-contacting segments of submarine pipelines and automatically track the laying of submarine pipelines, eliminating human manipulation and reducing operating costs. There is no indication that this method has been utilized in engineering practices during the laying of submarine pipelines. Further, there are still additional challenges related to pipeline location that are influenced by various chemical agents present on the seabed such as hazardous materials, including munitions or remnants from past warfare, posing risks to both the marine robots and the pipelines themselves [
1,
2].
The unique characteristics of the underwater environment and the complex operating environment can cause the silt on the seabed to adhere to the surface of the pipeline, forming a layer of irregular silt film. The light source from the underwater autonomous remotely operated vehicle (ARV) is absorbed and scattered by the seawater, causing the image of the pipeline in the model’s field of view to merge with the background color of the silt on the seabed, blurring the boundary between the pipeline and the background. At the same time, the characteristics of the extended sea pipeline and the slight change in the curvature of the laid sea pipeline cause the sea pipeline to appear in a continuous and smooth state in the model’s field of view, and so the difference between the characteristics of the sea pipeline before and after the extension is small, which is not conducive to the model’s inference and detection abilities. The existing method of using sonar to determine the location and shape of the seabed-contacting segments of subsea pipelines is limited by its resolution, making it impossible to obtain a fine-grained segmentation of the pipeline boundary. The concavity and convexity of the underwater terrain causes changes in the propagation path of the acoustic wave, making it difficult to identify and locate the pipeline. Although it is possible to obtain a real image of the seabed using a vision camera, the surface of the seabed pipeline may lack obvious texture and visual features. In response to the weak texture features presented by the seabed pipeline, the attention mechanism can quickly remove a large amount of redundant information about the seabed pipeline and increase sensitivity to the weak texture features, allowing the model to focus more on the part of the pipeline that makes an important contribution to the task.
By further improving the attention mechanism of the RTMDet network model, the model can quickly converge on the seabed-contacting segment region of interest, such as the feature of a smaller radius of curvature at the seabed-contacting segment. At the same time, the segmentation of the submarine pipeline boundary is further refined by improving the fusion strategy of the feature maps to improve the detection performance of the model.
Based on the above discussion, we prove the effectiveness of our modules by plugging in our designed cascade attention module and prefusion module, both of which improve the accuracy of different network models to varying degrees. Our trained models are visualized by Grad-Free CAM [
3], and it can be clearly seen that the improved network focuses on the target object more accurately than the original network model. Our main contributions are threefold:
- (1)
We propose a plug-and-play, simple and effective cascade attention module. The feature map is transformed into three different sizes of feature maps, and feature extraction is performed using spatial direction, a depth direction attention mechanism, and a position attention mechanism, respectively. The flow of feature information is controlled by the cascaded feature maps through a learnable gating unit.
- (2)
We propose a plug-and-play, simple and effective prefusion module. Using three different upper and lower scales of feature maps as inputs for the module, the finer features in the different scales are obtained by fusion after scaling so that more shallow and more highly fine-grained feature expressions are added to the deeper feature maps.
- (3)
The cascade attention module and the prefusion module improve the detection and instance segmentation performance of our best model through a 6.3% increase in AP and a 3.8% increase in mIOU.
We verify the effectiveness of the continuous operation of underwater autonomous remotely operated vehicles (ARVs) during pipeline operations through data collection, modeling algorithm experiments, and tank experiments. It is the first time that the automatic tracking and inspection technology of ARVs has been utilized to assist submarine pipeline-laying operations and provide an experimental basis.
2. Related Work
At present, the detection and segmentation of underwater targets is widely studied; however, due to the complexity of and variability in the underwater environment on the seabed, there are a lot of floating objects in the water, and there are often color shifts, distortions, and low contrasts in the camera images. Chen proposed a lightweight algorithm [
4] based on multiscale feature fusion to address the problems of the limited computational power of underwater equipment and the low accuracy of image detection. To this end, the feature fusion path was optimized and an adaptive fusion strategy for multiscale features was applied to reduce dependence on the complex feature extraction network and reduce the model parameters. However, because of the simplification of the original complex model, the algorithm also diminished the anti-disturbance ability in complicated scenarios. Hao [
5] added a depth-separable convolution and EASPP to the backbone network of Yolov4, which was very effective compared with the original network model. Zhang proposed edge enhancement scaling [
6] for sea cucumber detection based on Yolov4, which reduced the effects of different hues and brightness on sea cucumber misdetection by emphasizing the edge features of the target. This method was found to be less flexible in terms of target detection despite the addition of an edge enhancement module and model visibility. Knausgard [
7] improved the backbone network of YOLOv3 using an SE module and achieved higher accuracy in fish detection. Arain [
8] proposed a method to improve image-based underwater obstacle detection by combining a sparse stereo point cloud with single-target image segmentation. Ronneberger [
9] presented an underwater segmentation algorithm based on a U-Net [
10], fine-tuning the trained model. Zhou [
11] introduced an automatic underwater target detection method using clustering, segmentation, and feature differentiation to achieve underwater target segmentation detection with low false alarm probability. These studies improved the detection accuracy by fine-tuning the model and embedding new modules to meet the needs of different subtasks, but there was no fine-tuned analysis of the problems that occur in this type of underwater pipeline detection task, such as pipeline boundary blur and background color.
The attention mechanism mainly sets the weights of features in the target region so that the network can focus on the region with the most important information during feature extraction while suppressing other irrelevant feature information to reduce the interference of irrelevant results on the detection results. Pan [
12] introduced the attention mechanism in the channel dimension, which is used to enhance the feature information of important channels in the network framework to increase the model’s attention to those important channels. On the basis of pure attention, Lint [
13] introduced attention and dense connectivity in the feature pyramid to integrate the feature map with the attention module while utilizing dense connectivity to reduce the loss of feature information. However, this strategy also lacks the possibility of different dimensions of attention. Therefore, Hu [
14] added the feature attention module to the backbone network of Faster R-CNN [
15] to extract the ROI of the target image from the channel and spatial dimensions, respectively, which improved the localization of the target image by the network. Sun [
16] proposed a multiscale-based target detection algorithm with multiple attention mechanisms using a global feature attention module and a pixel feature attention module to improve detection performance. In contrast to the above approach, Zhang used a residual interference (RIR) [
17] structure to form a very deep network that bypasses the rich low-frequency information through multiple frequency-hopping links, allowing the main network to focus on learning high-frequency information. Wang presented an efficient channel attention (ECA) module [
18] to efficiently implement a local cross-channel interaction strategy without dimensionality reduction by one-dimensional convolution and used adaptive selection to determine the coverage of local cross-channel interactions. In view of the slow curvature change in the vicinity of the seabed-contacting segments of submarine pipelines, the particular underwater environment causes an information redundancy problem, and the attention mechanism can quickly locate key features in a large amount of redundant information.
Feature fusion methods are widely used in the field of target detection and instance segmentation. Zhao proposed the MLFPN [
19] network, which enables feature fusion at multiple scales and levels. NAS-FPN [
20] designed a search structure for neural architectures that can select the optimal feature pyramid in an extensible search space that includes all cross-scale connections. However, the above strategies consume large amounts of computational resources. They cannot reasonably be used on lightweight underwater devices. Bi-FPN [
21] uses PA-Net [
22] as the base layer and proposes a weighted fusion scheme in which the features need to be multiplied when superimposed with a weighting coefficient to further optimize the information transfer between different feature layers. This improves model performance by preserving key features of the underlying layer through a small number of cross-domain parameter connections. Kim [
23] devised a parallel pyramid network that combines the features of SPPN [
24] and FPN [
25], where the features of the backbone network are passed through the SPP [
24] layer to obtain multiscale features. These multiscale features are downscaled before being fused across scales to generate a new hierarchical feature map, which is then used for prediction. Multi-level feature maps are also employed for prediction. There are also some improved methods such as DSSD [
26], RSSD [
27], and FSSD [
28], which are based on the original SSD [
29] method. In underwater environments, a large number of the key features of an image are blurred because of the scattering and absorption of light by seawater. The model needs to fully understand the existing features and accomplish the task of target detection, which requires feature fusion methods to adequately distinguish the boundaries between the foreground and the background.
3. Overview of ARV and Operating Scenarios
We present the technical parameters and functional characteristics of the ARV unmanned submersible equipment, outline the specific conditions and facilities of the tank experiments, and explain the specific operating procedures of the unmanned sensing system.
3.1. Overview
The general diagram of the ARV is shown in
Figure 1. It is equipped with two stern thrusters, two front and rear vertical thrusters, and one side thruster each, which can realize six degrees of freedom of control [
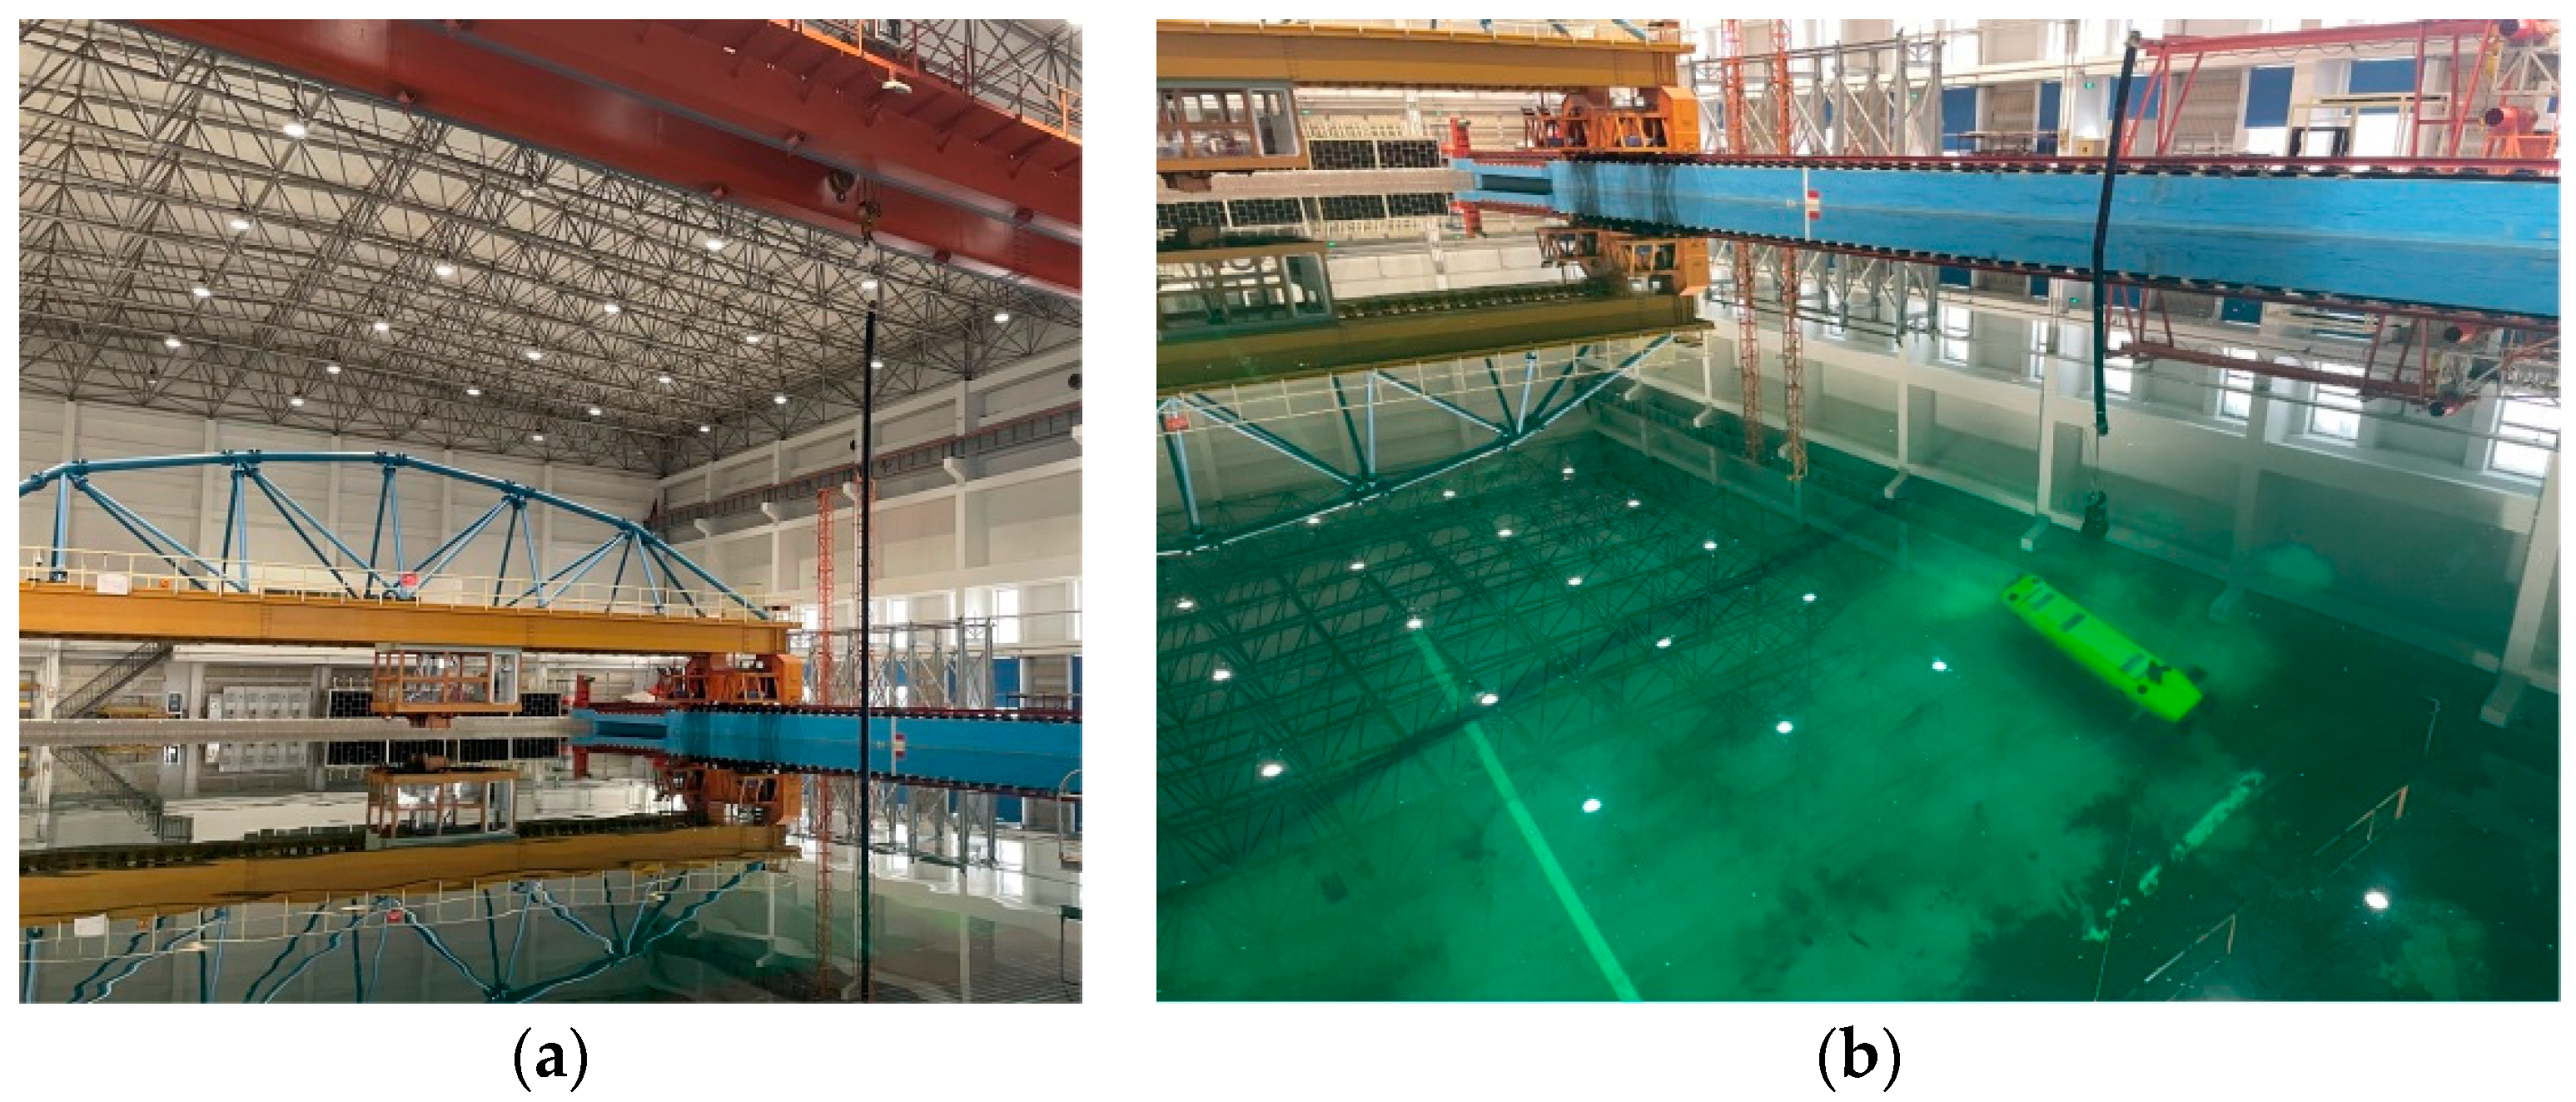
30]. The thrust of the stern thruster is 50 kgf, the thrust of the vertical thruster is 80 kgf, and the thrust of the side thruster is 50 kgf. The maximum speed it can reach in the water is 8 kn, and the power source is an 80 Ah Li-ion battery. The ARV uses inertial guidance to realize underwater localization and navigation, and uses instruments such as a depth gauge and an altimeter to obtain the height and depth information of the ARV itself in the water. The ARV is equipped with a front view camera, a front view sonar, and two side view cameras. In the experiment, as shown in
Figure 2, a gantry crane is used to put in and take out the pipeline to simulate the pipeline-laying process, while the ARV dives into the water to detect and identify the location of the pipeline’s seabed-contacting segment to realize autonomous tracking.
The specific equipment parameters of the ARV underwater robot are listed in
Table 1.
3.2. System Brief
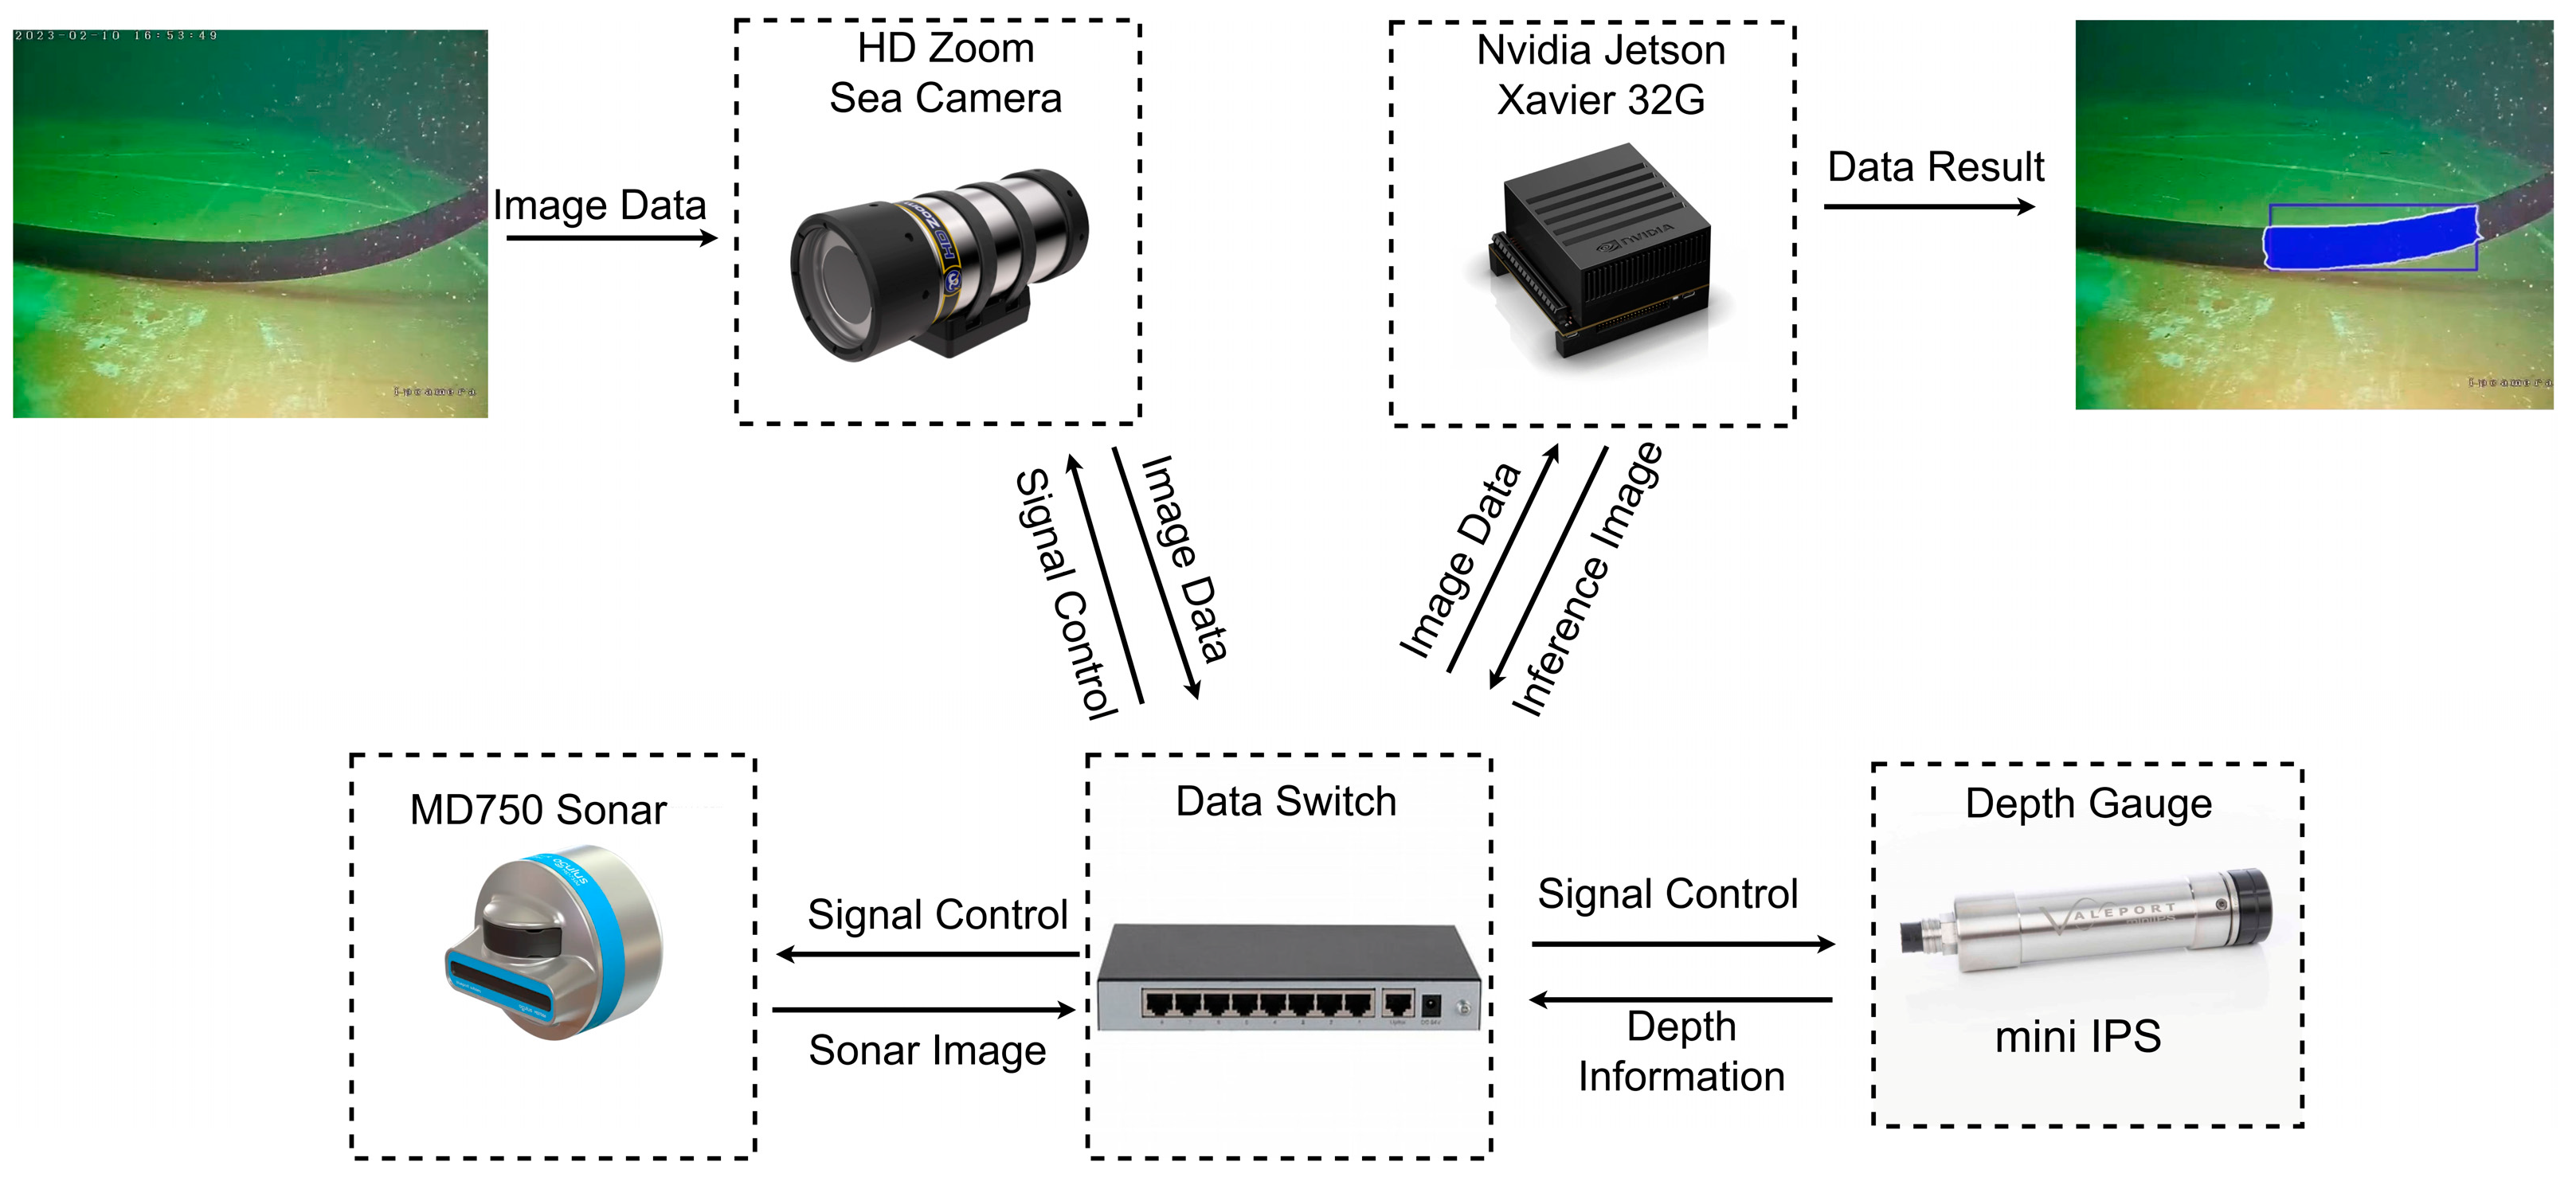
Our network model is deployed on the Nvidia Jetson Xavier 32G (NVIDIA, Santa Clara, CA, USA) embedded platform in the ARV, and has low power consumption, is small in size, and has high computational power for the neural network to achieve the real-time autonomous detection of underwater pipelines. As shown in
Figure 3, the camera and sonar equipment in the underwater ARV capture the target images, which are transmitted to the Nvidia Jetson Xavier through the switch as an intermediate data transmission link to perform image inference and detection. The position parameters of the seabed-contacting segments are then obtained, including the detection position and the pixel parameters of the detected segments of the pipelines. The obtained parameters are displayed in the terminal images and are transmitted to the switch. The ARV can adjust the parameters of the camera and sonar equipment according to the real-time detection results. The ARV inputs the position parameters of the seabed-contacting segments and the pixel parameters of the segmented pipeline into the control subsystem, which allows the control subsystem to adjust the movement attitudes of the ARV underwater in real time and complete the task of autonomously tracking and detecting the seabed-contacting segments underwater [
30]. The specific process information is shown in
Figure 3.
4. Method
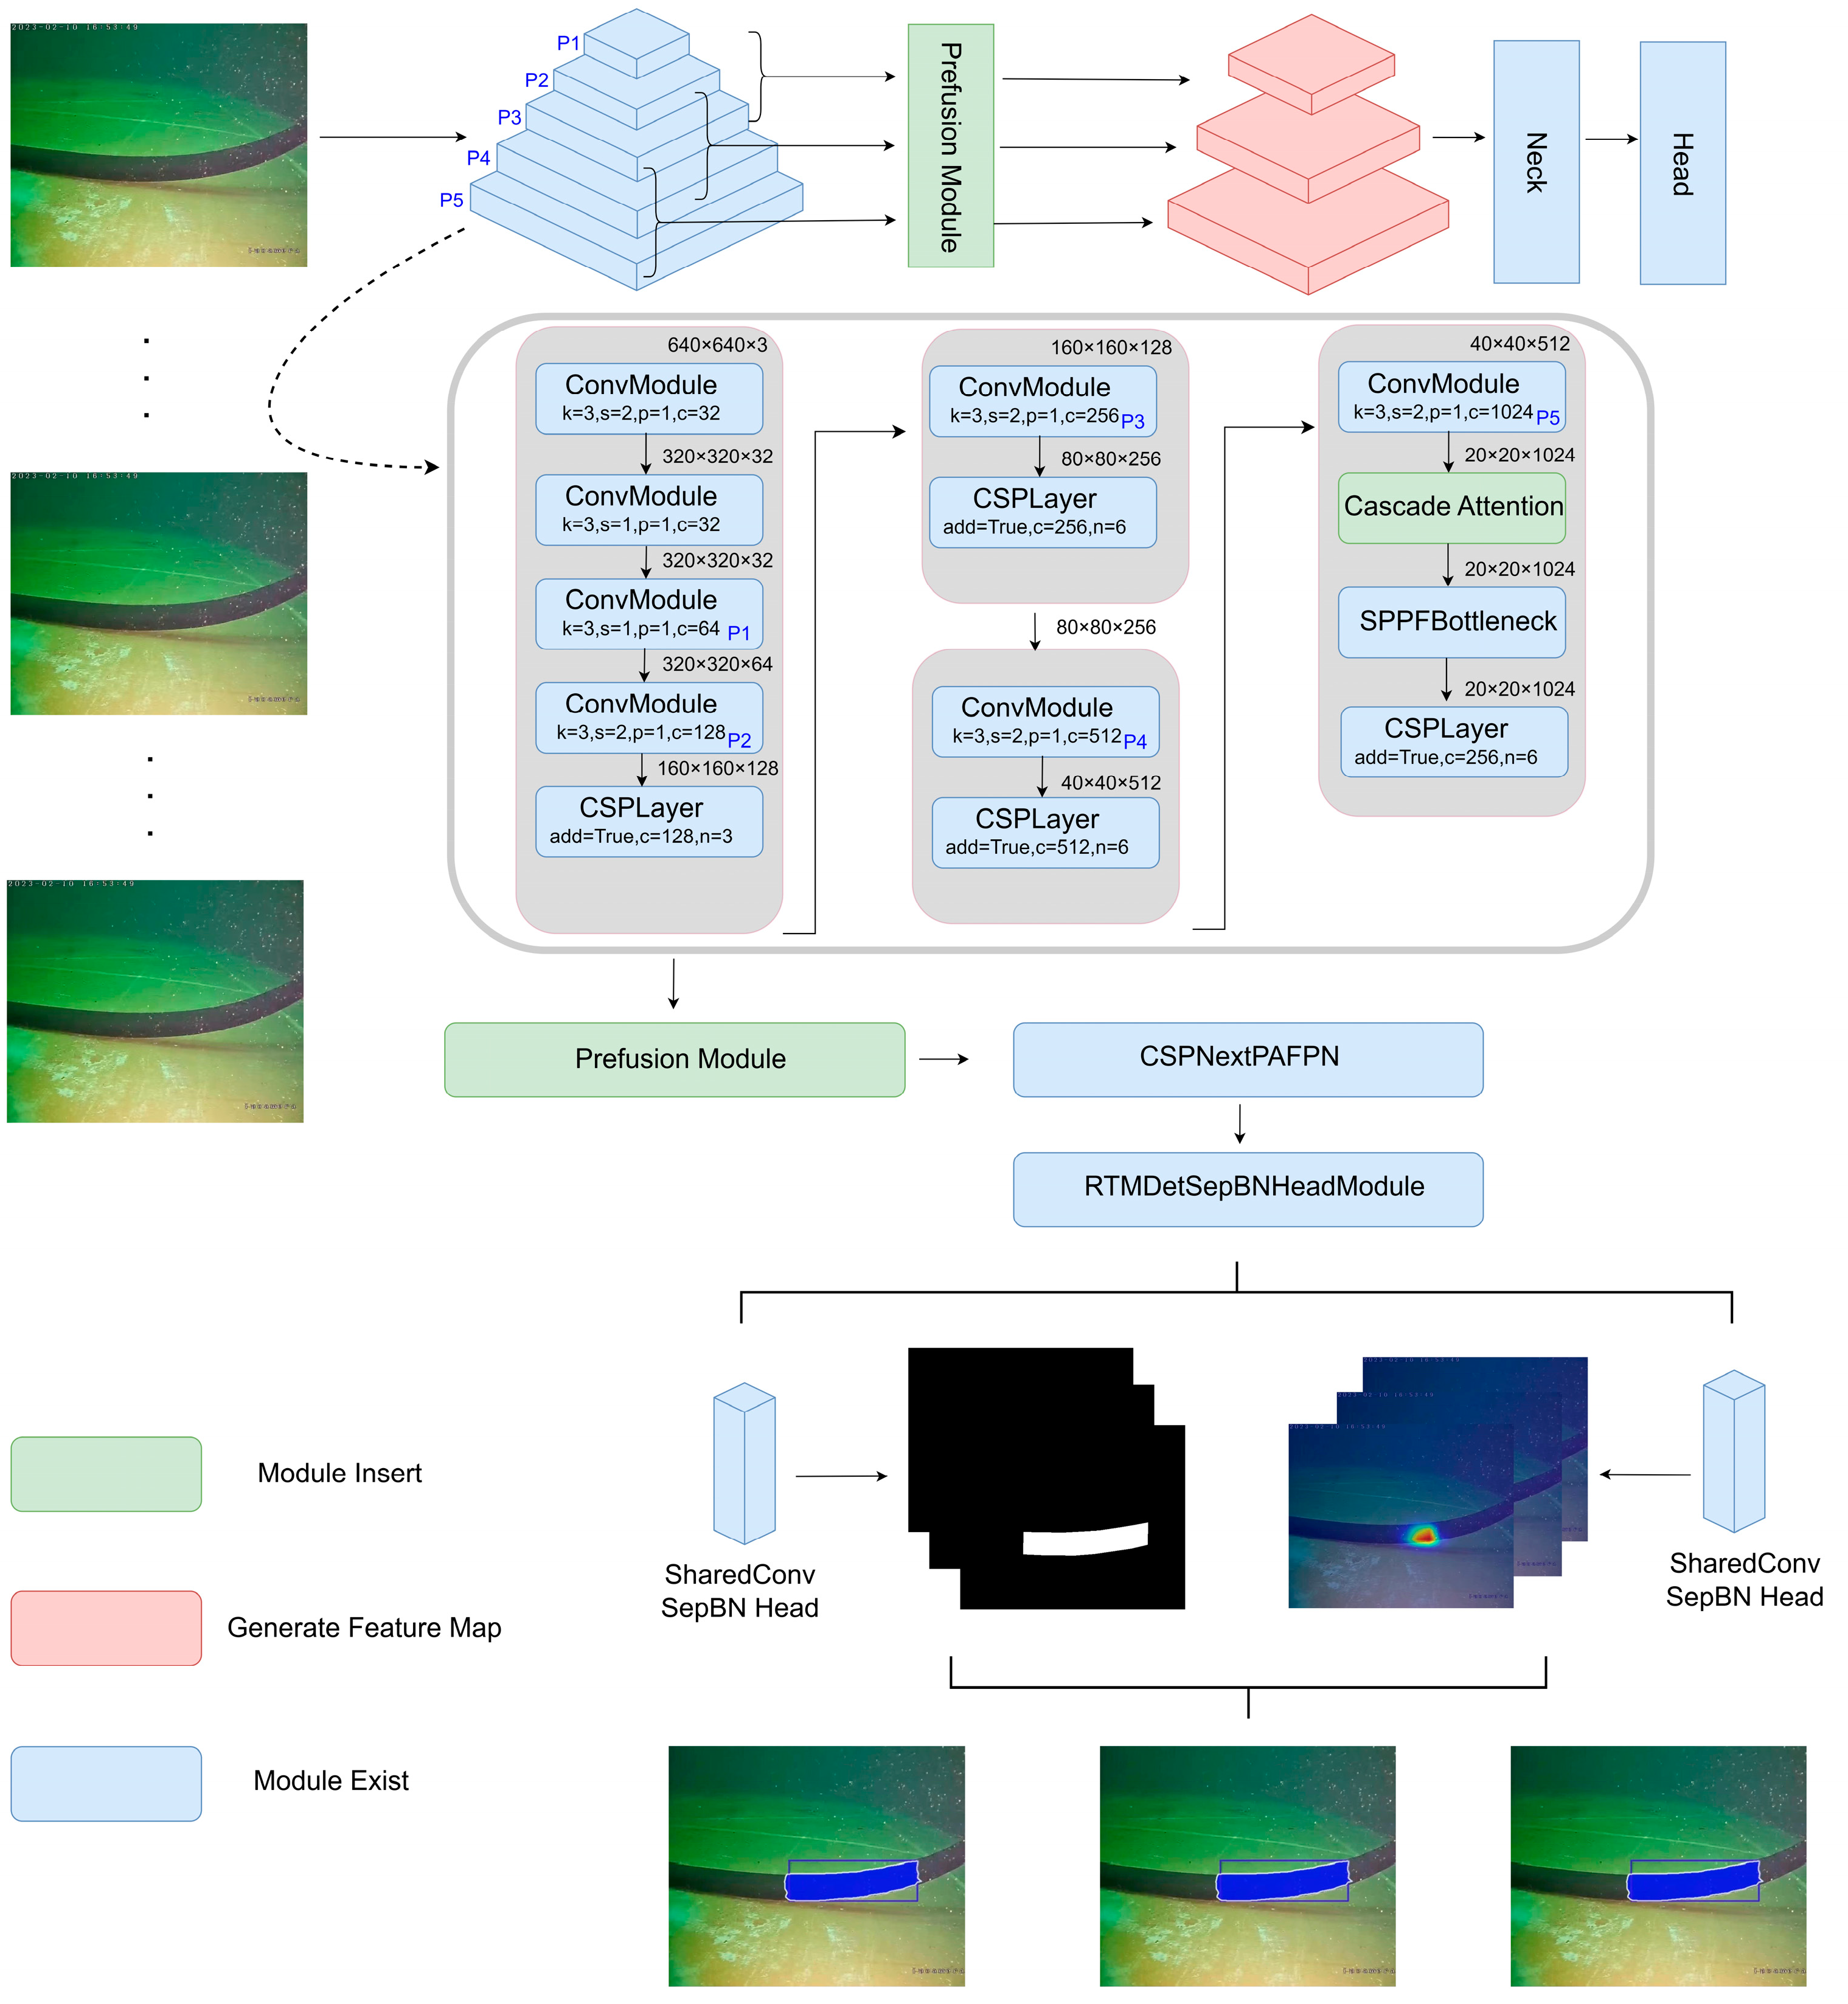
We explain our approach in two sections, the cascade attention module and the prefusion module. The overall structure diagrams of the two network models are shown in
Figure 4.
To describe our model of image processing more intuitively, we provide a pyramidal feature map of the input detection image using a CNN convolution operation, as shown in
Figure 4. Before sending it to fusion processing to extract the feature map information, we first process the pyramidal feature map with our proposed prefusion module to fully utilize the different scales of the feature map information. At the same time, we incorporate our cascade attention module into the extraction of the feature map to help us focus on the region of interest more quickly.
4.1. Cascade Attention
In this subsection, we first show the overall structure of the module, and then introduce the interaction between the spatial and dimensional information for the input feature maps. Next, we use three different attention modes for the three different interacting feature maps for further attention extraction. Finally, we gradually fuse the three feature maps with attention by using cascading to obtain more contextual information.
In the process of submarine oil pipeline laying, the characteristics of extended sea pipelines and the slight changes in the curvature of the laid sea pipelines cause the pipeline to appear in a continuous and smooth state in the model’s field of view; so, the difference between the characteristics of the sea pipeline before and after the extension is small, which is not conducive to the model’s inference and detection. Therefore, we propose the cascade attention module for the input of the feature map. Through the use of the attention mechanism, it can quickly find the information we are interested in, such as information relating to the characteristics of the seabed-contacting segment pipeline where the radius of curvature becomes smaller, while suppressing any useless information.
The feature map is a 3D scale feature map input. The spatial attention mechanism [
31] does not have all regions contributing equally to the task but focuses more on the regions that are important for the task. The channel attention mechanism [
32] models the importance of each channel and assigns key features to different task inputs. If we focus only on feature attention in the spatial direction or only on feature attention in the channel direction, we inevitably lack the ability to travel in the other direction to solve an attention mechanism issue. Therefore, Woo proposed CBAM [
33] on this basis, and we believe that the spatial and channel directions, as well as the scale of the positional attention mechanism [
34], benefit the attention mechanism at the pixel level. We improve the attention mechanism from three different directions and integrate the three, proposing the cascade attention module, as shown in
Figure 5.
4.1.1. Up-Focus and Down-Focus
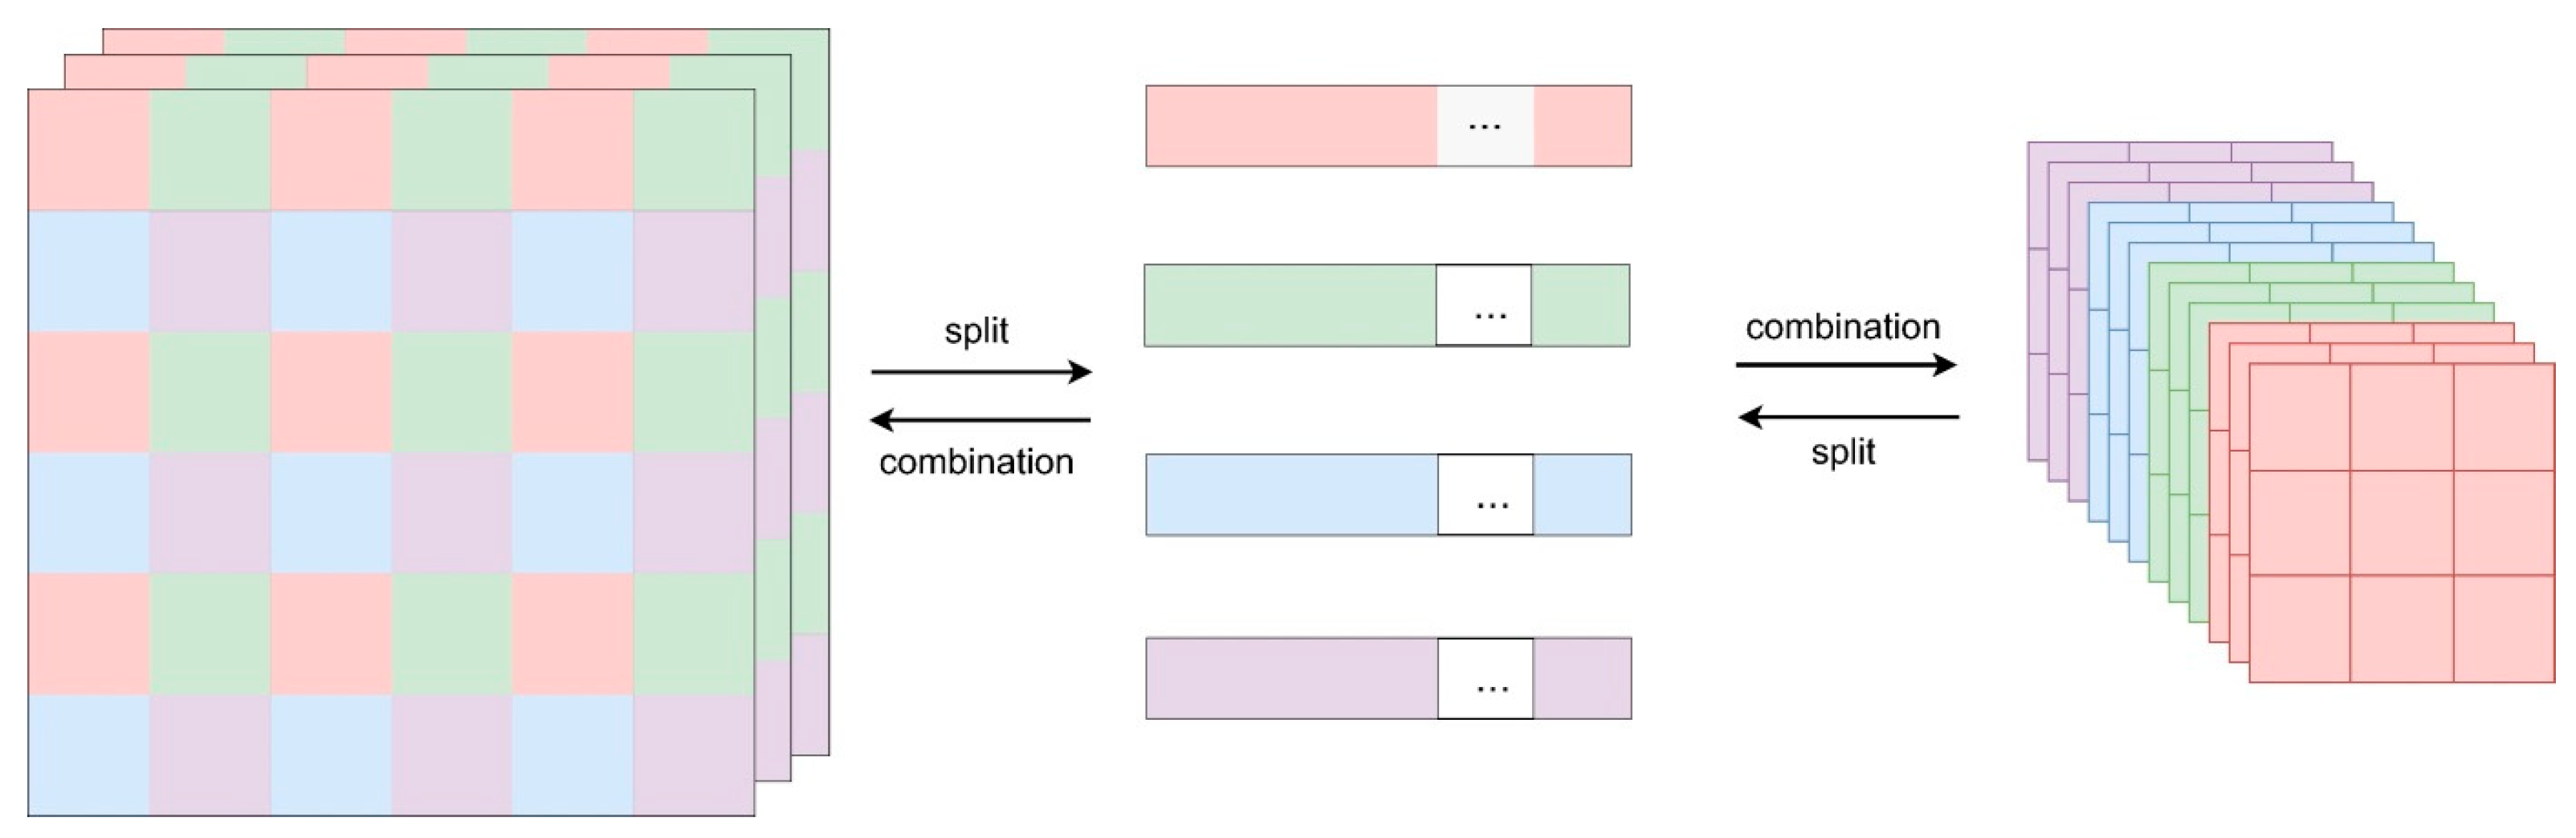
The focus module is used as a down-sampling method in the network model instead of the traditional convolution method, which combines the spatial pixel information sequentially in the direction of the depth channel. This effectively reduces the number of layers in the network model, reduces the number of model parameters during training, and improves the speed of forward and backward propagation. Based on focus, we propose and design a reverse up-sampling that fuses the depth direction information with space and realizes the information fusion interaction between space and channel direction. It is used as the original input image for various attention operations and tries to realize the attention fusion of different sizes of space and channel to improve the performance of the model. As shown in
Figure 6, up-focus and down-focus are mutually inverse operations that can obtain F1 and F2 feature maps.
4.1.2. Door Control Adaptive
We use a gating mechanism, a gating adaptation, to adapt to the original features. By introducing the gating mechanism, our module can promote competition and cooperation during the training process. Let the gating weights be
; thus, we design the following gating features:
Each original channel undergoes a corresponding gating adaptation, and since the gating adaptation is parameter-less, we design trainable weights and biases for learning to wisely control the activation of the gated channels so that our module can model more types of relationships (e.g., competition or cooperation) between different channels. When the weight of a channel is positively activated, it promotes competition between that channel and other channels, and when the gating weights are negatively activated, it promotes cooperation between that channel and other channels.
On each of the three different attention lines of feature map F1, original feature map, and feature map F2, we add trainable learning parameters weights
and biases
for the learning-wise activation of the control gate channel. As shown in
Figure 7, we pass the attentional information from the three different branches through the gated channel after aggregating them to achieve self-learning gated adaptation.
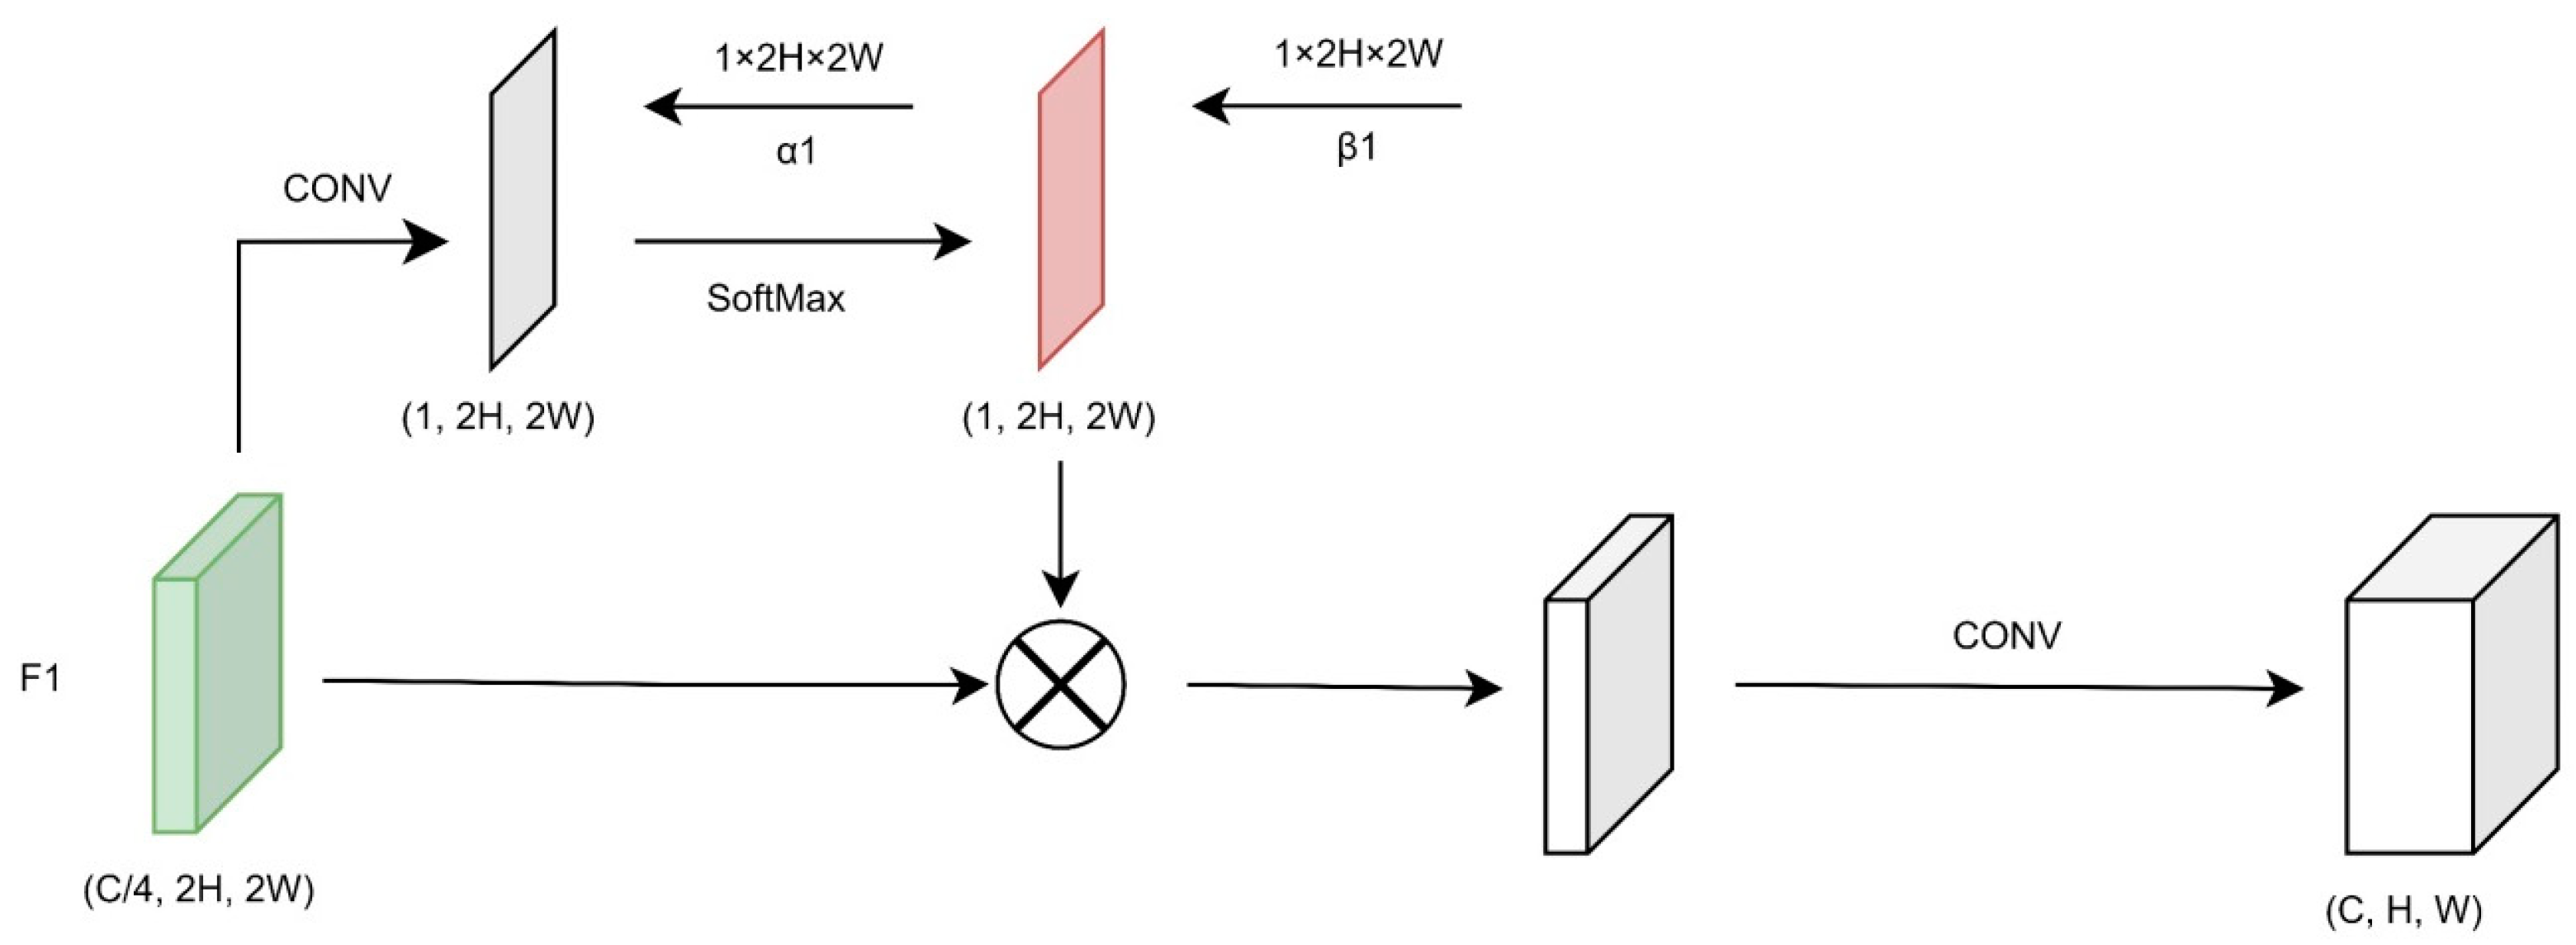
4.1.3. Positioning Semantic Enhancement Module
The location semantic enhancement module focuses on generating a pixel-level positional attention mechanism. A mask map of the same size as the feature map is not simply generated by taking the extreme values, as it is implemented using a convolutional approach. The purpose is to hope that the positional attention mask map can autonomously learn the pixel-level region of interest and augment the feature map.
Pixel-level positional self-attention is a variant of the attention mechanism that aims to reduce dependence on external information and utilize information inherent in the features as much as possible for attentional interaction. Wang [
35] proposed a non-local module based on the transformer architecture proposed by Google and applied it to the vision domain, which achieves the global modeling of pixel-level positional information by computing the coefficients of the correlation weight matrix and superimposing them on the original matrix. However, the computational resources consumed by this series of operations are undoubtedly enormous. Therefore, the location semantic enhancement module adaptively learns the weighting coefficient matrices of pixel-level positional attention through a simple convolution operation that greatly reduces the cost of computational resources.
For the input feature map F1, we use a convolution kernel of size 1 to map the feature map to the feature map with channel 1, which assigns a self-learning parameter to each pixel of the feature map. This is used to represent the relationship of each pixel with the global feature map. The convolved feature map is multiplied by the feature map F1 according to the global SoftMax. At the same time, it must be converted back into the number of channels of the ORI feature map through the convolution operation to obtain the output of the feature map of the positioning semantic enhancement module, F1′, in order to perform the fusion operation in the next step.
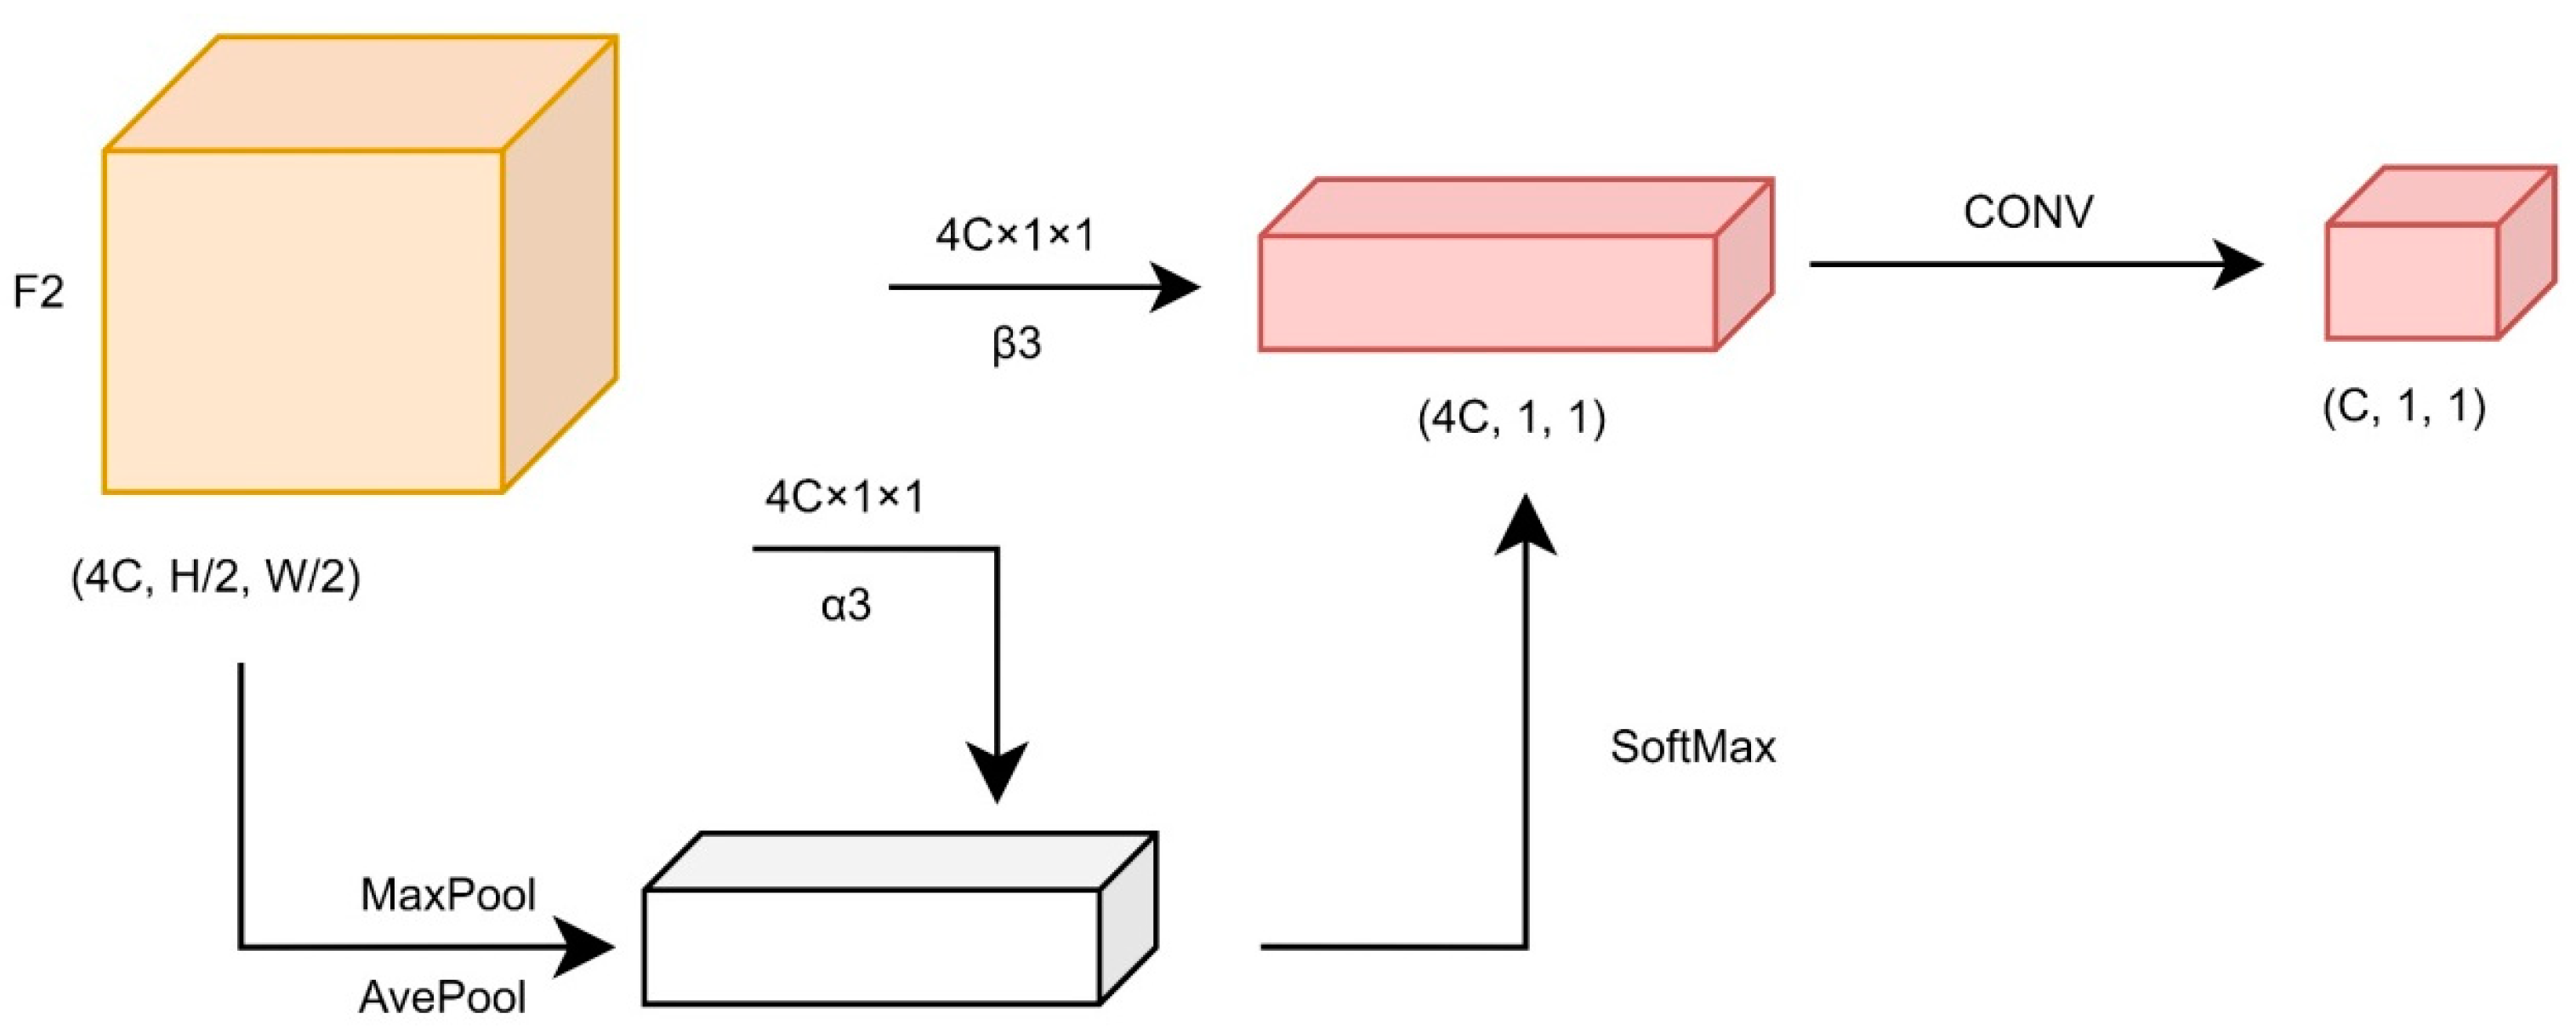
4.1.4. Channel Semantic Enhancement Module
The channel semantic enhancement module mainly focuses on the establishment of the channel attention mechanism, which compresses the spatial scale of the feature map, extracts the most useful region information of the spatial scale, establishes a connection between different channels, and finally assigns the mask weight in the direction of this channel of the feature map so that the attention mechanism is established in the direction of the channel.
For the input feature map F2 (in
Figure 8), we use either the maximum global pooling operation or the average global pooling operation for each channel of the feature map to aggregate the spatial information of the feature maps. We then obtain the attention of different channels through the SoftMax operation, and finally use the convolution operation to transform the feature maps back to the number of channels of the ORI feature maps without destroying the size of the original input feature maps to obtain the feature map output F2′ of the channel semantic enhancement module.
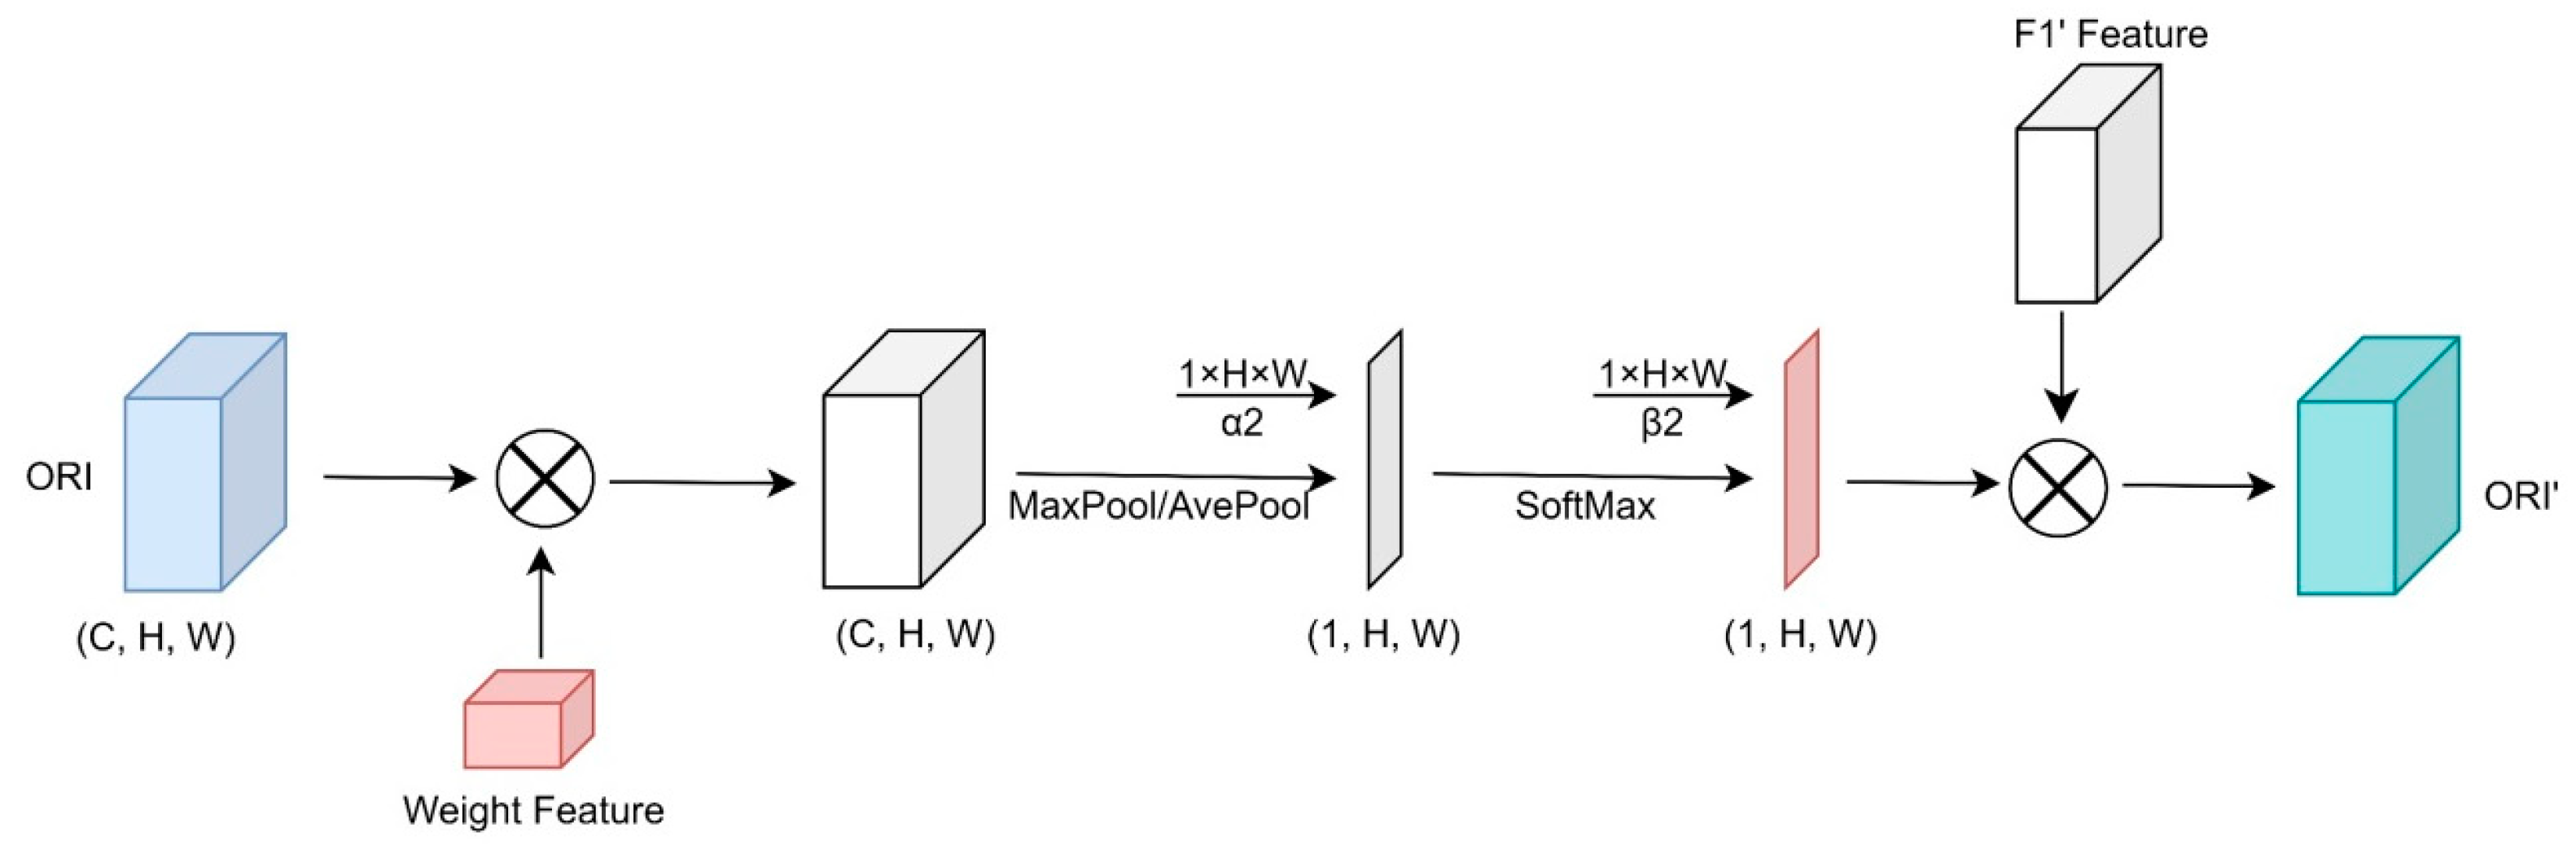
4.1.5. Spatial Semantic Enhancement Module
The spatial semantic enhancement module focuses on the establishment of the spatial attention mechanism. The aim is to extract important information about the longitudinal scale through the compression on the longitudinal scale, establish a connection between the regional scales under the same channel, and finally assign the mask weights in the spatial direction to the feature maps to establish the spatial attention mechanism.
For the input feature map ORI (in
Figure 9), we multiply it by the
feature map so that the feature map with the attention mechanism and the ORI feature map are merged with each other to form the contextual information interaction. Based on this, the feature map is synthesized into the aggregated attention on a channel along the depth direction using the maximum pooling operation or the average pooling operation so that each pixel in each channel receives the most effective information in the depth direction. The attention feature map is then multiplied by the
feature map after the SoftMax operation to interact with the contextual information and connect the attention to each pixel simultaneously.
The short-cut connection was first proposed in the ResNet network structure to solve the problem of gradient disappearance when the number of network layers increases, leading to difficulties in network training. We add the short-cut connection (in
Figure 5) to the module mainly to merge the information of the feature map on the original feature layer with the information of the attention feature map to avoid missing information.
4.2. Prefusion Module
We show the general structure of the prefusion module and describe where the prefusion module is located in the overall structure of network model. We then show the specific composition of the prefusion module, through the three different stages of feature maps as input. These are processed by the module to output the three different feature maps and then transfer them to the neck network.
In the process of laying pipelines, the complex operating environment of the seabed can cause the silt on the seabed to adhere to the surface of the pipeline, forming a layer of irregular silt film. At the same time, the light source from the underwater ARV is absorbed and scattered by the seawater, which causes the image of the pipeline in the model’s field of view to merge with the background color of the silt on the seabed, blurring the boundary between the pipeline and the background. To address this problem, we propose the prefusion module, which enables the network to enhance the fine-grained information about the boundaries by fusing feature maps to improve the performance of the model in detecting boundary segmentation.
We aim to add more shallow and more highly fine-grained feature representations from the feature maps output by the backbone to the deeper feature maps. As shown in
Figure 5, the original model passes the three deep feature maps in the backbone directly to the neck as feature inputs and ignores the two shallow feature maps, which, however, contain rich detailed information that can greatly improve the boundary segmentation of the target. Therefore, we add the prefusion module between the neck and the backbone as the preprocessing layer of the neck layer. As shown in the prefusion module in
Figure 5, each module M receives three different stages of backbone output feature maps and performs the fusion process (the specific fusion process will be explained in detail later), and the feature maps of the output of the three parallel modules are then fused by the output feature maps from the three parallel modules in a top-down manner. Finally, we output the same size feature maps as the original backbone by DW convolution and pass them to the neck layer for further processing.
Module Design
The prefusion module takes multiscale feature maps as input and acts as a bridge mediator between the backbone and the neck, which can fully and effectively utilize all the output feature maps of the feature extraction network and provides a high-quality starting point for subsequent feature map processing in the neck layer. The computational input maps of the prefusion module are composed of three feature maps of different scale feature hierarchies with a scaling step of 2 between them, which are processed by the prefusion module to produce output maps of the same size. These are recomposed into three layers of feature maps as inputs to the neck layer. We choose the last layer of the feature maps of each stage of the backbone as the input, and this choice is natural because the last feature map of each stage tends to have the strongest feature expression of that stage.
The specific sequence of feature map processing is shown in
Figure 10. First, we take the
feature map, the
feature map, and the
feature map as inputs. For the
feature map, we use the de-conv operation to up-sample the feature map to the size of (C, 4H, 4W) and add it to the
feature map, and the result is nonlinearly transformed by DW convolution. In DW convolution, we adopt the expansion convolution kernel with an expansion coefficient of 2, so that the feature map can obtain a larger sense field in the nonlinear transformation, while at the same time, the DW convolution can effectively reduce the model parameters and reduce the extra overhead in the modeling process. The feature map output by the DW convolution is then reduced to the size of (2C, 2H, 2W) by the down-focus module designed above. Similarly, for the
feature map of size (4C, H, W), the feature map is enlarged to (2C, 2H, 2W) using the nonlinear DW convolution and the up-focus operation, respectively. Next, the
feature map, the
feature map, and the
feature map processed above are stacked with the
feature map using the concat operation, and finally transformed back to the size of the
feature map by the DW-conv operation and output.
5. Experiment
The main body of the experimental tank is 50 m long, 40 m wide, and 10 m deep, with a gantry crane spanning over the tank to tow and lift the simulated offshore pipe. There is an indoor natural light illuminance of 15~200 lux, an underwater ambient light illuminance of 5~40 lux, water-scattering turbidity of 9~15 NTU, and a particulate suspended matter concentration of approximately 0.6 g/cm3.
The model computational reasoning environments are all deployed on a NVIDIA Xavier module, with a 6-core NVIDIA Carmel Arm processor, 32 GB of 256-bit video memory, 32 TOPS of computing power, and 750 Gbps of high-speed I/O power, running a Ubuntu 20.04 operating system and using Tensor-RT for computation and fast inference.
5.1. Datasets and Implementation Details
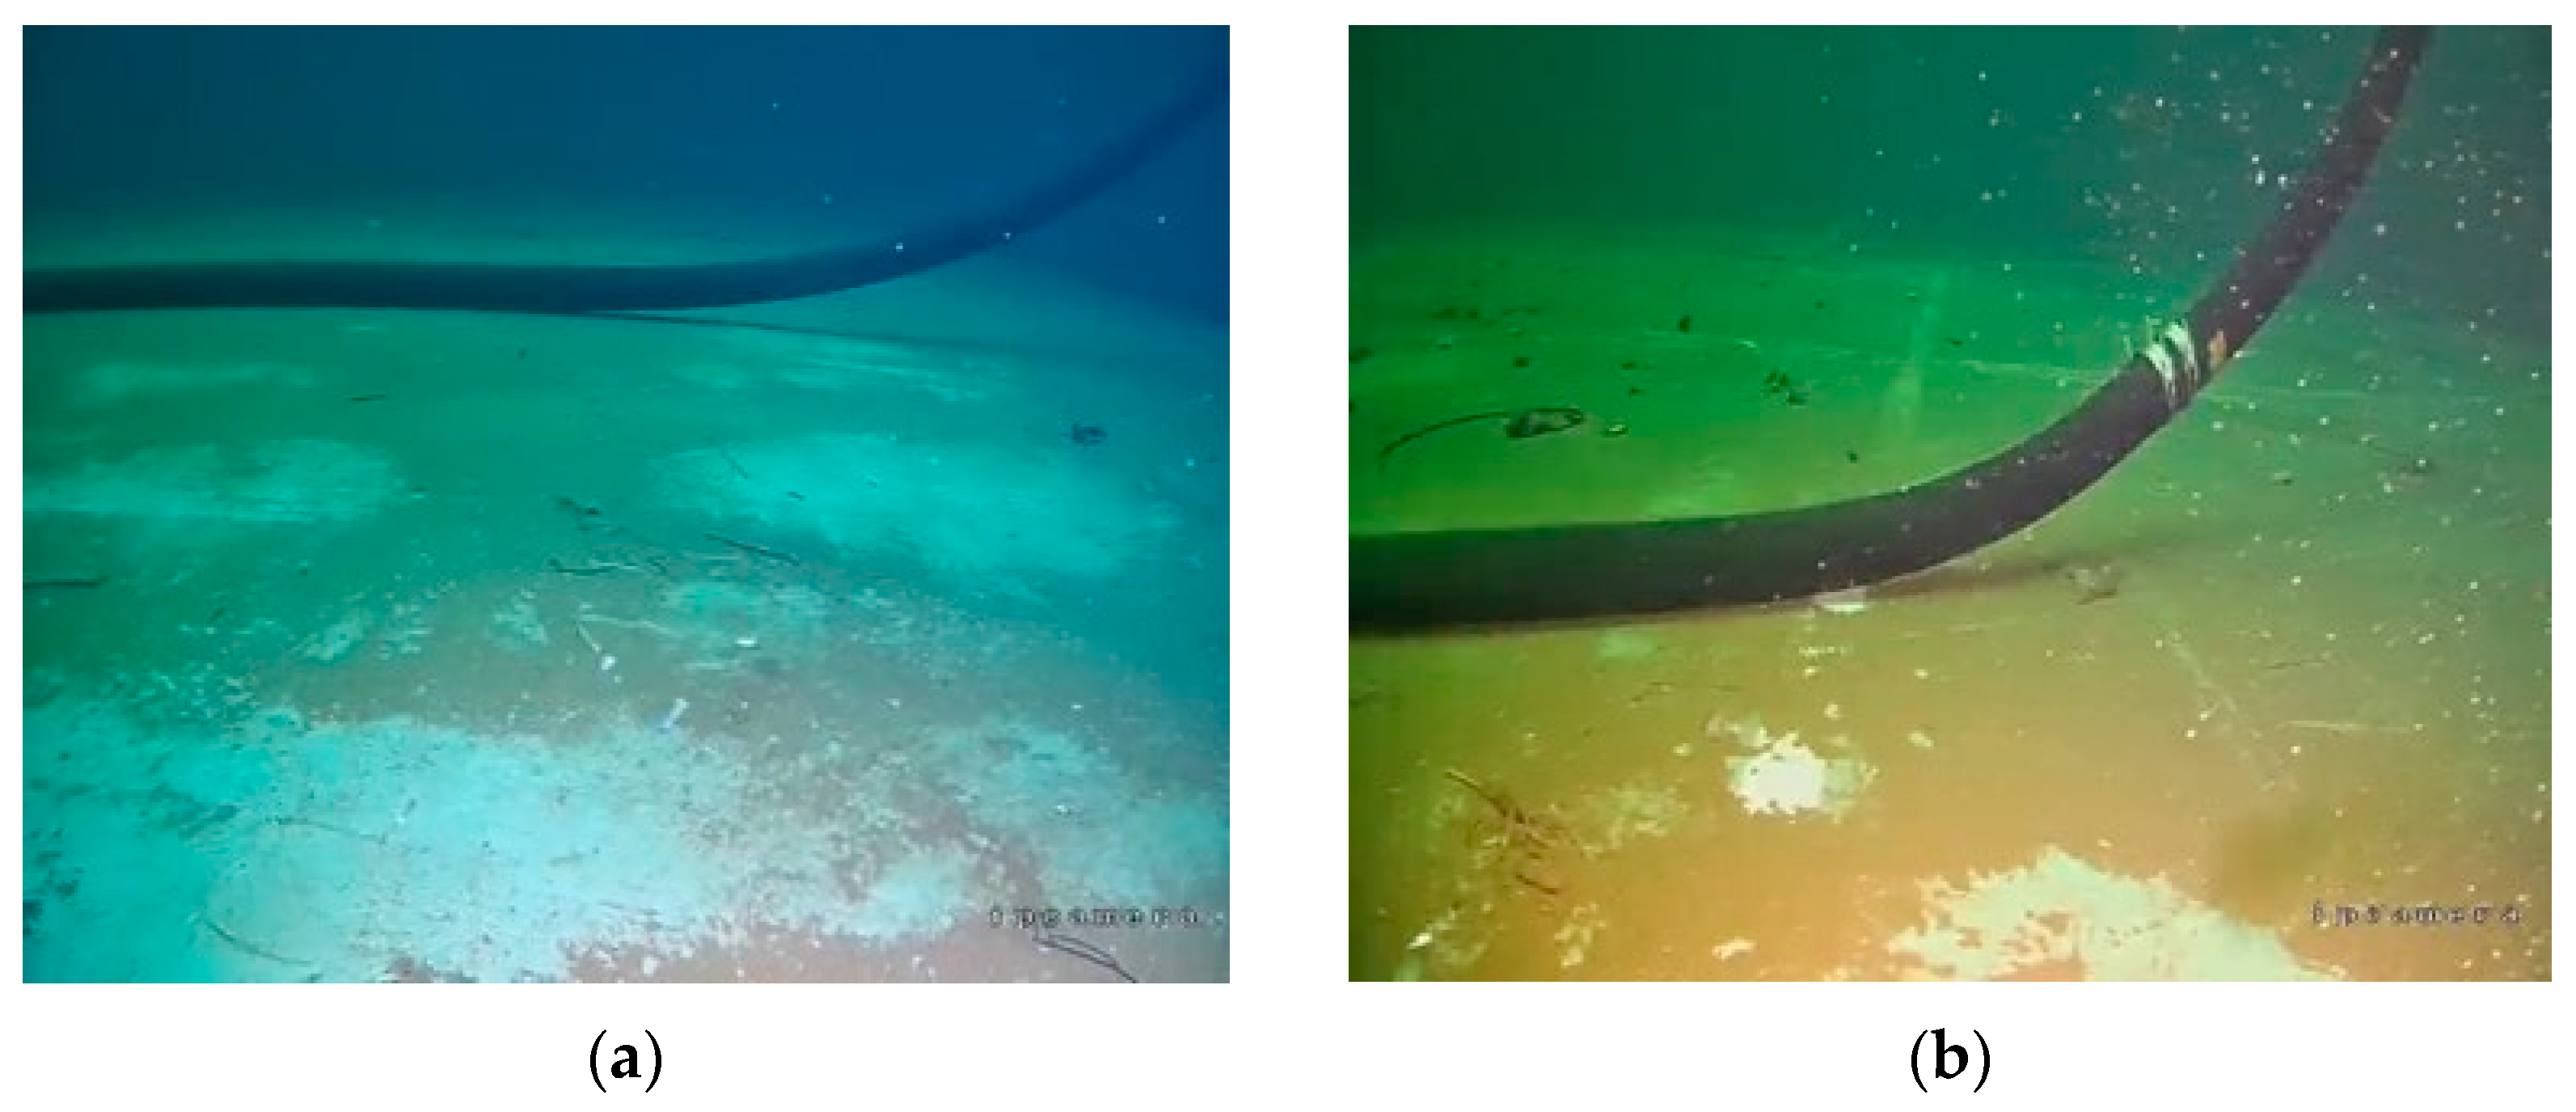
Our experiment is based on the oil pipeline inspection experiment project. The dataset for detecting seabed-contacting segments of an underwater oil pipeline consists of 4000 underwater oil pipeline images, each 575 × 704 pixels in size. There are 2800 images in the training set, 800 images in the validation set, and 400 images in the test set, as shown in
Figure 11. The batch size is set as 8, the initial learning rate is 0.004, the optimizer is Adam, a linear learning rate is used to warm up in the first 1000 iterations, a cosine learning rate is used thereafter, and the input image size is set as 640 × 640 pixels.
5.2. Attention Module Ablation Experiment
We add the cascade attention module to various baseline network models and perform ablation experiments on the seabed-contacting segment detection dataset. The results are summarized in
Table 2. The indicator mAP is used to describe the average accuracy in target detection. All networks with cascade attention outperform the baseline network, which demonstrates that our proposed cascade attention module is powerful and widely generalizable, improving the performance of network detection.
Considering the above performance of the network model, we decided to use the RTMDet network model as a baseline to explore the effects of different modules on the accuracy of underwater seabed-contacting segment location detection by adjusting the different module combinations.
As shown in
Table 3, the proposed cascade attention module significantly improves the performance of target detection. Compared with the baseline RTMDet, the seabed-contacting segment detection mAP of the oil pipeline with spatial semantic enhancement module reaches 63.5%, which is an improvement of 2.5%, and achieves 1.8% and 1.3% with the positioning semantic enhancement module and the channel semantic enhancement module, respectively. When we combine the spatial semantic enhancement module, the channel semantic enhancement module, and the position semantic enhancement module, we find that the detection mAP of the model is further improved compared with the original. This shows that, by applying different scale transformations to the feature map and fusing contextual information, the feature map information can be further utilized, which is conducive to improving the detection performance of the network. Furthermore, when our proposed cascade attention module is applied, the mAP of the seabed-contacting segment detection reaches 66.5%, which is a significant improvement of 5.5% when compared with the baseline network.
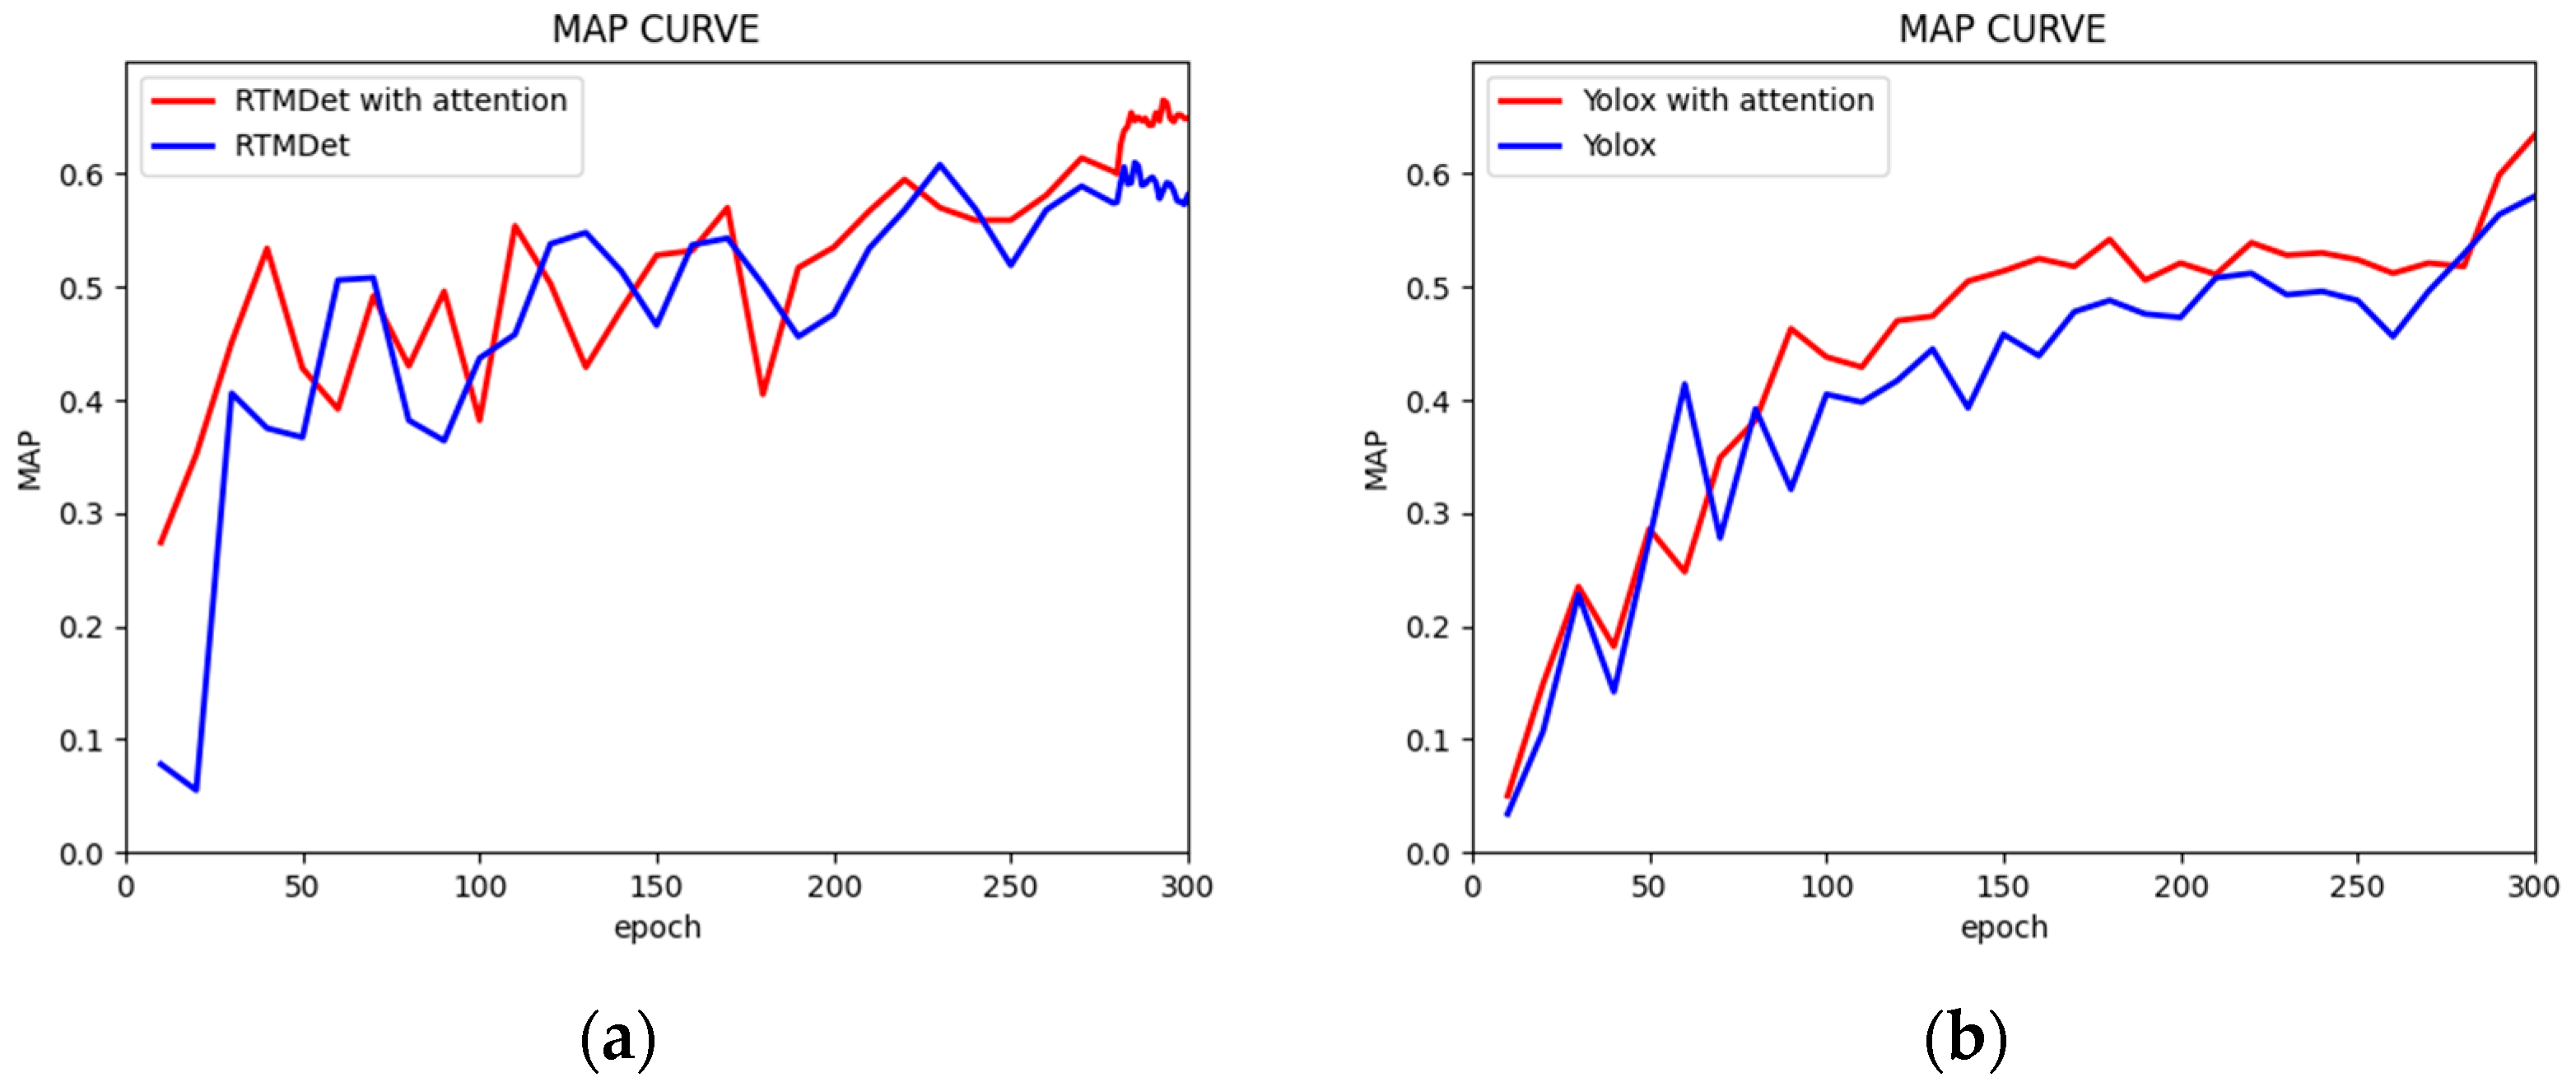
Figure 12 shows the mAP curves of the RTMDet and YOLOX network models trained on the dataset to detect seabed-contacting segments in underwater pipelines. It can be clearly seen that, in the RTMDet network model, the RTMDet network with the cascade attention mechanism can learn the effective information features from the dataset faster at the beginning; however, in the middle stage, the network with the cascade attention mechanism and the baseline network are always in a fluctuating upward process. We believe that this may be caused by the distribution of the data. The two models in the same dataset at different stages of the model parameters of the feature information, expressed by the ability to perform differently, are both, in general, constantly learning the process of increase. In the last 20 iterations, the two converge to stabilize. The addition of the cascade attention mechanism to the network model, and its model characterization ability, begins to highlight that its model detection performance is higher than that of the baseline network model.
In the YOLOX network model, the validation mAP of the model is approximately at a comparable position level at the beginning of training. However, as the training iteration progresses, the network model with the addition of the cascade attention module, due to the incorporation of the attention mechanism, continues to increase attention in the vicinity of the seabed-contacting segment of the oil pipeline, distancing itself from the original baseline detection and consistently maintaining the leading level of mAP compared with its baseline network.
Figure 12 adequately illustrates the effectiveness of the cascade attention mechanism in the network model.
5.3. Prefusion Module Ablation Experiment
From the study of the cascade attention ablation experiment above, it can be seen that the performance of the model under the RTMDet network model is the best. We explore the performance of the prefusion module on the network model on this basis as detailed below.
We consider the cascade attention module and the prefusion module as two separate base modules and discuss the performance of the RTMDet network model with different combinations of the two base modules. Since the prefusion module differs from the attention module above in that it focuses more on the control details after fusing the fine-grained information of the low-level feature maps to the high-level feature maps, we add the segmentation header of the target to the original one and add the mIOU evaluation metrics to evaluate the network model’s grasp of the object’s details during object detection. At the same time, since the prefusion module was designed so that the number of parameters and computation of the original network model does not increase too much, we added the indexes of computation and the number of parameters to evaluate our model.
The ablation experiments for both the cascade attention and prefusion modules are shown in
Table 4. It can be seen that, compared with the baseline network model, both the mAP and mIOU indices are significantly improved by the advancements in the attention module and the prefusion module, with the mIOU index reaching 74.7% and the mAP performance improvement being relatively obvious at 67.3%. However, when only the attention module or only the prefusion module is added, the mAP and mIOU performances of the two show different levels of increase (i.e., the mAP performance of cascade attention is better than that of the latter and has a greater increase relative to the baseline network, but is not as good as the prefusion module in terms of mIOU performance). This is because the attention mechanism focuses more on one feature point in the target to improve the target localization and classification performance, while the prefusion module is more sensitive to the pixel-level IOU perception owing to the addition of the low-level feature maps with higher granularity; so, its mIOU performance is naturally higher compared with the attention module.
The floating-point operations and the model parameter size with different modules on the baseline network are shown in
Table 4. In general, the increase in parameters and floating-point operations after adding the cascade attention module and the prefusion module is not very large. The increase in model parameters mainly comes from the attention module, while the number of model parameters in the prefusion module is almost zero. This is due to the use of DW convolution in the prefusion module, which changes the mode of ordinary convolution by first considering the region of the feature map, and then considering the changes in the feature map channel to achieve the separation of channel and region and realize the nonlinear expression of the feature map. Meanwhile, the number of convolution parameters is greatly reduced.
5.4. Visualization and Analysis of Model
To analyze the results of our ablation experiments, we use the Grad-CAM method to visualize the results of our image processing. We simultaneously evaluate the segmentation accuracy of our model using the Hausdorff distance [
42].
5.4.1. Attention Visualization
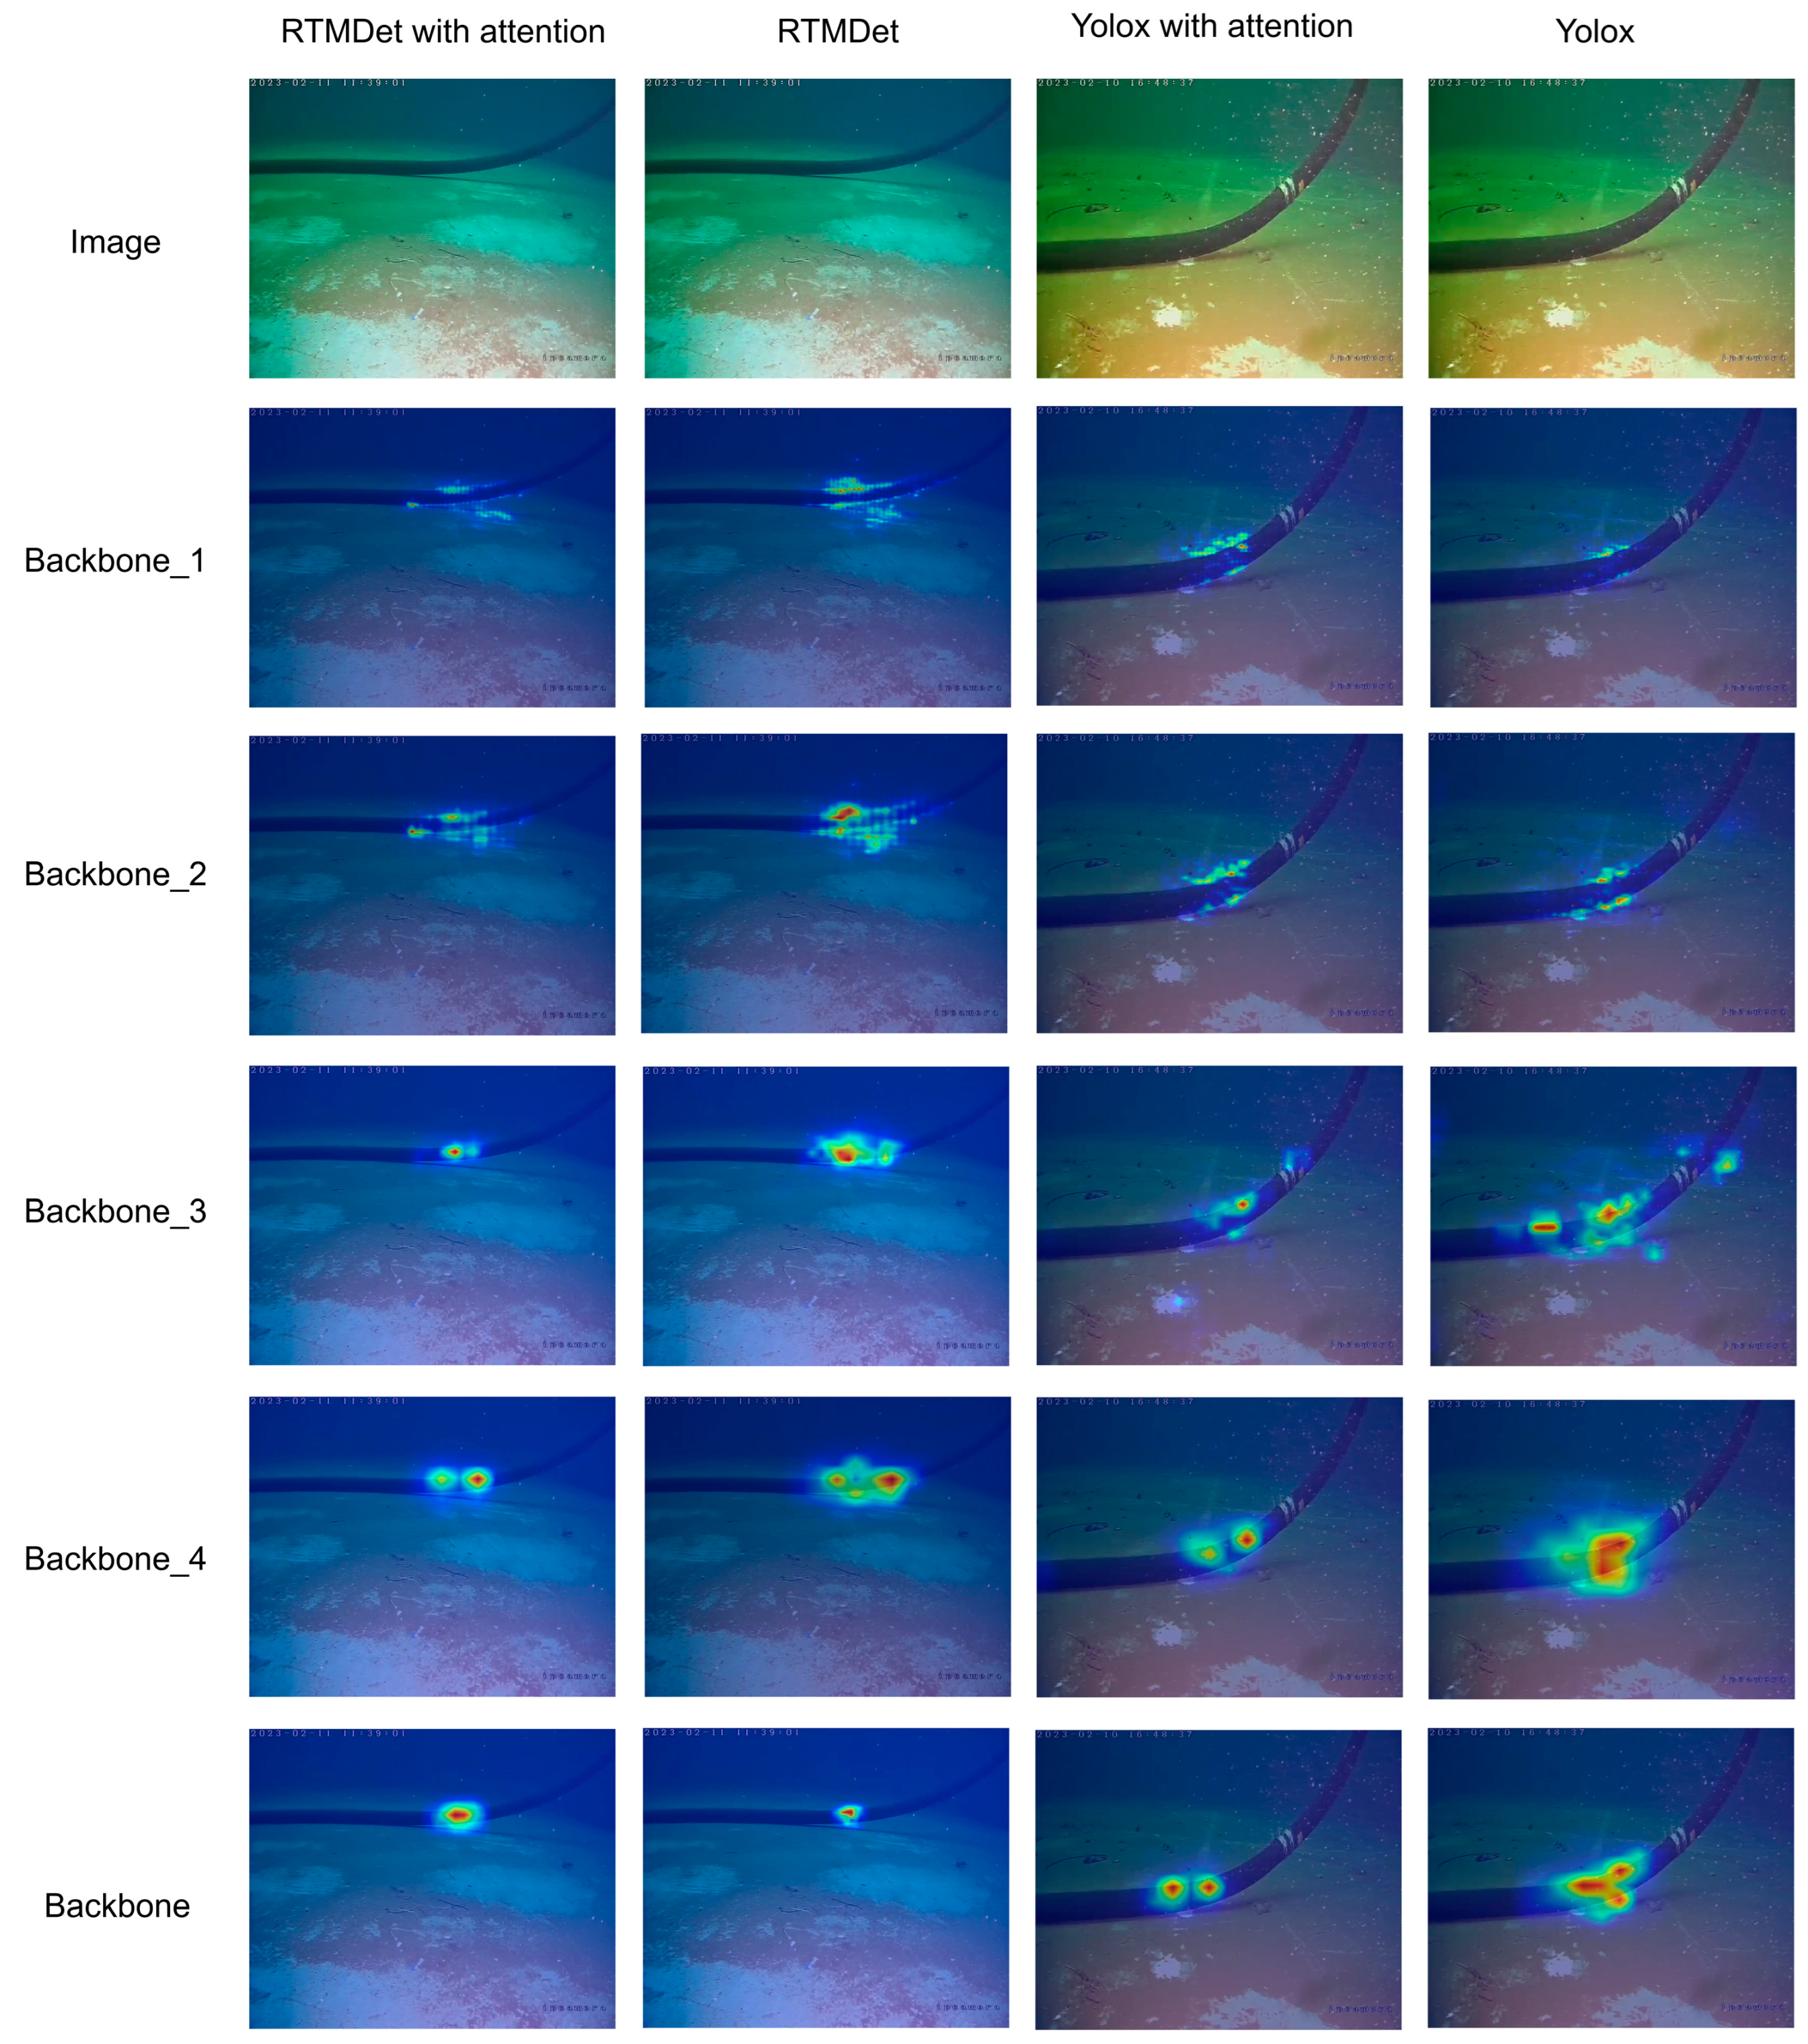
To better demonstrate the effectiveness of the cascade attention module, we apply Grad-CAM to the RTMDet and YOLOX network models, respectively, to visualize images from the subsea seabed-contacting segment detection dataset. Grad-CAM generates heat maps for the input images and is able to clearly visualize the image positions from which the network learns and on which it focuses.
Figure 13 compares the visualization results of the network baseline with those of the additional cascade attention module and shows, in particular, the feature attention maps in the backbone phase. It is clear that the network with cascade attention can focus on the target object better than the baseline network in the third and fourth feature maps of the backbone.
The images above represent the feature attention maps of backbone without cascade attention and backbone with cascade attention, respectively. We clearly see that the attention area of the former is large and scattered, and that even some of the attention has been transferred to the background of the tank, which is not desirable. When we add the cascade attention module, we can clearly see that the attention of the feature map is more concentrated compared with the former, and that the attention is placed in the foreground of the object oil pipeline, although there are two attention points. However, these two attention points are close to each other and are located at the turning position of the seabed-contacting segment of the oil pipeline, which is an obvious feature of the seabed-contacting segment of the oil pipeline, and is helpful for detecting the seabed-contacting segment of the oil pipeline. In other words, the cascade attention module successfully fuses the contextual attention information, which enables the network to learn the aggregated features and improve the accuracy of detecting target objects, fully proving the effectiveness of the cascade attention module.
5.4.2. Visualization of Prefusion Module
The Grad-CAM network visualization fully demonstrates the improved target detection performance of the network model with the addition of the cascade attention module. Meanwhile,
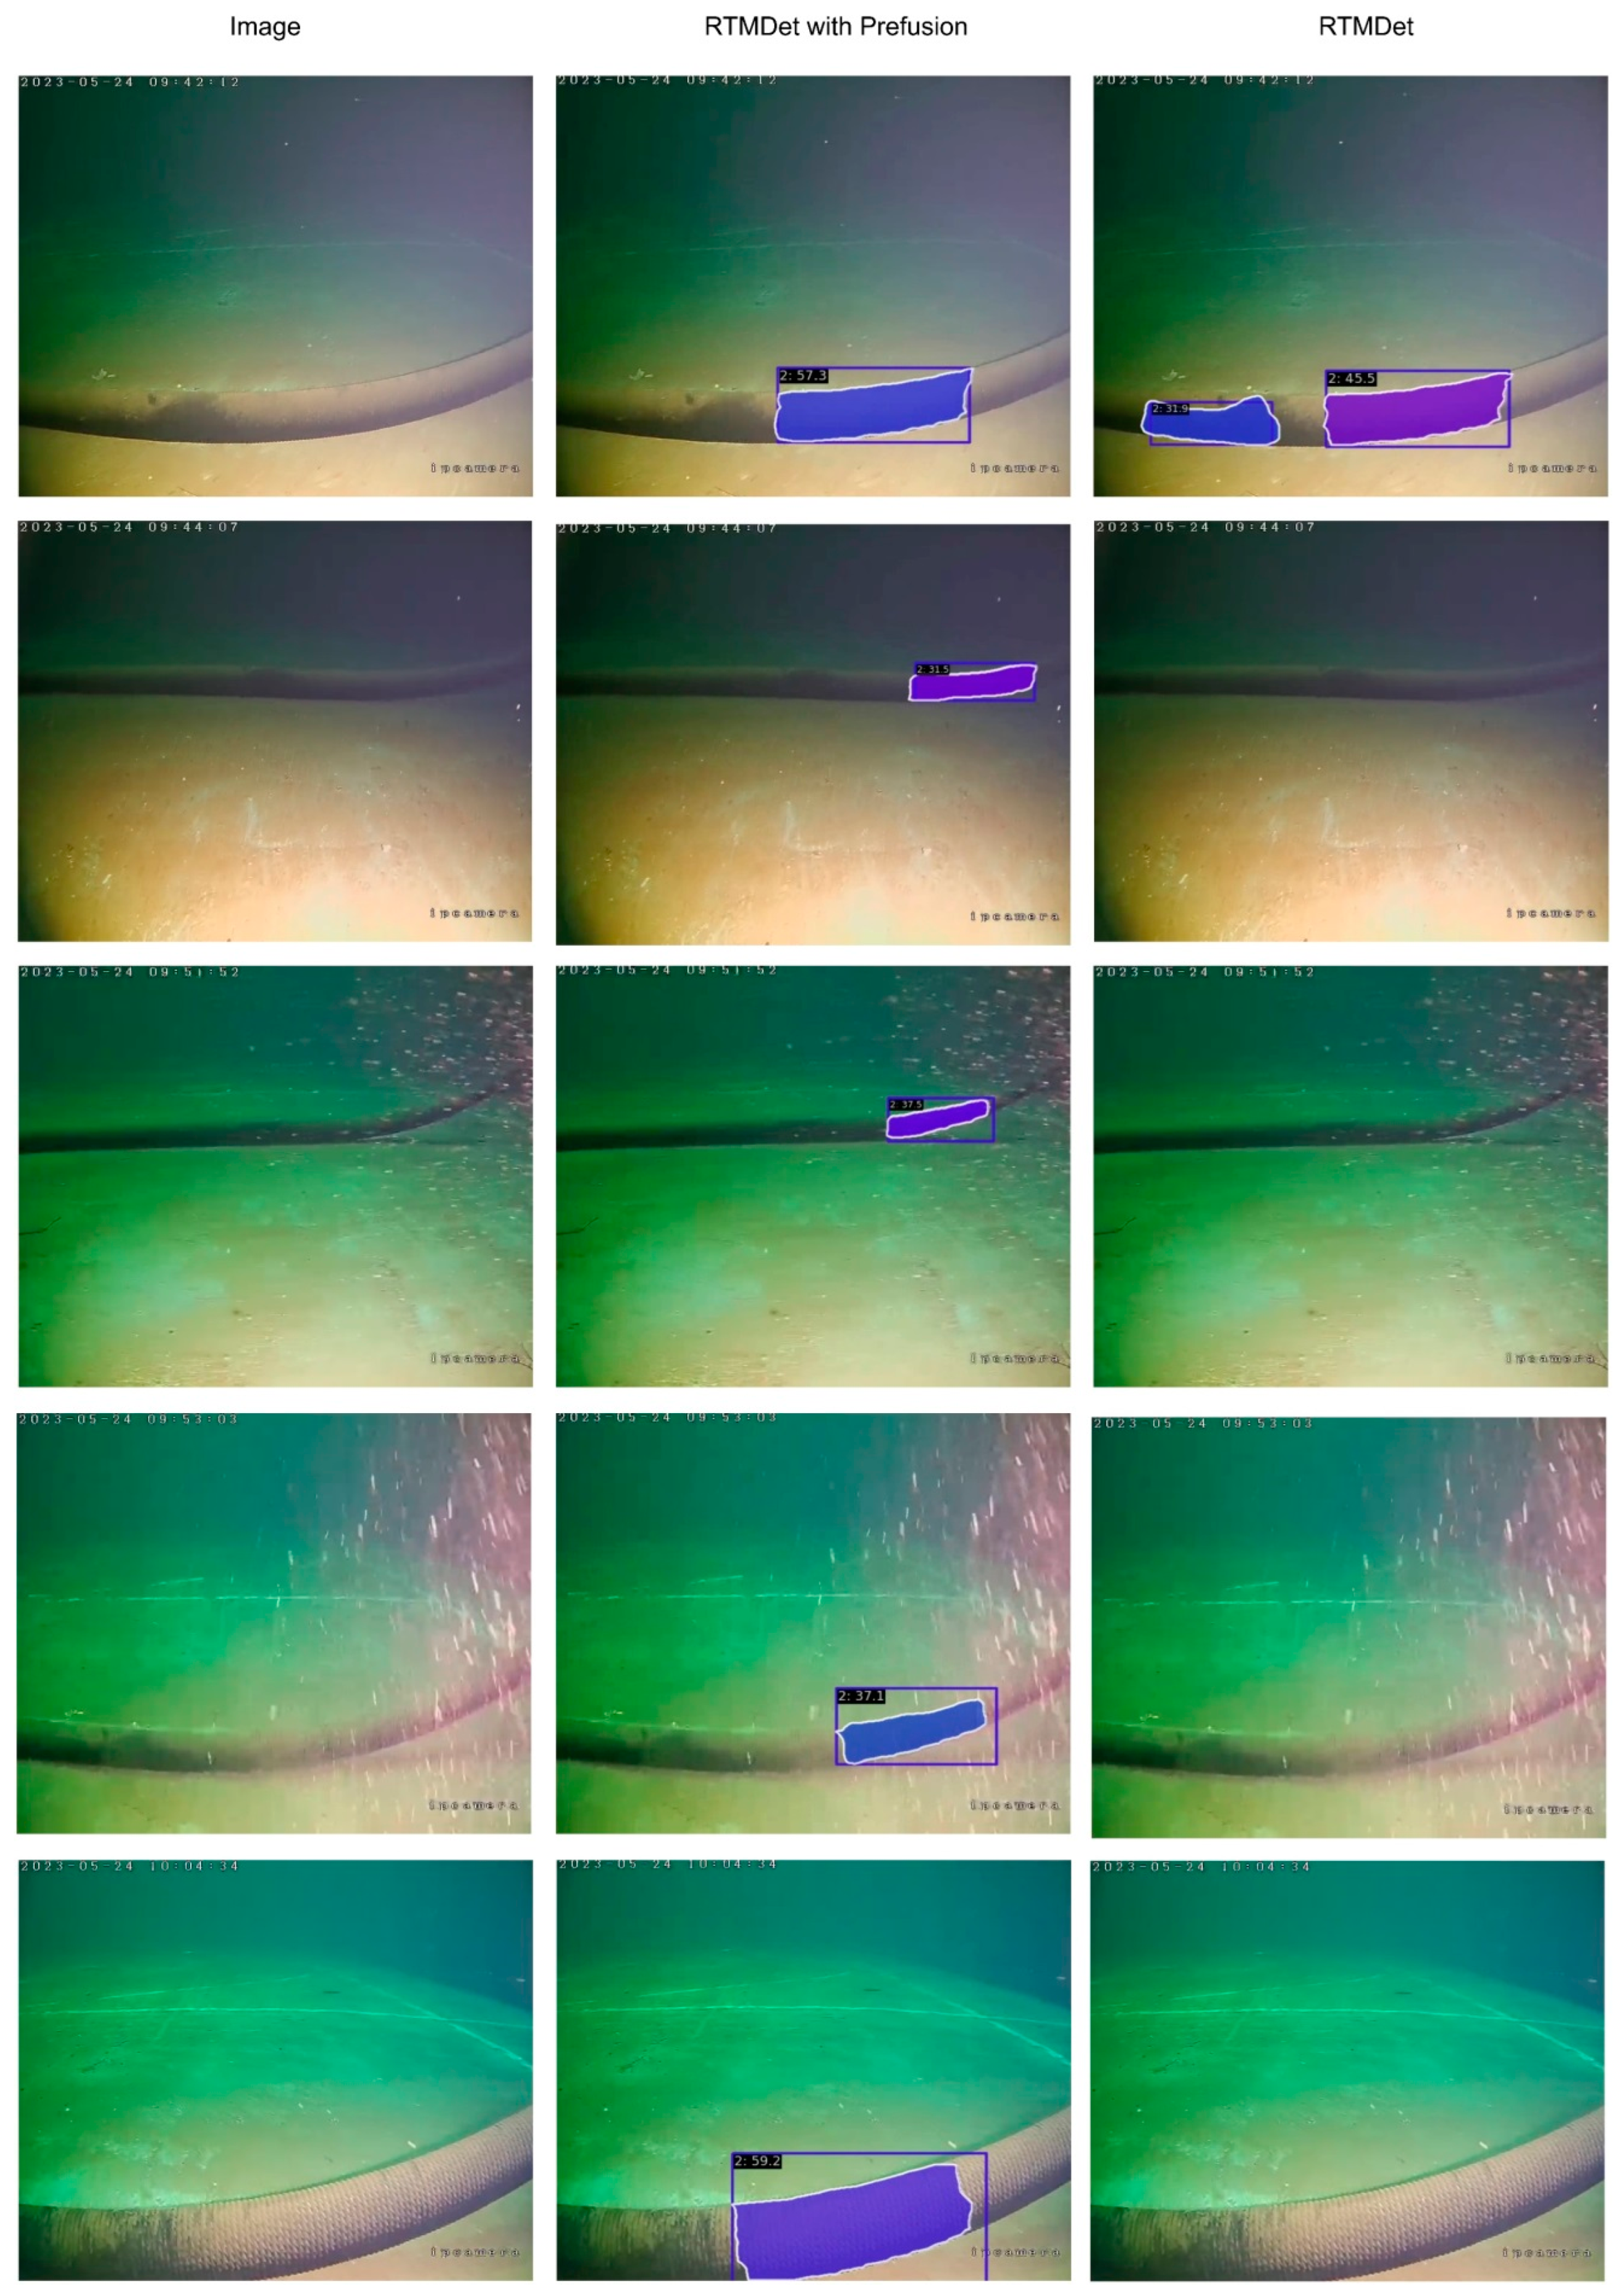
Figure 14 illustrates the segmentation effect of the network model through its target segmentation task.
We use the RTMDet network model as the baseline network for detection. From
Figure 14, it can be seen that adding the prefusion module to the baseline model directly leads to a great difference in the detection model test data. The figure shows a more discriminating visualization of the results selected from the dataset.
It can be seen that the baseline network in the dim underwater environment has misdetection errors, and its model segmentation accuracy is lower compared with the previous model detection results with the addition of the prefusion module. Meanwhile, when our target pipeline is close to or far away from the underwater ARV, underwater disturbances may stir up the silt under the water, causing the pipeline to be exposed to floating dust, which greatly increases the difficulty of model detection. As can be seen from the figure, in this situation, by adding the prefusion module, the model fully understands and learns the semantic information of the context in the feature map, which enables the model to maintain sufficient detection and segmentation accuracy, even in the dusty underwater environment. Secondly, when the ARV is far away from the oil pipeline, the pipeline in the image almost blends in with the background color in the dim environment, owing to the limited distance of the light, leading to difficulty in detecting the seabed-contacting segment of the oil pipeline. The original baseline model is no longer able to detect and segment in this environment. Correspondingly, after adding the feature prefusion module, the ability of the model to judge the position of the oil pipeline seabed-contacting segment is enhanced and its generalization ability is improved so that, even in a situation where the target oil pipeline almost merges with the background color, it still maintains good detection and segmentation performance, and the segmentation accuracy can still be guaranteed.
5.4.3. Analysis of Pipeline Boundary Accuracy
The Hausdorff distance is sensitive to the boundary of the target segmentation and can be used to evaluate the segmentation accuracy of the target segmentation. The Hausdorff distance is a measure that describes the degree of similarity between two sets of point sets. It is a defined form of the distance between two point sets. Assuming there are two sets
,
, the Hausdorff distance is defined as follows:
where
and
can be described as follows:
where
is the distance paradigm between point set
and point set
.
In
Figure 15, underwater pipeline images under different lighting and distance conditions are shown from top to bottom. The real labeling map and its mask map, and the prediction map and its mask map are shown from left to right, respectively. We simply want to compare the boundary accuracy of the segmentation without considering the different Hausdorff distances between the label map and the prediction map caused by the color changes in the images. Therefore, we transform both the segmented label part and the segmented pipeline part in the prediction map into mask maps in binary form. Using the binary form of the labeled mask map and the predicted mask map, we calculate the Hausdorff distance of both to evaluate the segmentation accuracy of the picture.
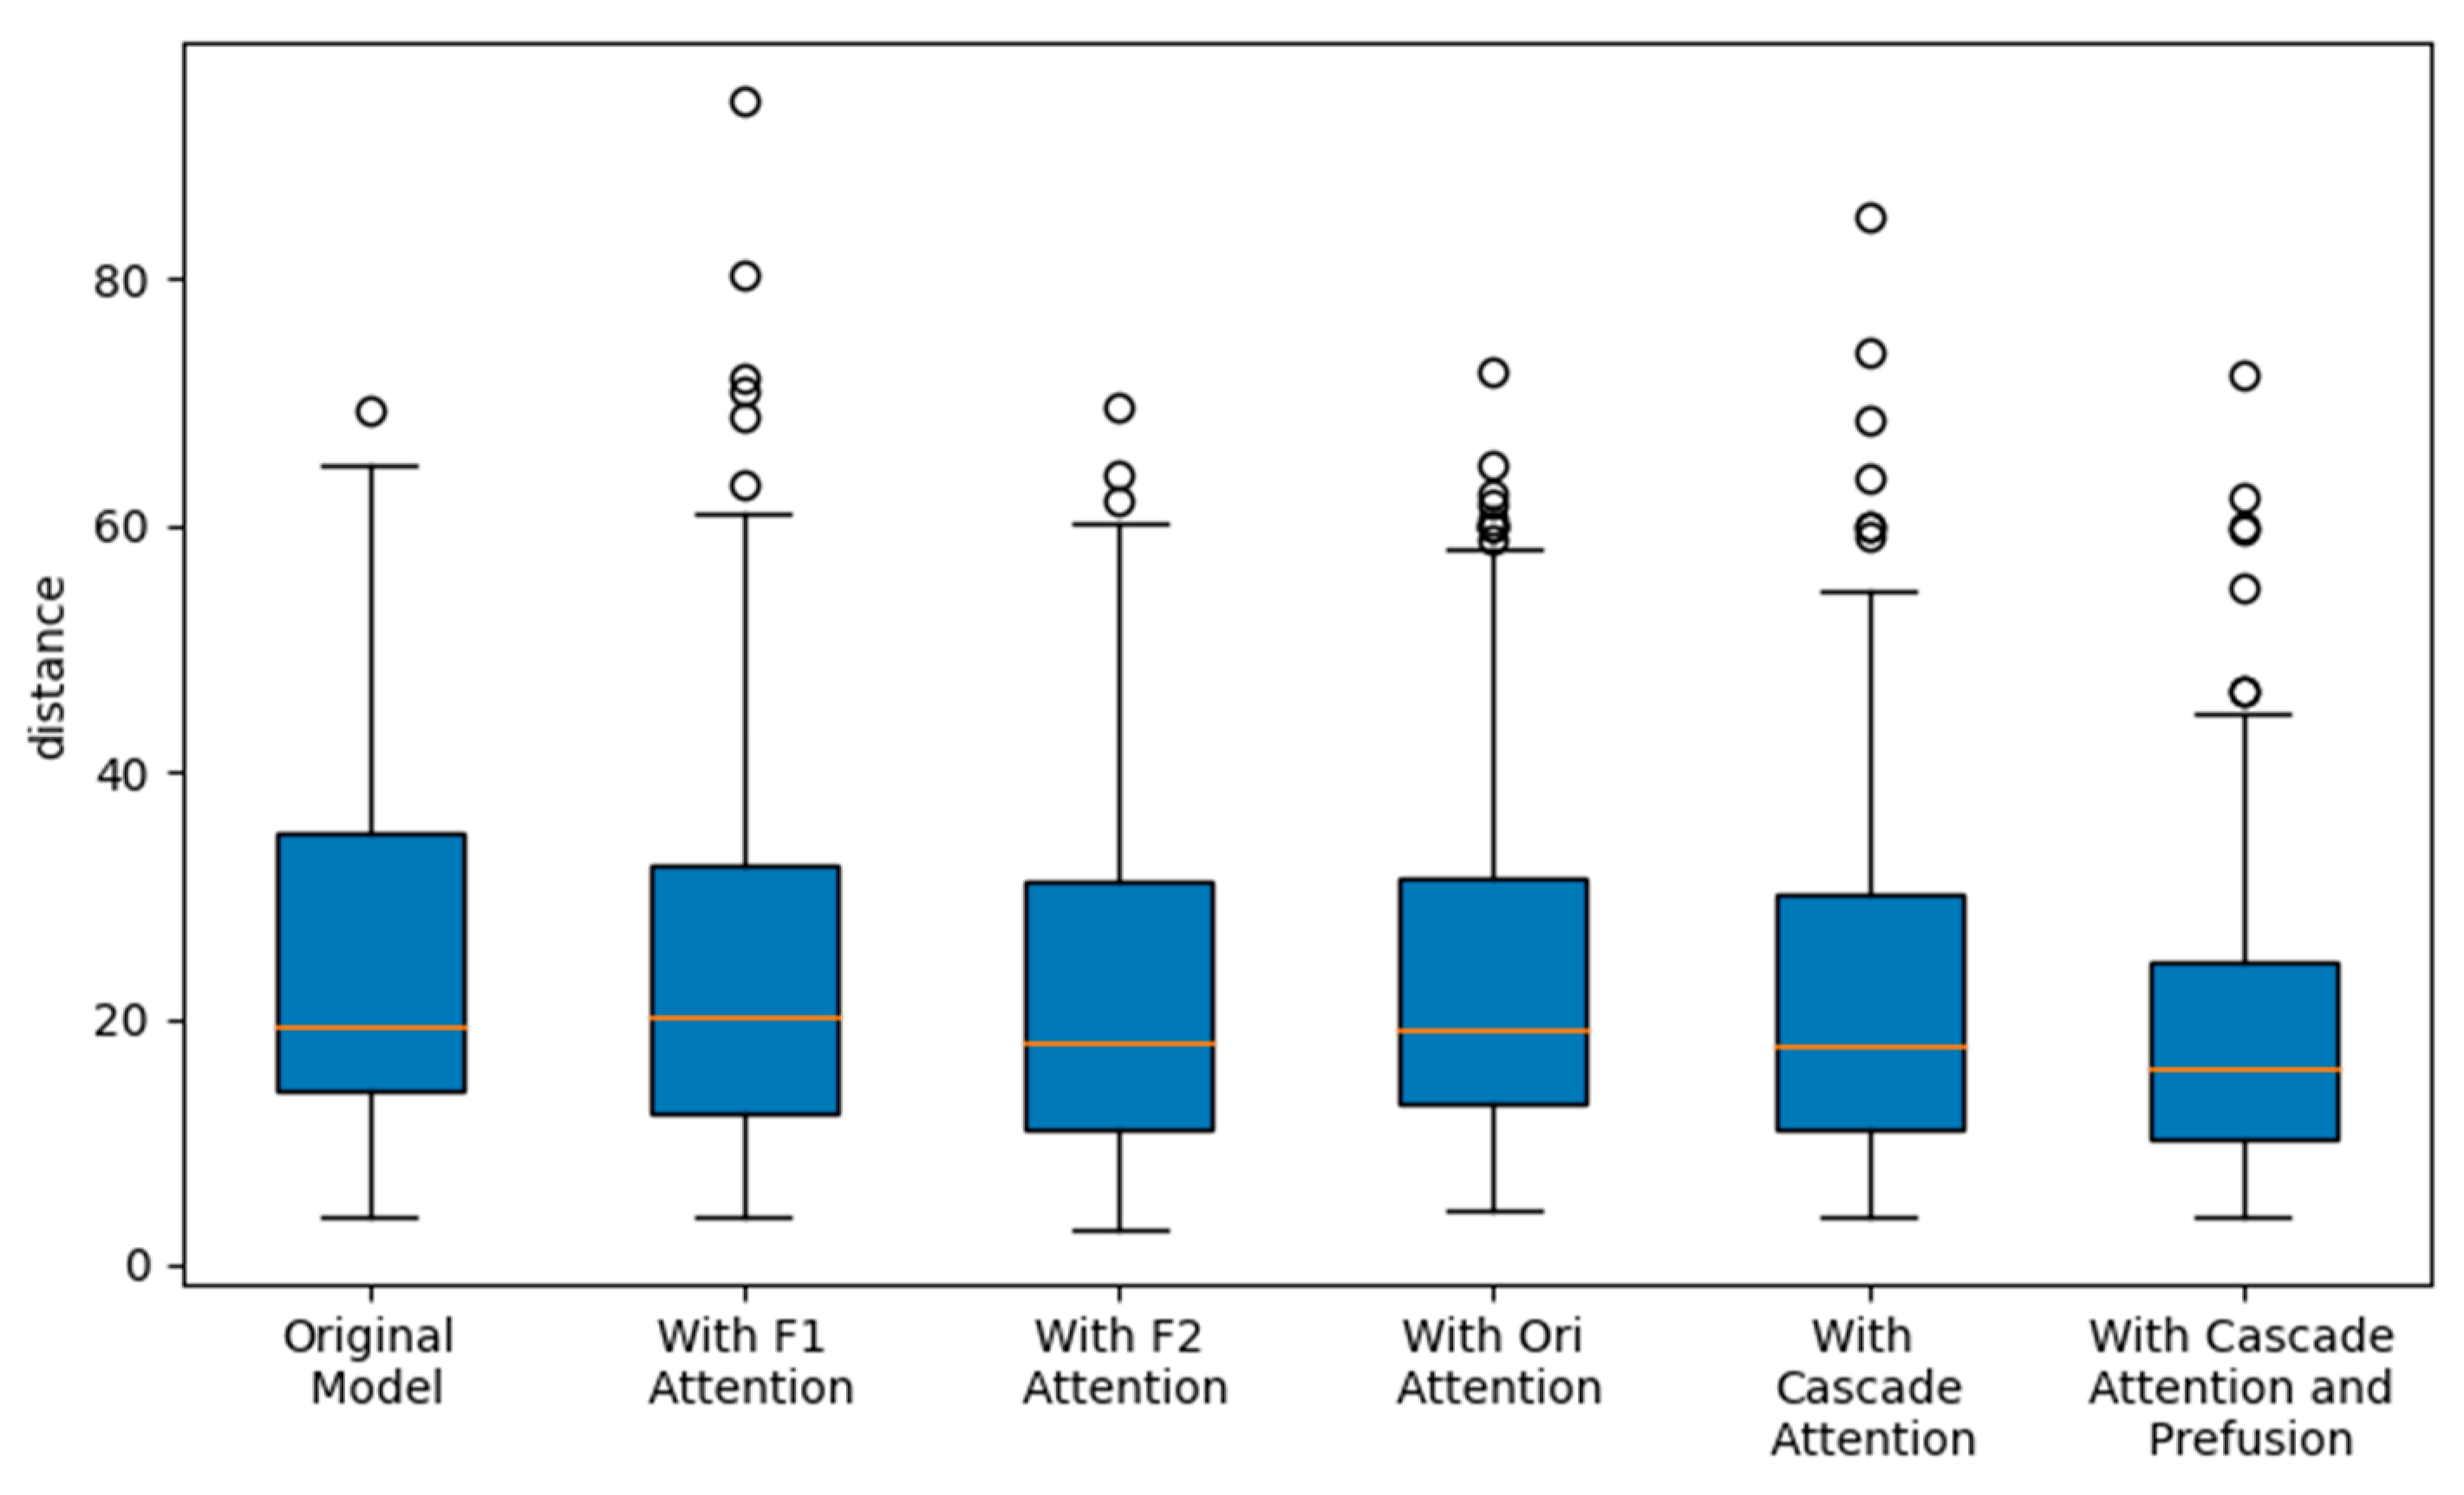
In our test dataset, we test different combinations of modules to calculate the Hausdorff distance and plot it as a line graph, as shown in
Figure 16. The average Hausdorff distance is plotted in the figure. We see that the overall Hausdorff distance shows a decreasing trend with the addition of our modules, indicating that the accuracy of segmentation continues to improve, and that there is a significant portion of the dataset in which the degree of fluctuation in Hausdorff distance continues to decrease with the addition of our modules. This is a good indication of the effectiveness of our proposed modules.
5.5. Validation of Tank Experiment
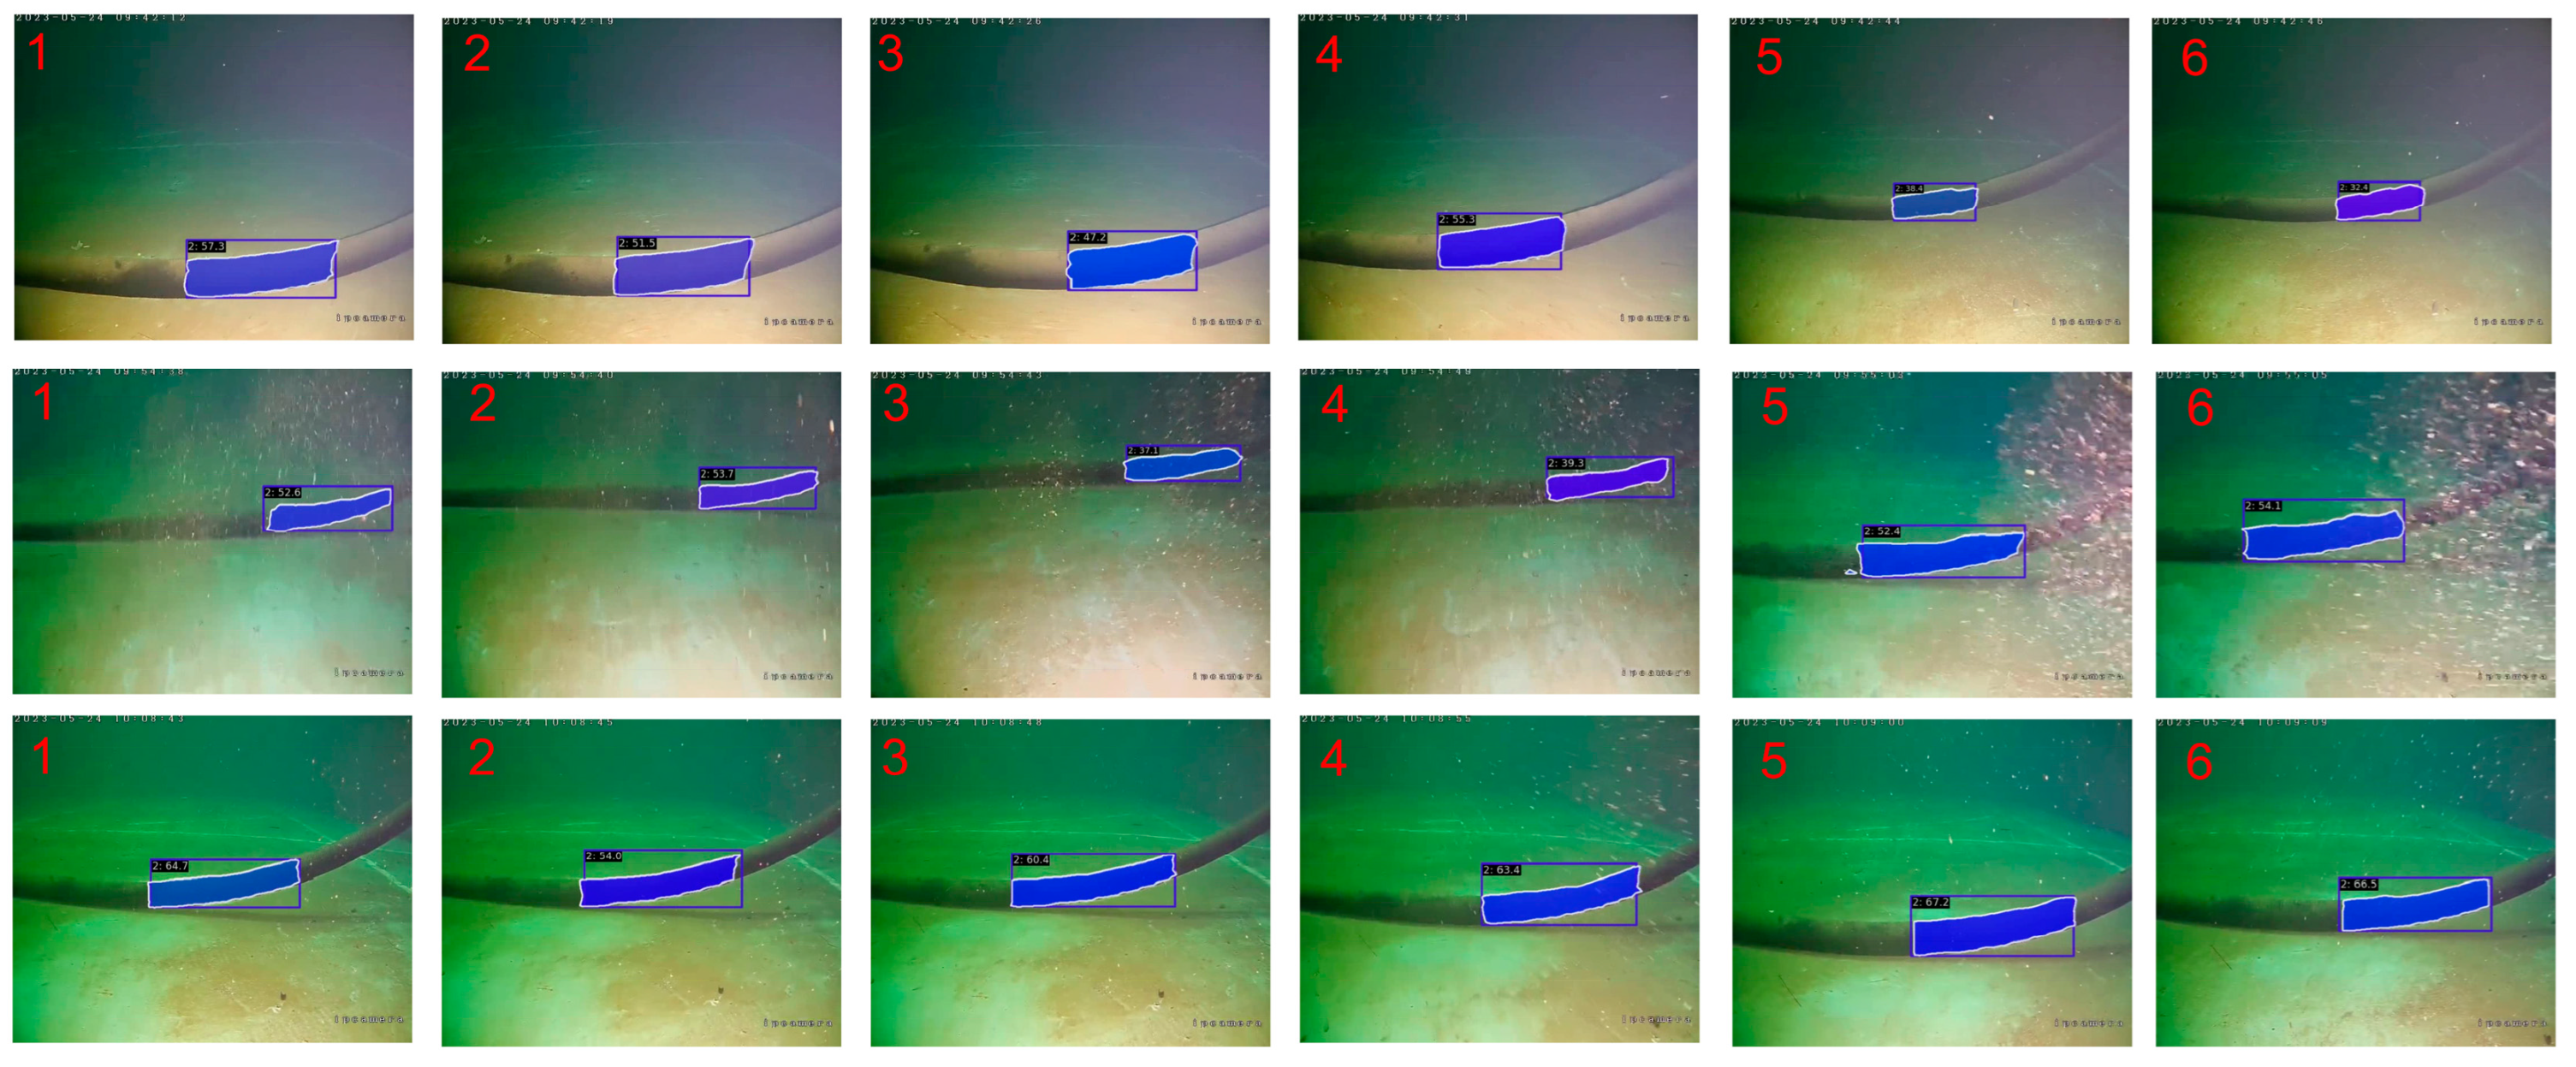
To validate the effectiveness of our proposed cascade attention module and prefusion module, we deployed the model to the Nvidia Jetson Xavier 32G embedded platform and integrated it into the ARV underwater robot. During the test, the laying speed of the underwater oil pipeline was approximately 0.2 m/s. Real-time detection was performed using the ARV’s side view camera, while different environments were set up to check the model’s detection performance by changing the distance to the target, light, water quality, and other conditions.
The results of the image inference sequences under three different environmental conditions are shown in
Figure 17. The image size detected by the ARV is 575 × 704, the inference speed of the image on the model reaches 36 FPS, and the accuracy rate of image inference reaches more than 95%, realizing the task of tracking and detecting the seabed-contacting segment of the underwater ARV in the process of oil pipeline laying and fully proving the effectiveness of our proposed module.
6. Conclusions
We proposed a cascade attention module to improve the network representation capability and a prefusion module to refine the feature representation capability of the network model, achieving excellent detection performance in seabed-contacting segment detection. Specifically, the target detection and instance segmentation performance of the best model were improved by 6.3% and 3.8% over the baseline model, reaching 67.3% of AP and 74.7% of mIOU, respectively. The cascade attention module extracted the attention information in the feature maps using three different types of attention, and then fused them in a cascade to produce an attention map. The prefusion module took advantage of the fact that the fine features of the shallow feature maps are more conducive to target localization, fusing them with deeper feature maps containing semantic information to produce richer feature information maps. Finally, the effectiveness of the module was verified using the tank experiment validation method. In the tank experiment validation, the model inference speed of a 575 × 704 image on the Nvidia Jetson Xavier 32G embedded platform was 36 FPS, and the accuracy of image inference reached over 95%. This demonstrates that the submerged ARV can accomplish the task of tracking and detecting seabed-contacting segments underwater during pipeline laying, proving the effectiveness of our proposed module. The current study was limited to tank experiments, which differ greatly from real marine environments on the seabed; thus, further tests are needed to prove the effectiveness of the model. Moreover, in the process of submarine oil pipeline laying, submarine sediment floats can occur, resulting in detection images being blurred, which reduces the model detection performance. In addition, it is necessary to deal with situations in which suspended sediment obscures the target object. In future research, we will continue to improve and optimize detection methods for application in ARV systems operating in actual underwater seabed environments.
Author Contributions
Conceptualization, B.W. and Y.L. (Ye Li); methodology, B.W.; software, J.W.; validation, J.W. and C.Z.; data curation, Y.L. (Yueming Li) and J.C.; writing—original draft preparation, J.W.; writing—review and editing, B.W.; funding acquisition, B.W. and J.C. All authors have read and agreed to the published version of the manuscript.
Funding
This research was funded by the National Key Research and Development Program of China, grant number 2021YFC2801300; the National Natural Science Foundation of China, grant number 52371350; the Project of Sanya Yazhou Bay Science and Technology City, grant number SKJC-2022-PTDX-012; and the National Key Laboratory Foundation of Autonomous Marine Vehicle Technology, grant number 2024-HYHXQ-WDZC03.
Institutional Review Board Statement
Not applicable.
Informed Consent Statement
Not applicable.
Data Availability Statement
The data presented in this study are available on request from the corresponding author due to privacy or ethical restrictions.
Conflicts of Interest
The authors declare no conflicts of interest.
References
- Bełdowski, J.; Brenner, M.; Lehtonen, K.K. Contaminated by war: A brief history of sea-dumping of munitions. Mar. Environ. Res. 2020, 162, 105189. [Google Scholar] [CrossRef] [PubMed]
- Silarski, M.; Sibczyński, P.; Bezshyyko, O.; Kapłon, Ł.; Kumar, V.; Niedźwiecki, S.; Nowakowski, M.; Moskal, P.; Sharma, S.; Sobczuk, F. Monte Carlo simulations of the underwater detection of illicit war remnants with neutron-based sensors. Eur. Phys. J. Plus 2023, 138, 751. [Google Scholar] [CrossRef]
- Selvaraju, R.R.; Cogswell, M.; Das, A.; Vedantam, R.; Parikh, D.; Batra, D. Grad-cam: Visual explanations from deep networks via gradient-based localization. In Proceedings of the IEEE International Conference on Computer Vision, Venice, Italy, 22–29 October 2017; pp. 618–626. [Google Scholar] [CrossRef]
- Chen, L.; Yang, Y.; Wang, Z.; Zhang, J.; Zhou, S.; Wu, L. Underwater Target Detection Lightweight Algorithm Based on Multi-Scale Feature Fusion. J. Mar. Sci. Eng. 2023, 11, 320. [Google Scholar] [CrossRef]
- Hao, W.; Xiao, N. Research on Underwater Object Detection Based on Improved YOLOv4. In Proceedings of the 2021 8th International Conference on Information, Cybernetics, and Computational Social Systems (ICCSS), Beijing, China, 24–26 September 2021; pp. 166–171. [Google Scholar]
- Zhang, Z.; Zhang, H.; Wang, Y.; Liu, T.; He, Y.; Tian, Y. Underwater Sea Cucumber Target Detection Based on Edge-Enhanced Scaling YOLOv4. J. Beijing Inst. Technol. 2023, 32, 328–340. [Google Scholar]
- Knausgård, K.M.; Wiklund, A.; Sørdalen, T.K.; Halvorsen, K.T.; Kleiven, A.R.; Jiao, L.; Goodwin, M. Temperate fish detection and classification: A deep learning based approach. Appl. Intell. 2022, 52, 6988–7001. [Google Scholar] [CrossRef]
- Arain, B.; McCool, C.; Rigby, P.; Cagara, D.; Dunbabin, M. Improving underwater obstacle detection using semantic image segmentation. In Proceedings of the 2019 International Conference on Robotics and Automation (ICRA), Montreal, QC, Canada, 20–24 May 2019; pp. 9271–9277. [Google Scholar] [CrossRef]
- Ronneberger, O.; Fischer, P.; Brox, T. U-net: Convolutional networks for biomedical image segmentation. In Proceedings of the Medical Image Computing and Computer-Assisted Intervention–MICCAI 2015: 18th International Conference, Munich, Germany, 5–9 October 2015; pp. 234–241. [Google Scholar] [CrossRef]
- Nezla, N.A.; Haridas, T.P.M.; Supriya, M.H. Semantic segmentation of underwater images using unet architecture based deep convolutional encoder decoder model. In Proceedings of the 2021 7th International Conference on Advanced Computing and Communication Systems (ICACCS), Coimbatore, India, 19–20 March 2021; pp. 28–33. [Google Scholar]
- Zhou, T.; Si, J.; Wang, L.; Xu, C.; Yu, X. Automatic detection of underwater small targets using forward-looking sonar images. IEEE Trans. Geosci. Remote Sens. 2022, 60, 4207912. [Google Scholar] [CrossRef]
- Pan, H.; Chen, G.; Jiang, J. Adaptively dense feature pyramid network for object detection. IEEE Access 2019, 7, 81132–81144. [Google Scholar] [CrossRef] [PubMed]
- Lin, T.Y.; Goyal, P.; Girshick, R.; He, K.; Dollár, P. Focal loss for dense object detection. In Proceedings of the IEEE International Conference on Computer Vision, Venice, Italy, 22–29 October 2017; pp. 2980–2988. [Google Scholar] [CrossRef]
- Hu, H.; Bai, S.; Li, A.; Cui, J.; Wang, L. Dense relation distillation with context-aware aggregation for few-shot object detection. In Proceedings of the IEEE/CVF Conference on Computer Vision and Pattern Recognition, Nashville, TN, USA, 20–25 June 2021; pp. 10185–10194. [Google Scholar] [CrossRef]
- Ren, S.; He, K.; Girshick, R.; Sun, J. Faster R-CNN: Towards real-time object detection with region proposal networks. IEEE Trans. Pattern Anal. Mach. Intell. 2016, 39, 1137–1149. [Google Scholar] [CrossRef] [PubMed]
- Sun, B.; Li, B.; Cai, S.; Yuan, Y.; Zhang, C. Fsce: Few-shot object detection via contrastive proposal encoding. In Proceedings of the IEEE/CVF Conference on Computer Vision and Pattern Recognition, Nashville, TN, USA, 20–25 June 2021; pp. 7352–7362. [Google Scholar] [CrossRef]
- Zhang, Y.; Li, K.; Wang, L.; Zhong, B.; Fu, Y. Image super-resolution using very deep residual channel attention networks. In Proceedings of the European Conference on Computer Vision (ECCV), Munich, Germany, 8–14 September 2018; pp. 286–301. [Google Scholar] [CrossRef]
- Wang, Q.; Wu, B.; Zhu, P.; Li, P.; Zuo, W.; Hu, Q. ECA-Net: Efficient channel attention for deep convolutional neural networks. In Proceedings of the IEEE/CVF Conference on Computer Vision and Pattern Recognition, Seattle, WA, USA, 14–19 June 2020; pp. 11534–11542. [Google Scholar]
- Zhao, Q.; Sheng, T.; Wang, Y.; Tang, Z.; Chen, Y.; Cai, L.; Ling, H. M2det: A single-shot object detector based on multi-level feature pyramid network. In Proceedings of the AAAI Conference on Artificial Intelligence, Honolulu, HI, USA, 27 January–1 February 2019; pp. 9259–9266. [Google Scholar]
- Ghiasi, G.; Lin, T.Y.; Le, Q.V. Nas-fpn: Learning scalable feature pyramid architecture for object detection. In Proceedings of the IEEE/CVF Conference on Computer Vision and Pattern Recognition, Long Beach, CA, USA, 16–20 June 2019; pp. 7036–7045. [Google Scholar] [CrossRef]
- Tan, M.; Pang, R.; Le, Q.V. Efficientdet: Scalable and efficient object detection. In Proceedings of the IEEE/CVF Conference on Computer Vision and Pattern Recognition, Seattle, WA, USA, 14–19 June 2020; pp. 10781–10790. [Google Scholar]
- Liu, S.; Qi, L.; Qin, H.; Shi, J.; Jia, J. Path aggregation network for instance segmentation. In Proceedings of the IEEE Conference on Computer Vision and Pattern Recognition, Salt Lake City, UT, USA, 18–23 June 2018; pp. 8759–8768. [Google Scholar] [CrossRef]
- Kim, S.W.; Kook, H.K.; Sun, J.Y.; Kang, M.C.; Ko, S.J. Parallel feature pyramid network for object detection. In Proceedings of the European Conference on Computer Vision (ECCV), Munich, Germany, 8–14 September 2018; pp. 234–250. [Google Scholar] [CrossRef]
- He, K.; Zhang, X.; Ren, S.; Sun, J. Spatial pyramid pooling in deep convolutional networks for visual recognition. IEEE Trans. Pattern Anal. Mach. Intell. 2015, 37, 1904–1916. [Google Scholar] [CrossRef] [PubMed]
- Lin, T.Y.; Dollár, P.; Girshick, R.; He, K.; Hariharan, B.; Belongie, S. Feature pyramid networks for object detection. In Proceedings of the IEEE Conference on Computer Vision and Pattern Recognition, Honolulu, HI, USA, 21–26 July 2017; pp. 2117–2125. [Google Scholar] [CrossRef]
- Fu, C.Y.; Liu, W.; Ranga, A.; Tyagi, A.; Berg, A.C. Dssd: Deconvolutional single shot detector. arXiv 2017, arXiv:1701.06659. [Google Scholar]
- Jeong, J.; Park, H.; Kwak, N. Enhancement of SSD by concatenating feature maps for object detection. arXiv 2017, arXiv:1705.09587. [Google Scholar]
- Li, Z.; Zhou, F. FSSD: Feature fusion single shot multibox detector. arXiv 2017, arXiv:1712.00960. [Google Scholar]
- Liu, W.; Anguelov, D.; Erhan, D.; Szegedy, C.; Reed, S.; Fu, C.Y.; Berg, A.C. Ssd: Single shot multibox detector. In Proceedings of the Computer Vision–ECCV 2016: 14th European Conference, Amsterdam, The Netherlands, 11–14 October 2016; pp. 21–37. [Google Scholar] [CrossRef]
- Xu, S.; Jiang, Y.Q.; Li, Y.; Wang, B.; Xie, T.Q.; Li, S.C.; Qi, H.D.; Li, A.; Cao, J. A stereo visual navigation method for docking autonomous underwater vehicles. J. Field Robot. 2024, 21, 374–395. [Google Scholar] [CrossRef]
- Dosovitskiy, A. An image is worth 16 × 16 words: Transformers for image recognition at scale. arXiv 2020, arXiv:2010.11929. [Google Scholar]
- Gao, J.; Zhang, T.; Xu, C. Graph convolutional tracking. In Proceedings of the IEEE/CVF Conference on Computer Vision and Pattern Recognition, Long Beach, CA, USA, 16–20 June 2019; pp. 4649–4659. [Google Scholar] [CrossRef]
- Woo, S.; Park, J.; Lee, J.Y.; Kweon, I. Cbam: Convolutional block attention module. In Proceedings of the European Conference on Computer Vision (ECCV), Munich, Germany, 8–14 September 2018; pp. 3–19. [Google Scholar] [CrossRef]
- Hou, Q.; Zhou, D.; Feng, J. Coordinate attention for efficient mobile network design. In Proceedings of the IEEE/CVF Conference on Computer Vision and Pattern Recognition, Nashville, TN, USA, 20–25 June 2021; pp. 13713–13722. [Google Scholar] [CrossRef]
- Wang, X.; Girshick, R.; Gupta, A.; He, K. Non-local neural networks. In Proceedings of the IEEE Conference on Computer Vision and Pattern Recognition, Salt Lake City, UT, USA, 18–23 June 2018; pp. 7794–7803. [Google Scholar] [CrossRef]
- Tian, Z.; Shen, C.; Chen, H.; He, T. Fcos: Fully convolutional one-stage object detection. In Proceedings of the IEEE/CVF International Conference on Computer Vision, Seoul, Republic of Korea, 27 October–2 November 2019; pp. 9627–9636. [Google Scholar] [CrossRef]
- Redmon, J.; Farhadi, A. Yolov3: An incremental improvement. arXiv 2018, arXiv:1804.02767. [Google Scholar]
- Zhang, S.; Chi, C.; Yao, Y.; Lei, Z.; Li, S.Z. Bridging the gap between anchor-based and anchor-free detection via adaptive training sample selection. In Proceedings of the IEEE/CVF Conference on Computer Vision and Pattern Recognition, Seattle, WA, USA, 14–19 June 2020; pp. 9759–9768. [Google Scholar]
- Sun, P.; Zhang, R.; Jiang, Y.; Kong, T.; Xu, C.; Zhan, W.; Luo, P. Sparse r-cnn: End-to-end object detection with learnable proposals. In Proceedings of the IEEE/CVF Conference on Computer Vision and Pattern Recognition, Nashville, TN, USA, 20–25 June 2021; pp. 14454–14463. [Google Scholar] [CrossRef]
- Ge, Z.; Liu, S.; Wang, F.; Li, Z.; Sun, J. YOLOX: Exceeding yolo series in 2021. arXiv 2021, arXiv:2107.08430. [Google Scholar]
- Lyu, C.; Zhang, W.; Huang, H.; Zhou, Y.; Wang, Y.; Liu, Y.; Chen, K. RTMDet: An Empirical Study of Designing Real-Time Object Detectors. arXiv 2022, arXiv:2212.07784. [Google Scholar]
- Das, T.; Fishman, L.; Simmons, D.; Urbański, M. Hausdorff dimensions of perturbations of a conformal iterated function system via thermodynamic formalism. Sel. Math. 2023, 29, 19. [Google Scholar] [CrossRef]
Figure 1.
Overall diagram of our developed ARV.
Figure 1.
Overall diagram of our developed ARV.
Figure 2.
The tank experiment of a pipelaying operation. (a) Gantry crane and oil pipeline; (b) ARV and oil pipeline for autonomous seabed-contacting segment detection.
Figure 2.
The tank experiment of a pipelaying operation. (a) Gantry crane and oil pipeline; (b) ARV and oil pipeline for autonomous seabed-contacting segment detection.
Figure 3.
Flowchart of sensor data.
Figure 3.
Flowchart of sensor data.
Figure 4.
Overall structure diagram of the model.
Figure 4.
Overall structure diagram of the model.
Figure 5.
Cascade attention module.
Figure 5.
Cascade attention module.
Figure 6.
Up-focus and down-focus module.
Figure 6.
Up-focus and down-focus module.
Figure 7.
Location semantic enhancement module.
Figure 7.
Location semantic enhancement module.
Figure 8.
Channel semantic enhancement module.
Figure 8.
Channel semantic enhancement module.
Figure 9.
Spatial semantic enhancement module.
Figure 9.
Spatial semantic enhancement module.
Figure 10.
Prefusion module.
Figure 10.
Prefusion module.
Figure 11.
Image samples of underwater pipelines. (a) Image sample captured under clear water conditions; (b) image sample captured under turbid water conditions.
Figure 11.
Image samples of underwater pipelines. (a) Image sample captured under clear water conditions; (b) image sample captured under turbid water conditions.
Figure 12.
Precision performance comparison. (a) mAP curve of RTMDet network; (b) mAP curve of YOLOX network.
Figure 12.
Precision performance comparison. (a) mAP curve of RTMDet network; (b) mAP curve of YOLOX network.
Figure 13.
GRAD-CAM visualization in the RTMDet and YOLOX networks.
Figure 13.
GRAD-CAM visualization in the RTMDet and YOLOX networks.
Figure 14.
Visualization of RTMDet after joining the prefusion module.
Figure 14.
Visualization of RTMDet after joining the prefusion module.
Figure 15.
Segmentation graphs and their mask graphs in different environments.
Figure 15.
Segmentation graphs and their mask graphs in different environments.
Figure 16.
Hausdorff distance diagram under different module combinations.
Figure 16.
Hausdorff distance diagram under different module combinations.
Figure 17.
Results of image sequence detection in different environments.
Figure 17.
Results of image sequence detection in different environments.
Table 1.
Parameters of the ARV equipment.
Table 1.
Parameters of the ARV equipment.
| Equipment | Parameters |
|---|
| ARV | L × W × H: 2200 × 600 × 350 (mm) |
| Weight: 450 kg |
| Speed: 2~8 kn |
HD Zoom
Sea-Camera | Working Depth: 0~6000 m |
Focal Length: 4.4 mm~88.4 mm
Resolution: 4 K
Focus Speed: 0.1 s |
MD750D
Multibeam
Imaging Sonar | Dual Frequency: 750 kHz and 1.2 MHz |
| Working Depth: 4000 m |
| Horizontal Field of View: 130° (low frequency), or 50° (high frequency) |
Transducer Frequency: 1 MHz
Beam Angle: 22.5° |
| DVL | Data Rate: 4–15 Hz
Speed Resolution: 0.1 mm/s |
| Others | Depth Gauge, Altimeter, INS, USBL, Fiber Optic, WIFI |
Table 2.
Performance of the different network models on the underwater oil pipeline seabed-contacting segment detection dataset. NO Attention means no attention mechanism added.
Table 2.
Performance of the different network models on the underwater oil pipeline seabed-contacting segment detection dataset. NO Attention means no attention mechanism added.
| Module | Backbone | NO Attention | Cascade Attention | mAP↗ |
|---|
| RetinaNet [13] | ResNet18 | 56.4 | 57.6 | +1.2 |
| FCOS [36] | ResNet18 | 56.9 | 59.7 | +2.8 |
| SSD [29] | MobileNetv2 | 55.7 | 58.4 | +2.7 |
| Yolov3 [37] | DarkNet53 | 56.8 | 59 | +2.2 |
| ATSS [38] | R50 | 57.2 | 60.4 | +3.2 |
| Sparse R-CNN [39] | R50 | 57.6 | 61.1 | +3.5 |
| YOLOX [40] | CSPDarkNet | 58 | 63.4 | +5.4 |
| RTMDet_s [41] | CSPNeXt | 61 | 66.5 | +5.5 |
Table 3.
RTMDet-based ablation experiment for underwater seabed-contacting segment detection. F1, ORI, and F2 denote the attentional processing methods in the three branches of the module.
Table 3.
RTMDet-based ablation experiment for underwater seabed-contacting segment detection. F1, ORI, and F2 denote the attentional processing methods in the three branches of the module.
| Module | BackBone | F1 | ORI | F2 | mAP |
|---|
| RTMDet_s | CSPNeXt | | | | 61 |
| RTMDet_s | CSPNeXt | | | ✓ | 62.3 |
| RTMDet_s | CSPNeXt | | ✓ | | 63.5 |
| RTMDet_s | CSPNeXt | ✓ | | | 62.8 |
| RTMDet_s | CSPNeXt | ✓ | ✓ | | 65.1 |
| RTMDet_s | CSPNeXt | | ✓ | ✓ | 64.7 |
| RTMDet_s | CSPNeXt | ✓ | | ✓ | 64.3 |
| RTMDet_s | CSPNeXt | ✓ | ✓ | ✓ | 66.5 |
Table 4.
Performance of RTMDet_s baseline network under different modules.
Table 4.
Performance of RTMDet_s baseline network under different modules.
| Module | Cascade Attention | Prefusion Module | GFLOPs | Parameters | FPS | mAP | mIOU |
|---|
| RTMDet_s | | | 21.522 | 10.153 M | 36.4 | 61 | 70.9 |
| RTMDet_s | ✓ | | 21.760 | 11.793 M | 36.1 | 66.5 | 72.5 |
| RTMDet_s | | ✓ | 22.325 | 10.153 M | 35.6 | 64.1 | 73.6 |
| RTMDet_s | ✓ | ✓ | 22.562 | 11.793 M | 35.2 | 67.3 | 74.7 |
| Disclaimer/Publisher’s Note: The statements, opinions and data contained in all publications are solely those of the individual author(s) and contributor(s) and not of MDPI and/or the editor(s). MDPI and/or the editor(s) disclaim responsibility for any injury to people or property resulting from any ideas, methods, instructions or products referred to in the content. |
© 2024 by the authors. Licensee MDPI, Basel, Switzerland. This article is an open access article distributed under the terms and conditions of the Creative Commons Attribution (CC BY) license (https://creativecommons.org/licenses/by/4.0/).


