Article

A Novel Configuration of Hybrid Reverse Osmosis, Humidification–Dehumidification, and Solar Photovoltaic Systems: Modeling and Exergy Analysis

by
Ahmed E. Tourab
1,2,
Ana María Blanco-Marigorta
3,*,
Aly M. Elharidi
1 and
María José Suárez-López
2
1
Arab Academy for Science and Technology and Maritime Transport, Mechanical Engineering Department, Alexandria 21611, Egypt
2
EDZE (Departamento de Energía), Universidad de Oviedo, Campus de Viesques, 33204 Gijon, Asturias, Spain
3
Departamento de Ingeniería de Procesos, Universidad de Las Palmas de Gran Canaria, Edificio de Ingenierías-Tafira Baja, 35017 Las Palmas de Gran Canaria, Spain
*
Author to whom correspondence should be addressed.
J. Mar. Sci. Eng. 2024, 12(1), 19; https://doi.org/10.3390/jmse12010019
Submission received: 10 November 2023 / Revised: 5 December 2023 / Accepted: 7 December 2023 / Published: 20 December 2023
(This article belongs to the Special Issue The Use of Hybrid Renewable Energy Systems for Water Desalination)

Abstract

:
The pressing demand for clean water worldwide has increased attention to developing innovative desalination processes. In this work, the second law of thermodynamics is used to examine and assess two coupled desalination systems: a separation-based reverse osmosis (RO) system and a thermal desalination-based humidification–dehumidification (HDH) system. The HDH unit configuration used here is based on the working principle of the heat pump, where the process is open-air, open-water, and air-heated. The RO system is equipped with a pressure exchanger (PX) and has been examined under various operating circumstances, such as different feed water pressures, salinities, and flow rates. To improve the system’s sustainability, a solar photovoltaic system (PV) was integrated. An exergy model was used to precisely evaluate the system components and the hybrid systems by employing a proper exergy efficiency definition. The evaluation of the second law of thermodynamics for the RO–HDH–PX and RO–HDH–PX–PV systems indicated maximum efficiencies of 23% and 23.25%, respectively. A cost analysis was also performed on the hybrid RO–HDH–PX–PV desalination system using two approaches: the first included a battery storage system, whereas, in the second, the battery was not considered. When a battery storage system is included, the cost per cubic meter varies from USD 3.22 to USD 5.10. In contrast, it varies from USD 3.96 to USD 7.12 without a battery storage system.

1. Introduction

Water is one of the fundamental necessities required for life. Water scarcity and the growing demand for water are among the most pressing problems facing development, industry, and urbanization [1,2,3]. Around 1.2 billion people around the globe are affected by extreme water scarcity [4]. Much of the world’s water cannot be utilized directly for freshwater consumption, even in the small amounts in which it is primarily used as potable water [5,6]. Therefore, water desalinization may be the solution. One of the significant issues affecting current methods for generating freshwater is the high level of investment required for water treatment.
On the other hand, most traditional desalination systems rely on fossil fuels to power their operations. There is a necessity to develop more sustainable methods due to the environmental effect of these energy sources and their inherent unsustainability. In terms of performance and commercial viability, conventional systems remain superior to sustainable desalination alternatives. However, there is a significant potential that renewable energy-based desalination systems will surpass conventional plants over time [7]. High energy consumption is a major barrier to expanding the scale of the desalination systems used in industrial and commercial applications. This revelation gave rise to the integration of renewable energy sources with desalination techniques.
Thermal and membrane desalination technologies account for the vast majority of what is now available. The former technologies suffer from high costs, corrosion, and complicated installation procedures (e.g., multi-stage flash (MSF)). The latter are affected by membrane fouling, which necessitates the pre- and post-treatment of the water before it can be delivered to the desalination modules. There are various other less-well-known desalination methods, such as pervaporation, forward osmosis, and membrane distillation, each with benefits and drawbacks.
Many pilot desalination plants that use renewable energy sources have been established, and most have been running efficiently for years. Most of them use solar or geothermal energy to produce potable water, and they are each suited to their specific location [8]. Renewable-energy-powered desalination systems are not yet cost-competitive with conventional desalination systems. However, they are suitable in certain locations, and they are expected to become more widely viable soon. El-Ghonemy [9] examined renewable-energy-powered water desalination systems, focusing on recent developments in this field from both a technological and a financial perspective.
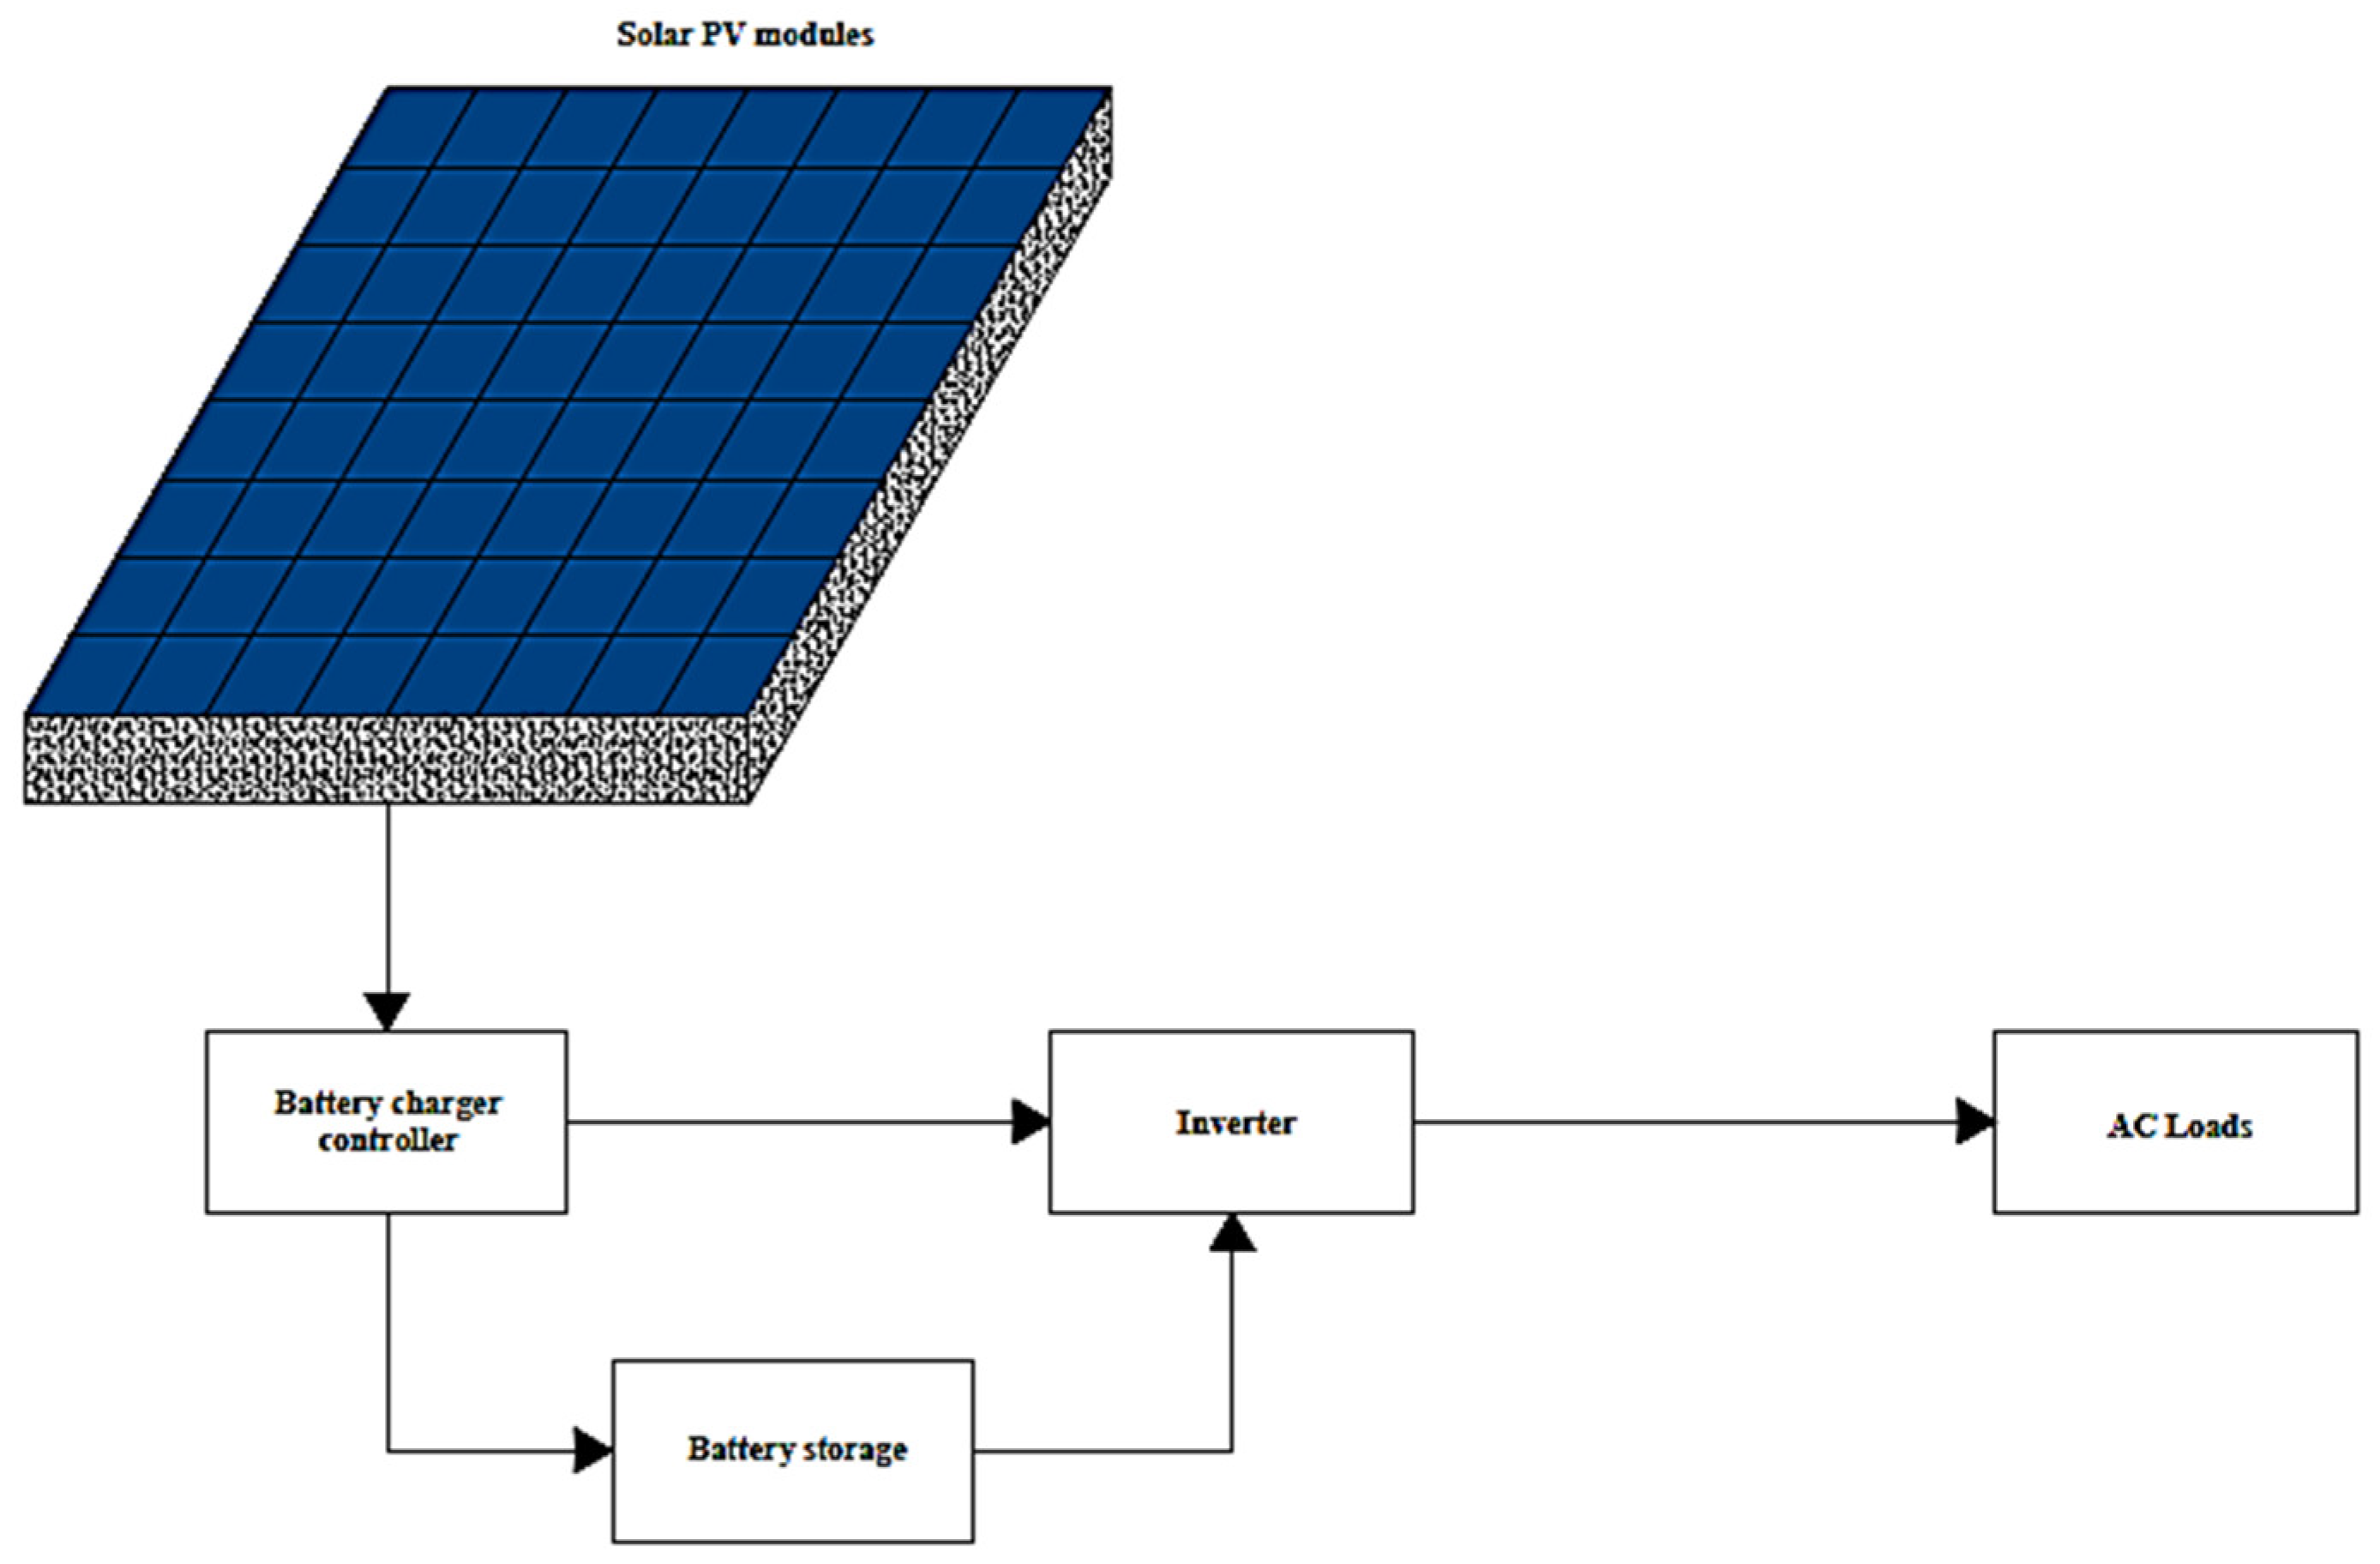
Different desalination technologies—mostly reverse osmosis (RO) and humidification–dehumidification (HDH) systems—have been integrated with solar photovoltaic (PV) systems to increase their sustainability. Shalaby [10] discussed RO desalination systems powered by solar energy and reported that photovoltaic (PV) energy is the renewable energy source most commonly utilized to power RO systems because it is more cost-effective than using solar organic Rankine cycles (ORCs). Herold and Neskakis [11] experimented with a PV–RO battery-based system that could produce 0.3 to 0.8 m3/day. With a feed pressure of 63 bar, the SEC was 15 kWh/m3. Additionally, an investigation by Mohamed et al. [12] examined the financial viability of a PV–RO system in two scenarios: with and without batteries. Even though the SEC dropped when the system with batteries was examined, the price rose from EUR 7.5 to EUR 8.3 per cubic meter owing to the high level of investment and expense required for replacement. Kettani and Bandelier [13] presented a techno-economic analysis of a PV-RO desalination system on a major scale. For a plant with a capacity of 275,000 m3/day, they estimated a freshwater cost of around USD 1 per cubic meter.
Conversely, a few research studies involving HDH systems with integrated solar PV systems were conducted. Wang et al. [14] demonstrated that a PV-powered HDD in which the power is supplied directly and indirectly by solar radiation is an economically feasible choice for desalination in remote areas. In addition, they discovered that forced convection improved the performance of this setup under the same operational conditions. Wang et al. [15] studied the effects of several variables on the rates of evaporation and condensation. The highest freshwater output was around 0.873 L/m2/d with forced convection and an evaporator temperature of 64.3 °C; this was higher than the 0.789 kg/m2/d obtained using a free convection process. From this study, it can be concluded that the integration of solar PV systems is more appropriate for small-scale HDH systems and is favorable for remote areas away from electric power supplies. Using thermal energy recovery (TES) technology, Giwa et al. [16] studied the various environmental circumstances that affected a PV–HDH system’s productivity. Using an HDH desalination unit that was combined with PV/T modules, Gabrielli et al. [17] investigated the effect of the design and the working environment on the performance of the system. In a theoretical study, Rafiei et al. [18] investigated how the operating circumstances affected the amount of freshwater produced by an HDH desalination system that used a solar dish concentrator and a PV/T system. Mahmoud et al. [19] hypothetically evaluated the performance of a hybrid solar distiller/HDH desalination system with incorporated PV panels and solar concentrators.
Many researchers have conducted such hybridization techniques. Narayan et al. [20] presented a hybrid HDH and reverse osmosis system to minimize energy consumption. Compared to conventional HDH systems, the GOR for this hybrid system was significantly increased to reach 20. Similarly, Kabeel and El-Said [21] examined a system that combined air heated HDH with a flash desalination system in a single stage. Solar collectors were used to heat both air and water at a laboratory scale [22]. In a separate study performed by the same authors [23], the system’s economic viability was examined. The hybrid system was more productive and cost-effective than the independent units. Also, from a financial perspective, Eslamimanesh et al. [
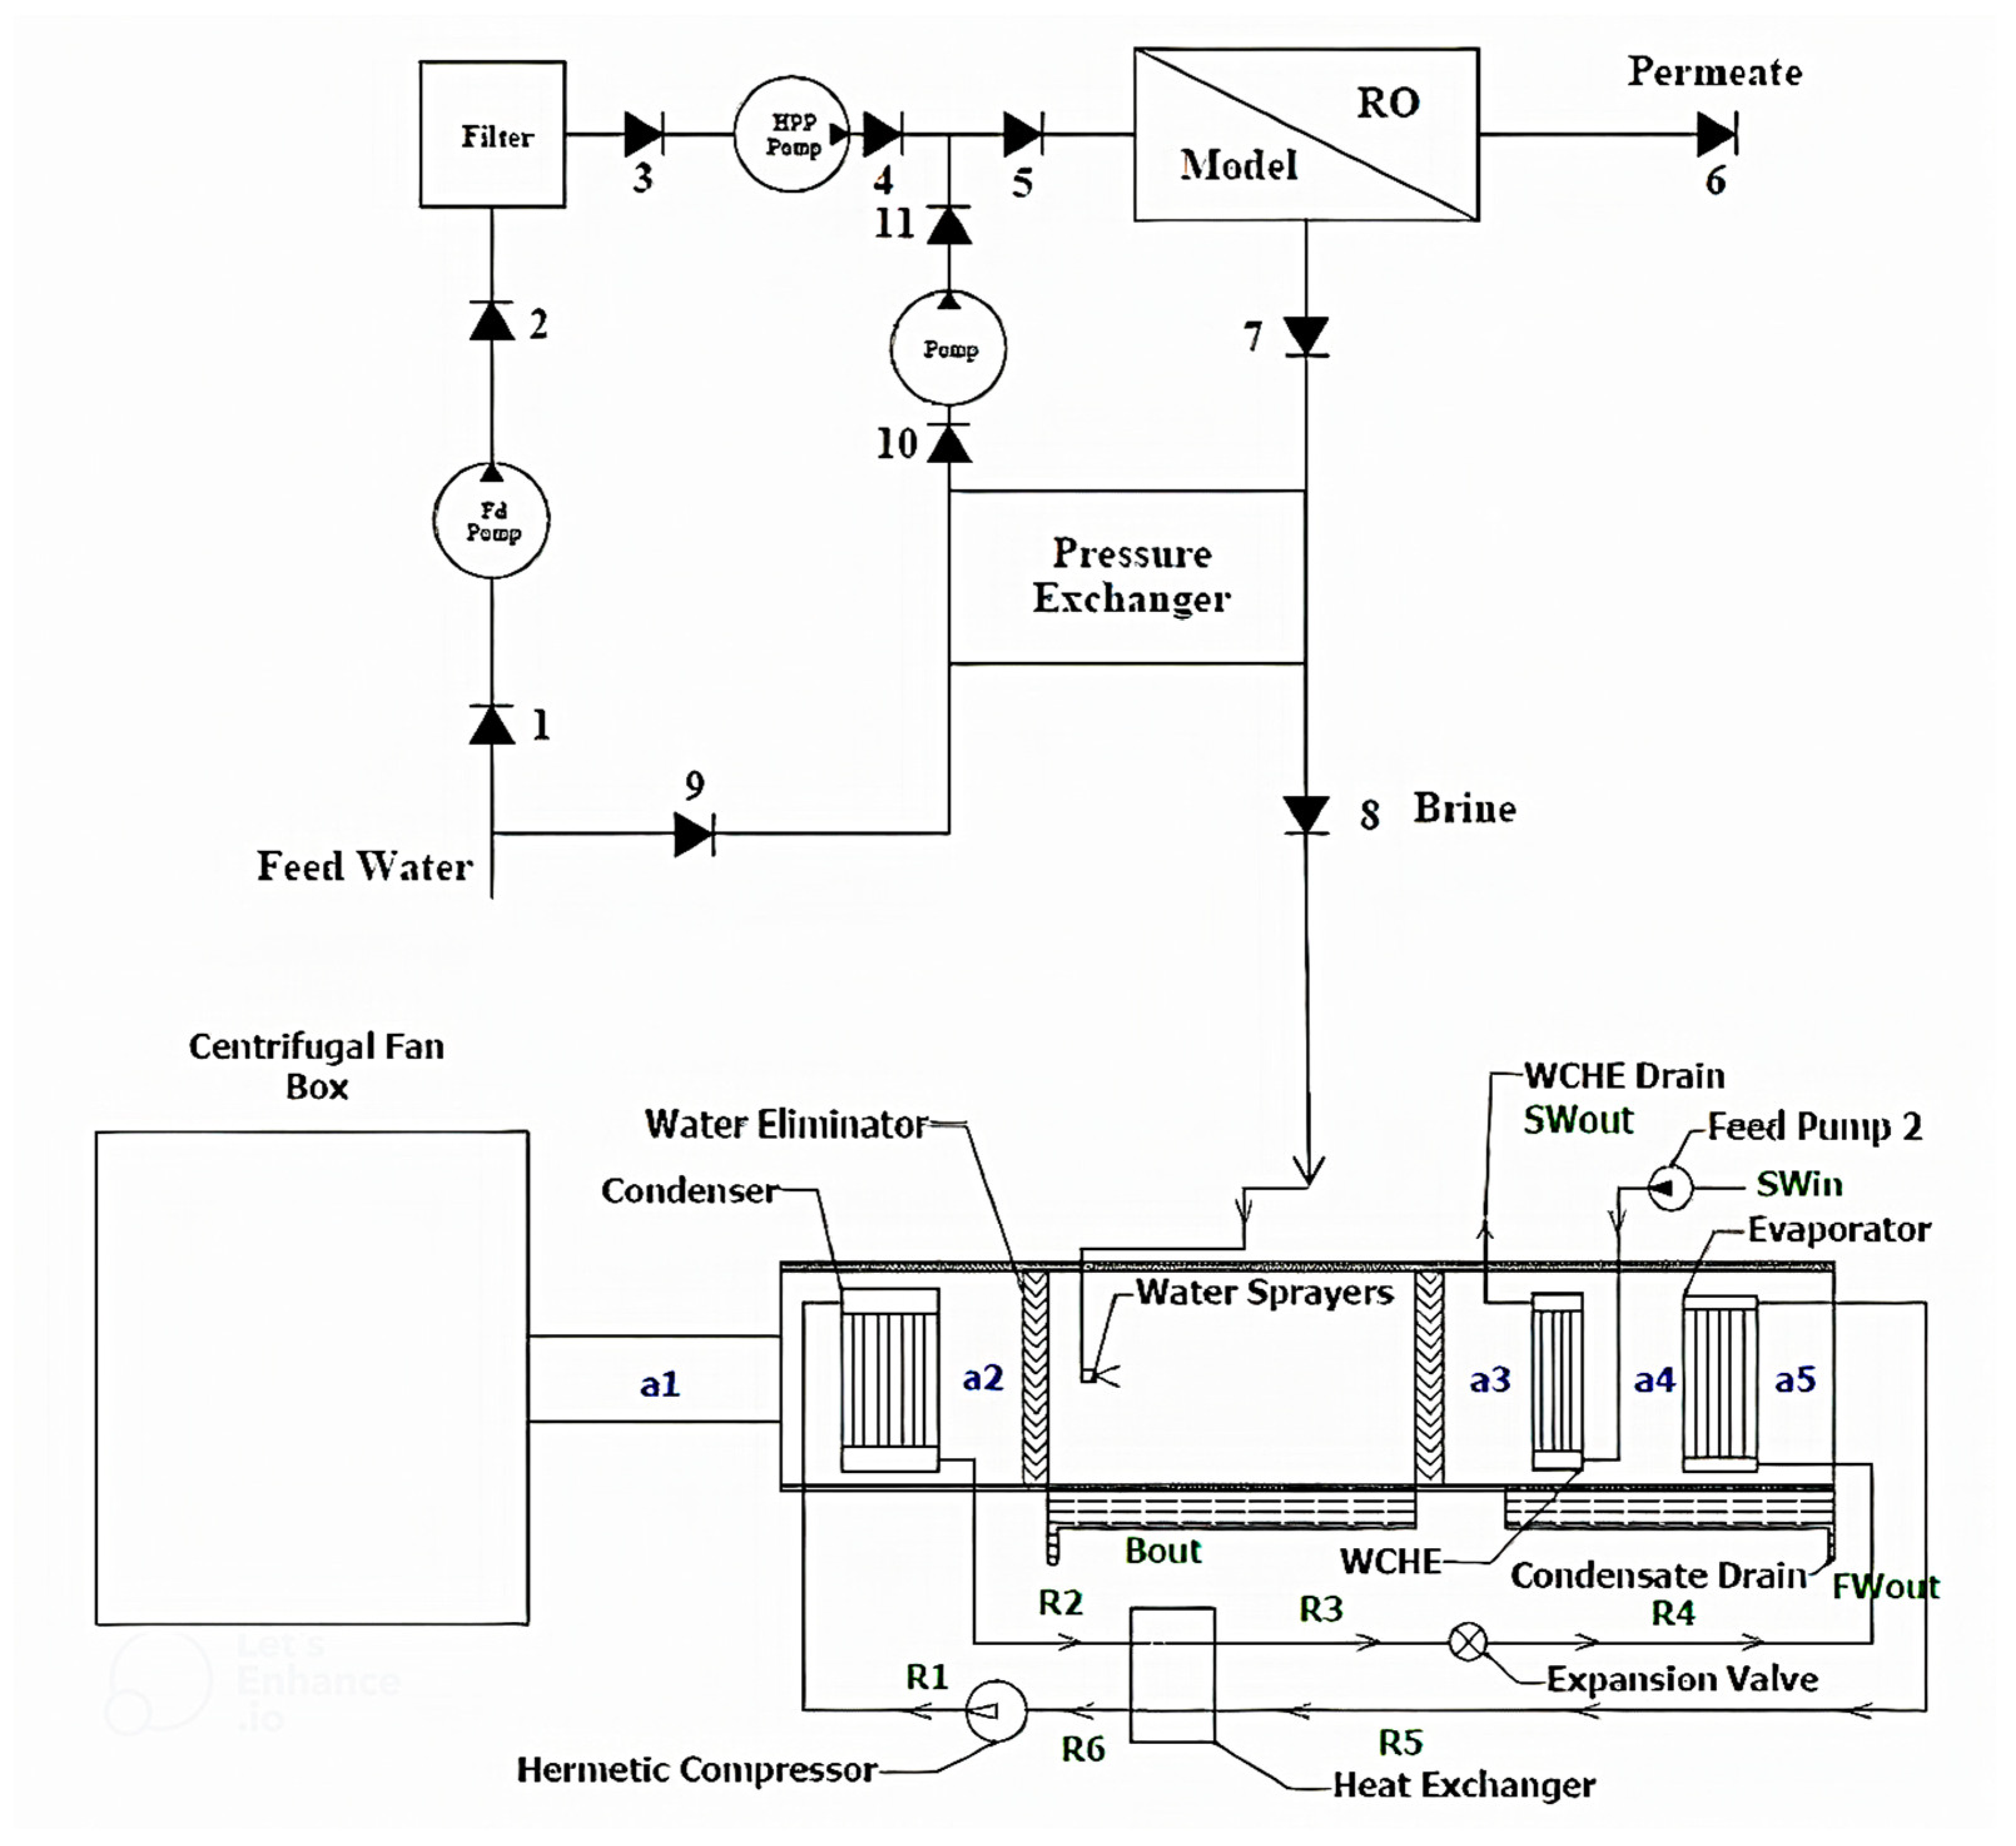
24] compared a pilot HDH system to an RO system. They recommended integrating an HDH system with an RO for the highest potential. A PV-powered HDH–RO system including thermal recovery (PV cooling) units, solar collectors (air and water), and a pressure exchanger was simulated by Abdelgaied et al. [25]. The collectors were employed to improve the HDH system’s efficiency, while the PV cooling units served a dual purpose: they both preheated the HDH system’s water and increased the PV system’s power output. With SEC values between 1.22 and 1.24 kWh/m3, the suggested system achieved a maximum hourly production of 192–200 L.
On the other hand, other researchers have investigated the hybridization of the HDH with the RO system using the second law of thermodynamics. The second law of thermodynamics, widely referred to as exergy, attempted to enhance the quality of the energy released through its exergy in a dead state or, in particular, with regard to the ambient environment. Al-Sulaiman et al. [26] examined a hybrid HDH–RO system theoretically, where they modeled the whole system thermodynamically and calculated exergy for all components, ignoring concentration change in HDH. They treated water as a real solution and analyzed its characteristics using Sharqawy et al. [27]. The entire unit exergy efficiency was stated to be 10–11.9%. Likewise, Jamil et al. [28] compared two HDH desalination systems, one using the OAOW process and the other using an OACW process. The combination of an RO and HDH unit was also investigated. According to the study, the HDH–RO with PX has the highest exergy efficiency at 3%. Furthermore, Ameri and Eshaghi [29] introduced a water desalination system combining RO with an HDH system, in which chemical exergy was considered. The stand-alone RO, HDH, and RO–HDH had exergy efficiencies of 0.064–0.724%, 7.95–12.66%, and 15.90–20.60%, respectively.
Many HDH and RO exergy studies have been found in the literature, but few examine the chemical exergy of flows or salt propagation into freshwater produced by HDH systems. In addition, few studies have examined the usage of solar PV systems with such hybrid RO–HDH and the effect of the PV integration on the hybrid system from an exergy analysis perspective. Consequently, this study aimed to propose a hybrid desalination system integrating two methods of desalination, RO and HDH. The novelty can be considered in the integration of the RO system with the HDH, which is driven by a heat pump. Moreover, the hybrid system is powered by a solar PV system, which is adequate for such a small-scale desalination system, as indicated by the Wang et al. [14] study. Using a pressure exchanger as an ERD, the RO system’s energy consumption was improved. Energy and exergy assessments are examined for the RO–HDH–PX–PV system. In addition, an advanced exergy model is used to evaluate system components through an appropriate exergy efficiency definition.

2. Description of Systems and Models

The water desalination system combines two different technologies (reverse osmosis and humidification–dehumidification processes) powered by a solar PV system. The reverse osmosis system includes a configuration using ERD (pressure exchanger), as shown in Figure 1. The feed water first enters the reverse osmosis system, which is equipped with a pressure exchanger to harness the energy of the brine flowing out of the reverse osmosis module. The brine flow collected from the reverse osmosis system is also used as a direct source to feed the humidification section of the HDH unit.
The main operating parameters of the hybrid RO–HDH desalination system are summarized in Table 1.

2.1. Reverse Osmosis Desalination System

The RO system consists of a feed pump, feed water filters, a high-pressure pump, RO modules, a pressure exchanger, and a booster pump. The RO module consists of four pressure vessels, each fitted with six elements of SW30-4040 membranes (DuPont, Wilmington, DE, USA). The characteristics of this type of membrane are presented in Table 2.
Variations in applied pressure, feedwater mass flow rate, and total dissolved salts affect system performance benchmarks, as will be discussed in the results and discussion section. The ranges used in this work are the following: the feedwater flow rate varied from 383 to 602 kg/h, while the feed pressure varied from 5 to 6.5 MPa. Two salinity concentrations will be considered for the feedwater: 35,000 ppm and 45,000 ppm. The brine from the RO system will feed the HDH system.
The thermodynamic properties of the material streams at the RO–PX desalination system for a feedwater flow rate of 602 kg/h are presented in Table 3.
The permeate water flux is defined as follows [30]:
J w = A A × T C F × F F P f P p P f 2 π b w π p × 10 6
As AA is the water permeability coefficient, TCF is the temperature correction factor, which can be estimated using Equations (2) or (3) [31]. The FF is the fouling factor; it was assumed to be 0.85, while π is the osmatic pressure.
For T < 25 °C:
T C F = e x p 2640 1 298 1 T f + 273
For T > 25 °C:
T C F = e x p 3020 1 298 1 T f + 273
The salt flux estimated is:
J s = B ( C b w C p )
The osmotic pressure is a mutually exclusive feature. Within this respect, the osmotic pressure is simply determined by the concentration of ions in the solution [32]. As a result of Vant’s Hoff equation:
π = i R T C
The number of ions released by a salt solution in a solvent is represented by Vant’s Hoff coefficient i in Equation (5).
Using Formula (6), we may determine the permeate solution’s mean velocity.
V p = J w J s ρ p
The film-theory method may be used to estimate the concentration polarization on the feed sidewall of the membrane [33]:
C m C p C b w C p = e x p J w K m
where K M is defined as the mass transfer coefficient of the solute, as determined by Equation (8) [34]:
K M = 1.62 × R e 0.33 × S c 0.33 × d h L 0.33
where Re denotes the Reynolds number and Sc denotes the Schmidt number, specified as follows:
R e = V × ρ × d h m u
S c = m u ρ × D s
The hydraulic diameter of rectangular ducts is equivalent to two times the duct’s height. Using a spacer, the hydraulic diameter of that duct may be obtained as follows [32]:
d h = 4 α 2 H + ( 1 α S m )
where α and Sm denote the spacer porosity and the spacer’s specific surface area, respectively, and H denotes the duct height.
For seawater, the following is the solute permeability coefficient [35]:
D s = 6.2725 × 10 6 × e x p 0.1546 × 10 3 × C f 2513 273.15 + T
The pressure drop across a rectangular duct is expressed as [30]:
P f = 0.0033 × Q avg × l × m u W × F S 3
As a result of the mass conservation law:
Q f = Q b w + Q p
Q f × C f = Q b w × C b w + Q p × C p
The efficiency of the pressure exchanger can be described as follows:
η p x = Q b w , o u t × P b w , o u t + Q f , o u t × P f , o u t Q b w , i n × P b w , i n + Q f , i n × P f , i n
The SW30-4040 membrane was employed to optimize the performance of the proposed RO system according to the characteristics of the element membrane shown in Table 4. The model developed to simulate the RO system was validated by Lu et al. [36]. However, this study utilized the SW30XLE-400i membrane (DuPont, Wilmington, DE, USA), whose characteristics are shown in Table 4. The validation was focused on the permeate concentration, indicating the feasibility of the developed model and allowing the use of the proposed model. Table 5 presents the validation of the reverse osmosis system.

2.2. Humidification–Dehumidification Desalination System

The humidification–dehumidification (HDH) system process is based on the working principle of a heat pump. The system used here is described by Tourab et al. [37] as open-air, open-water air-heated (OAOW-AH). The HDH desalination system consists of a heat pump condenser, evaporator, humidifier, and dehumidifier. In the humidification process, a parallel spraying system is used. The humidifier receives two streams where heat and mass are transferred; one is the hot air from a heat pump condenser and the other is salted water from the RO desalination system. Due to the heating process for air, the specific humidity decreases, thus improving the humidification process. The dehumidifier has two sections: the first includes a water-cooled heat exchanger and the second contains a heat pump evaporator. Therefore, moist air is dehumidified, and freshwater is collected.
The feedwater mass flow rate to the humidification process varied from 219 to 345 kg/h. In contrast, the air mass flow rate varied from 936 kg/h to 1440 kg/h. Table 6 and Table 7 show some thermodynamic properties at different locations for the HDH unit and the heat pump. Where the calculations are based on a flow of air of 936 kg/h and a flow of water of 219 kg/h.
The mathematical modeling for the heat pump condenser, humidifier, dehumidifier, and reverse osmosis systems is solved using MATLAB 2015b. The following assumptions are considered:
  • Fluid properties are constant: cp,a, cp,w, cp,v, cp,R, and hfg, which are the specific heat at a constant pressure of air, water, vapor, and refrigerant, in addition to the latent heat of vaporization, respectively.
  • Ambient temperature (Tamb): 25 °C.
  • The pressure drop in the RO filter is 14 kPa.
  • Isentropic efficiency of the pressure exchanger: 96%.
  • Isentropic efficiency of all the pumps: 75%.
The model for the humidification–dehumidification system was already validated in previous works [3,37]. Some results are shown in Table 8. Table 9 summarizes the HDH’s geometry as well as its characteristics.

2.3. Solar Energy Integration

The integration of a solar photovoltaic (PV) system enhances the sustainability of the hybrid desalination system and mitigates the ecological footprint attributed to the consumption of fossil-fuel-based energy sources.
According to the previous review, solar PV is the best and cheapest renewable source to power the RO system. So, in this section, an investigation of integrating a solar PV system with the RO–HDH–PX hybrid system will be introduced. Figure 2 shows the components of the solar PV system used for this purpose: solar PV modules, battery charger controller, battery storage system, and inverter.
Two approaches have been considered. The first approach employed batteries in the PV system to guarantee the energy supply throughout the day. The second approach was considered without using the battery. The location of Alexandria, Egypt, was chosen for the design of the PV system. The average annual amount of sunshine is about ten hours per day. [38]. The monthly solar direct normal irradiation over the year, DNI, has been obtained from the Global Solar Atlas [38]. The average daily solar energy input over the year, Gavg, was calculated from the DNI as 5.337 kWh/day/m2.
The total energy consumption of the RO–HDH–PX hybrid system for the daily load operation and considering the first and second approaches (with and without battery usage) is shown in Table 10. The values represent the maximum energy consumption at different seawater feed flow rate operating conditions.

2.3.1. Sizing of the PV System Panels

Here, a basic sizing to study the effect of the integration of the solar photovoltaic system with the RO–HDH–PX system is included.
The operating parameters of the PV module, Sunergy Solar SSM420-108, were obtained from the manufacturer data sheet as listed in Table 11.
The size of the PV array can be calculated by:
P V a r e a = E L G a v · η p v · η B · η I n v · T C F
where EL is the average daily energy yield, as given in Table 10, Gavg is the average solar energy input per day, and TCF is the temperature correction factor assumed to equal 0.8. η p v is the PV module efficiency, while η B and η I n v are the battery efficiency of 90% and inverter efficiency of 93%, respectively.
The peak solar insolation, PSI, is assumed to be 1000 W/m2; thus, the PV peak power is given as follows:
P V   P e a k   P o w e r = P V a r e a · P S I · η p v
Thus, after calculating the PV peak power, the number of solar PV modules could be estimated.

2.3.2. Battery Storage Capacity

The battery storage capacity can be calculated using Equation (19) [39], assuming that the DC bus voltage is 24 V.
S t o r a g e   C a p a c i t y = N c · E L D O D · η o u t
NC is the number of successive cloudy days at the location [38], which is seven days based on the chosen location, and DOD is the maximum depth of drain of the battery, which is 80%. Consequently, the ampere-hour could be obtained by dividing the storage capacity by the DC bus voltage. According to the battery ampere-hour, the total number of the battery could be estimated.

2.3.3. Battery Charge Controller

A battery charge controller is essential for the secure charging of batteries and the extension of their life span. It needs to handle the PV array’s short circuit current. The battery charger selection is based on the number of module strings and the short circuit current Isc.

2.3.4. Inverter

The inverter installed needs to be able to withstand the maximum possible AC load. It might be chosen to be 20% over the estimated rated power of the AC loads.

2.3.5. Results of the Design

The results of the design are summarized in Table 12. The effect of different operating conditions has been considered.

3. Exergy Analysis

The exergy of a material stream consists mainly of a thermo-mechanical (physical) exergy part and a chemical exergy part. The thermo-mechanical part is defined as the maximum work produced when the temperature and pressure of the system are varied to the temperature and pressure of the surrounding environment (T0, P0) while maintaining the same concentration of all system elements. Therefore, a thermo-mechanical equilibrium with the environment is achieved. Chemical exergy is the amount of work that can be conducted when the concentration of each substance in the system varies to the concentration in the environment at the same pressure and temperature as the environment (T0, P0). As a result, a state of chemical equilibrium arises. The mathematical description of the flow exergy may be stated as considering the physical and chemical exergy as follows [40,41]:
e f = h h 0 T 0 s s 0 + i = 1 n w i μ i , 0 μ i , 0
where the properties denoted by “0” are determined at the dead state temperature and pressure (T0, P0) but the initiation composition or concentration of the flow stream. μ i , 0 is the chemical potential of “i” at T0 and P0 when the composition is that of the state under consideration and μ i , 0 * represents the chemical potential of “i” when, at T0 and P0, the system reaches chemical equilibrium with the environment. w i is the mass fraction of component “i”.
Exergy is not a conservative quantity in any existing system since exergy destruction (due to irreversibilities) occurs in every real system. It is necessary to determine the flow exergy at each state in the desalination plant before studying the system. The system is examined under steady-state conditions while disregarding the kinetic and potential energy of the fluid streams. So, the exergy balance is represented as follows:
E x e r g y i n E x e r g y o u t = E x e r g y   d e s t r o y e d
It is critical to clarify that the amount of energy consumed by any system or component should be positive. A negative exergy destroyed value indicates a negative entropy generation, which violates the second law of thermodynamics.
In calculating the specific exergy, the specific enthalpy, specific entropy, and chemical potential have been estimated using the correlations presented by Sharqawy et al. [42].
On the other hand, the specific exergy of the moist air can be determined using Equation (22) presented by Wepfer et al. [43]. Therefore, it may be defined as follows:
e m a = c p a ω c p v · T 0 · T T 0 1 l n T T 0 + 1 + 1.608 · ω · R a · T 0 · l n P P 0 + R a · T 0 [ 1 + 1.608 ω · l n 1 + 1.608 · ω 0 1 + 1.608 · ω + 1.608 · ω · l n ω ω 0 ]
In this equation, the physical exergy is referred to by the first two terms and the chemical exergy by the last term. The following parameter values were employed in this investigation: c p a = 1.003 kJ/kg.K, c p v = 1.872 kJ/kg.K, and R a = 0.287 kJ/kg.K.
In this work, the values of the properties of the environment are as follows: T0 = 25 °C, P0 = 101.325 kPa, ω 0 = 0.0099 kg vapor/kg dry air, and the concentration of salted feed water: TDS0 = 35,000 ppm.
It is possible to define the exergy balance in terms of output exergetic effect and the required input or driven exergy expenditure, known as product and fuel exergy, respectively.
E ˙ P = E ˙ F E ˙ D E ˙ L
Finally, the exergy efficiency may be represented as follows:
ε = E ˙ P E ˙ F = 1 E ˙ D + E ˙ L E ˙ i n

3.1. Exergy Balance of the Desalination Systems

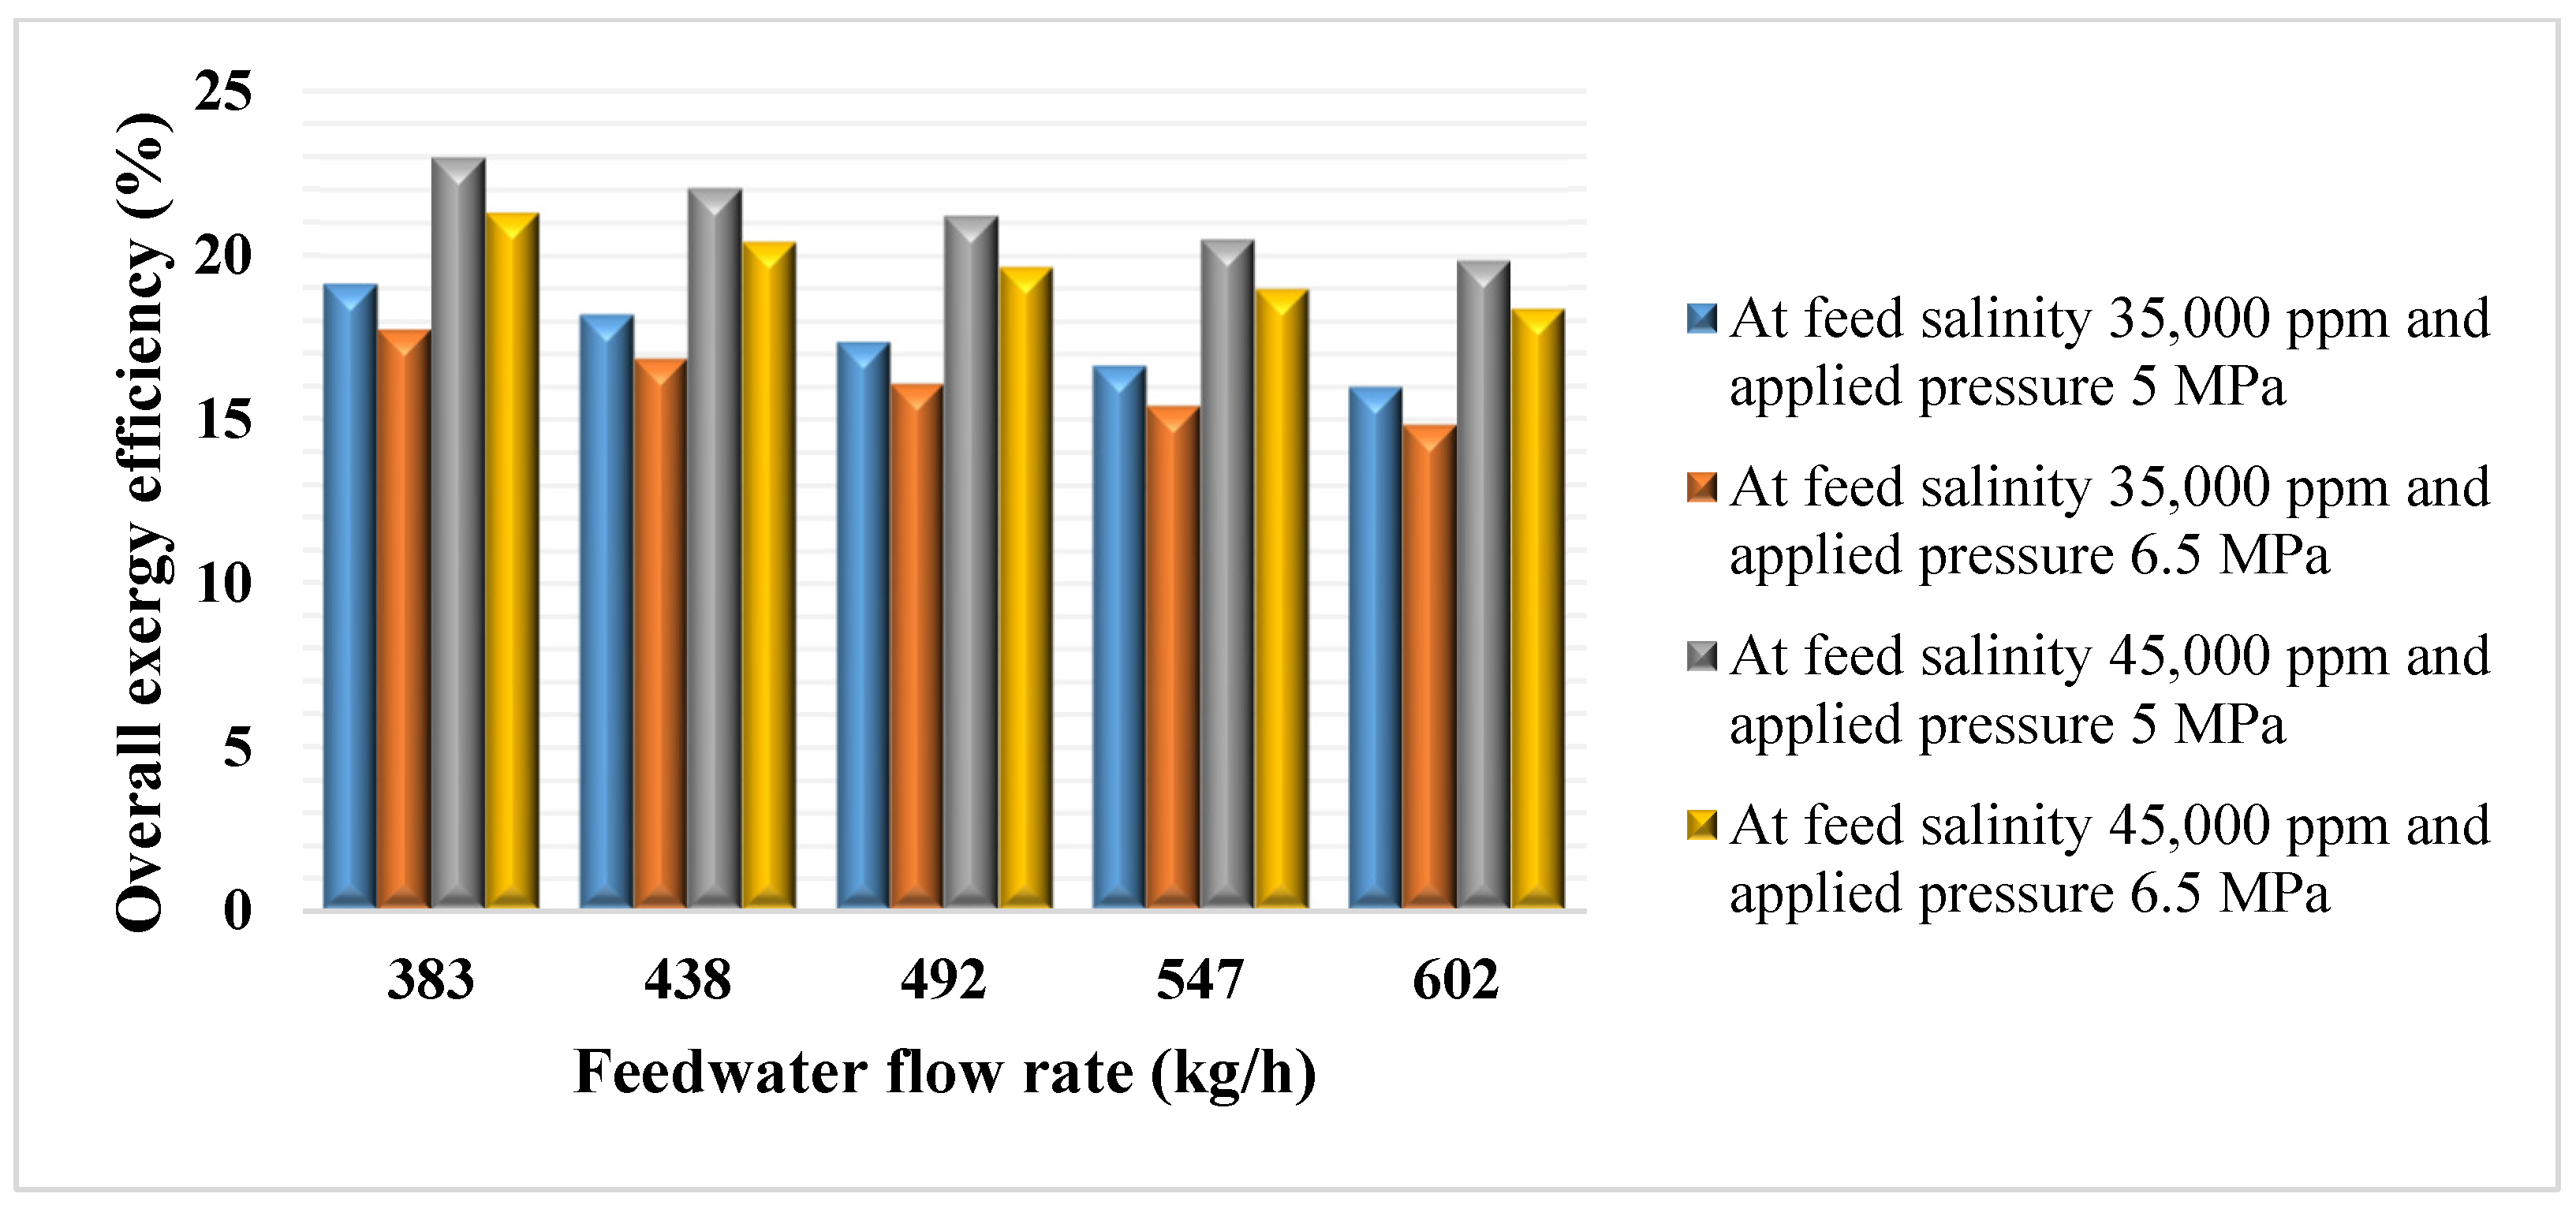
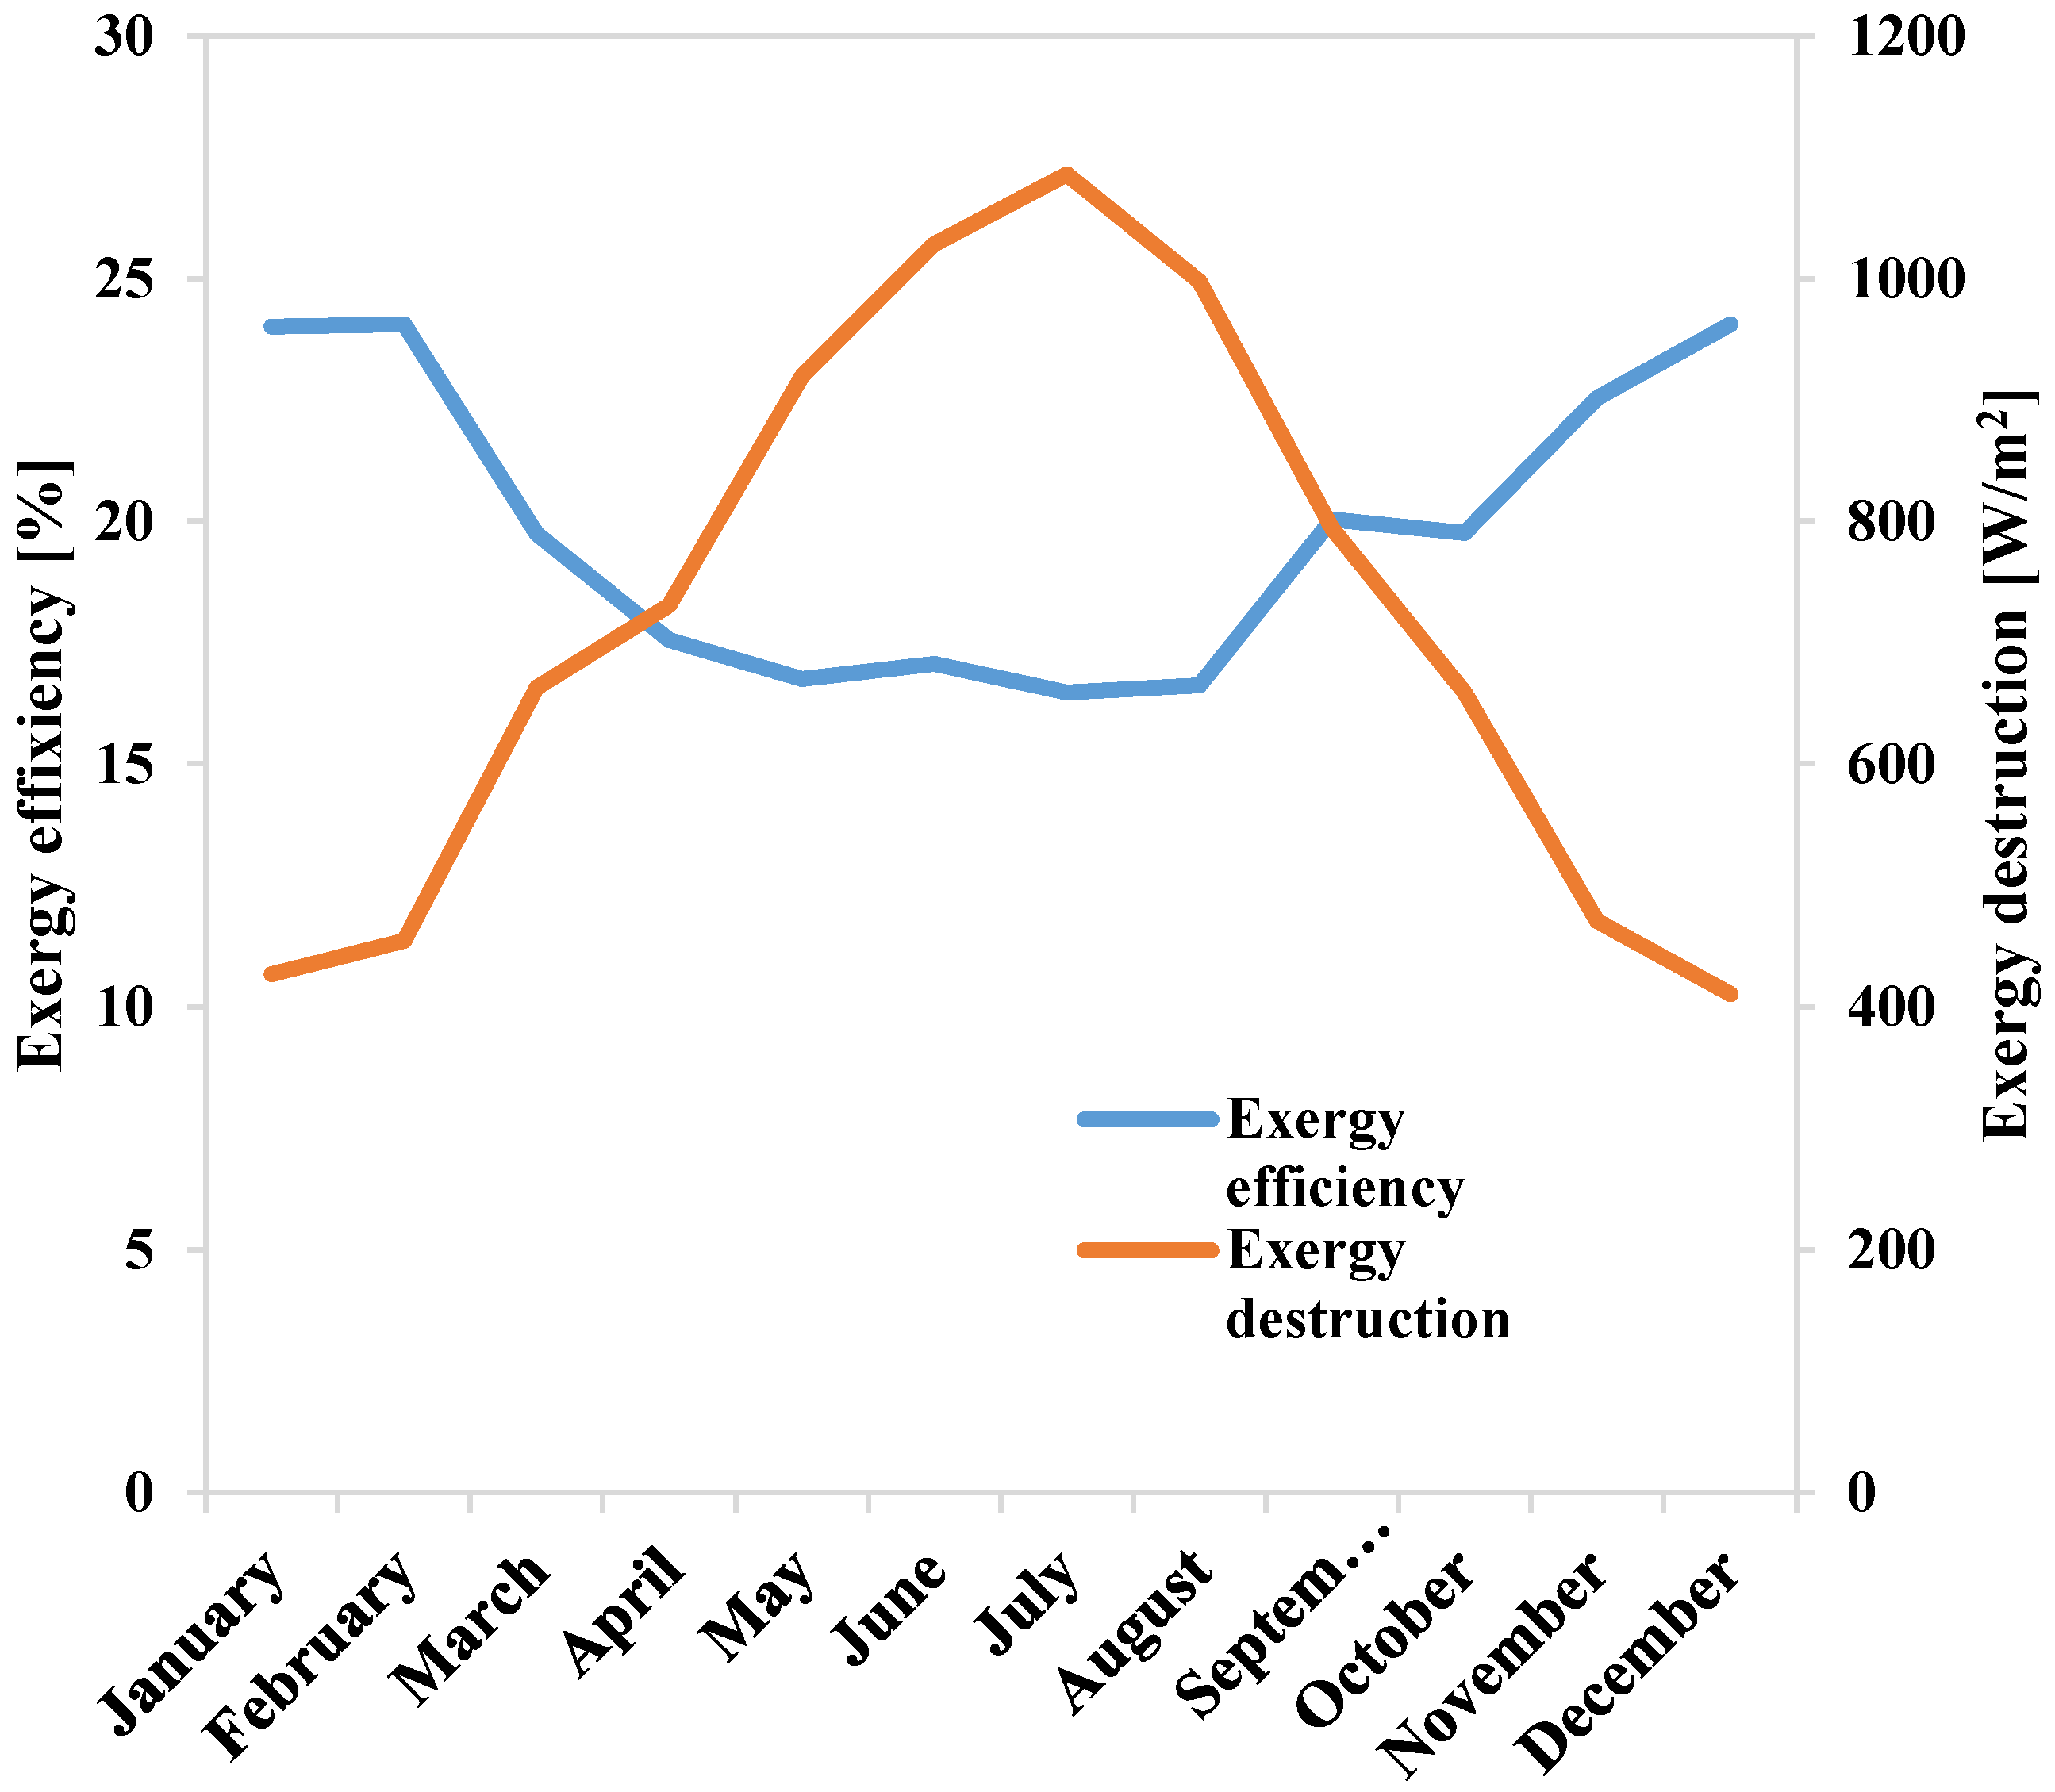
The exergy destroyed at the different components of the desalination systems is compiled in Table 13.

3.2. Exergy Analysis of the Solar PV Panel

The exergetic assessment of the solar PV system, assuming a steady-state flow process, can be obtained using Equation (23). Electrical and thermal energy are the two energy forms produced from solar radiation converted by solar cells. The potential of electrical energy is the main target. In contrast, thermal energy is wasted in the surrounding environment in the form of heat, causing exergy destruction.
The exergy efficiency of the PV module can be calculated using Equation (24).
The fuel exergy of a PV system includes only solar radiation exergy from the sun. The PV fuel exergy can be described as follows [44]:
E F , P V = A p v m . G 1 4 3 T a m b T s u n + 1 3 T a m b T s u n 4
where the sun temperature T s u n is assumed to be 6000 K. A p v , m is the PV module area (m2) and G is the solar radiation intensity (W/m2) defined based on the chosen location.
The product exergy of the PV system can be calculated as [45]:
E P , P V = E e l e c t r i c a l
The electrical exergy in the output electrical power of the PV module is given as follows [46]:
E e l e c t r i c a l = V O C · I S C · F F
FF denotes the fill factor, which can be determined using Equation (28). It indicates the most influential power transformation achieved by the PV module [47]. Meanwhile, V O C and I S C are the open-circuit voltage and short-circuit current of the PV module, respectively.
F F = I m · V m I S C · V O C
where I m and V m are the maximum current and voltage delivered by the PV module, respectively.
However, the thermal exergy can be considered an exergy loss E ˙ t h e r m a l , which is given as follows:
E t h e r m a l = Q p v , L 1 T a m b T p v , m
where Q p v , L denotes the heat losses from the PV cells, which can be estimated by:
Q p v , L = U p v · A p v m · T p v , m T a m b
where U p v is the overall heat transfer coefficient of the PV module and T p v , m the solar PV module temperature. The overall heat transfer coefficient U p v of a PV module includes convection and radiation losses that can be calculated by:
U p v = h c o n v ,   p v + h r a d ,   p v
The convective heat transfer coefficient is defined by [33], as follows:
h c o n v ,   p v = 2.8 + 3 V w
where V w is the wind speed [38].
The radiative heat transfer coefficient, as described by Watmuff et al. [48], is defined as follows:
h r a d ,   p v = ϵ σ T s k y + T p v , m T s k y 2 + T p v , m 2
where the emissivity of the panel ϵ is assumed to be 0.9, while σ is Stefan Boltzmann’s Constant 5.67 × 10⁻⁸ W/m2K4 and T s k y is the effective temperature of the sky defined by Watmuff et al. [48], as follows:
T s k y = T a m b 6
The solar PV module temperature, Tpv,m, can be determined using the nominal operating cell temperature, NOCT, which is defined as the temperature reached by open-circuited cells in a module under the conditions G = 800 W/m2, T a m b = 20 °C, and V w = 1 m/s [47].
T p v , m = T a m b + N O C T 20 . G 800  
Thus, the overall system exergy efficiency of the RO–HDH–PX system combined with the solar PV system can be defined as:
ε P V = E ˙ P , t o t E ˙ F , t o t = E ˙ x , p e r m e a t e + E ˙ x , a 5 + E ˙ x , F W o u t + E P , P V W ˙ t o t E ˙ x , S W o u t E ˙ x , S W i n + E F , P V
And, hence, the total exergy loss of the RO–HDH–PX system combined with the solar PV system is:
E ˙ l o s s = E ˙ x , B o u t + E t h e r m a l

4. Results

4.1. Exergy Analysis of the RO–HDH–PX System

The exergy analysis of the hybrid RO–HDH–PX system showed that the highest exergetic efficiency was obtained at feed salinity and pressure of 45,000 ppm and 5 MPa, as illustrated in Figure 3. The analysis indicated that the heat pump has a significant impact on the exergy destruction distribution, where the condenser and compressor were responsible for the highest exergy destruction, as shown in Figure 4 and Figure 5. However, no significant differences were observed in the exergy destruction of the different components as a function of operating conditions.

4.2. Exergy Analysis of the Stand-Alone Solar PV System

The variation in the exergetic efficiency and the exergy destruction over a year is shown in Figure 6. In the summer season, the exergy efficiency decreases due to the increase in the value of the irreversibilities with global radiation. In contrast, the exergetic efficiency has the highest values at the beginning and end of the year, when the value of the irreversibilities decreases. The maximum exergetic efficiency achieved was 24.06% in February, while the minimum was 16.49% in July (data from 2022).

4.3. Exergy Analysis of the RO–HDH–PX System Integrated with Solar PV

The hybrid RO–HDH–PX system combined with the solar PV system has been examined from an exergy analysis perspective. In the exergy analysis of the integrated hybrid system, the cooling capacity of the heat pump evaporator was considered as the product exergy in addition to the electrical energy produced by the solar PV system and freshwater produced by the RO and HDH systems. The integrated system RO–HDH–PX–PV has been investigated under different circumstances regarding feed water pressure, salinity, and mass flow rate. Moreover, the effect of solar irradiance variations over the year was included. However, as clarified in Section 4.2, the highest and lowest exergy efficiencies for the solar PV system were found in February and July; consequently, the overall exergy analysis for the whole system was conducted just for those months, which is the margin of the highest and lowest exergetic efficiency for the whole system.
The exergy efficiency has been affected by the integration with the PV system as a result of the exergy loss of the solar PV system throughout the year. Figure 7a–d shows the exergy efficiency of the RO–HDH–PX–PV system in February at different feed pressures, salinities, and mass flow rates. In contrast, Figure 8a–d shows the overall exergy efficiency in July. An increase of about 3% in exergy efficiency was observed in the RO–HDH–PX–PV system between February and July. Furthermore, the overall exergetic efficiency slightly improved as the percentage of increase varied from 1.25% to 2.15% compared to the RO–HDH–PX system. Meanwhile, in July, it slightly deteriorated compared to the RO–HDH–PX system by 0.15% to 1.12%. This was found to be consistent with the results indicated in the exergy analysis of the stand-alone solar PV system, where the addition of the product and fuel exergies of the solar PV system to the overall exergy analysis of the RO–HDH–PX system followed the same magnitude of increase and decrease in the exergy efficiency of the RO–HDH–PX–PV system in February and July during the year 2022, respectively.

4.4. Cost Analysis of the RO–HDH–PX–PV Hybrid Desalination System

The costs of the various components used in the desalination unit, based on the Egyptian market prices for 2022, are given in Table 14. To obtain the cost of the freshwater produced by these systems, other parameters must be taken into consideration: assuming installation costs to be 10% of the capital cost; expected lifetime, N, 10 years; inflation rate, dd, 15.637%; and interest rates ii, 11.75% (based on 2022 Egyptian economic statistics) [49,50]. In addition, a yearly maintenance cost, M/yr., of 5% of the capital cost has been considered.
The life cycle cost (LCC) of the hybrid system (RO–HDH–PX–PV) is the total of all current costs of the components RO, HDH, and PV, plus installation and present worth of the maintenance cost (MC), which is calculated using Equation (38).
M C = M y r × 1 + i i 1 + d d × 1 1 + i i 1 + d d N 1 1 + i i 1 + d d
All components are estimated to have a lifespan of 10 years, except for the batteries and RO membranes, which have a lifespan of 5 years. After five years, batteries and RO membranes must be replaced. The value of the additional set of batteries and RO membranes can be calculated using Equation (39), where CCx is the present worth value of the batteries or RO membranes.
C C x , P W = C C x · 1 + i i 1 + d d N
Figure 9 shows the unit cost of freshwater for the hybrid RO–HDH–PX–PV system, with and without batteries, and at different feedwater operating pressures (5 MPa and 6.5 MPa). The analysis shows that the system implemented with battery storage has the lowest unit cost despite the extra cost of the storage system on the total cost. The reason is that the productivity of the unit without a storage system is low because it has only 10 h of operation. Also, it was observed that the unit cost of freshwater decreases as the feed pressure decreases, while energy consumption decreases (mainly due to the high-pressure pump). The minimum unit cost of freshwater for the system implemented with battery storage results in 3.22 USD/m3 at a feedwater pressure of 5 MPa.

5. Conclusions

In this study, a hybrid desalination system based on membrane and thermal desalination technologies (RO–HDH) has been investigated.
The hybrid system was examined at different feedwater pressures, salinity, and mass flow rates. The HDH system was optimized to accommodate hybridization with the RO unit, where the brine from the RO unit feeds the HDH unit. Furthermore, a solar PV system was used to power the proposed hybrid desalination system, which was designed and evaluated considering the operational and environmental conditions. The findings can be summarized as follows:
  • The exergy analysis of the RO–HDH–PX system indicated that the condenser was responsible for the major exergy destruction, (from 43% to 49%, depending on the operation conditions). The highest exergy efficiency reached by the overall system was 23%.
  • The exergy analysis for the solar PV system revealed that the exergy efficiency is much higher in winter than in summer (reaching 7.5%) due to the high thermal losses.
  • The integration of the solar PV system increased the sustainability of the hybrid RO–HDH–PX system. The system implemented with battery storage showed a low freshwater cost compared to that without a battery. The unit cost of freshwater ranged from USD 3.22/m3 to USD 5.1/m3 when a battery was used; in contrast, it varied from USD 3.96/m3 to USD 7.1/m3 in the system without battery storage.

Author Contributions

Conceptualization, A.E.T., A.M.B.-M. and M.J.S.-L.; methodology, A.E.T., A.M.B.-M. and M.J.S.-L.; software, A.E.T.; validation, A.E.T., A.M.B.-M. and M.J.S.-L.; formal analysis, A.E.T.; investigation, A.E.T.; resources, A.M.E.; data curation, A.E.T.; writing—original draft preparation, A.E.T. writing—review and editing, A.E.T., A.M.B.-M. and M.J.S.-L.; visualization, A.M.B.-M. and M.J.S.-L.; supervision, A.M.B.-M., A.M.E. and M.J.S.-L.; project administration, A.M.E.; funding acquisition, A.E.T. and A.M.B.-M. All authors have read and agreed to the published version of the manuscript.

Funding

This research has been co-funded by ERDF funds, INTERREG MAC 2014–2020 programme, within the E5DES project (MAC2/1.1a/309). No funding sources had any influence on study design, collection, analysis, or interpretation of data, manuscript preparation, or the decision to submit for publication.

Data Availability Statement

The data presented in this study are available in this article (Section 2).

Acknowledgments

E5DES project (MAC2/1.1a/309), INTERREG MAC 2014–2020 programme.

Conflicts of Interest

The authors declare no conflict of interest.

Nomenclature

A Surface area (m2)
AAWater permeability coefficient (kg/m2sPa)
BSalt permeability coefficient (kg/m2s)
C Concentration (ppm)
C m Concentration polarization (ppm)
c p Specific thermal capacity (kJ/kgK)
dDiameter (m)
ddInflation rate (%)
dhHydraulic diameter (m)
DsSolute diffusivity (m2/s)
EEvaporator
E ˙ Exergy (kJ)
e f Specific flow exergy (kJ/kg)
FFFill factor
FSFeed space (μm)
GSolar radiation intensity (W/m2)
hSpecific enthalpy (kJ/kg)
h c o n v Convective heat transfer coefficient (W/m2/K)
h r a d Radiative heat transfer coefficient (W/m2/K)
iiInterest rate (%)
I Current (A)
J Flux (kg/m2s)
kThermal conductivity (W/mK)
K m Mass transfer coefficient (m/s)
L / G Atomized water to airflow mass ratio
m ˙ Mass flow rate (kg/s)
muDynamic viscosity (Ns/m2)
NcLargest number of continuous cloudy days on the site
PPressure (kPa)
QVolume flow rate (m3)
RaSpecific gas constant (J/kgK)
ReReynolds number
sSpecific entropy (kJ/kgK)
ScSchmidt number
SmSpecific surface area (m2)
TTemperature (K)
UOverall heat transfer coefficient (W/m2.K)
VVoltage (V)
V w Speed (m/s)
Abbreviations
CAOW-AHClosed-air, Open-water, and air heated
CAOW-WHClosed-air, Open-water, and water heated
DODMaximum permissible depth of discharge of the battery
EDElectro-Dialysis
ERDEnergy recovery device
GORGain output ratio
HDHHumidification–Dehumidification
LCCLife cycle cost
MCMaintenance cost
MEDMulti-Effect Distillation
MSFMulti-Stage Flash
NAge of the system
NOCTNormal Operation Cell Temperature
OACWOpen-air, Closed-water
OAOW-WHOpen-air, Open-water, and water heated
PWPresent worth
PXPressure exchanger
ROReverse Osmosis
TCFTemperature correction factor
TVThrottle valve
TDSTotal Dissolved Salts
WCHEWater Cooled Heat Exchanger
Subscript
0Dead State
aAir
ambAmbient
avgAverage
bwBrine
compHeat pump compressor
condHeat pump condenser
ConvHeat transfer by convection
cwCooling water
DDestruction
EHeat pump evaporator
ExpHeat pump expansion device
FFuel
fFeed seawater
FPFeed pump
FWFreshwater
HHumidifier
HPPHigh-pressure pump
inInlet
LLosses
mModule, maximum
maMoist air
oEnvironmental condition
OCOpen circuit
outOutlet
PProduct
pPermeate
pvSolar photovoltaic
RRefrigerant
radHeat transfer by radiation
SCShort-circuit
swSeawater
sSalt
totTotal
vWater vapor
vapWater vapor
wPure water
Superscript
CHChemical
PHPhysical
Greek Symbols
α Porosity
πOsmotic Pressure (MPa)
ρ Density (kg/m3)
σ Stefan Boltzmann’s Constant (5.67 × 10⁻⁸) [W/m2K4]
υSeawater-specific volume (m3/kg)
ɳ Energy efficiency (%)
η I I Exergy efficiency (%)
P f Pressure drop (MPa)

References

  1. United Nations. The United Nations World Water Development Report 2019; United Nations Publications: New York, NY, USA, 2019. [Google Scholar] [CrossRef]
  2. Mayere, A. Solar Powered Desalination. Ph.D. Dissertation, University of Nottingham, Nottingham, UK, 2011. [Google Scholar]
  3. El-Maghlany, W.M.; Tourab, A.E.; Hegazy, A.H.; Teamah, M.A.; Hanafy, A.A. Experimental study on productivity intensification of HDH desalination unit utilizing two-stage dehumidification. Desalination Water Treat. 2018, 107, 28–40. [Google Scholar] [CrossRef]
  4. FAO. The State of Food and Agriculture 2020, Overcoming Water Challenges in Agriculture; FAO: Rome, Italy, 2020. [Google Scholar] [CrossRef]
  5. Li, C. Innovative Desalination Systems Using Low-Grade Heat. Ph.D. Dissertation, University of South Florida, Tampa, FL, USA, 2012. [Google Scholar]
  6. Fawell, J.; Lund, U.; Mintz, B. Total dissolved solids in Drinking-water. In Background Document for Development of WHO Guidelines for Drinking-Water Quality; World Health Organization: Geneva, Switzerland, 2003. [Google Scholar]
  7. Santosh, R.; Arunkumar, T.; Velraj, R.; Kumaresan, G. Technological advancements in solar energy driven humidification-dehumidification desalination systems—A review. J. Clean. Prod. 2019, 207, 826–845. [Google Scholar] [CrossRef]
  8. Hürdoğan, E.; Kara, O. Performance assessment of a desalination system integrated with ground heat exchanger for hydrogen and fresh water production. Environ. Prog. Sustain. Energy 2022, 41, e13745. [Google Scholar] [CrossRef]
  9. El-Ghonemy, A.M.K. RETRACTED: Water desalination systems Powered by Renewable energy sources, Review. Renew. Sustain. Energy Rev. 2012, 16, 1537–1556. [Google Scholar] [CrossRef]
  10. Shalaby, S.M. Reverse osmosis desalination powered by photovoltaic and solar Rankine cycle power systems: A review. Renew. Sustain. Energy Rev. 2017, 73, 789–797. [Google Scholar] [CrossRef]
  11. Herold, D.; Neskakis, A. A small PV-driven reverse osmosis desalination plant on the island of Gran Canaria. Desalination 2001, 137, 285–292. [Google Scholar] [CrossRef]
  12. Mohamed, E.S.; Papadakis, G.; Mathioulakis, E.; Belessiotis, V. A direct coupled photovoltaic seawater reverse osmosis desalination system toward battery based systems—A technical and economical experimental comparative study. Desalination 2008, 221, 17–22. [Google Scholar] [CrossRef]
  13. Kettani, M.; Bandelier, P. Techno-economic assessment of solar energy coupling with large-scale desalination plant: The case of Morocco. Desalination 2020, 494, 114627. [Google Scholar] [CrossRef]
  14. Wang, J.-H.; Gao, N.-Y.; Deng, Y.; Xia, S.-J.; Qiao, J.-L. PV cell-driven humidification-dehumidification (H/D) process for brine treatment. Desalination Water Treat. 2011, 28, 328–337. [Google Scholar] [CrossRef]
  15. Wang, J.H.; Gao, N.Y.; Deng, Y.; Li, Y.L. Solar power-driven humidification–dehumidification (HDH) process for desalination of brackish water. Desalination 2012, 305, 17–23. [Google Scholar] [CrossRef]
  16. Giwa, A.; Fath, H.; Hasan, S.W. Humidification–dehumidification desalination process driven by photovoltaic thermal energy recovery (PV-HDH) for small-scale sustainable water and power production. Desalination 2016, 377, 163–171. [Google Scholar] [CrossRef]
  17. Gabrielli, P.; Gazzani, M.; Novati, N.; Sutter, L.; Simonetti, R.; Molinaroli, L.; Manzolini, G.; Mazzotti, M. Combined water desalination and electricity generation through a humidification-dehumidification process integrated with photovoltaic-thermal modules: Design, performance analysis and techno-economic assessment. Energy Convers. Manag. X 2019, 1, 100004. [Google Scholar] [CrossRef]
  18. Rafiei, A.; Alsagri, A.S.; Mahadzir, S.; Loni, R.; Najafi, G.; Kasaeian, A. Thermal analysis of a hybrid solar desalination system using various shapes of cavity receiver: Cubical, cylindrical, and hemispherical. Energy Convers Manag. 2019, 198, 111861. [Google Scholar] [CrossRef]
  19. Mahmoud, A.; Fath, H.; Ahmed, M. Enhancing the performance of a solar driven hybrid solar still/humidification-dehumidification desalination system integrated with solar concentrator and photovoltaic panels. Desalination 2018, 430, 165–179. [Google Scholar] [CrossRef]
  20. Narayan, G.P.; McGovern, R.K.; Zubair, S.M.; Lienhard, J.H. High-temperature-steam-driven, varied-pressure, humidification-dehumidification system coupled with reverse osmosis for energy-efficient seawater desalination. Energy 2012, 37, 482–493. [Google Scholar] [CrossRef]
  21. Kabeel, A.; El-Said, E.M. A hybrid solar desalination system of air humidification–dehumidification and water flashing evaporation: Part I. A numerical investigation. Desalination 2013, 320, 56–72. [Google Scholar] [CrossRef]
  22. Kabeel, A.; El-Said, E.M. A hybrid solar desalination system of air humidification, dehumidification and water flashing evaporation: Part II. Experimental investigation. Desalination 2014, 341, 50–60. [Google Scholar] [CrossRef]
  23. Kabeel, A.; Elmaaty, T.A.; El-Said, E.M. Economic analysis of a small-scale hybrid air HDH–SSF (humidification and dehumidification–water flashing evaporation) desalination plant. Energy 2013, 53, 306–311. [Google Scholar] [CrossRef]
  24. Eslamimanesh, A.; Hatamipour, M. Economical study of a small-scale direct contact humidification–dehumidification desalination plant. Desalination 2010, 250, 203–207. [Google Scholar] [CrossRef]
  25. Abdelgaied, M.; Kabeel, A.; Kandeal, A.; Abosheiasha, H.; Shalaby, S.; Hamed, M.H.; Yang, N.; Sharshir, S.W. Performance assessment of solar PV-driven hybrid HDH-RO desalination system integrated with energy recovery units and solar collectors: Theoretical approach. Energy Convers. Manag. 2021, 239, 114215. [Google Scholar] [CrossRef]
  26. Al-Sulaiman, F.A.; Narayan, G.P.; Lienhard, J.H. Exergy analysis of a high-temperature-steam-driven, varied-pressure, humidification–dehumidification system coupled with reverse osmosis. Appl. Energy 2013, 103, 552–561. [Google Scholar] [CrossRef]
  27. Sharqawy, M.H.; Zubair, S.M.; Lienhard, J.H. Second law analysis of reverse osmosis desalination plants: An alternative design using pressure retarded osmosis. Energy 2011, 36, 6617–6626. [Google Scholar] [CrossRef]
  28. Jamil, M.A.; Elmutasim, S.M.; Zubair, S.M. Exergo-economic analysis of a hybrid humidification dehumidification reverse osmosis (HDH-RO) system operating under different retrofits. Energy Convers. Manag. 2018, 158, 286–297. [Google Scholar] [CrossRef]
  29. Ameri, M.; Eshaghi, M.S. A novel configuration of reverse osmosis, humidification–dehumidification and flat plate collector: Modeling and exergy analysis. Appl. Therm. Eng. 2016, 103, 855–873. [Google Scholar] [CrossRef]
  30. Lu, Y.; Liao, A.; Hu, Y. The design of reverse osmosis systems with multiple-feed and multiple-product. Desalination 2012, 307, 42–50. [Google Scholar] [CrossRef]
  31. Aljundi, I.H. Second-law analysis of a reverse osmosis plant in Jordan. Desalination 2009, 239, 207–215. [Google Scholar] [CrossRef]
  32. Foley, G. Membrane Filtration: A Problem Solving Approach with MATLAB; Cambridge University Press: Cambridge, UK, 2013. [Google Scholar] [CrossRef]
  33. Cengel, Y.A.; Ghajar, A. Heat and Mass Transfer (A Practical Approach, SI Version); McGraw-670 Hill Education: New York, NY, USA, 2011; Volume 671, p. 52. [Google Scholar]
  34. Khalaf, T.Y. Biomedical Dngineering Dept, Estimation of Concentration Polarization Using the Combined Film theory/Spiegler-Kedem Model and Empirical Correlation. NUCEJ Spat. ISSUE 2008, 11, 322. [Google Scholar]
  35. Murthy, Z.V.P.; Vengal, J.C. Optimization of a Reverse Osmosis System Using Genetic Algorithm. Sep. Sci. Technol. 2006, 41, 647–663. [Google Scholar] [CrossRef]
  36. Lu, Y.-Y.; Hu, Y.-D.; Zhang, X.-L.; Wu, L.-Y.; Liu, Q.-Z. Optimum design of reverse osmosis system under different feed concentration and product specification. J. Membr. Sci. 2007, 287, 219–229. [Google Scholar] [CrossRef]
  37. Tourab, A.E.; Blanco-Marigorta, A.M.; Elharidi, A.M.; Suárez-López, M.J. A Novel Humidification Technique Used in Water Desalination Systems Based on the Humidification–Dehumidification Process: Experimentally and Theoretically. Water 2020, 12, 2264. [Google Scholar] [CrossRef]
  38. Global Solar Atlas. Available online: https://globalsolaratlas.info/map?c=31.199004,29.894378,11&s=31.199004,29.894378&m=site (accessed on 10 August 2022).
  39. Mahmoud, M.M.; Ibrik, I.H. Techno-economic feasibility of energy supply of remote villages in Palestine by PV-systems, diesel generators and electric grid. Renew. Sustain. Energy Rev. 2006, 10, 128–138. [Google Scholar] [CrossRef]
  40. Bejan, A. Advanced Engineering Thermodynamics, 4th ed.; John Wiley & Sons: Hoboken, NJ, USA, 2016. [Google Scholar]
  41. Moran, M.J. Availability Analysis: A Guide to Efficient Energy Use Corrected Edition; ASME Press: New York, NY, USA, 1989. [Google Scholar]
  42. Sharqawy, M.H.; Lienhard, J.H.; Zubair, S.M. Thermophysical properties of seawater: A review of existing correlations and data. Desalination Water Treat. 2010, 16, 354–380. [Google Scholar] [CrossRef]
  43. Wepfer, W.J.; Gaggioli, R.A.; Obert, E.F. Proper Evaluation of Available Energy for Hvac. ASHRAE Trans. 1979, 85, 214–230. [Google Scholar]
  44. Petela, R. Exergy of undiluted thermal radiation. Sol. Energy 2003, 74, 469–488. [Google Scholar] [CrossRef]
  45. Sarhaddi, F.; Farahat, S.; Ajam, H.; Behzadmehr, A. Exergetic Performance Evaluation of a Solar Photovoltaic (PV) Array. Aust. J. Basic Appl. Sci. 2010, 4, 502–519. [Google Scholar]
  46. Joshi, A.S.; Dincer, I.; Reddy, B.V. Thermodynamic assessment of photovoltaic systems. Sol. Energy 2009, 83, 1139–1149. [Google Scholar] [CrossRef]
  47. Sahin, A.D.; Dincer, I.; Rosen, M.A. Thermodynamic analysis of solar photovoltaic cell systems. Sol. Energy Mater. Sol. Cells 2007, 91, 153–159. [Google Scholar] [CrossRef]
  48. Watmuff, J.; Charters, W.; Proctor, D. Solar and wind induced external coefficients—Solar collectors. Coop. Mediterr. Energ. Sol. 1977, 1, 56. [Google Scholar]
  49. Inflation Rates. Available online: https://www.cbe.org.eg/en/EconomicResearch/Statistics/Pages/InflationRates.aspx (accessed on 11 August 2022).
  50. Discount Rates. Available online: https://www.cbe.org.eg/en/EconomicResearch/Statistics/Pages/DiscountRates.aspx (accessed on 11 August 2022).
Figure 1. The schematic diagram for the hybrid desalination system (RO–HDH–PX) using a pressure exchanger.
Jmse 12 00019 g001
Figure 2. The block diagram shows the solar PV system components.
Jmse 12 00019 g002
Figure 3. Overall exergy efficiency for RO–HDH–PX system.
Jmse 12 00019 g003
Figure 4. Percentage of exergy destruction of RO–HDH–PX system at feed pressure and salinity of 5 MPa and 45,000 ppm.
Jmse 12 00019 g004
Figure 5. Percentage of exergy destruction of RO–HDH–PX system components at the feed flow rate, pressure, and salinity of 602 kg/h, 5 MPa, and 45,000 ppm, respectively.
Jmse 12 00019 g005
Figure 6. Exergy efficiency and destruction variations over the year 2022.
Jmse 12 00019 g006
Figure 7. The exergy efficiency of the hybrid RO–HDH–PX–PV system in 2/2022 for different feed water flow rates at (a) 5 MPa and 35,000 ppm; (b) 6.5 MPa and 35,000 ppm; (c) 5 MPa and 45,000 ppm; and (d) 6.5 MPa and feed salinity 45,000 ppm.
Jmse 12 00019 g007
Figure 8. The exergy efficiency of the hybrid RO–HDH–PX–PV system in 7/2022 for different feed water flow rates at (a) 5 MPa and 35,000 ppm; (b) 6.5 MPa and 35,000 ppm; (c) 5 MPa and 45,000 ppm; and (d) 6.5 MPa and feed salinity 45,000 ppm.
Jmse 12 00019 g008
Figure 9. The unit cost of freshwater for the hybrid RO–HDH–PX–PV system: with and without a battery storage system.
Jmse 12 00019 g009
Table 1. Operating conditions for RO–HDH hybrid system.
ParametersHumidification–Dehumidification SystemReverse Osmosis System
Membrane type-SW30-4040
Air mass flow rate (kg/h)936-
Feedwater mass flow rate (kg/h)219–345383–602
Air inlet temperature (°C)25-
Water inlet temperature (°C)2525
Feedwater pressure (MPa)0.155–6.5
Recovery ratio (%)-43.86
Feedwater Salinity (ppm)Based on RO brine35,000–45,000
Table 2. Characteristics of the Film-Tec spiral wound membrane element used in the reverse osmosis system (DuPont, Wilmington, DE, USA).
Element TypeSW30-4040
Active area (m2)7.4
Length of the element (m)1016
Diameter of the element (mm)99
Feed space (μm)711.2
Feed flow rate range (m3/h)0.1–3.6
Permeate flow (m3/d)7.4
Stabilized salt rejection (%)99.75
Maximum operating pressure (MPa)6.9
Pure water permeability constant, A (kg/m2.s.Pa)9.058 × 10−10
Salt permeability constant, B (kg/m2.s)2.11 × 10−10
Table 3. Thermodynamic properties at different locations for the RO–PX unit at a feedwater flow rate of 602 kg/h.
PointTemperature (°C)Pressure (kPa)Mass Flow Rate (kg/h)Total Dissolved Salts (ppm)
125101.325240.6435,000
225500240.6435,000
325486240.6435,000
4256500240.6435,000
5256500601.6135,000
625101.32525762.69
7256350337.7862290
825150337.7862290
925101.32536135,000
10255706.736135,000
1125650036135,000
Table 4. Characteristics of the Film-Tec spiral wound reverse osmosis membrane elements used in the model validation (DuPont, Wilmington, DE, USA).
Element TypeSW30-4040SW30XLE-400i
Active area (m2)7.437.2
Length of the element (m)10161.016
Diameter of the element (mm)99201
Feed space (μm)711.2711.2
Feed flow rate range (m3/h)0.1–3.619.3
Permeate flow (m3/d)7.434
Stabilized salt rejection (%)99.7599.7
Maximum operating pressure (MPa)6.98.3
Pure water permeability constant, A (kg/m2.s.Pa)9.058 × 10−103.5 × 10⁻⁹
Salt permeability constant, B (kg/m2.s)2.11 × 10−103.2 × 10⁻⁵
Table 5. Validation of the reverse osmosis system.
ParametersTest 1Test 2Test 3
Lu et al. [36]Model ValuesLu et al. [36]Model ValuesLu et al. [36]Model Values
Feed water mass flow rate (m3/h)264264264264264264
Permeate water mass flow rate (m3/h)120120120120120120
Feed water concentration (ppm)48,00048,00042,00042,00038,00038,000
Feed water pressure (MPa)8.18.17.37.36.76.7
Permeate water concentration (ppm)380383.1682330341.9592300318.8987
Table 6. Thermodynamic properties at different locations for the HDH unit for a 936 kg/h flow of air and 219 kg/h flow of feed water.
PointTemperature (°C)Pressure (kPa)Mass Flow Rate (kg/h)Specific Enthalpy (kJ/kg)
a125101.31493650.33
a250101.31493662.57
a332.2101.314957.9587.19
a431.4101.314957.9586.69
a526.8101.314953.9377.99
SWin2512527099.79
SWout28.3101.325270110.71
Fin25150219.3399.79
Bout25101.325210.9395.44
FWout18.63101.3254.01876.09
Table 7. Thermodynamic properties of the refrigerant at different locations for the heat pump cycle.
PointPressure (kPa)Specific Enthalpy (kJ/kg)Mass Flow Rate (kg/h)
R1200046857.6
R2200027557.6
R32000268.7157.6
R4450260.257.6
R5450418.357.6
R6450421.557.6
Table 8. Validation of HDH system.
ParametersEl-Maghlany et al. [3] Experimental DataModel ValuesRelative Error (%)
Feed seawater mass flow rate (kg/h)1321320
Feed air flow mass rate (kg/min)15.7115.710
Inlet air temperature (°C)25250
Inlet feed water temperature (°C)15150
Inlet-specific enthalpy to heat pump condenser h R , 1 (kJ/kg)4704853.19
Inlet-specific enthalpy to heat pump evaporator h R , 4 (kJ/kg)2752905.45
Freshwater produced (kg/h)3.223.181.24
The temperature of freshwater (°C)20.619.853.64
Table 9. Specification and geometry of the HDH unit [3].
ParametersValues
Heat pump condenser fins195
Heat pump condenser volume (m3)0.53 × 0.4 × 0.25
Fin pitch in the condenser (m)0.02
Humidifier volume (m3)0.53 × 0.4 × 1.5
Water-cooled heat exchanger fins169
Water-cooled heat exchanger volume (m3)0.53 × 0.4 × 0.2
Heat pump evaporator fins177
Fin pitch in the evaporator (m)0.02
Heat pump evaporator volume (m3)0.53 × 0.4 × 0.2
Compressor power (kW)2
Feed pump power (kW)0.22
Table 10. Energy consumption per day of the RO–HDH–PX hybrid system at different operating conditions.
Total Seawater Feed Flow Rate (m3/h)383438492547602
At feed pressure, 5 MPa
Without battery usage (kWh/day)15.716.216.717.1317.6
Using battery (kWh/day)37.838.94041.142.2
At feed pressure, 6.5 MPa
Without battery usage (kWh/day)16.717.317.918.519.1
Using battery (kWh/day)40.141.5044344.445.8
Table 11. Characteristics of the Sunergy Solar SSM420-108 PV module (Sunergy Solar, Huzhou, China).
ParametersValue
Nominal output power (Pmmp)420 W
Nominal voltage (Vmmp)31.77 V
Nominal current (Immp)13.15 A
Short circuit current (Isc)14.05 A
Open circuit voltage (Voc)37.81 V
Module efficiency η p v 21.4%
Number of cells 108 cell
Module Dimensions1722 × 1134 × 30 mm
Normal Operation Cell Temperature (NOCT)41 °C ( ± 3   ° C )
Table 12. Results of the design of the solar system at different operating conditions.
ItemsAt Feed Pressure, 5 MPaAt Feed Pressure, 6.5 MPa
System approachWithout batteryUtilizing batteryWithout batteryUtilizing battery
Number of solar PV module 11–1225–2811–1327–31
Number of batteries
(12 V–220 A)
-75–84-80–91
Solar inverter capacity (kW)3333
Battery charger capacity (kW)-14.4-14.4
Table 13. Exergy destruction at each component of the HDH, RO, and hybrid desalination systems.
ComponentsExergy Balance
HDH system
Fan and Condenser E ˙ D , c o n d , f a n = E ˙ x , R 1 E ˙ x , R 2 + W ˙ F a n E ˙ x , a 2 E ˙ x , a 1
Humidifier E ˙ D , h u m i = E ˙ x , a 2 P H E ˙ x , a 3 P H E ˙ x , B o u t E ˙ x , F i n E ˙ x , a 3 C H E ˙ x , a 2 C H
Water-cooled heat exchanger E ˙ D , W C H E = E ˙ x , a 3 E ˙ x , a 4 E ˙ x , B o u t E ˙ x , F i n
Evaporator E ˙ D , E = E ˙ x , R 5 E ˙ x , R 4 E ˙ x , a 4 ( E ˙ x , a 5 + E ˙ x , F W o u t )
Heat exchanger E ˙ D , H E = E ˙ x , R 2 E ˙ x , R 3 E ˙ x , R 5 E ˙ x , R 6
Compressor E ˙ D , c o m p = W ˙ c o m p E ˙ x , R 1 E ˙ x , R 6
Overall HDH system exergy efficiency ε H D H = E ˙ x , a 5 + E ˙ x , F W o u t W ˙ c o m p + W ˙ F a n + W ˙ f e e d   p u m p , 1 + W ˙ f e e d   p u m p , 2 + E ˙ x , F i n
HDH exergy losses E ˙ L = E ˙ x , B o u t + E ˙ x , S W o u t
RO system
Feed pump and Filter E ˙ D , F P = W ˙ F P E ˙ x , 3 E ˙ x , 1
High-pressure pump E ˙ D , H P P = W ˙ H P P E ˙ x , 4 E ˙ x , 3
Pressure exchanger pump E ˙ D ,   P X   p u m p = W ˙ P X , p u m p E ˙ x , 11 E ˙ x , 10
Reverse osmosis module without ERD E ˙ D , R O = E ˙ x , 4 P H ( E ˙ x , 5 P H E ˙ x , 7 P H ) ( E ˙ x , 5 C H E ˙ x , 7 C H ) E ˙ x , 4 C H
Reverse osmosis module using pressure exchanger E ˙ D , R O = E ˙ x , 5 P H ( E ˙ x , 6 P H E ˙ x , 7 P H ) ( E ˙ x , 6 C H E ˙ x , 7 C H ) E ˙ x , 5 C H
Pressure exchanger E ˙ D , P X = E ˙ x , 7 E ˙ x , 8 E ˙ x , 10 E ˙ x , 9
Overall RO–PX system exergy efficiency ε R O P X = m ˙ p e r m e a t e . e p e r m e a t e C H + m ˙ b r i n e ( e b r i n e P H + e b r i n e C H e s e a w a t e r P H ) W ˙ p u m p s + m ˙ p e r m e a t e ( e s e a w a t e r P H e p e r m e a t e P H )
Hybrid system
Overall RO–HDH–PX system exergy efficiency ε R O H D H P X = E ˙ P , t o t E ˙ F , t o t = E ˙ x , p e r m e a t e + E ˙ x , a 5 + E ˙ x , F W o u t W ˙ t o t ( E ˙ x , S W o u t E ˙ x , S W i n )
Total exergy loss E ˙ l o s s = E ˙ x , B o u t
Table 14. Estimated capital cost for the RO–HDH–PX–PV components (2022 Egyptian market).
System ComponentsCost (USD)System ComponentsCost (USD)
RO systemSolar PV system
Seawater FP750Solar PV panel0.188/W
Seawater HPP (4.5 MPa delivery pressure)1500Solar inverter290
Seawater HPP (6.5 MPa delivery pressure)2000Battery59.9/kWh
RO membrane Film-tec SW30-4040464/elementBattery Charge Controller375
Pressure exchanger2000
HDH system
Centrifugal fan100Feed pump I40
Flexible duct15Heat pump evaporator40
Compressor464Piping40
Heat pump condenser50Steel construction stands150
Water eliminator20Insulated ducts30
Control panel25
Two water sprayers5
Installation 10% of capital cost
Maintenance ( M / y r ) 5% of capital cost/year
Disclaimer/Publisher’s Note: The statements, opinions and data contained in all publications are solely those of the individual author(s) and contributor(s) and not of MDPI and/or the editor(s). MDPI and/or the editor(s) disclaim responsibility for any injury to people or property resulting from any ideas, methods, instructions or products referred to in the content.

