
Oxygen Extraction Efficiency and Tolerance to Hypoxia in Sponges


Abstract
1. Introduction
2. Materials and Methods
3. Results
4. Discussion
4.1. Oxygen Extraction Efficiency
4.2. Oxygen Uptake in Sponges versus Mussels
5. Conclusions
Funding
Institutional Review Board Statement
Informed Consent Statement
Data Availability Statement
Acknowledgments
Conflicts of Interest
References
- Dohrmann, M.; Wörheide, G. Dating early animal evolution using phylogenomic data. Sci. Rep. 2017, 7, 3599. [Google Scholar] [CrossRef] [PubMed]
- Leys, S.P.; Kahn, A.S. Oxygen and energetic requirements of the first multicellular animals. Integ. Comp. Biol. 2018, 58, 666–676. [Google Scholar] [CrossRef] [PubMed]
- Canfield, D.E.; van Zuilen, M.A.; Nabhan, S.; Bjerrum, C.J.; Zhang, S.; Wang, H.; Wang, X. Petrographic carbon in ancient sediments constrains Proterozoic Era atmospheric oxygen levels. Proc. Natl. Acad. Sci. USA 2021, 118, e2101544118. [Google Scholar] [CrossRef] [PubMed]
- Ayling, A.L. Factors affecting the spatial distributions of thinly encrusting sponges from temperate waters. Oecologia 1983, 60, 412–418. [Google Scholar] [CrossRef]
- Barthel, D. On the ecophysiology of the sponge Halichondria panicea in Kiel Bight. II. Biomass, production, energy budget and integration in environmental processes. Mar. Ecol. Prog. Ser. 1988, 43, 87–93. [Google Scholar] [CrossRef]
- Bell, J.J. The functional roles of marine sponges. Estuar. Coast. Shelf Sci. 2008, 79, 341–353. [Google Scholar] [CrossRef]
- Bell, J.J.; McGrath, E.; Kandler, N.M.; Marlow, J.; Beepat, S.S.; Bachtiar, R.; Shaffer, M.R.; Mortimer, C.; Micaroni, V.; Mobilia, V.; et al. Interocean patterns in shallow water sponge assemblage structure and function. Biol. Rev. 2020, 95, 1720–1758. [Google Scholar] [CrossRef] [PubMed]
- Van Soest, R.W.M.; Boury-Esnault, N.; Vacelet, J.; Dohrmann, M.; Erpenbeck, D.; De Voogd, N.J.; Santodomingo, N.; Bart Vanhoorne, B.; Kelly, M.; Hooper, J.N.A. Global diversity of sponges (Porifera). PLoS ONE 2012, 7, e35105. [Google Scholar] [CrossRef]
- Morganti, T.M.; Ribes, M.; Moskovich, R.; Weisz, J.B.; Yahel, G.; Coma, R. In situ pumping rate of 20 marine demosponges is a function of osculum area. Front. Mar. Sci. 2021, 8, 583188. [Google Scholar] [CrossRef]
- Bergquist, P.R. Sponges; University of California Press: Berkeley, CA, USA; Los Angeles, CA, USA, 1978; 268p. [Google Scholar]
- Simpson, T.L. The Cell Biology of Sponges; Springer-Verlag: New York, NY, USA, 1984. [Google Scholar]
- Lavrov, A.I.; Bolshakov, F.V.; Tokina, D.B.; Ereskovsky, A.V. Fine details of the choanocyte filter apparatus in asconoid calcareous sponges (Porifera: Calcarea) revealed by ruthenium red fixation. Zoology 2022, 150, 125984. [Google Scholar] [CrossRef]
- Nielsen, C. Hydrodynamics in early animal evolution. Biol. Rev. 2023, 98, 376–385. [Google Scholar] [CrossRef] [PubMed]
- Weissenfels, N. The filtration apparatus for food collection in freshwater sponges (Porifera, Spongillidea). Zoomorphology 1992, 112, 51–55. [Google Scholar] [CrossRef]
- Reiswig, H.M. Particle feeding in natural populations of three marine demosponges. Biol. Bull. 1971, 141, 568–591. [Google Scholar] [CrossRef]
- Reiswig, H.M. The aquiferous systems of three marine Demospongiae. J. Morphol. 1975, 145, 493–502. [Google Scholar] [CrossRef] [PubMed]
- Lüskow, F.; Riisgård, H.U.; Solovyeva, V.; Brewer, J.R. Seasonal changes in bacteria and phytoplankton biomass control the condition index of the demosponge Halichondria panicea in temperate Danish waters. Mar. Ecol. Prog. Ser. 2019, 608, 119–132. [Google Scholar] [CrossRef]
- Imsiecke, G. Ingestion, digestion, and egestion in Spongilla lacustris (Porifera, Spongillidae) after pulse feeding with Chlamydomonas reinhardtii (Volvocales). Zoomorphology 1993, 113, 233–244. [Google Scholar] [CrossRef]
- Funch, P.; Kealy, R.A.; Goldstein, J.; Brewer, J.R.; Solovyeva, V.; Riisgård, H.U. Fate of microplastic captured in the marine demosponge Halichondria panicea. Mar. Poll. Bull. 2023, 194, 115403. [Google Scholar] [CrossRef]
- Mills, D.B.; Francis, W.R.; Vargas, S.; Larsen, M.; Elemans, C.H.P.; Canfield, D.E.; Wörheide, G. The last common ancestor of animals lacked the HIF pathway and respired in low-oxygen environments. eLife 2018, 7, e31176. [Google Scholar] [CrossRef]
- Micaroni, V.; Strano, F.; McAllen, R.; Woods, L.; Turner, J.; Harman, L.; Bell, J.J. Adaptive strategies of sponges to deoxygenated oceans. Glob. Change Biol. 2022, 28, 1972–1989. [Google Scholar] [CrossRef]
- Elliott, G.R.D.; Leys, S.P. Coordinated contractions effectively expel water from the aquiferous system of a freshwater sponge. J. Exp. Biol. 2007, 210, 3736–3748. [Google Scholar] [CrossRef]
- Kealy, R.A.; Busk, T.; Goldstein, J.; Larsen, P.S.; Riisgård, H.U. Hydrodynamic characteristics of aquiferous modules in the demosponge Halichondria panicea. Mar. Biol. Res. 2019, 15, 531–540. [Google Scholar] [CrossRef]
- Goldstein, J.; Funch, P. A review on genus Halichondria (Demospongiae, Porifera). J. Mar. Sci. Eng. 2022, 10, 1312. [Google Scholar] [CrossRef]
- Kumala, L.; Thomsen, M.; Canfield, D.E. Respiration kinetics and allometric scaling in the demosponge Halichondria panicea. BMC Ecol. Evol. 2023, 23, 53. [Google Scholar] [CrossRef] [PubMed]
- Jørgensen, C.B.; Møhlenberg, M.; Sten-Knudsen, O. Nature of relation between ventilation and oxygen consumption in filter feeders. Mar. Ecol. Prog. Ser. 1986, 29, 73–88. [Google Scholar] [CrossRef]
- Riisgård, H.U.; Kumala, L.; Charitonidou, K. Using the F/R-ratio for an evaluation of the ability of the demosponge Halichondria panicea to nourish solely on phytoplankton versus free-living bacteria in the sea. Mar. Biol. Res. 2016, 12, 907–916. [Google Scholar] [CrossRef]
- Goldstein, J.; Riisgård, H.U.; Larsen, P.S. Exhalant jet speed of single-osculum explants of the demosponge Halichondria panicea and basic properties of the sponge-pump. J. Exp. Mar. Biol. Ecol. 2019, 511, 82–90. [Google Scholar] [CrossRef]
- Riisgård, H.U.; Larsen, P.S. Filtration rates and scaling in demosponges. J. Mar. Sci. Eng. 2022, 10, 643. [Google Scholar] [CrossRef]
- Jørgensen, C.B. Comparative physiology of suspension feeding. Ann. Rev. Physiol. 1975, 37, 57–79. [Google Scholar] [CrossRef]
- Riisgård, H.U.; Larsen, P.S. Comparative ecophysiology of active zoobenthic filter-feeding, essence of current knowledge. J. Sea Res. 2000, 44, 169–193. [Google Scholar] [CrossRef]
- Riisgård, H.U. Filter-feeding mechanisms in crustaceans. In Lifestyles and Feeding Biology, Volume II. The Natural History of Crustaceans; Thiel, M., Watling, L., Eds.; Oxford University Press: Oxford, UK, 2015; Chapter 15; pp. 418–463. [Google Scholar]
- Tang, B.; Riisgård, H.U. Relationship between oxygen concentration, respiration and filtration rate in blue mussel Mytilus edulis. J. Oceanol. Limnol. 2018, 36, 395–404. [Google Scholar] [CrossRef]
- Tang, B.; Riisgård, H.U. Physiological regulation of valve-opening degree enables mussels Mytilus edulis to overcome starvation periods by reducing the oxygen uptake. Open J. Mar. Sci. 2016, 6, 341–352. [Google Scholar] [CrossRef]
- Riisgård, H.U.; Larsen, P.S. Physiologically regulated valve-closure makes mussels long-term starvation survivors: Test of hypothesis. J. Mollusc. Stud. 2015, 81, 303–307. [Google Scholar] [CrossRef]
- Kumala, L.; Larsen, M.; Glud, R.N.; Canfield, D.E. Spatial and temporal anoxia in single-osculum Halichondria panicea demosponge explants studied with planar optodes. Mar. Biol. 2021, 168, 173. [Google Scholar] [CrossRef]
- Riisgård, H.U.; Larsen, P.S. Actual and model-predicted growth of sponges–with a bioenergetic comparison to other filter-feeders. J. Mar. Sci. Eng. 2022, 10, 607. [Google Scholar] [CrossRef]
- Lesser, M.P. Size effects on pumping rates in high microbial versus low microbial abundance marine sponges. Oceans 2023, 4, 394–408. [Google Scholar] [CrossRef]


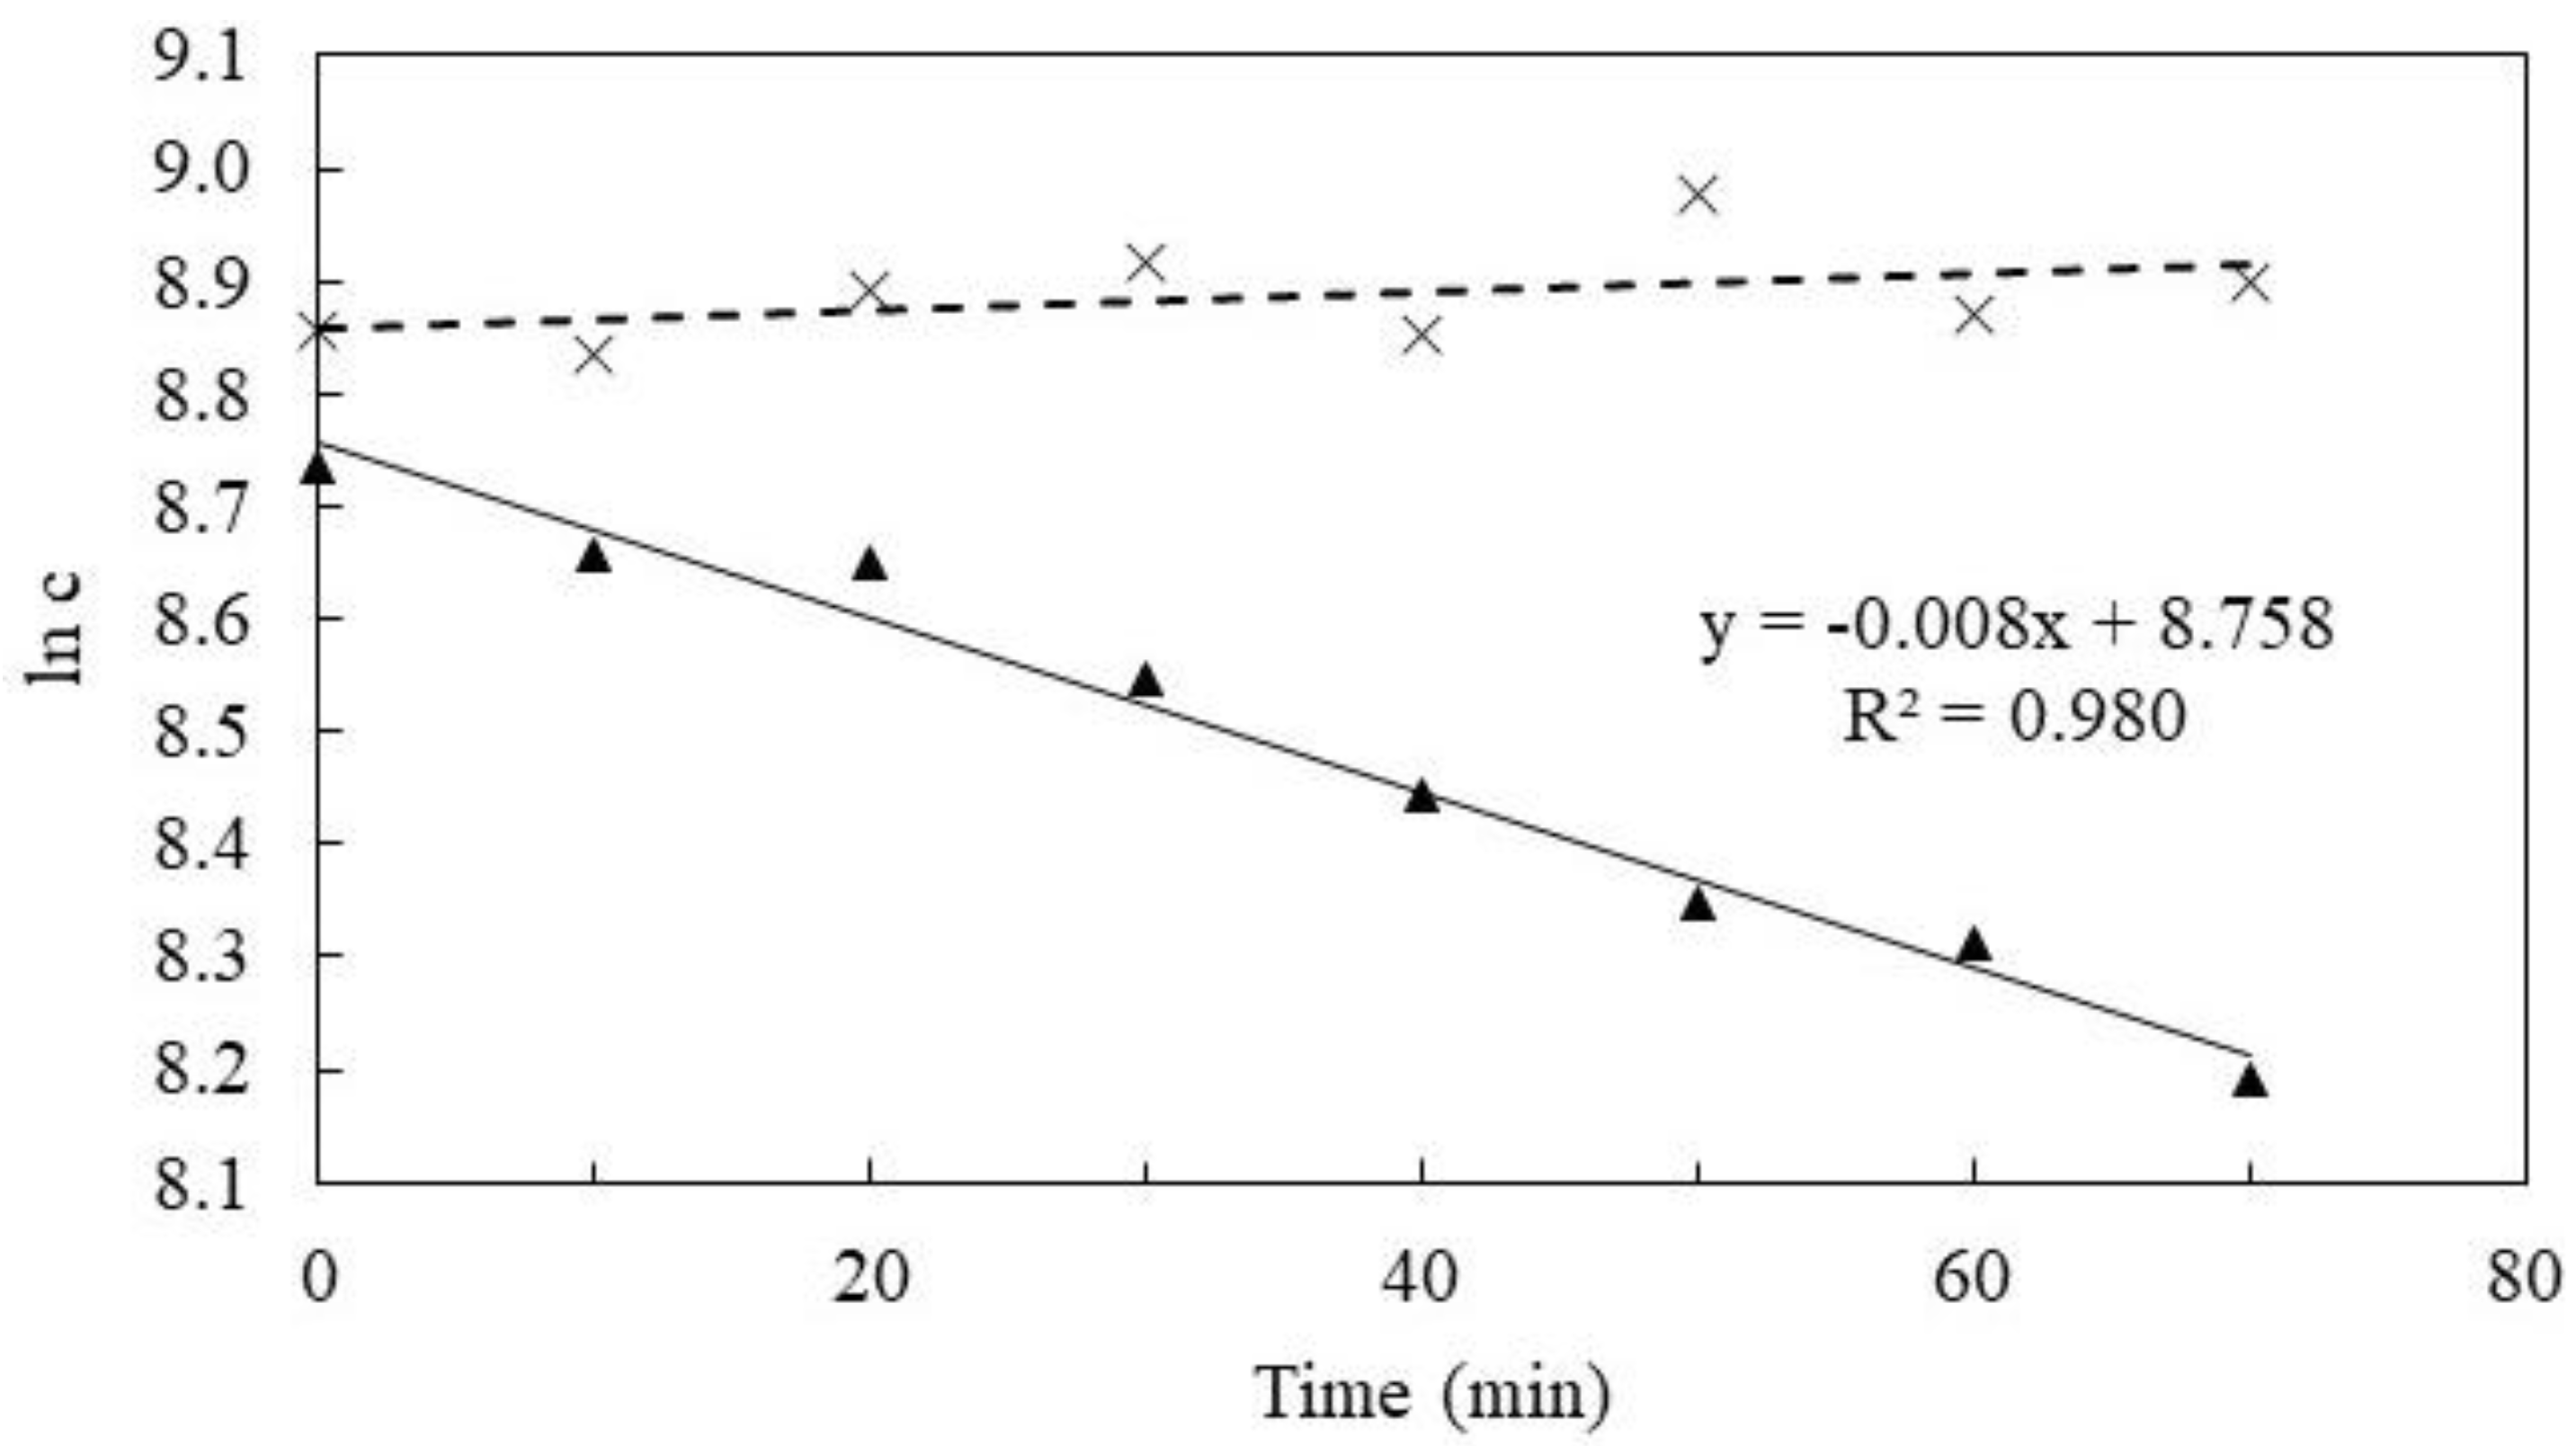
| V (mL) | Vch (mL) | c0 (Cells mL−1) | b (min−1) | OSA (mm2) | F (L h−1) | F1 (L h−1) | F2 (L h−1) |
|---|---|---|---|---|---|---|---|
| 1.0 | 250 | 6209 | 0.008 | 0.9 ± 0.4 | 0.12 | 0.08 | 0.16 |
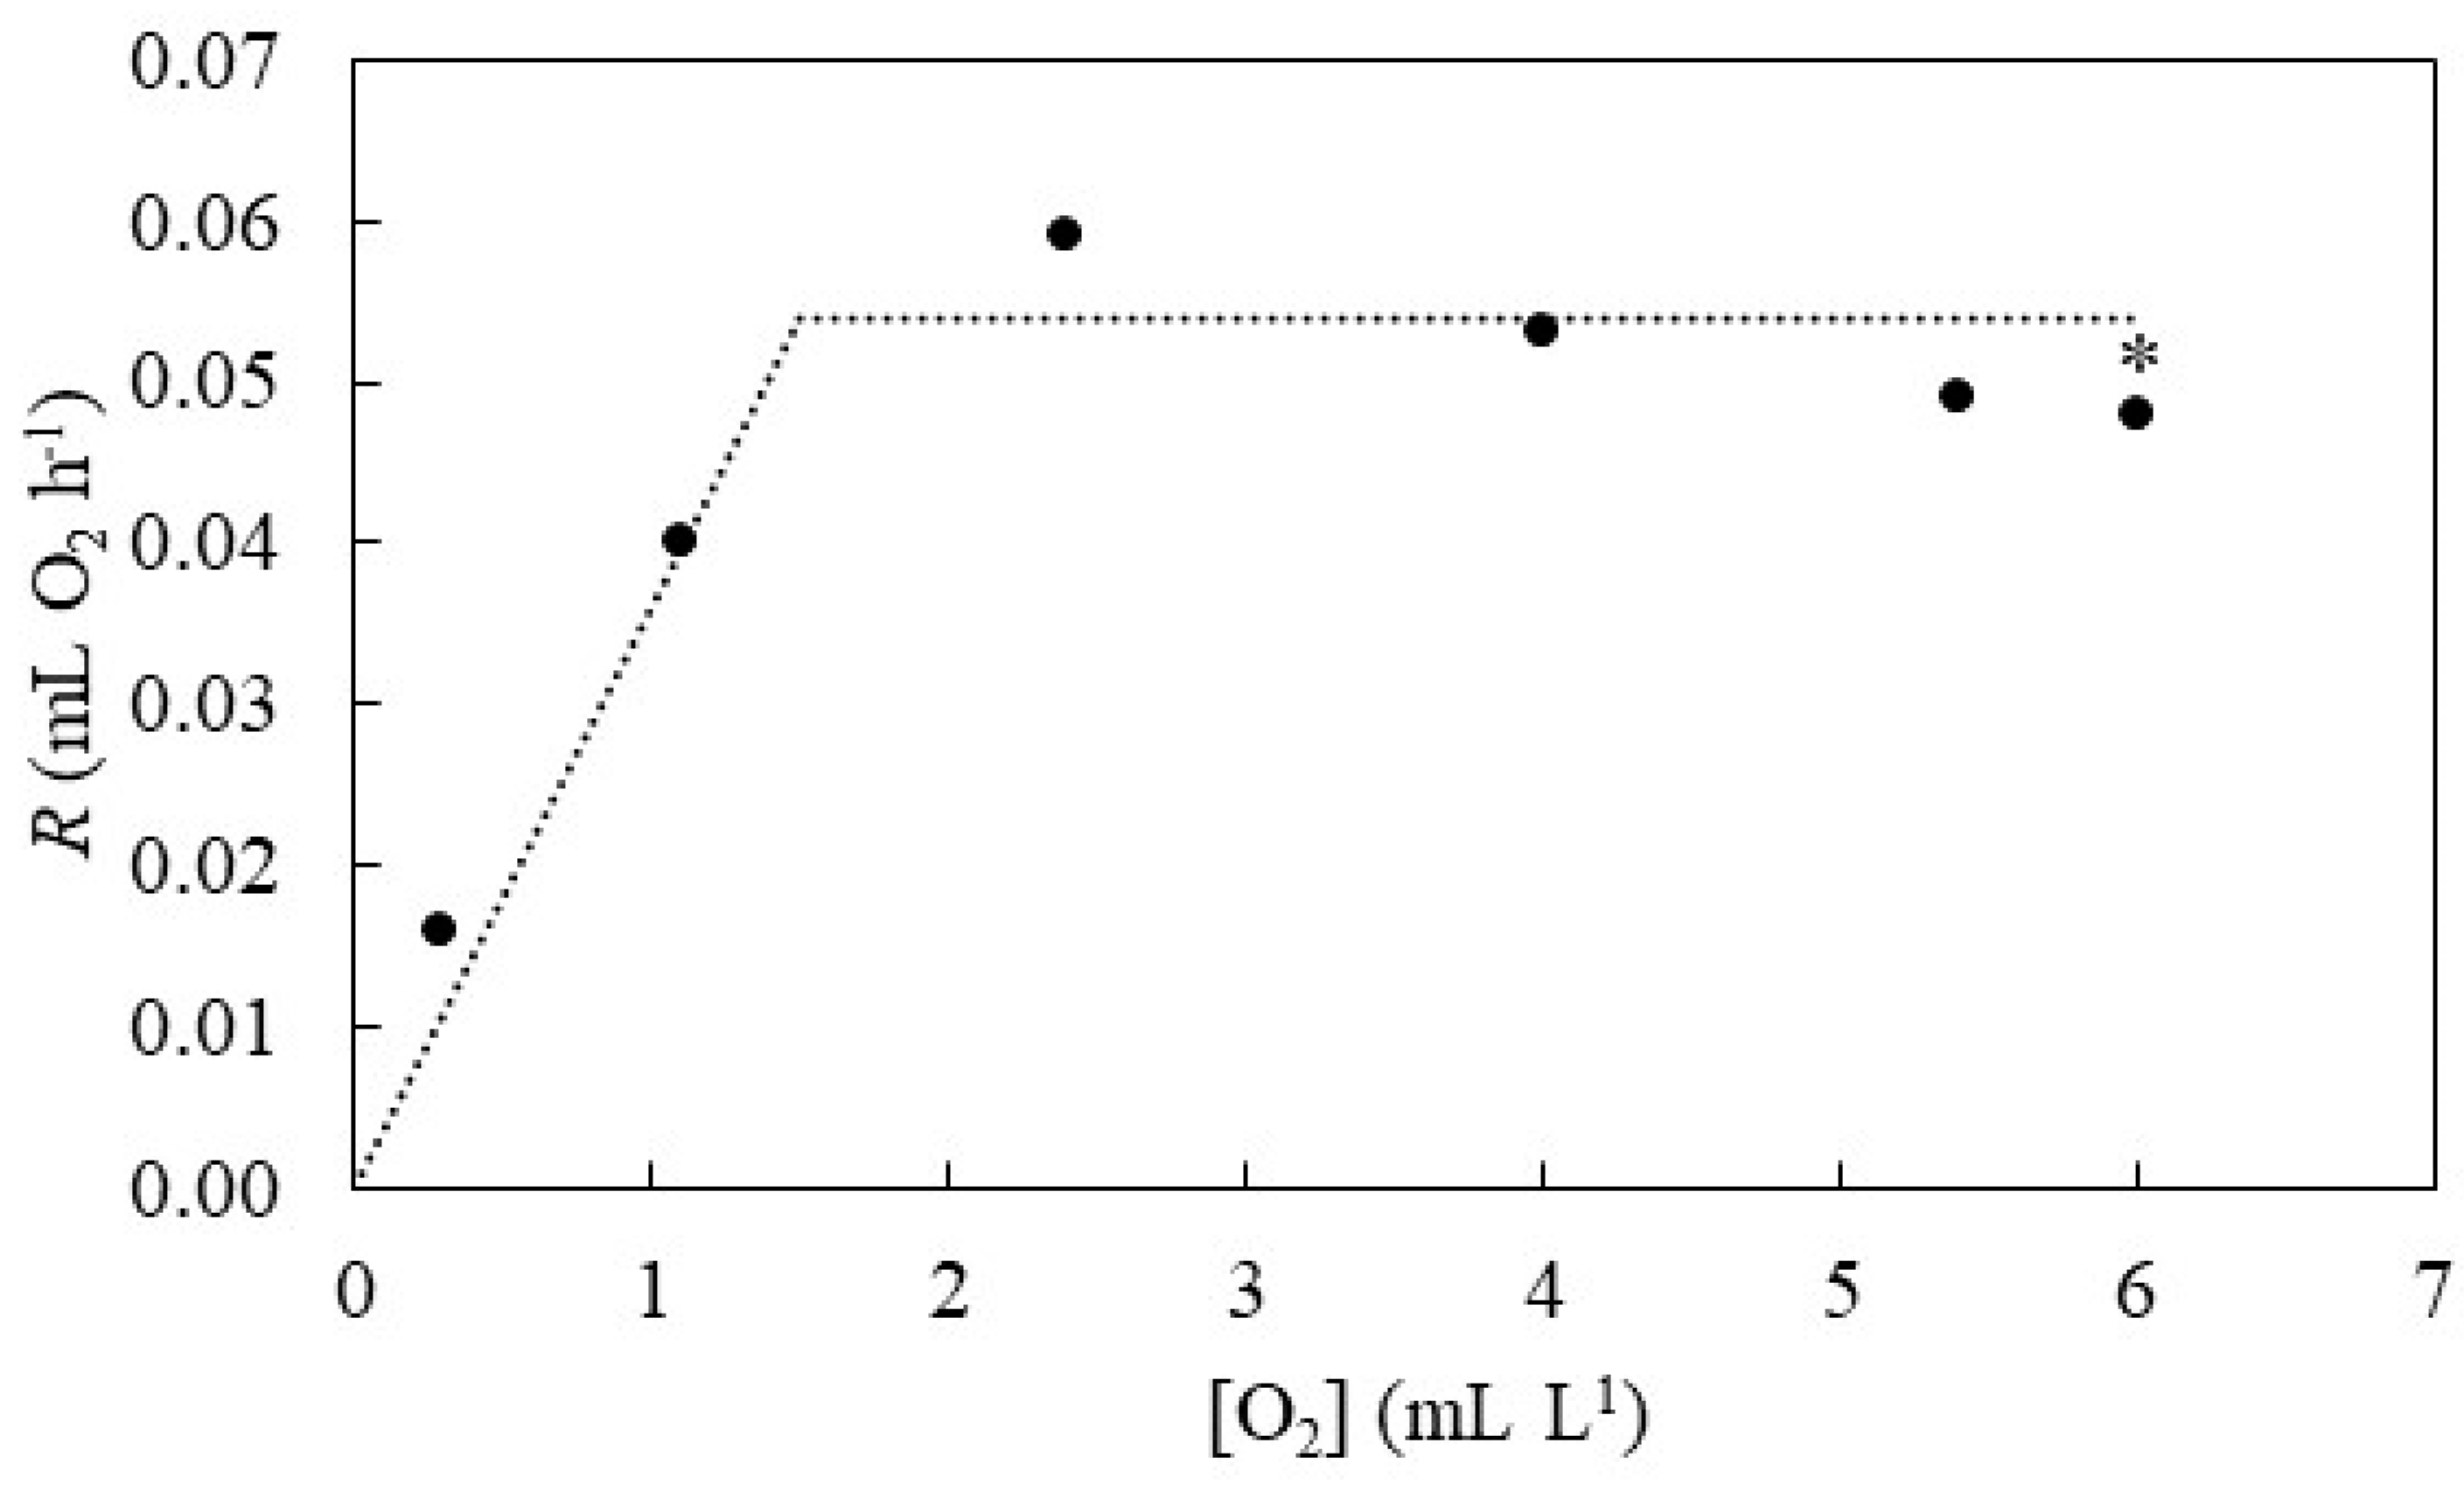
| Step # | T (°C) | [O2] (mg L−1) | (O2) (mL L−1) | (O2) (%) | b (mg O2 L−1 h−1) | R (mg O2 h−1) | R (mL O2 h−1) | F (L h−1) | F/R (L (mL O2)−1) | EE (%) |
|---|---|---|---|---|---|---|---|---|---|---|
| 1 | 15.3 | 7.7 ± 0.6 | 5.4 ± 0.4 | 85.0 ± 6.3 | 0.612 ± 0.340 | 0.070 | 0.049 | 0.12 | 2.45 | 7.6 |
| 2 | 15.5 | 5.7 ± 0.7 | 4.0 ± 0.5 | 62.9 ± 7.5 | 0.656 ± 0.093 | 0.075 | 0.053 | 0.12 | 2.26 | 11.0 |
| 3 | 15.5 | 3.4 ± 0.7 | 2.4 ± 0.5 | 37.4 ± 7.5 | 0.726 ± 0.059 | 0.084 | 0.059 | 0.12 | 2.03 | 20.5 |
| 4 | 15.6 | 1.5 ± 0.4 | 1.1 ± 0.3 | 17.0 ± 4.3 | 0.493 ± 0.154 | 0.057 | 0.040 | 0.12 | 3.00 | 30.3 |
| 5 | 15.6 | 0.4 ± 0.0 | 0.3 ± 0.0 | 4.3 ± 0.4 | 0.197 ± 0.016 | 0.023 | 0.016 | 0.12 | 7.50 | 44.4 |
Disclaimer/Publisher’s Note: The statements, opinions and data contained in all publications are solely those of the individual author(s) and contributor(s) and not of MDPI and/or the editor(s). MDPI and/or the editor(s) disclaim responsibility for any injury to people or property resulting from any ideas, methods, instructions or products referred to in the content. |
© 2024 by the author. Licensee MDPI, Basel, Switzerland. This article is an open access article distributed under the terms and conditions of the Creative Commons Attribution (CC BY) license (https://creativecommons.org/licenses/by/4.0/).
Share and Cite
Riisgård, H.U. Oxygen Extraction Efficiency and Tolerance to Hypoxia in Sponges. J. Mar. Sci. Eng. 2024, 12, 138. https://doi.org/10.3390/jmse12010138
Riisgård HU. Oxygen Extraction Efficiency and Tolerance to Hypoxia in Sponges. Journal of Marine Science and Engineering. 2024; 12(1):138. https://doi.org/10.3390/jmse12010138
Chicago/Turabian StyleRiisgård, Hans Ulrik. 2024. "Oxygen Extraction Efficiency and Tolerance to Hypoxia in Sponges" Journal of Marine Science and Engineering 12, no. 1: 138. https://doi.org/10.3390/jmse12010138
APA StyleRiisgård, H. U. (2024). Oxygen Extraction Efficiency and Tolerance to Hypoxia in Sponges. Journal of Marine Science and Engineering, 12(1), 138. https://doi.org/10.3390/jmse12010138