
Design and Optimization of PV Power Supply System for Marine Buoys


Abstract
1. Introduction
2. The Model of Solar Irradiance on the Marine Buoy
2.1. Angle Needed to Calculate Irradiance
- Declination Angle
- 2.
- Solar altitude angle
- 3.
- Solar azimuth
2.2. The Model of Tilted Surface Irradiance
3. Performance Analysis of PV Power System with the Motion of Marine Buoy
3.1. Motion Equation of the Buoy and Buoy Structure
3.2. Simulation of Buoy Motion and Analysis of Solar Irradiance
3.3. Power Generation Performance of Marine Buoy PV System Considering Buoy Motions
4. Experimental Validation
4.1. Experimental Platform
4.2. Effect on Module Output Power and Electrical Parameters
4.2.1. Effect on Power Output
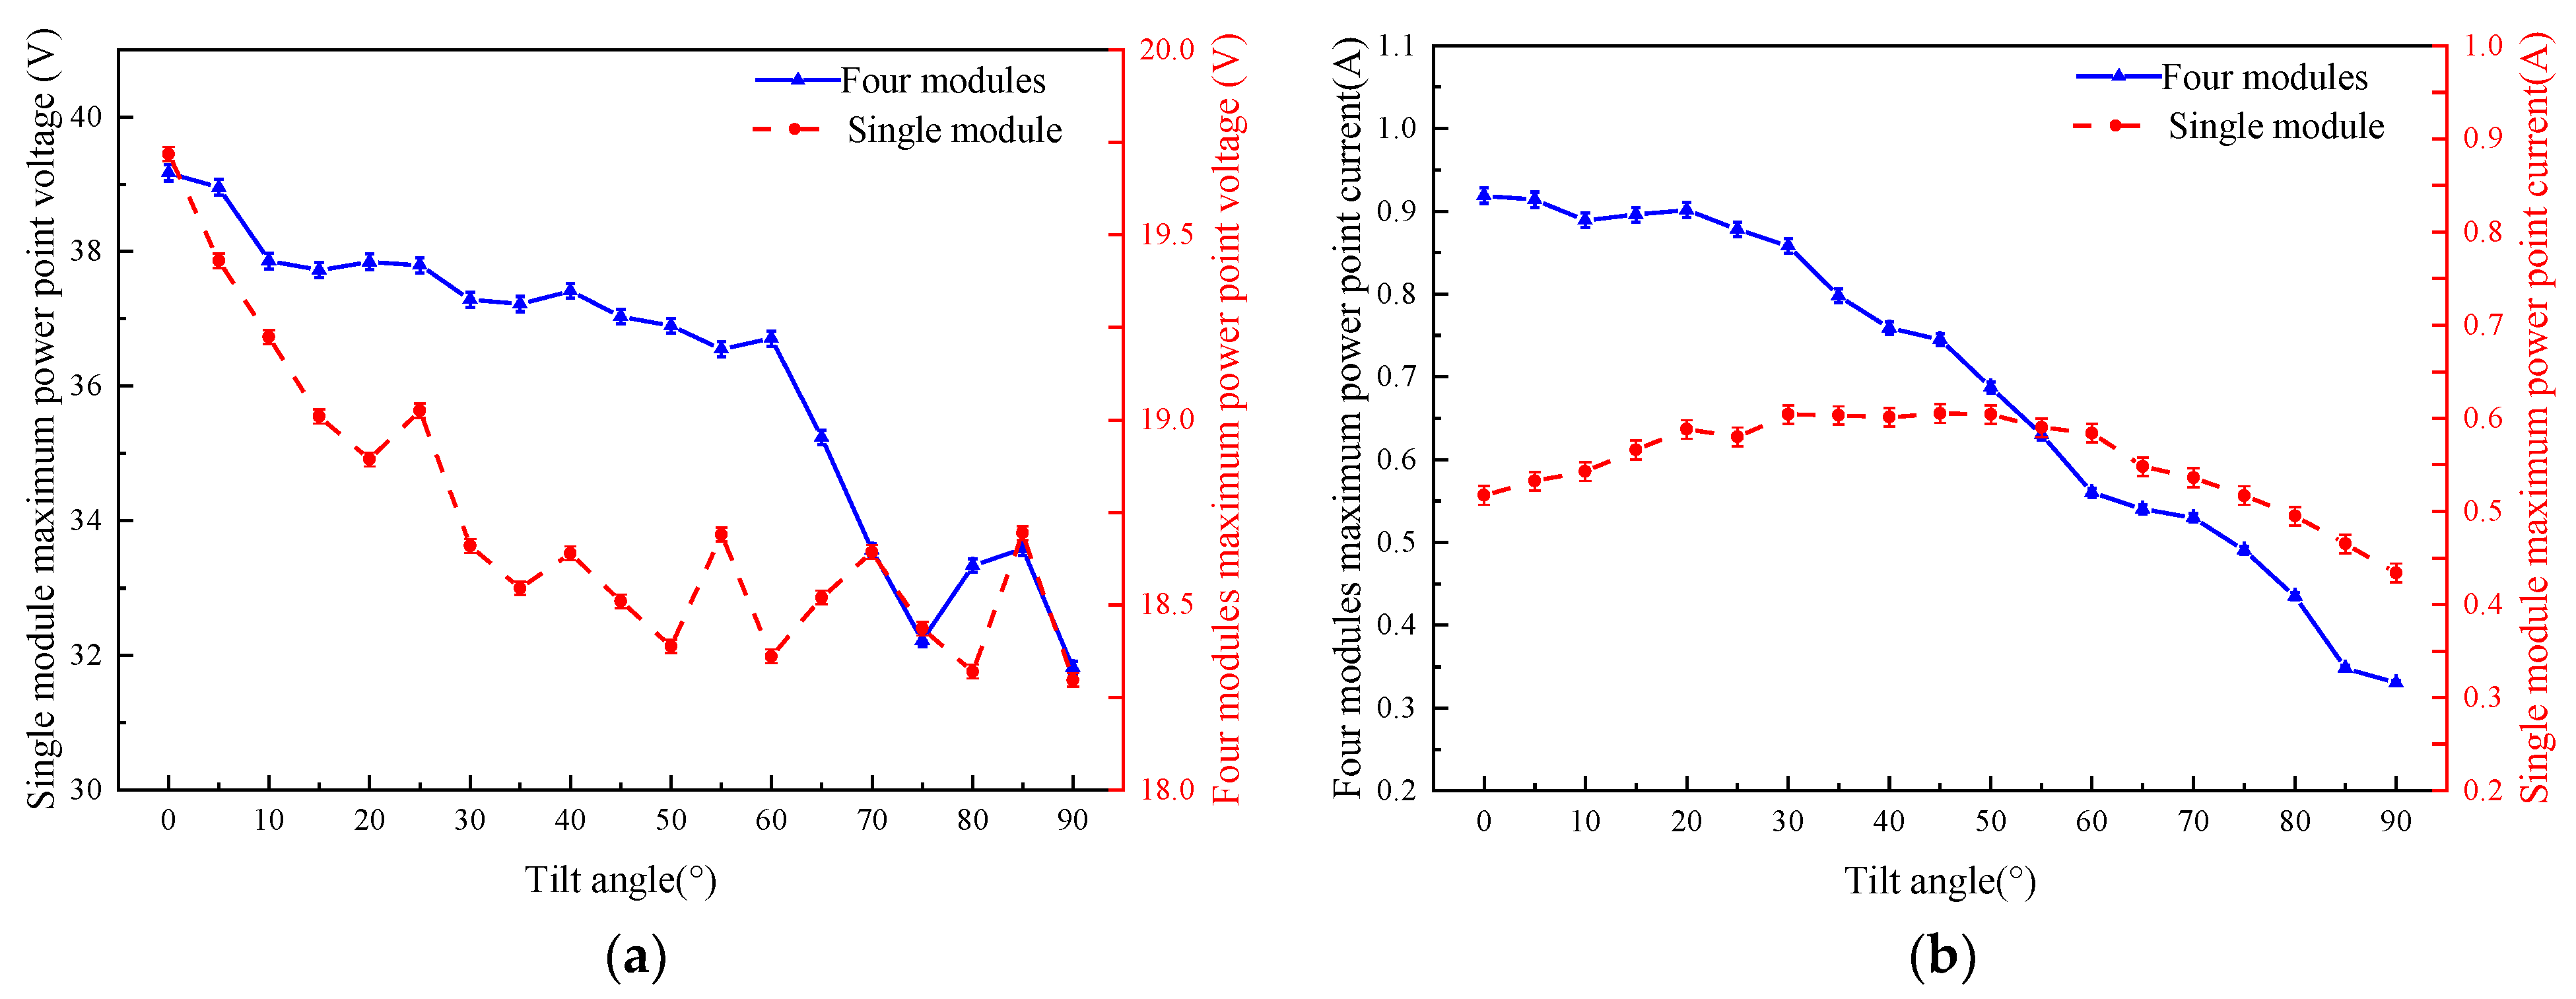
4.2.2. Effect on Module Electrical Parameters
4.2.3. Error Analysis
5. Conclusions and Remarks
Author Contributions
Funding
Institutional Review Board Statement
Informed Consent Statement
Data Availability Statement
Conflicts of Interest
References
- Xu, R.; Wang, H.; Xi, Z.; Wang, W.; Xu, M. Recent Progress on Wave Energy Marine Buoys. J. Mar. Sci. Eng. 2022, 10, 566. [Google Scholar] [CrossRef]
- Park, Y.W.; Kim, T.W.; Kwak, J.S.; Kim, I.K.; Park, J.E.; Ha, K.H. Design of Korean Standard Modular Buoy Body Using Polyethylene Polymer Material for Ship Safety. J. Mater. Sci. Chem. Eng. 2016, 4, 65–73. [Google Scholar] [CrossRef][Green Version]
- Canepa, E.; Pensieri, S.; Bozzano, R.; Faimali, M.; Traverso, P.; Cavaleri, L. The ODAS Italia 1 buoy: More than forty years of activity in the Ligurian Sea. Prog. Ocean. 2015, 135, 48–63. [Google Scholar] [CrossRef]
- Li, X.; Bian, Y. Modeling and prediction for the Buoy motion characteristics. Ocean Eng. 2021, 239, 109880. [Google Scholar] [CrossRef]
- Srinivasan, R.; Rajendran, V.; Zacharia, S.; Sudhakar, T.; Atmanand, M.A. Indigenized Indian Drifting Buoys with INSAT Communication for Ocean Observations. Ocean Eng. 2017, 145, 263–267. [Google Scholar] [CrossRef]
- Venkatesan, R.; Vengatesan, G.; Vedachalam, N.; Muthiah, M.A.; Lavanya, R.; Atmanand, M.A. Reliability assessment and integrity management of data buoy instruments used for monitoring the Indian Seas. Appl. Ocean Res. 2016, 54, 1–11. [Google Scholar] [CrossRef]
- Shaikh, F.K.; Zeadally, S. Energy harvesting in wireless sensor networks: A comprehensive review. Renew. Sustain. Energy Rev. 2016, 55, 1041–1054. [Google Scholar] [CrossRef]
- Khan, J.; Arsalan, M.H. Solar power technologies for sustainable electricity generation—A review. Renew. Sustain. Energy Rev. 2016, 55, 414–425. [Google Scholar] [CrossRef]
- Zhang, H.; Zhang, D.; Zhang, A. An Innovative Multifunctional Buoy Design for Monitoring Continuous Environmental Dynamics at Tianjin Port. IEEE Access 2020, 8, 171820–171833. [Google Scholar] [CrossRef]
- Tomisa, T.; Krajcar, S.; Pinezic, D. Multipurpose marine Buoy. In Proceedings of the 2008 50th International Symposium ELMAR, Borik Zadar, Croatia, 9 January 2008; pp. 401–405. [Google Scholar]
- Mueller, P.; Thoss, H.; Kaempf, L.; Güntner, A. A Buoy for Continuous Monitoring of Suspended Sediment Dynamics. Sensors 2013, 13, 13779–13801. [Google Scholar] [CrossRef]
- Zhou, H. Design and Research of Emergency Water Quality Monitoring Buoy System. Master’s Thesis, Tianjin University, Tianjin, China, 2020. [Google Scholar]
- Mondol, J.D.; Yohanis, Y.G.; Norton, B. The impact of array inclination and orientation on the performance of a grid-connected photovoltaic system. Renew. Energy 2007, 32, 118–140. [Google Scholar] [CrossRef]
- Bugeja, R.; Mule Stagno, L.; Branche, N. The effect of wave response motion on the insolation on offshore photovoltaic installations. Sol. Energy Adv. 2021, 1, 100008. [Google Scholar] [CrossRef]
- Golroodbari, S.Z.; Sark, W. Simulation of performance differences between offshore and land-based photovoltaic systems. Prog. Photovolt. Res. Appl. 2020, 28, 873–886. [Google Scholar] [CrossRef]
- Yadav, A.K.; Chandel, S.S. Tilt angle optimization to maximize incident solar radiation: A review. Renew. Sustain. Energy Rev. 2013, 23, 503–513. [Google Scholar] [CrossRef]
- Zhenlong, W.; Zheng, X.; Xiaoyan, H.; Zongxu, Q. Study on practical calculating models of irradiance intensity on tilted surfaces. Prog. Photovolt. Res. Appl. 2016, 37, 787–793. [Google Scholar]
- Abd Elaziz, M.; Senthilraja, S.; Zayed, M.E.; Elsheikh, A.H.; Mostafa, R.R.; Lu, S. A new random vector functional link integrated with mayfly optimization algorithm for performance prediction of solar photovoltaic thermal collector combined with electrolytic hydrogen production system. Appl. Therm. Eng. 2021, 193, 117055. [Google Scholar] [CrossRef]
- Sharma, A.; Kallioğlu, M.A.; Awasthi, A.; Chauhan, R.; Fekete, G.; Singh, T. Correlation formulation for optimum tilt angle for maximizing the solar radiation on solar collector in the Western Himalayan region. Case Stud. Therm. Eng. 2021, 26, 101185. [Google Scholar] [CrossRef]
- Zayed, M.E.; Zhao, J.; Elsheikh, A.H.; Li, W.; Sadek, S.; Aboelmaaref, M.M. A comprehensive review on Dish/Stirling concentrated solar power systems: Design, optical and geometrical analyses, thermal performance assessment, and applications. J. Clean. Prod. 2021, 283, 124664. [Google Scholar] [CrossRef]
- Cheng, C.; Chen, Z.H.; Sun, P.J. Advances in Calculation Method of the Optimal Tilted Angle for PV Array in Solar Resource Assessment. Adv. Meteorol. Sci. Technol. 2017, 7, 60–65. [Google Scholar]
- Lau, K.Y.; Tan, C.W.; Yatim, A.H.M. Effects of ambient temperatures, tilt angles, and orientations on hybrid photovoltaic/diesel systems under equatorial climates. Renew. Sustain. Energy Rev. 2018, 81, 2625–2636. [Google Scholar] [CrossRef]
- Kaddoura, T.O.; Ramli, M.A.M.; Al-Turki, Y.A. On the estimation of the optimum tilt angle of PV panel in Saudi Arabia. Renew. Sustain. Energy Rev. 2016, 65, 626–634. [Google Scholar] [CrossRef]
- Herrería-Alonso, S.; Suárez-González, A.; Rodríguez-Pérez, M.; Rodríguez-Rubio, R.F.; López-García, C. A Solar Altitude Angle Model for Efficient Solar Energy Predictions. Sensors 2020, 20, 1391. [Google Scholar] [CrossRef] [PubMed]
- Oh, M.; Kim, J.; Kim, B.; Yun, C.; Kim, C.K.; Kang, Y.; Kim, H. Tolerance angle concept and formula for practical optimal orientation of photovoltaic panels. Renew. Energy 2021, 167, 384–394. [Google Scholar] [CrossRef]
- Raptis, P.I.; Kazadzis, S.; Psiloglou, B.; Kouremeti, N.; Kosmopoulos, P.; Kazantzidis, A. Measurements and model simulations of solar radiation at tilted planes, towards the maximization of energy capture. Energy 2017, 130, 570–580. [Google Scholar] [CrossRef]
- Liu, B.Y.H.; Jordan, R.C. The long-term average performance of flat-plate solar-energy collectors. Sol. Energy 1963, 7, 53–74. [Google Scholar] [CrossRef]
- Hay, J.E. Calculation of monthly mean solar radiation for horizontal and inclined surfaces. Sol. Energy 1979, 23, 301–307. [Google Scholar] [CrossRef]
- Munkhammar, J.; Widén, J. Correlation modeling of instantaneous solar irradiance with applications to solar engineering. Sol. Energy 2016, 133, 14–23. [Google Scholar] [CrossRef]
- Yao, W.; Li, Z.; Zhao, Q.; Lu, Y.; Lu, R. A new anisotropic diffuse radiation model. Energy Convers. Manag. 2015, 95, 304–313. [Google Scholar] [CrossRef]
- Hafez, A.Z.; Soliman, A.; El-Metwally, K.A.; Ismail, I.M. Tilt and azimuth angles in solar energy applications—A review. Renew. Sustain. Energy Rev. 2017, 77, 147–168. [Google Scholar] [CrossRef]
- Sang, S.; Zhou, Y.; Jiang, X.L. Study on Nonlinear Motion Behavior of Coupled Heave-Pitch for the Classic Spar Platform Based on AQWA. Appl. Mech. Mater. 2012, 170–173, 2170–2174. [Google Scholar] [CrossRef]
- Wang, S.M.; Shi, F.B.; Lin, Z.N.; Zou, W. A Hydrodynamic Analysis of Offshore Platform Based on the AQWA. Appl. Mech. Mater. 2014, 615, 301–304. [Google Scholar] [CrossRef]
- Chen, C.; Chen, Y.; Cai, Q. Hydrodynamic-Interaction Analysis of an Autonomous Underwater Hovering Vehicle and Ship with Wave Effects. Symmetry 2019, 11, 1213. [Google Scholar] [CrossRef]
- Joseph, D.D. Potential flow of viscous fluids: Historical notes. Int. J. Multiph. Flow 2005, 32, 285–310. [Google Scholar] [CrossRef]
- Seif, M.S.; Inoue, Y. Dynamic analysis of floating bridges. Mar. Struct. 1998, 11, 29–46. [Google Scholar] [CrossRef]
- Luo, T. Modelling and Simulation of the Elamis-Type Wave Energy Converter Based on AQWA. Master’s Thesis, Harbin Institute of Technology, Harbin, China, 2015. [Google Scholar]
- García, E.; Quiles, E.; Correcher, A.; Morant, F. Sensor Buoy System for Monitoring Renewable Marine Energy Resources. Sensors 2018, 18, 945. [Google Scholar] [CrossRef] [PubMed]
- Huang, S.; Shi, H.; Cao, F.; Tan, J.; Cheng, H.; Li, D.; Liu, S.; Gong, H.; Tao, J. Experimental Study on Interaction between Degrees of Freedom in a Wave Buoy. J. Ocean. Univ. China 2019, 18, 1256–1264. [Google Scholar] [CrossRef]
- Tao, J.; Cao, F.; Dong, X.; Li, D.; Shi, H. Optimized design of 3-DOF buoy wave energy converters under a specified wave energy spectrum. Appl. Ocean. Res. 2021, 116, 102885. [Google Scholar] [CrossRef]
- Yang, R.; Yu, S. A Study on a Floating Solar Energy System Applied in an Intertidal Zone. Energies 2021, 14, 7789. [Google Scholar] [CrossRef]
- Ma, Y.; Ai, S.; Yang, L.; Zhang, A.; Liu, S.; Zhou, B. Hydrodynamic Performance of a Pitching Float Wave Energy Converter. Energies 2020, 13, 1801. [Google Scholar] [CrossRef]
- Jeong, S.; Son, B.; Lee, C. Estimation of the Motion Performance of a Light Buoy Adopting Ecofriendly and Lightweight Materials in Waves. J. Mar. Sci. Eng. 2020, 8, 139. [Google Scholar] [CrossRef]
- Duffie, J.A.; Beckman, W.A. Solar Engineering of Thermal Processes; Wiley-Interscience Publication: New York, NY, USA, 1980; pp. 1–72. [Google Scholar]
- Receveur, S.; Weiss, R.; Fingscheidt, T. Turbo Automatic Speech Recognition. IEEE/ACM Trans. Audio Speech Lang. Process. 2016, 24, 846–862. [Google Scholar] [CrossRef]
- George, A.; Anto, R. Analytical and experimental analysis of optimal tilt angle of solar photovoltaic systems. In Proceedings of the 2012 International Conference on Green Technologies (ICGT), Trivandrum, India, 18–20 December 2012; pp. 234–239. [Google Scholar]
- Adiyasuren, E.D.U.; Damba, U.-o.; Tsedensodnom, B. Comparison of Power Generation from Solar Panel with Various Climate Conditionand Selection of Best Tilt Angles in Ulaanbaatar, Strategic Technology (IFOST). In Proceedings of the 2013 8th International Forum on Strategic Technology (IFOST), Ulaanbaatar, Mongolia, 28 June–1 July 2013; pp. 519–521. [Google Scholar]
- Chowdhury, S.; Al-Amin, M.; Ahmad, M. Performance variation of Building integrated photovoltaic application with tilt and azimuth angle in Bangladesh. In Proceedings of the 2012 7th International Conference on Electrical and Computer Engineering, Dhaka, Bangladesh, 20–22 December 2012; pp. 896–899. [Google Scholar]
- Şenol, M.; Abbasoğlu, S.; Kükrer, O.; Babatunde, A.A. A guide in installing large-scale PV power plant for self consumption mechanism. Sol. Energy 2016, 132, 518–537. [Google Scholar] [CrossRef]


| Parameters | Details |
|---|---|
| Mass | 3000 kg |
| Basal diameter | 3 m |
| Height of base | 1.5 m |
| Centre-of-gravity position | 0.5 m |
| Roll inertia | 2691 kg·m2 |
| Pitch inertia | 2692 kg·m2 |
| Yaw inertia | 2497 kg·m2 |
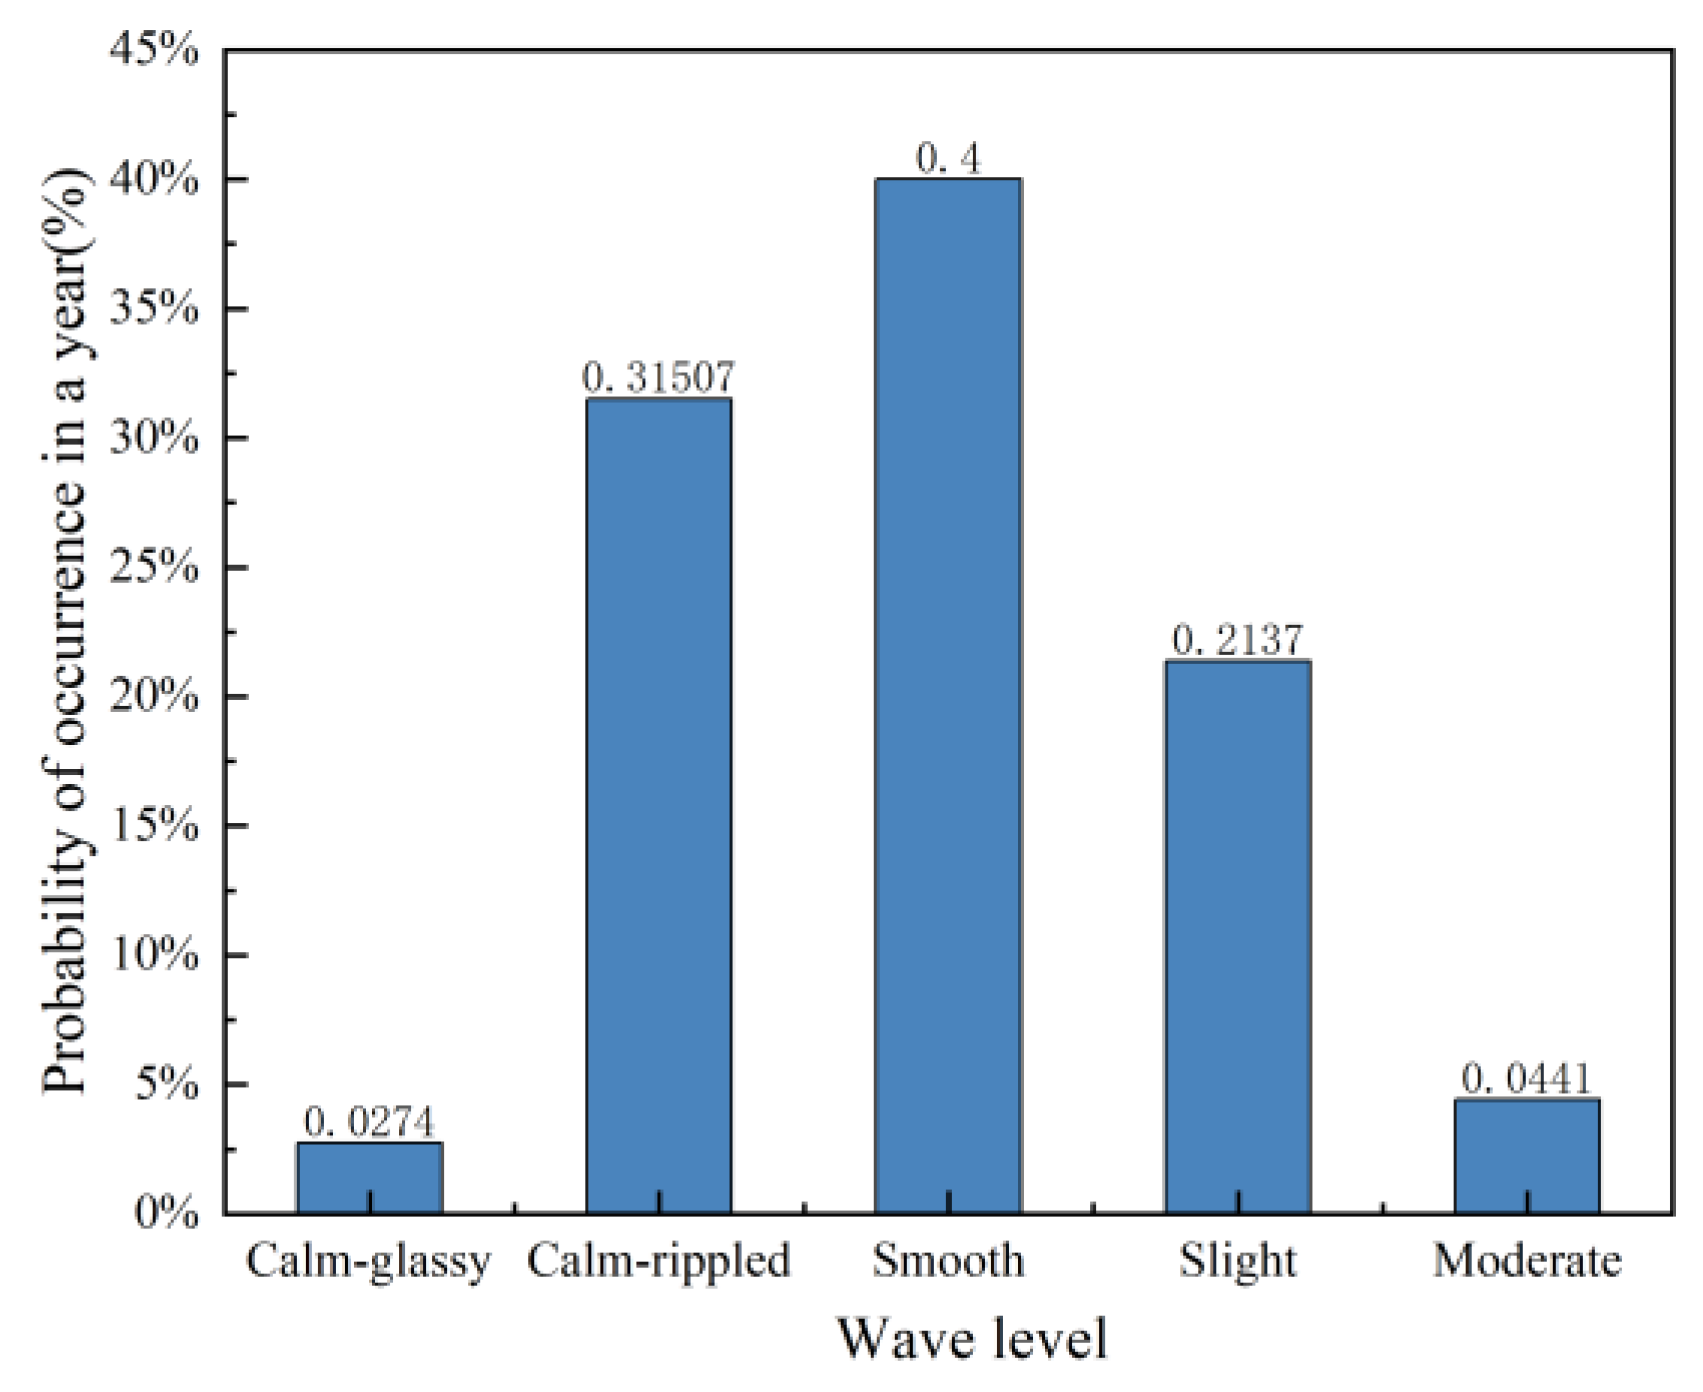
| Index | Wave Level | Average Wave Height (m) | Period (s) |
|---|---|---|---|
| 0 | calm-glassy | 0.012 | 1.2 |
| 1 | calm-rippled | 0.1 | 0.4–2.8 |
| 2 | smooth | 0.3 | 0.8–5.0 |
| 3 | slight | 0.6 | 1.5–7.8 |
| 4 | moderate | 1.2 | 2.8–10.6 |
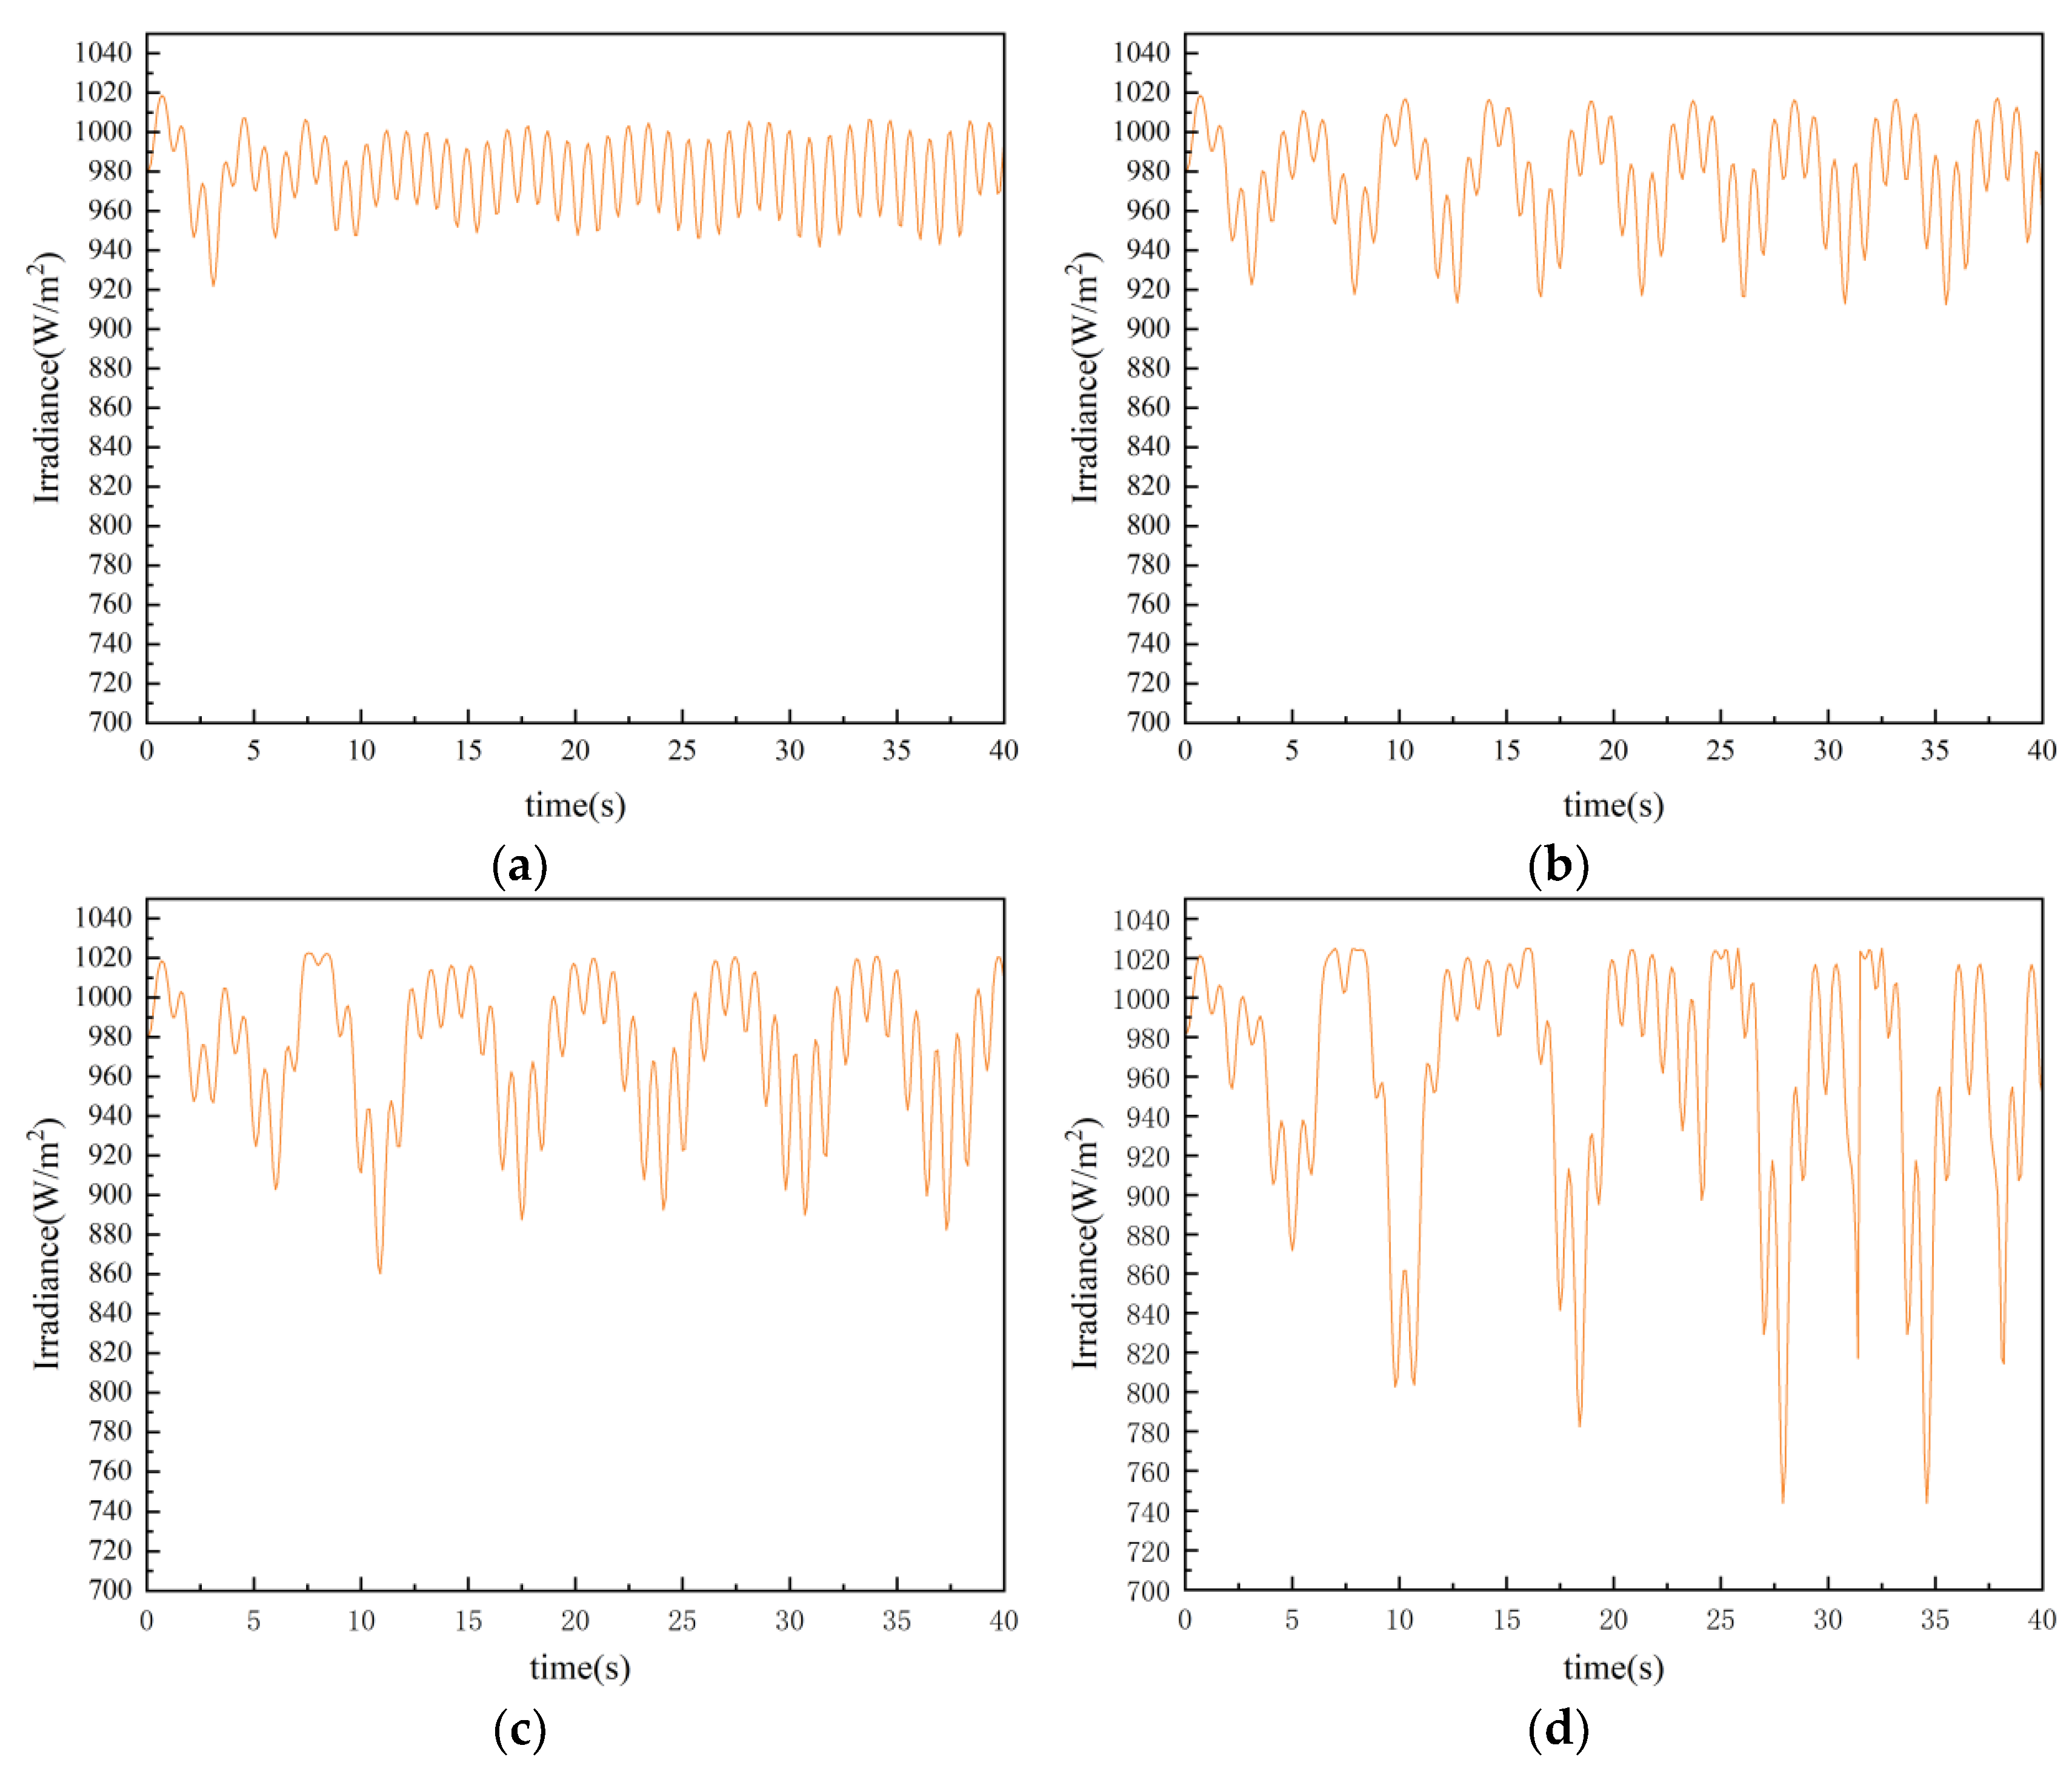
| Name of Wave | Range of Irradiance Variation (W/m2) | Average Irradiance (W/m2) |
|---|---|---|
| calm-rippled | [9481, 010] | 980 |
| smooth | [918, 1017] | 977 |
| slight | [867, 1022] | 973 |
| moderate | [751, 1019] | 959 |
| Parameters | Details |
|---|---|
| Material | Mono-crystalline silicon (m-Si) |
| Model number | AK10W-36P |
| Maximum power | 10 W |
| Operating voltage | 18 V |
| Peak current | 0.56 A |
| Open-circuit voltage | 21.6 V |
| Short-circuit current | 0.61 A |
| Weight | 0.8 kg |
| Size of the module | 350 mm 240 mm |
Disclaimer/Publisher’s Note: The statements, opinions and data contained in all publications are solely those of the individual author(s) and contributor(s) and not of MDPI and/or the editor(s). MDPI and/or the editor(s) disclaim responsibility for any injury to people or property resulting from any ideas, methods, instructions or products referred to in the content. |
© 2023 by the authors. Licensee MDPI, Basel, Switzerland. This article is an open access article distributed under the terms and conditions of the Creative Commons Attribution (CC BY) license (https://creativecommons.org/licenses/by/4.0/).
Share and Cite
Wang, C.; Song, X.; Fu, Q.; Cui, L.; Chen, P. Design and Optimization of PV Power Supply System for Marine Buoys. J. Mar. Sci. Eng. 2023, 11, 1808. https://doi.org/10.3390/jmse11091808
Wang C, Song X, Fu Q, Cui L, Chen P. Design and Optimization of PV Power Supply System for Marine Buoys. Journal of Marine Science and Engineering. 2023; 11(9):1808. https://doi.org/10.3390/jmse11091808
Chicago/Turabian StyleWang, Chunjie, Xiaodong Song, Qiang Fu, Lin Cui, and Peng Chen. 2023. "Design and Optimization of PV Power Supply System for Marine Buoys" Journal of Marine Science and Engineering 11, no. 9: 1808. https://doi.org/10.3390/jmse11091808
APA StyleWang, C., Song, X., Fu, Q., Cui, L., & Chen, P. (2023). Design and Optimization of PV Power Supply System for Marine Buoys. Journal of Marine Science and Engineering, 11(9), 1808. https://doi.org/10.3390/jmse11091808