Article

On the Possibility of Detecting Pore Pressure Changes in Marine Sediments Using Bottom Seismometer Data

1
Laboratory of Fundamental Problems of Petroleum Geophysics and Geophysical Monitoring, Schmidt Institute of Physics of the Earth of the Russian Academy of Sciences, Moscow 123242, Russia
2
Science and Technology Center of Geophysics and Mineral Resources, Moscow Institute of Physics and Technology, National Research University, Dolgoprudny 141701, Russia
*
Authors to whom correspondence should be addressed.
J. Mar. Sci. Eng. 2023, 11(9), 1803; https://doi.org/10.3390/jmse11091803
Submission received: 25 August 2023 / Revised: 12 September 2023 / Accepted: 14 September 2023 / Published: 15 September 2023
(This article belongs to the Section Geological Oceanography)

Abstract

:
This paper is devoted to the detection and analysis of overpressure zones in unconsolidated seafloor sediments using an ocean-bottom seismometer. The methodological aspects of creating a system of anomalous pore pressure zone detection in marine sediments are studied. The aim of this study is to establish the requirements for a pore pressure monitoring system necessary to successfully detect overpressure zones based on seismic response, and to analyze temporal changes in pore pressure distribution. Data from a certain offshore field are used as a basis from which to construct synthetic models of overpressure distribution in marine sediments. Synthetic models are constructed using specially developed rock physics models for unconsolidated saturated media. Seismic responses are calculated for these synthetic models to represent data that otherwise would be obtained from bottom seismometers placed on the seafloor. Resultant seismic responses are studied with respect to the detection of overpressure zones. Possibilities and limitations of bottom seismometer data are discussed. Requirements for the frequency bands of bottom seismometers are formulated based on the results that are obtained.

1. Introduction

Prediction of pore pressure is an important step during the exploration and development of hydrocarbon reservoirs. Data on pore pressure becomes essential when considering offshore reservoirs [1], where the strength of seafloor sediments is typically very low, as the consolidation process is still taking place [2]. Over- or underestimation of pore pressure can lead to various risks such as blowouts [3], submarine landslides [4], the activation of faults [5], and mud volcanoes [6]. There are risks of geohazards caused by unpredicted overpressure zones during the exploitation of hydrate-bearing sediments [7], as pressure affects the conditions of hydrate stability zones [8] and potential recovery [9].
Comprehensive overviews of overpressure-formation mechanisms suggest several scenarios [10]. According to these classifications, overpressure development can be associated either with physical, chemical, or biological processes. Physical processes include disequilibrium compaction, hydrate formation and sealing, degasification, buoyancy, hydrothermal pressuring, tectonic movement, and overpressure transfer. Depending on the mechanism, overpressure can be characterized by various features, with corresponding requirements for the accuracy of pressure prediction.
Current standard practice for characterizing marine sediments in near-seafloor zones relies on extensive coring/cone penetrometer testing, and stratigraphic correlation to seismic facies [11]. Quantitative analysis of the properties of marine sediments is generally limited to acoustic properties [12], yet geophysical data can be potentially used for the prediction of gas saturation [13,14]. While pore pressure prediction itself can provide information on fluid filtration paths [15], it can also be related to unconsolidated rock properties [16]. It is worth mentioning that overpressure zones tend to evolve with time, as suggested by both modeling [17] and field data [18].
Acoustic and seismic data remain an important source of information for pore pressure prediction in marine sediments. It has been proved that acoustic data can be used to localize overpressure zones in unconsolidated sands at low effective pressures under laboratory conditions [19]. This served as a basis for establishing a procedure to evaluate pore pressure in unconsolidated media using seismic data [20]. Inverse modelling and seismic data provided evidence of constraints on overpressure generation from disequilibrium compaction and aquathermal pressuring [21]. Different techniques of dealing with seismic data were developed to characterize marine sediments: pre-stack full-waveform inversion [22] or post-stack impedance inversion [23] are widely used for reservoir characterization and monitoring [24] Amplitude-versus-Offset analysis was proved to be consistent with other studies and models which show a seismic reflection of P-wave changes due to changes in pressure and water saturation [25]. Development of seismic data analysis and interpretation methods led to a broadening of possibilities in dealing with pore pressure: recent studies prove that seismic velocity modeling provides a reliable estimation of pore pressure even in cases featuring sediments with a complicated inner structure [26]. Shallow overpressure in consolidating submarine slopes can be successfully characterized via seismic full-waveform inversion [27].
Rock physics (RP) models, it has been proved, can infer marine in situ pore pressure [28], which results from the reported relationship between pressure and unconsolidated sediments’ properties even in conditions of disequilibrium [16]. Our previous study [29] compared pore pressure prediction through rock physics modeling and consolidation analysis. Consolidation analysis was found to be more suitable for the localization of tight intervals with considerable overpressure, while rock physics modeling provides more averaged estimates. Nevertheless, rock physics modeling is of a statistical nature, so it can be used for the construction of different models with similar effective properties. Furthermore, different models can be used to synthesize sets of input data for seismic analysis, including time-lapse seismic models [30]. To sum up, modern achievements in seismic data analysis and rock physics modeling provide a solid basis for pore pressure evaluation in unconsolidated seafloor sediments.
Furnished with these possibilities, the next natural step in the development of pore pressure prediction techniques could be associated with planning seismic surveys. Given our understanding of the requirements for seismic data quality and the typical scenarios for overpressure zone generation and evolution in unconsolidated seafloor sediments, we are capable of constructing a series of rock physics models. These rock physics models can be used to establish synthetic seismic data sets corresponding to different scenarios for overpressure zone formation. Subsequently, these synthetic models can be analyzed through Amplitude-versus-Offset or full-waveform inversion to localize and evaluate overpressure zones. The reliability of the obtained results can be clearly defined via a comparison between the initial data on pore pressure distribution used for the rock physics modeling and the results of seismic data analysis. This procedure provides an opportunity to define requirements for seismic surveys. In the current paper, we carry out this procedure based on recently published results [29].
Seismic signatures associated with pore pressure anomalies, and especially with pore pressure temporal changes, may be small as compared with the variability of the signal originating from the geological formation and even with seismic noise. It is known that bottom seismometers provide better results in the seismic monitoring of reservoir changes during hydrocarbon development, as compared with floating seismic streamers, due to the lower noise and vector nature of the recorded data. Most of the currently commercially available bottom seismometers are designed for hydrocarbon exploration and reservoir monitoring, while pore pressure studies in the shallow subsurface possess different technical requirements for the equipment they use, specifically regarding the frequency band. One of the major goals of the current research is to evaluate the possibility of using modern bottom seismometers to uncover the presence of pore pressure anomalies in shallow subsurface formations, along with their temporal changes, and to formulate the basic requirements for the corresponding sensors and registration systems. The main focus of the paper is unconsolidated seafloor sediments at relatively low depths not exceeding 50 m below the seafloor.
This paper is structured as follows. Section 2 provides an overview of the initial data for analysis, a description of rock physics models used to construct synthetic sets of seismic data corresponding to various distributions of pore pressure, and the construction of these seismic models themselves. Section 3 contains rock physics and seismic modeling results. These results are analyzed with respect to the planning of offshore seismic surveys in Section 4; in particular, the sensitivity and reliability of seismic data analysis results is discussed

2. Materials and Methods

2.1. Initial Data Overview

This study is carried out with data published in the previous paper in the series [29]. The data used for analysis is obtained from an area located in the northwestern part of the Black Sea within the Kerch–Taman shelf. In the west, it is limited by the meridian of the southern tip of the Crimea; in the northwest, by the Crimean, and in the east, by the Caucasian coast of the Krasnodar Territory. A considerable tectonic feature of the area is the Kerch–Taman trough, which includes the Taman Peninsula, the southeastern part of the Kerch Peninsula and the adjacent Kerch–Taman shelf of the Black Sea.
A number of exploratory wells were drilled in the area following the completion of marine seismic exploration surveys, as the area was considered to have potential for hydrocarbon deposits [31]. Indeed, commercial hydrocarbon inflows were obtained from Maikop deposits [32,33].
Seismic surveys were carried out in the studied area for a period of time. As of now, 2D multichannel reflection (very high resolution) seismic data are available. The frequency range of the seismic data was from 100 to 600 Hz, with a central frequency of 250 Hz. The range of offsets was from 50 to 250 m, which facilitated a range of incident angles of reflected P-waves from 5 to 45° in the near-surface. The maximum propagation depth of the seismic survey was about 400 m, and the vertical resolution of the resulting seismic images was about 2–5 m [29]. A limited number of engineering wells were drilled at the site, with a number of sediment samples extracted from depth intervals between 0 and 50 mbsf. Note that water depth is as low as 90 m at the site. The samples were subjected to geomechanical studies in the laboratory, providing information on static and dynamic elastic moduli and strength properties. Low strength and typical stress vs. strain loading curves suggested that the studied samples were in a disequilibrium compaction state; fluid pressure affects mechanical properties of the seafloor sediments a great deal [16].
Thus, the current study is mainly focused on analyzing local anomalies in pore pressure at relatively low depths not exceeding 50 mbsf. Data on laboratory experiments, and the results of pre-stack seismic data inversion on the available 2D reflection seismic datasets, were combined to evaluate the mechanical properties and porosity of sediments along a certain projected well trajectory to evaluate drilling risks [29]. Figure 1 summarizes these data, that were subsequently used to estimate pore pressure distribution.
Data shown in Figure 1 were used in [29] to evaluate the potential profile in pore pressure along the projected well trajectory through two methods, consolidation analysis and rock physics modeling.
Consolidation analysis mostly utilizes the porosity log [34]. Consolidation analysis considers a specific level of preconsolidation stress as a parameter corresponding to the deformation processes that have taken place in the sediments under consideration. This term was proposed to describe the maximum vertical effective stress that the soil has been subjected to during the history of its elastic and elastoplastic deformation [35]. Specific laboratory experiments based on reconsolidation of extracted samples were developed by various researchers [36,37].
In general, the following dependency for pore pressure Ppor can be found [29,34]:
Ppor(z) = SV(z) − 10−(e(z)−e0)/Cc,
where e0 is void ratio at a vertical effective stress of unity (1 MPa), e(z) is void ratio profile (which can be easily recalculated from porosity log), Cc is specific compression index describing deformation along the yield surface, SV is total stress (measured in MPa to constrain consistency in units that emerges from the assumption that void ratio is proportional to the log of effective stress [34]), z is depth below seafloor. If the sea depth is known alongside the density profile, the total stress can be obtained as:
S V ( z ) = ρ w g h w + 0 z ρ ( z ) g d z ,
where, ρw is water density, hw is sea depth, and ρ(z) is estimated density profile. Generally, two independent measurements of pore pressure are necessary for successful application of Equation (1) for pore pressure prediction, as e0 and Cc can be considered as two fitting parameters in a case when no specific experiments can be performed to find their values. It should be kept in mind that these parameters can be obtained from consolidation tests as discussed in some studies [34,37]. One of these measurements was completed during engineering drilling at the site: drilling was characterized by an intensive gas leak visible at sea surface level when a specific depth interval was drilled. Given the known depth of drilling, the sea depth at the drilling site and the intensity of the leak, an evaluation of pore pressure at the layer was completed: pore pressure in the gas-saturated zone at a depth of 20 mbsf was proved to be 1.2 MPa. The second fitting point was hydrostatic evaluation of pore pressure at seafloor. Parameters Cc and e0 were evaluated for the considered site as 0.18 and 0.88 respectively [29]. The analogous values for the Gulf of Mexico were reported to be Cc = 0.54 and e0 = 0.47 [34].
Rock physics modeling can deal with pore pressure evaluation procedure in a different way. The well-known soft-sand model of Mavko et al. [38], combined with Gassmann’s fluid substitution [39], was used to evaluate pore pressure. The pore pressure enters the soft-sand model formulas as a parameter along with the elastic moduli of solid grains, porosity, number of grain–grain contacts, and so-called critical porosity (a more detailed description of the model parameters is given in the next section). Some of the model parameters, including the pore pressure, were unknown. The unknown parameters were estimated with the help of an N-dimensional mesh method (N is the number of unknown parameters in the model). According to this method, first, for each parameter a range of its possible variations is specified. Then, all ranges are divided into intervals. The division points serve as nodes for the so-called N-dimensional mesh. Each node contains a set of parameters. The forward problem is solved for each node. Then, the parameters of the nodes which provide an acceptable agreement between theoretical and experimental elastic wave velocities experimental data are selected as solutions. Many sets of the model parameters can be obtained for a single pair of P- and S-wave velocities. Among many solutions, we choose a solution with the pore pressure value close to a reference one at a certain depth. Unfortunately, only one reference depth was available where the pore pressure was experimentally measured. Then, we fixed all the unknown parameters, setting them to those found at the reference depth. Then, we again applied the N-dimensional mesh method to find a distribution of only a single unknown parameter along the studied well: namely, the pore pressure.
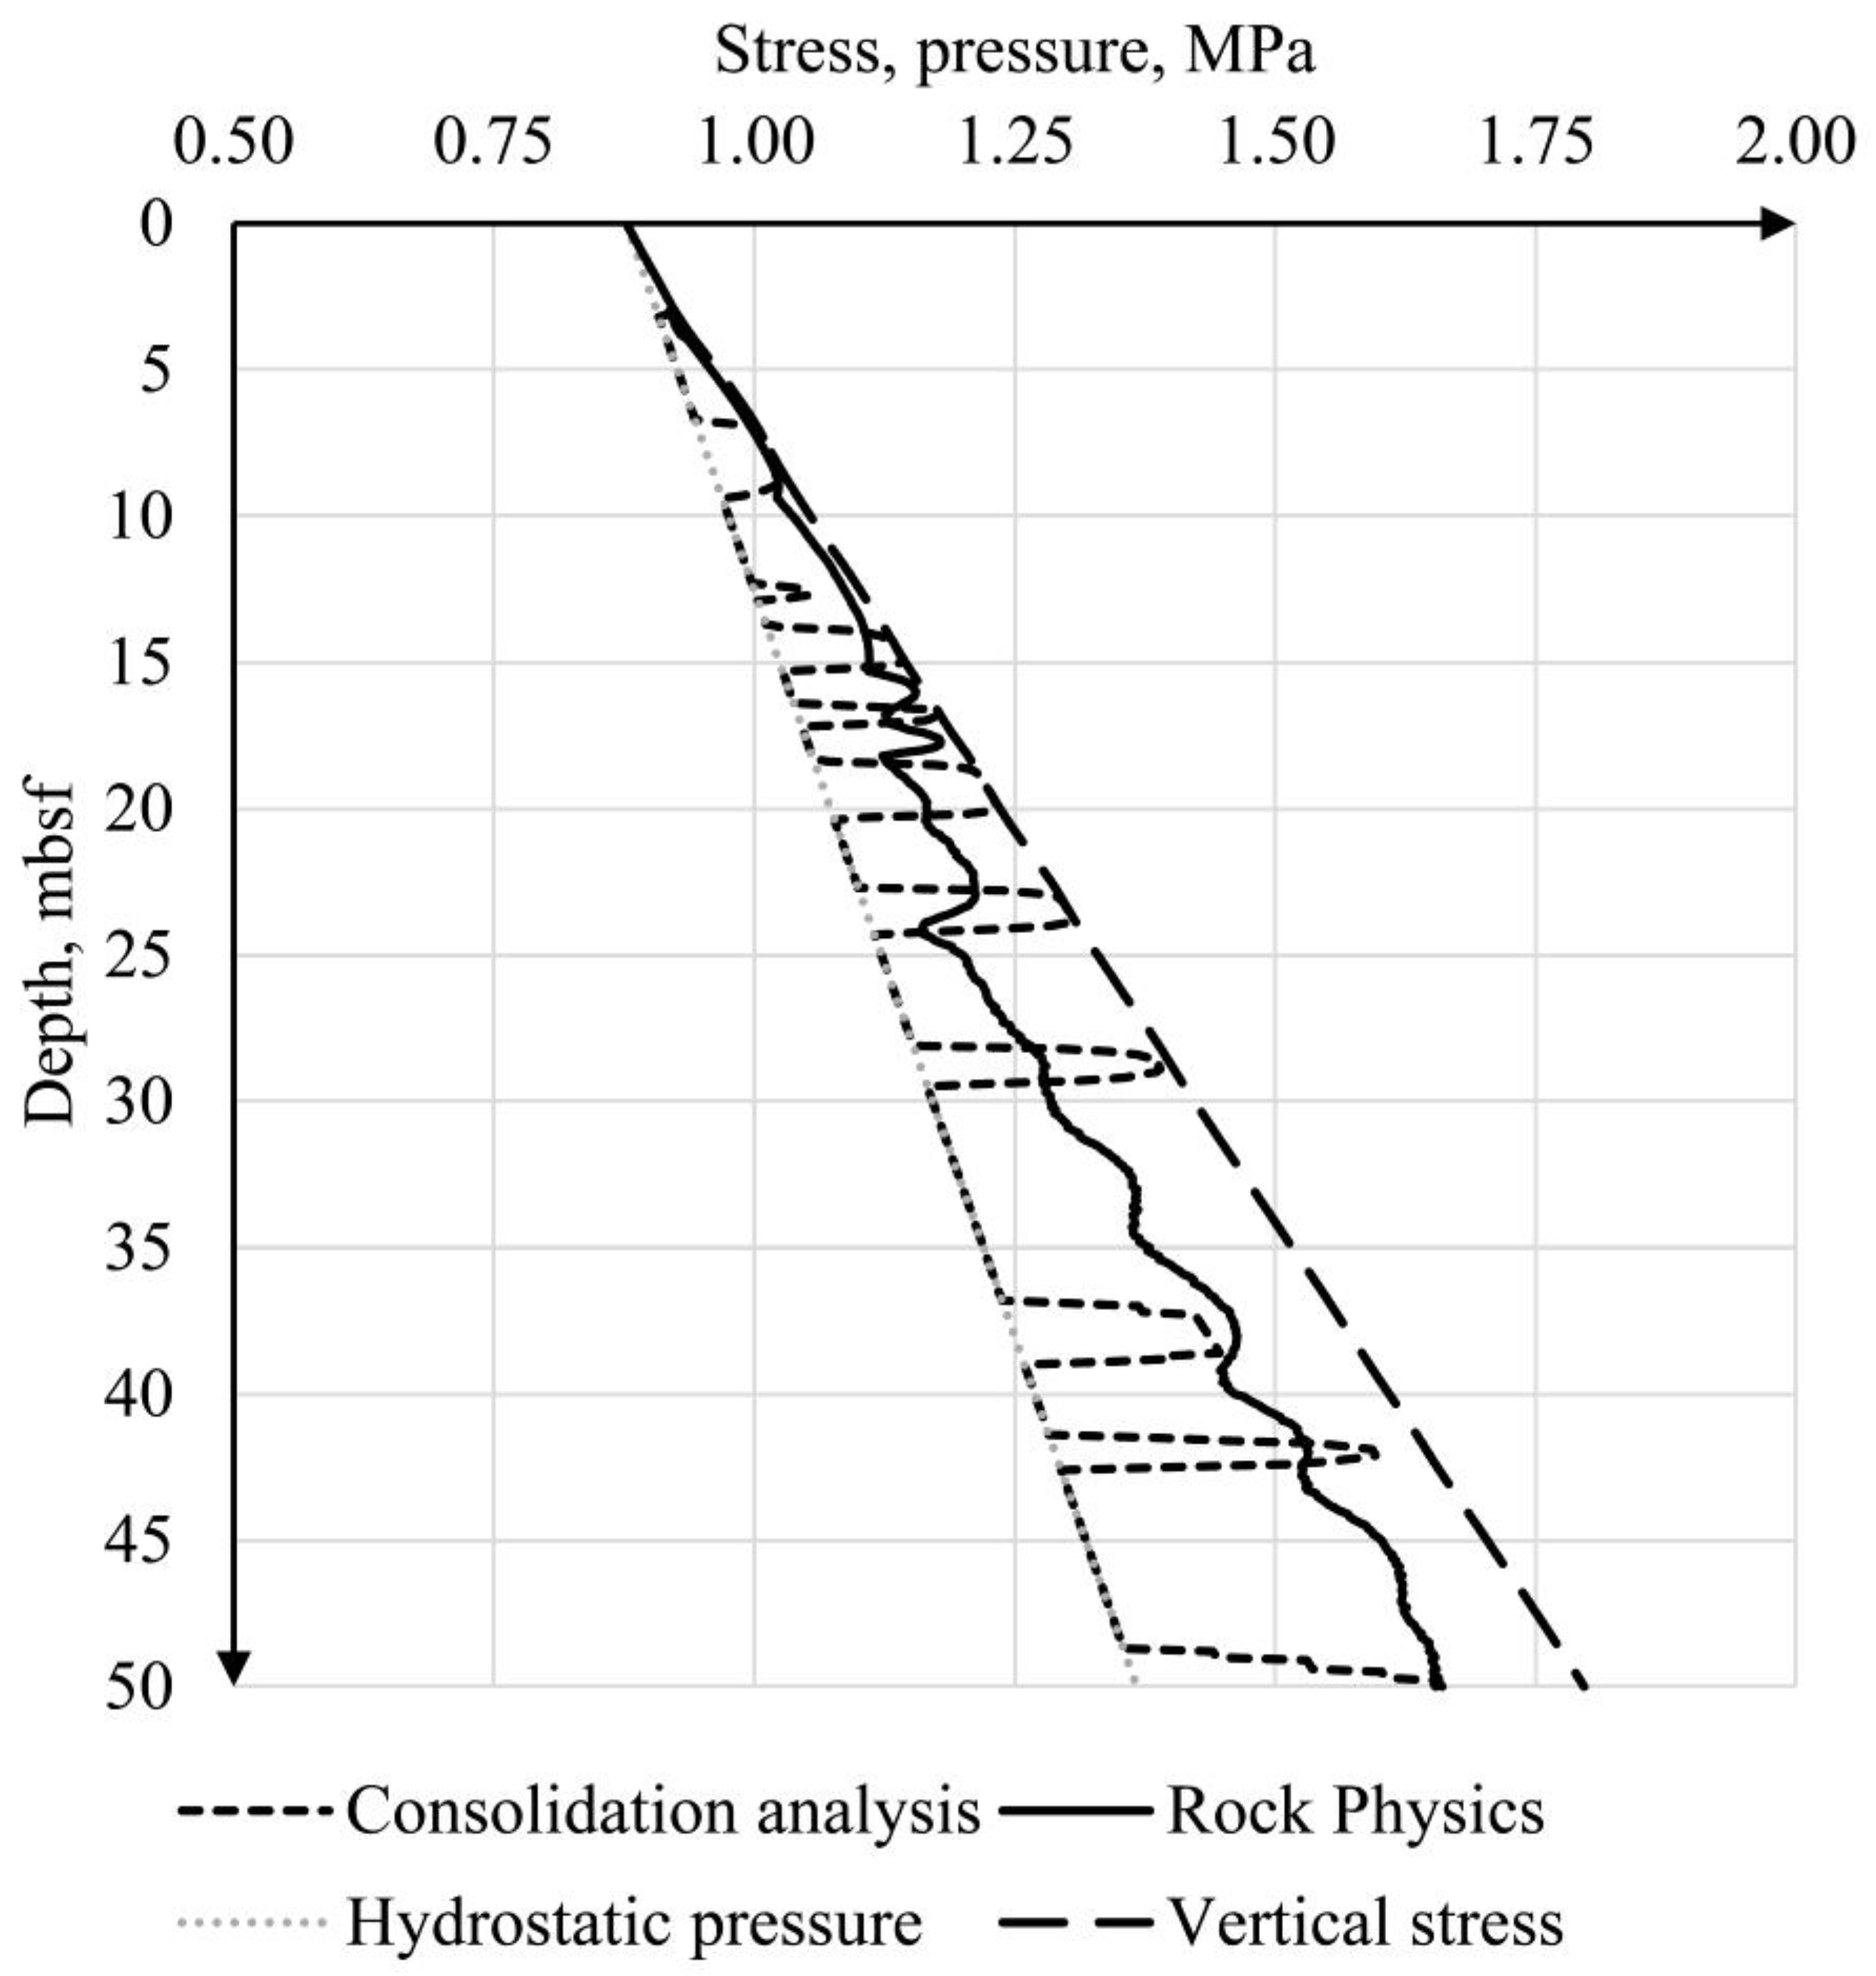
Both approaches were used to construct a one-dimensional model of pore pressure along the studied well. Figure 2 summarizes the pore pressure prediction procedures described in [29]. The solid black line stands for the results of rock physics modeling and the black dotted line reveals the consolidation analysis approach. The figure also contains total vertical stress calculated via Equation (2) as a dashed black line and hydrostatic pressure as a dotted grey line. Discussion of these results can be summarized as follows: generally, rock physics presents a more conservative approach, revealing a general overpressure tendency along the trajectory with indistinct local peaks. By contrast, consolidation analysis highlights the local peaks in pore pressure, so it is mostly aimed at the localization of distinct overpressure zones rather than on providing a general evaluation of overpressure.
Overpressure in marine sediments studied in the current research can be quite low if compared to hydrostatic pressure in absolute values. Nevertheless, the ratio between overpressure and hydrostatic is worthy of note, as pore pressure in several zones becomes almost twice that of hydrostatic pressure. Thus, we consider any zone with a pore pressure to hydrostatic ratio higher than one as an overpressure zone.
These data were used in the current research to create a series of synthetic models for pore pressure distribution. Figure 2 provides a general understanding of the type and level of anomalies in pore pressure in the area of interest. The rock physics approach provides an opportunity to construct synthetic data on properties of the seafloor sediments in the studied depth interval with respect to slight modifications of pore pressure, such as changes in number of anomalous zones, depth intervals with anomalous zones, and degrees of overpressure.

2.2. Modeling of Effective Elastic Properties in Unconsolidated Sediments

As was mentioned above, a goal of this study is the planning of seismic surveys aimed at localizing zones with increased pore pressure. In order to solve this problem, a knowledge of the effects of pore pressure effect on elastic wave velocities is necessary. This can be provided by rock physics modeling. Among RP methods, a group of methods suitable for granular media makes this approach possible. The majority of these methods are based on the classical Hertz–Mindlin (HM) approach that relates the effective elastic moduli of a dry random pack of identical spherical grains with the porosity, elastic moduli of grains; number of contacts for a grain with other grains; and pressure applied to the granular medium [40]. The formulas for this method are presented in Appendix A. As related to unconsolidated marine rocks, the pressure entering the HM approach formulas is the effective pressure equal to the difference between the total vertical stress and pore pressure.
In geophysical practice, in order to produce a better coincidence with the experimental data, different modifications of the HM approach based on combinations with Hashin–Shtrikman (HS) bounds [41] are used [42]. In these modifications, a notion of critical porosity φc is introduced. The critical porosity is the porosity above which a rock becomes unconsolidated. The critical porosity of different rocks depends on their inner structure (grain and pore shape) and varies in a wide range from 5 to 90% [38]. Commonly, for modeling, the critical porosity value is chosen to be 30–40%. However, sometimes greater values of the critical porosity (e.g., 76%) allow one to obtain a good agreement with experimental data [29]. If the rock porosity is smaller than the critical value, the following model is considered [43]. The granular medium of porosity φc plays a role of host medium for spherical particles of a mineral polycrystal (nonporous). This model is called the soft-sand model. If the rock porosity φ is greater than the critical value, spherical voids are placed in the granular host matrix. In both cases, the effective elastic moduli are calculated as the respective HS bounds (lower or upper) of two-component medium consisting of the host granular medium and inclusions (solid nonporous spheres for φ < φc and voids for φ > φc). In such a model, first, the elastic moduli are calculated for the dry case. Then, Gassmann’s fluid substitution is applied [39]. Knowing the effective elastic moduli and density of the saturated rock, the compressional and shear elastic wave velocities (Vp and Vs) can be calculated. Formulas for calculating the HS bounds and elastic wave velocities are presented in Appendix A along with the Gassmann’s method formulas.
In this work, we follow the idea described above and apply another RP model compared to a version of the soft-sand model used in [29]. We choose a critical porosity value equal to 60% instead of 76%; apart from Dvorkin’s model, if φ > φc, voids are supposed to be filled with the suspension instead of pure fluid. The elastic moduli of the suspension are calculated as the low HS bound. In the case of φ < φc, spherical particles of consolidated porous material (instead of particles of nonporous polycrystal in Dvorkin’s soft-sand model) are inserted in the granular host matrix. For calculation of the effective moduli of the consolidated porous material, we use Berryman’s self-consistent method [44]. In the modeling, we introduce a coefficient for the porosity increase in suspension, or its decrease in consolidated porous material, as compared to the total porosity. We call it the “porosity correction coefficient”. We also use the term “additions” for the suspension and consolidated porous material. We control the volume concentration of porous additions (suspension or consolidated porous material) in the granular host matrix by the total porosity value. Below, we call this model the new RP model.
As follows from the results presented in [45], a dependence exists between the porosity of granular medium and coordination number n entering Formula (A1). This dependence can be presented in the form n = 22.984·exp (−2.554·φ) (the porosity is in fractions of a unit). For porosity varying from 27 to 67% (see Figure 1), the coordination number drops from 11 to 4, averaging 6. For porosity of 37% (critical porosity), the coordination number is 9. However, if the grains are not well sorted and have an irregular shape, the coordination number can be greater. The considered marine sediments are clayey and contain organic impurities. The clay particles are highly non-isometric, as are some kinds of organic particles. Therefore, in our model, we chose an increased coordination number: namely, 18. In this case the theoretical velocities Vp are in a good correspondence with experimental ones [29] that vary from 1.5 to 2.0 km/s. Note that in real rocks such parameters like critical porosity and coordination number can be considered as adjustable (fitting) parameters due to the reasons mentioned above. This situation is similar to the RP modeling of consolidated rocks based on Eshelby’s solution, when the shape of mineral grains, voids, and other inclusions is represented by ellipsoids of revolution (of course, they are not ellipsoids in reality) whose shape is parametrized by an aspect ratio.
To analyze the effect of pore pressure on the elastic moduli, we vary its value between hydrostatic pressure and total vertical stress using the formula
Ppor = Phydr + diff_p × A,
where diff_p is the difference between the total vertical stress and hydrostatic pressure and A is a factor ranging from 0 to 1. If A = 0, the pore pressure is equal to hydrostatic (no anomalies in the pore pressure). In the other limiting case (A = 1), the pore pressure approaches the total vertical stress and the situation becomes dangerous.

2.3. Synthetic Seismic Data

We apply the conventional convolution seismic trace model, specifically:
s(t) = f(t) ∗ r(t),
where s(t) is the seismic trace, f(t) is the seismic source signature, and r(t) is the reflectivity that is computed from seismic velocities and density using the Aki–Richards approximation of the Zoeppritz equation [46].

3. Results

3.1. Effective Properties Modeling

Initial data for the RP modeling were taken from our previous work [29]. These data are the density distribution along a wellbore and grain density that is equal to 2.71 g/cm3 for the studied well. As in our previous work [29], the bulk and shear moduli of solid grains are 52 and 32 GPa, respectively.
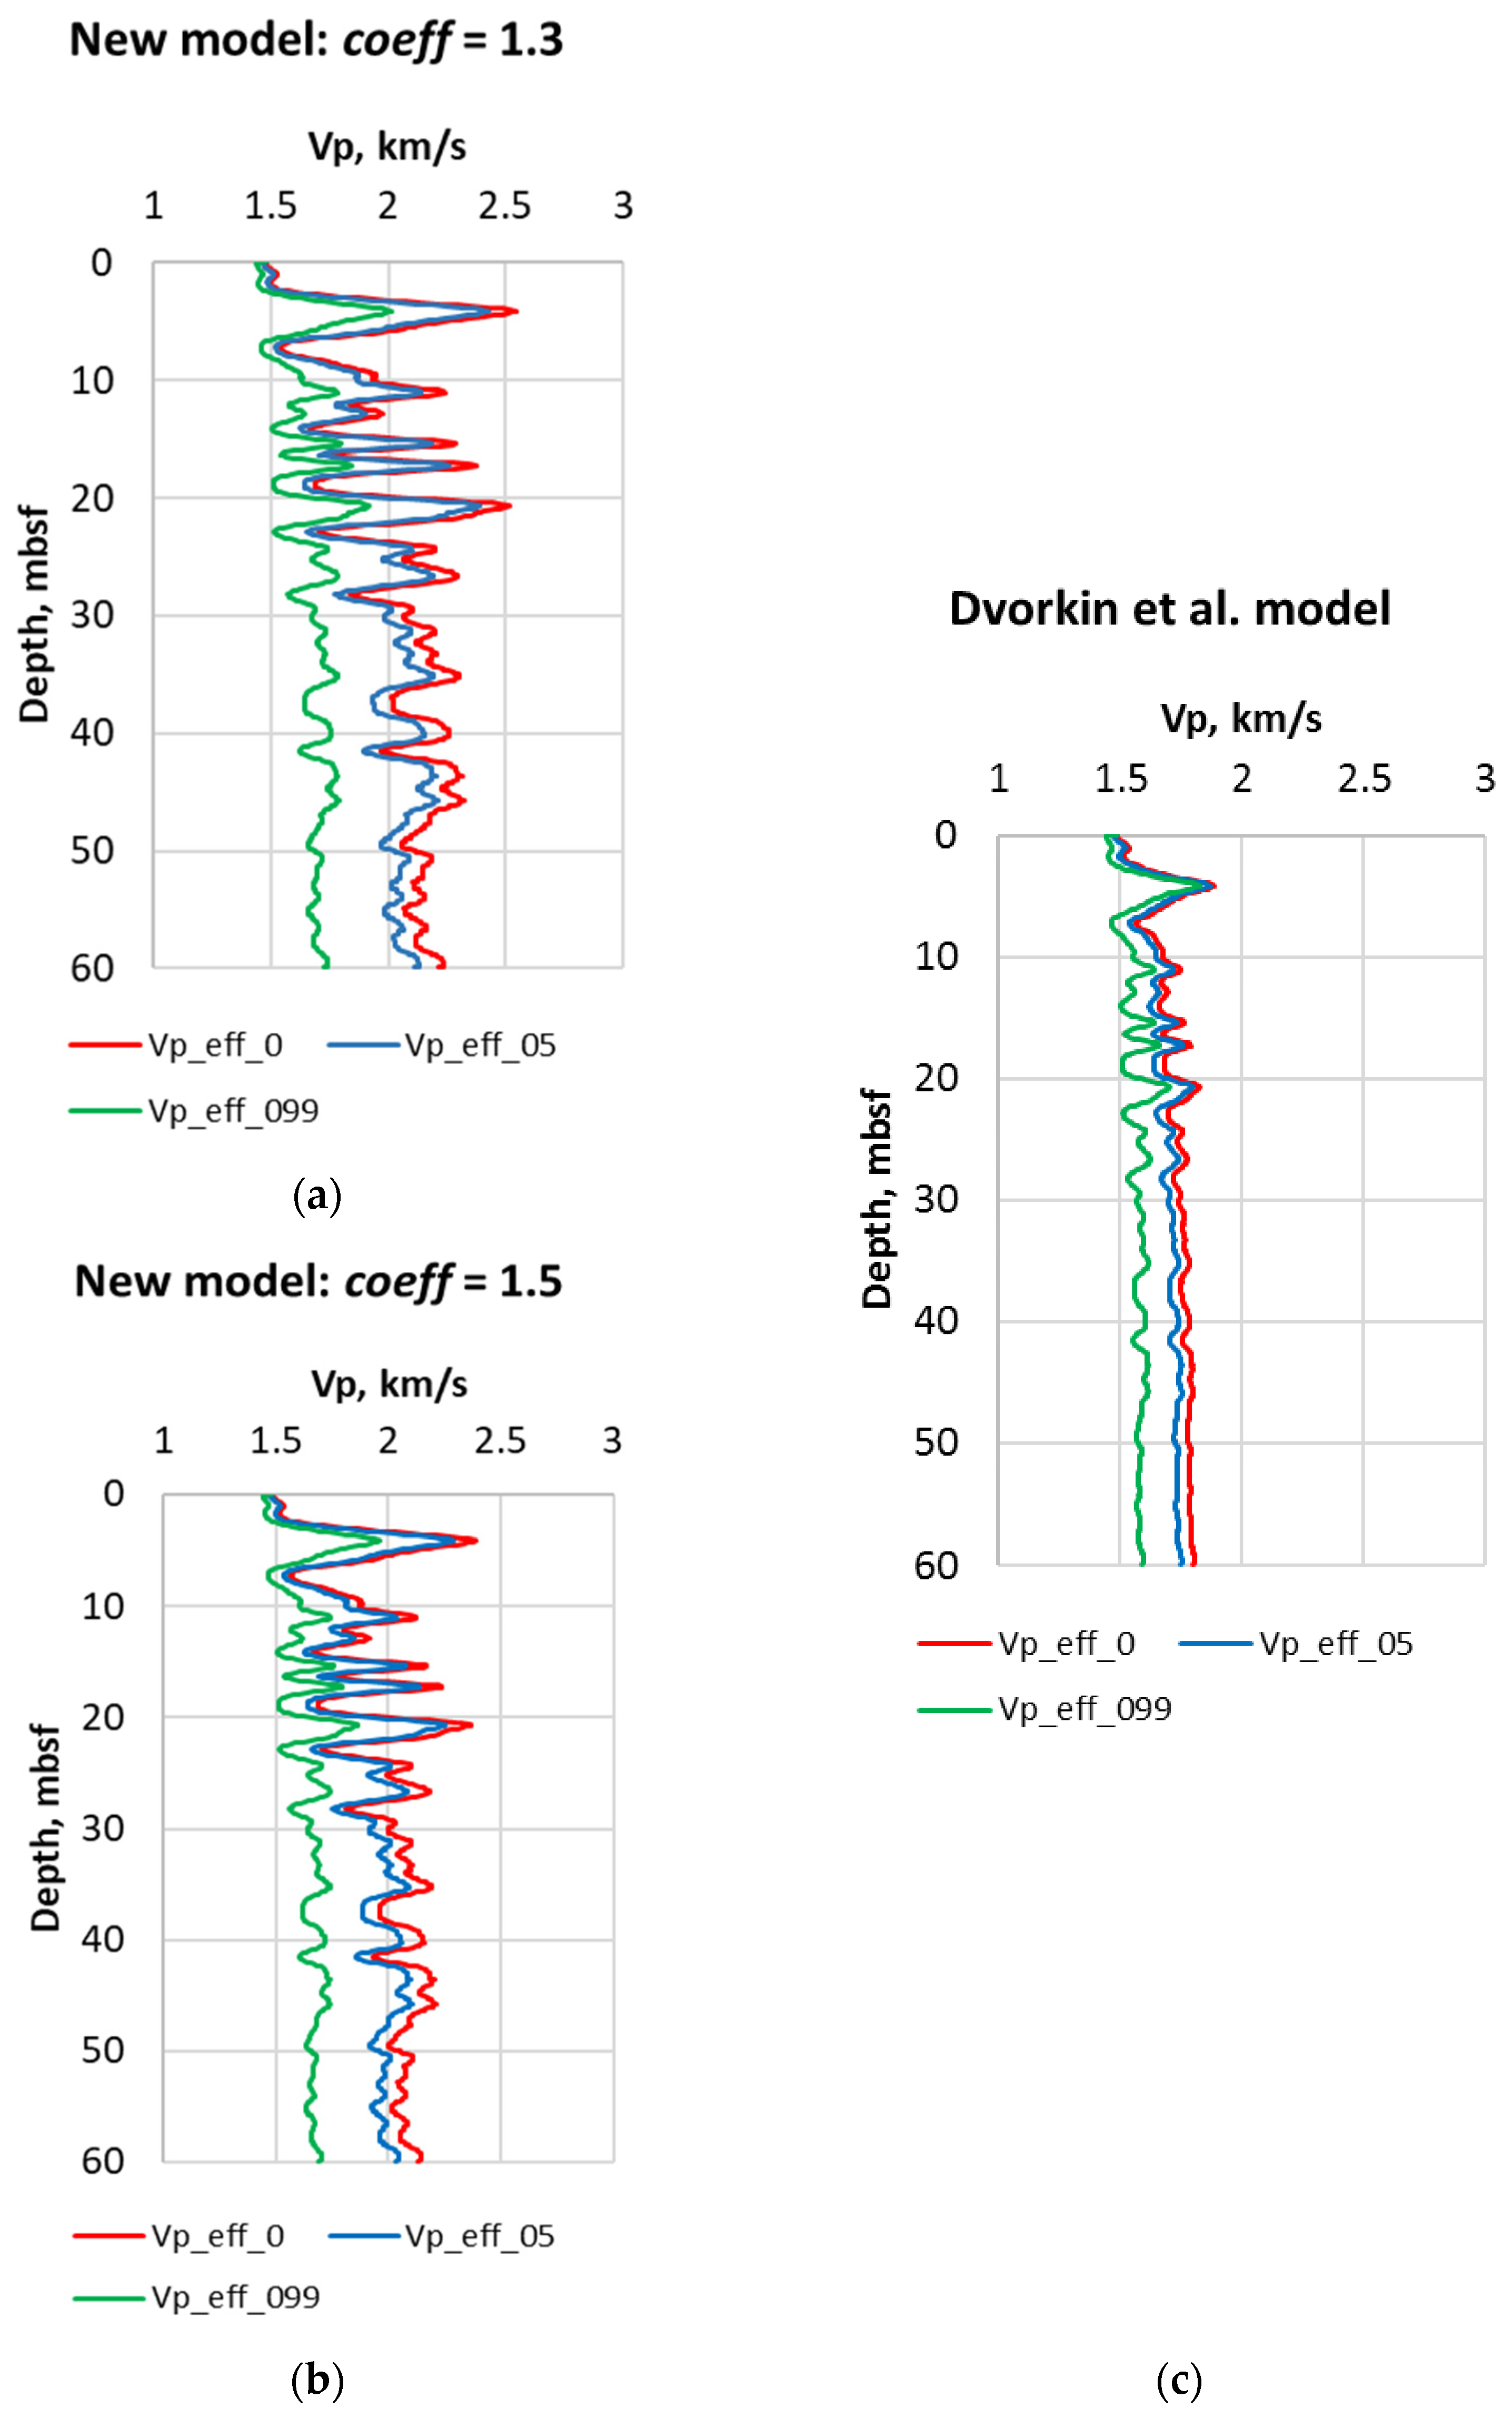
To analyze how the model is sensitive to the pore pressure, we vary factor A in Formula (3) and analyze a difference in the velocities. Note that of importance is the compressional velocity, since this type of velocity is commonly reliably measured in seismic surveys. We set the porosity correction coefficient (coeff) equal to 1.3 and 1.5. This means that, if the coefficient is 1.5 and the total porosity is 40%, the porosity of suspension is 60% and the porosity of consolidated solid material is around 27%. It is obvious that in reality this is not a necessary correspondence between the increase and decrease in porosity for these cases (φ > φc and φ < φc). It is assumed just for simplicity. The maximum porosity of suspension is assumed to be 99.5% (close to pure fluid). We consider three values of parameter A in Formula (3): A = 0 (the pore pressure is equal to hydrostatic), A = 0.5, and A = 0.99 (the pore pressure is close to total vertical stress, and the situation is critical).
The modeling results are shown in Figure 3 and Figure 4 for Vp and Vs, respectively. For comparison, the results obtained with the help of Dvorkin et al.’s [43] model are shown. In the Dvorkin’s model, we use the same critical porosity and coordination number as in the new RP model (60% and 18, respectively). As seen in our results, the new RP model provides higher velocities. In addition, the velocities at different pore pressures differ in a more pronounced way compared to the Dvorkin’s model. The velocities decrease as the suspension becomes more porous. This can be due to the contrast in the elastic moduli of “inclusions” and the granular medium increases. Note that “dry suspension” (obtained before Gassmann’s fluid substitution) has zero elastic moduli irrespective of the suspension porosity.
As seen from Figure 3 and Figure 4, the difference in the velocities provided by the new RP model and Dvorkin’s model decrease as the pore pressure increases. Furthermore, the dependence of the velocities on the pore pressure is nonlinear. The velocities drop faster as the pore pressure tends to the total vertical stress. Meanwhile, we can see that the drop in Vp may attain 27–28% (depths are 20.8 and 35.2 mbsf, model with coeff = 1.3) as the pore pressure is close to critical levels. This gives us a chance to detect the zones of critical pressure in seismic experiments. Note that the drop in Vs is even higher (around 70%) at these depths. However, shear wave velocities are determined with higher uncertainty in seismic experiments as compared to compressional waves. Note that the models for coeff = 1.3 and coeff = 1.5 differ insignificantly. However, compared to the limiting case (Dvorkin’s model), the difference is well pronounced.
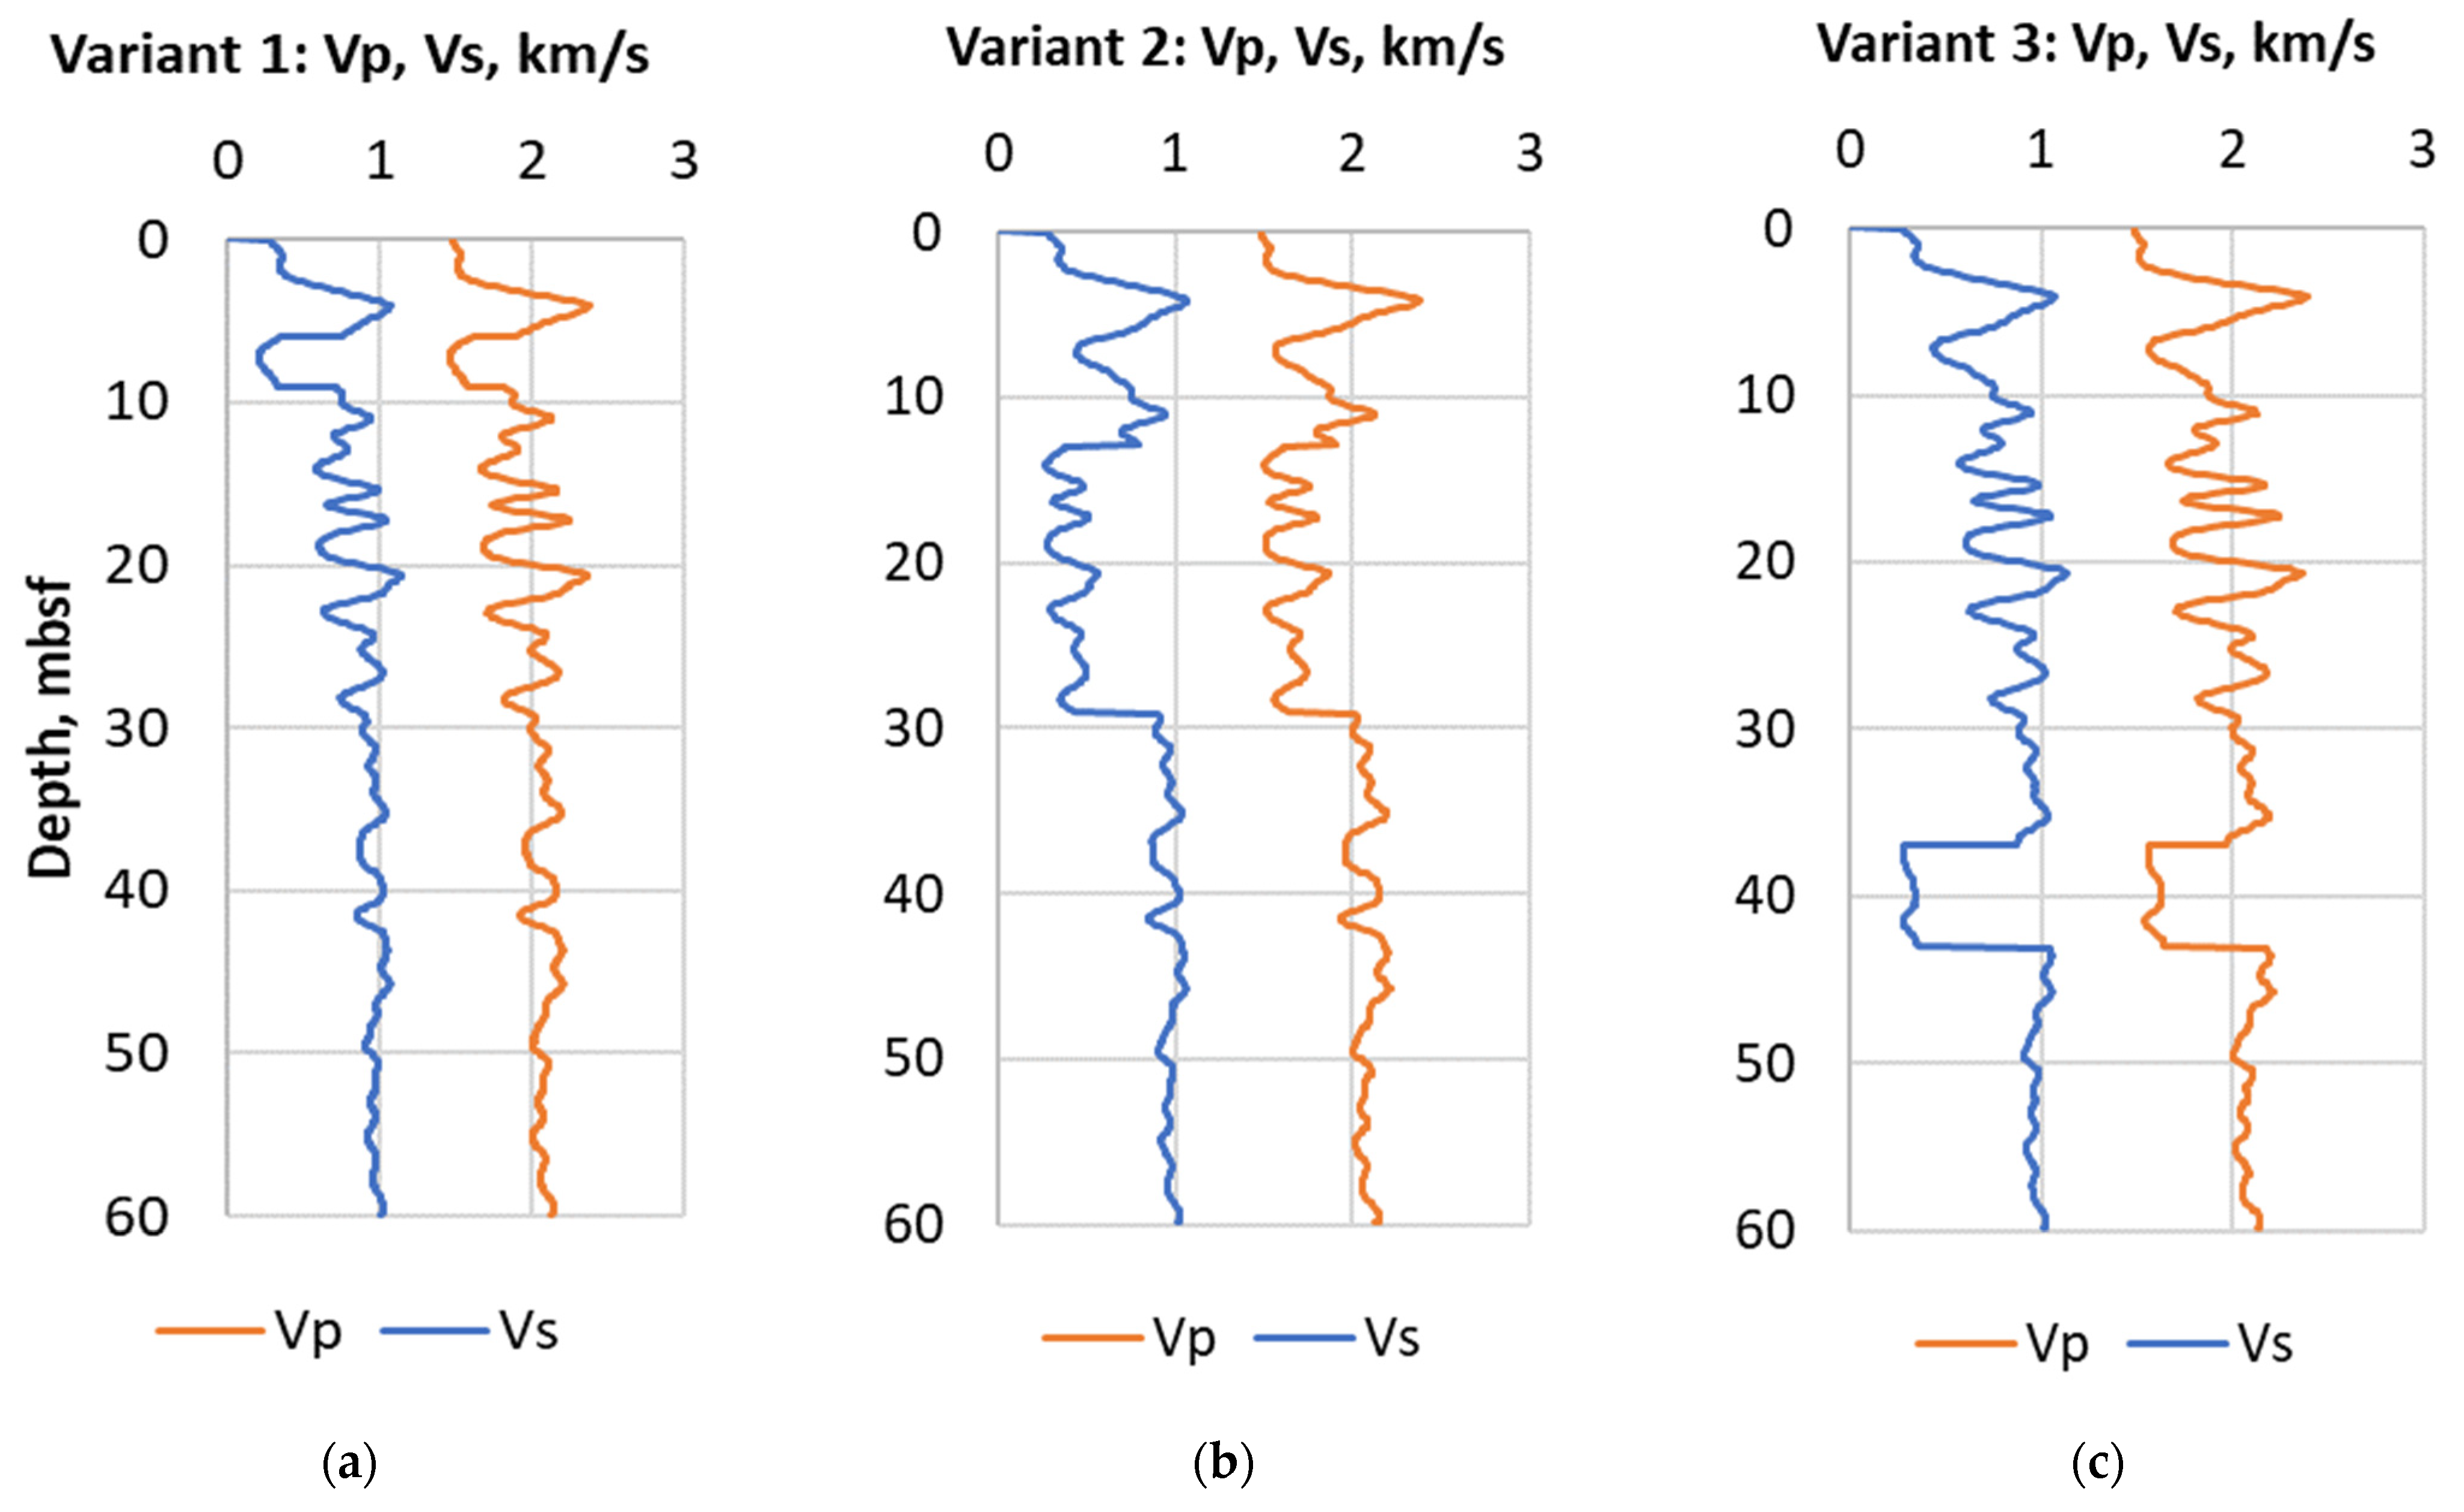
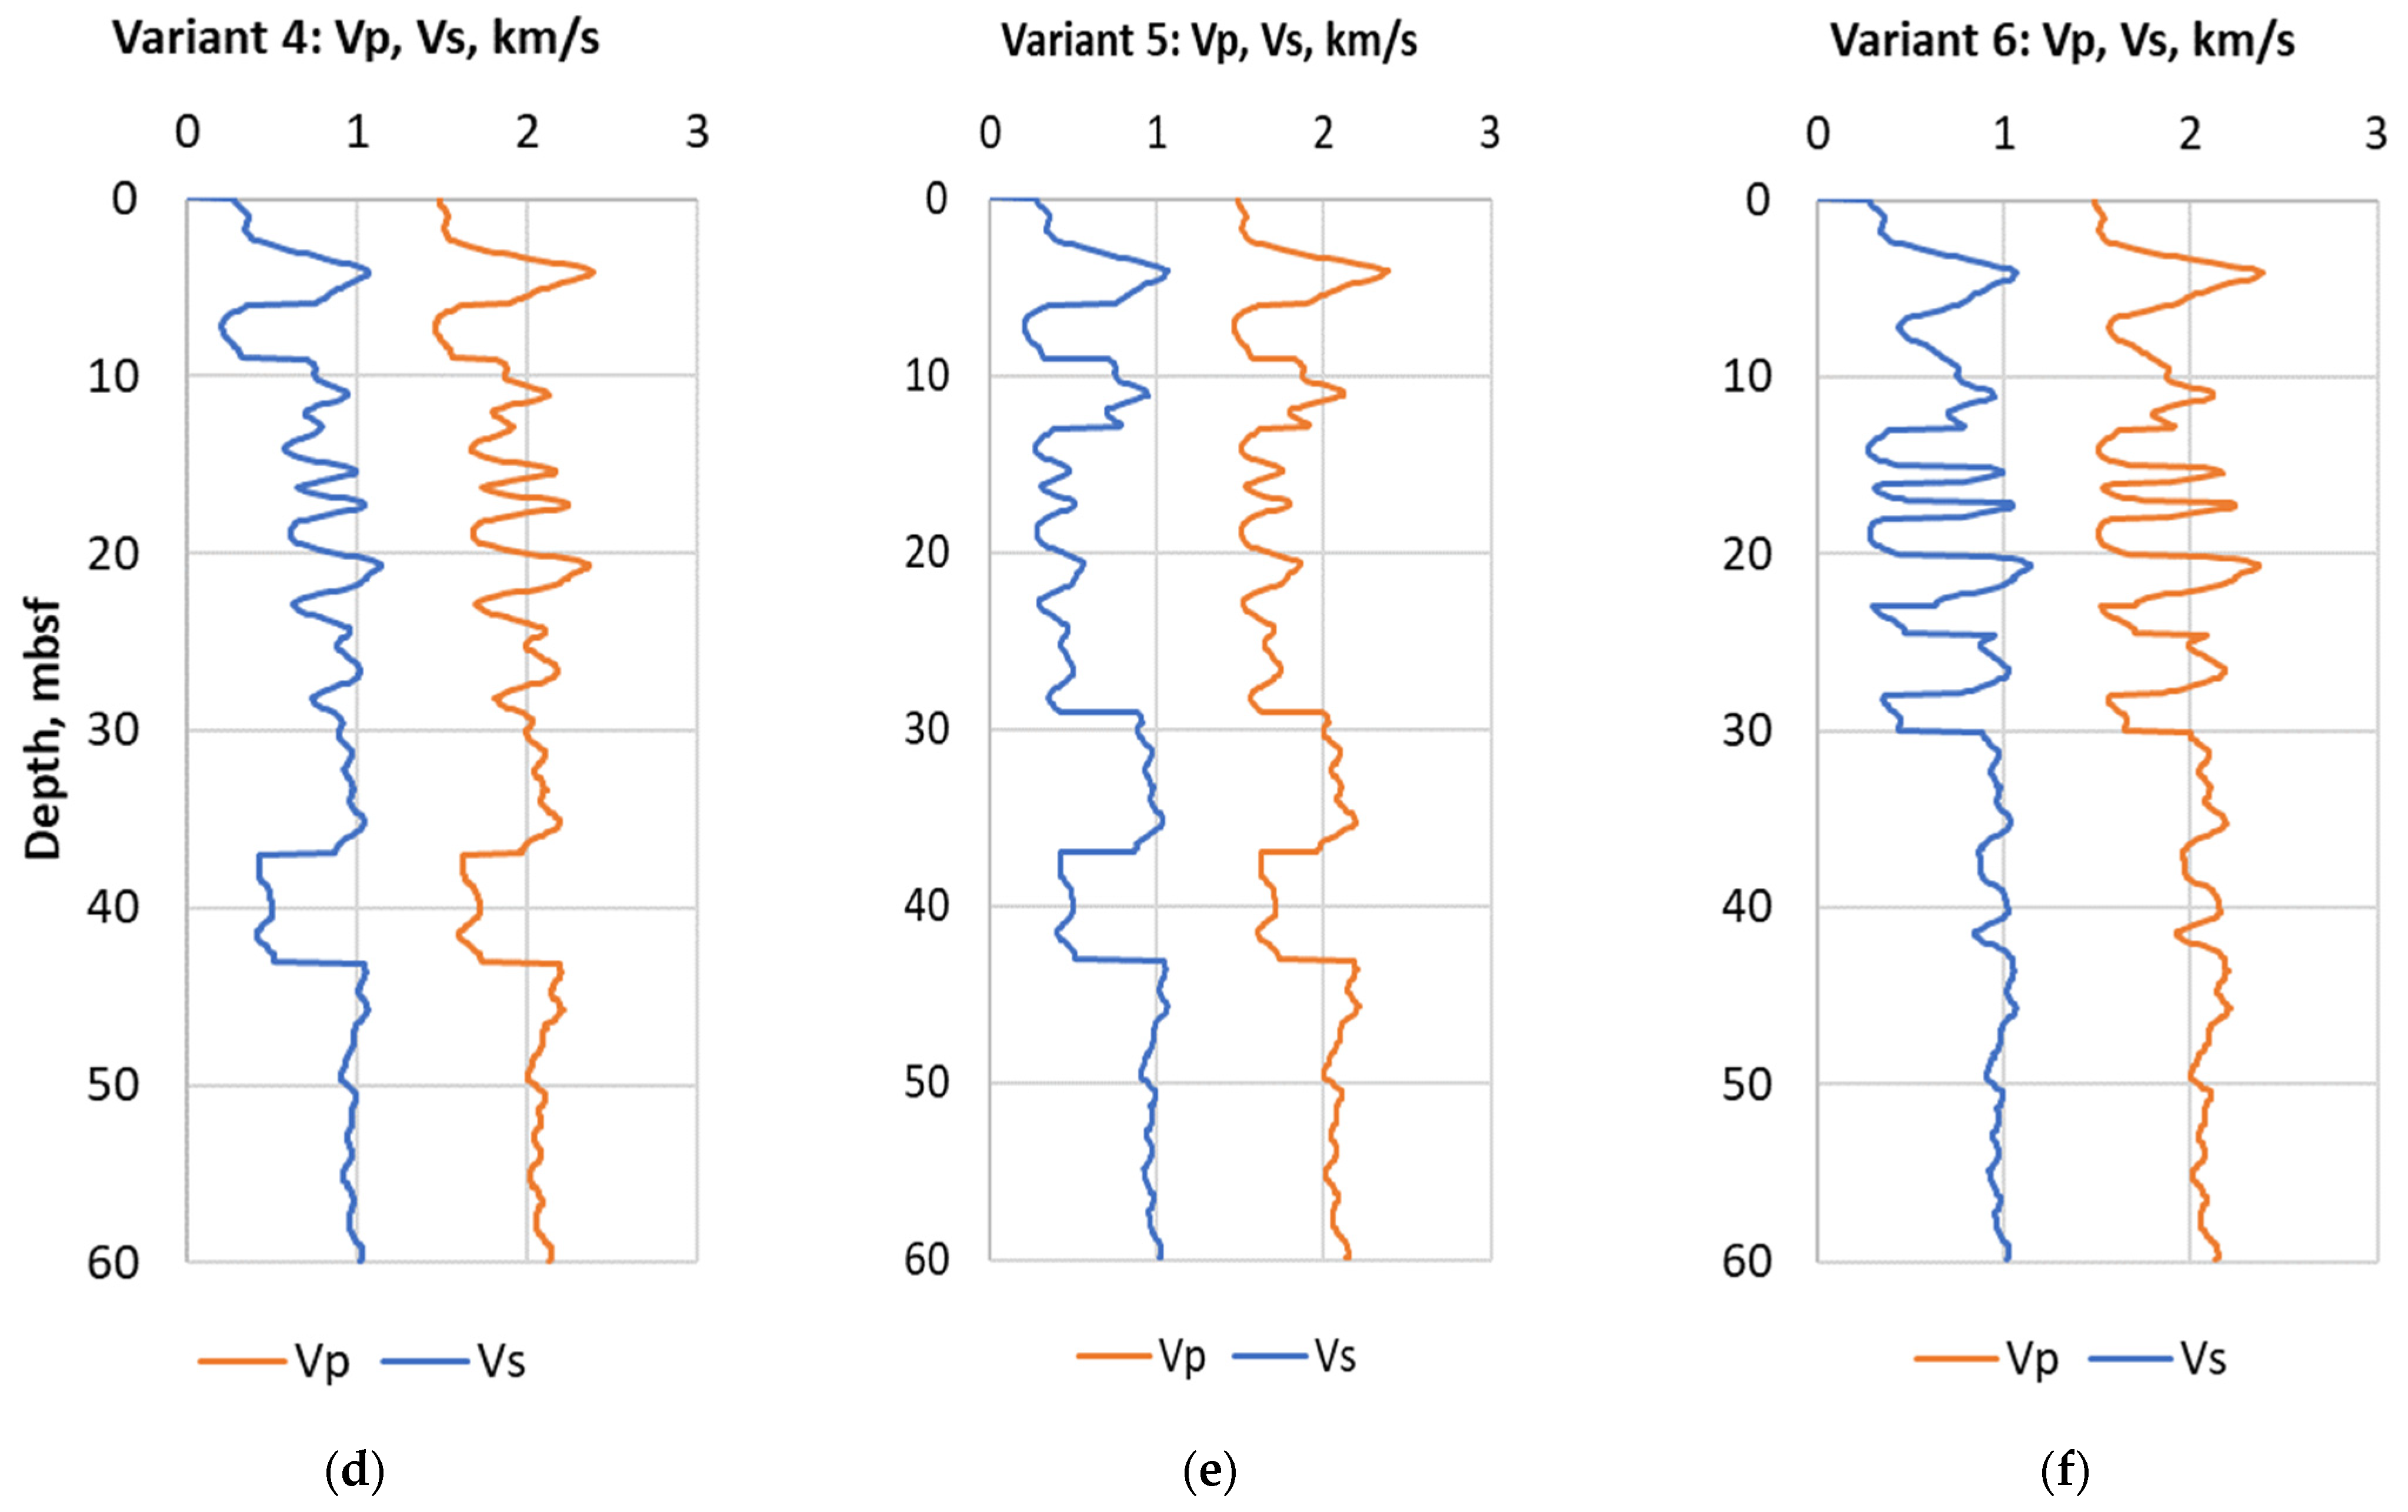
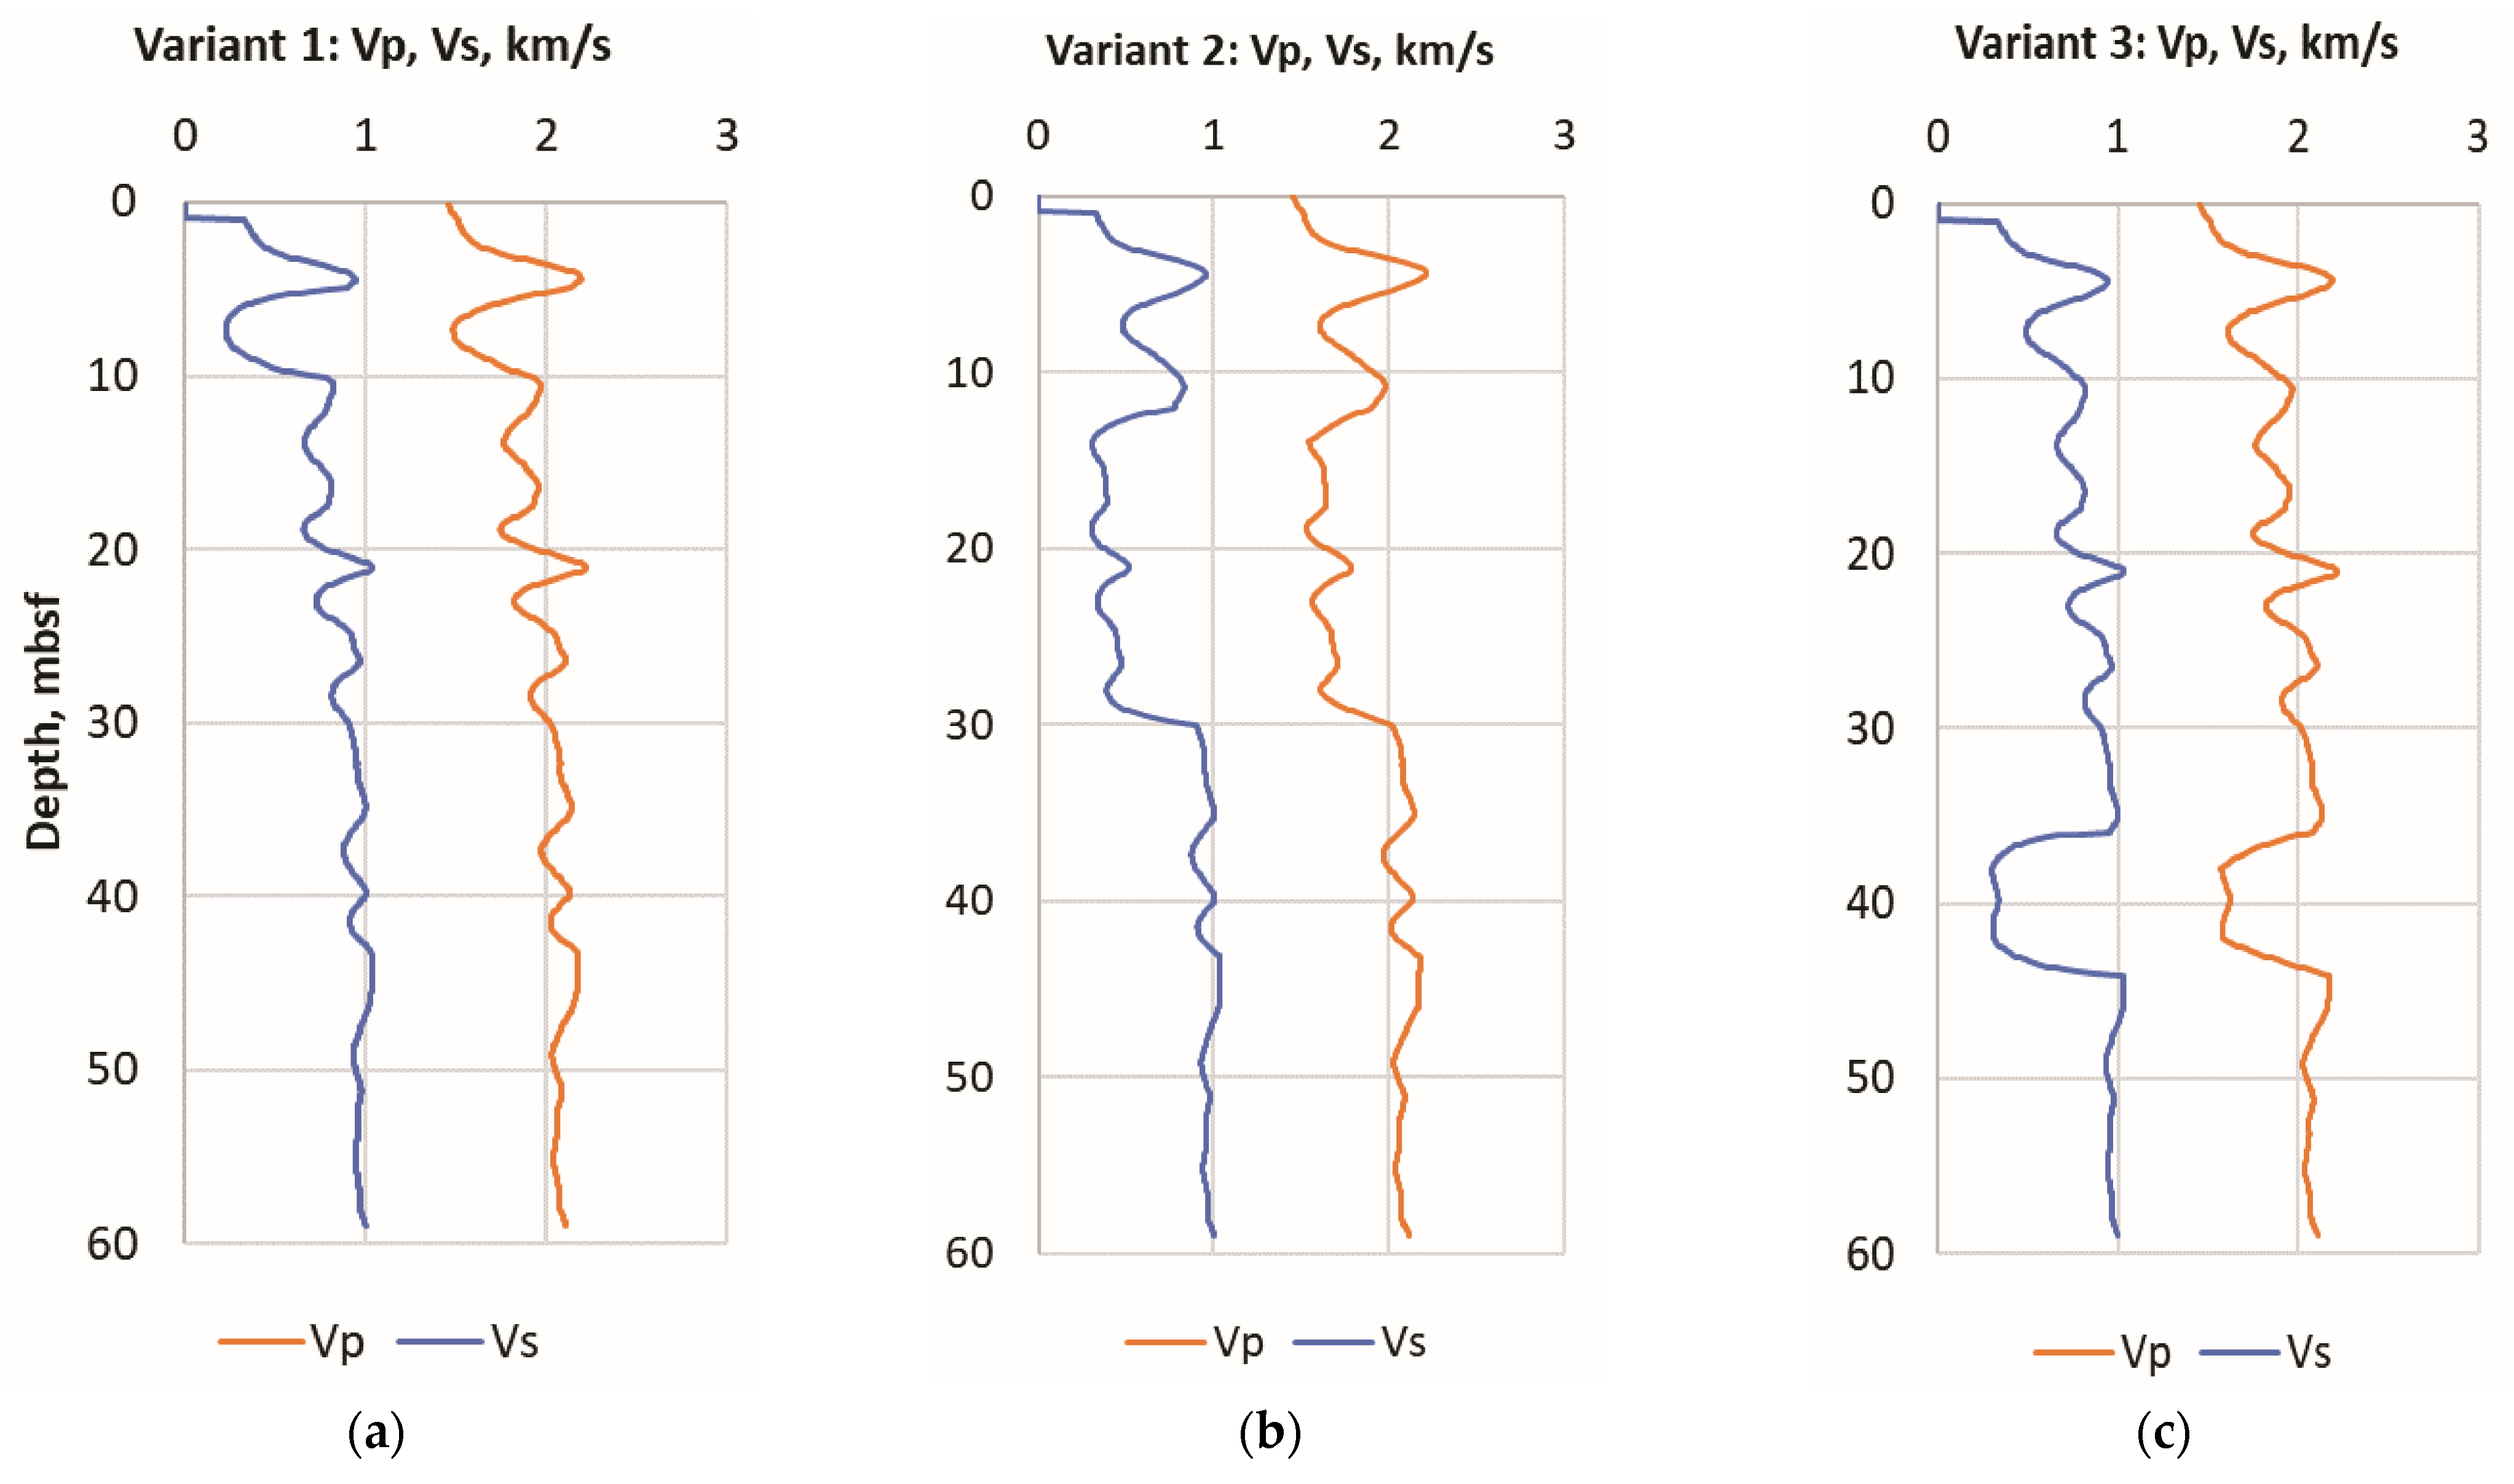
Using the new RP model, we can prepare several synthetic logs for Vp and Vs velocities for the future development of optimal seismic surveys for detecting zones with critical pore pressure (A = 0.99). For the modeling, we take a porosity correction coefficient equal to 1.5. Based on the results of consolidation analysis presented in [29] (also see Figure 2), we can consider several variants of critical pore pressure distribution. These variants are listed in Table 1. The synthetic logs of Vp and Vs corresponding to the six intervals are shown in Figure 5.
As seen from Figure 5, the synthetic logs of elastic wave velocities of the six variants differ considerably. Recall that the difference is only due to different intervals of critical pore pressure.
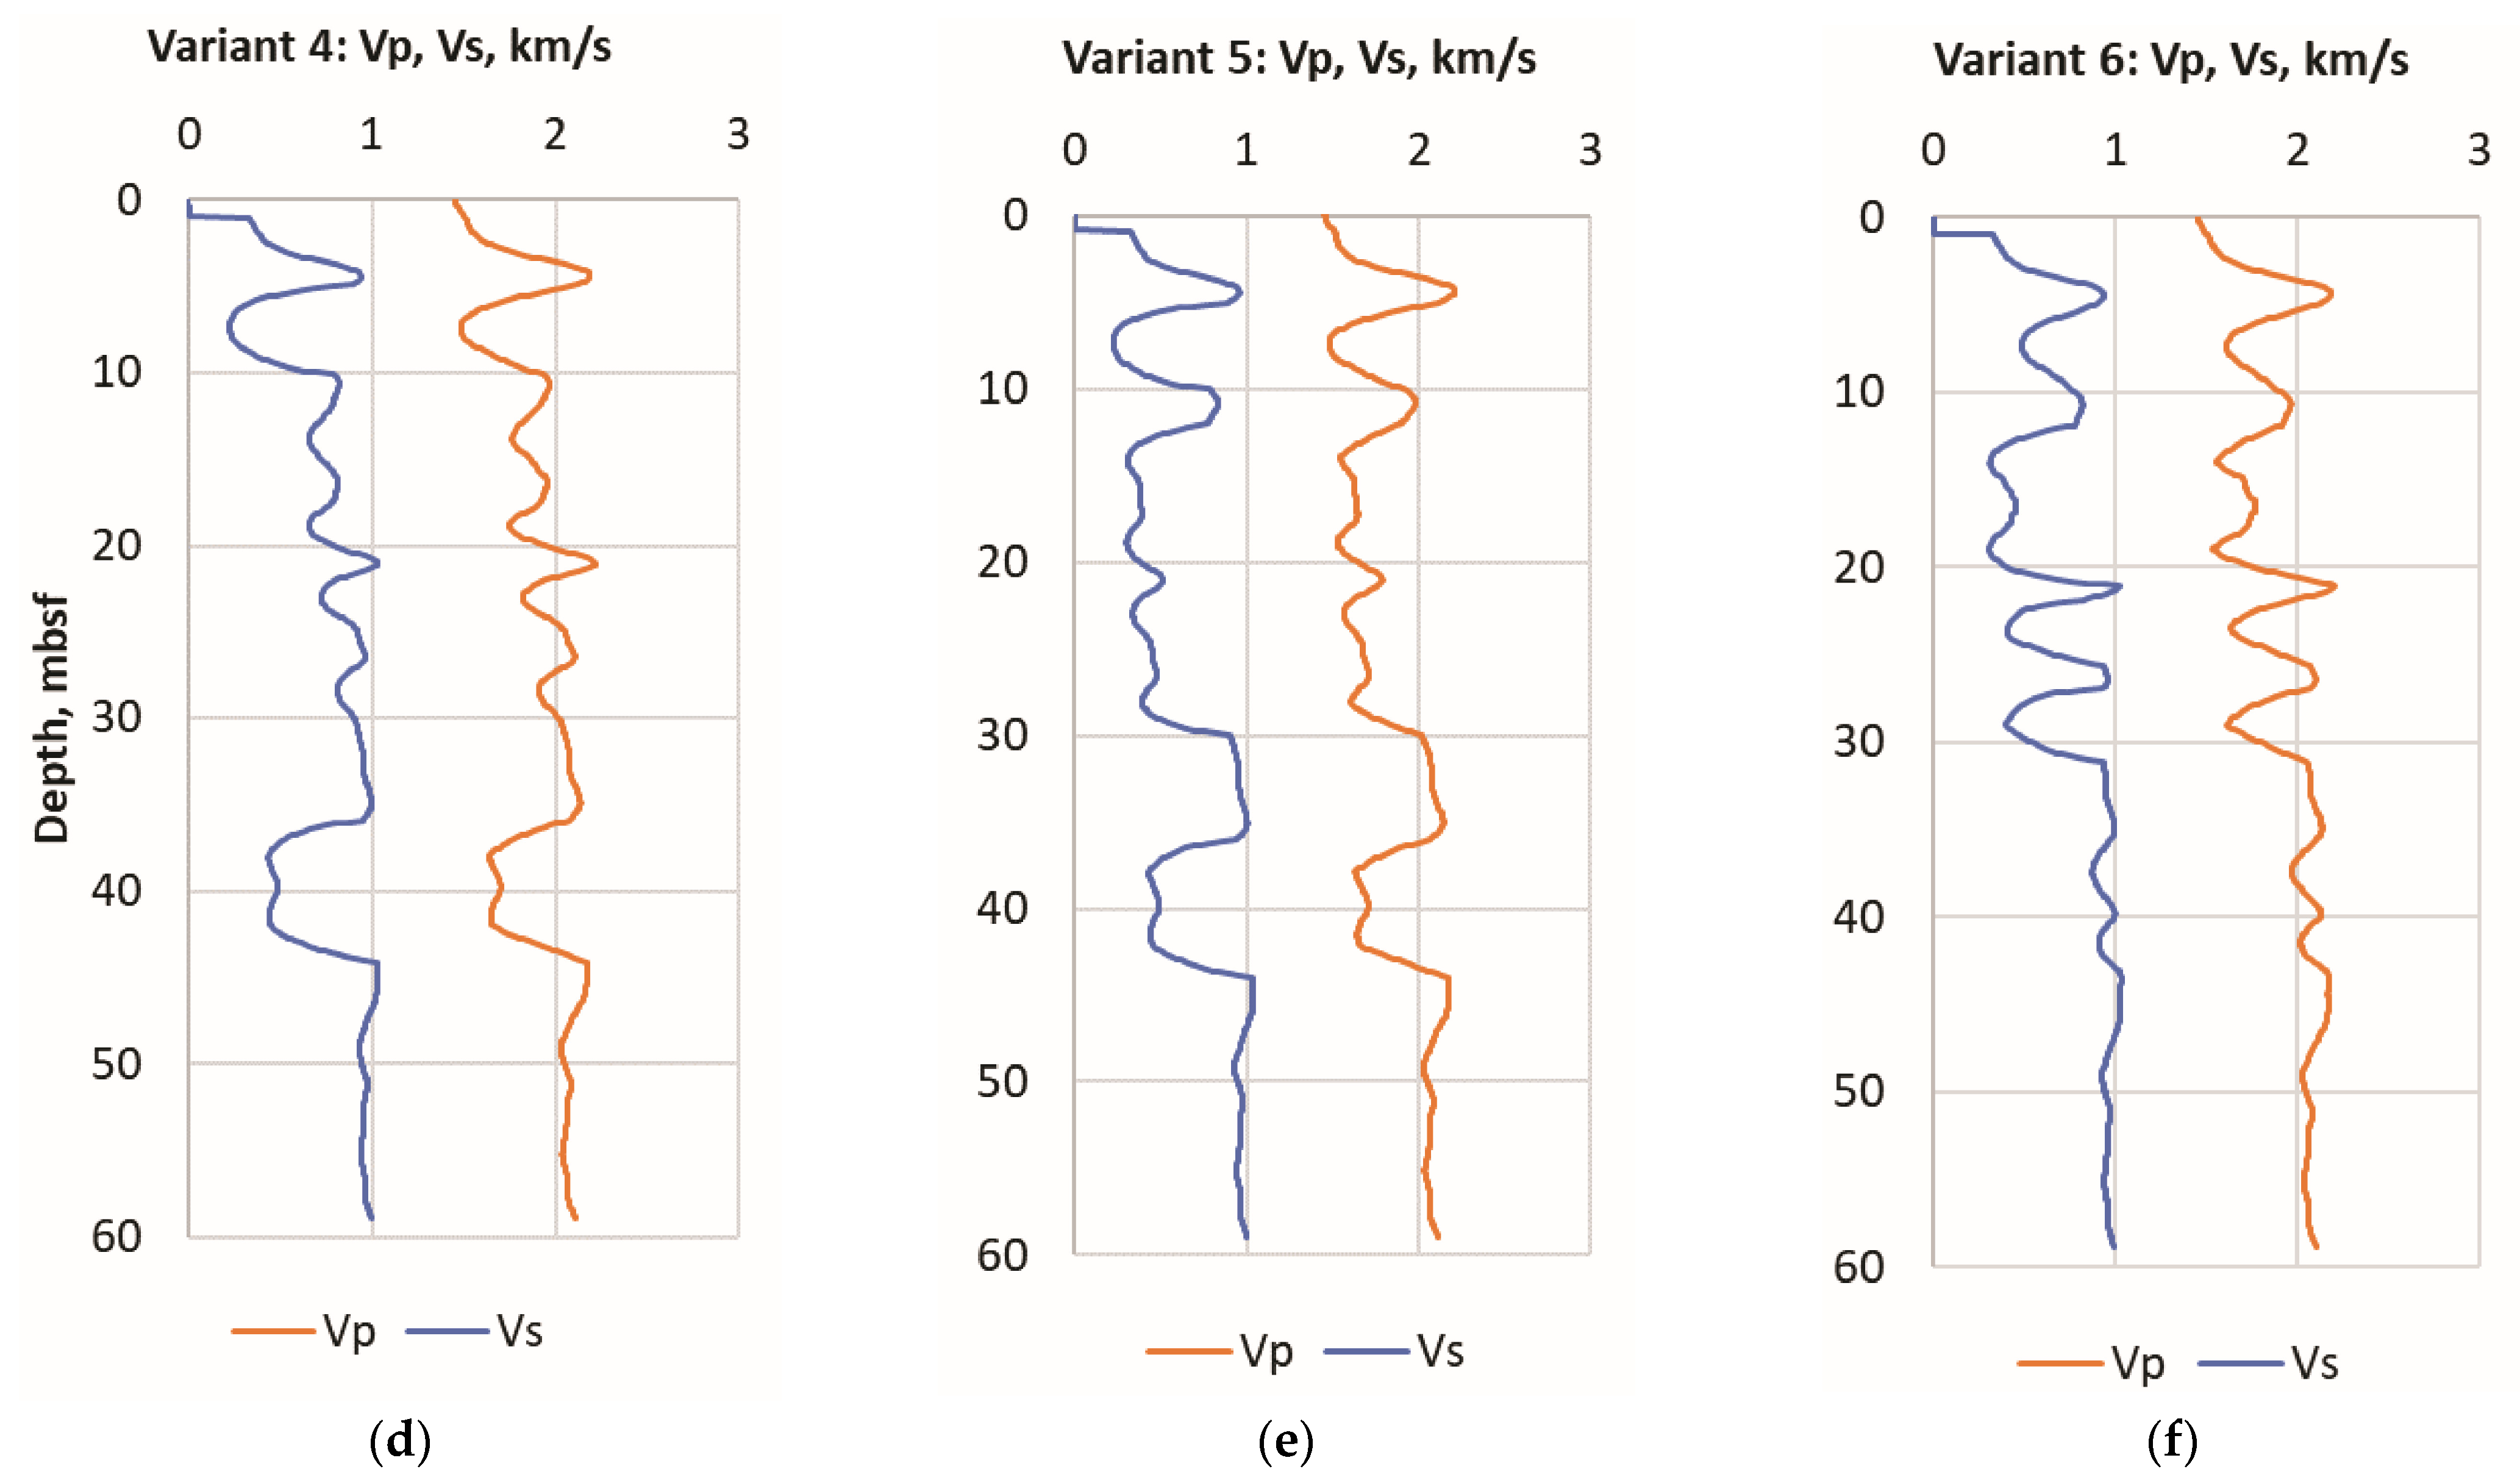
We also upscale these velocities for the seismic scale using the Backus method [47] for the frequency 250 Hz (the central frequency of the seismic experiment [29]). The formulas of the Backus method are shown in Appendix A. The upscaled velocities for all six variants listed in Table 1 are shown in Figure 6. The analysis of the velocities obtained at different directions suggests that the anisotropy is too small and can be neglected.
Figure 6 demonstrates that, again, as for synthetic logs shown in Figure 5, the upscaled velocities exhibit various distributions along the depth depending on the location of critical pore pressure zones.

3.2. Synthetic Seismic Data

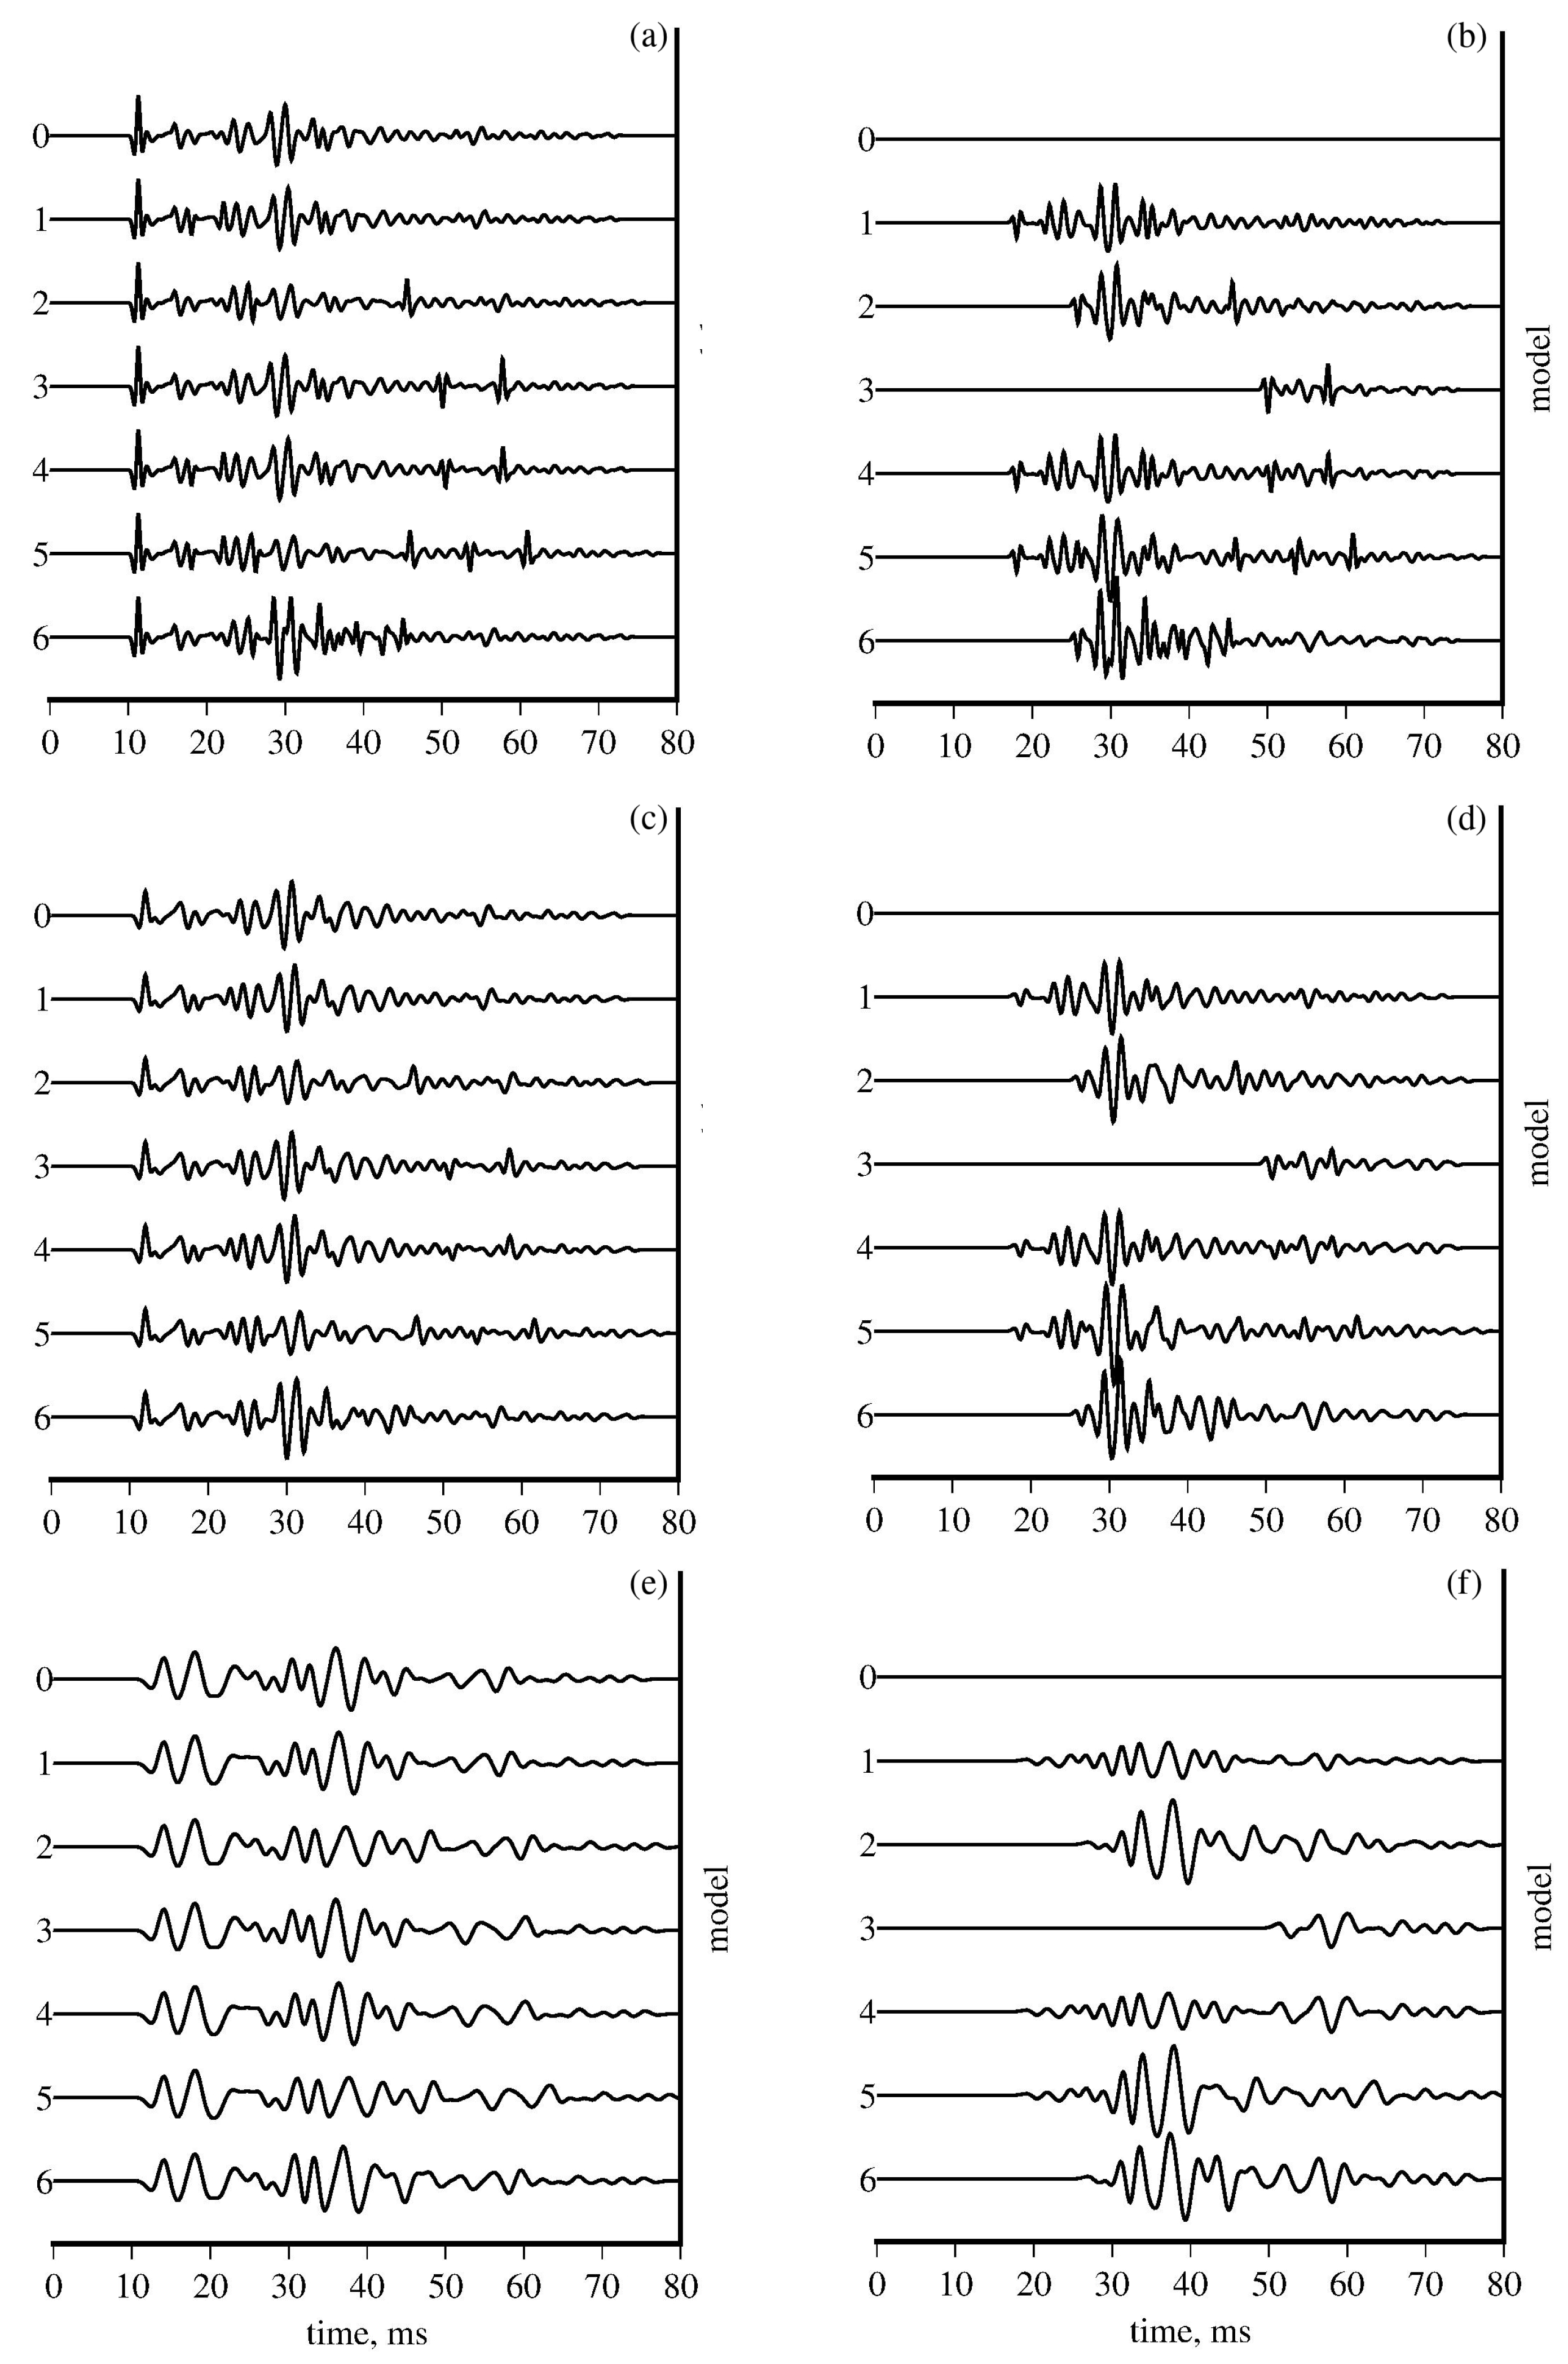
We calculate the zero-offset seismic response (i.e., the CDP sum after kinematic corrections were applied) of the 1D velocity and density profiles corresponding to the rock physics models discussed above (see Table 1 and Figure 5 and Figure 6). There are three typical frequency intervals used in marine engineering seismic surveys to search for the pore pressure anomalies [48,49]: high resolution seismic (200–250 Hz central frequency), very high resolution seismic (400–600 Hz) and ultra-high resolution seismic (700–1500 Hz). They differ in penetration depth as well as in frequency (see [49]). These three modifications correspond to the different seismic sources used: a small air-gun or sparker may be utilized for the high resolution surveys, a multi-electrode sparker or the very high resolution seismic and a boomer (i.e., piezoelectric source) for the ultra-high resolution. It is worth mentioning that these sources have different signal signatures, but we use for the modeling the same Ricker source function to make the results comparable. The central frequencies of 250 Hz, 500 Hz and 750 Hz are used. It is important to note that only wide-band seismic receivers are suitable for the multi-frequency studies that cover all frequency bands mentioned.
The seismic source is supposed to be near the water surface at the optimum depth of λ0/4 = Vw/4f0, where λ0 is the central wavelength, f0 is central impulse frequency, and Vw is water acoustic velocity. The vertical geophones are placed at the sea bottom. The results are shown in Figure 7 and Figure 8. Figure 7 corresponds to the time scale, while Figure 8 corresponds to the depth scale, i.e., to the depth-migrated section.
It can be seen that, at all frequencies, there exist notable difference in seismic response (see Figure 7b,d,f and Figure 8b,d,f). Nevertheless, at a central frequency of 250 Hz, it is difficult to mention these changes at the original traces (Figure 7e and Figure 8e), while at 500 Hz (Figure 7c and Figure 8c) and 750 Hz (Figure 7a and Figure 8a) the signature clearly changes at the intervals that correspond to the anomalous pore pressure.

4. Discussion

Figure 7 and Figure 8 contain the main results of the current study: modeled seismic responses of various possible pore pressure anomalies distributions. A description of these models is given in Table 1; to recap, models 1 through 3 are characterized by a single anomalous zone, model 4 contains two anomalous zones, model 5 has three anomalous intervals, and model 6 contains the largest number of depth intervals with critical pore pressure.
First of all, it is clear that, if pore pressure needs to be predicted from a seismic response, it is necessary to process raw seismic data. Seismic responses to various models do not differ between each other at first glance: local anomalies in pore pressure are not high enough to distinguish corresponding anomalies in seismic response. It is especially clear for relatively low frequencies (Figure 7e and Figure 8e), as the seismic responses seem similar. While differences between the seismic response for the studied models and a model without pore pressure anomalies (track 1 in Figure 7 and Figure 8) makes it possible to detect anomalies, two problems occur. First, it is complicated to detect depth intervals with anomalous pore pressure from Figure 8f: while the upper boundary of anomalous interval can be identified with relative ease, the deeper boundary remains questionable as changes in the seismic response occur not only in the interval with the anomaly (e.g., 6–9 mbsf for model 1), but for deeper depths as well. The other problem is more general: differential seismic responses shown in Figure 7b,d,f and Figure 8b,d,f) suggest that there is a basic model (track 0) without any anomalies in pore pressure. It is clear that real field conditions do not allow for constructing this basic model, since the presence of anomalies in the pore pressure remains questionable in itself. Thus, while sets of Figure 7b,d,f and Figure 8b,d,f provide a much more clear representation of anomalies in seismic responses compared to their counterparts shown in Figure 7a,c,e and Figure 8a,c,e), acquisition of such data is technically very complicated. Nevertheless, these differences can be used for the monitoring of temporal changes in the pore pressure distribution. It has been already mentioned above that several studies [17,18] reveal the potential temporal evolution of pore pressure distributions in seafloor sediments. As a result, one can consider a series of bottom seismometer data with respect to initial measurements as an undisturbed state similar to trace 0 in Figure 7 and Figure 8. The pore pressure can be considered as one of the factors that are easily altered due to external actions, at least, compared to sediment’s mechanical properties and composition. Thus, bottom seismometers can be used as a monitoring tool of changes in pore pressure induced by external factors which is essential at early stages of offshore hydrocarbon exploration and development. If seismic data are obtained regularly via the same system, the early appearance of anomalies associated with pore pressure redistribution and evolution can be detected, which potentially mitigates corresponding geological risks.
As it clearly follows from Figure 7 and Figure 8, the pore pressure anomalies appear at seismic responses for different frequencies, but not in a similar way. While relatively low frequencies provide responses resembling each other, higher frequencies give more detailed responses. Detailed analysis of these responses makes it possible not only to find the upper boundary of the highest anomalous zone, but also to distinguish different anomalies. Natural noise is not high enough to overshadow the effect of anomalous pore pressure zones and one can even evaluate the lower limit in depth of an overpressure zone—yet uncertainty remains relatively high. Simultaneous analysis of seismic responses on a set of frequencies provides the widest understanding of anomalous zone locations.
The obtained results show that bottom seismometers are suitable for detecting the seismic response of high pore pressure zones in submarine sediments. To achieve this goal, the frequency range of the seismometers must cover all the above-mentioned frequency bands, including very high and ultra-high resolution seismic. This means that the upper frequency for the seismic receiver must be at least as high as 1000 Hz. The digitizing frequency of the registration system must satisfy the Nyquist criterion for the ultra-high band, i.e., a time step of 0.5 ms must be available in the system.
Technical realization of such a seismic survey is worth additional discussion. One point is that the central frequency of the seismic sources is not altered with ease. The given example suggests using different sources: 750 Hz is related to a boomer source; 500 Hz can be achieved through using a sparker source, and an air-gun source can be used to achieve a frequency of 250 Hz. Thus, a seismic monitoring system for the detection of overpressure zones in submarine sediments should be a combination of different sources. Recent advances in marine seismic devices provide examples of such multi-frequency shooting [48,49].
The main challenge is to construct the bottom seismic acquisition systems useful for the problem considered here. In order to be capable of seismic monitoring of pore pressure changes, such equipment must satisfy two criteria: being suitable for permanent installation on the sea floor for the time range of the monitoring (up to years); and providing the wide frequency range of 1–1000 Hz as discussed below. Therefore, it is clear that bottom cable systems (OBC) have the advantage over autonomous bottom stations (OBS) for the purpose of monitoring, because they do not require reinstallation and may provide real-time information during the time span of the monitoring. The reinstallation of the autonomous stations almost necessarily leads to the change of their position from one survey series to another. The corresponding changes in seismic records may mask the changes arising due to pore pressure change. The wide frequency band may be obtained through the combination of low-frequency geophones or hydrophones, such as molecular-electronic transducers that may cover the 0.02–200 Hz frequency range [50], and piezoelectric hydrophones that provide a usable frequency range up to 10 kHz and more. Another possibility is provided by modern fiber-optic vector hydrophones that exhibit a very high responsivity in the frequency range of 10–1000 Hz [51]. Thus, recent advances in acoustic sensing provide the means to construct bottom seismic stations useful for the investigation and monitoring of pore pressure in the shallow subsurface.
To quantify the pore pressure anomalies and invert for such important parameters as pore pressure, a rock physics-based inversion can be applied. That means that the observed seismic field should be approximated by a synthetic analogue computed on the basis of a suitable rock physics model, specifically that described above. To use the full-waveform inversion, one also need the low-frequency information to constrain the velocity model. Therefore, the frequency band of the seismometers should cover the range from 1 to 1000 Hz.
Meanwhile, the results of a rock physics-based inversion for the model parameters are not unique. To narrow the domain of possible solutions, some “reference values” for unknown parameter(s) should be known. Specifically, it is valuable to have experimental values of the “measurable” parameters (such as pore pressure) at some depths in order to evaluate the other model parameters that could not be measured (such as critical porosity and coordination number). As shown in our previous work [29], the possibility of having data on pore pressure at some depths allowed us to fix the other “nonmeasurable” model parameters and obtain the pore pressure distribution in a good agreement with the results of consolidation analysis.
In the presence of methane hydrates, another RP model should be constructed. The model should take into account how the methane hydrate is distributed in the rock. It could be in the form of cement around the other solid particles or in the form of inclusions inside the granular material. Under a certain pressure and temperature, the methane hydrates become unstable and methane start to release. It enhances the pore pressure so that can become greater than the total vertical stress, which leads to wellbore collapse.

5. Conclusions

Detection and analysis of overpressure zones in unconsolidated seafloor sediments is one of the important tasks for offshore reservoir exploration and development. It is not enough to detect overpressure zones once, before the start of exploitation, as pore pressure spatial distributions happen to evolve over time, so zones that could be identified as normal before exploitation may become overpressured due to fluid filtration affected by external factors. Thus, it is necessary to develop monitoring systems to identify the pore pressure in unconsolidated sediments and control its temporal variations.
Floating seismic streamers can be potentially used for seismic monitoring, but less noise and the nature of the recorded data make bottom seismometers a more reliable source of information on subtle changes in sediment structure and properties. While bottom seismometers can be potentially used for pore pressure detection and monitoring, it is necessary to understand the requirements for their specifications.
This current paper presents synthetic data on pore pressure distributions in unconsolidated marine sediments. We use real field data to create sets of models that can represent real conditions on the one hand, and, on the other, give variations on pore pressure distributions to study differences between potential seismic responses that could be obtained via a bottom seismometer. A special rock physics model has been developed for this purpose to properly incorporate the pore pressure in unconsolidated media into its seismic response. This model is based on a combination of the Hertz–Mindlin method and Hashin–Shtrikman bounds with a further Gassmann’s fluid substitution. The model is a modification of Dvorkin et al.’s [43] model incorporating so-called “porous additions” that are a suspension in the case when the porosity is greater than the critical one, and a consolidated porous material in the opposite case.
The constructed models of dynamic mechanical properties can be consequently used to simulate seismic response by varying the pore pressure distributions.
Obtained results suggest that it is possible to develop and apply bottom marine seismic registration systems suitable for detecting the presence and temporal evolution of pore pressure anomalies in the shallow subsurface sediments. Rock physics-based full-waveform inversion may be applied to detect and quantify these anomalies. To achieve these goals, the registration system should have a frequency range as wide as 0.1–1000 Hz and a corresponding digitizing frequency.
Satisfaction of these requirements is expected for pore pressure monitoring systems to become capable of detecting zones of anomalous pore pressure in unconsolidated seafloor sediments. Usage of such systems can potentially mitigate geological risks that occur at early stages of offshore hydrocarbon reservoir exploration and development.

Author Contributions

Conceptualization, S.T., I.B. and N.D.; methodology, S.T. and I.B.; software, S.T. and I.B.; validation, S.T., I.B. and N.D.; formal analysis, S.T. and I.B.; investigation, S.T. and I.B.; resources, N.D.; data curation, S.T., I.B. and N.D.; writing—original draft preparation, S.T., I.B. and N.D.; writing—review and editing, N.D.; visualization, S.T., I.B. and N.D.; supervision, S.T.; project administration, S.T.; funding acquisition, S.T. All authors have read and agreed to the published version of the manuscript.

Funding

This research was founded by the Russian ministry of science and higher education, contract number 075-11-202-030 from 8 April 2022.

Institutional Review Board Statement

Not relevant.

Informed Consent Statement

Not applicable.

Data Availability Statement

https://doi.org/10.5281/zenodo.8331354. This online publication contains: (1) initial data for modeling shown in Figure 1 and Figure 2, (2) the data on six RP models listed in Table 1 and for the model without pore pressure anomalies for log scale, (3) the data on the six RP models and for the model without pore pressure anomalies upscaled for 250.

Conflicts of Interest

The authors declare no conflict of interest.

Appendix A

Appendix A.1. Formulas of Hertz–Mindlin Method [38,40]

The Hertz–Mindlin method is applied for calculating the effective elastic moduli of a dry granular medium represented by a random pack of spheres having the same size. The effective elastic bulk (KHM) and shear (µHM) moduli are found by the formulas
K H M = [ D ( P ) 18 ] 1 / 3 , μ H M = 5 4 ν 5 ( 2 ν ) [ 3 2 D ( P ) ] 1 / 3 , D ( P ) P [ n ( 1 φ ) μ π ( 1 ν ) ] 2 ,
where P is the effective pressure equal to the difference of the total vertical stress and pore pressure; µ and ν are the shear modulus and Poisson ratio of grain material; φ is the porosity (here and below the porosity is given in fractions of a unit); n is the average number of contacts per grain (so-called coordination number).

Appendix A.2. Formulas of Hashin–Shtrikman Bounds [41]

The Hasin–Shtrikman formulas provide the upper and lower bounds for the bulk and shear moduli of heterogeneous media. If the stiffest material plays the role of a matrix containing isolated particles of other materials this model corresponds to the upper HS bound. If the matrix is the softest material, this corresponds to the lower HS bound. The inclusions are of arbitrary shape.
The bounds for bulk and shear moduli of the two-component composite can be calculated by the formulas
K H S ± = K 1 + v 2 1 / ( K 2 K 1 ) + v 1 / ( K 1 + 4 3 μ 1 ) , μ H S ± = μ 1 + v 2 1 / ( μ 2 μ 1 ) + 2 v 1 ( K 1 + 2 μ 1 ) / [ 5 μ 1 ( K 1 + 4 3 μ 1 ) ] ,
where signs “+” and “−” are related to the upper and lower HS bounds, respectively. Indices “1” and “2” are, respectively, related to the stiff and soft components. To obtain the lower bound, the soft and stiff components should be replaced by each other. Variables v1 and v2 are the volume concentrations of the soft and stiff components.

Appendix A.3. Formulas of Berryman’s Self-Consistent Method [44]

The way of derivation of self-consistent method formulas assumes that each inclusion of ellipsoidal shape is placed in a medium with effective properties. Thereby, implicitly, a connection of inclusions is allowed. In particular, at great porosity (40–60%) the elastic moduli exhibit rather small values which is in correspondence with the statement.
The formulas for calculating the effective elastic moduli of two-component medium can be written in the form
K B e r r = v 1 K 1 F 1 K + v 2 K 2 F 2 K v 1 F 1 K + v 2 F 2 K , μ B e r r = v 1 μ 1 F 1 μ + v 2 μ 2 F 2 μ v 1 F 1 μ + v 2 F 2 μ ,
where for spherical inclusions we have
F i K = K M + 4 3 μ M K i + 4 3 μ M , F i μ = μ M + E M μ i + E M , E M = μ M 6 ( 9 K M + 8 μ M ) ( K M + 2 μ M ) ,
where index i takes values 1 or 2 depending on the inclusions’s type.
Equations (A3) and (A4) are solved by iterations. The variables with index M change from iteration to iteration. Usually, 5–6 iterations are necessary to obtain a solution for effective elastic moduli for spherical inclusions.

Appendix A.4. Formulas for Gassmann’s Fluid Substitution [39]

If a fluid fills the voids in a dry porous medium, the elastic moduli of the fluid-saturated medium should obey the following equation:
K s a t K m i n e r a l K s a t = K d r y K m i n e r a l K d r y + K f l u i d φ ( K m i n e r a l K f l u i d ) ,
where Ksat, Kmineral, and Kdry are, respectively, the bulk moduli of saturated medium, solid matrix, and dry medium; φ is the porosity. The fluid does not affect the shear modulus.
Gassmann’s fluid-substitution is applied if the pressure is equalized in the pore space.

Appendix A.5. Formulas for Calculating the Elastic Wave Velocities in Isotropic Medium

If a medium is isotropic, the Vp and Vs velocities are calculated by the formulas:
V p = K + 4 3 μ ρ , V s = μ ρ ,
where ρ is the density.

Appendix A.6. Formulas of Backus Method [47]

The Backus method gives the possibility of obtaining the effective elastic properties of a medium composed of thin isotropic horizontal layers that are randomly distributed over the volume. The resulting medium is anisotropic of VTI symmetry. The stiffness matrix of such a medium has the form
[ A B F 0 0 0 B A F 0 0 0 F F C 0 0 0 0 0 0 D 0 0 0 0 0 0 D 0 0 0 0 0 0 M ] ,   M = 1 2 ( A B ) ,
A = 4 μ ( λ + μ ) λ + 2 μ + N Q 2 , B = 2 λ μ λ + 2 μ + N Q 2 , C = N , F = N Q , N 1 λ + 2 μ 1 , Q λ λ + 2 μ , D = 1 μ 1 , M = μ . ,
In these formulas λ is the Lamé parameter that can be found from the bulk and shear moduli as follows: λ = K 2 3 μ .
To find the velocities in any arbitrary direction, the Green–Christoffel equation should be applied. Specifically, the Vp velocities in the vertical and horizontal directions can be found as follows:
V P v e r t = C ρ , V P h o r t = A ρ . ,

References

  1. Dugan, B.; Sheahan, T.C. Offshore sediment overpressures of passive margins: Mechanisms, measurement, and models. Rev. Geophys. 2012, 50, 1–20. [Google Scholar] [CrossRef]
  2. Bruce, B.; Bowers, G. Pore pressure terminology. Lead. Edge 2002, 21, 170–173. [Google Scholar] [CrossRef]
  3. Pinkston, F.W.M.; Flemings, P.B. Overpressure at the Macondo Well and its impact on the Deepwater Horizon blowout. Sci. Rep. 2019, 9, 7047. [Google Scholar] [CrossRef] [PubMed]
  4. Moernaut, J.; Wiemer, G.; Reusch, A.; Stark, N.; De Batist, M.; Urrutia, R.; Ladrón de Guevara, B.L.; Kopf, A.; Strasser, M. The influence of overpressure and focused fluid flow on subaquatic slope stability in a formerly glaciated basin: Lake Villarrica (South-Central Chile). Mar. Geol. 2017, 383, 35–54. [Google Scholar] [CrossRef]
  5. Tobin, H.J.; Saffer, D.M. Elevated fluid pressure and extreme mechanical weakness of a plate boundary thrust, Nankai Trough subduction zone. Geology 2009, 37, 679–682. [Google Scholar] [CrossRef]
  6. Tingay, M.R.P.; Hillis, R.R.; Swarbrick, R.E.; Morley, C.K.; Damit, A.R. Origin of overpressure and pore-pressure prediction in the Baram province, Brunei. AAPG Bull. 2009, 93, 51–74. [Google Scholar] [CrossRef]
  7. Yin, Z.; Linga, P. Methane hydrates: A future clean energy source. Chin. J. Chem. Eng. 2019, 27, 2026–2036. [Google Scholar] [CrossRef]
  8. Bhatnagar, G.; Chapman, W.G.; Hirasaki, G.J.; Dickens, G.R.; Dugan, B. Effect of Overpressure on Gas Hydrate Distribution. In Proceedings of the 6th International Conference on Gas Hydrates (ICGH 2008), Vancouver, BC, Canada, 6–20 July 2008. [Google Scholar]
  9. Ren, J.; Liu, X.; Niu, M.; Yin, Z. Effect of sodium montmorillonite clay on the kinetics of CH4 hydrate—Implication for energy recovery. Chem. Eng. J. 2022, 437, 135368. [Google Scholar] [CrossRef]
  10. Li, C.; Zhan, L.; Lu, H. Mechanisms for Overpressure Development in Marine Sediments. J. Mar. Sci. Eng. 2022, 10, 490. [Google Scholar] [CrossRef]
  11. Vardy, M.E.; Vanneste, M.; Henstock, T.J.; Clare, M.A.; Forsberg, C.F.; Provenzano, G. State-of-the-art remote characterization of shallow marine sediments: The road to a fully integrated solution. Near Surf. Geophys. 2017, 15, 387–402. [Google Scholar] [CrossRef]
  12. Pinson, L.; Vardy, M.; Dix, J.; Henstock, T.; Bull, J.; Maclachlan, S. Deglacial history of glacial lake Windermere, UK: Implications for the central British and Irish Ice Sheet. J. Quat. Sci. 2013, 28, 83–94. [Google Scholar] [CrossRef]
  13. Morgan, E.; Vanneste, M.; Lecomte, I.; Baise, L.; Longva, O.; McAdoo, B. Estimation of free gas saturation from seismic reflection surveys by the genetic algorithm inversion of a P-wave attenuation model. Geophysics 2012, 77, R175–R187. [Google Scholar] [CrossRef]
  14. Toth, Z.; Spiess, V.; Kiell, H. Frequency dependence in seismoacoustic imaging of shallow free gas due to gas bubble resonance. J. Geophys. Res. Solid Earth 2015, 120, 8056–8072. [Google Scholar] [CrossRef]
  15. Neuzil, C.E. Interpreting fluid pressure anomalies in shallow intraplate argillaceous formations. Geophys. Res. Lett. 2015, 42, 4801–4808. [Google Scholar] [CrossRef]
  16. Yu, H.; Hilterman, F.J. The effect of pressure on rock properties in the Gulf of Mexico: Comparison between compaction disequilibrium and unloading. Interpretation 2014, 2, SB1–SB15. [Google Scholar] [CrossRef]
  17. Li, C.; Zhang, L.; Luo, X.; Wang, B.; Lei, Y.; Cheng, M.; Luo, H.; Wang, C.; Yu, L. Modeling of Overpressure Generation–Evolution of the Paleogene Source Rock and Implications for the Linnan Sag, Eastern China. Front. Earth Sci. 2022, 10, 829322. [Google Scholar] [CrossRef]
  18. Nifuku, K.; Kobayashi, Y.; Araki, Y.; Ashida, T.; Taniwaki, T. Overpressure evolution controlled by spatial and temporal changes in the sedimentation rate: Insights from a basin modelling study in offshore Suriname. Basin Res. 2020, 33, 1293–1314. [Google Scholar] [CrossRef]
  19. Prasad, M. Acoustic measurements in unconsolidated sands at low effective pressure and overpressure detection. Geophysics 2002, 67, 405–412. [Google Scholar] [CrossRef]
  20. Scott, C.L.; Shillington, D.J.; Minshull, T.A.; Edwards, R.A.; Brown, P.J. Wide-angle seismic data reveal extensive overpressures in the Eastern Black Sea Basin. Geophys. J. Int. 2009, 178, 1145–1163. [Google Scholar] [CrossRef]
  21. Marin-Moreno, H.; Minshull, T.A.; Edwards, R.A. Inverse modelling and seismic data constraints on overpressure generation by disequilibrium compaction and aquathermal pressuring: Application to the Eastern Black Sea Basin. Geophys. J. Int. 2013, 194, 814–833. [Google Scholar] [CrossRef]
  22. Bosch, M.; Mukerji, T.; Gonzalez, E. Seismic inversion for reservoir properties combining statistical rock physics and geostatistics: A review. Geophysics 2010, 75, A165–A176. [Google Scholar] [CrossRef]
  23. Wagner, C.; Gonzalez, A.; Agarwal, V.; Koesoemadinata, A.; Ng, D.; Trares, S.; Biles, N.; Fisher, K. Quantitative application of poststack acoustic impedance inversion to subsalt reservoir development. Lead. Edge 2012, 31, 528–537. [Google Scholar] [CrossRef]
  24. Vardy, M.E. Deriving shallow-water sediment properties using post-stack acoustic impedance inversion. Near Surf. Geophys. 2015, 13, 143–154. [Google Scholar] [CrossRef]
  25. Ariful Islam, S.M.; Shofiqul Islam, M.; Hossain, M.M. Investigation of fluid properties and their effect on seismic response: A case study of Fenchuganj gas field, Surma Basin, Bangladesh. Int. J. Oil Gas Coal Technol. 2014, 2, 36–54. [Google Scholar] [CrossRef]
  26. Bahamaei, Z.; Hosseini, E. Pore pressure prediction using seismic velocity modeling: Case study, Sefid-Zakhor gas field in Southern Iran. J. Pet. Explor. Prod. Technol. 2020, 10, 1051–1062. [Google Scholar] [CrossRef]
  27. Provenzano, G.; Zervos, A.; Vardy, M.E.; Henstock, T.J. Characterization of shallow overpressure in consolidating submarine slopes via seismic full waveform inversion. Q. J. Eng. Geol. Hydrogeol. 2020, 53, 366–377. [Google Scholar] [CrossRef]
  28. Hornbach, M.J.; Manga, M. The ability of rock physics models to infer marine in situ pore pressure. Geochem. Geophys. Geosystems 2014, 15, 4769–4780. [Google Scholar] [CrossRef]
  29. Dubinya, N.; Bayuk, I.; Hortov, A.; Myatchin, K.; Pirogova, A.; Shchuplov, P. Prediction of Overpressure Zones in Marine Sediments Using Rock-Physics and Other Approaches. J. Mar. Sci. Eng. 2022, 10, 1127. [Google Scholar] [CrossRef]
  30. Nguyen, P.K.T.; Nam, M.J. A Review on Methods for Constructing Rock Physics Model of Saturated Reservoir Rock for Time-Lapse Seismic. Geosystem Eng. 2011, 14, 95–107. [Google Scholar] [CrossRef]
  31. Bagriy, I.D.; Voitsitsky, Z.I.; Maslun, N.V.; Naumenko, U.Z.; Aksem, S.D.; Grieg, M.Y. Integrated geological-structural-thermo-atmo-geochemical studies—A tool for forecasting and searching for hydrocarbons and methane hydrates on the continental slope of the Black Sea. In Geology and Mineral Resources of the World Ocean; National Academy of Sciences of Ukraine: Kyiv, Ukraine, 2014; Volume 4, pp. 24–47. [Google Scholar]
  32. Gozhik, P.F.; Maslun, N.V.; Plotnikova, L.F.; Ivanik, M.M.; Yakushin, L.M.; Ishchenko, I.I. Stratigraphy of the Meso-Cenozoic Clades of the Peninsular-Western Shelf of the Black Sea; Institute of Geological Sciences of the National Academy of Sciences of Ukraine: Kyiv, Ukraine, 2006; 171p. [Google Scholar]
  33. Maslun, N.V.; Ivanik, M.M.; Tsikhotska, N.N.; Klyushina, G.V. Detailed Stratification of Maikop Clade in the Peninsula-Zahodny Shelf of the Black Sea/Biostratigraphic Criteria for the Analysis and Correlations in the Clade of the Phanerozoic of Ukraine; Institute of Geological Sciences of the National Academy of Sciences of Ukraine: Kyiv, Ukraine, 2005; pp. 153–159. [Google Scholar]
  34. Schneider, J.; Flemings, P.B.; Dugan, B.; Long, H.; Germaine, J.T. Overpressure and consolidation near the seafloor of Brazos-Trinity Basin IV, northwest deepwater Gulf of Mexico. J. Geophys. Res. 2009, 114, B05102. [Google Scholar] [CrossRef]
  35. Becker, D.E.; Crooks, J.H.A.; Been, K.; Jefferies, M.G. Work as a criterion for determining in situ and yield stresses in clays. Can. Geotech. J. 1987, 24, 549–564. [Google Scholar] [CrossRef]
  36. Saffer, D.M.; Silver, E.A.; Fisher, A.T.; Tobin, H.; Moran, K. Inferred pore pressures at the Costa Rica subduction zone: Implications for dewatering processes. Earth Planet. Sci. Lett. 2000, 177, 193–207. [Google Scholar] [CrossRef]
  37. Dugan, B.; Germaine, J. Near-seafloor overpressure in the deep-water Mississippi Canyon, northern Gulf of Mexico. Geophys. Res. Lett. 2008, 35, L02304. [Google Scholar] [CrossRef]
  38. Mavko, G.; Mukerdji, T.; Dvorkin, J. Rock Physics Handbook, 3rd ed.; Cambridge University Press: Cambridge, UK, 2020; pp. 220–308. [Google Scholar]
  39. Gassmann, F. Über die Elastizität poröser Medien. Vierteljahrsschr. Naturforschenden Ges. Zur. 1951, 96, 1–23. [Google Scholar]
  40. Mindlin, R.D. Compliance of elastic bodies in contact. J. Appl. Mech. 1949, 16, 259–268. [Google Scholar] [CrossRef]
  41. Hashin, Z.; Shtrikman, S. A variational approach to the elastic behavior of multiphase materials. J. Mech. Phys. Sol. 1963, 11, 127–140. [Google Scholar] [CrossRef]
  42. Avseth, P.; Mavko, G.; Dvorkin, J.; Rykkje, J. Diagnosing high-porosity sands for reservoir characterization using sonic and seismic. In SEG Technical Program Expanded Abstracts; 1998; pp. 1024–1027. [Google Scholar] [CrossRef]
  43. Dvorkin, J.; Prasad, M.; Sakai, A.; Lavoie, D. Elasticity of marine sediments: Rock physics modeling. Geophys. Res. Lett. 1999, 26, 1781–1784. [Google Scholar] [CrossRef]
  44. Berryman, J.G. Long-wavelength propagation in composite elastic media. J. Acoust. Soc. Am. 1980, 68, 1809–1831. [Google Scholar] [CrossRef]
  45. Mavko, G.; Mukerji, T.; Dvorkin, J. The Rock Physics Handbook. In Tools for Seismic Analysis of Porous Media, 2nd ed.; Cambridge University Press: Cambridge, UK, 2009; p. 234. [Google Scholar]
  46. Aki, K.; Richards, P.G. Quantitative Seismology; University Science Books: Melville, NY, USA, 2002. [Google Scholar]
  47. Backus, G.E. Long-wave elastic anisotropy produced by horizontal layering. J. Geophys. Res. 1962, 67, 4427–4440. [Google Scholar] [CrossRef]
  48. Pirogova, A.S.; Tikhotskii, S.A.; Tokarev, M.Y.; Suchkova, A.V. Estimation of Elastic Stress-Related Properties of Bottom Sediments via the Inversion of Very- and Ultra-High-Resolution Seismic Data. Izv. Atmos. Ocean. Phys. 2019, 55, 1755–1765. [Google Scholar] [CrossRef]
  49. Souza, L.A.P. Shallow-Water Sub-Bottom Seismic Investigation: A Multi-Frequency Approach. Braz. J. Geophys. 2022, 40, 1–8. [Google Scholar] [CrossRef]
  50. Zaitsev, D.S.; Avdyukhina, M.; Ryzhkov, I.; Evseev, E.; Egorov, V.; Agafonov, V. Frequency response and self-noise of the MET hydrophone. J. Sens. Sens. Syst. 2018, 7, 443–452. [Google Scholar] [CrossRef]
  51. Meng, Z.; Chen, W.; Wang, J.; Hu, X.; Chen, M.; Zhang, Y. Recent Progress in Fiber-Optic Hydrophones. Photonic Sens. 2021, 11, 109–122. [Google Scholar] [CrossRef]
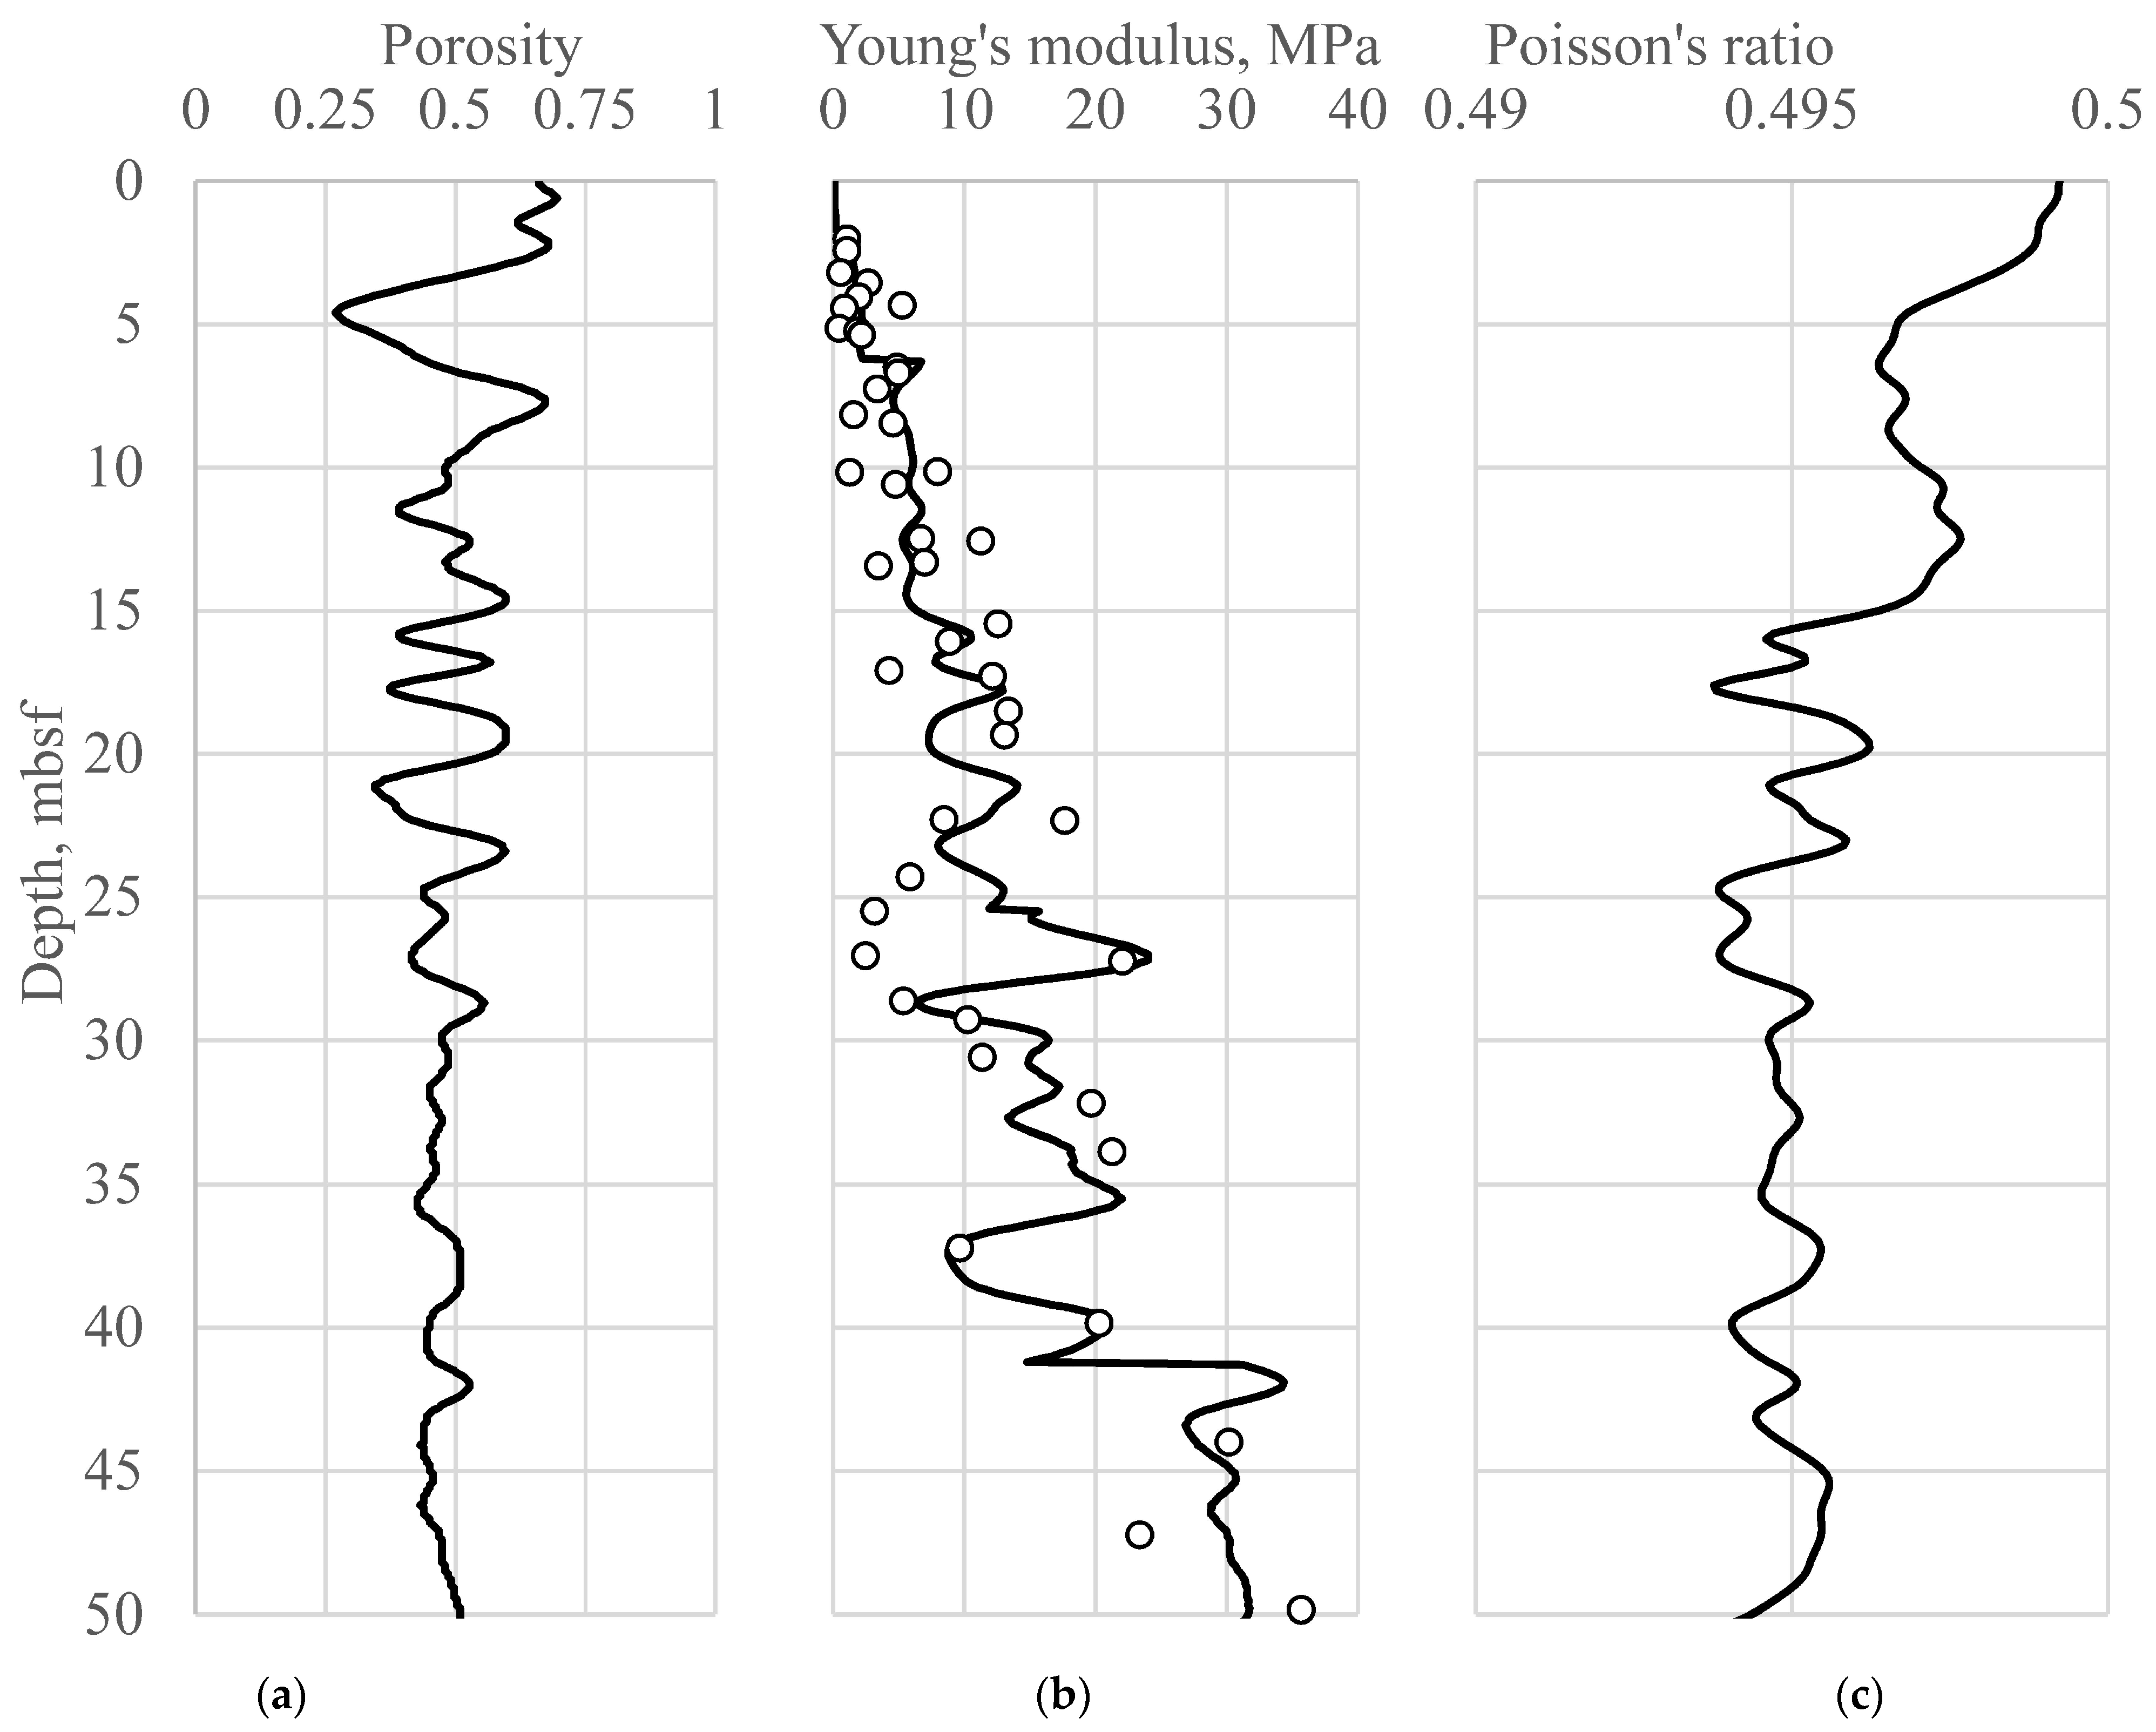
Figure 1. Model of mechanical properties along the studied well trajectory. (a) Porosity (in fractions of a unit); (b) Static Young’s modulus (adapted from the dynamic Young’s modulus obtained after seismic inversion). Dots represent results of static loading tests on extracted samples. (c) Static and dynamic Young’s moduli are considered equal to each other. The figure is adapted from [29].
Jmse 11 01803 g001
Figure 2. Results of pore pressure prediction profiles for the projected well. Adapted from [29].
Jmse 11 01803 g002
Figure 3. Results of Vp modeling for initial data of the projected well obtained with the new RP model presented in this paper (left, (a,b)) and with Dvorkin et al.’s [43] model (right, (c)). Abbreviation coeff is the “porosity correction coefficient”. Digits in legends are related to A = 0, 0.5, 0.99.
Jmse 11 01803 g003
Figure 4. Results of Vs modeling for initial data of the projected well obtained with the new RP model presented in this paper (left, (a,b) and with Dvorkin et al.’s [43] model (right, (c)). Abbreviation and legends are as for Figure 3.
Jmse 11 01803 g004
Figure 5. Synthetic Vp and Vs logs constructed with the use of new RP model for critical pore pressure intervals shown in Table 1 (plots (af)).
Jmse 11 01803 g005aJmse 11 01803 g005b
Figure 6. Elastic wave velocities Vp and Vs upscaled for 250 Hz (plots (af)).
Jmse 11 01803 g006aJmse 11 01803 g006b
Figure 7. Synthetic zero-offset seismic response of the rock physics models described above (traces indices correspond to the model number in Table 1. Trace 0 corresponds to the section without the anomalous pore pressure). The central frequencies of the seismic source are: (a,b) 750 Hz (ultrahigh resolution seismic, boomer source); (c,d) 500 Hz (very high resolution seismic, sparker source); (e,f) 250 Hz (high resolution seismic, air gun source); (a,c,d) are synthetic seismic traces. (b,d,f) are differences of the synthetic traces with respect to the trace 0 (no pressure anomalies).
Jmse 11 01803 g007
Figure 8. Synthetic depth-migrated, zero-offset seismic response of the rock physics models described above. Figures (af) show the same as in Figure 7 but versus depth.
Jmse 11 01803 g008
Table 1. Variants of critical pressure distribution along the projected well.
Number of VariantDepth Intervals of Critical Pore Pressure (mbsf)
16–9 (1 interval)
213–29 (1 interval)
337–43 (1 interval)
46–9, 37–43 (2 intervals)
56–9, 13–29, 37–43 (3 intervals)
613–15, 16–17, 18–20, 23–24.5, 28–30 (5 intervals)
Disclaimer/Publisher’s Note: The statements, opinions and data contained in all publications are solely those of the individual author(s) and contributor(s) and not of MDPI and/or the editor(s). MDPI and/or the editor(s) disclaim responsibility for any injury to people or property resulting from any ideas, methods, instructions or products referred to in the content.