1. Introduction
Even though rotating machines submerged in water have been widely used since a long time ago, their operation still represents a challenge today. For instance, rotating vortex ropes and vanless space vortex structures [
1,
2,
3,
4,
5] threaten the safe operation of hydraulic turbines. And large relative variations in head [
6], free surface vortices or upstream and downstream water level fluctuations [
7,
8] compromise the operation of marine and run-of-river turbines. In order to minimize the risks of these phenomena, it is of paramount importance to determine the modal responses, i.e., the natural frequencies, mode shapes, and damping ratios, of the machines. However, calculating their modal responses is always complex as the rotor is often composed of a runner, a shaft, an alternator, bearings, and seals, and this type of machine always has certain parts submerged in water, significantly affecting their modal responses [
9].
Historically, turbine manufacturers have studied their modal responses by means of rotor dynamic analysis considering that the turbines are in air or at most considering increases in the runner masses due to the added mass effect. Jasper [
10], Benkö et al. [
11], and Hofstad [
12] proposed a value for this added mass calculated through a rule of thumb. Later, Gustavsson et al. [
13] and Keto-Tokio et al. [
14] calculated the added mass by means of acoustic structural simulations and a method derived from Theodorsen’s unsteady thin airfoil theory. The added mass was found to significantly influence the natural frequencies of a rotor [
13,
14,
15].
In addition to the added mass, which is associated with the body’s acceleration, the fluid–structure interaction (FSI) also depends on the body’s displacement and velocity through the added stiffness and the added damping, respectively [
16,
17].
There have been a large number of investigations that have focused on the influence of the added coefficients on the modal responses of non-rotating structures submerged in water. For instance, Leblond et al. [
18] studied the added mass and damping of a non-rotating circular cylinder oscillating with a low amplitude and a high frequency in cylindrical confinement. The authors presented analytical equations for the added mass and damping, considering the fluid as incompressible and inviscid as well as incompressible and viscous. It was concluded that the analytical solutions underestimated both the added mass and damping.
The standing mode shapes, which are characteristics of non-rotating structures, become whirling mode shapes when a structure rotates. Both the rotation and the whirling motion may then influence the added coefficients. In this sense, Gandjalikhan et al. [
19] numerically investigated the added forces associated with body displacement, which were induced on a rotating cylinder with static eccentricity in cylindrical confinement. The pressure in the laminar flow was observed to increase as the fluid passed through the diverging part, such that the maximum and minimum pressure occurred upstream and downstream of the minimum film thickness. Moreover, the unfavorable pressure gradient in the circumferential direction was found to cause flow separation in the vicinity of the maximum fluid thickness. Similarly, Adibi et al. [
20] numerically investigated the incompressible viscous flow between eccentric rotating cylinders. The maximum and minimum pressures were also found downstream and upstream of the minimum film thickness. They concluded that the amount of shear stress and its gradient increased on the cylinder with an increase in eccentricity.
Magnus [
21] experimentally investigated the added forces associated with body velocity, which were induced by a flow passing through a rotating cylinder. The combined effects of cylinder rotation and translation inside a fluid led to an asymmetrical pressure distribution at the top and bottom of the cylinder, which flipped as the rotating direction changed. It was concluded that this asymmetrical pressure distribution resulted in an additional lift force called the Magnus effect. Prandtl [
22] also conducted experiments on a flow passing through a rotating cylinder. He stated that the maximum intensity of the lift coefficient due to the Magnus effect could not exceed 4π. Later, Glauert [
23] concluded that the intensity of the lift coefficient due to the Magnus effect might exceed 4π because a fluid body with a high velocity and high vorticity could break due to the centrifugal force and subsequently be carried away by the stream, increasing the circulation of the cylinder. More recently, Yao et al. [
24] numerically studied the flow passing through a rotating cylinder at supercritical Reynolds numbers. It was concluded that there was a linear relationship between the Magnus effect and the rotating speed ratio, i.e., the ratio of rotating speeds to flow velocities. On the other hand, it was observed that the drag coefficient decreased gradually to a certain value and subsequently remained constant when the rotating speed of the cylinder was increased. Ma et al. [
25] experimentally investigated the flow around a cylinder at Reynolds numbers from 4.6 × 10
4 to 5.1 × 10
5 for rotating speed ratios from 0 to 2. They concluded that the evolution of the drag coefficient and the Magnus effect depended on the flow state. For instance, in the subcritical flow state, the drag coefficient decreased at rotating speed ratios below one whilst it increased at rotating speed ratios above one whenever the speed ratio was increased. On the other hand, the Magnus effect continuously increased.
Most of the previous studies have focused on the added coefficients of oscillating non-rotating structures [
10,
11,
12,
13,
14,
18] or those of non-oscillating rotating structures [
19,
20,
21,
22,
23,
24,
25] when submerged in water. However, they have not studied rotating submerged structures presenting a whirling motion, which is the actual case of turbine runners. Despite the potential new added coefficients induced due to the rotation and whirling motion, no results have been published on their identification, origin, and/or evolution as a function of the rotating speed.
This work presents a study on the added modal coefficients of a rotating submerged cylinder when it presents a whirling motion. For this reason, a bespoke test rig was built, which consisted of a cylinder submerged in a cylindrical water tank and clamped to a shaft that could be rotated. The identification of added modal coefficients, their origin, their values, and their evolutions is presented and discussed as a function of the rotating speed. The direct measurement of the added modal forces and their corresponding added modal coefficients is complex and it implies an interaction between the dynamic response of the structure and the excitation system attached to it, which might influence their values. In order to minimize this interaction, the added modal coefficients were calculated indirectly from measured natural frequencies and damping ratios as well as from a proposed mathematical model of the system.
2. Experimental Setup
2.1. Test Rig
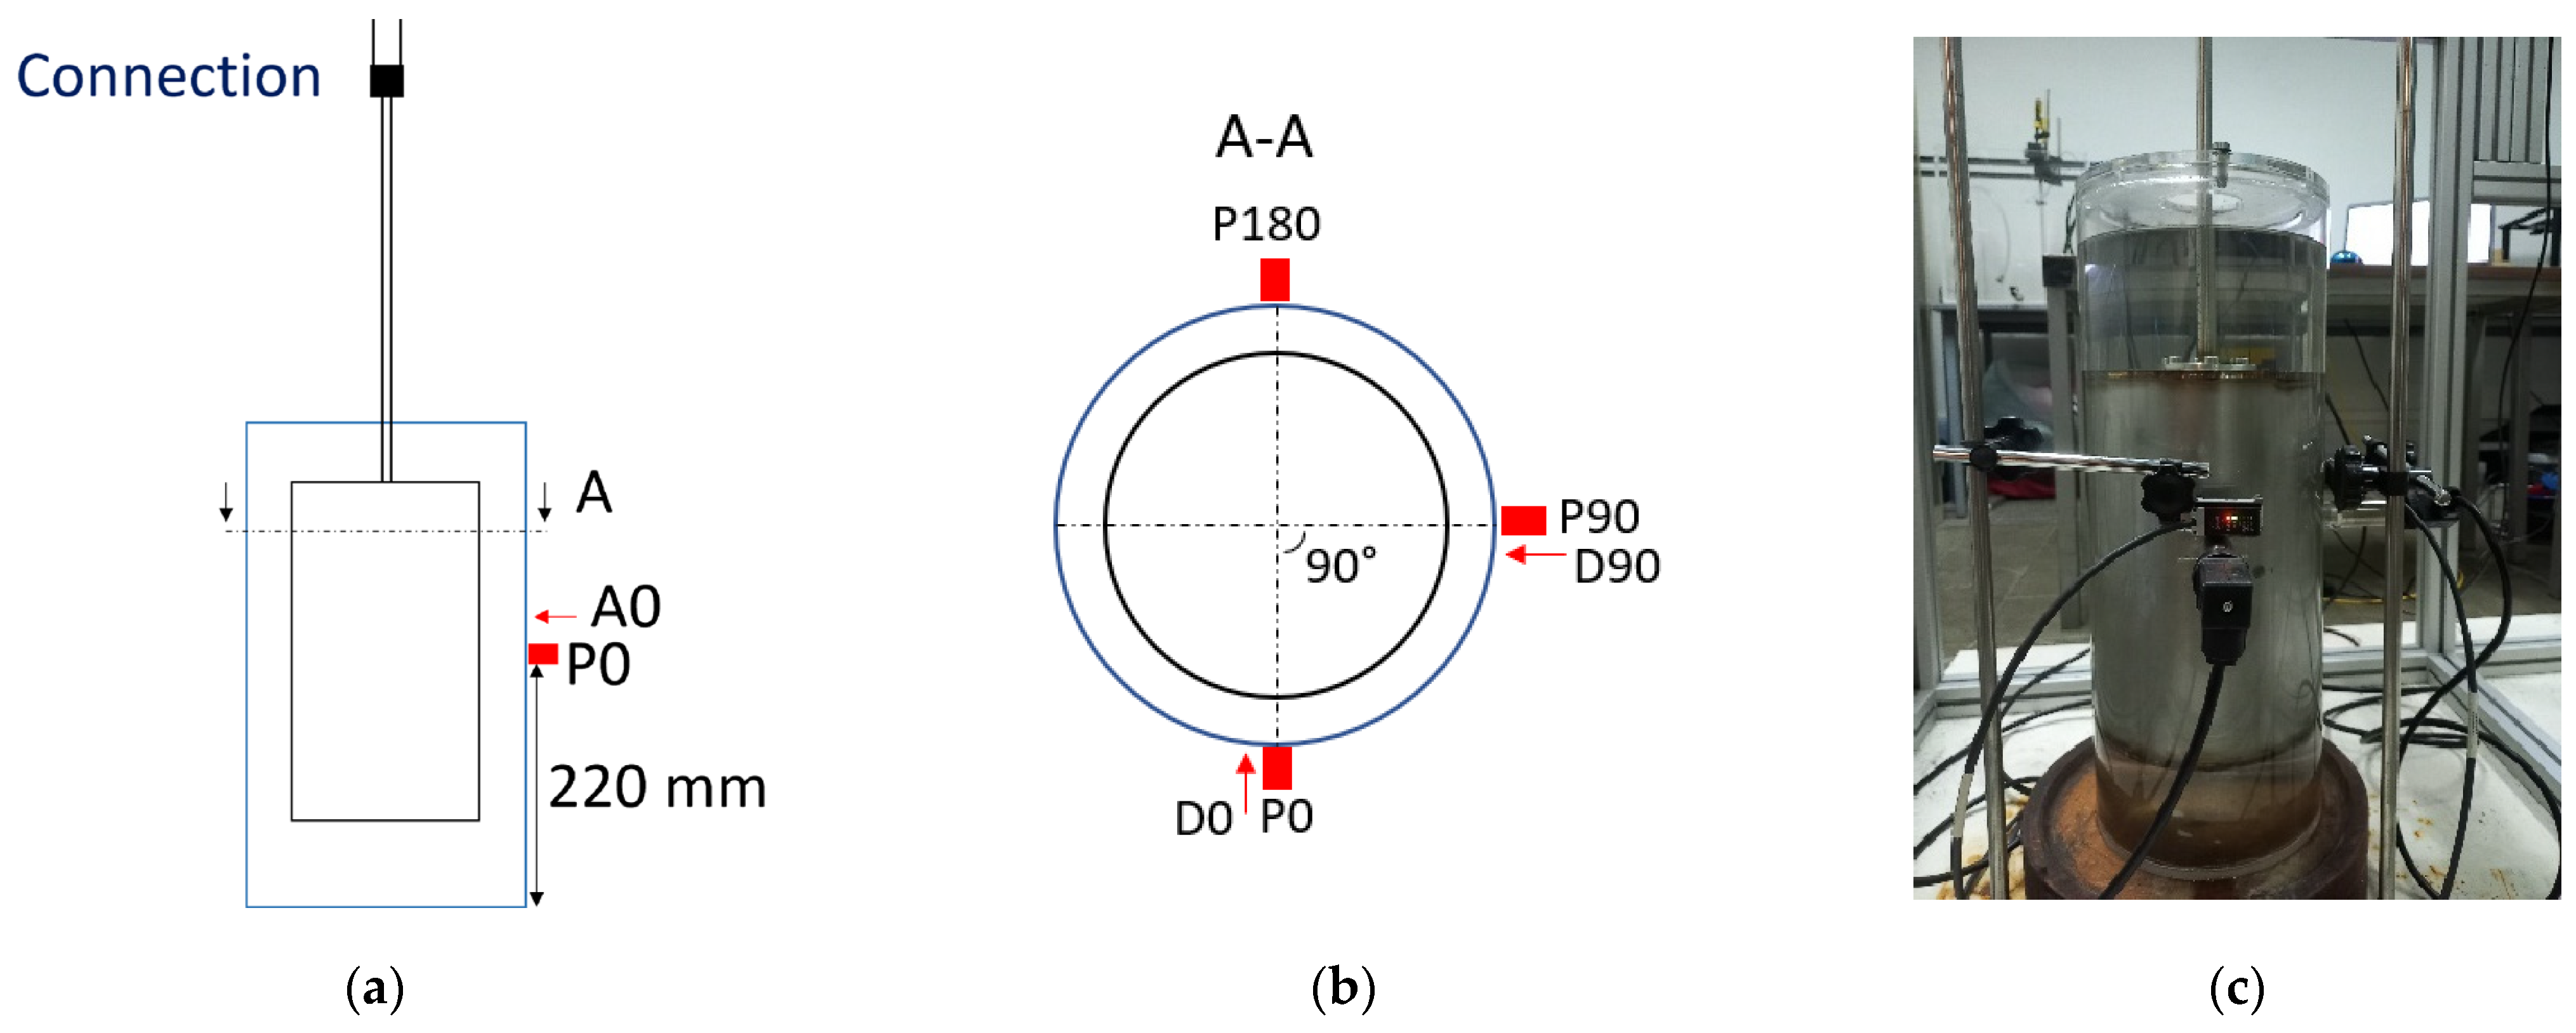
The test rig consisted of a long vertical stainless-steel shaft coupled to a stainless-steel cylinder through a screwed connection of six bolts, which could be partially submerged in a cylindrical water tank made of transparent methacrylate (see
Figure 1a,b). The shaft was composed of two parts: (i) a slim part, with external and internal diameters of 12 and 10 mm, respectively, and (ii) a thick part, with external and internal diameters of 30 and 24 mm, respectively. Both parts were coupled by means of six bolts (see the red square in
Figure 1a). The thickest part, supported by two ball bearings placed on an aluminum frame, was equipped with a driven pulley connected to a variable-speed motor (Crouzet SQ75) through a cog belt. The motor permitted the rotation of the system at different speeds (
) and carrying out ramps in
at different accelerations and in different frequency ranges.
Due to the measuring range of the laser displacement sensors, the gap between the external wall of the cylinder and the external wall of the water tank had to be around 25 mm. Since the water tank wall thickness was 10 mm, a maximum gap distance of 15 mm had to be chosen between the cylinder and the inner wall of the tank.
2.2. Instrumentation
In order to measure the radial movement at the midplane of the cylinder’s lateral wall, two laser displacement sensors, D0 and D90 (ILD1320-10), were fixed outside the water tank in off-board positions 90° apart from each other with their laser beams crossing the transparent methacrylate wall. Similarly, three pressure transducers, P0, P90, and P180 (UNIK5000: PMP5076-TA-A2-CA-H0-PB), were mounted flush on the inner surface of the water tank wall, also measuring the pressure fluctuations on the midplane 90° apart from each other, as shown in
Figure 2. These signals were digitalized and recorded using the National Instruments compact DAQ NI-cDAQ-9185 chassis equipped with the input current module NI-9253 for the laser displacement sensors and the input voltage module NI-9223 for the pressure sensors. The signals were measured and synchronized with a LabVIEW program and sampled at a frequency of 800 Hz.
On one hand, the 24-bit NI-9253 module had a measuring range of ±20 mA, a gain uncertainty of 0.41%, and an offset uncertainty of 0.08%, resulting in a total uncertainty of ±0.114 mA when measuring the maximum current of 20 mA. Similarly, the 16-bit NI-9223 module had a measuring range of ±10 V, a gain uncertainty of 0.2%, and an offset uncertainty of 0.1%, resulting in a total uncertainty of ±0.04 V when measuring the maximum voltage of 10 V.
On the other hand, the laser displacement sensors had a linearity uncertainty of 0.12%, a repeatability uncertainty of 0.1%, and an accuracy of 0.3%. Assuming a confidence interval of 95%, the random uncertainty of the laser displacement sensors was ±9.05 × 10⁻⁴ mm and the total uncertainty was ±0.09 mm when measuring the maximum displacement of 30 mm. Similarly, the pressure sensors had a linearity uncertainty of 0.1%, a repeatability uncertainty of 0.11%, and an accuracy of 0.1%. Assuming again a confidence interval of 95%, the random uncertainty of the pressure sensors was ±0.03 mbar and the total uncertainty was ±0.77 mbar when measuring the maximum pressure of 200 mbar.
3. Mathematical Model
Assuming that the two first identical but perpendicular eigenmodes of the dynamic system, and , are independent and orthogonal, the equations of motion of the cylinder are described using mode superposition. Consequently, the mathematical model only has two degrees of freedom with their corresponding modal displacements, and ; modal velocities, and ; and modal accelerations, and . When the cylinder does not rotate, the two degrees of freedom are not coupled and the system has two standing mode shapes, and ; two repeated natural frequencies, in air and in water; and two repeated damping ratios, in air and in water. When the cylinder rotates, the two degrees of freedom couple, resulting in two whirling modes. One of them whirls in the direction of the rotation and is referred to as the forward whirling mode (FW), and the other one whirls in the opposite direction to the rotation and is referred to as the backward whirling mode (BW). Each FW and BW mode has corresponding natural frequencies ( and in air and and in water) and damping ratios ( and in water).
3.1. Non-Rotating Cylinder in Air
Assuming that there are no external excitation forces, when the cylinder does not rotate in air, the dynamic equations are
where
is the structural modal mass,
is the structural modal stiffness, and
is the structural modal damping.
Assuming that the influence of
on the natural frequencies is negligible:
where
and
are the natural frequencies and
and
are the damping ratios in air.
can also be expressed as
where
and
are the density and volume of the structure, respectively.
3.2. Cylinder Rotating in Air
Assuming that, in the range of tested, the gyroscopic effects and other structural forces associated with the rotation and coupling of the two degrees of freedom have a negligible influence on the natural frequencies of the FW and BW, and have to be equal to and can be calculated using Equation (2).
3.3. Non-Rotating Cylinder in Water
When the cylinder submerged in water does not rotate and assuming that the structural damping is negligible compared to the fluid damping [
26], the dynamic equations are
where
is the added modal force exerted on the structure, which can also be expressed as
where
is the total added force exerted on the structure and
is the fluid–structure interface. Assuming that there are no external excitation forces and that there is a lineal dependency between the added modal damping,
, and the
and
as well as between the added modal mass,
, and the
and
, then
can be described as
Finally, Equation (5) can be rewritten as
Assuming that the influence of
on the natural frequencies is negligible:
where
and
are the natural frequencies and
and
are the damping ratios in water.
With the non-rotating cylinder oscillating in a cylindrical water tank while modeling the water as incompressible and viscous, a new added mass,
, and added damping,
, can be expressed based on the work from Chen et al. [
27,
28] as
where
is the length of the cylinder,
is the density of the fluid,
is the radius of the cylinder,
is the radius of the cylindrical water tank,
is the kinematic viscosity of the fluid,
is the dynamic viscosity of the fluid, and
is the oscillating frequency of the cylinder. It must be noted that
and
differ from
and
because they are defined assuming a pure radial displacement of the cylinder rather than based on the displacement induced by
.
3.4. Cylinder Rotating in Water
To the authors’ knowledge, no dynamic equation for a rotating cylinder submerged in a cylindrical water tank has been published in the literature up to now. In order to better reproduce experimental observations of the dynamic system, the incorporation of two new matrices in the dynamic equation, which are composed of two new added modal coefficients,
and
, was considered. It must be noted that both matrices couple the two degrees of freedom of the system.
induces an added modal force proportional and perpendicular to the modal velocity. This added modal force may have its origin in the Magnus effect [
21,
22,
23,
24,
25].
induces another added modal force proportional and perpendicular to the modal displacement. Assuming that the structural damping is negligible compared to the fluid damping [
26], the following dynamic equations are proposed:
where
is the added modal stiffness.
Equation (15) can be transformed to complex coordinates defining
as
and adding
times the second equation to the first equation:
Assuming that the influence of
and
on the natural frequencies is negligible, then:
From Equations (18) and (20), it must be noted that is always higher than .
Using complex coordinates, the natural frequencies can be positive or negative. A positive natural frequency means that the corresponding mode whirls in the direction of the rotation, and a negative one means that it whirls in the opposite direction to the rotation. Like in real coordinates, positive and negative damping ratios mean stable and unstable motion, respectively.
Assuming that
is associated with the Magnus effect, a new
can be expressed based on the work from the authors of [
21,
22,
23], who defined the Magnus force as
where
is the Magnus force exerted on a non-oscillating rotating cylinder located in a flow with velocity
. From Equation (15), it can be seen that
induces a force,
, defined as
Assuming that
is equivalent to
and that
is equivalent to
, the new
can be expressed as
It must be noted that differs from because it is defined based on the equation of the Magnus effect, which assumes that (i) the cylinder does not oscillate and is submerged in a water flow, i.e., a pure radial displacement of the cylinder; (ii) the cylinder is not confined in a cylindrical water tank; and (iii) the flow velocity is constant rather than oscillating due to the whirling motion.
Due to the complexity of the flow, no analytical equations can be developed for , , and for the case of the cylinder rotating in water.
4. Experimental Methodology
During steady conditions, the values of , , , , and were calculated indirectly from measured natural frequencies and damping ratios together with the proposed mathematical models in order to minimize the interaction with the dynamic system and to simplify the experimental setup. The natural frequencies and damping ratios of the cylinder rotating and not rotating in air and water were first excited through a push release and determined via a spectral analysis. Subsequently, the added modal coefficients were calculated by means of the mathematical models using the measured values of the natural frequencies and damping ratios. The steady tests were carried out at values of 0.00, 0.83, and 1.25 Hz in air and between 0.00 and 6.25 Hz in steps of approximately 0.20 Hz in water. In order to calculate averaged results, each test was repeated three times.
During transient conditions, ramps in with different accelerations were performed. In this case, the exact values of the added coefficients were not calculated but were assessed qualitatively based on the values of the natural frequencies and damping ratios excited by the system’s mechanical unbalance and determined via a spectral analysis. Each test was also repeated three times in order to calculate averaged results.
4.1. Measurement of Natural Frequencies, Damping Ratios, and Whirling Directions during Steady Conditions
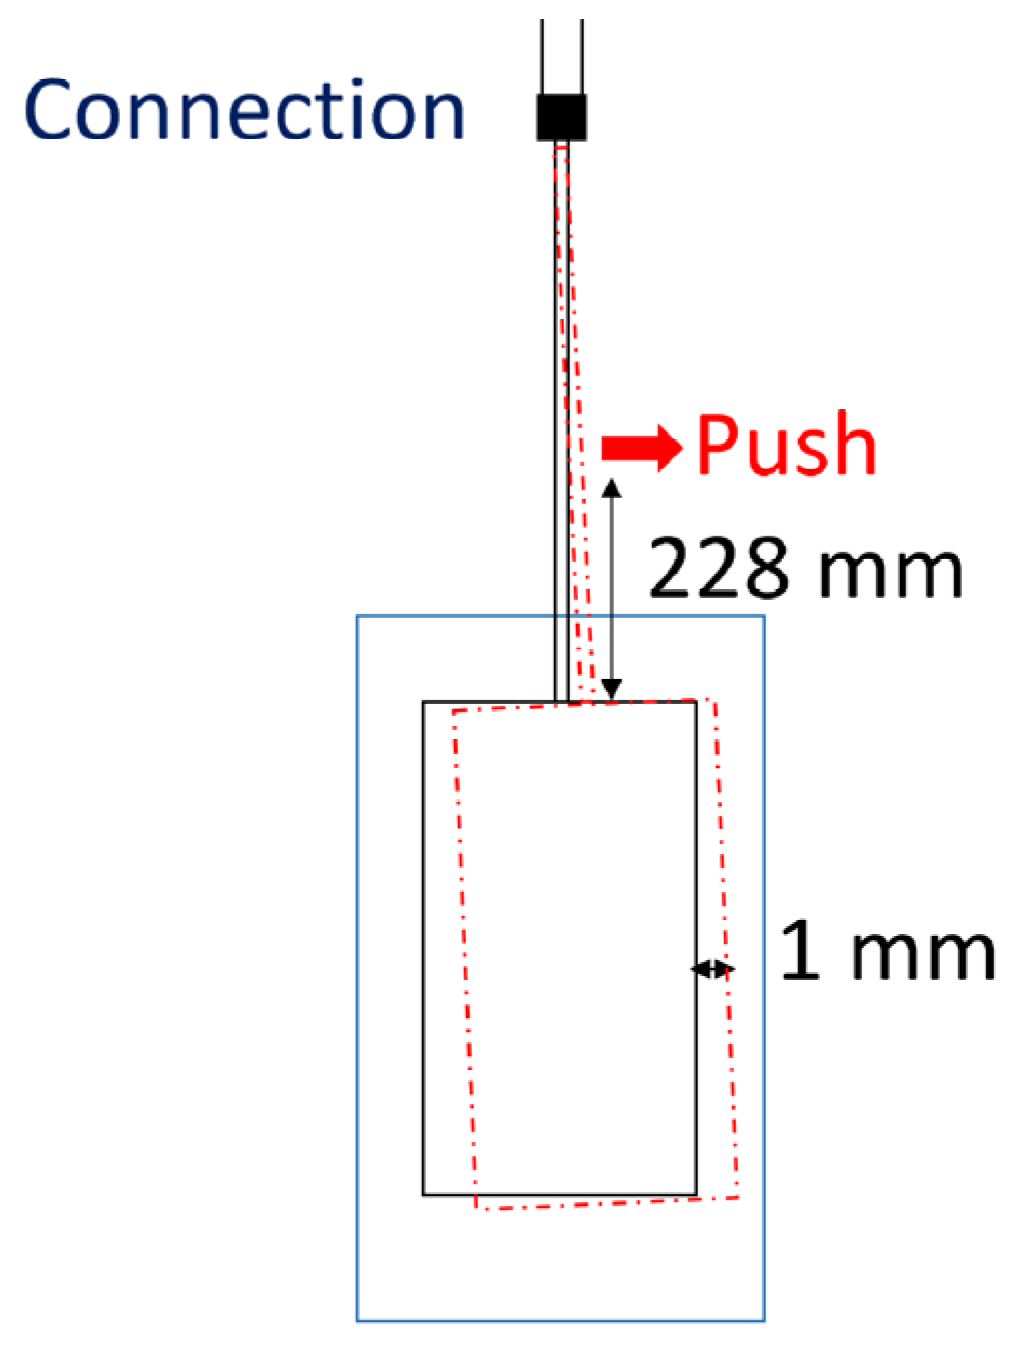
Natural frequencies were excited through a push release with a manual push applied to a slim shaft and its subsequent release, leaving the entire structure to oscillate freely. During all tests, with the cylinder not rotating and rotating in air and water, the cylinder was displaced from its equilibrium position by around 1 mm at the midplane by the push action (see
Figure 3).
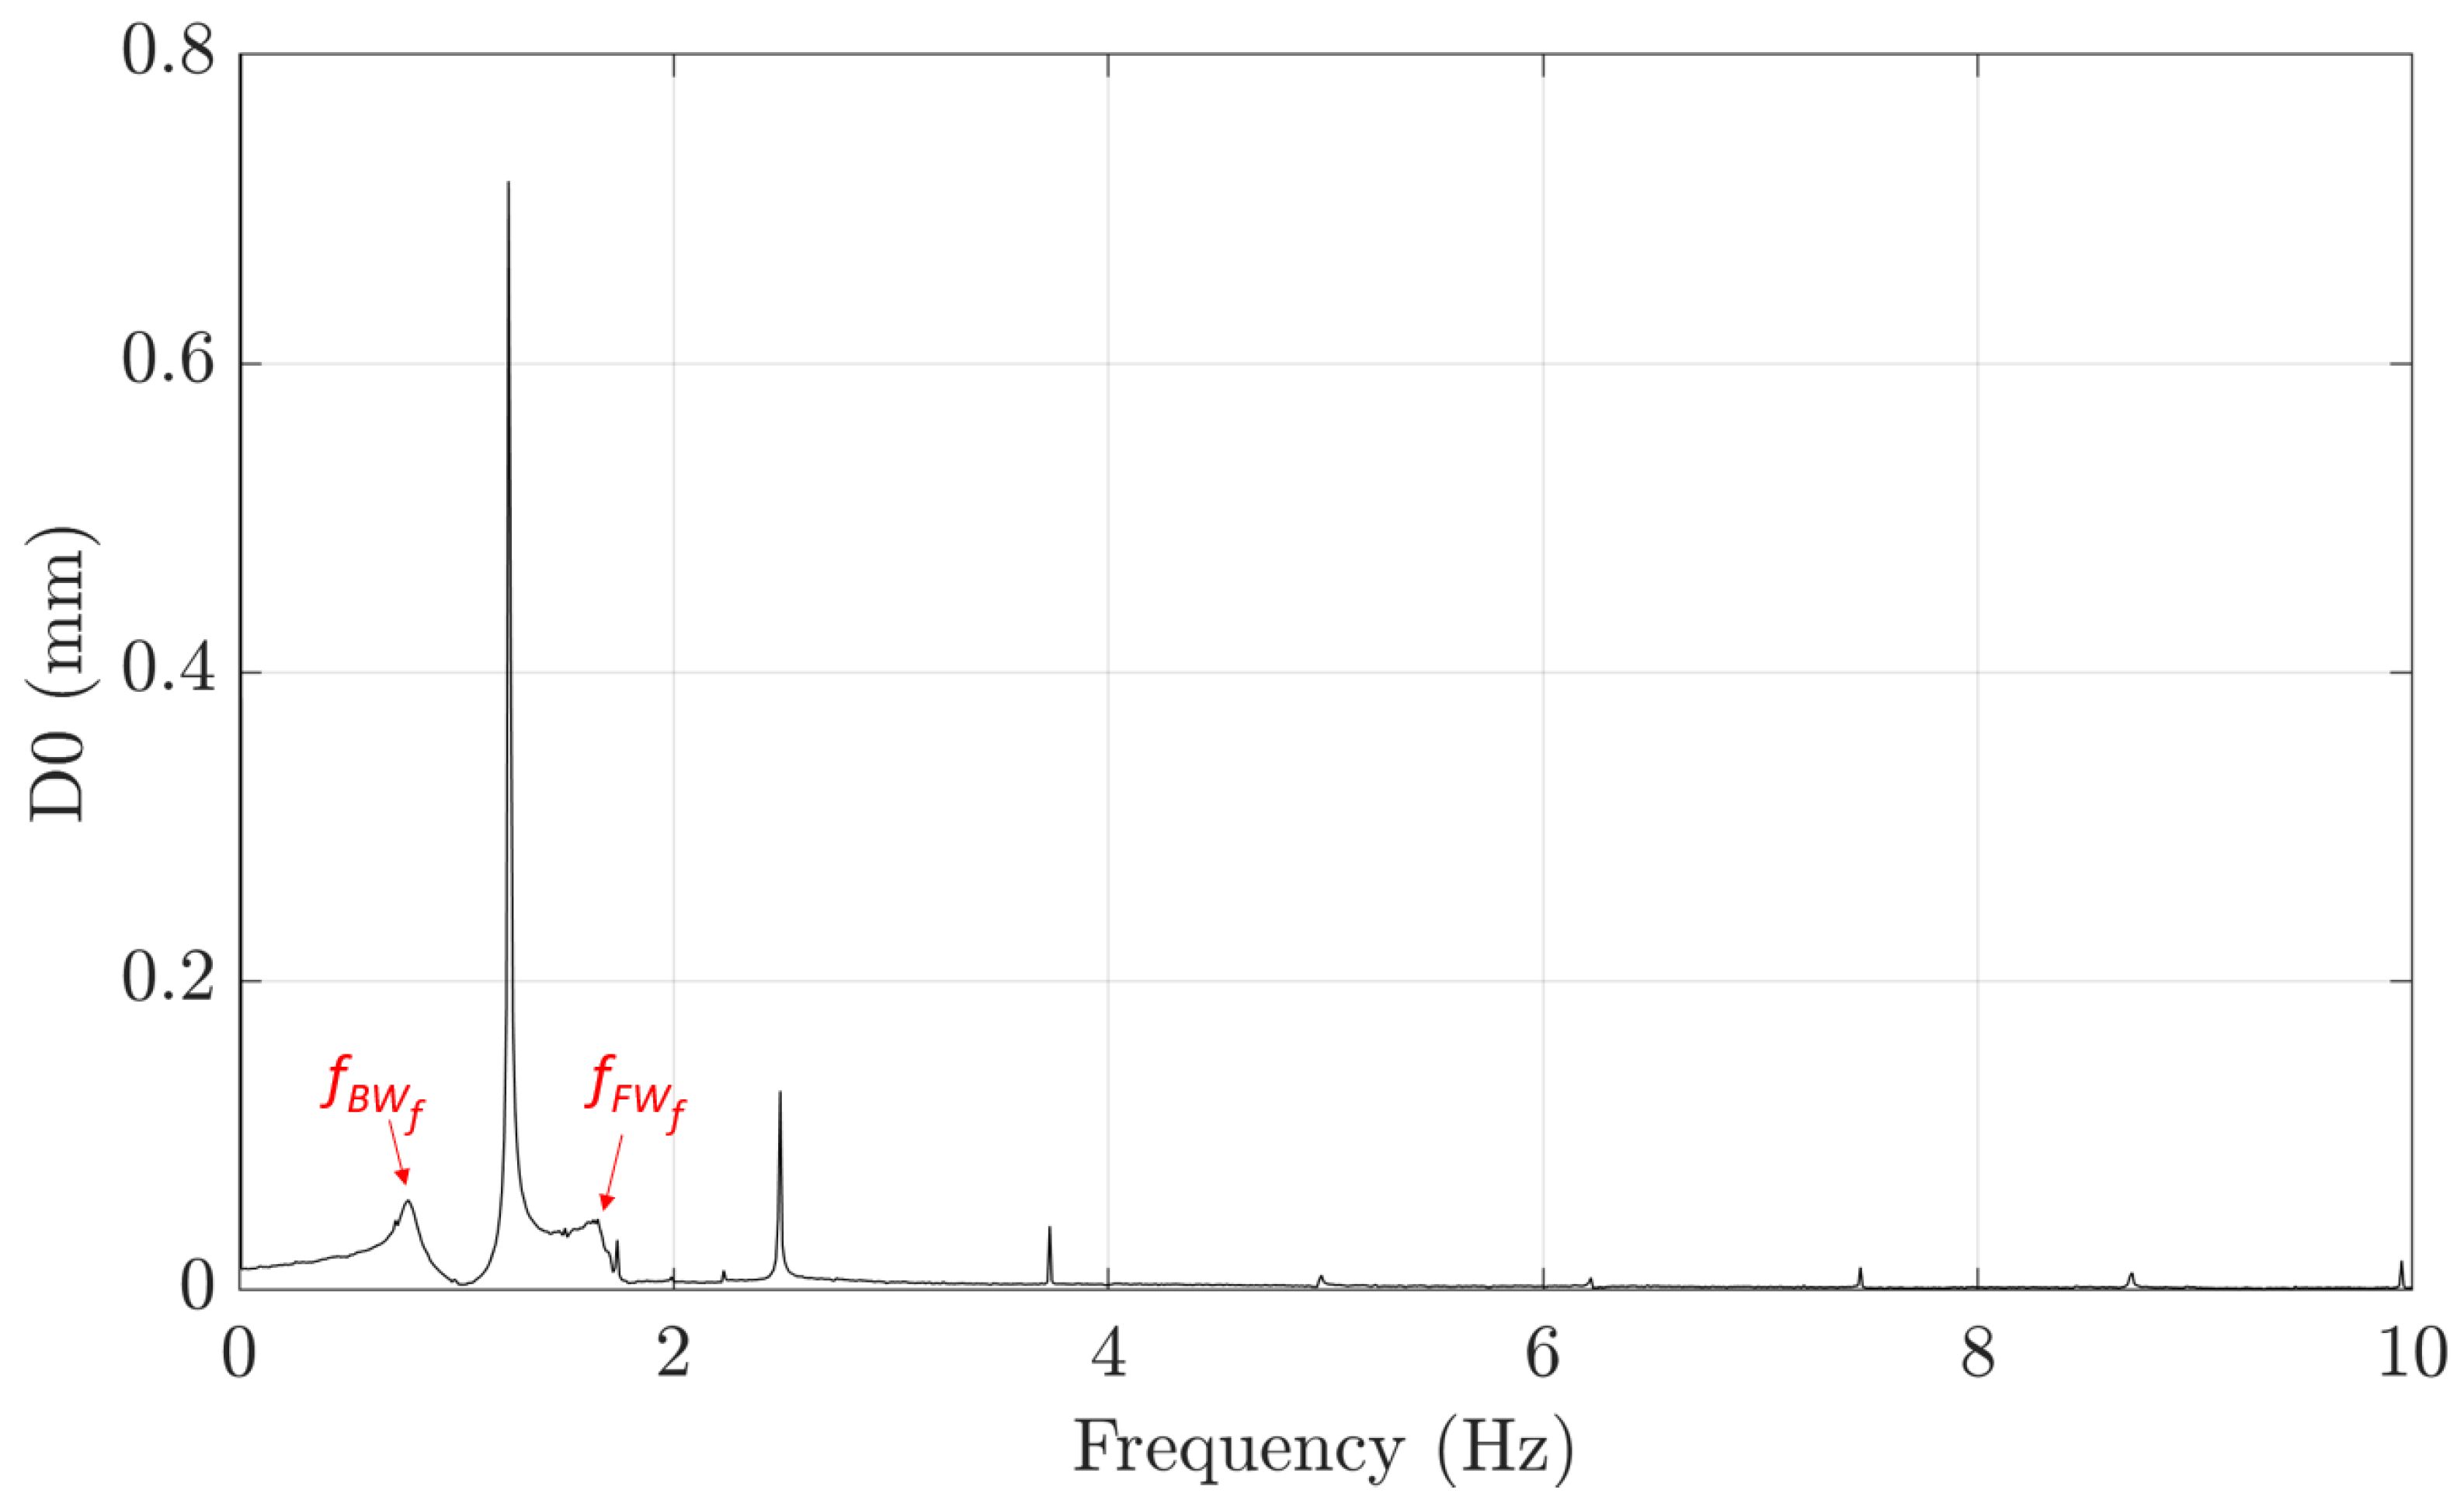
The values of the natural frequencies were identified from the averaged spectra of the cylinder displacement responses to the push release, calculated by means of a Fast Fourier Transform (FFT) with a Hanning window. All the signals had a length of 100 s and were acquired with a sampling rate of 800 Hz, resulting in a frequency resolution of 0.01 Hz in the spectra (see
Figure 4). Based on Equations (18) and (20), the peak at a lower frequency has to correspond to the
and that at a higher frequency has to correspond to the
.
The damping ratios were calculated using a curve-fitting algorithm applied to the displacement time signals induced by the push release and bandpass-filtered (see
Figure 5). The selected filter was an infinite impulse response filter of the Bessel type with one order. The center of the filter was adjusted to the value of the natural frequency and the band limits were set 0.25 Hz above and 0.25 Hz below the natural frequency. The curve-fitting algorithm is programmed to find the best fit for the filtered experimental signal based on Equation (25), which represents an ideal free decay motion. From the fitted curve, the value of the damping ratio,
, can be extracted given the known value of
, which corresponds to the initial displacement; the value of
, which corresponds to the initial velocity; and the value of
, which corresponds to the natural frequency.
where
is the temporal evolution of the amplitude.
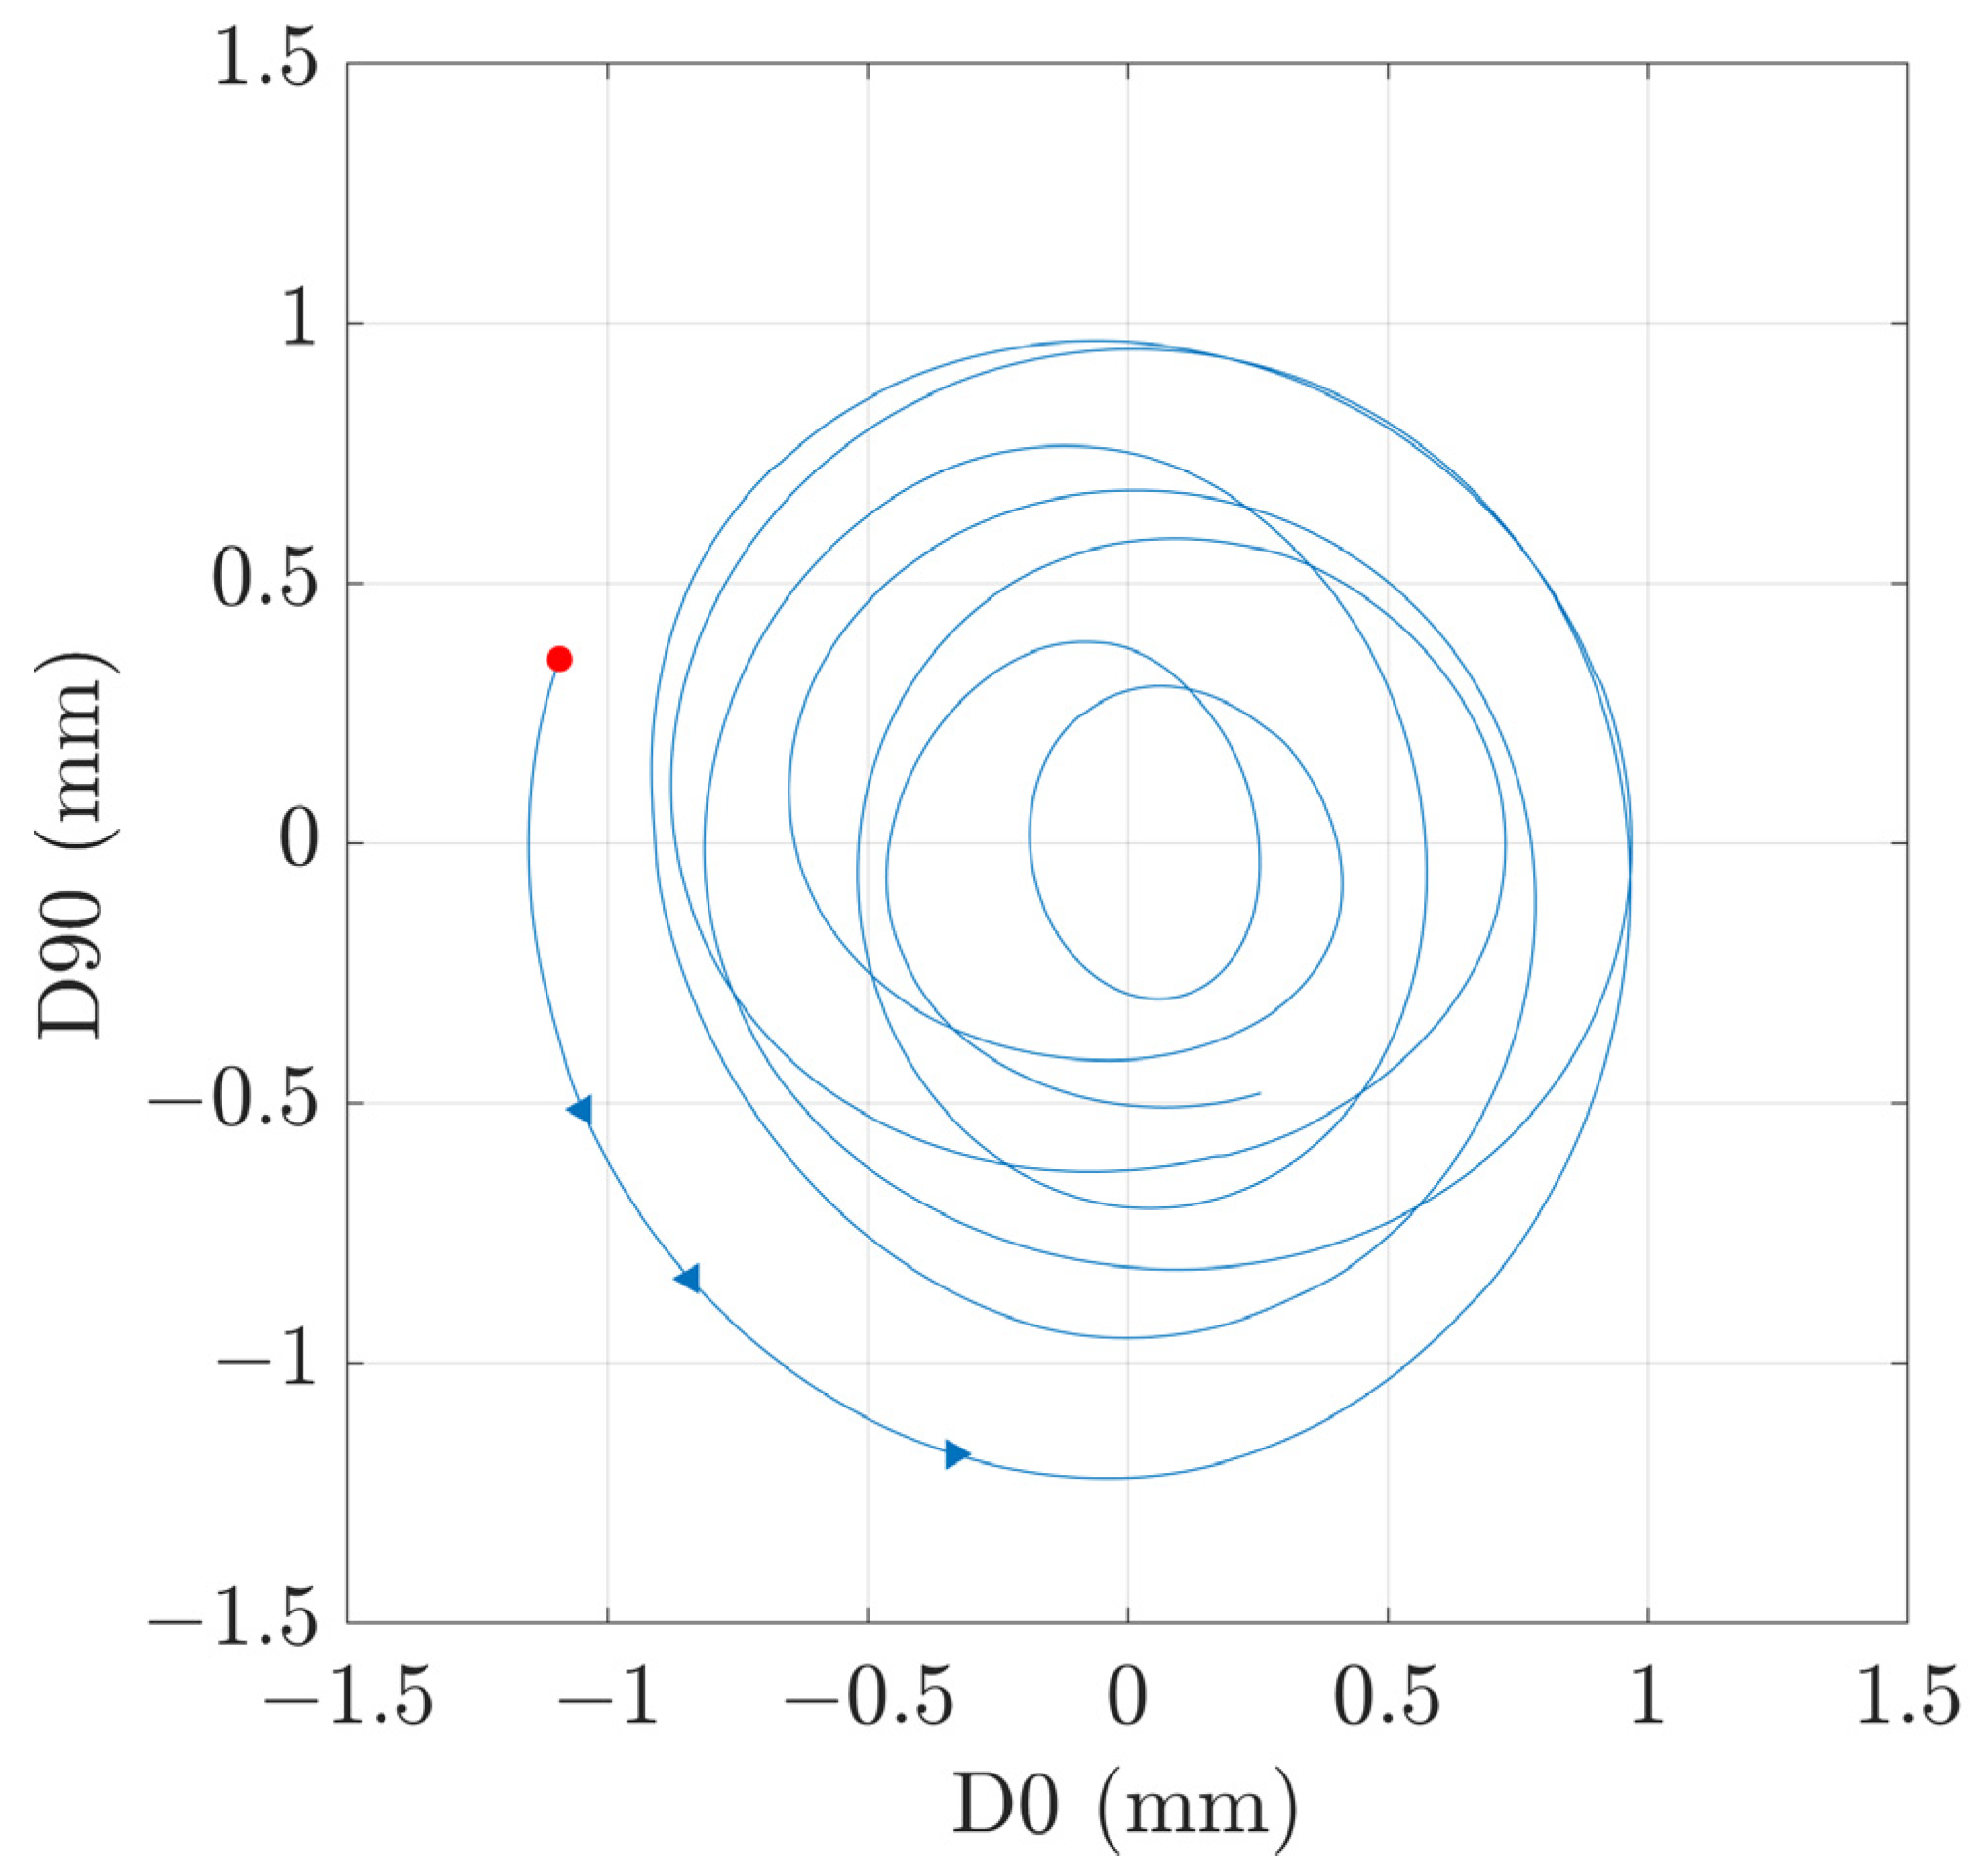
The direction of the whirling motion, corresponding to
and
, was identified from an orbit graph, which was plotted using the bandpass-filtered D0 and D90 displacement signals. More specifically, the center of the filter was adjusted to
or
and the band limits were set 0.25 Hz above and 0.25 Hz below the natural frequency. The filtered D0 and D90 signals were plotted on the horizontal and vertical axes, respectively, of a polar graph, as shown in
Figure 6.
4.2. Fluid-Added Modal Coefficient Calculation during Steady Conditions
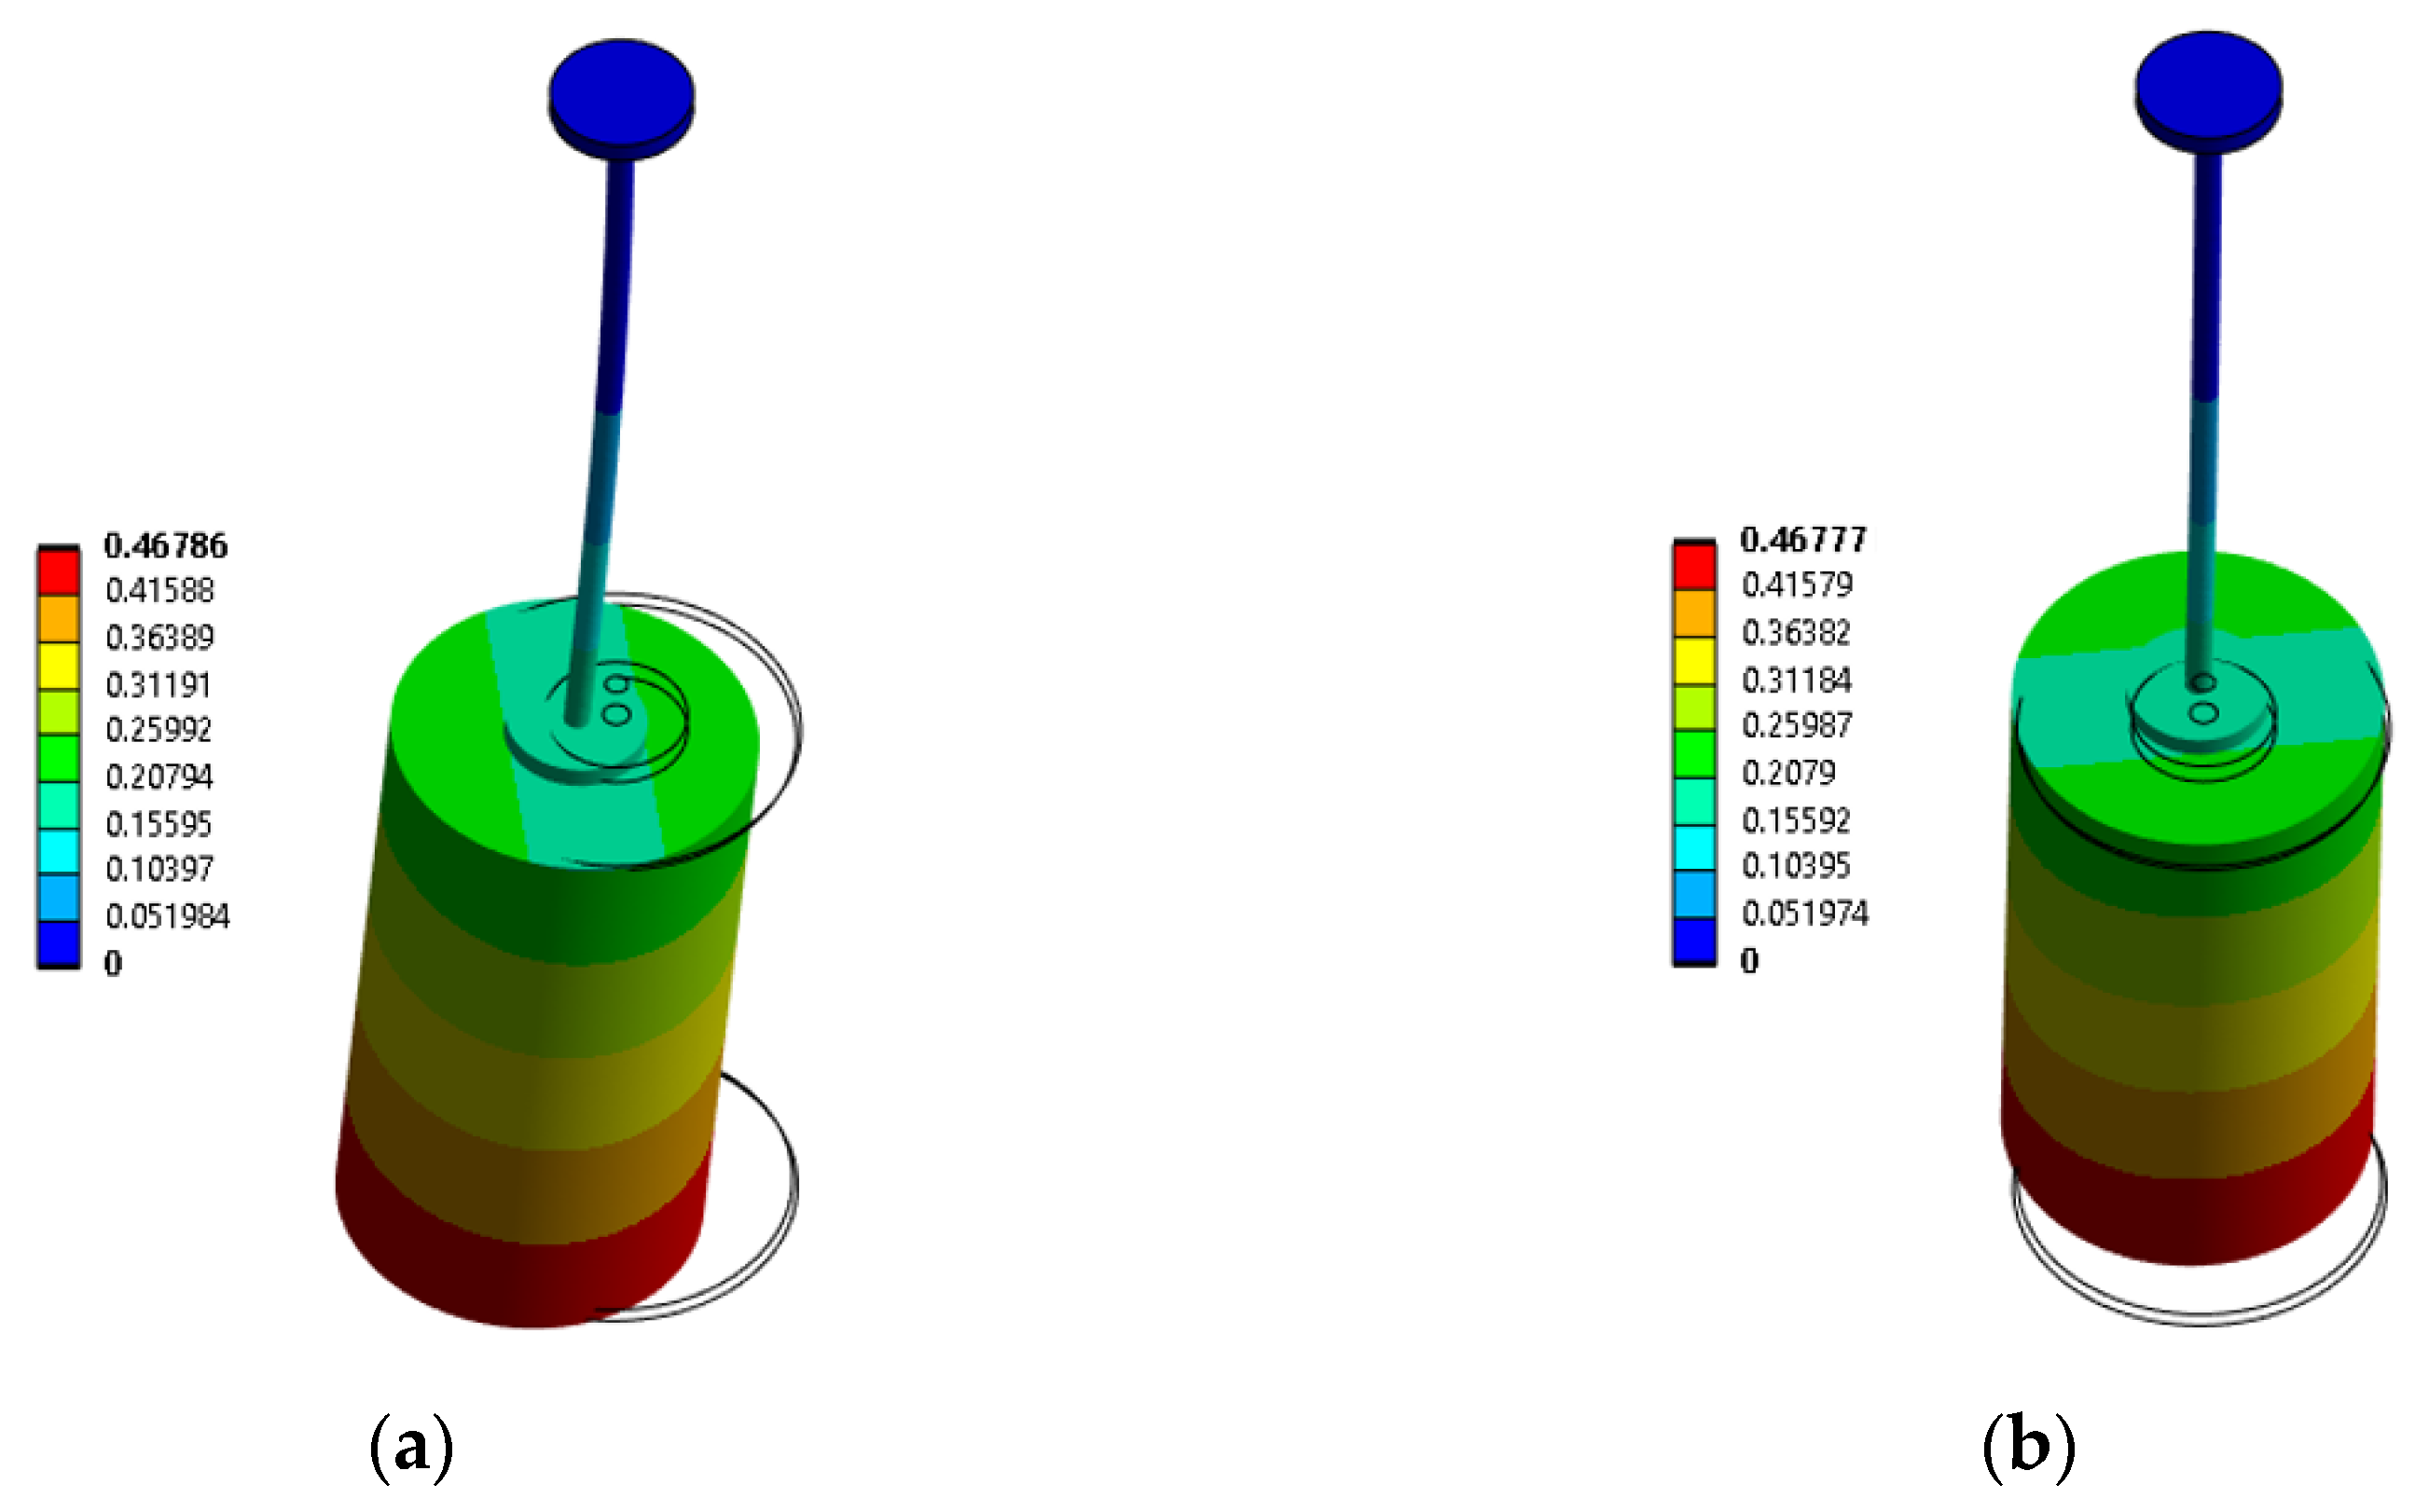
was calculated using Equation (4) and using the
of the non-rotating cylinder in air, which was computed by means of a numerical structural modal analysis. Only the cylinder and the slim shaft were included in the numerical model since the eigenmodes of interest only affected these two parts of the test rig. This could be confirmed by the fact that the top of the slim shaft presented zero displacement, as shown in
Figure 7, which in turn confirmed that the system’s dynamic response was isolated from the non-linearities of the bearings. It must be noted that a slim shaft was designed specifically for this purpose and that, in addition, it resulted in lower natural frequencies, which were also more convenient for carrying out the tests. Both the cylinder and the slim shaft were made of a standard stainless steel and modeled using tetrahedral elements (SOLID185). A mesh refinement process was carried out to determine the optimal mesh size that gives an accurate solution with a low computational cost based on the evolution of
with the number of mesh nodes (see
Table 1). The selected mesh had a total of 359,954 nodes.
Figure 7 presents the numerical mode shapes,
and
, of the cylinder before unity normalization.
Once
was calculated, first,
and
were computed using Equations (2) and (3), respectively, based on
and the measured
and
. Second,
was calculated with Equation (9) and
was calculated with Equation (10) based on the measured
and
. Finally,
and
were calculated with Equations (18) and (20), and
and
were calculated with Equations (19) and (21) based on the measured
,
,
, and
values, assuming that
does not depend on the flow surrounding the structure [
26,
29,
30,
31], i.e., on the flow induced by the rotation, and that
,
,
,
, and
are independent of the natural frequency value.
4.3. Fluid-Added Modal Coefficient Assessment during Transient Conditions
Upward and downward ramps of
at different accelerations were performed in order to investigate the added modal coefficients under transient conditions. For that, the system was not excited using a push release but was excited with its own mechanical unbalance. Tests were carried out for
values from 0.85 to 2.50 Hz with durations of 1.0, 2.5, 5.0, 10.0, 50.0, and 100.0 s and for
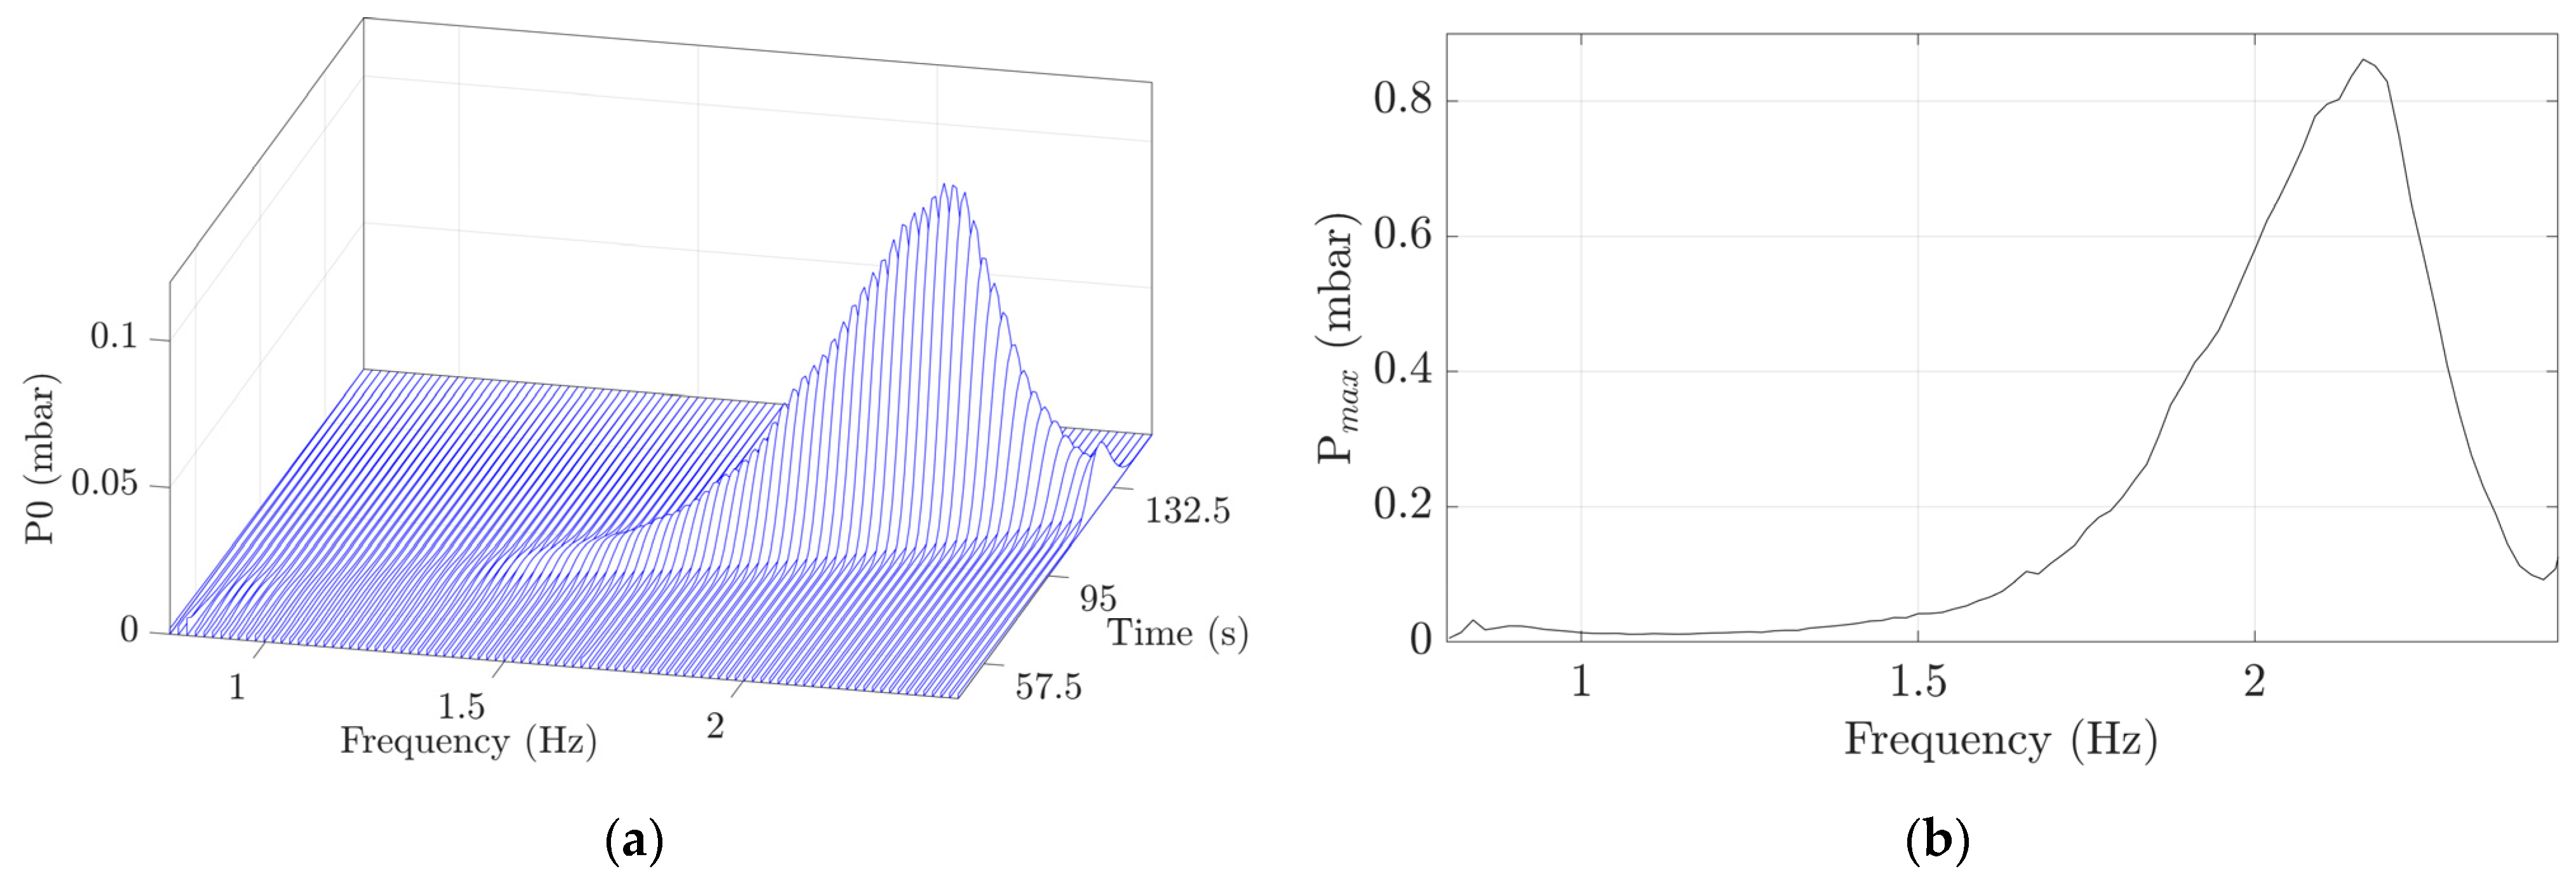
values from 0.00 to 6.25 Hz with a duration of 375 s. The frequency content and amplitudes of the ramp signals were calculated with a Short-Time Fourier Transform (STFT). All the values composing the waterfall spectra in each frequency bin, as shown in
Figure 8, were summed to construct a single overall maximum spectrum,
Pmax, with a resolution of 0.016 Hz, as shown in
Figure 8b, using a Hanning window with an FFT block size of 50,000 points and a sliding time segment with a 5% time increment between two consecutive FFT blocks.
5. Results
5.1. Natural Frequencies and Damping Ratios of the Cylinder in Air and Water during Steady Conditions
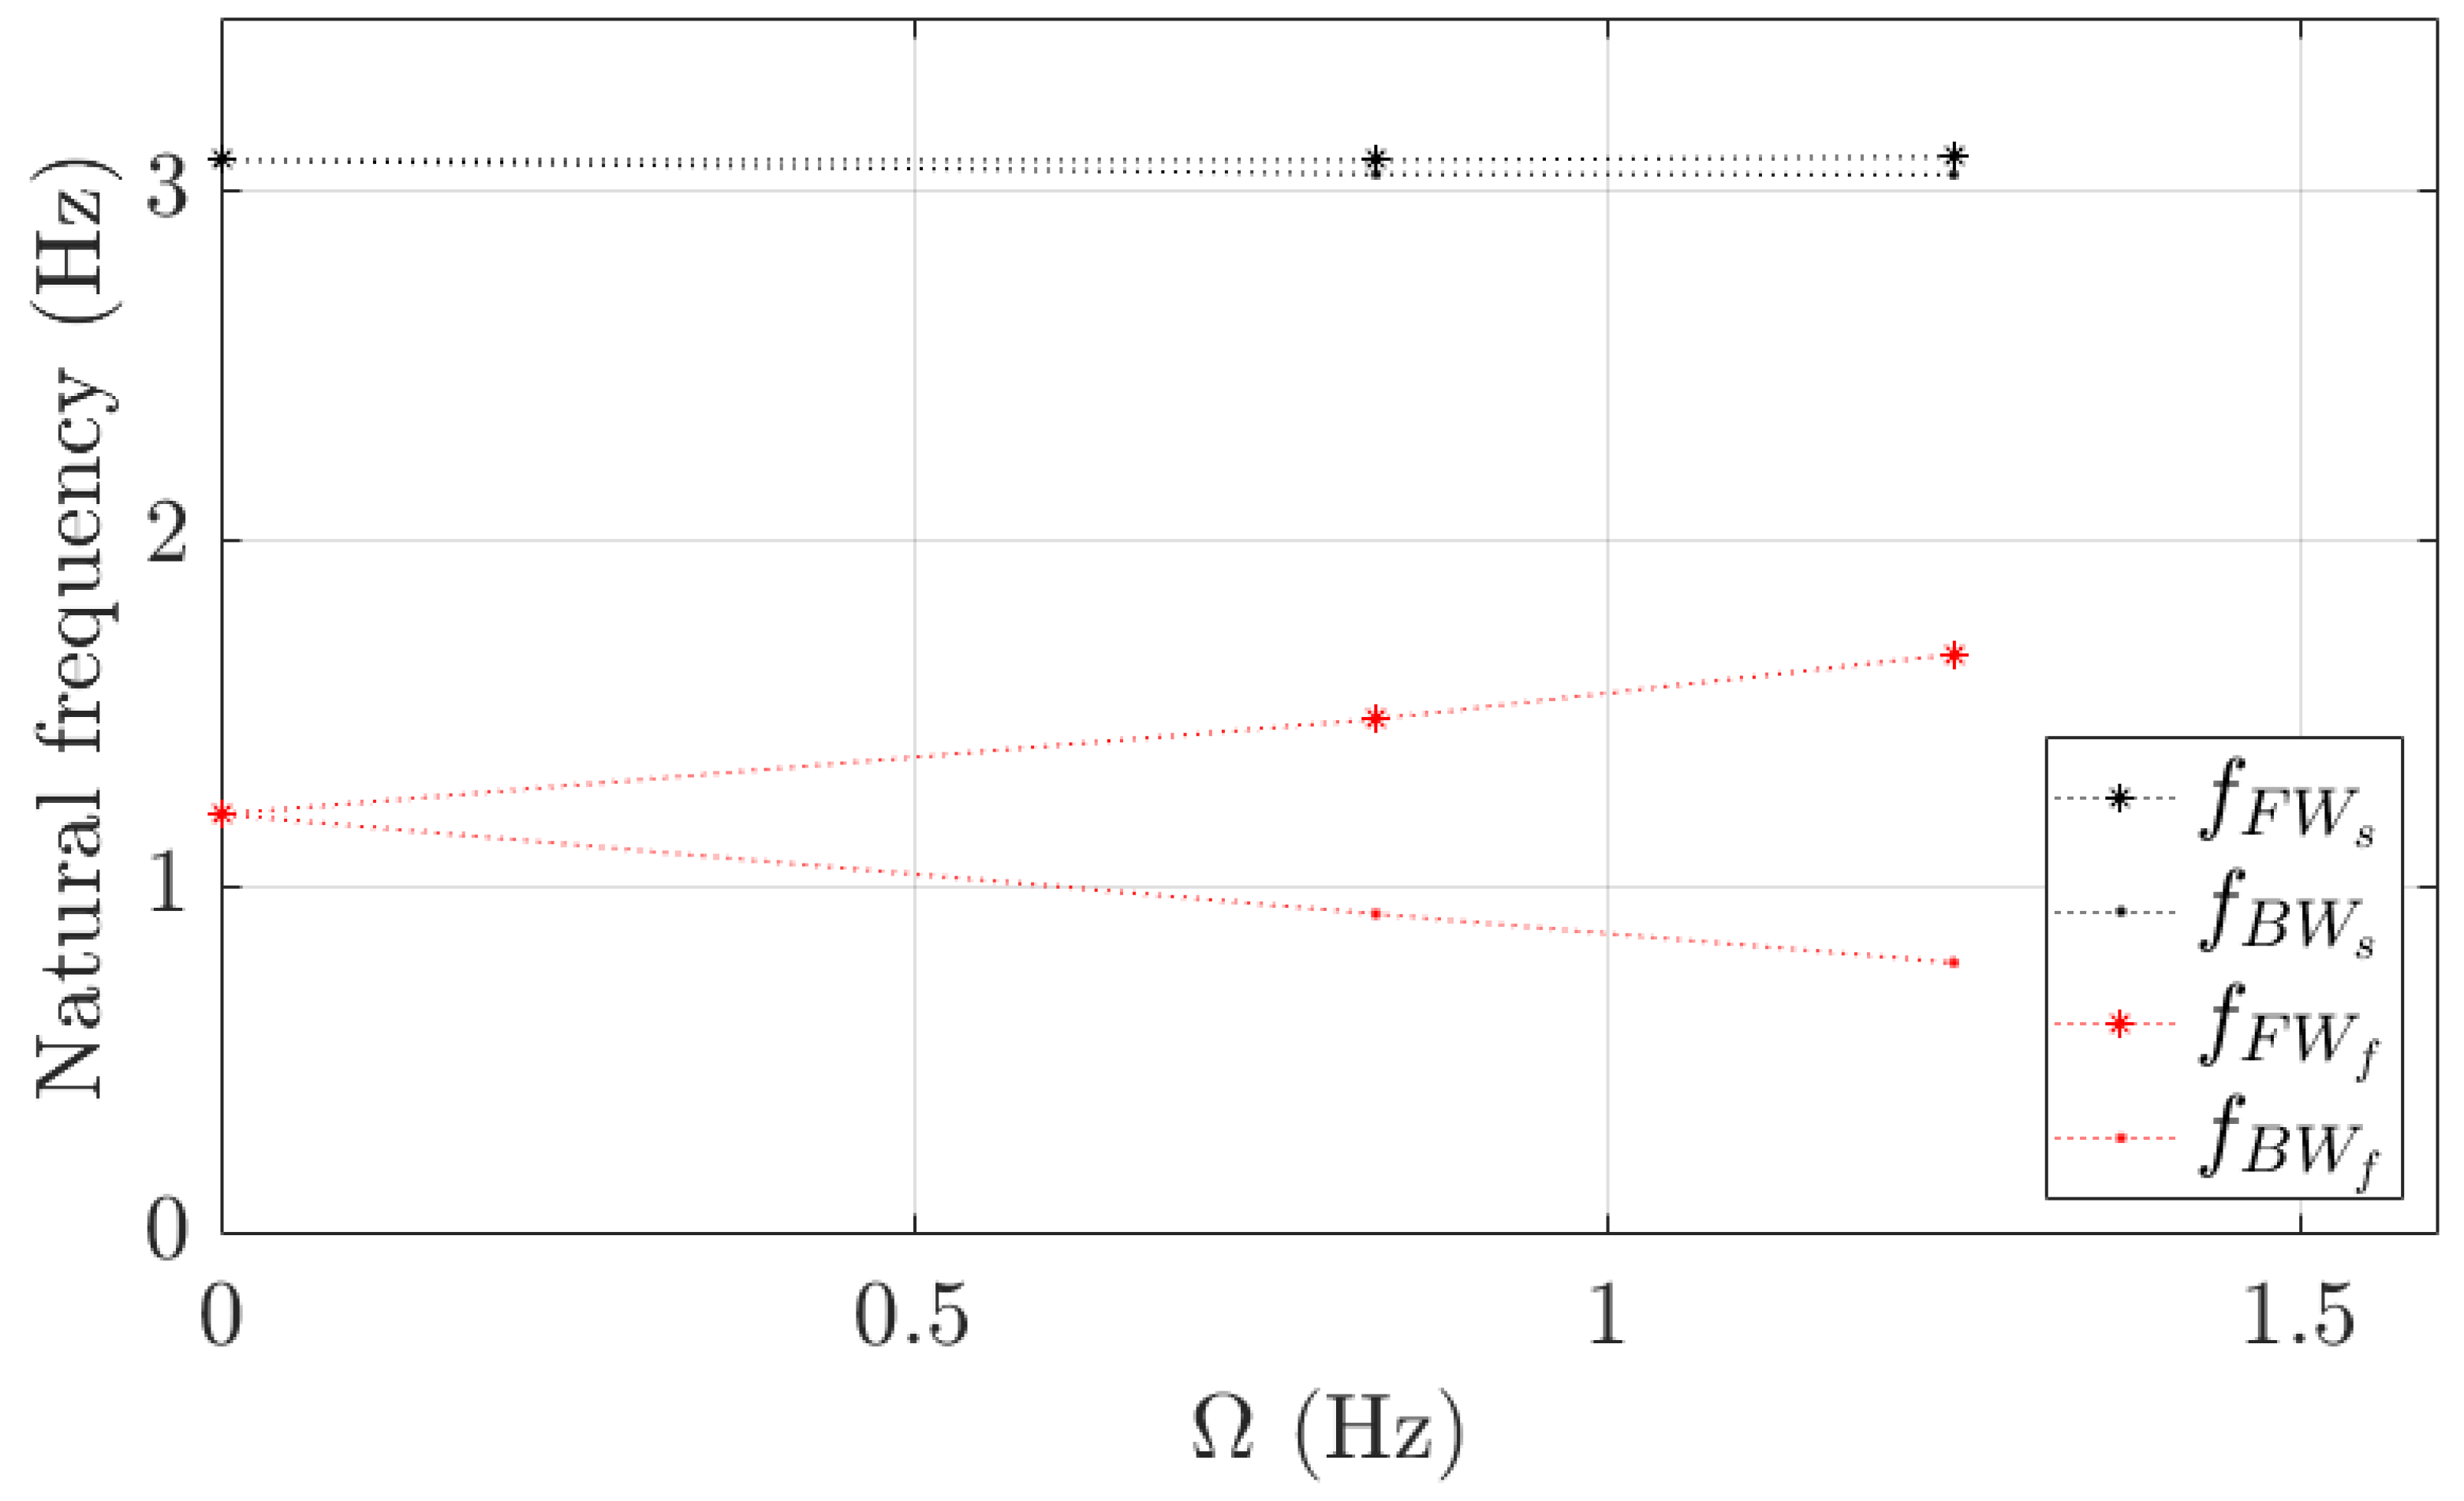
Figure 9 shows
and
as well as the evolution of
,
,
, and
as a function of
. When the cylinder does not rotate,
is 3.1 Hz and
is 1.2 Hz, presenting a frequency reduction ratio (FRR) of 61.3% due to
.
When the cylinder rotates in air,
and
are approximately equal to each other and
, which agrees with the assumption noted in
Section 3.2. Nonetheless,
and
change in water depending on
.
increases and
decreases as
is increased, with
equal to 1.67 Hz and
equal to 0.78 Hz at an
value equal to 1.25 Hz. These results suggest that there are more forces than those due to the gyroscopic effect inducing the frequency shift when the cylinder is in water compared to air. Based on Equations (18) and (20), these forces have to be induced mainly by
, which must have an effect significantly stronger than the gyroscopic effect.
Figure 10 shows the temporal response of the displacement time signals to a push release and the curve fitting in air and water when the cylinder does not rotate.
is 0.0014 and
is 0.02, thus presenting an increase of about 1330% from air to water. It must be noted that the R-square values of the curve fittings are 0.85 in air and 0.83 in water. This result agrees with previous investigations concluding that the structural damping is negligible compared to the viscous damping associated with the fluid [
26].
5.2. Natural Frequencies, Damping Ratios, and Whirling Directions of the Cylinder in Water during Steady Conditions
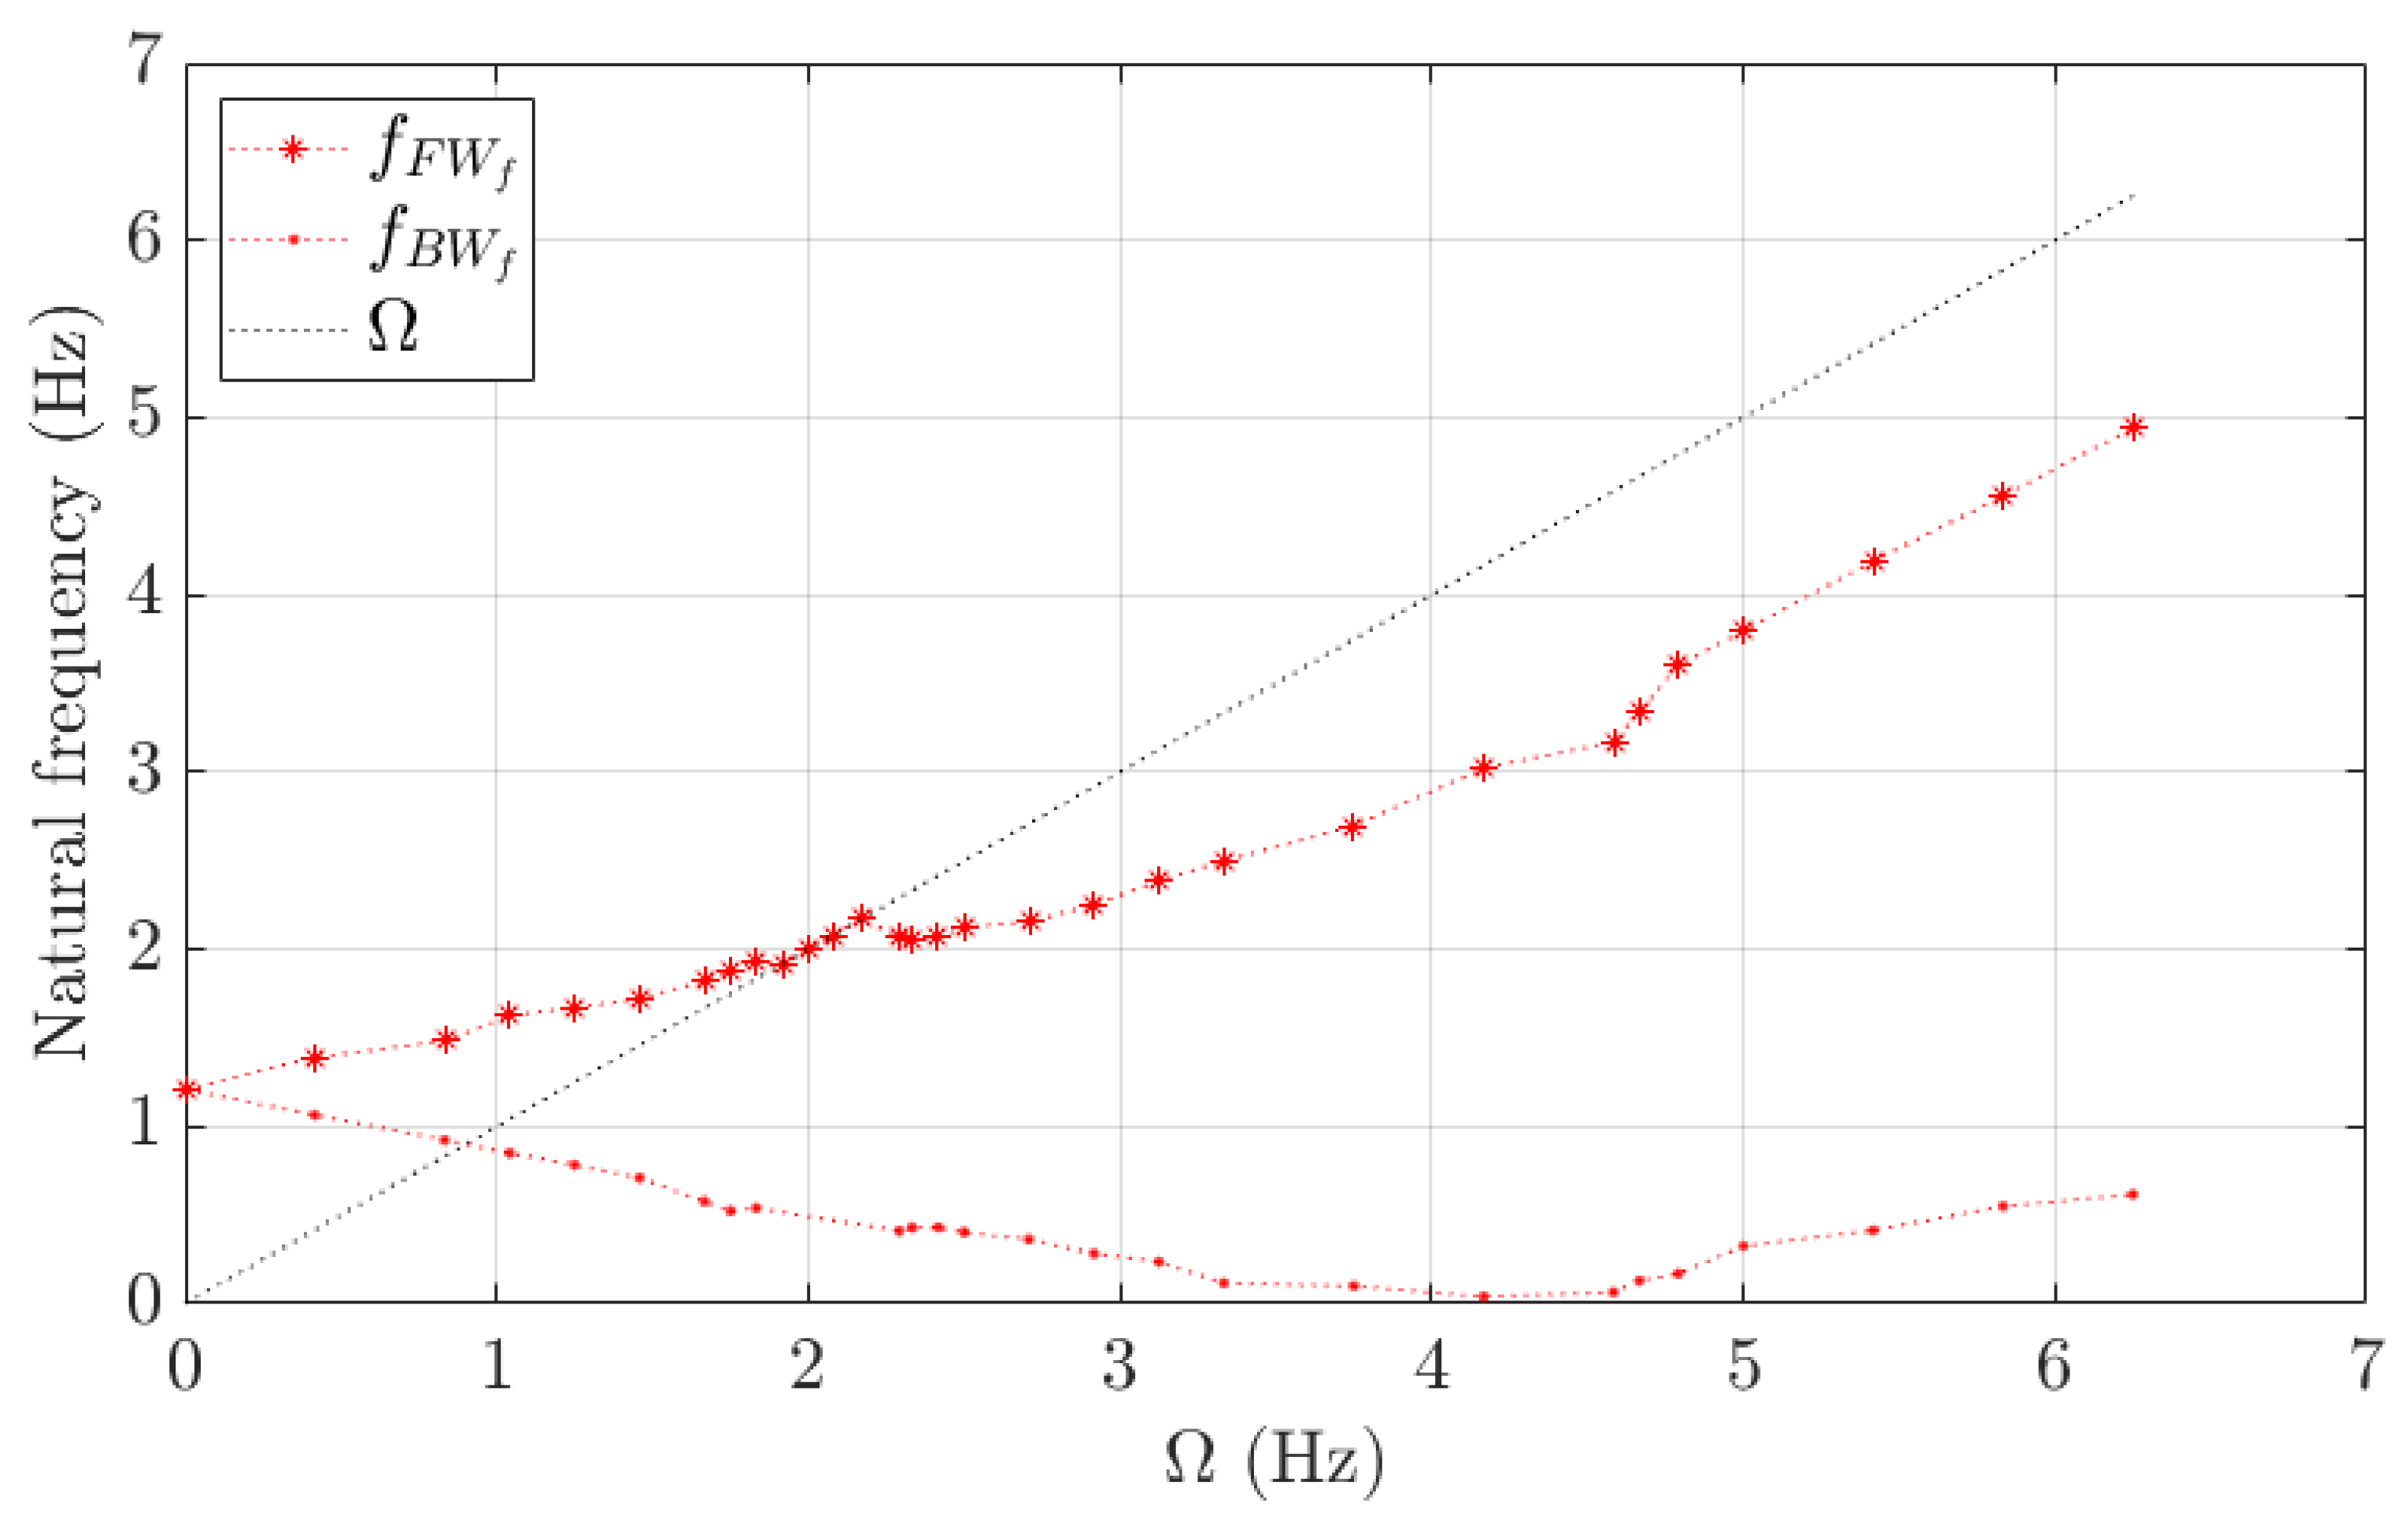
Figure 11 shows
and
as well as the evolutions of
and
as a function of
.
always increases, whereas
decreases with
from 0 to 4.5 Hz, reaches a value of 0 Hz for an
equal to 4.5 Hz, and begins to increase as
is further increased. Based on Equations (18) and (20), when
decreases it implies that the structural modal stiffness is higher than the absolute added modal stiffness (
, when
is 0 Hz it implies that both the structural and absolute added modal stiffness are equal (
, and when
increases it implies that the structural modal stiffness is lower than the absolute added modal stiffness (
).
evolves continuously at , whereas presents a discontinuity for from 1.8 to 2.3 Hz due to a lock-in between and . presents a constant value for from 1.8 to 1.9 Hz; increases with from 1.9 to 2.16 Hz, during the lock-in; drops and presents a constant value for from 2.16 to 2.3 Hz, when the lock-in is overcome; and increases continuously again at higher values. It must be noted that at 0.83 Hz, the does not lock in with because, in contrast to FW, BW whirls in the opposite direction to the rotation. In this case, the lock-in is governed by the mechanical unbalance and takes the value of . During the lock-in, is not excited when performing the push release, leading to a structure resonating only with the FW.
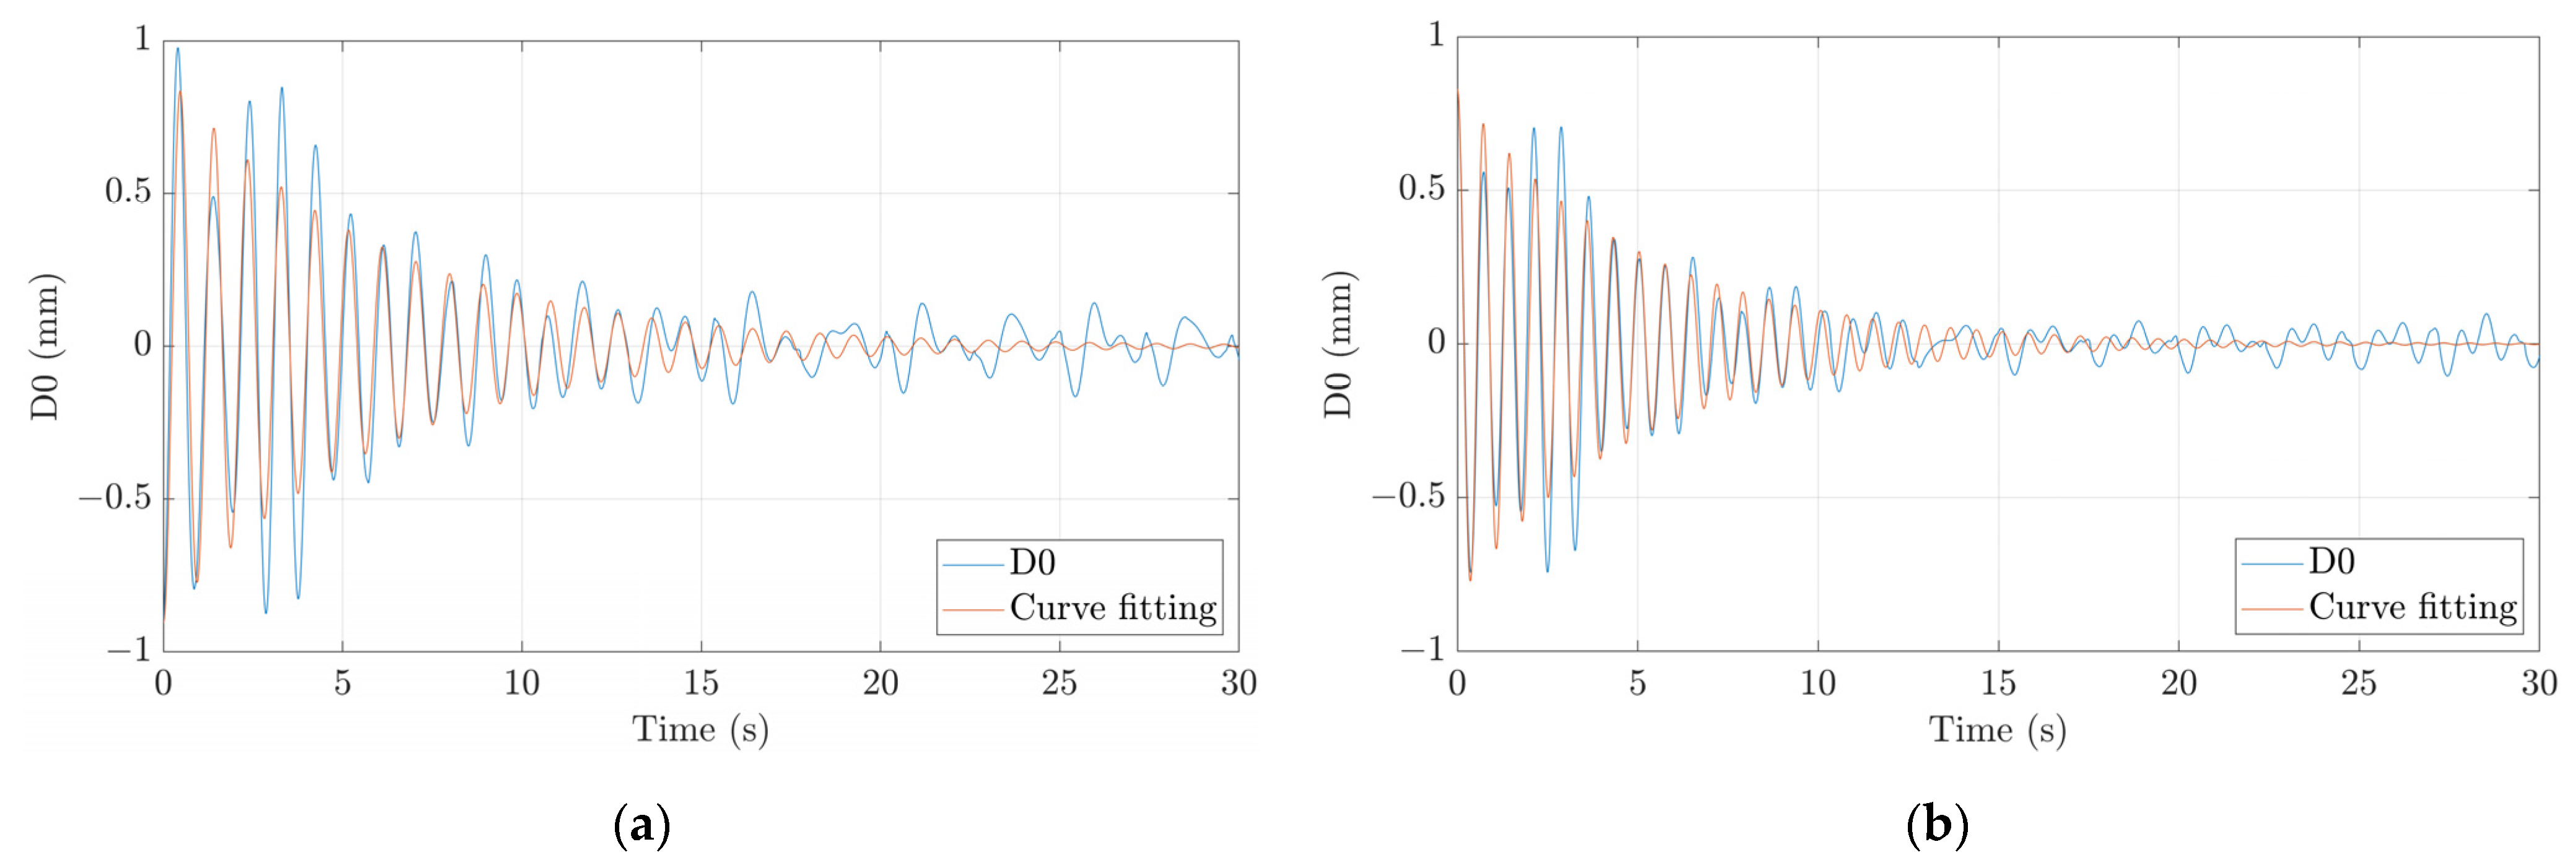
Figure 12 presents the temporal responses of the cylinder displacement due to the push release and the curve fitting.
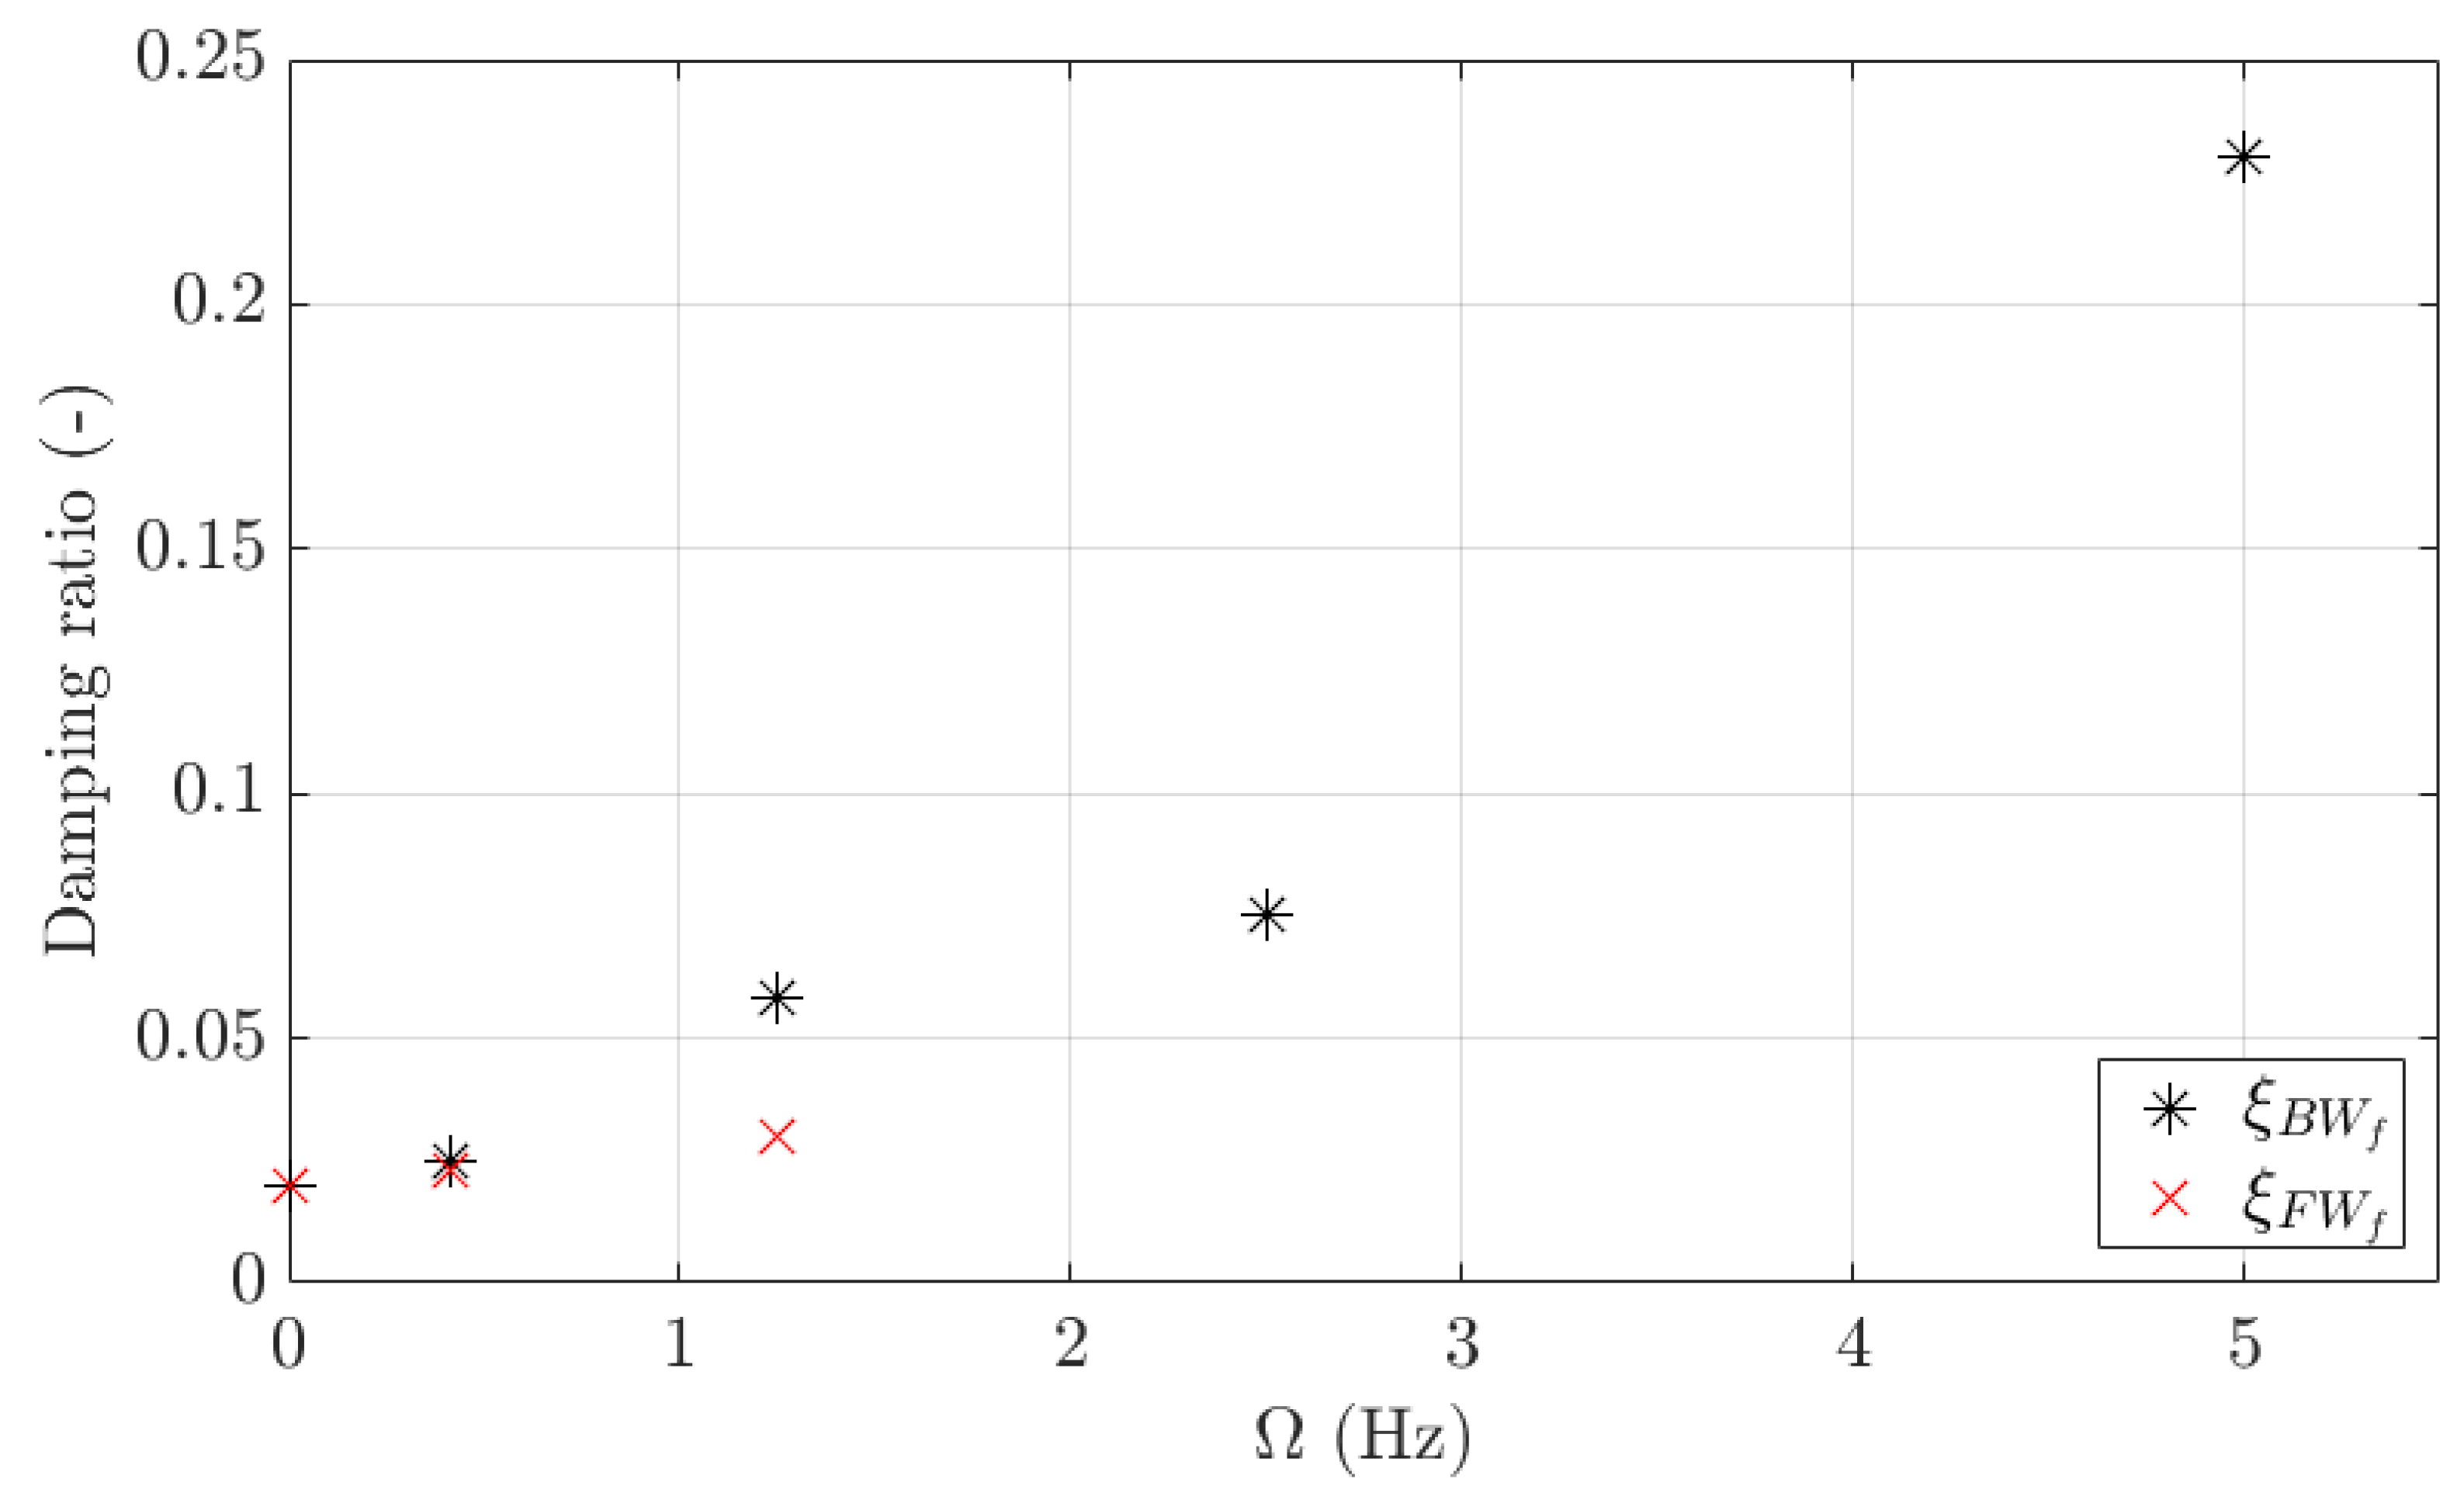
Figure 13 shows
as well as the evolutions of
and
as a function of
.
increases from 0.02 up to 0.23, representing an increase of around 1000% when
is also increased from 0 to 5 Hz.
was only calculated up to an
of 1.25 Hz, and based on the current measurements, it has not been possible to determine its trend. However,
can be assumed to always be higher than
, which agrees with Equations (19) and (21). It must be noted that the R-square of the curve fitting at an
equal to 0.42 Hz is 0.76 for the FW and 0.79 for the BW, at an
equal to 1.25 Hz, it is 0.21 for the FW and 0.35 for the BW; and at
values equal to 2.5 and 5 Hz, it is 0.64 and 0.98 for the BW. The R-square value decreases when the natural frequencies are close to the rotating frequency of the cylinder since its contribution cannot be removed from the signal through the filter. Although the exact values of the added damping present uncertainty, at least we can believe its calculated trend as a function of the rotation.
Figure 14 presents some orbits corresponding to the FW and BW modes. The FW mode whirls in the same direction as the rotation and the BW mode whirls in the opposite direction to the rotation for
values from 0 to 4.5 Hz. At higher
values, both the FW and BW modes whirl in the same direction as the rotation. Based on Equation (20), this change in the BW whirling direction must imply that
.
5.3. Fluid-Added Coefficients during Steady Conditions
Table 2 presents the values of
,
,
,
, and
, when the non-rotating cylinder is oscillating at 1.2 Hz according to
in water as well as those of
[
27,
28],
[
27,
28], and
[
21,
22,
23], calculated using equations extracted from the literature.
,
,
and
are zero, whereas
and
are 13.1 and 38 kg, respectively, and
and
are 4.23 and 11.9 Ns/m, respectively. The deviations between
and
and between
and
are 190% and 181%, respectively.
and
are higher than
and
because Equations (11) and (12) consider that the cylinder moves radially. However, as presented in
Figure 7,
reassembles a pendulum movement. At the top of the cylinder, the fluid presents lower acceleration and velocity than at the bottom, resulting in lower
and
values.
Figure 15a presents constant linear increases in
and
with
. Equation (24) considers that the cylinder moves radially rather than as a pendulum, which should result in higher values of
than
. Nonetheless, Equation (24) does not consider the boundaries of the cylindrical water tank, which should result in lower values of
than
, as the boundaries are expected to cause higher flow velocities. In this specific case, both simplifications compensate for each other, leaving Equation (24) predicting
accurately. The minimum deviation between both values occurs for an
of 5 Hz and is 0.5%, and the maximum deviation occurs for an
of 2.7 Hz and is 24% with an average deviation of 11%. However, it must be noted that the evolution of
with
agrees with the results of the Magnus effect obtained in previous studies [
21,
22,
23].
Figure 15b plots
and shows that it is negative and decreases quadratically with
. A negative value of
is expected since an eccentricity of the rotating cylinder implies a smaller fluid thickness on one side of the cylinder. In this smaller gap, there are higher velocities and consequently lower pressures, resulting in a force towards the smaller fluid thickness, which pushes the cylinder away from its equilibrium position. The evolution of
agrees with previous studies concluding that an increase in
results in an increase in the forces exerted on a cylinder [
19,
20].
Table 3 presents
and
at different
values.
increases with
, which is in line with previous studies concluding that
increases with the flow velocity [
32,
33,
34], i.e., the flow induced by the rotation. Based on the present measurements, it can only be concluded that
is lower for lower
values. Assuming that
and
increase with
, the FW could become unstable if
(see Equation (19)). Consequently, the stability of the FW depends on the values of the added modal coefficients, which in turn depend on
. The FW may be unstable at some specific
value and stable at others. In contrast, the BW is always stable.
Based on the presented experimental methodology, it can be summarized that (i) and are positive and increase, (ii) is negative and decreases, and (iii) decreases quadratically relative to the increase in as is increased. Additionally, it must be noted that the effect of radial confinement must influence all the added modal coefficients since it causes higher flow accelerations and velocities and consequently higher values of as well as , , , and , respectively.
5.4. Lock-in between the FW Natural Frequency and the Rotating Frequency during Transient Conditions
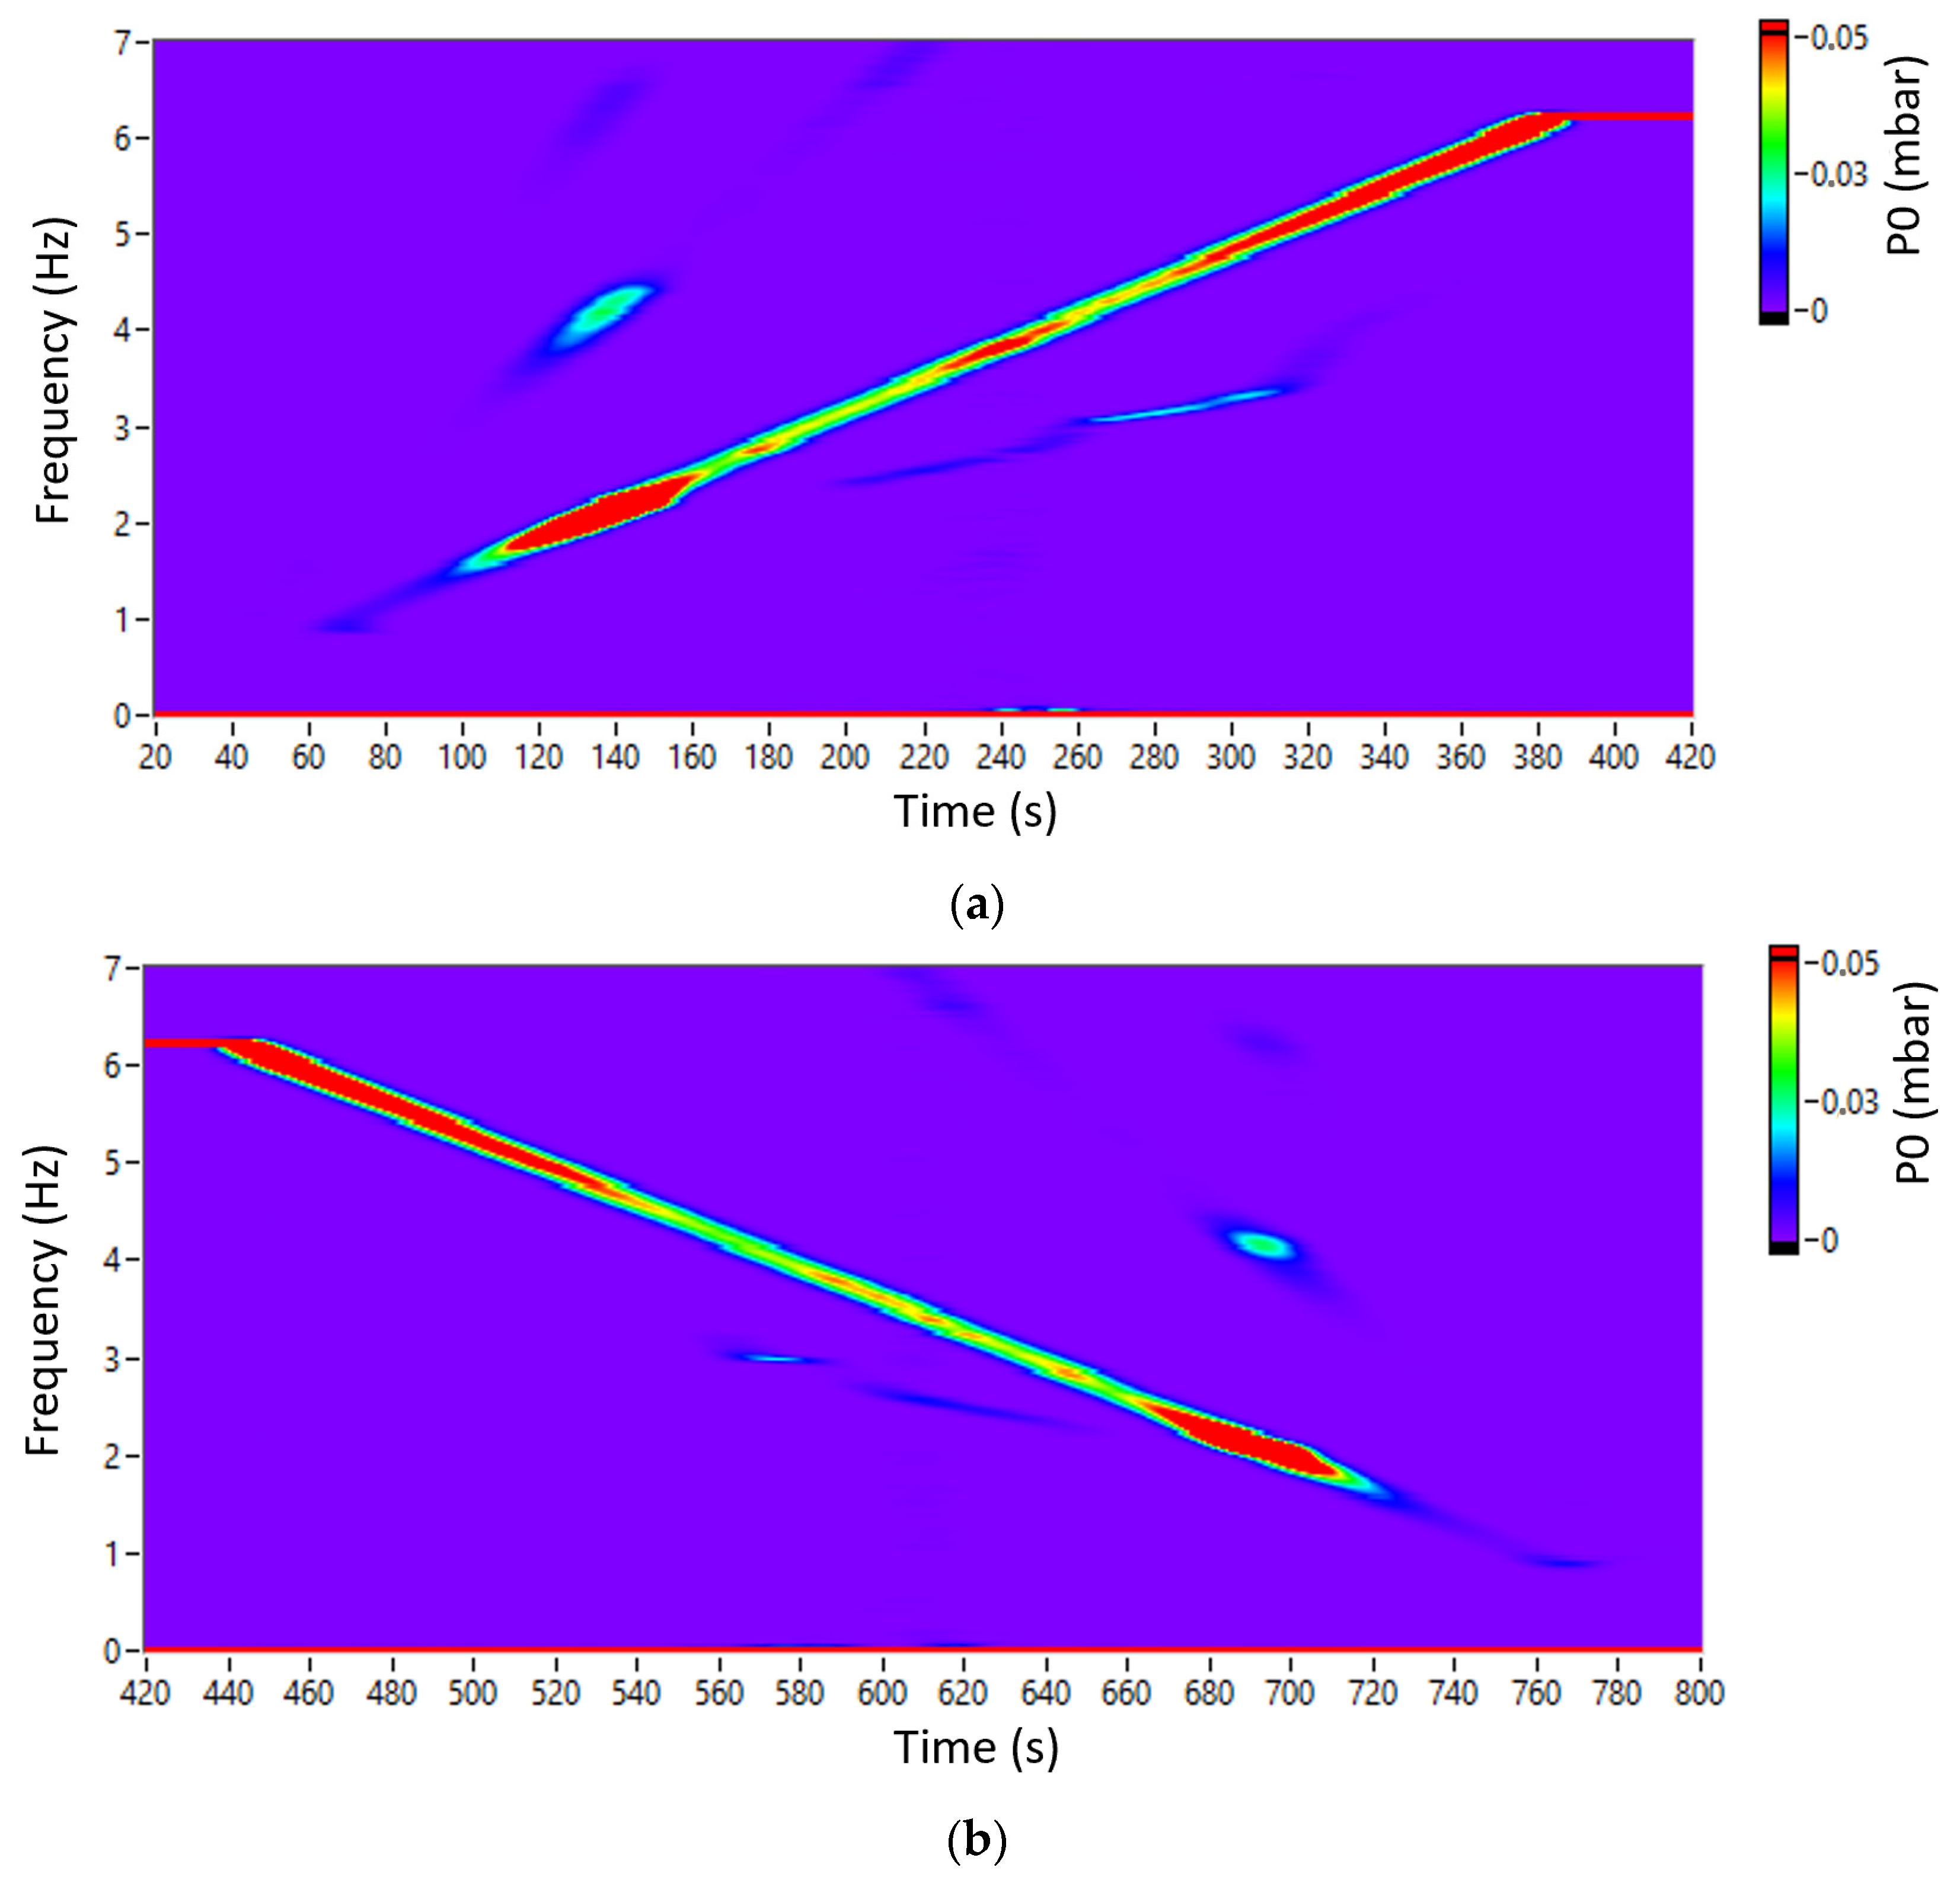
Figure 16 shows a colormap of the P0 pressure signal during an upward ramp from 0 to 6.25 Hz and a downward ramp from 6.25 to 0 Hz with a duration of 375 s for each of them. During both ramps, P0 presents an increase in amplitude between 1.8 and 2.3 Hz due to the lock-in. It must be noted that the lock-in resonance presents a second harmonic of lower amplitude. Additionally, the P0 presents another increase in the amplitude of
from 3 to 3.5 Hz that could be related to a decrease in
.
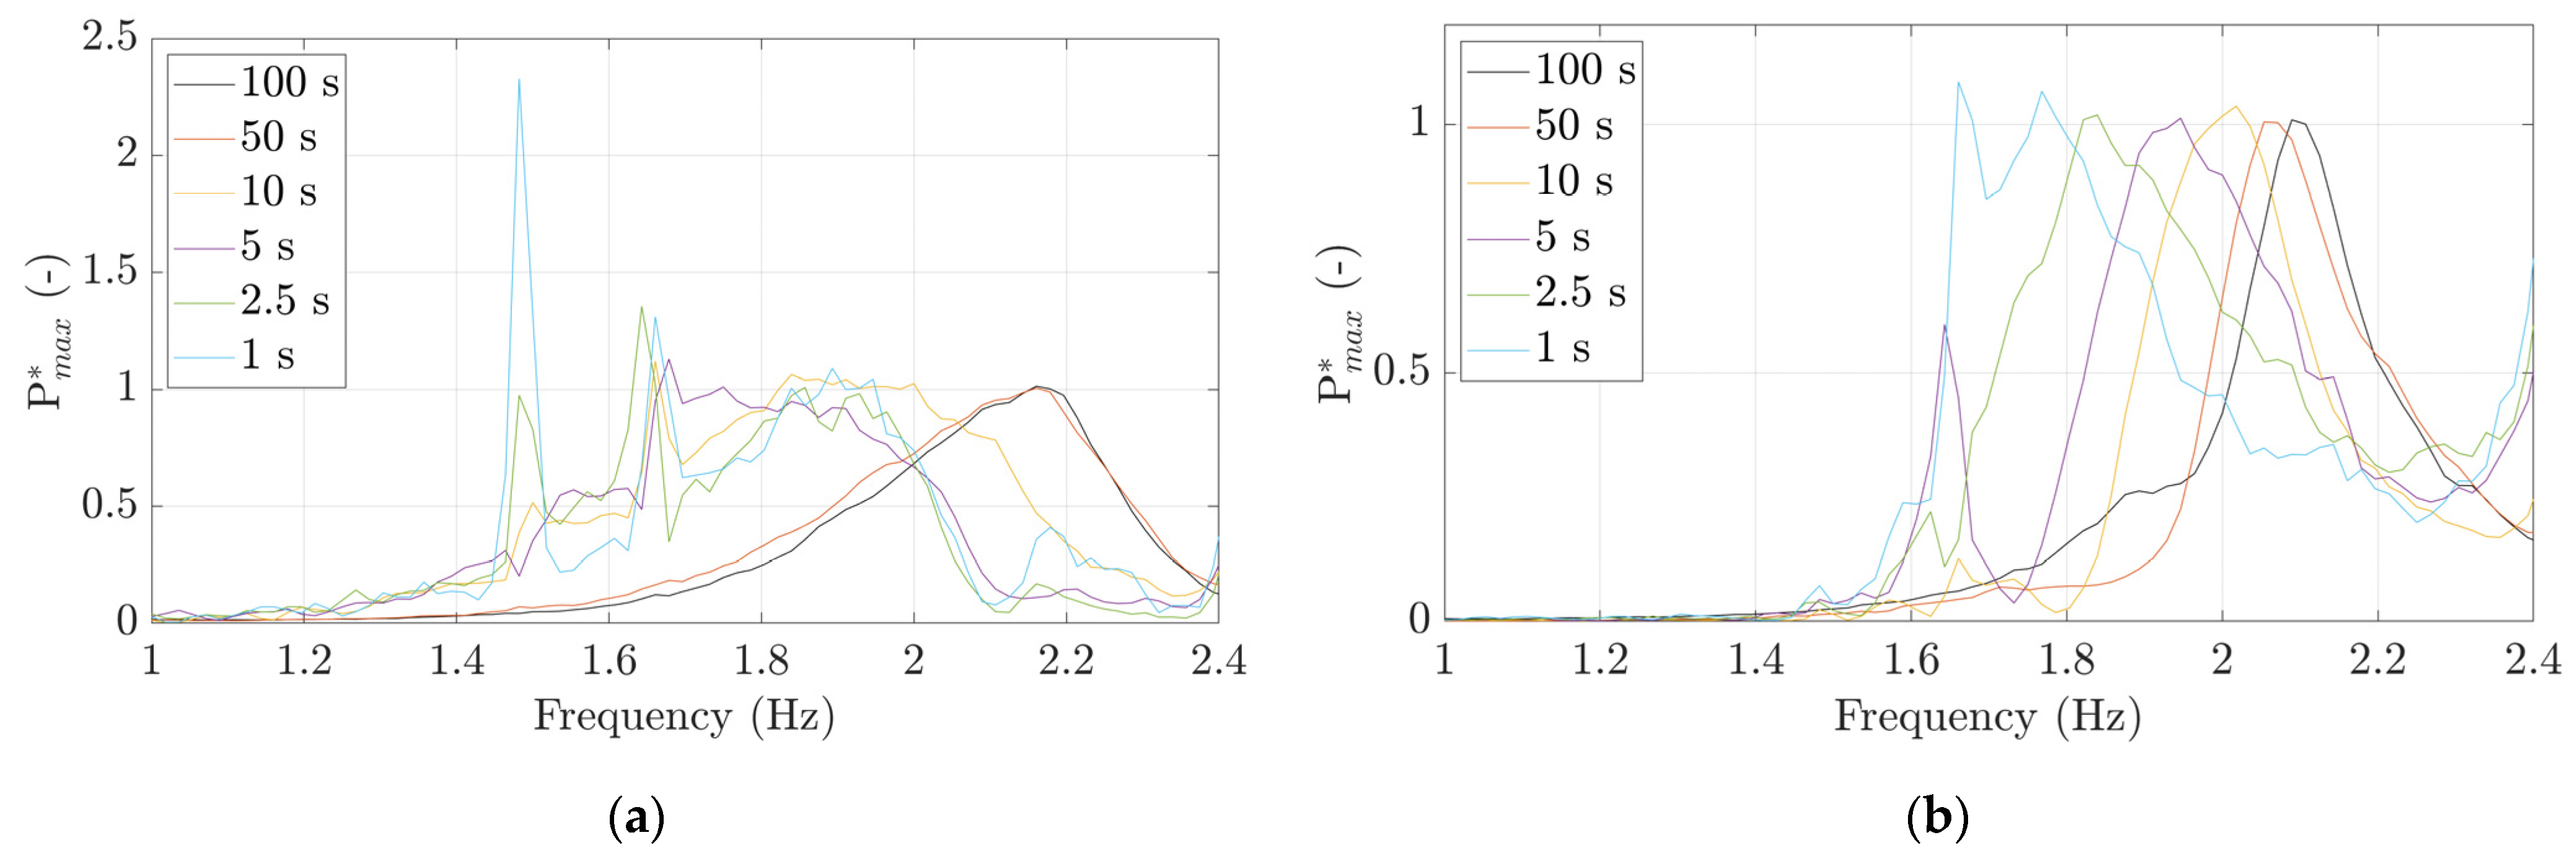
Figure 17 presents the
Pmax values of P0 during ramps performed at different accelerations, with an enlargement of the frequency range from 1 to 2.4 Hz in order to visualize the lock-in amplitude in detail. The lock-in amplitude of the 1 s ramp is 180 times lower than that of the 100 s ramp, suggesting that the lock-in requires a certain amount of time to develop. The lock-in peaks during ramps with higher accelerations are wider than those observed during ramps with lower accelerations, indicating that an increase in the ramp acceleration may also imply an increase in the damping ratio. The reduction in lock-in amplitudes observed with higher accelerations could therefore occur due to both of the following conditions: (i) the lock-in is not fully developed and (ii) the damping ratio of the system is higher.
For high accelerations, the lock-in amplitudes during downward ramps are higher than those during upward ramps. For instance, during a 1 s ramp, the lock-in amplitude during a downward ramp is around four times higher than that during an upward ramp. The lock-in amplitude is damped more slowly during a downward ramp because after the resonance the mechanical unbalance decreases in intensity as the rotating frequency also decreases and it cannot govern the flow and the cylinder, which continue whirling together at the lock-in frequency. On the other hand, during an upward ramp, after the resonance, the mechanical unbalance increases in intensity as the rotating frequency also increases and it governs the flow and the cylinder, which is forced to whirl at higher frequencies away from the lock-in frequency, resulting in lower amplitudes. At low accelerations, the transient case resembles a stationary case and both upward and downward ramps result in similar lock-in amplitudes.
Figure 18 shows the
Pmax values of P0, normalized by the lock-in amplitude, during ramps performed at different accelerations, with an enlargement of the frequency range of 1 to 2.4 Hz in order to visualize the exact lock-in frequency in detail. During ramps of 1 s, plotted in blue, the lock-in frequencies are 1.77 Hz for downward ramps and 1.87 Hz for upward ramps. However, during ramps of 100 s, plotted in black, the lock-in frequencies are 2.12 Hz for downward ramps and 2.18 Hz for upward ramps. This represents lock-in frequency increases of 19.8% for downward ramps and 16.6% for upward ramps. The decrease in the ramp acceleration results in a continuous increase in the lock-in frequency. In both upward and downward ramps, the acceleration may alter the modal coefficients of the system and consequently
. Higher ramp accelerations imply a lower
and consequently a lower lock-in frequency due to an increase in the
and/or a decrease in
and/or
.
6. Conclusions
A test rig was designed to investigate the added modal coefficients of a rotating submerged cylinder with a whirling motion, based on the values of measured natural frequencies and damping ratios as well as a proposed two-degree-of-freedom mathematical model of the dynamic system.
Two new added modal coefficients, and , were incorporated into the mathematical model of the rotating cylinder in water to better reproduce experimental observations of the dynamic system. induces a force proportional and perpendicular to the modal velocity and influences both the natural frequencies and damping ratios. induces a force proportional and perpendicular to the modal displacement and mainly influences the damping ratios. Both and couple the two degrees of freedom of the system.
Under rotating conditions, the system presents the FW and BW modes as a result of the coupling of the two degrees of freedom. In air, their corresponding natural frequencies are independent of and equal to each other with a value of 3.1 Hz. In water, the FW natural frequency increases from 1.2 to 4.9 Hz as is increased from 0 to 6.25 Hz. Nonetheless, the BW natural frequency decreases from 1.2 to 0 Hz as is increased from 0 to 4.5 Hz and then it increases from 0 to 0.6 Hz as is further increased from 4.5 to 6.25 Hz. In water, the FW mode always whirls in the direction of . However, the BW mode whirls opposite to for values of lower than 4.5 Hz and in the direction of for values of higher than 4.5 Hz. Both the changes in the BW natural frequency trend and the whirling direction are predicted by the proposed mathematical model. In water, the BW damping ratio increases from 0.02 to 0.23 as the value of is also increased from 0 up to 5 Hz, whilst the trend of the FW damping ratio has not been determined. Based on the proposed mathematical model, all these trends of the natural frequencies and damping ratios imply that and must increase and must decrease when is increased.
During ramps in the rotating speed, the BW natural frequency does not lock in the rotating frequency, whereas the FW natural frequency does lock in. This is probably because the FW mode whirls in the cylinder’s rotation direction and the BW mode whirls in the opposite direction. During these transient tests, higher accelerations of the rotating speed ramps resulted in 16 to 20% lower lock-in frequencies and 180 times lower lock-in amplitude. Additionally, for higher accelerations, the downward ramps resulted in lock-in amplitudes four times higher than the upward ramps. All these observations suggest that the acceleration of and the directions of the ramps significantly alter the added modal coefficients.


