Article

Baseline Measurements of Waves and Currents along the Coast of Oman

1
Department of Civil Engineering and Architecture, Sultan Qaboos University, P.O. Box 33, Muscat 123, Oman
2
Ministry of Labor, P.O. Box 413, Muscat 100, Oman
*
Author to whom correspondence should be addressed.
J. Mar. Sci. Eng. 2023, 11(9), 1711; https://doi.org/10.3390/jmse11091711
Submission received: 28 July 2023 / Revised: 25 August 2023 / Accepted: 27 August 2023 / Published: 30 August 2023
(This article belongs to the Section Ocean Engineering)

Abstract

:
The coast of Oman is undergoing huge coastal developments in order to realize Oman Vision 2040, covering all the strategic sectors. Historical data of coastal hydrodynamic parameters is scarce, even though its importance for properly designed coastal structures is recognized. In the present study, Acoustic Doppler Current Profilers (ADCP) were deployed at eleven locations along the coast of Oman. These locations were selected based on their strategic importance for the country. The duration of the deployments were between 60 and 265 days. The measured data of the waves and currents were collected and analyzed using equipment-specific software and Excel. The significant wave heights can reach 2 m along the whole coast of Oman. The southern coast is dominated by swells. The maximum to significant wave height ratio is approximately 1.5, which is less than the value of 2 obtained using the Rayleigh distribution. The coastal currents are stronger along the southern coast than those along the northern coast. The range of current magnitude is between 0.02 m/s and 0.8 m/s. This baseline study will help the public authorities in establishing permanent hydrodynamic measurement stations along the coast of Oman. Moreover, these measurements will serve the practicing engineers in designing coastal structures along the coast of Oman.

1. Introduction

Coastal currents play an important role in the hydrodynamic transport processes near coastlines. Since the early seventies, the increase in oil and gas production, operational vessel activities, coastal and industrial development, desalination, and wastewater treatment have been the main sources of damage to the marine environment in the Sea of Oman [1]. The pollution caused by accidental and intentional spills, ballast water discharge, brine disposal, toxic waste discharge, dredging, and land reclamations has led to severe ecological damage to the coastal environment and the marine ecosystem. Preventive and control strategies have been put in place to fight both land and sea-based pollution, in order to safeguard the marine ecology of the region. Therefore, continuous monitoring of hydrodynamic and seawater quality parameters along the Omani coast is imperative to improve the understanding of sediment transport, erosion, and deposition mechanisms in this region [2].
The Sea of Oman (previously known as the Gulf of Oman) is situated in the subtropical zone, with its depth varying from 3000 m in the oceanic part, and becoming shallower towards the Strait of Hormuz, with varying depths of 70–110 m separating it from the Persian Gulf. It has a total area of 94,000 km2. The Strait of Hormuz is 56 km wide and roughly 90 m deep, except for a trough near and around the Musandam Peninsula. The Arabian Sea stretches 1200 km along the Omani coast, from Ras Al-Hadd in the north to the Oman-Yemen border in the south. The open Arabian Sea has a total area of 3,862,000 km2, with a depth of up to 4652 m.
Atmospheric conditions over the Persian Gulf and the Sea of Oman include northwesterly winds, with seasonal variations over the Sea of Oman, high pressures in winter (1015 hPa), with relatively low pressures in summer (995 hPa), and air temperatures varying between 32–34 °C in summer and 18–20 °C in winter. Hydrologically, during summer the Sea of Oman experiences the Southwest Monsoon (SWM) that oscillates from the Persian Gulf, transmitting towards the Arabian Sea. In winter, the Northwest Monsoon (NWM) from the oceanic regions of the Arabian Sea moves toward the Gulf, passing through the Sea of Oman along the Iranian coast in the north. Circulation in the Sea of Oman is dominated by a clockwise gyre in the west and counterclockwise gyre in the east, creating upwelling circulation in both summer and winter, and whose strength depends on prevailing winds [3].
The tide from the Persian Gulf oscillates to the Sea of Oman through the narrow Strait of Hormuz, which further co-oscillates towards the Arabian Sea. Those tides are complex standing waves and vary in pattern from primarily semi-diurnal to diurnal [3]. Akbari et al. [4] observed the tides in the Persian Gulf, which are standing waves, with progressive waves passing along the sea surface in the Sea of Oman and the Arabian Sea. Wind and tides predominantly result in high water level fluctuations in the Sea of Oman and the Persian Gulf, with tide height varying from 1.5 m to 4.5 m [5]. Although the coast of the Sea of Oman has strategic importance, by virtue of the oil pollution risks due to heavy tanker traffic (approximately 35% of global ship-borne oil passes through the Strait of Hormuz according to one report [6]), the huge coastal developments along the coast of Oman and possible climate change effects on the seawater quality and marine life, hydrodynamic measurements are scarce. The first detailed measurements were carried out after the second Gulf War in 1992 [3]. Kwarteng et al. [7] carried out a few hydrodynamic measurements to study coastal erosion along Al-Batinah coast of Oman. Sana and Baawain [8] carried out seawater quality and hydrodynamic measurements at 44 points along the northern coast of Oman. Although these measurements were carried out in shallow depths (about 10 m), very low dissolved oxygen values (2 mg/L) were observed in the bottom layers. In other words, stressful conditions for marine life existed even in the shallow waters. Higher levels of concentrations of Lead and Vanadium were found in the samples collected from locations near Mina Al-Fahal and Qalhat. In October-November 1999, the GOGP99 project was carried out to conduct hydrodynamic and seawater quality measurements, and detailed results were reported about the Strait of Hormuz and the Gulf of Oman (presently the Sea of Oman) [9,10]. Recently, Gerd et al. [11] reported coastal currents along the northern coast of Oman. Along the Arabian Peninsula, seawater quality is deteriorating due to anthropogenic and natural effects [12]. Although studies based on field measurements of hydrodynamic and water quality parameters in the Persian Gulf or the Sea of Oman are scarce, many numerical modeling studies have been carried out in the past two decades [13,14,15,16,17,18,19,20,21,22]. To calibrate or validate the hydrodynamic model, most of these studies used tidal elevations that are generally available from the relevant public authorities. Some of these studies [20,21,23] used the measured ADCP data from earlier sources or conducted such measurements. There is a wealth of literature from other sites dealing with coastal hydrodynamics and wave propagation in coastal environments [24,25,26].
A huge number of short-term studies have been conducted in the past 50 years by the consultants who were involved in the design and analysis of several coastal structures along the coast of Oman. These structures include ports, harbors, intakes and outfalls of desalination and power plants, and other industrial plants located along the coast. Unfortunately, most of these studies are unpublished and the collected data are either lost or considered classified by the public and private organizations who were the owners of the relevant projects. The Sultanate of Oman is working on Oman Vision 2040 (https://www.oman2040.om/vision-en.html, accessed on 25 July 2023), according to which sustainability is one of the pillars of the future development. To ensure sustainable coastal development procurement and the maintenance of historical data on coastal hydrodynamics, seawater quality and marine ecology is imperative. To maintain coastal data, the relevant public authorities can play vital role in the establishment, operation, and management of permanent coastal monitoring stations and data collection centers, quality control measures, and dissemination to the interested stakeholders. The government of Oman has established the National Centre for Statistics and Information (https://data.gov.om/, accessed on 25 July 2023) for the dissemination of important data and information. However, the website is in its infancy and a limited range of data is available through it.
In this present study, wave and current measurements were carried out at eleven locations along the coast of Oman. This study will help the public authorities in establishing a permanent coastal hydrodynamic monitoring system to mitigate coastal problems, including pollution and coastal erosion along the coast of Oman. Moreover, wave estimates for various return periods are presented that will be useful in the design of coastal structures along the coast of Oman.

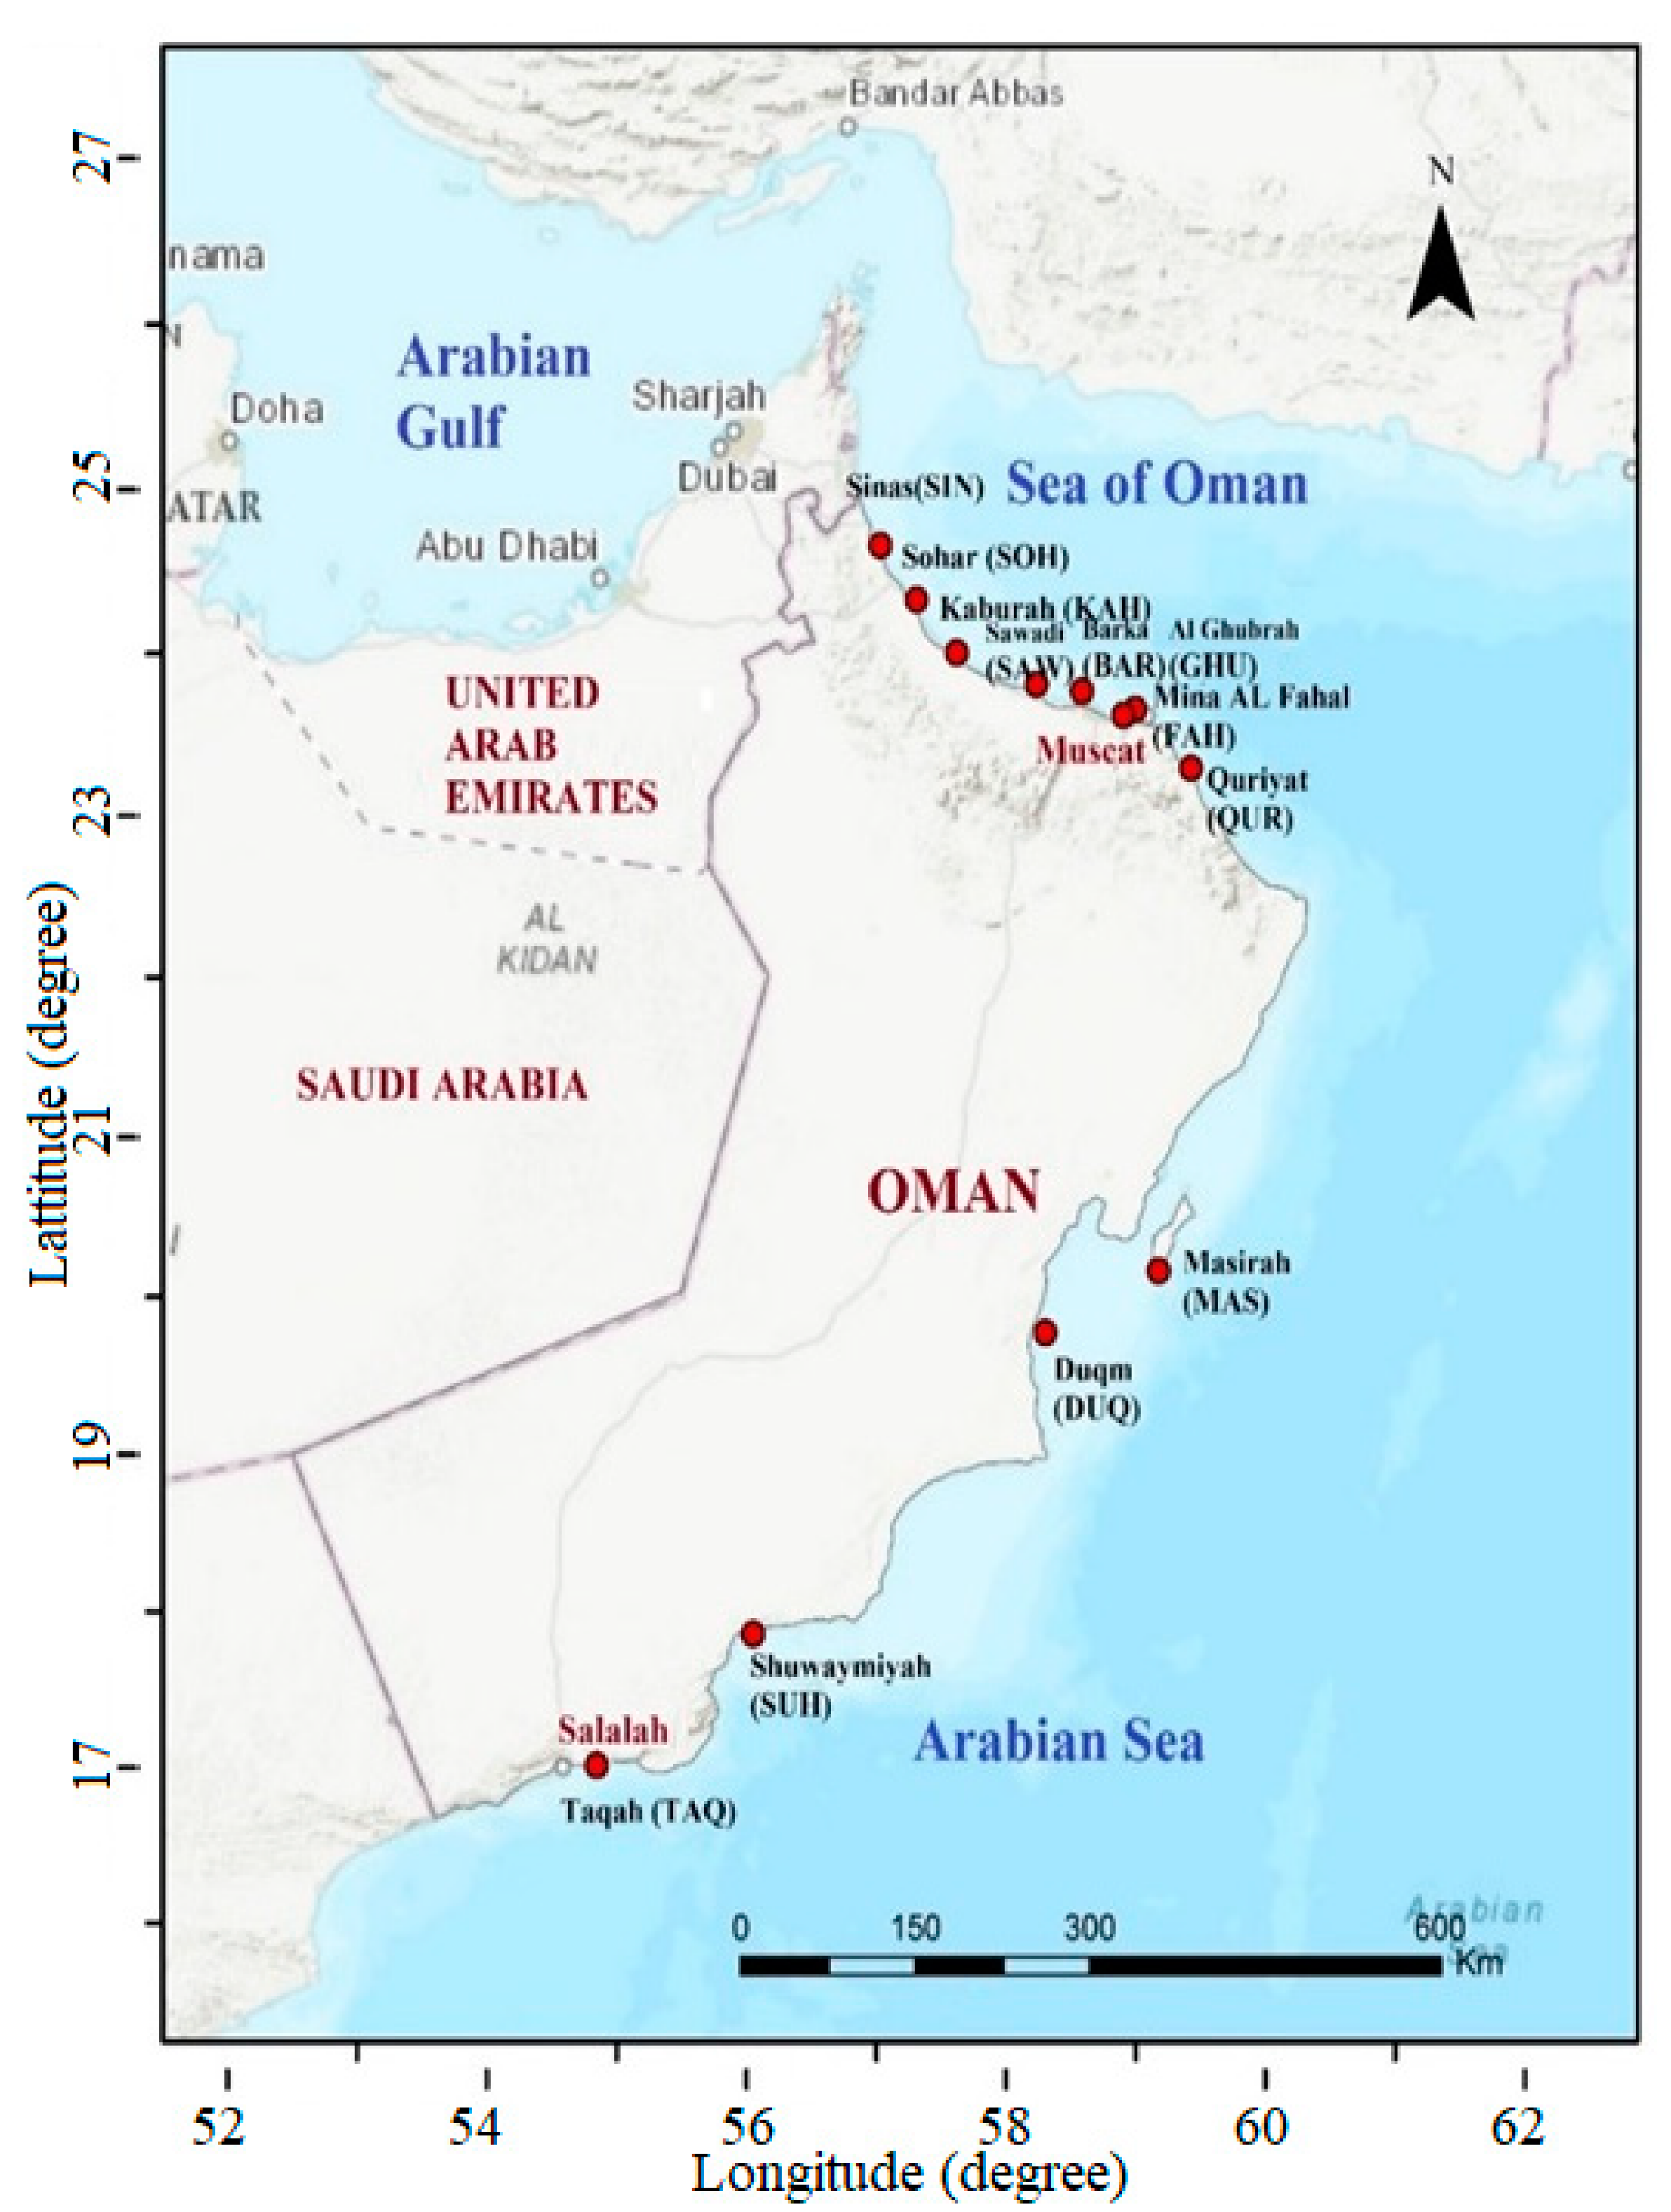
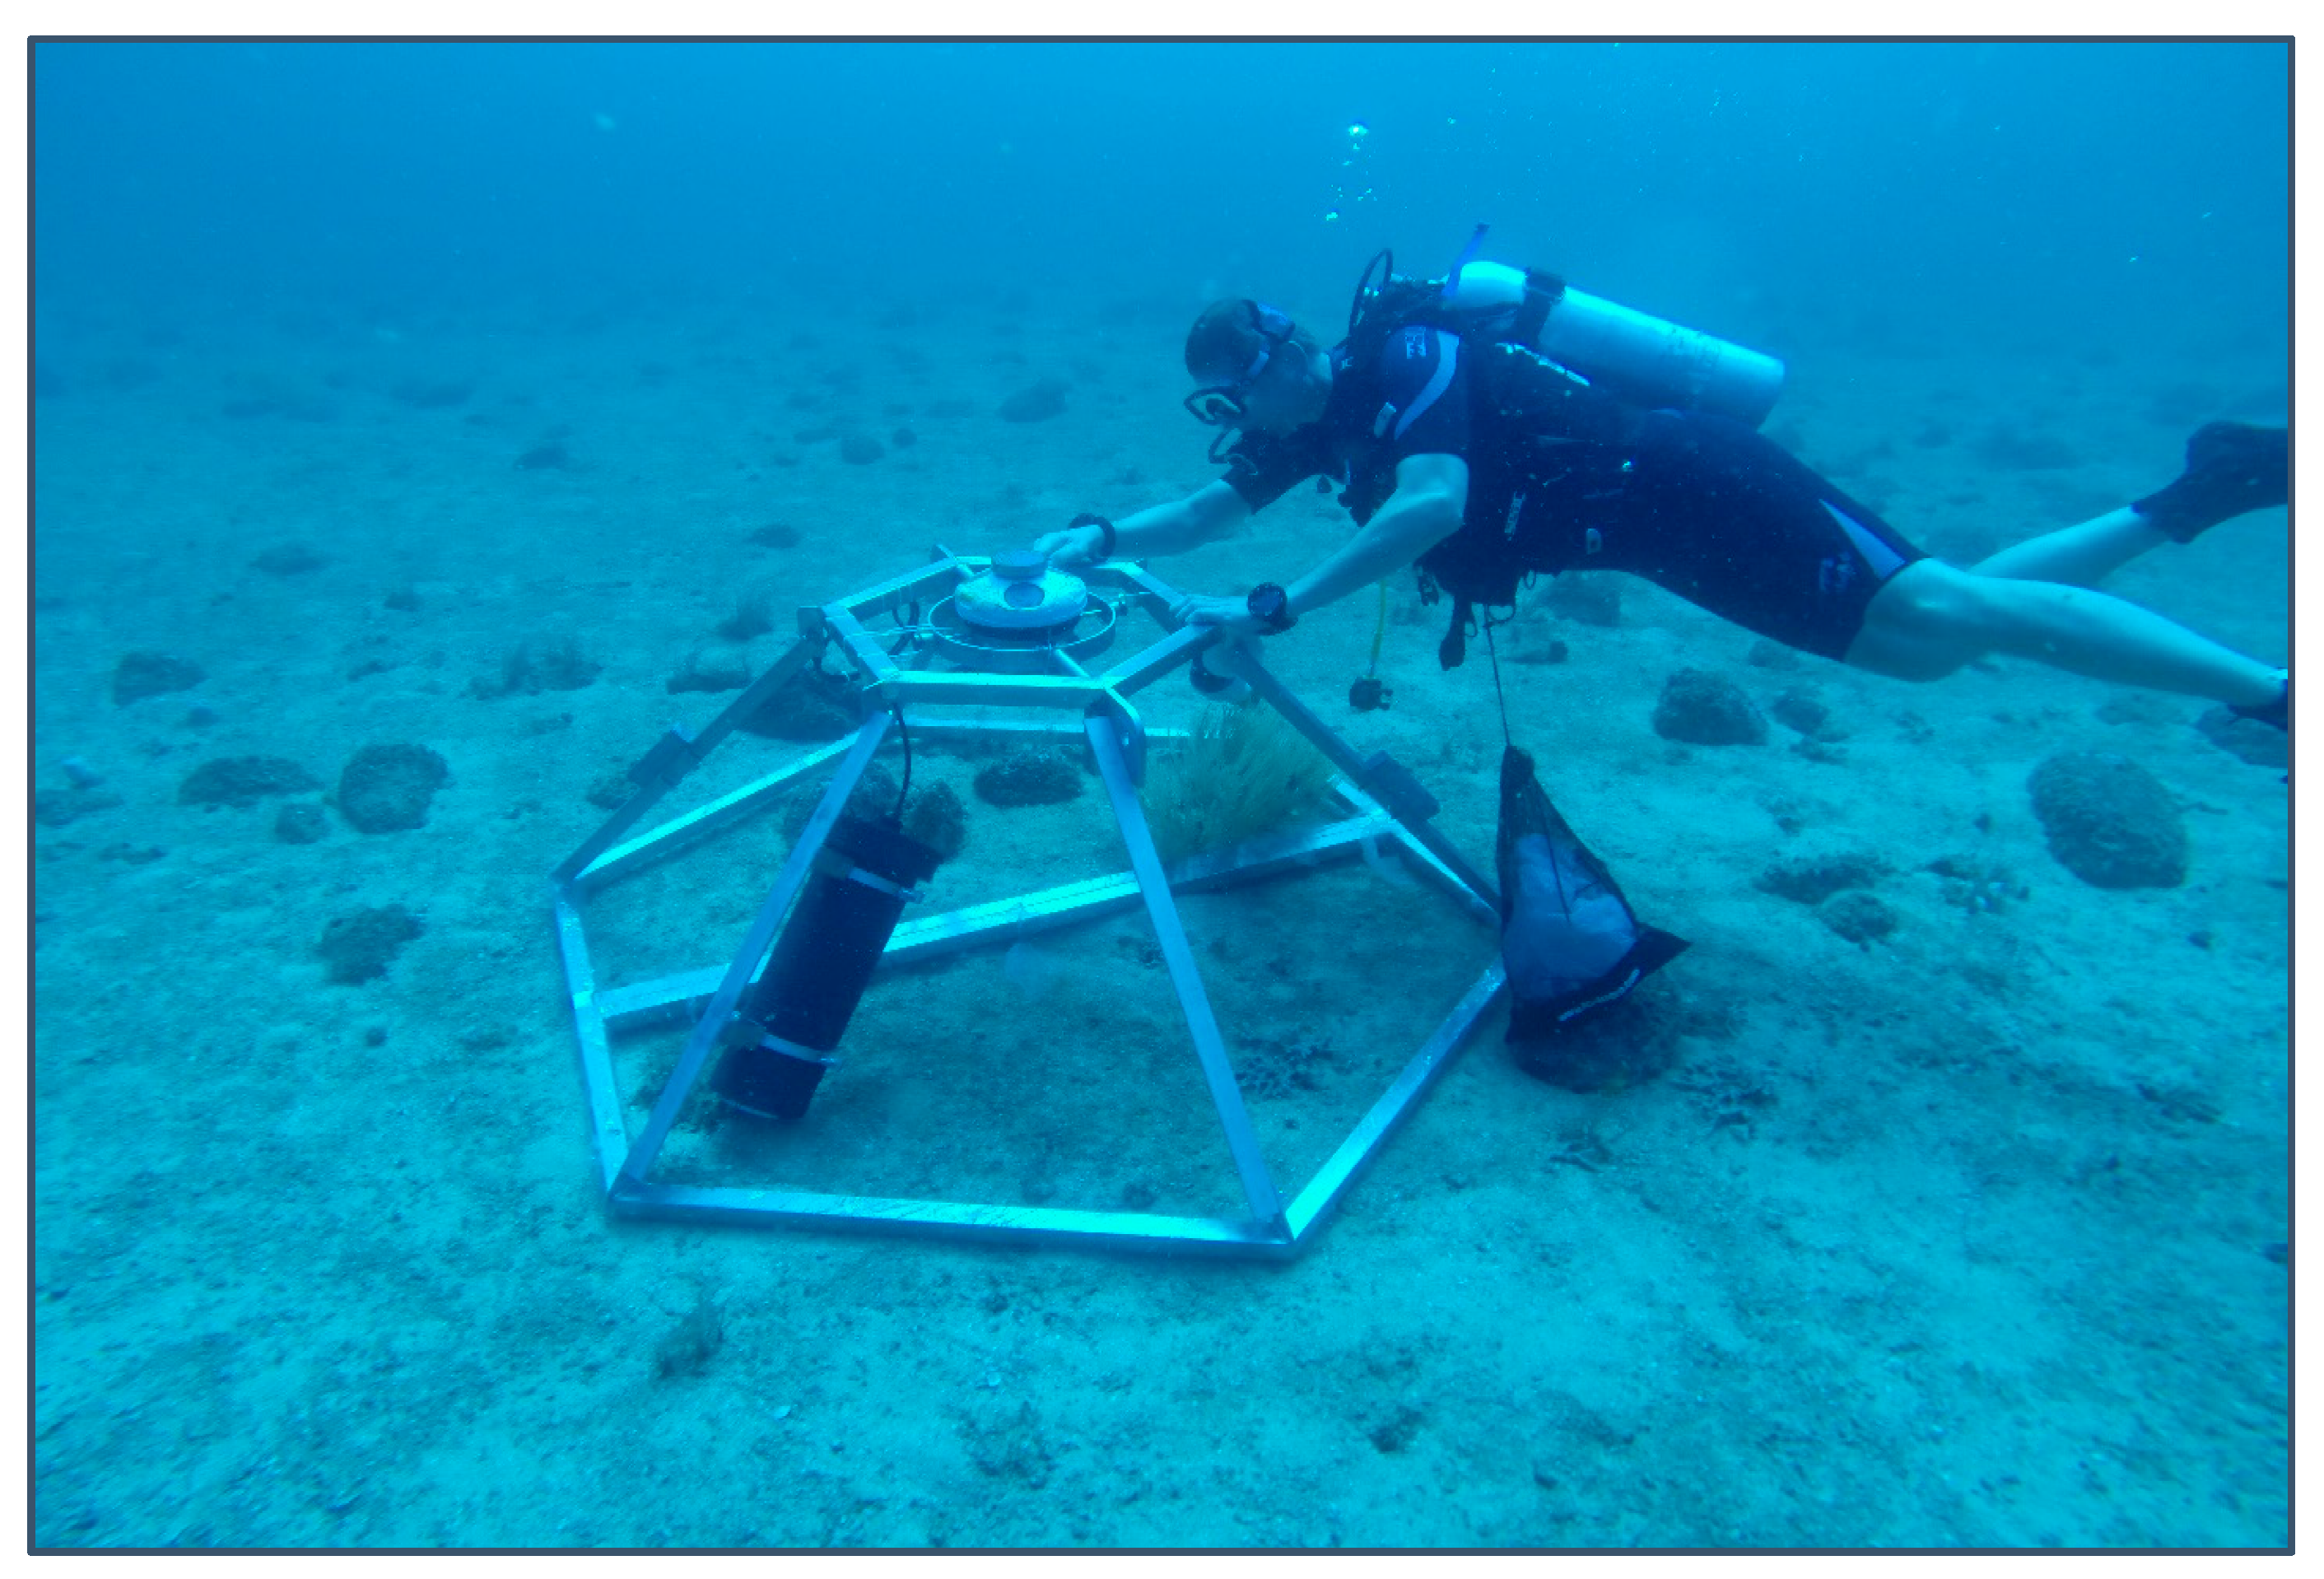
2. Materials and Methods

The waves and currents were sampled using a Nortek Acoustic Doppler Current Profiler (ADCP) AWAC AST 600 kHz, deployed at the sea bottom with an external battery canister that supplies power in stand-alone mode, and raw data was stored in its internal memory (Figure 1). Therefore, the instrument was recovered in a timely manner in order to charge, download, and process the raw data using a personal computer. The AWAC software was used for instrument configuration before deployment and to convert raw data to ASCII code. Storm software was used for the graphical interpretation and processing of the raw data. This equipment can measure ocean current profiles below a depth of 50 m and waves below a depth of 60 m. In this present study, the ADCP settings had the vertical bin resolution of 1 m and blanking distance of 0.5 m along the water column. The current and wave data were obtained at 10 min and 20 min profile intervals, respectively. The wave measurements were processed offline using software by Nortek. The measured data of wave and current profiles required strict quality control by virtue of the accuracy of deployment, location, and maintenance. For the deployments of longer durations, it was necessary to clean the ADCP head because barnacles started depositing on the sensors. The effect of such depositions does not much affect the efficiency of measurements. Nonetheless, regular in situ cleaning of the equipment was carried out by divers.
Along the coast of Oman, field measurements of waves and currents were carried out from 2017 to 2019 at eleven coastal locations (Figure 2). At each location, the hydrodynamic data were collected for at least two months in each season (summer and winter). The coordinates and duration of the measurements for all these locations are shown in Table 1.
The measurement locations were selected due to their strategic importance for the country and the region. For example, Oman’s oil refineries are located at Mina Al-Fahal and Sohar. The largest refinery to date is expected to start operating by the end of 2023 at Duqm. Moreover, major shipping ports are located at Sohar and Duqm. The most important desalination plants are located at Al-Ghubrah, Barka, and Taqah. Shuwaymiyah is a potential location for future industrial activities. Khaburah, Quriyat, and Shinas are important due to fisheries-related activities. Large-scale aquaculture projects are located in the offshore area of Quriyat. Masirah Island is one of the most promising tourist destinations in Oman, for which a comprehensive development plan is soon to begin. All these locations either currently have ongoing, or will undergo, coastal development in the country’s plan, namely Oman Vision 2040.

3. Results and Discussion

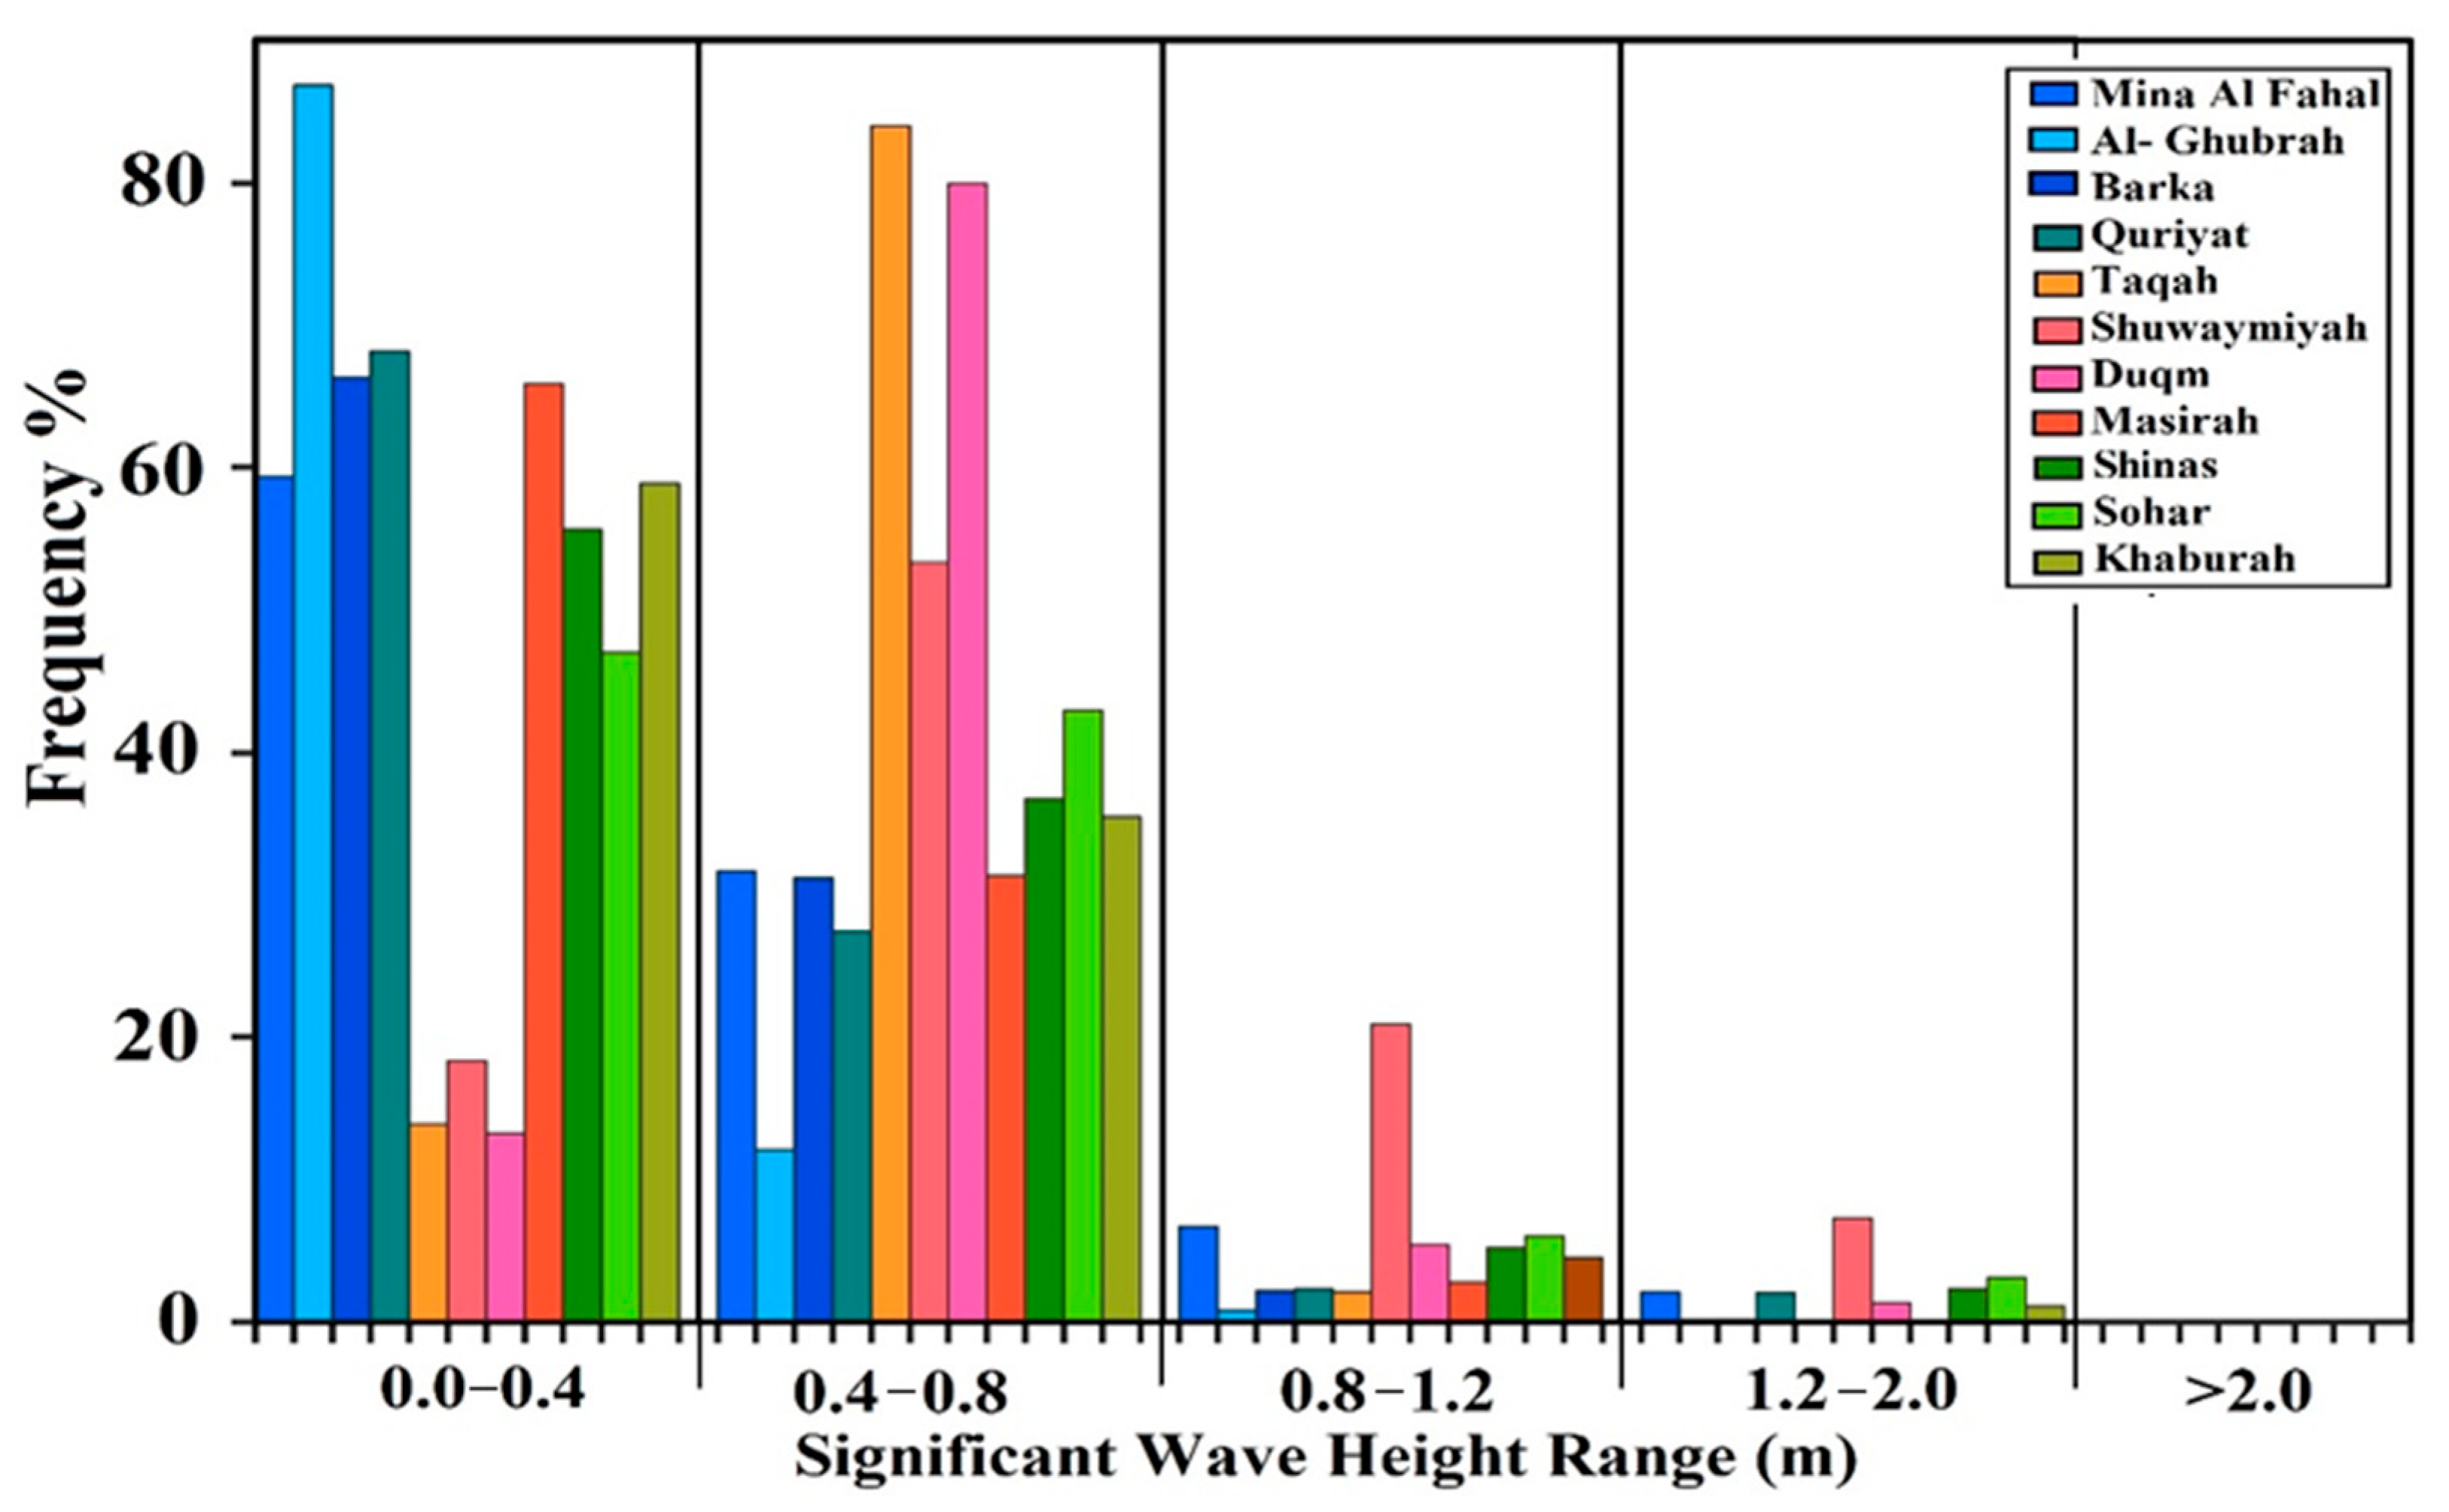
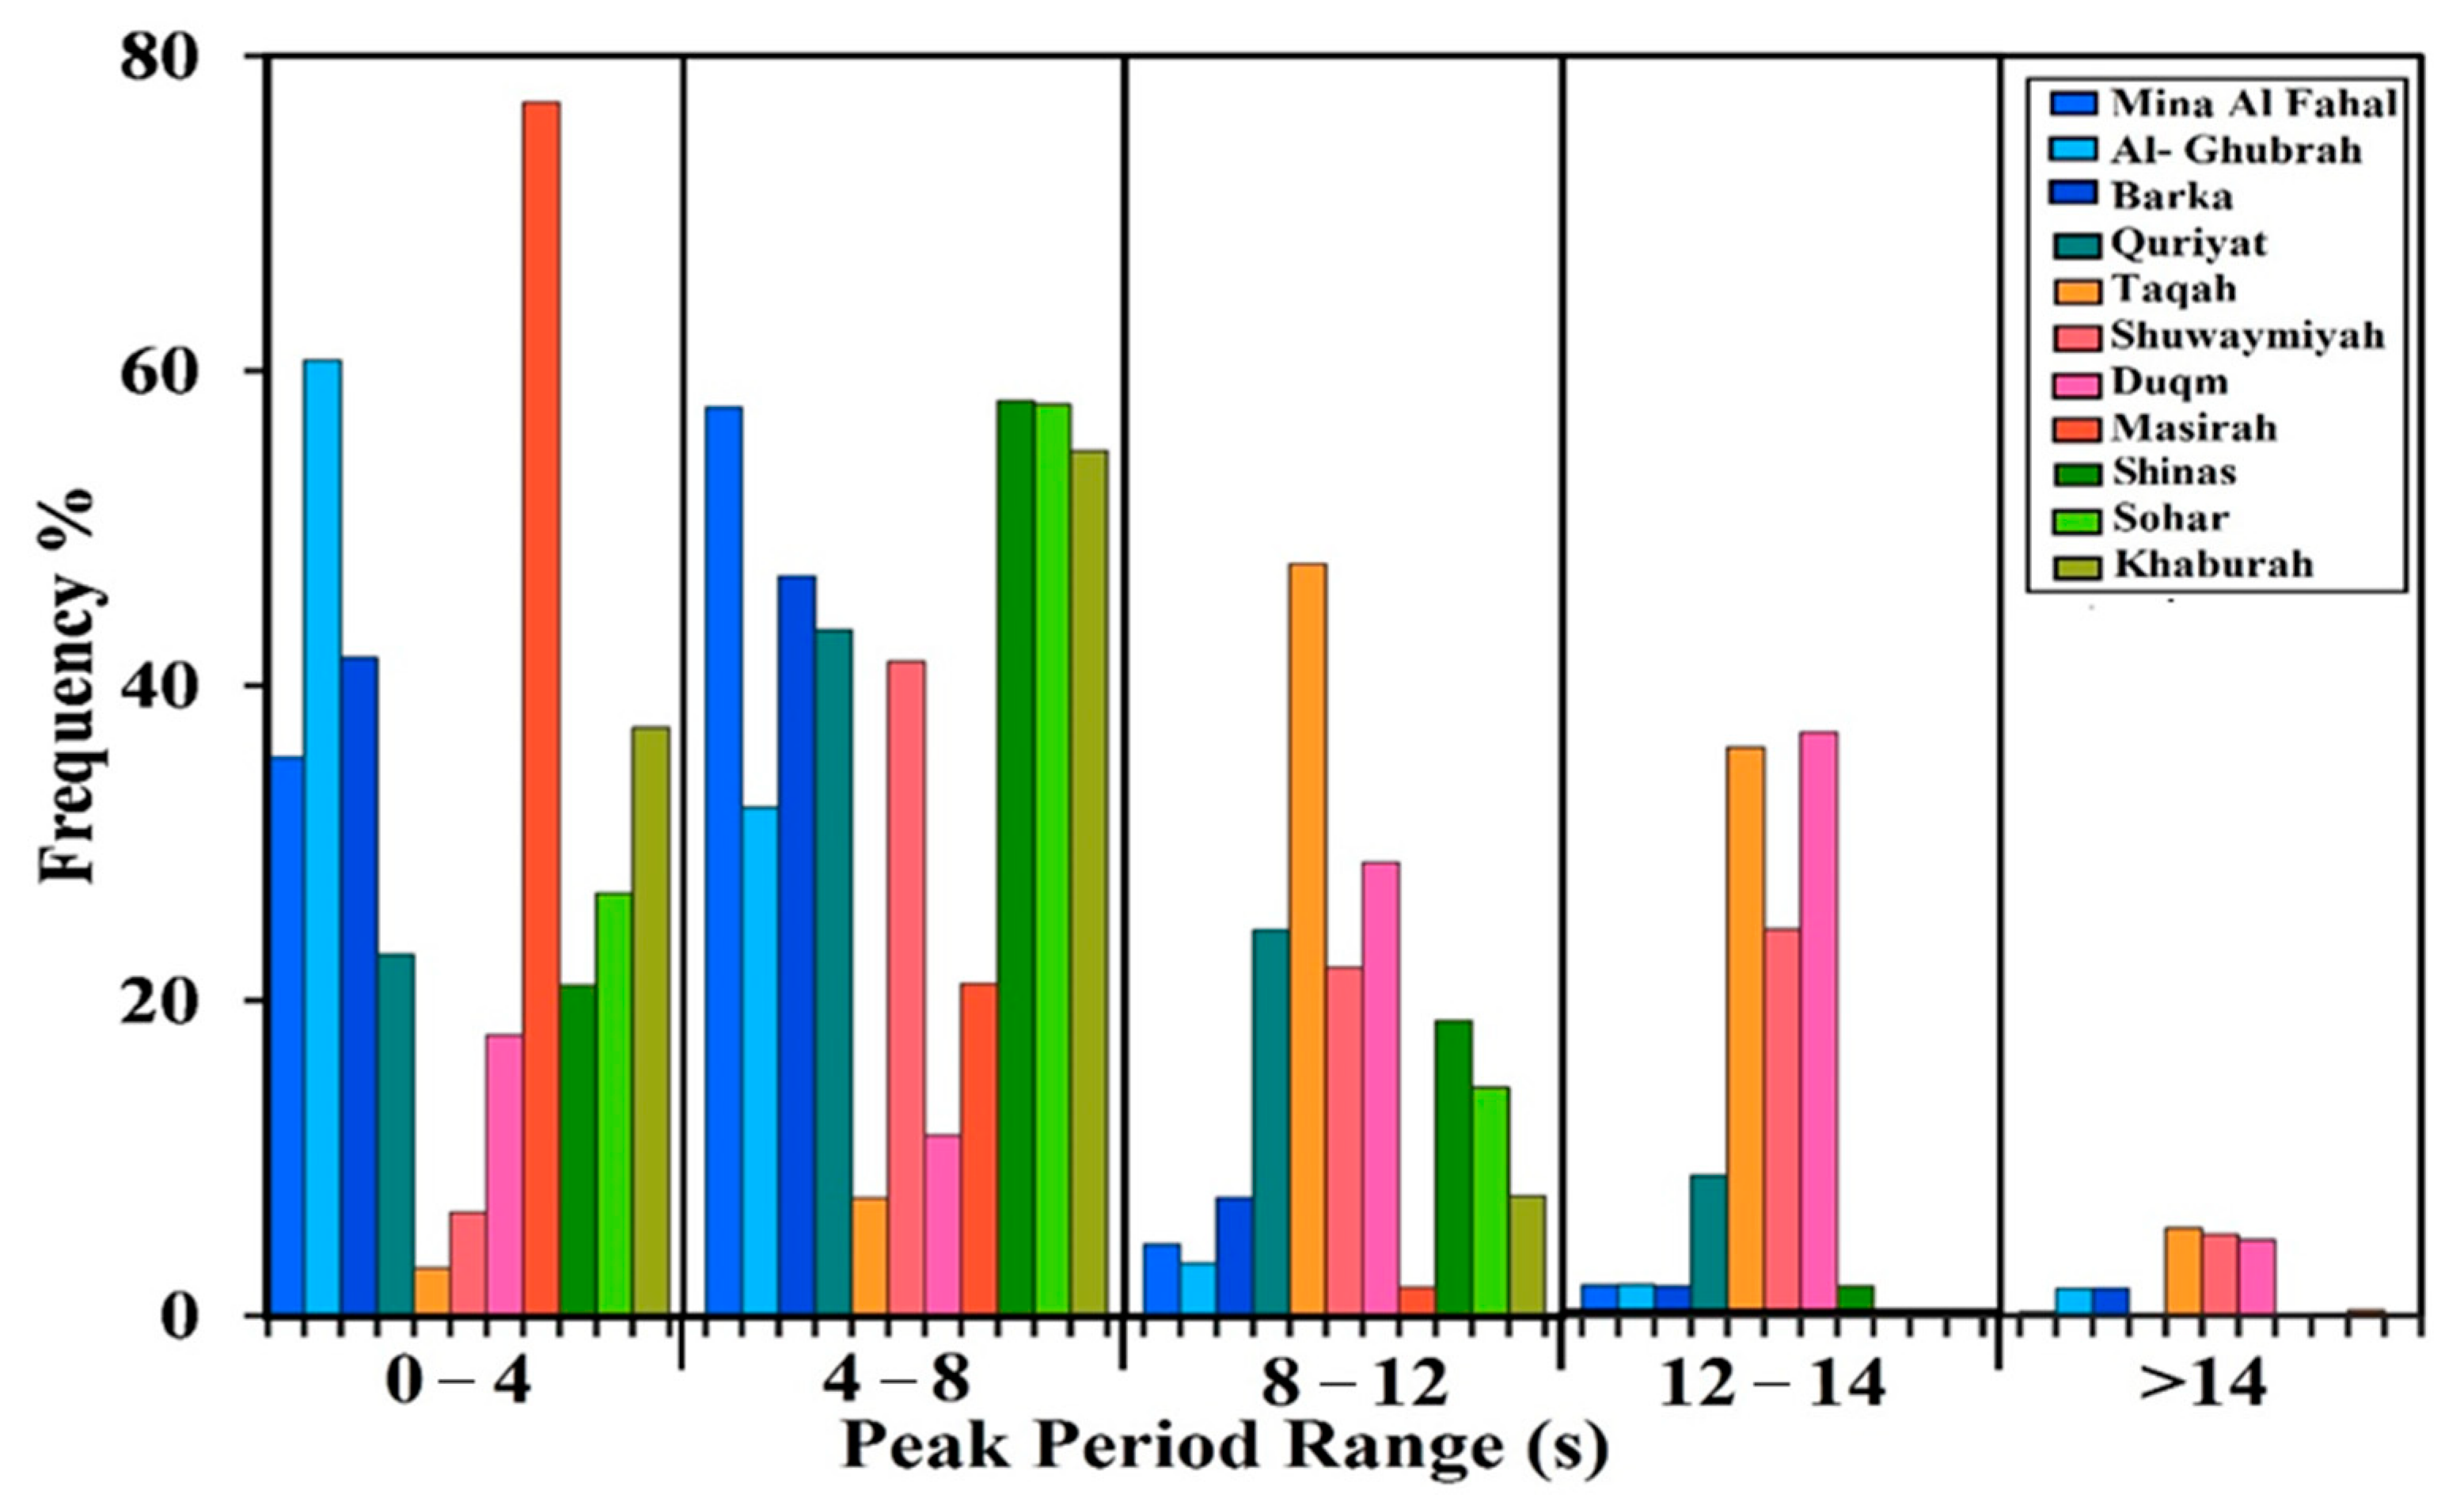
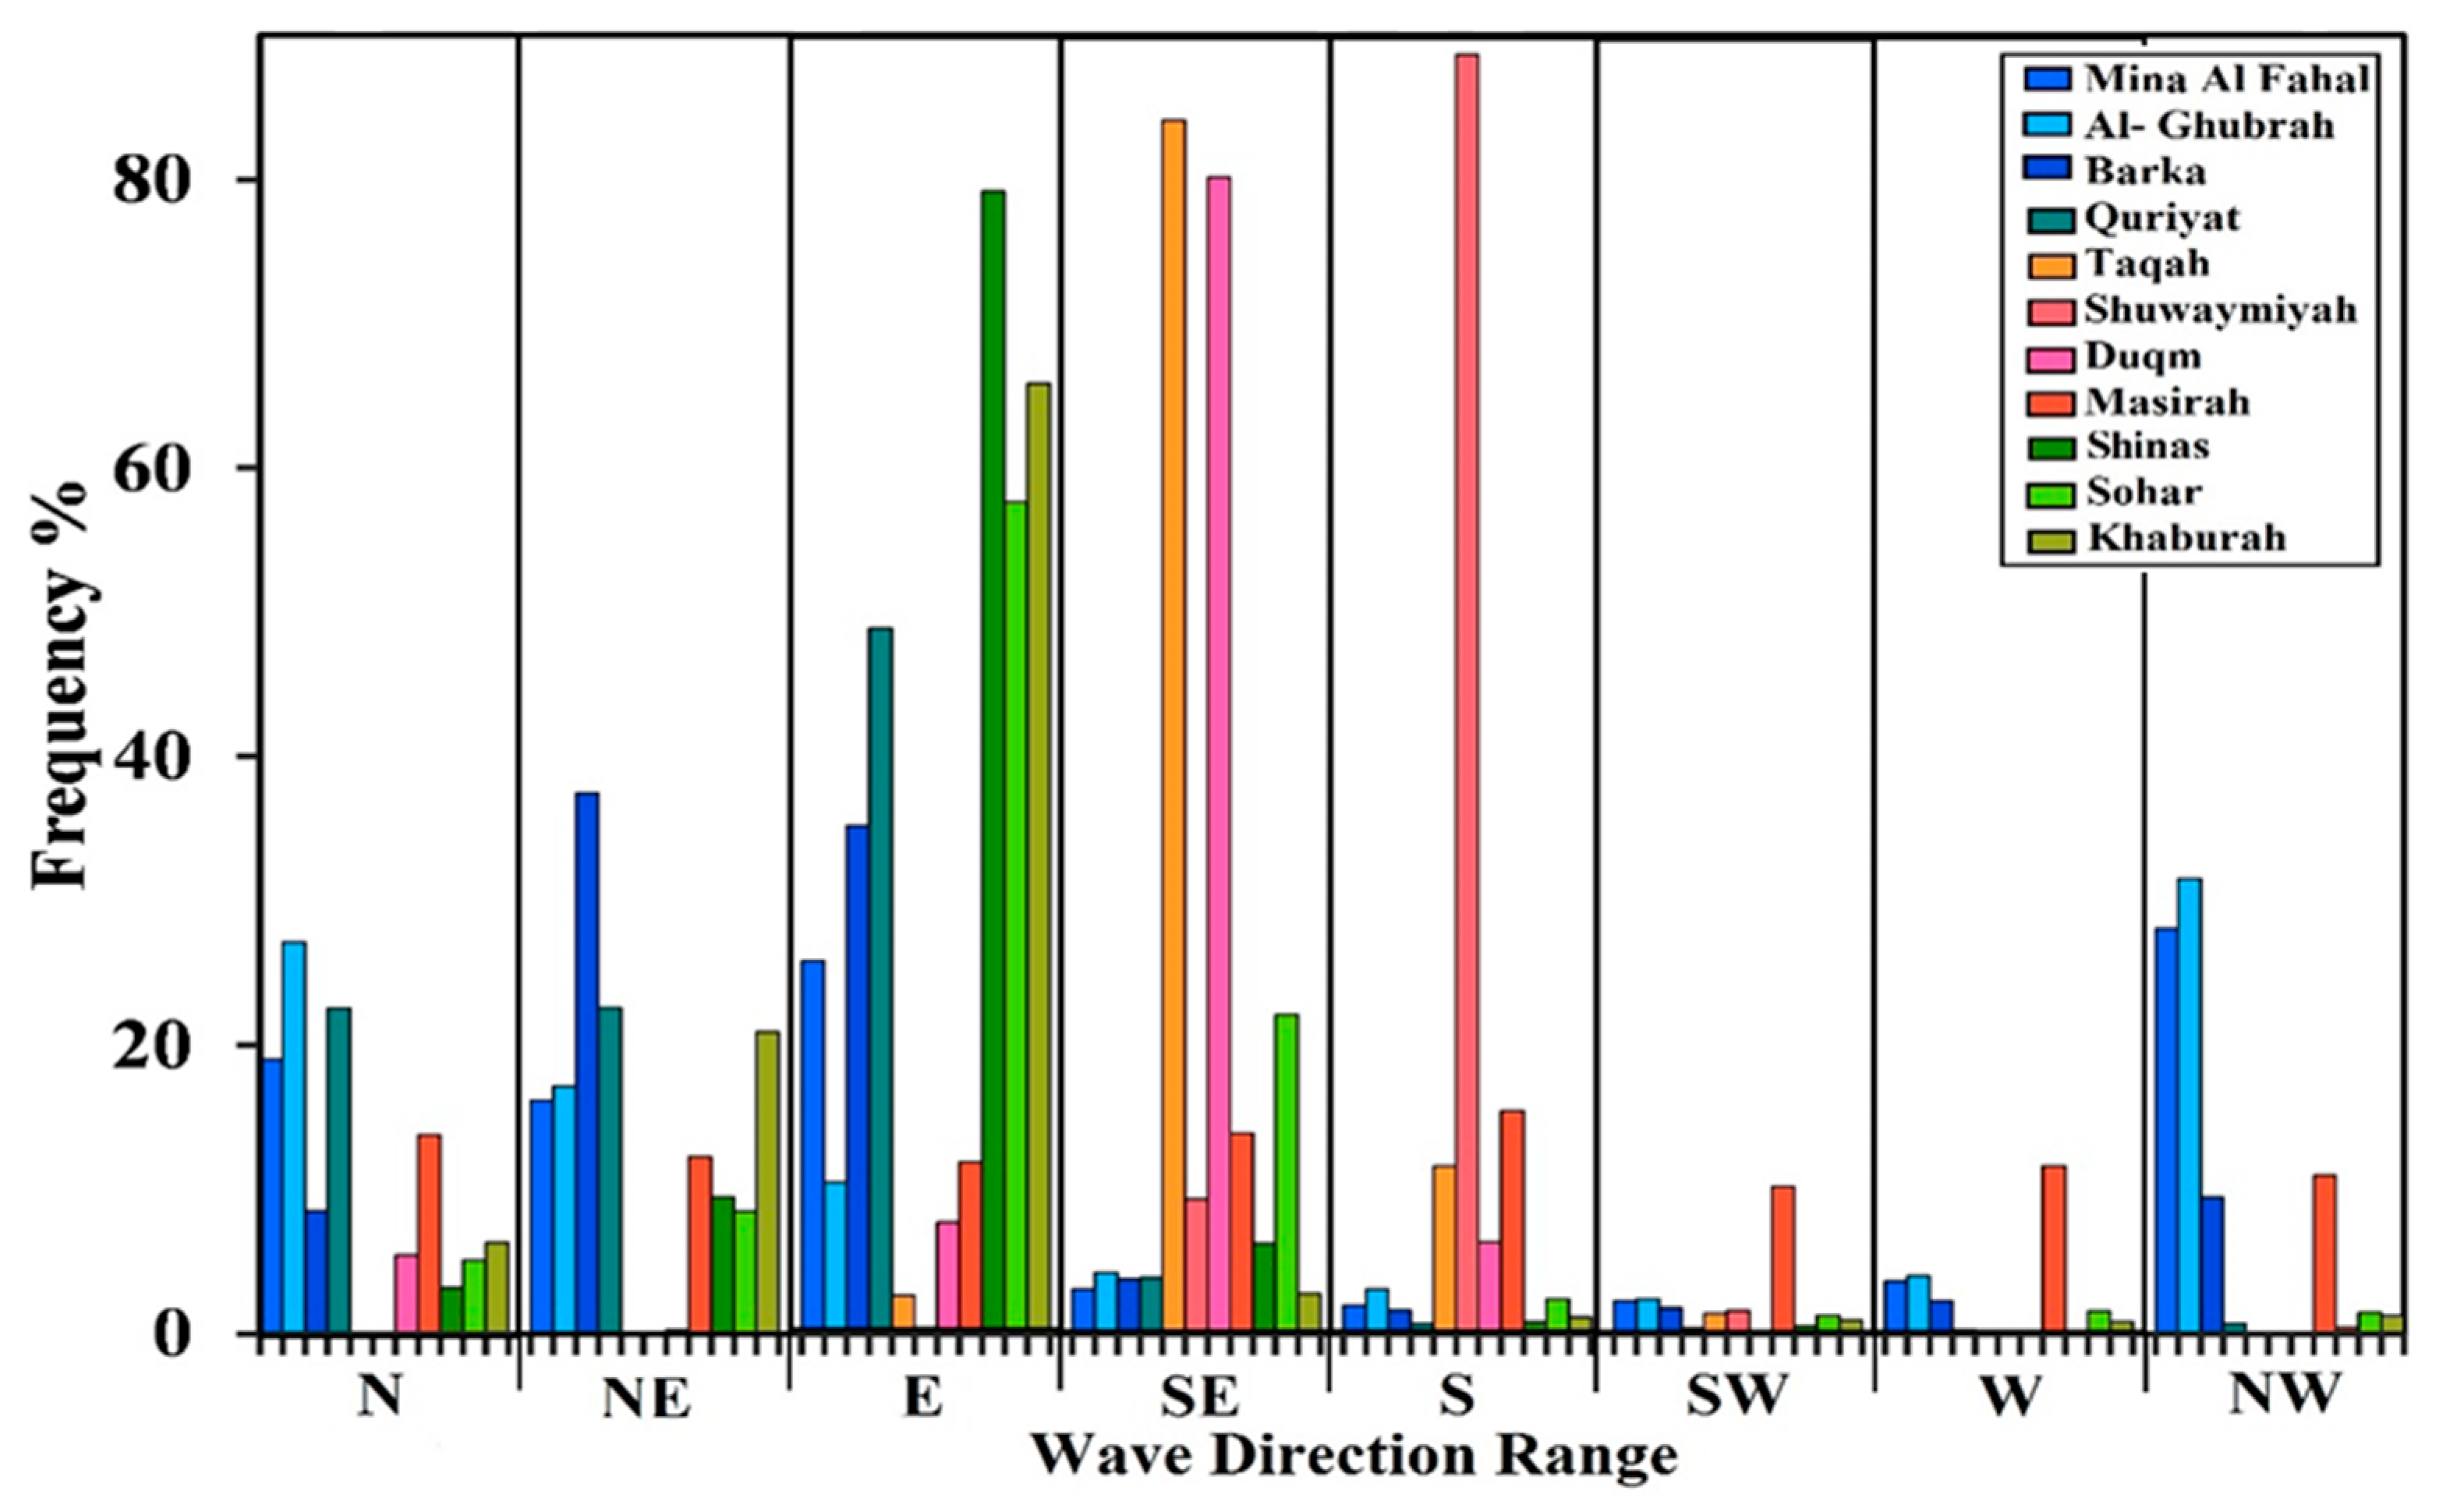
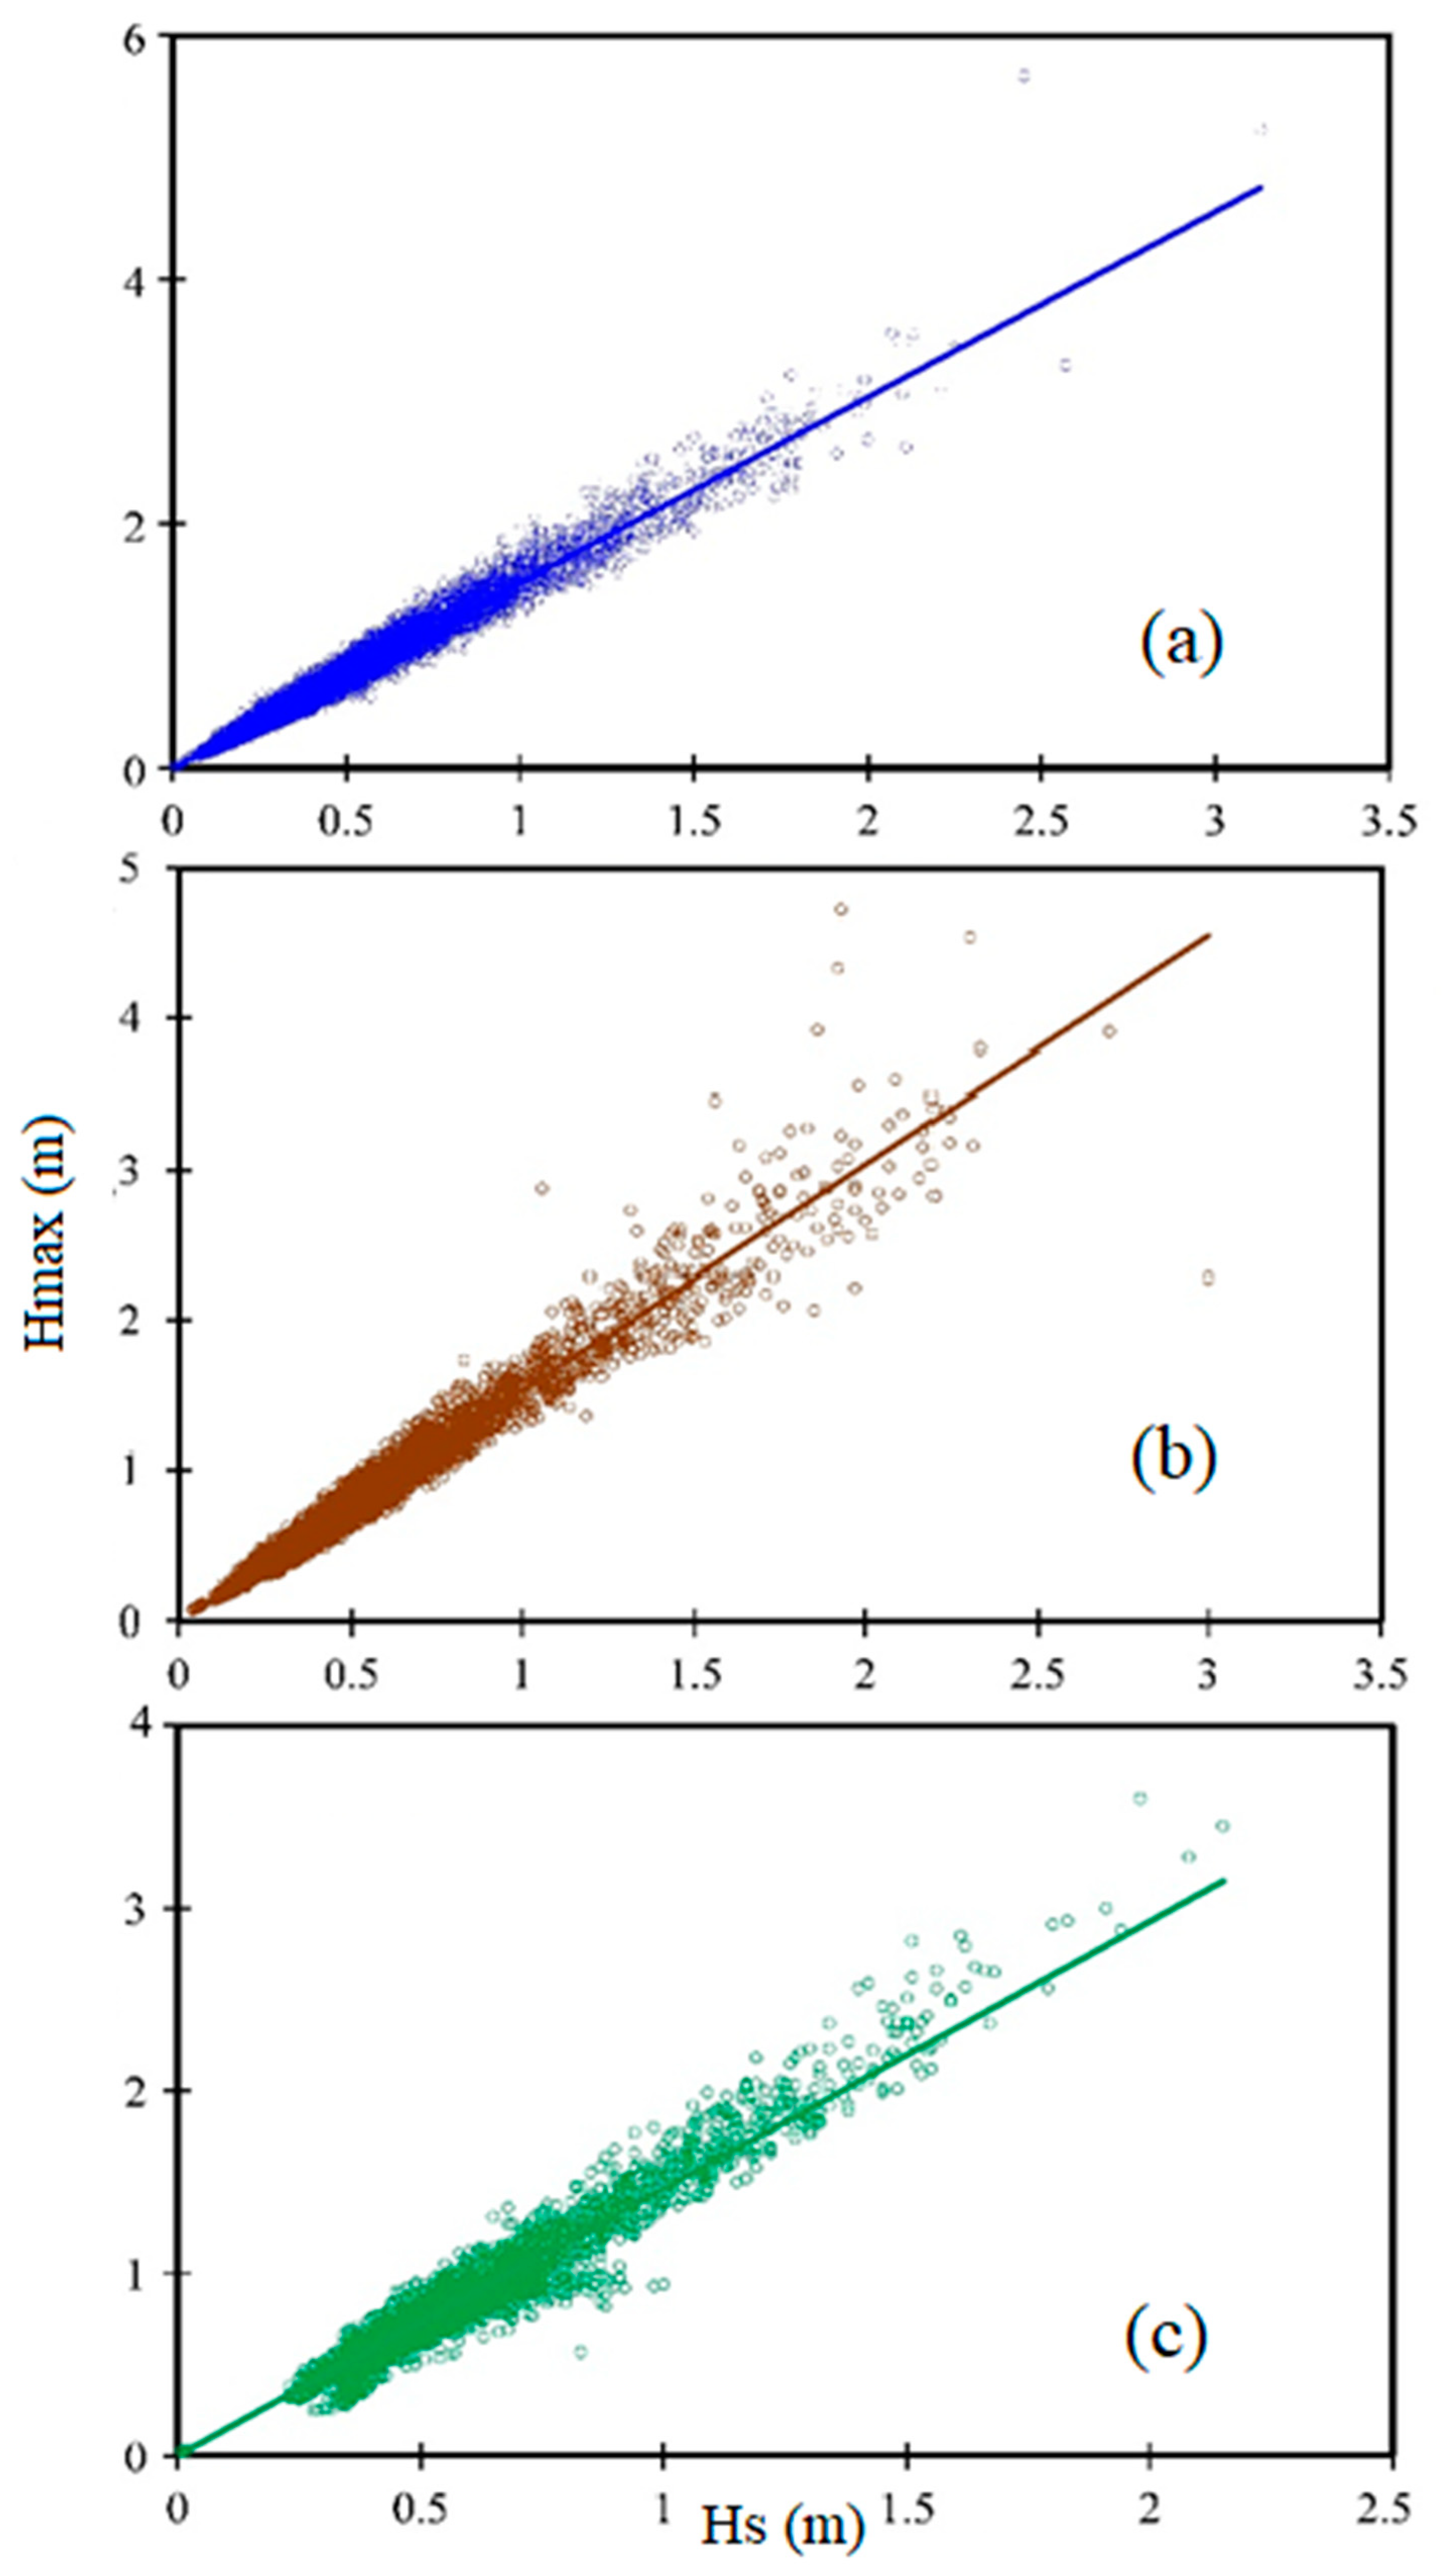
3.1. Wave Measurements

The significant wave heights at most of the measurement stations located along the coast in the Sea of Oman were generally less than 0.8 m, whereas at the stations located in the Arabian Sea, the values reached 2 m (Figure 3). This can be explained by the shorter fetch length in the Sea of Oman compared to that in the Arabian Sea. According to prevalent wave theories, fetch (distance over which the wind is blowing) and wind duration are the major factors for the generation of wind waves [27].
The peak wave period also showed distinct difference between the stations located along the Sea of Oman and Arabian Sea (Figure 4). The stations located in the Sea of Oman have peak wave periods of up to 8 s, which is a typical value for wind waves generated in an area. On the other hand, the stations located in the Arabian Sea were dominated by peak wave periods of greater than 8 s, which is the characteristic of swells (wind waves generated far from the measurement area). In the Arabian Sea, which has more open area than the Sea of Oman, the propagation of waves from greater distances is possible compared to that in the Sea of Oman. Wave direction (Figure 5) also showed different characteristics on the measurement stations located in the Sea of Oman and the Arabian Sea. The wave direction in the Sea of Oman was generally from the north, northeast, northwest, and east, whereas the stations in the Arabian Sea showed the waves mostly coming from the south and southeast. A small percentage of waves at the Masirah station coming from southwest or west are probably the waves reflected from the mainland coast. At Shinas, Sohar, and Khaburah, most of the waves were found to propagate from the east. The Al-Hajar mountain range is on the western side of the Al-Batinah coast, along which these stations are located; it may be noted that the possibility of wind blowing from the west is minute. Therefore, the possibility of wind wave generation from this direction is bleak.
The ratio between the maximum wave height Hmax, and significant wave height Hs for the the coastal stations in the vicinity of Muscat (Mina Al Fahal, Al Ghubrah, Barka, and Quriyat), the southern Omani coast (Taqah, Shuwaymiyah, Duqm, and Masirah), and the northern coast along the Al-Batinah region (Shinas, Sohar, and Khaburah) are shown in Figure 6. The ratio Hmax/Hs is based on the least squares method (represented by straight lines in Figure 6), which was 1.52 for Muscat and the northern (Al-Batinah) coast, whereas this ratio was 1.463 for the southern coast. Using the Rayleigh probability distribution, which is widely used for wind waves [27], the Hmax/Hs ratio was ≈ 2. However, for the nearshore region, the statistical relation slightly varied and was limited by the lower extremes or by breaking waves [27]. Therefore, for the coastal locations of Oman, the ratio of Hmax/Hs ≈ 1.46 to 1.5 was found from the measurements in this present study.

Wave Height Return Period Analysis

For the design of coastal structures, estimates of wave height for various return periods (TR) are required. Here, the measured data was found to follow a Gumbel distribution, which is commonly used for this purpose [27].
Table 2 shows the Hs calculated for the return periods of 5, 10, 20, 50, and 100 years from the measured wave data. For TR = 5 years, the estimated wave height was less than 1 m at all observation stations except at Shuwaymiyah, where it was slightly higher (1.06 m). The wave heights for the return periods of 5, 10, 20, and 50 years depicted higher values at the stations on the southern Omani coast as compared to those at the stations located along the Muscat coastline. These higher values might be due to the longer fetch provided by the Arabian Sea, which is more prone to tropical cyclones with high intensity winds than the semi-enclosed Sea of Oman. However, the wave heights at the Sohar and Barka measurement stations were found to be higher than those at the southern coast stations for the 100 year return period. These unusual values could be because of the few extreme events observed during the measurement campaigns at these stations. This further reinforces the idea that long-term observation data are required to obtain realistic statistics of the hydrodynamic parameters. Wave height estimation at the eastern coastal location of the Sea of Oman for the 50 year return period was nearly 2 m, and in the offshore area of the Sea of Oman it ranged between 5.5 and 8 m (based on the 33 years of offshore cyclone modelling [28]). The intensity of the storms and the tropical cyclones is quite high in the offshore locations and open sea, resulting in large wave heights, but its strength gradually lowers when it reaches the coast due to energy dissipation. Therefore, the estimated wave height of 3.31 m at the monitored coastal location of Oman seems reasonable. Due to logistical restrictions, the wave and current profiles could not be measured at further offshore locations in the present study.

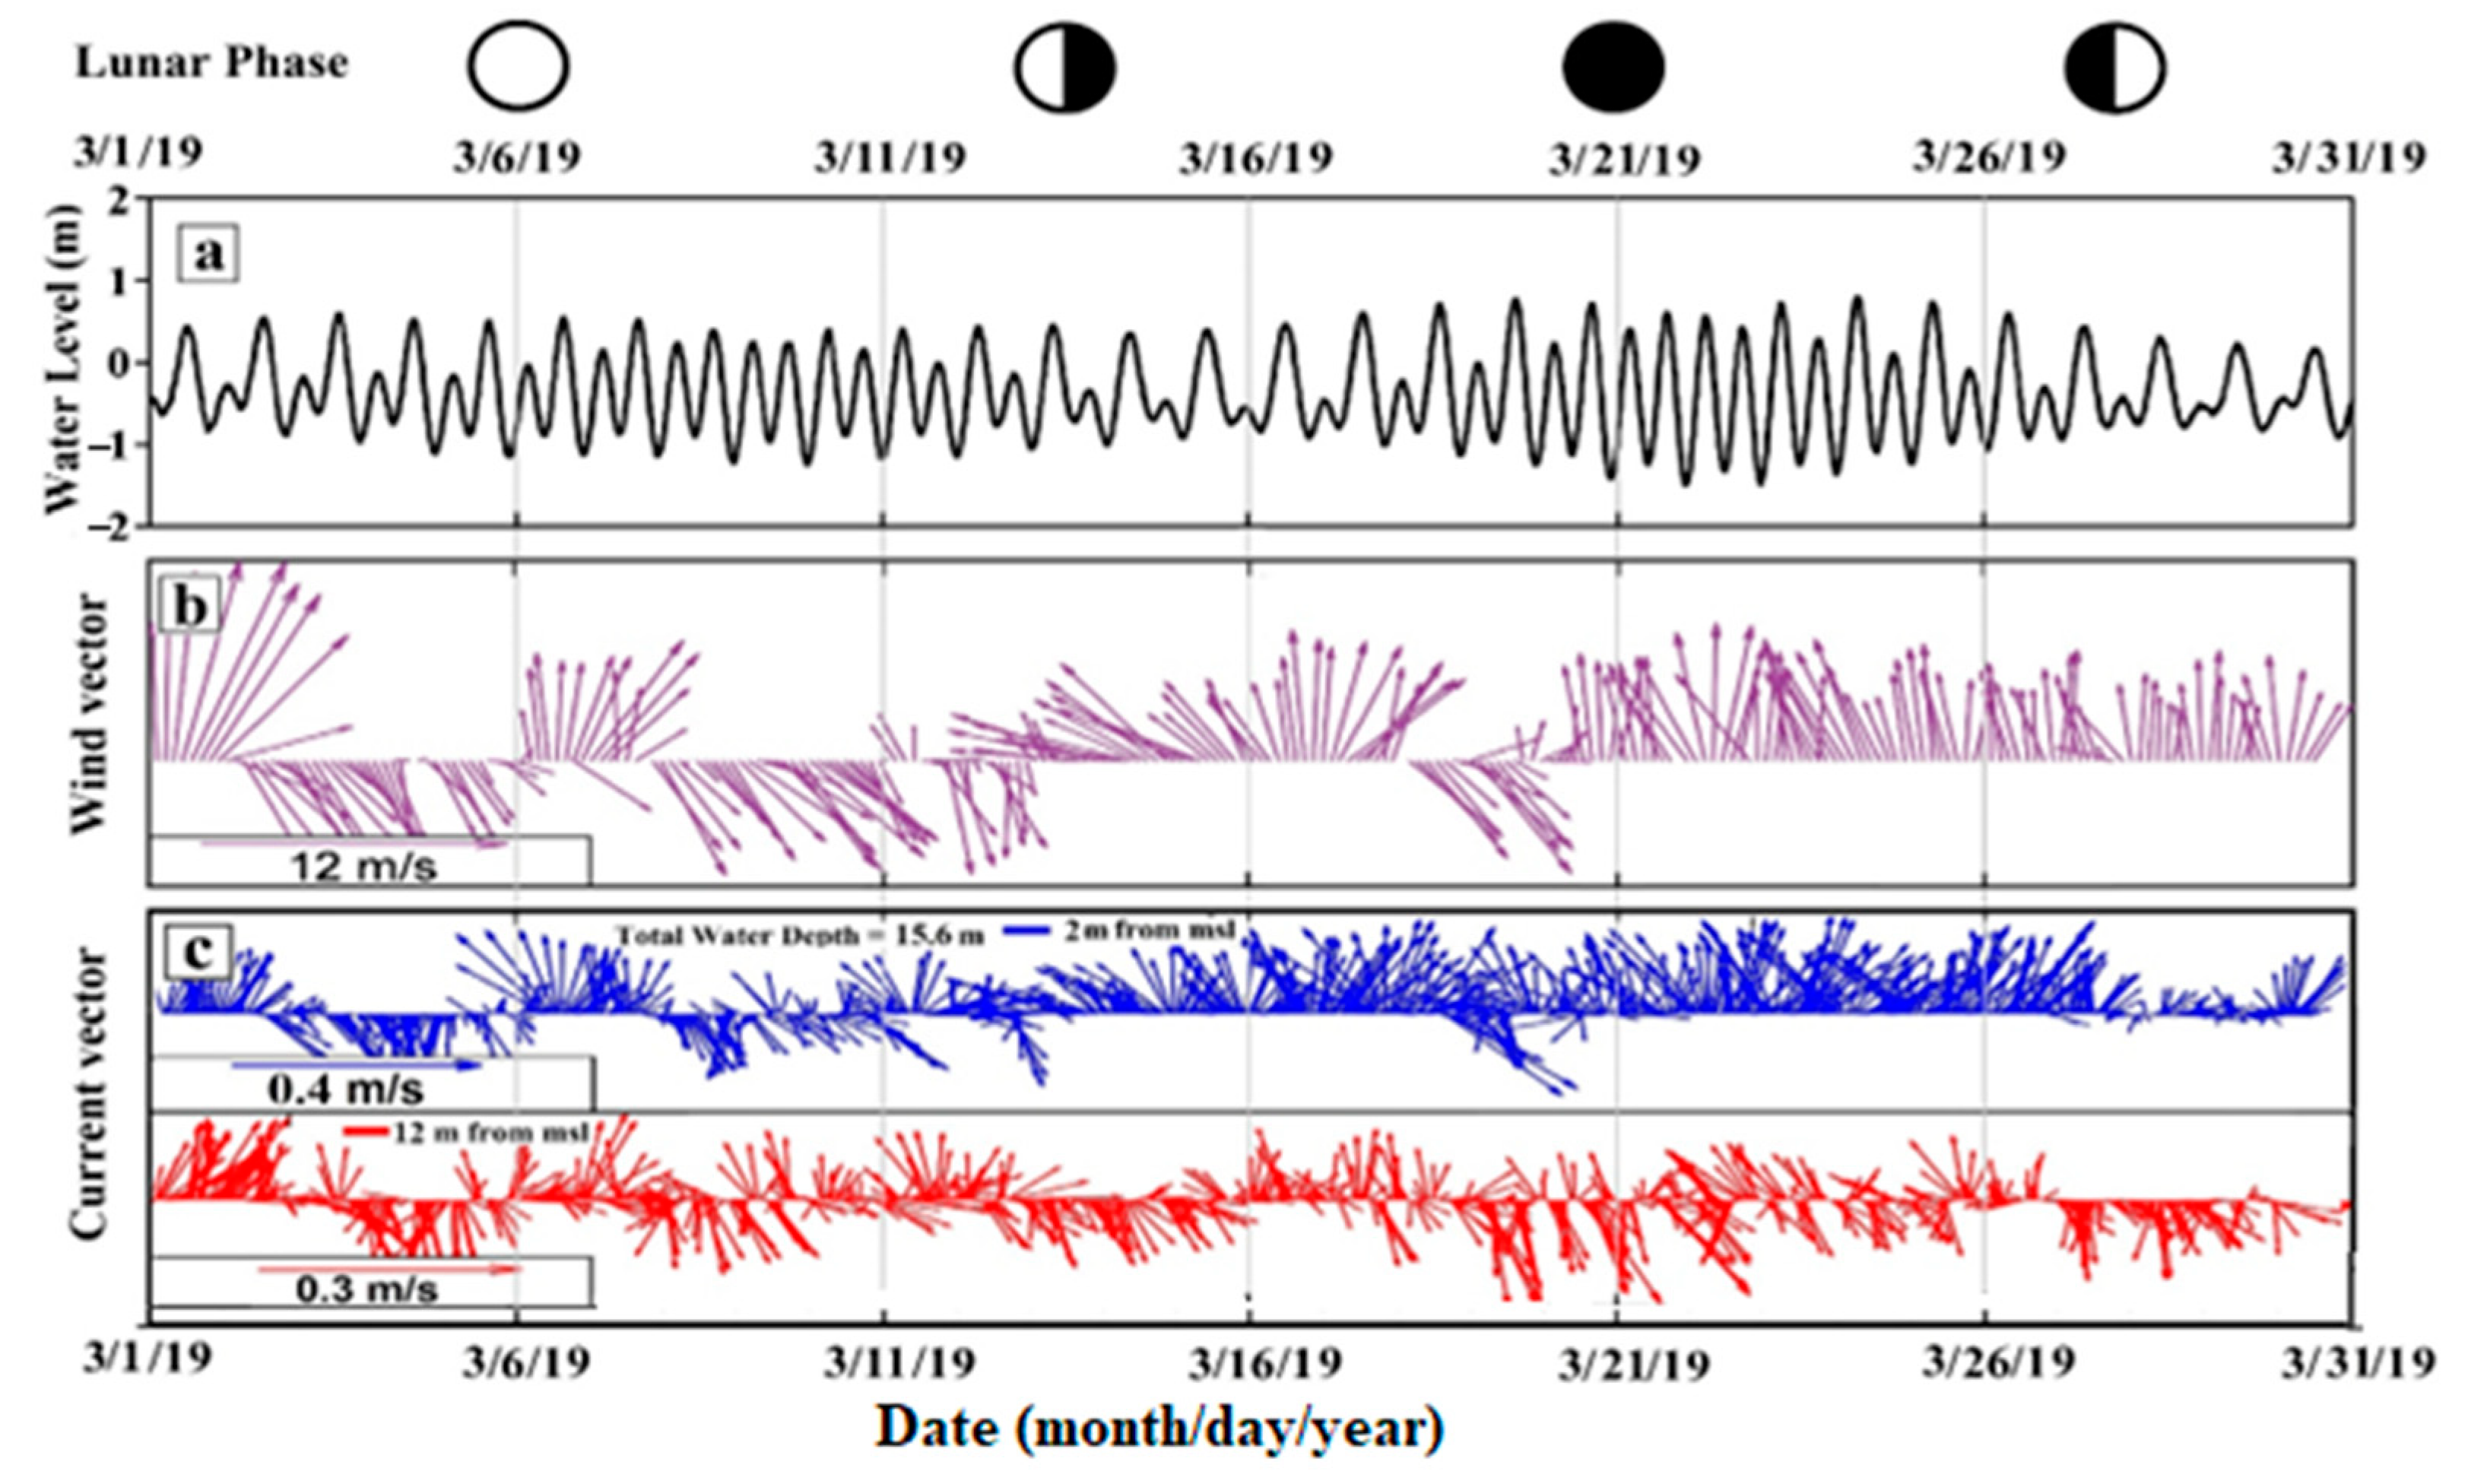
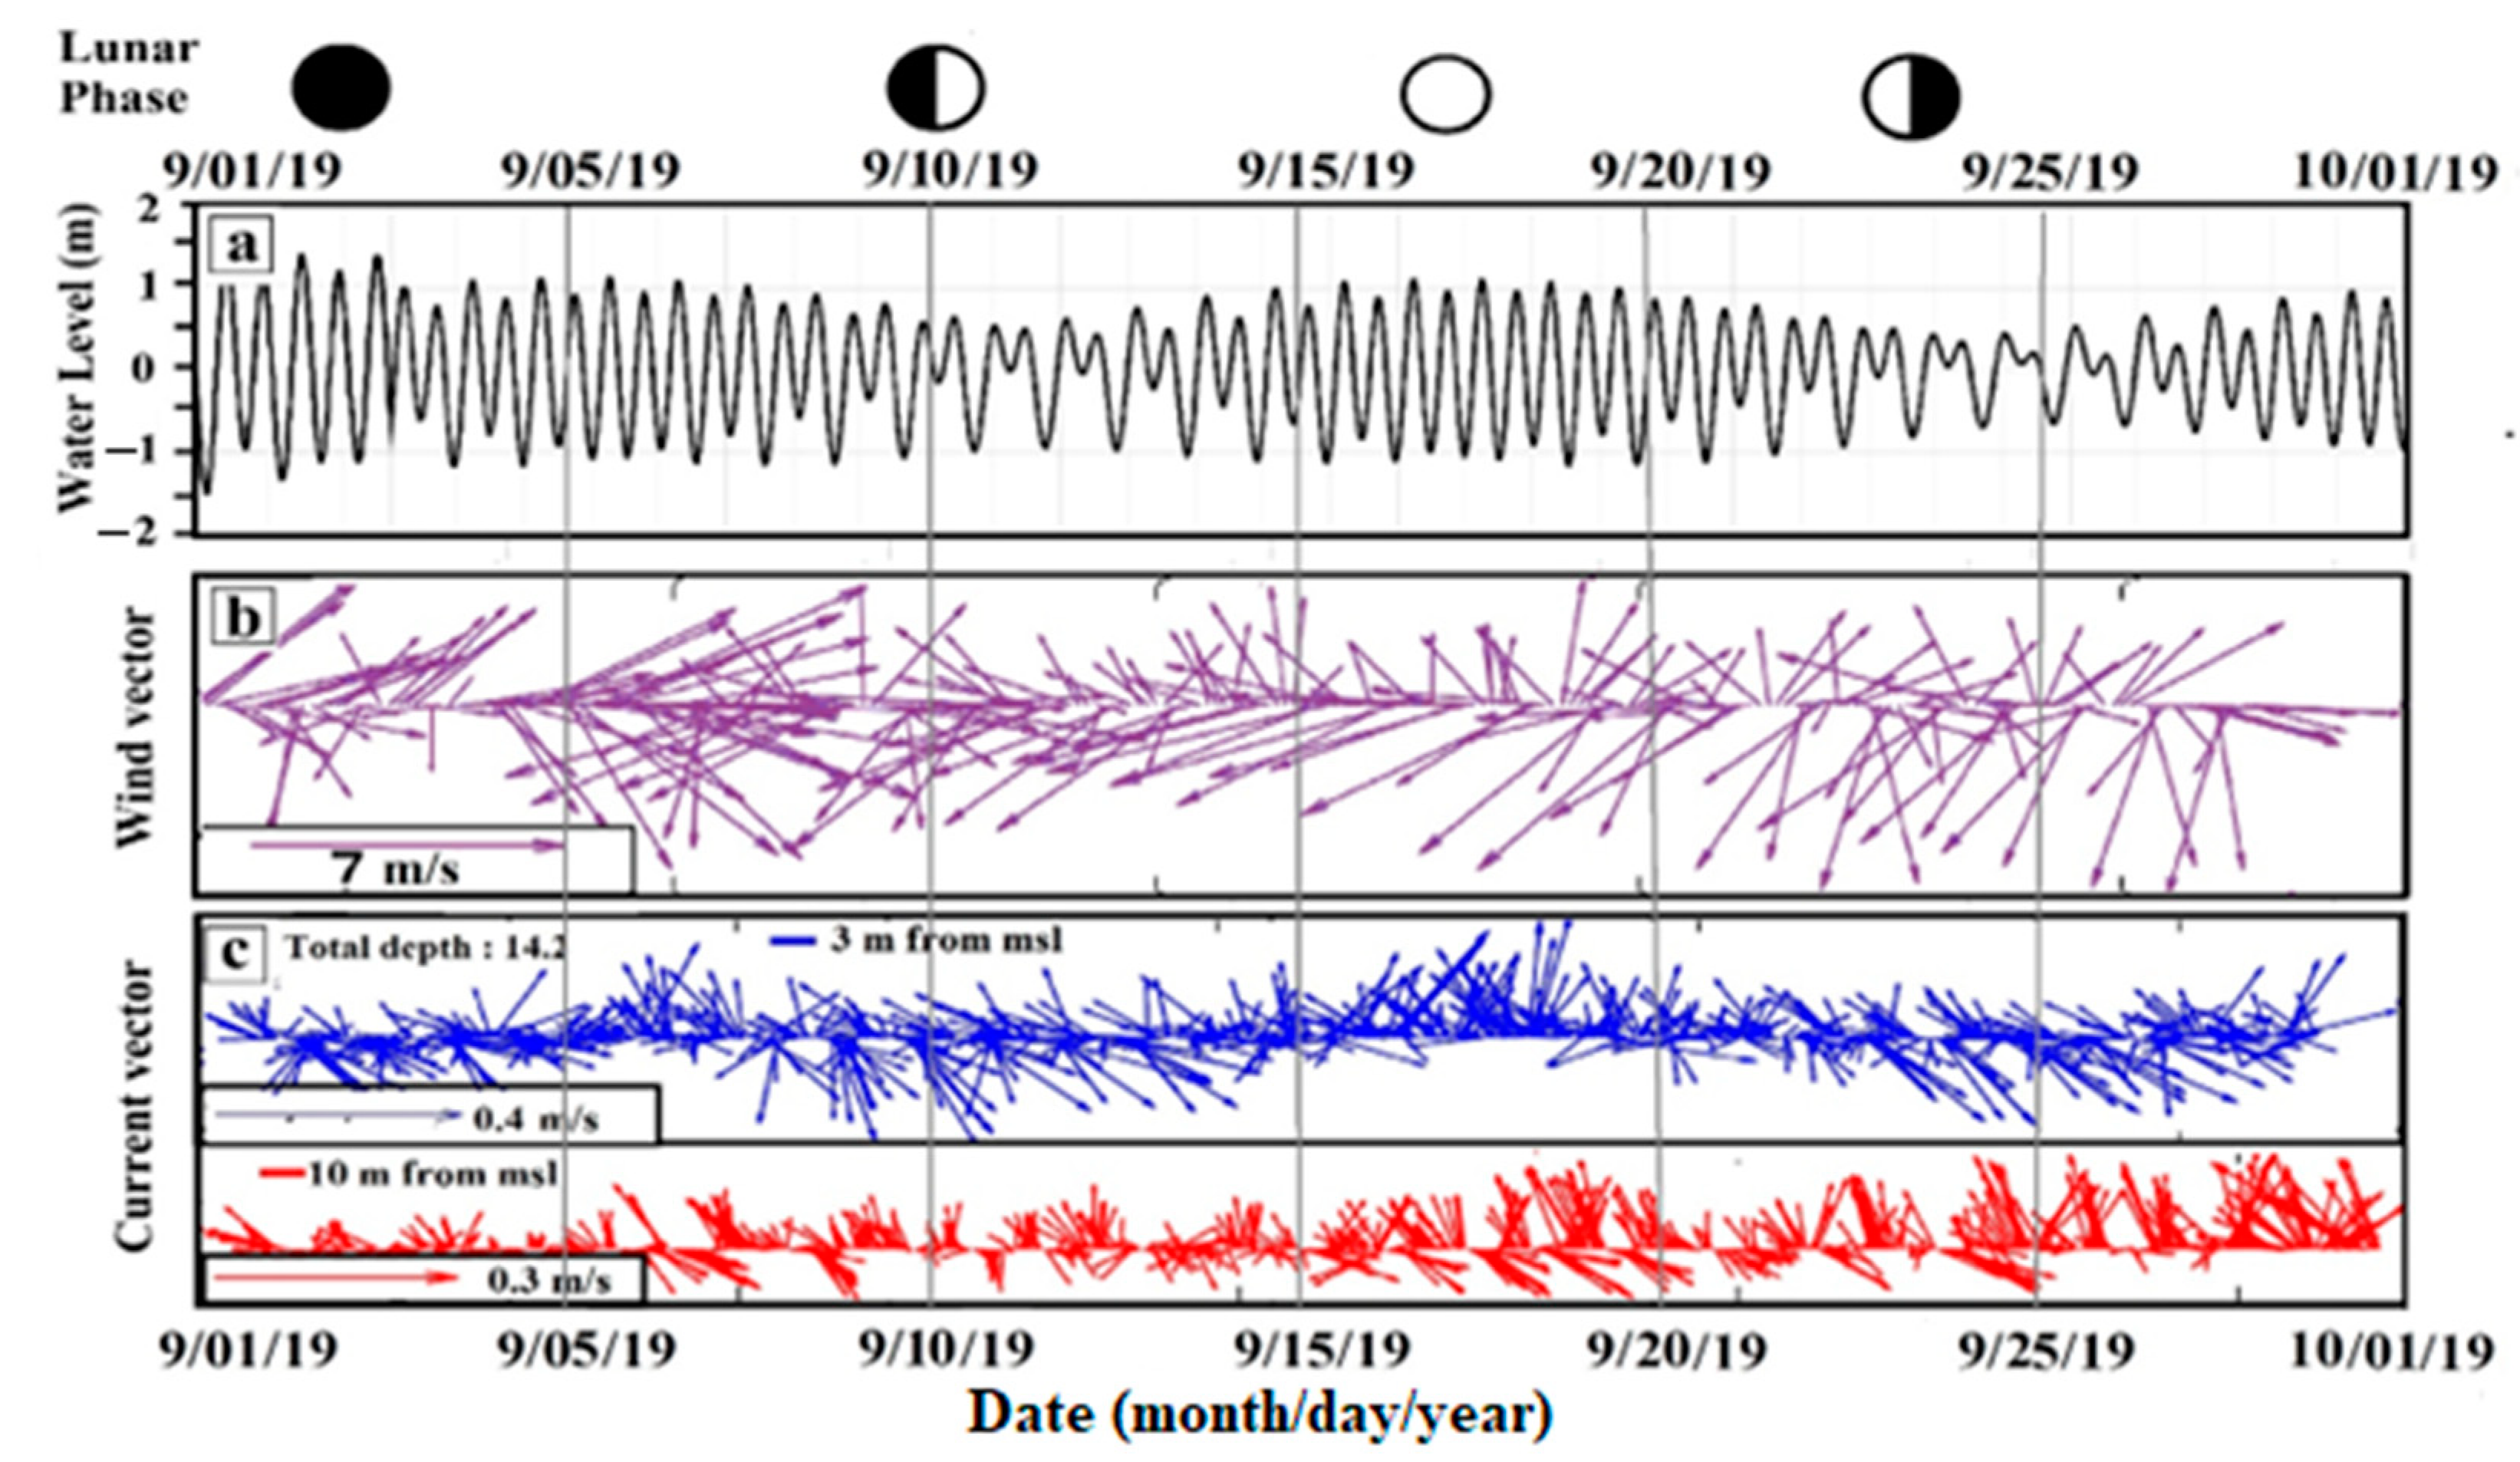
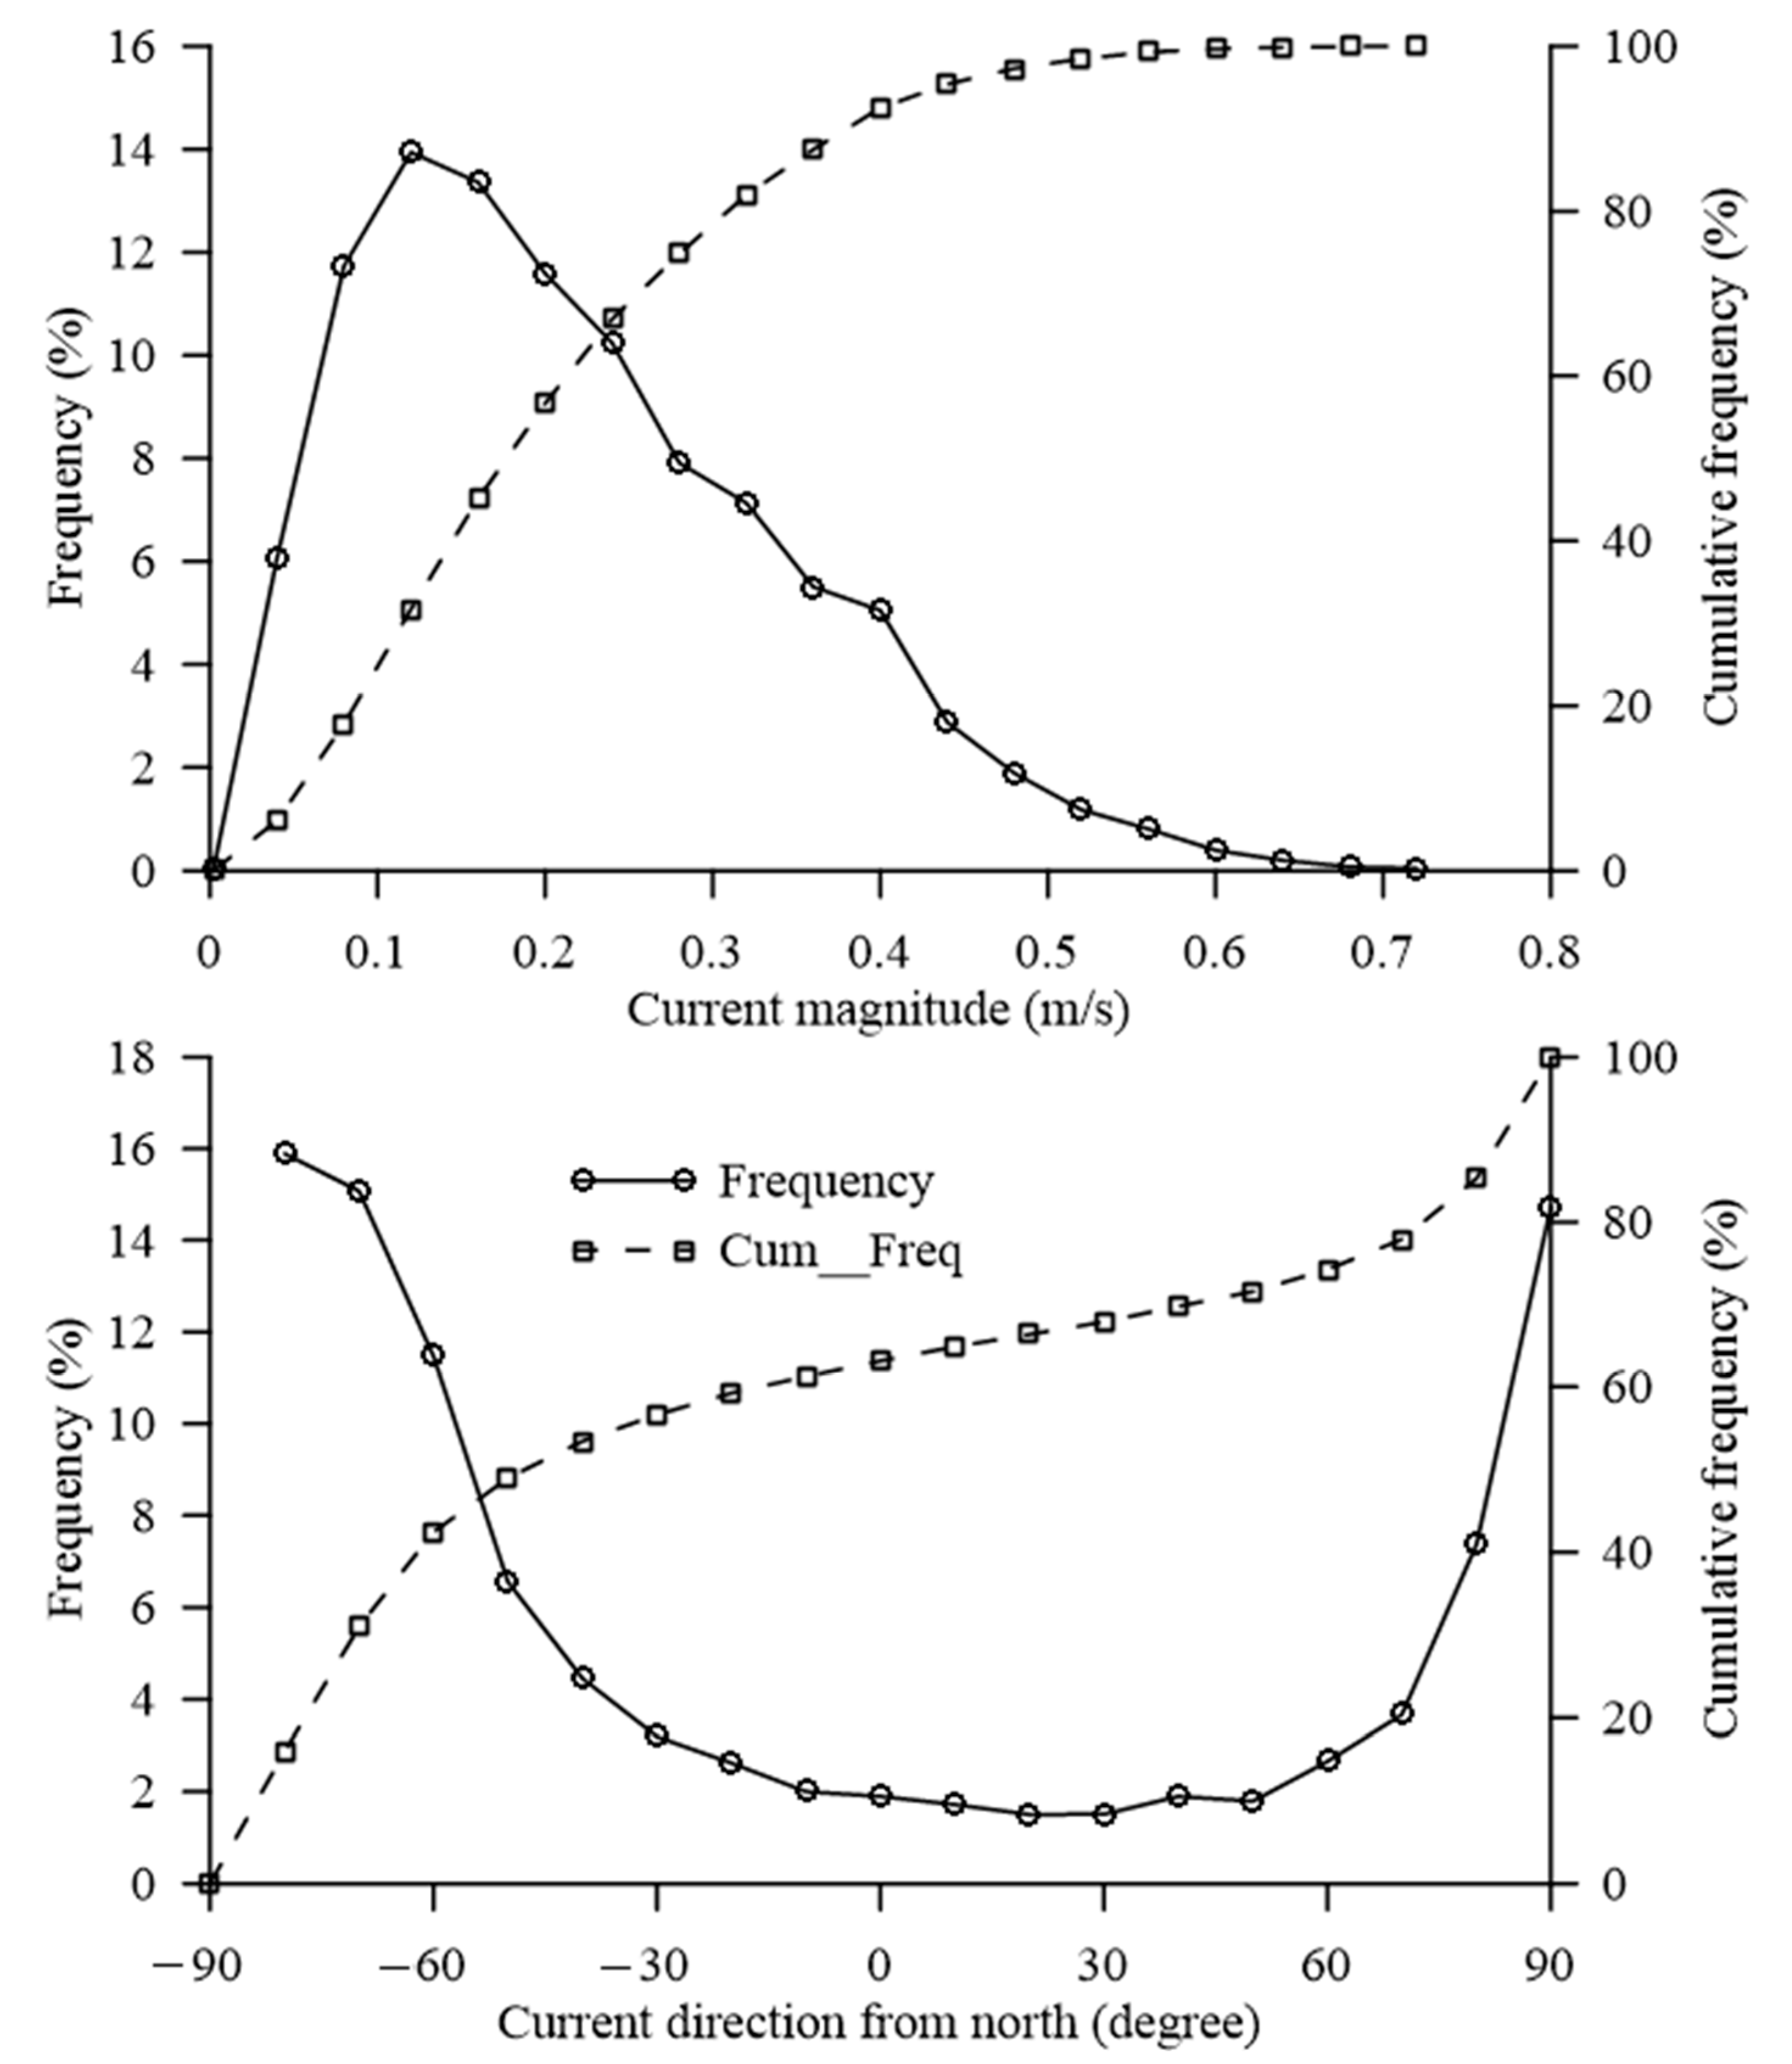
3.2. Tide and Current Measurements

The water surface elevation and current profile at each measurement location were recorded for a period of no less than two months. The wind data were obtained from the European Centre for Medium-Range Weather Forecasts (ECWMF)-ERA-interim model (https://www.ecmwf.int/, accessed on 25 July 2023). The water surface elevation suggests that all along the coast of Oman, a mixed, predominantly semidiurnal, tide prevails. Examples of the water surface elevation, wind vectors, and current vectors are shown for Duqm (southern coast) (Figure 7) and Sohar (northern coast) (Figure 8), along with the lunar phases.
Both locations are important because the major ports of Oman are located there. Moreover, Oman’s second largest oil refinery is located at Sohar, and the future largest oil refinery is to start operating at Duqm by the end of year 2023. The tidal characteristics at both stations show mixed, predominantly semi-diurnal, tides. Current magnitudes at the Duqm station were generally higher than those at Sohar. The tidal oscillations were highly influenced by the alignment of the orbit of the Earth with the Sun and the Moon. The highest tidal level occurred after the events of the full and new Moon, when the Earth, Sun and the Moon are sprightly aligned—this condition is known as spring tide. The minimum tidal range is observed during the first and third quarter Moon, when the Earth and the Moon are at right angles with the Sun, which is known as the neap tide [27]. Tidal elevations at both stations show the spring and neap tides conforming to the full (and new) moon and the half-moon, respectively.
At four locations on the coast of the Arabian Sea (Taqah, Shuwaymiyah, Duqm, and Masirah), the currents were stronger (0.1 m/s to 0.8 m/s) than those along the Sea of Oman, where seven measurement stations were located (Mina Al Fahal, Al Ghubrah, Barka, Quriyat, Shinas, Sohar and Khaburah). The current speeds ranged from 0.02 m/s to 0.25 m/s. These values conform well with previous studies in this area [3,9,10,11].
Generally, the currents were found to be governed by the tidal circulation at all the study locations, as represented by the water surface elevations. In the present measurements, the currents near the ocean bottom did not have a significant correlation with the wind stress by virtue of direction. Wind and waves are responsible for generating surface shear and mixing, while the strong tidal currents cause bottom friction and the mechanical mixing of layers in the water column [3]. Although not very prominent, the effect of Coriolis force, and wave and wind friction in the water surface were visible at all stations, with the current direction differing by approximately 45° with respect to the dominant propelling wind direction around the station. Wind speed along the coast of the Arabian Sea was also much stronger than the coast of Sea of Oman, causing stronger near-surface currents along the Arabian Sea, as shown by comparing current magnitudes at Duqm (Figure 7) and Sohar (Figure 8), which are located along the Arabian Sea and the Sea of Oman, respectively.
Mina Al-Fahal is one of the most strategically important locations along the coast of Oman. Measured current magnitude (averaged over water depth) and direction (with respect to north) were analyzed using approximately three-month-long observations from 31 December, 2017, to 3 April, 2018, at 10 min intervals. The frequencies of various current magnitudes and directions are shown in Figure 9. A current magnitude of 0.12 m/s has the highest frequency (about 14%). From cumulative frequency, it can be observed that 80% of the currents had a magnitude less than or equal to 0.3 m/s. This was expected because the Sea of Oman coast is a low-energy coast, as described in previous studies [8,11]. The average current direction is generally restricted within a narrow frequency range. About 30% of the currents were directed between −80° to +80° of north, and about 80% of the currents are within −30° to +30° of north. In other words, generally the currents were flowing either in eastward or westward direction. Again, such a direction is logical because of the location of this station and reports from earlier studies [3]. The current magnitudes depict a skewed frequency plot resembling a Rayleigh-type distribution, which is believed to be applicable to wind waves. Such a result is useful in the prediction of seawater quality, sediment movement, and marine ecology in the coastal waters.

4. Conclusions

Since the early seventies, the coasts of the Arabian Peninsula have observed huge coastal developments, resulting in more job opportunities and enhanced economic activities. At the same time, the environment along the coasts has rapidly deteriorated due to a lack of monitoring and improper management of the coasts. In the present study, the hydrodynamic measurements were conducted using available state-of-the-art equipment. The results of the present study may be used as baseline measurements and permanent monitoring stations could be established by the public authorities by selecting some of the sites from this study. Current and wave behavior in different months from 2017 to 2019 at the eleven coastal location of the Oman were investigated based on the in situ current and wave data obtained from the ADCP.
The wave measurements showed that the most frequently occurring waves had significant wave heights ranging from 0.15 m to 0.65 m, and peak wave periods from 2 s to 6 s. The occurrence of swell waves with a longer period (>8 s) occurred more at the stations located on the southern coast (>40% of total waves) as compared to those in the vicinity of the Muscat (<10% of the total waves) and northern (Al Batinah) coasts (<20% of the total waves). The effect from the dispersion of storms or weather conditions at the Arabian Sea, rather than the effect from local wind conditions, supports the occurrence of higher swell waves at the southern coastal stations. Generally, the maximum wave height was estimated from the Raleigh probability distribution, according to which maximum wave height is approximately twice the significant wave height. However, the measurements in the present study suggest that Hmax ≈ 1.5 Hs. The statistical analysis based on the Gumbel distribution shows that the 100 year return period significant wave height varies from 1.67 m to 3.31 m for the eleven monitored location.
The average current magnitude at the upper surface was found to be 0.3 m/s, with the dominant direction towards the south, at the measurement stations in the vicinity of Muscat; 0.15 m/s, with the dominant direction towards southwest, at northern (Al Batinah) coast; and 0.2 m/s, with the dominant direction towards southeast, at the southern coastal stations. The mixed semidiurnal tidal cycle, with a tidal range of about 2 m, was observed in the study area. Higher current magnitudes were observed during the spring tide than during neap tide.
The measurement and assessment of the current, wind and waves parameters helps our understanding of the sea state and hydrodynamics along the coast of Oman. The analysis of these environmental forces plays an important role in research related to the planning and development of coastal and offshore engineering, ocean wave generation, wave energy converter, and other applications. The real-time continuous measurement of these forces would further help in the calibration and validation of the coastal and ocean models for evaluating pollution transportation, sedimentation, plume dispersion and flushing for the coastal area of Oman.
The continuous hydrodynamic measurements have numerous advantages due to the rapid pace of development along the coast. Due to a lack of historical data of hydrodynamic parameters, the design of coastal structures in the region is generally based on the statistical inferences from short-term measurements. Therefore, extremely expensive coastal structures are at risk of partial or total failure caused by the utilization of improper data. Another major problem is the coastal sediment movement causing erosion or deposition at various locations along the coast of Oman. A proper estimation of sediment movement requires an accurate knowledge of the waves and coastal currents. In the last two decades, harmful algal blooms (HABs) along the Omani coast have also posed a serious threat to human and marine life. The transport modeling of HABs requires a knowledge of the hydrodynamic characteristics of the area. A continuous monitoring program could improve this situation by providing historical data to the stakeholders. As observed from the hydrodynamic measurements in the present study, the wave, tide and current parameters along the Sea of Oman are different from those along the Arabian Sea. Therefore, permanent monitoring stations are needed for both bodies of water. To investigate the relationships between the deepwater waves and current profiles and those near the coastline, deepwater wave buoys equipped with downward-looking ADCPs would be useful. In addition, wind speed sensors should also be installed on the measurement stations because the wind data from nearby weather stations or ECWMF may not correctly represent the local wind conditions.
This study is extremely important considering the forthcoming environmental problems caused by the improper design and management of coastal structures, marine discharges, and the anticipated effects of climate change in the region.

Author Contributions

Conceptualization, A.S. and M.B.; methodology, A.S.; software, P.C.; analysis, P.C.; resources, M.B. and A.A.-M.; writing—original draft preparation, A.S. and P.C.; writing—review and editing, A.S.; visualization, P.C.; supervision, A.S. and M.B.; project administration, M.B.; funding acquisition, M.B. All authors have read and agreed to the published version of the manuscript.

Funding

This research was funded by the Environment Authority, Oman, grant number CR/DVC/CESAR/15/02.

Institutional Review Board Statement

Not applicable.

Informed Consent Statement

Not applicable.

Data Availability Statement

The data presented in this study are available on request from the corresponding authors. The data are not publicly available due to privacy reasons.

Acknowledgments

The authors wish to acknowledge the technical help provided by Nafeer Abulhuda and Induka Halwalage for the preparation of equipment deployments and MDPI for supporting the publication charges for this article.

Conflicts of Interest

The authors declare no conflict of interest.

References

  1. Chitrakar, P.; Baawain, M.S.; Sana, A.; Al-Mamun, A. Current Status of Marine Pollution and Mitigation Strategies in Arid Region: A Detailed Review. Ocean Sci. J. 2019, 54, 317–348. [Google Scholar]
  2. Chitrakar, P.; Baawain, M.S.; Sana, A.; Al-Mamun, A. Multivariate statistical technique in the assessment of coastal water quality of Oman. J. Environ. Eng. Sci. 2020, 15, 141–153. [Google Scholar]
  3. Reynolds, R.M. Physical Oceanography of the Gulf, Strait of Hormuz, and the Gulf of Oman-Results from the Mt Mitchell Expedition. Mar. Pollut. Bull. 1993, 27, 35–59. [Google Scholar]
  4. Akbari, P.; Sadrinasab, M.; Chegini, V.; Siadatmousavi, M. Tidal Constituents in the Persian Gulf, Gulf of Oman and Arabian Sea: A Numerical Study. Indian J. Geo-Mar. Sci. 2016, 45, 1010–1016. [Google Scholar]
  5. Ketabdari, M.J.; Ilia, A.; Karimi, M. A Model Study of Wind-Induced Sea Level Fluctuations in the Persian Gulf and the Gulf of Oman. In Proceedings of the International Conference on Numerical Analysis and Applied Mathematics (ICNAAM 2014), Rodhes, Greece, 22–28 September 2014; American Institute of Physics, Ed.; American Institute of Physics (AIP): College Park, MD, USA, 2014; Volume 1648, p. 770010. [Google Scholar]
  6. U.S. Energy Information Administration. Available online: https://www.eia.gov/todayinenergy/detail.php?id=4430 (accessed on 20 July 2023).
  7. Kwarteng, A.Y.; Al-Hatrushi, S.M.; Illenberger, W.K.; McLachlan, A.; Sana, A.; Al-Buloushi, A.S.; Hamed, K.H. Beach erosion along Al Batinah coast, Sultanate of Oman. Arab. J. Geosci. 2016, 9, 85. [Google Scholar]
  8. Sana, A.; Baawain, M. Assessment of seawater quality along northern coast of Oman. In Proceedings of the 6th International Conference on Asian and Pacific and Coasts (APAC 2011), Hong Kong, 14–16 December 2011; pp. 2002–2009. [Google Scholar]
  9. Pous, S.P.; Carton, X.; Lazure, P. Hydrology and circulation in the Strait of Hormuz and the Gulf of Oman—Results from the GOGP99 Experiment: 1. Strait of Hormuz. J. Geophys. Res. 2004, 109, C12037. [Google Scholar] [CrossRef]
  10. Pous, S.P.; Carton, X.; Lazure, P. Hydrology and circulation in the Strait of Hormuz and the Gulf of Oman—Results from the GOGP99 Experiment: 2. Gulf of Oman. J. Geophys. Res. 2004, 109, C12038. [Google Scholar]
  11. Bruss, G.; Kwarteng, A.; Baawain, M.; Sana, A.; Chitrakar, P.; Al-Abdali, F.; Al-Habsi, H. Coastal Currents on the Northern Omani Shelf. In Proceedings of the 13th International Conference on Coasts, Ports and Marine Structures (ICOPMAS 2018), Tehran, Iran, 26–28 November 2018. [Google Scholar]
  12. Lee, W.; Kaihatu, J.M. Effects of Desalination on Hydrodynamic Process in Persian Gulf. Coast. Eng. Proc. 2018, 1, 3. [Google Scholar]
  13. Elhakeem, A.; Elshorbagy, W. Hydrodynamic evaluation of long term impacts of climate change and coastal effluents in the Arabian Gulf. Mar. Pollut. Bull. 2015, 101, 667–685. [Google Scholar]
  14. Chitrakar, P.; Baawain, M.S.; Sana, A.; Al-Mamun, A. Hydrodynamic measurements and modeling in the coastal regions of Northern Oman. J. Ocean Eng. Mar. Energy 2020, 6, 99–119. [Google Scholar]
  15. Rakha, K.; Al-Salem, K.; Neelamani, S. Hydrodynamic Atlas for the Arabian Gulf. J. Coast. Res. 2007, Special Issue 50, 550–554. [Google Scholar]
  16. Kämpf, J.; Sadrinasab, M. The circulation of the Persian Gulf: A numerical study. Ocean Sci. 2006, 2, 27–41. [Google Scholar] [CrossRef]
  17. Singer, M.N.; Cavalcante, G.H.; Atabay, S. Hydrodynamic modeling of Sharjah lagoons under climate changes, United Arab Emirates (UAE). Reg. Stud. Mar. Sci. 2023, 63, 102995. [Google Scholar]
  18. Azam, M.H.; Elshorbagy, W.; Ichikawa, T.; Terasawa, T.; Taguchi, K. 3D Model Application to Study Residual Flow in the Arabian Gulf. J. Waterw. Port, Coastal, Ocean Eng. 2006, 132, 388–400. [Google Scholar]
  19. Azam, M.H.; Elshorbagy, W.; Nakata, K. Three-Dimensional Modeling of the Ruwais Coastal Area of United Arab Emirates. J. Waterw. Port, Coastal, Ocean Eng. 2006, 132, 487–495. [Google Scholar] [CrossRef]
  20. Elshorbagy, W.; Azam, M.H.; Taguchi, K. Hydrodynamic Characterization and Modeling of the Arabian Gulf. J. Waterw. Port, Coastal, Ocean Eng. 2006, 132, 47–56. [Google Scholar]
  21. Elhakeem, A.; Elshorbagy, W.; Bleninger, T. Long-term hydrodynamic modeling of the Arabian Gulf. Mar. Pollut. Bull. 2015, 94, 19–36. [Google Scholar] [CrossRef]
  22. Abdulla, K.H.; Naser, H.A. Protection of marine environmental quality in the Kingdom of Bahrain. Ocean Coast. Manag. 2021, 203, 105520. [Google Scholar] [CrossRef]
  23. Madah, F.; Gharbi, S.H. Numerical simulation of tidal hydrodynamics in the Arabian Gulf. Oceanologia 2022, 64, 327–345. [Google Scholar] [CrossRef]
  24. Ramesh, M.; Krishna, P.S.; Raj, V.A.; Nair, L.S. Coupled coastal monitoring framework for the analysis of beach stability and nearshore hydrodynamics of a structure influenced medium energy coast in India. Ocean Coast. Manag. 2023, 239, 106619. [Google Scholar] [CrossRef]
  25. Rhomad, H.; Khalil, K.; Neves, R.; Sobrinho, J.; Dias, J.M.; Elkalay, K. Three-dimensional hydrodynamic modelling of the Moroccan Atlantic coast: A case study of Agadir bay. J. Sea Res. 2022, 188, 102272. [Google Scholar]
  26. Afzal, M.S.; Kumar, L. Propagation of waves over a rugged topography. J. Ocean Eng. Sci. 2022, 7, 14–28. [Google Scholar] [CrossRef]
  27. Sorensen, R.M. Basic Coastal Engineering, 3rd ed.; Springer: New York, NY, USA, 2006. [Google Scholar]
  28. Taebi, S.; Golshani, A. Long term Characteristics of Waves in the Caspian Sea, Persian Gulf and Gulf of Oman. In Proceedings of the 7th International Conference on Coastal and Port Engineering in Developing Countries (PIANC-COPEDEC VII), Dubai, United Arab Emirates, 24–28 February 2008. [Google Scholar]
Figure 1. ADCP deployment at the sea bottom. The ADCP is fixed to a stainless-steel frame in the center facing upwards and the battery (black cylindrical object) is connected to one of the legs of the frame.
Jmse 11 01711 g001
Figure 2. Measurement locations along the Omani coast.
Jmse 11 01711 g002
Figure 3. Significant Wave Height Distribution over various measurement locations.
Jmse 11 01711 g003
Figure 4. Distribution of peak wave period at the monitored stations.
Jmse 11 01711 g004
Figure 5. Wave Direction Distribution at the monitored stations.
Jmse 11 01711 g005
Figure 6. Relationships between maximum wave height Hmax and significant wave height Hs, (a) Muscat coast, (b) northern Oman (Al-Batinah) coast, (c) southern Oman coast.
Jmse 11 01711 g006
Figure 7. Measurements at Duqm, (S7), (a) water surface elevation, (b) wind, (c) current.
Jmse 11 01711 g007
Figure 8. Measurements at Sohar (S10), (a) water surface elevation, (b) wind, (c) current.
Jmse 11 01711 g008
Figure 9. Current magnitude and direction at Mina Al-Fahal measurement station.
Jmse 11 01711 g009
Table 1. Coordinates and duration of deployment for the measurement locations.
Station IDStation LocationLatitude
(°N)
Longitude (°E)Depth 1 (m)Duration 2
(Days)
S1Mina Al Fahal23°39.562′58°29.950′20.6265
S2Al Ghubrah23°37.277′58°24.405′14.371
S3Barka23°46.200′58°5.172′22.5189
S4Quriyat23°17.742′58°55.560′16.464
S5Taqah17°0.943′54°20.669′18.660
S6Shuwaymiyah17°51.410′55°33.071′17.961
S7Duqm19°46.319′57°48.313′15.661
S8Masirah20°9.581′58°40.734′19.361
S9Shinas24°39.746′56°32.032′16.0156
S10Sohar24°19.774′56°48.772′14.2154
S11Khaburah24°0.257′57°7.205′15.1135
1 Depth of water at the location of ADCP deployment. 2 Duration of deployment.
Table 2. Estimates of wave heights for various return periods at measurement stations.
Station IDStation LocationReturn Period (Year)
5102050100
S1Mina Al Fahal0.660.881.11.382.56
S2Al Ghubrah0.420.570.690.92.57
S3Barka0.570.81.011.283.13
S4Quriyat0.580.790.981.241.89
S5Taqah0.771.031.531.81.95
S6Shuwaymiyah1.061.461.852.222.97
S7Duqm0.851.21.551.631.67
S8Masirah0.791.081.611.921.99
S9Shinas0.790.991.081.422.03
S10Sohar0.871.041.201.513.31
S11Khaburah0.680.851.021.191.88
All stations0.710.921.151.323.31
Disclaimer/Publisher’s Note: The statements, opinions and data contained in all publications are solely those of the individual author(s) and contributor(s) and not of MDPI and/or the editor(s). MDPI and/or the editor(s) disclaim responsibility for any injury to people or property resulting from any ideas, methods, instructions or products referred to in the content.

