Abstract
Automatic identification systems (AIS) can record a large amount of navigation information about ships, including abnormal or illegal ship movement information, which plays an important role in ship supervision. To distinguish the trajectories of ships and analyze the behavior of ships, this paper adopts the method of supervised learning to classify the trajectories of ships. First, the AIS data for the ships were marked and divided into five types of ship tracks. The Tsfresh module was then used to extract various ship trajectory features, and a new ensemble classifier based on traditional classification using a machine learning algorithm was proposed for modeling and learning. Moreover, ten-fold cross validation was used to compare the ship trajectory classification results. The classification performance of the ensemble classifier was better than that of the other single classifiers. The average F1 score was 0.817. The results show that the newly proposed method and the new ensemble classifier have good classification effects on ship trajectories.
1. Introduction
Maritime transport is one of the major modes of transport worldwide today, with 70% of global cargo being transported by sea [1]. The International Maritime Organization (IMO) designed the Automatic Identification System (AIS) in the 1990s [2], and all ships with a gross tonality of more than 300 tons worldwide are required to install an AIS onboard [3]. The AIS is a ship tracking system that transmits signals to satellites, shore-based stations, and surrounding ships at regular intervals, containing a large amount of ship information.
With the growth in AIS data volume, there are more and more ships at sea, and surveillance at sea is becoming more and more important. Currently, an increasing number of studies have been conducted to analyze ship trajectories and marine traffic based on AIS data [4,5,6,7,8,9]. Among them, track classification is an important research field. The track classification of fishing vessels can strengthen the supervision of fishing behavior, and the track classification of merchant ships can further analyze and identify the behavior of ships and strengthen shipping monitoring. Considerable research has been conducted on trajectory classification. Based on the AIS data of fishing boats, Souza [10] proposed three classifiers to classify and detect trawl, longline, and purse seine activities, with detection accuracies of 83%, 84%, and 97%, respectively. Saini [11] combined hidden Markov and genetic algorithms to classify ship trajectories, tested them on two datasets, and obtained good results. Guo and Xie [12] converted a ship trajectory into an image, classified and labeled it, and used a neural network to identify the channel to which the ship trajectory belonged. The results showed that the ship trajectory classification model based on a deep convolutional neural network could effectively distinguish ship trajectories in different channels. Kontopoulos [13] converted different ship behavior trajectories into images and classified labels and used deep learning algorithms to accurately classify ship activities in near real-time. The results show that the accuracy of the ship activity classification performance can exceed 96%. Based on a deep recurrent neural network, Jiang [14] adopted a new partition-gated recurrent unit architecture to detect the trajectory classification of trawler fishing activities. Kapadais [15] considered the ship trajectory classification problem as a time-series classification or shapelet classification task, extracted the information shape from the training data, transformed it into a feature space of a small shape, and combined it with a genetic algorithm to classify the ship trajectory. Chuaysi and Kiattisin [16] proposed a method based on local features of a time series and converted the trajectory pattern into global features of deep learning to detect fishing, non-fishing, and transshipping behaviors with an average accuracy of 97.50%. This approach can identify illegal fishing and enable maritime monitoring, as well as maritime and marine resource protection. Kontopoulos [17] proposed a method for classifying ship activities from real-time data streams, dividing ship tracks into multiple overlapping parts and distinguishing the segments in which a ship is engaged in trawling or longline fishing from other segments in progress after the ship leaves its destination. The evaluation of the real data demonstrates that high-precision results can be achieved. Zhang [18] proposed four typical wandering trajectory shapes and classified them based on a convolutional neural network, achieving an average accuracy of 96.5%. At present, most studies focus on the trajectory of fishing boats, whereas few studies mention large ships such as merchant and cargo ships. In addition, trajectory classification studies mostly convert trajectories into images for classification, and then run machine learning for modeling to judge new trajectories. However, this method does not consider the change characteristics of AIS data series, resulting in inadequate utilization and analysis of AIS data. At the same time, machine learning has achieved good results in this field of research, can be based on a large number of historical data modeling, and then make judgments on new data. Compared to some methods that utilize trajectories identified by specific algorithms, machine learning methods model based on large amounts of historical data, increasing the robustness of the model.
Currently, the increase in maritime cargo throughput poses a challenge to the supervision of maritime transportation. Although the initial function of the AIS was to ensure the safety of maritime navigation and avoid maritime traffic accidents [19], it is possible to distinguish different ship trajectories and detect suspicious ship behaviors by analyzing the sequence data of ship AIS systems [20,21]. AIS data are a type of time-series data of ship navigation, and existing trajectory classification methods cannot classify the trajectory according to the features of the AIS sequence data. Therefore, this study proposes a ship trajectory classification method based on AIS data features. In this study, we defined several types of ship trajectories, labeled and classified ship AIS data of different types of trajectories, extracted features from the AIS time-series data of various trajectories, and used a machine learning classification algorithm for modeling to classify the AIS trajectory data of ships.
2. Methods
The purpose of this study was to propose a method for ship trajectory classification based on AIS sequence data for ships. First, abnormal data points were eliminated, and the AIS track data were processed, including the elimination of repeated points and track segmentation. The ship’s trajectory was then classified and labeled. Second, the features of the time-series data were extracted, and a feature matrix was generated. Finally, a machine learning classification algorithm was applied to classify the ship trajectory according to the AIS data features. Figure 1 illustrates the research framework.
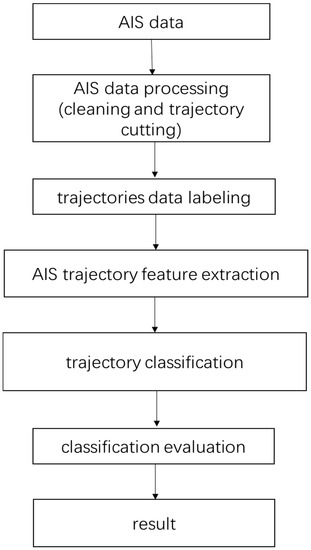
Figure 1.
Research framework.
2.1. AIS Data Preprocessing
The AIS data contain a large amount of ship navigation information [2]; the specific information is presented in Table 1. The AIS data should be preprocessed before classifying and labeling the ship trajectories. First, abnormal points, such as velocity value anomaly points and latitude and longitude anomaly jump points, were removed. Second, redundant data points that were repeatedly reported were excluded. The most important parameter is the Maritime Mobile Service Identification (MMSI) number, which is unique to each vessel and serves as the primary identifier for vessels in the AIS [22]. The AIS data of a ship are expressed according to Equation (1):
where k is the length of the AIS data and i represents the ith sequence data.

Table 1.
AIS data information.
The AIS data of the same MMSI for a long time are segmented according to the destination port information such that the AIS data of an MMSI are divided into multiple segments, and each segment of the trajectory represents the ship sailing from one port point to another. After segmentation, it can be expressed by Equations (2) and (3).
represents the AIS data of the ship going to one destination port, and represents the AIS data of the ship going to the other destination port, both of which are AIS data from the same MMSI.
After separating the AIS data of the different segments, the trajectory was segmented according to the ship’s mooring and non-mooring states. This can be expressed by Equations (4)–(7).
represents the AIS data of the non-anchored (sailing) segment to a destination port and represents the AIS data of the mooring segment to a destination port. represents the AIS data of the non-anchored (sailing) segment to the other destination port and represents the AIS data of the mooring segment to the other destination port.
2.2. Ship Trajectory Class Definition
Shipping is the main task of a ship, and the AIS records the trajectory and state of a ship’s navigation. According to the ship behavior, five ship trajectories were defined in the AIS data. The five types of ship trajectories include the trajectory in which ships may appear: normal sailing trajectory, anchoring or mooring trajectory, sailing trajectory with deviation, trajectory with signal loss, and irregular trajectory, as shown in Figure 2, Figure 3, Figure 4, Figure 5 and Figure 6, The red dots represent the locations where ships transmit AIS signals, and the blue lines are trajectories generated in series.
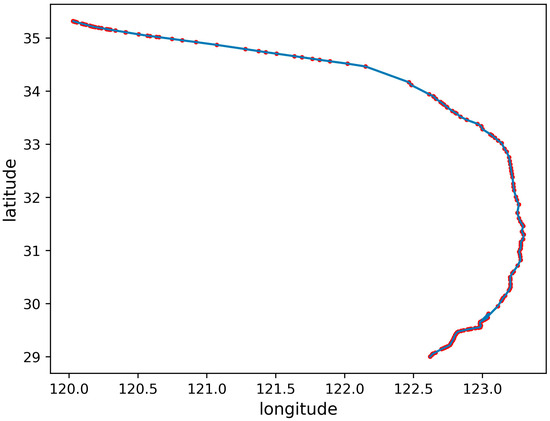
Figure 2.
Normal navigation trajectory.
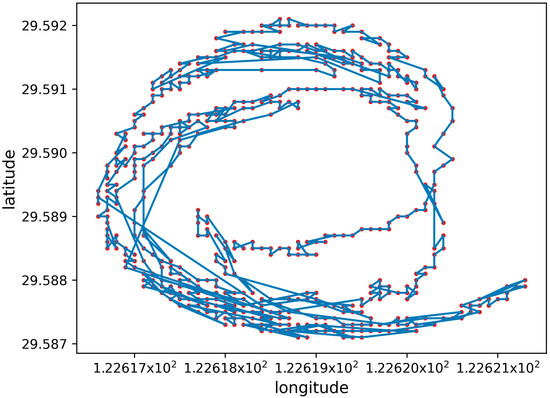
Figure 3.
Anchoring or mooring trajectory.
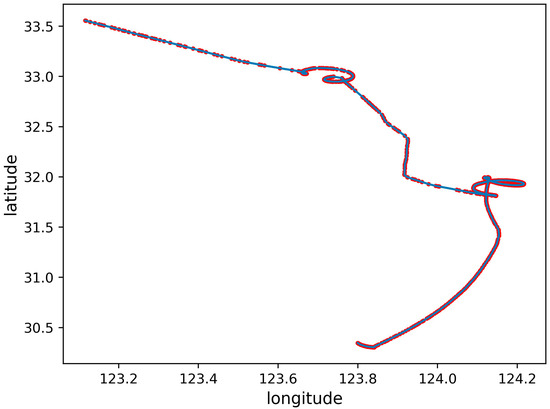
Figure 4.
Navigation trajectory with deviation.
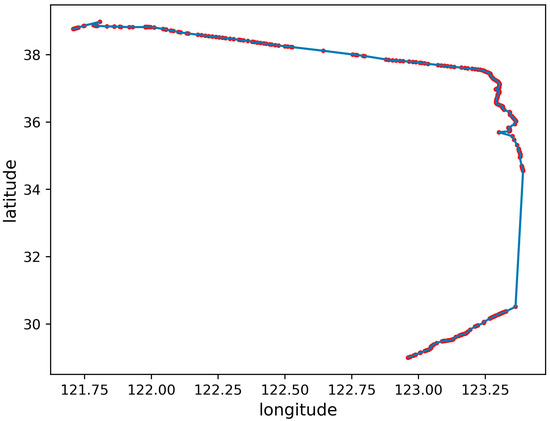
Figure 5.
Trajectory of the missing AIS signal.
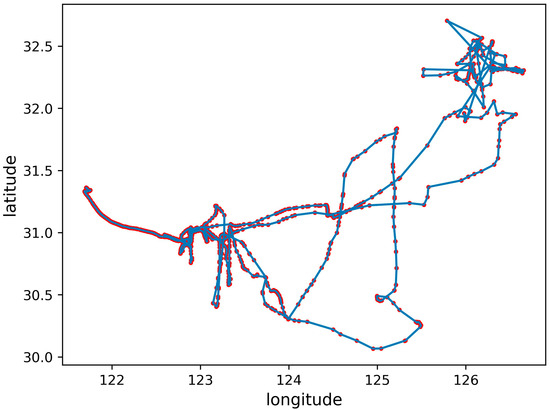
Figure 6.
Irregular trajectory.
Normal navigation trajectory: The ship travels from the departure point to the destination port, and there is no other redundant trajectory during the voyage, deviation of the course for other reasons, or loss of the AIS signal. Except in complex terrain, the trajectory of a ship during normal navigation is generally almost straight or an arc with a small curvature, as shown in Figure 2.
Anchoring or mooring trajectory: The mooring of a ship is a basic behavior. Mooring is used to stabilize a ship within a certain range and avoid collisions with other ships. Mooring may be at rest or accidentally. When anchored, ships can load, unload, and refuel [23]. During anchoring, ships can be affected by factors such as the current flow field and wind field (direction and strength) in the sea area. The ship moves around the anchor points and forms circular or semicircular trajectories in different directions, with the anchor points located approximately at the center of the circle. Ship mooring is generally performed in ports, where mooring refers to the connection of ships with ropes, or ropes to any structure used to secure the ship. Compared to anchoring, mooring did not change the position of the ship significantly, and the speed was almost stationary, as shown in Figure 3.
Navigation trajectory with deviation: Unlike normal navigation trajectories, in [24], several abnormal behaviors of ships, deviations from standard routes, and unexpected activities midway were defined, which are reflected in the AIS data. The overall trajectory still appears to be from the starting point to the destination point; however, there is an offset in the middle trajectory, which may delay the arrival of the ship at the destination port, as shown in Figure 4.
Trajectory of missing AIS signal: The AIS, a mandatory installation system for ships, must be turned on during navigation. Initially, it was used to avoid ship collisions, but now, it is used more for maritime surveillance [25]. The loss of AIS signals includes two situations [26]. The first is due to non-human factors, and the transmission of AIS signals is lost owing to the instability of the signal. Another type of behavior in sea areas with sufficient signal reception may be due to the artificial closure of AIS signals [27], which may be accompanied by illegal activities, such as ship smuggling, ship pollution discharge, and entry into marine protected areas or other prohibited areas, as shown in Figure 5.
Irregular trajectory: If the ship’s trajectory appears disordered, it may be due to the ship operating in the current sea area, supplying ships to the current sea area, navigating between different ships, or the complex terrain of the current sea area, leading to complex navigation routes, as shown in Figure 6.
2.3. Ship Trajectory Feature Extraction
Ship AIS data contain a large amount of information. The AIS dynamic information is mainly used for the above types of trajectories: longitude, latitude, ship sailing speed to the ground, and ship course to the ground. Tsfresh is a Python package for time-series data processing [28] that can automatically calculate a large number of time-series features using a variety of feature extraction methods. The Python Tsfresh package provides an automatic feature extraction and selection algorithm for a time series by building on the FRESH algorithm [29]. Because the AIS data are also time-series data, Tsfresh was used to extract features from the time series.
2.4. Ship Trajectory Classification
Decision Trees [30], Random Forests [31,32], Naive Bayes [33], and LightGBM [34] are commonly used machine-learning classification algorithms. A decision tree is a tree-like prediction model where each internal node represents a “test” of an attribute, each branch represents the result of a test, and each leaf node represents a class label [35]. Random forest classification uses multiple trees to train and predict samples. Each tree in the forest provides a classification, and the forest selects the category with the most votes for the output. This method is widely used for classification tasks. The Bayesian classification method is a statistical classification method that can be used to predict the probability of membership and the probability of a given classification. The naive Bayes algorithm satisfies the conditional independence hypothesis; that is, each attribute of a given classification has an independent influence on its target variable. LightGBM is a gradient-boosted decision tree algorithm that is an improvement on the GBDT algorithm. It uses gradient-based one-sided sampling (GOSS), exclusive feature binding (EFB), which is an algorithm-based histogram to find the best-split point and supports efficient parallel training. It has the characteristics of a faster training speed, lower memory consumption, and higher accuracy, making it suitable for classification tasks.
Generally, the performance of a single classification model is limited. Ensemble learning [36,37,38] is a machine learning method that uses a combination of multiple classifiers to form a new classifier to improve classification performance. In this study, an ensemble classifier is proposed that combines Naive Bayes and Random Forest to form a new classification model, as shown in Figure 7. First, the Naive Bayes classifier learns the data and combines the learning results of the Naive Bayes classifier with the features of the original data into new features; then, it uses the Random Forest classifier to learn and generate the classification model.

Figure 7.
Ensemble classifier model.
3. Experiment
3.1. Dataset
AIS datasets usually contain the following information [2]: Maritime Mobile Service Identifier (MMSI), ship status, latitude, longitude, ship sailing speed to the ground (SOG), ship course to ground (COG), ship type, time (transmission time of AIS signal), and destination port. Among them, the MMSI is used as a unique identifier of ships in the AIS [22].
The data used in this experiment were obtained from the Boiling Global Trade (http://www.gogotrade.info, accessed on 1 July 2022). From 1 March 2021 to 31 May 2021, the AIS trajectory data of 1000 large ships (container ships, timber ships, asphalt ships, oil tankers, and other large ships) in the Yellow Sea, Bohai Sea, and South China Sea were collected.
After the AIS data of each MMSI were preprocessed, track data with fewer than 100 data points were deleted. The AIS data of the ships were divided into five categories: 0, normal navigation trajectory; 1, navigation trajectory with deviation; 2, anchoring and mooring trajectory; 3, trajectory with AIS signal loss; and 4, irregular trajectory. There was a total of 100 trajectories of categories 0, 2, and 3, respectively, and there were only 78 and 51 trajectories of categories 1 and 4, respectively, because the trajectories of categories 1 and 4 were not common, so there were 429 trajectories in total, as shown in Figure 8.
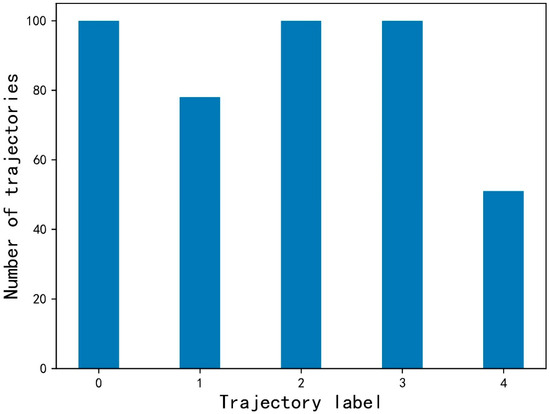
Figure 8.
Dataset.
3.2. Feature Extraction
The ship’s sailing speed to the ground (SOG), longitude (LON), latitude (LAT), and ship’s course to ground (COG) of the AIS data were selected for the first-order difference, as shown in Equation (8):
(i = 1, 2, 3, … L-1), i represents the ith sequence data and L represents the length of the sequence.
Subsequently, the feature-extraction submodule of the Tsfresh package was used for feature extraction [28], and 40 features were extracted. The results are summarized in Table 2.

Table 2.
Feature extraction results.
Names of the feature extraction results: ‘sog_sum_values’, ‘sog_median’, ‘sog_mean’, ‘sog_length’, ‘sog_standard_deviation’, ‘sog_variance’, ‘sog_root_mean_square’, ‘sog_maximum’, ‘sog_absolute_maximum’, ‘sog_minimum’, ‘lon_sum_values’, ‘lon_median’, ‘lon_mean’,’lon_length’, ‘lon_standard_deviation’, ‘lon_variance’,’lon_root_mean_square’, ‘lon_maximum’, ‘lon_absolute_maximum’, ‘lon_minimum’, ‘lat_sum_values’, ‘lat_median’, ‘lat_mean’, ‘lat_length’, ‘lat_standard_deviation’, ‘lat_variance’, ‘lat_root_mean_square’, ‘lat_maximum’, ‘lat_absolute_maximum’, ‘lat_minimum’, ‘cog_sum_values’, ‘cog_median’,’ cog_mean’, ‘cog_length’, ‘cog_standard_deviation’, ‘cog_variance’, ‘cog_root_mean_square’, ‘cog_maximum’, ‘cog_absolute_maximum’, and ‘cog_minimum’.
To ensure that the extracted features are useful, a hypothesis test is performed on each feature. Null hypothesis: labels and features are independent/features do not affect labels. Alternative Hypothesis: label and feature association/dependency significance level: α = 0.05.
Kendall’s tau [39] was used to calculate the significance of each feature column to the label column as a p-value. If p ≤α, the null hypothesis is rejected and the alternative hypothesis is accepted. Otherwise, the null hypothesis was accepted. A hypothesis test was used to determine whether the features were relevant to the current label. The select_features submodule of Tsfresh package was used to retain the relevant features, and 34 of them were retained, and the results are shown in Table 3.

Table 3.
Feature selection result.
Names of the feature selection results: ‘cog_variance’, ‘cog_standard_deviation’, ‘cog_minimum’, ‘cog_root_mean_square’, ‘cog_absolute_maximum’, ‘cog_maximum’, ‘lon_root_mean_square’, ‘lat_root_mean_square’, ‘lon_standard_deviation’, ‘lon_variance’, ‘lat_variance’, ‘lat_standard_deviation’, ‘lat_minimum’, ‘lon_minimum’, ‘sog_length’, ‘cog_length’, ‘lat_length’, ’lon_length’, ‘lon_absolute_maximum’, ‘lat_absolute_maximum’, ‘lat_median’, ‘lat_mean’,’lat_sum_values’, ‘cog_median’, ‘sog_root_mean_square’, ‘sog_variance’, ‘sog_standard_deviation’, ‘sog_mean’, ‘lon_maximum’, ‘sog_sum_values’, ‘sog_absolute_maximum’, ‘sog_maximum’, ‘lat_maximum’, and ‘sog_minimum’.
3.3. Classification Evaluation
Accuracy, precision, recall, and F1 scores are commonly used, where TP, TN, FP, and FN refer to the numbers of true-positive, true-negative, false-positive, and false-negative samples for each class, respectively. Accuracy refers to the number of correct judgments; TP represents the judgment that positive samples are positive; and TN represents the judgment that negative samples are negative. There are (TP + FN + FP + TN) samples in total; therefore, the accuracy can be expressed by Equation (9):
Precision is defined as the number of correct positive predictions. The predicted positive samples include two parts: one is to predict positive samples, and the other is to predict positive-negative samples. The precision can be expressed in Equation (10):
The recall represents the number of positive samples in the sample that were correctly predicted. Assuming that there are (TP + FN) positive samples in total and that TP TP-positive samples are correctly predicted, recall can be expressed as Equation (11):
The F1-score consists of the harmonic mean of precision and recall, where precision is the average precision per class and recall is the average recall per class. The F1 score is expressed as Equation (12):
For multiclass classification, the macro average F1-score can be expressed as Equation (13):
Cross validation [40] is a method used to evaluate a model’s performance. A common method is k-fold cross validation, in which the sample is split into k subsamples; a single subsample is retained as data for the validation model, and the remaining k-1 samples are used for training. Cross validation is repeated k times, once for each subsample, and the results are averaged k times. A 10-fold cross validation is commonly used.
4. Results and Validation
4.1. Classification Results of Ship Trajectories
Decision Trees, Random Forests, Naive Bayes, LightGBM, and Ensemble Classifier were used to classify and learn the trajectory feature selection results, with 80% of the data used for training and 20% for validation. The Naive Bayes classifier parameter, var_smoothing, defaults to 1 × 10⁻⁹, and prior represents the prior probability, which is not specified. Decision Tree classifier parameter, criterion: feature selection method, set to gini. Splitter: indicates the method for selecting feature partition points. The default value is best. All other parameters are default. LightGBM classifier parameters, max_depth = 10, learning_rate = 0.1, n_estimators = 200, and the rest are default parameters. Random Forest classifier parameter, n_estimators = 300, and other parameters are default. The Ensemble Classifier inputs the Bayesian output class probability into the Random Forest classifier as a new feature along with the original feature.
Figure 9 shows the confusion matrices of validation set with the best results among the five classifiers, among which the Ensemble Classifier has the best effect. Trajectory class 1 and trajectory class 0 are easily misjudged in the classification because trajectory class 1 (deviated navigation trajectory) and trajectory class 0 (normal navigation trajectory) are generally similar, whereas trajectory class 1 is locally different; therefore, the classification is easily confused. The accuracy of several classifiers is very high, and it is relatively easy to distinguish trajectory class 2 (anchor or mooring trajectory) and trajectory class 3 (trajectory with signal loss). The classification accuracy of trajectory class 1 (trajectory with deviation) and trajectory class 4 (irregular trajectory) is slightly lower.


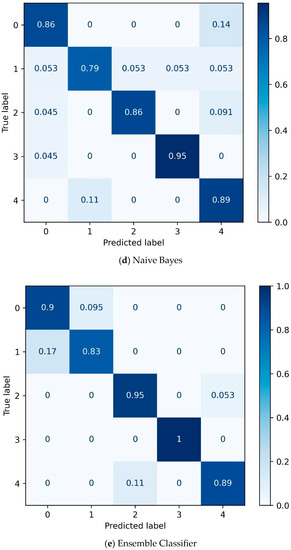
Figure 9.
Confusion matrix of validation set of different classifiers. (a) LightGBM; (b) Random Forests; (c) Decision Trees; (d) Naive Bayes; (e) Ensemble Classifier.
Table 4 lists the best classification results of the different machine learning classifiers for the trajectories. There was little difference in the overall classification accuracy, and the F1 scores of the different categories were relatively high, with the lowest being 0.71. For the classification of trajectory class 2 (anchor or mooring trajectory) and class 3 (trajectory with AIS signal loss), the F1-score was above 0.9. As shown in Table 4, the effect of a single classifier was not as good as that of the ensemble classifier, and the best classification accuracy of the ensemble classifier was 0.93, which was higher than that of the other classifiers. Simultaneously, considering that the amount of data was not sufficiently large, cross validation was used to compare the classification performance of different classifiers. Figure 10 shows the results of the 10-fold cross validation, and the macro average of the F1-score was used as the evaluation index for cross validation. From the cross-validation result plot, it can be seen that the results of LightGBM and Random Forest are significantly better than those of the Decision Trees and Naive Bayes. The results for LightGBM and Random Forest were similar, but the ensemble classifier performed the best. Table 5 presents the results of the 10-fold cross validation. The macro average F1-score of the ensemble classifier reached 0.817, indicating a good classification performance.

Table 4.
Classification results of different classifiers.
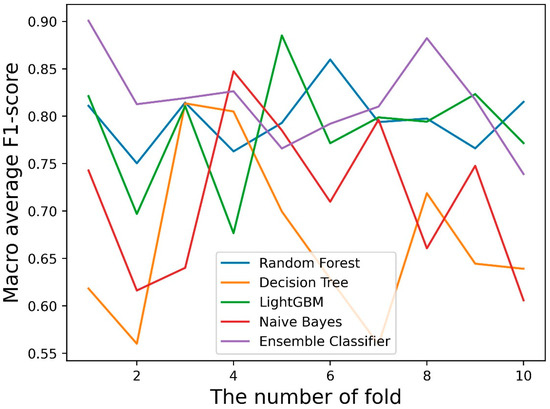
Figure 10.
10-fold cross validation graph for different classifiers.

Table 5.
Results of 10-fold cross validation.
4.2. Case Validation
Figure 11 shows the trajectory of two ships, the red dots represent the locations where ships transmit AIS signals, and the blue lines are trajectories generated in series.Figure 11a shows the trajectory of a merchant ship from South Korea to Zhejiang (MMSI number: 312917000), reported in the middle of December 2018, and there is a long area in the trajectory without an AIS signal, but in this sea area, the sending and receiving of AIS signals were normal. The data features were extracted, and the trajectory classification model generated by the ensemble classifier was used for discrimination. The classification result is trajectory class 3 (trajectory with AIS signal loss). It is reported that the merchant ship is a smuggling merchant ship. Figure 11b shows the trajectory of a ship in the South China Sea (MMSI number: 303859000) reported in late October 2021. The trajectory appeared irregular, and the result identified by the trajectory classification model generated by the ensemble classifier was classified as class 4 (irregular trajectory). The ship was reported to be a foreign vessel that conducted surveys in the South China Sea.
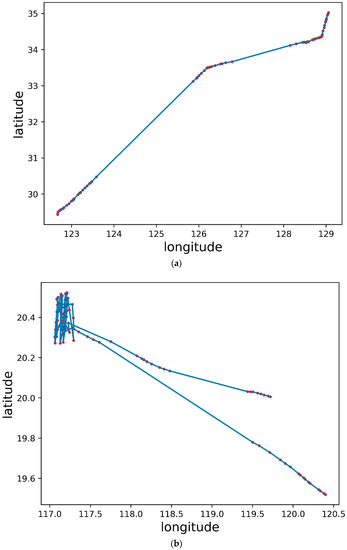
Figure 11.
Two actual cases of ship trajectory. (a) A smuggling case trajectory; (b) A sea operation case trajectory.
5. Conclusions and Future Work
The AIS records a large amount of information regarding ship navigation. Ship behavior can be further analyzed using the AIS data. In this study, we proposed a new trajectory classification method based on AIS information. First, five large ship trajectories were defined and the Tsfresh algorithm was used to extract features from the AIS data. Based on the hypothesis test, features were selected to generate the feature matrix of the AIS trajectory information and a machine learning classifier was used for classification. A new ensemble classifier was proposed that was better than the traditional single classifier.
The results of the Decision Trees, Random Forests, Naive Bayes, LightGBM, and the proposed Ensemble Classifier were compared. The macro average of the F1-score of the 10-fold cross validation of the ensemble classifier is 0.817, which has a good classification effect and is higher than that of the other four machine learning classifiers. This indicates that the feature extraction and trajectory classification of the AIS data are reasonable. To prove the applicability of our method in practice, we used the AIS data of two real cases for classification, and found that the classification results were correct, and the behaviors behind the trajectories were consistent with the guesses of this paper for such trajectories.
The advantage of the ship trajectory classification method proposed in this paper is that, compared with the method of converting the trajectory into an image and then classifying it, it pays attention to the change characteristics between the points in the time series, and can identify the trajectory of AIS signal shutdown or loss and irregular trajectory. Moreover, the changes of ship motion state and spatial information reflected by the changes in AIS data cannot be reflected by images. In addition, five types of ship trajectories are defined, which basically include the possible behavioral purposes and results of ship trajectories. Compared with other papers, the classification of specific trajectories is more systematic, and the abnormal trajectories can be preliminarily judged to enhance the surveillance of ships at sea. In addition, a new ensemble classifier is proposed, which outperforms the single classifier and improves the accuracy of trajectory classification. Although the effect of ensemble classifier is better than that of a single classifier, the output of multiple classifiers is lack of interpretability.
However, there are limitations to further determine the behavior behind the trajectory. Due to the limited information used in AIS data and the lack of label data of the behavior behind the trajectory, it is difficult to judge the behavior behind the ship trajectory reflected by AIS data. In addition, for a large number of ship AIS data, there are still too few abnormal tracks (such as track category 1 and track category 4 in this paper). In terms of track classification, there is an imbalance in the number of tracks of different categories, and the results may have certain limitations, requiring more data for verification.
In future work, on the one hand, we plan to collect more AIS data, expand the track classification data set, and further improve the accuracy of ship track classification; on the other hand, combined with relevant example data, further determine the behavior behind the track, so as to better analyze the behavior of ships at sea and strengthen maritime supervision.
Author Contributions
Conceptualization, D.L.; methodology, D.L.; validation, X.L.; resources, Y.Z.; writing—original draft preparation, D.L.; writing—review and editing, P.C. and J.Y.; funding acquisition, P.C. and J.Y. All authors have read and agreed to the published version of the manuscript.
Funding
This research was funded by National Key R&D Program of China (2022YFB3902400), Ministry of Science and Technology of the People’s Republic of China, China High Resolution Earth Observation System Program under Grant 41-Y30F07-9001-20/22, Ministry of Industry and Information Technology of People’s Republic of China.
Institutional Review Board Statement
Not applicable.
Informed Consent Statement
Not applicable.
Data Availability Statement
Not applicable.
Conflicts of Interest
The authors declare no conflict of interest.
References
- International Transport Forum. ITF Transport Outlook 2021; OECD Publishing: Paris, France, 2021. [Google Scholar] [CrossRef]
- IMO. Resolution MSC.74(69) Adoption of New and Amended Performance Standards; International Maritime Organisation: London, UK, 1998. [Google Scholar]
- IMO. Resolution A.1106(29) Revised Guidelines for the Onboard Operational Use of Shipborne Automatic Identification Systems(AIS); International Maritime Organisation: London, UK, 2015. [Google Scholar]
- Zhang, L.; Meng, Q.; Fang Fwa, T. Big AIS data based spatial-temporal analyses of ship traffic in Singapore port waters. Transp. Res. E Logist. Transp. Rev. 2019, 129, 287–304. [Google Scholar] [CrossRef]
- Zhen, R.; Jin, Y.; Hu, Q.; Shao, Z.; Nikitakos, N. Maritime Anomaly Detection within Coastal Waters Based on Vessel Trajectory Clustering and Naïve Bayes Classifier. J. Navig. 2017, 70, 648–670. [Google Scholar] [CrossRef]
- Andersson, P.; Ivehammar, P. Dynamic route planning in the Baltic Sea Region—A cost-benefit analysis based on AIS data. Marit. Econ. Logist. 2017, 19, 631–649. [Google Scholar] [CrossRef]
- Li, H.; Jiao, H.; Yang, Z. AIS data-driven ship trajectory prediction modelling and analysis based on machine learning and deep learning methods. Transp. Res. E Logist. Transp. Rev. 2023, 175, 103152. [Google Scholar] [CrossRef]
- Wang, X.; Xiao, Y. A Deep Learning Model for Ship Trajectory Prediction Using Automatic Identification System (AIS) Data. Information 2023, 14, 212. [Google Scholar] [CrossRef]
- Yang, D.; Wu, L.; Wang, S.; Jia, H.; Li, K.X. How big data enriches maritime research—A critical review of Automatic Identification System (AIS) data applications. Transp. Rev. 2019, 39, 755–773. [Google Scholar] [CrossRef]
- Souza, E.; Boerder, K.; Matwin, S.; Worm, B. Improving Fishing Pattern Detection from Satellite AIS Using Data Mining and Machine Learning. PLoS ONE 2016, 11, e0158248. [Google Scholar] [CrossRef]
- Saini, R.; Pratim Roy, P.; Prosad Dogra, D. A segmental HMM based trajectory classification using genetic algorithm. Expert Syst. Appl. 2018, 93, 169–181. [Google Scholar] [CrossRef]
- Guo, T.; Xie, L. Research on Ship Trajectory Classification Based on a Deep Convolutional Neural Network. J. Mar. Sci. Eng. 2022, 10, 568. [Google Scholar] [CrossRef]
- Kontopoulos, I.; Makris, A.; Tserpes, K. A Deep Learning Streaming Methodology for Trajectory Classification. ISPRS Int. J. Geo-Inf. 2021, 10, 250. [Google Scholar] [CrossRef]
- Jiang, X.; Liu, X.; de Souza, E.N.; Hu, B.F.; Silver, D.L.; Matwin, S. Improving Point-based AIS Trajectory Classification with Partition-wise Gated Recurrent Units. In Proceedings of the International Joint Conference on Neural Networks (IJCNN), Anchorage, AK, USA, 14–19 May 2017; pp. 4044–4051. [Google Scholar] [CrossRef]
- Kapadais, K.; Varlamis, I.; Sardianos, C.; Tserpes, K. A Framework for the Detection of Search and Rescue Patterns Using Shapelet Classification. Future Internet 2019, 11, 192. [Google Scholar] [CrossRef]
- Chuaysi, B.; Kiattisin, S. Fishing Vessels Behavior Identification for Combating IUU Fishing: Enable Traceability at Sea. Wirel. Pers. Commun. 2020, 115, 2971–2993. [Google Scholar] [CrossRef]
- Kontopoulos, I.; Chatzikokolakis, K.; Tserpes, K.; Zissis, D. Classification of vessel activity in streaming data. In Proceedings of the DEBS ‘20: The 14th ACM International Conference on Distributed and Event-based Systems, Montreal, QC, Canada, 13–17 July 2020; pp. 153–164. [Google Scholar] [CrossRef]
- Zhang, Z.; Huang, L.; Peng, X.; Wen, Y.; Song, L. Loitering behavior detection and classification of vessel movements based on trajectory shape and Convolutional Neural Networks. Ocean Eng. 2022, 258, 111852. [Google Scholar] [CrossRef]
- Zhang, W.; Feng, X.; Goerlandt, F.; Liu, Q. Towards a Convolutional Neural Network model for classifying regional ship collision risk levels for waterway risk analysis. Reliab. Eng. Syst. Saf. 2020, 204, 107127. [Google Scholar] [CrossRef]
- Sidibé, A.; Shu, G. Study of Automatic Anomalous Behaviour Detection Techniques for Maritime Vessels. J. Navig. 2017, 70, 847–858. [Google Scholar] [CrossRef]
- Rong, H.; Teixeira, A.P.; Guedes Soares, C. Data mining approach to shipping route characterization and anomaly detection based on AIS data. Ocean Eng. 2020, 198, 106936. [Google Scholar] [CrossRef]
- Balduzzi, M.; Pasta, A.; Wilhoit, K. A security evaluation of AIS automated identification system. In Proceedings of the Computer Security Applications Conference, New Orleans, LA, USA, 8–12 December 2014; pp. 436–445. [Google Scholar] [CrossRef]
- Zhang, P.; Zhao, J. The Obligations of an Anchored Vessel to Avoid Collision at Sea. J. Navig. 2013, 66, 473–477. [Google Scholar] [CrossRef][Green Version]
- Lane, R.O.; Nevell, D.A.; Hayward, S.D.; Beaney, T.W. Maritime anomaly detection and threat assessment. In Proceedings of the 13th International Conference on Information Fusion, Chicago, IL, USA, 5–8 July 2011; pp. 1–8. [Google Scholar] [CrossRef]
- Wolsing, K.; Roepert, L.; Bauer, J.; Wehrle, K. Anomaly Detection in Maritime AIS Tracks: A Review of Recent Approaches. J. Mar. Sci. Eng. 2022, 10, 112. [Google Scholar] [CrossRef]
- Ford, J.H.; Peel, D.; Kroodsma, D.; Hardesty, B.D.; Rosebrock, U.; Wilcox, C. Detecting suspicious activities at sea based on anomalies in Automatic Identification Systems transmissions. PLoS ONE 2018, 13, e201640. [Google Scholar] [CrossRef]
- Iphar, C.; Ray, C.; Napoli, A. Uses and Misuses of the Automatic Identification System. In Proceedings of the OCEANS 2019—Marseille, Marseille, France, 17–20 June 2019; pp. 1–10. [Google Scholar] [CrossRef]
- Christ, M.; Braun, N.; Neuffer, J.; Kempa-Liehr, A.W. Time Series Feature Extraction on basis of Scalable Hypothesis tests (tsfresh—A Python package). Neurocomputing 2018, 307, 72–77. [Google Scholar] [CrossRef]
- Christ, M.; Kempa-Liehr, A.W.; Feindt, M. Distributed and parallel time series feature extraction for industrial big data applications. arXiv 2017. [Google Scholar] [CrossRef]
- Quinlan, J.R. Induction of decision trees. Mach. Learn. 1986, 1, 81–106. [Google Scholar] [CrossRef]
- Breiman, L. Random Forests. Mach. Learn. 2001, 45, 5–32. [Google Scholar] [CrossRef]
- Breiman, L. Bagging predictors. Mach. Learn. 1996, 24, 123–140. [Google Scholar] [CrossRef]
- Friedman, N.; Dan, G.; Goldszmidt, M. Bayesian Network Classifiers. Mach. Learn. 1997, 29, 131–163. [Google Scholar] [CrossRef]
- Ke, G.L.; Meng, Q.; Finley, T.; Wang, T.F.; Chen, W.; Ma, W.D.; Ye, Q.W.; Liu, T.Y. LightGBM: A Highly Efficient Gradient Boosting Decision Tree. In Proceedings of the 31st International Conference on Neural Information Processing Systems, Long Beach, CA, USA, 4–9 December 2017. [Google Scholar]
- Loh, W.Y. Classification and regression trees. WIREs Data Min. Knowl. Discov. 2011, 1, 14–23. [Google Scholar] [CrossRef]
- Yang, Y.; Lv, H.; Chen, N. A Survey on ensemble learning under the era of deep learning. Artif. Intell. Rev. 2023, 56, 5545–5589. [Google Scholar] [CrossRef]
- Dietterich, T.G. Ensemble Methods in Machine Learning. In Proceedings of the 1st International Workshop on Multiple Classifier Systems (MCS 2000), Cagliari, Italy, 21–23 June 2000; Springer: Berlin/Heidelberg, Germany, 2000; Volume 1857, pp. 1–15. [Google Scholar] [CrossRef]
- Rokach, L. Ensemble-based classifiers. Artif. Intell. Rev. 2010, 33, 1–39. [Google Scholar] [CrossRef]
- Kendall, M.G. A New Measure of Rank Correlation. Biometrika 1938, 30, 81–93. [Google Scholar] [CrossRef]
- Schaffer, C. Technical Note: Selecting a Classification Method by Cross-Validation. Mach. Learn. 1993, 13, 135–143. [Google Scholar] [CrossRef]
Disclaimer/Publisher’s Note: The statements, opinions and data contained in all publications are solely those of the individual author(s) and contributor(s) and not of MDPI and/or the editor(s). MDPI and/or the editor(s) disclaim responsibility for any injury to people or property resulting from any ideas, methods, instructions or products referred to in the content. |
© 2023 by the authors. Licensee MDPI, Basel, Switzerland. This article is an open access article distributed under the terms and conditions of the Creative Commons Attribution (CC BY) license (https://creativecommons.org/licenses/by/4.0/).