Article

Fit-for-Purpose Information for Offshore Wind Farming Applications—Part-I: Identification of Needs and Solutions

1
Danish Meteorological Institute, Lyngbyvej 100, DK-2100 Copenhagen, Denmark
2
Deltares, P.O. Box 177, 2600 MH Delft, The Netherlands
3
Finnish Meteorological Institute, Erik Palmenin aukio 1, 00560 Helsinki, Finland
4
Atmospheric Chemistry Research Group, Chemical Resource Beneficiation, North-West University, Potchefstroom 2520, South Africa
5
Balearic Islands Coastal Observing and Forecasting System (SOCIB), 07121 Palma, Spain
6
Helmholtz-Zentrum Hereon, Max-Planck-Str. 1, 21502 Geesthacht, Germany
7
Institute of Marine Research, P.O. Box 1870, Nordnes, NO-5817 Bergen, Norway
*
Author to whom correspondence should be addressed.
J. Mar. Sci. Eng. 2023, 11(8), 1630; https://doi.org/10.3390/jmse11081630
Submission received: 30 June 2023 / Revised: 6 August 2023 / Accepted: 11 August 2023 / Published: 21 August 2023
(This article belongs to the Special Issue Advanced Studies in Coastal Ocean Observation)

Abstract

:
The rapid expansion of offshore wind farms (OWFs) in European seas is accompanied by many challenges, including efficient and safe operation and maintenance, environmental protection, and biodiversity conservation. Effective decision-making for industry and environmental agencies relies on timely, multi-disciplinary marine data to assess the current state and predict the future state of the marine system. Due to high connectivity in space (land–estuarial–coastal sea), socioeconomic (multi-sectoral and cross-board), and environmental and ecological processes in sea areas containing OWFs, marine observations should be fit for purpose in relation to multiple OWF applications. This study represents an effort to map the major observation requirements (Part-I), identify observation gaps, and recommend solutions to fill those gaps (Part-II) in order to address multi-dimension challenges for the OWF industry. In Part-I, six targeted areas are selected, including OWF operation and maintenance, protection of submarine cables, wake and lee effects, transport and security, contamination, and ecological impact assessments. For each application area, key information products are identified, and integrated modeling–monitoring solutions for generating the information products are proposed based on current state-of-the-art methods. The observation requirements for these solutions, in terms of variables and spatial and temporal sampling needs, are therefore identified.

1. Introduction

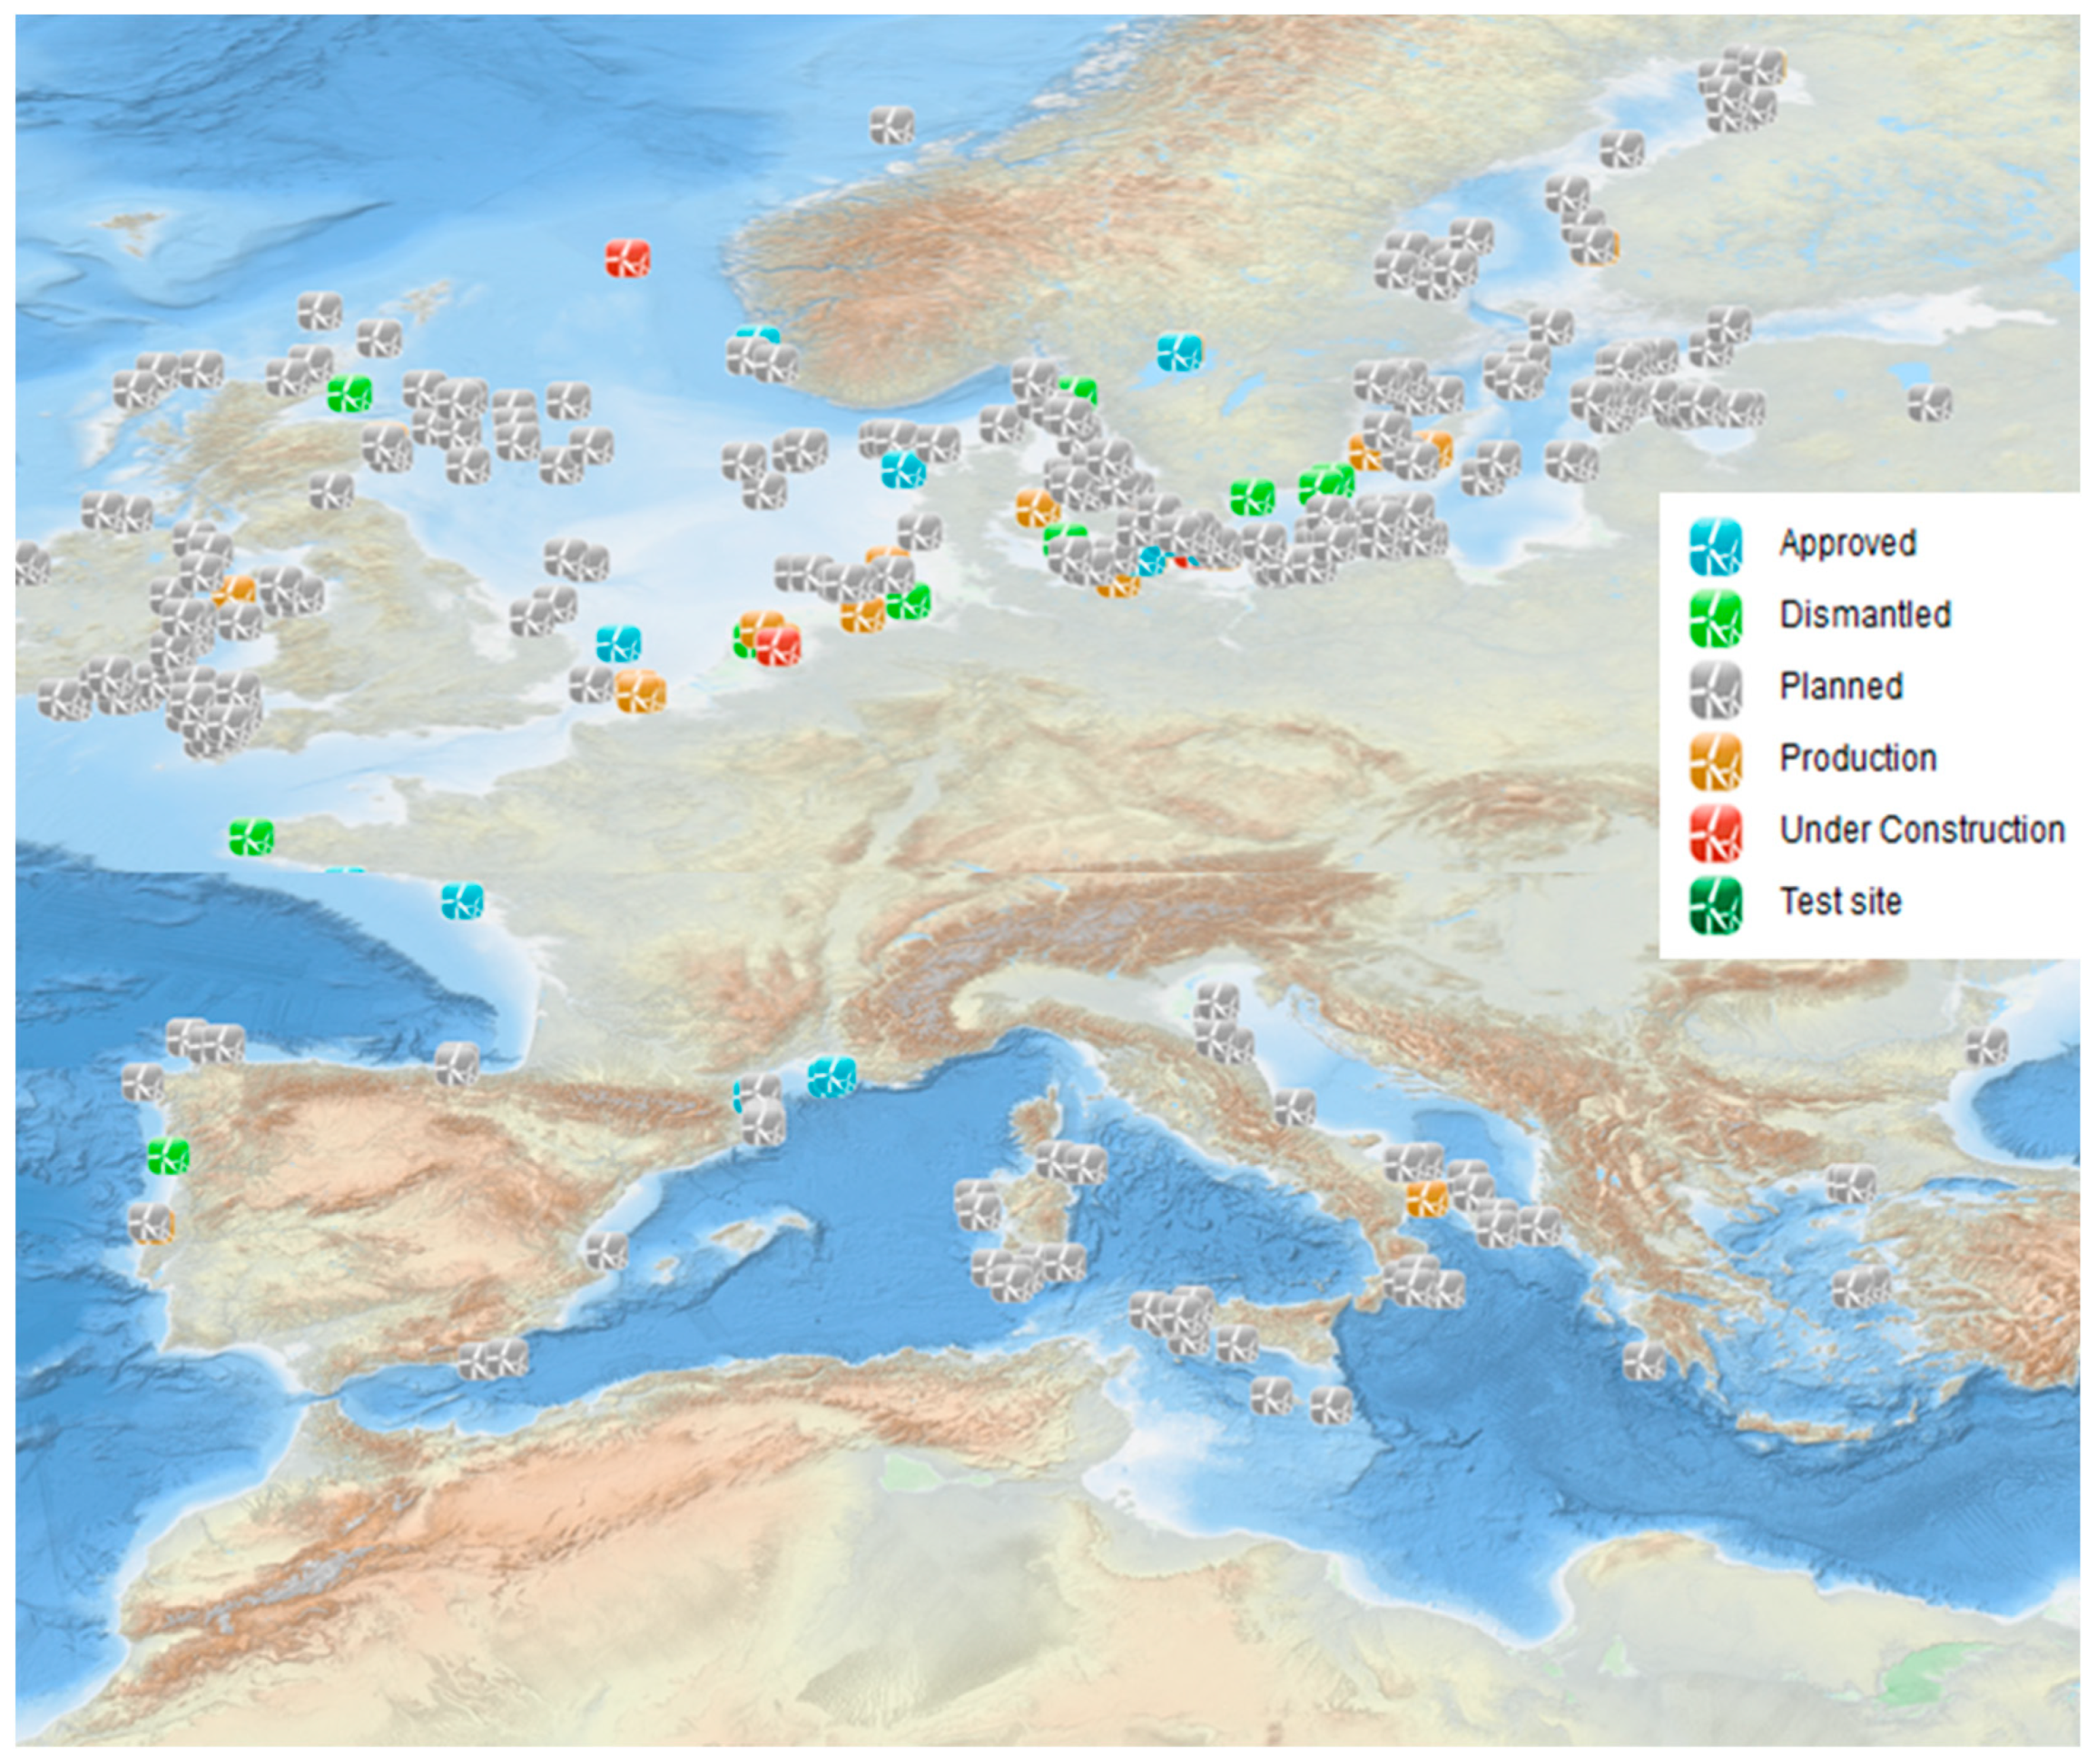
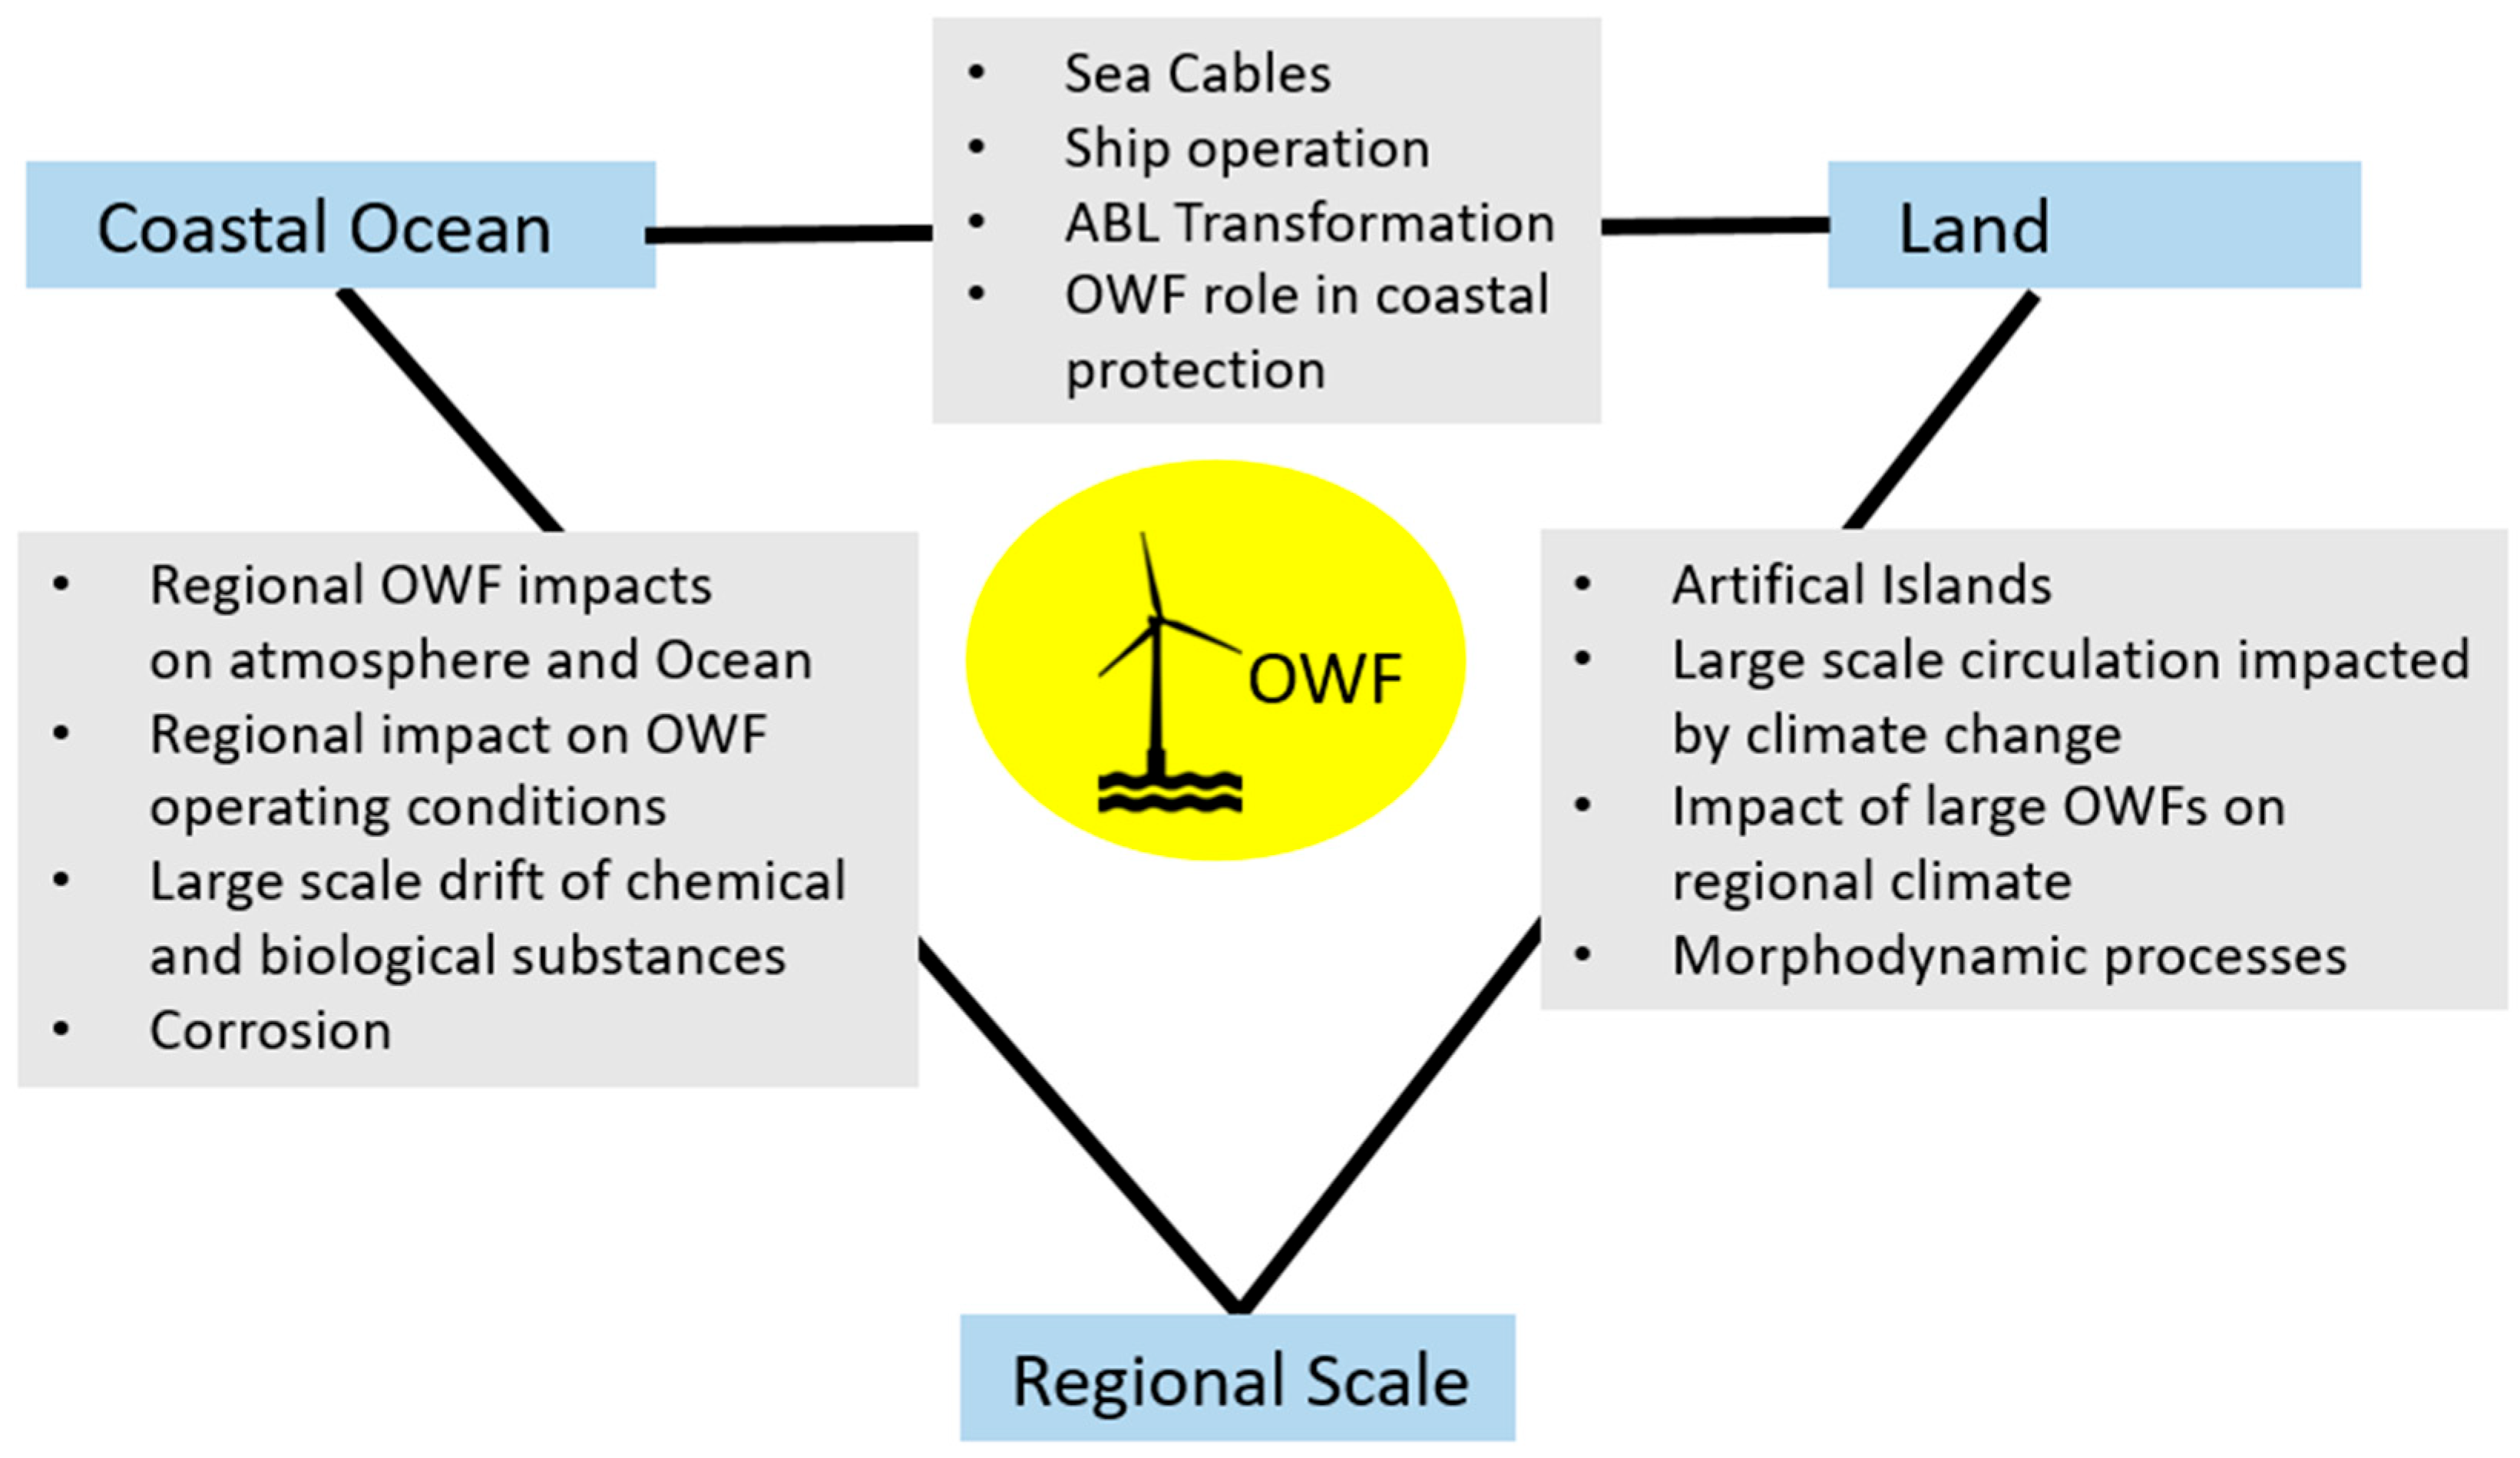
1.1. Offshore Wind Farm and Connectivity: Significance and Complexity

In Europe, as is the case globally, there is a need to reduce the use of fossil fuels and replace them with climate-neutral alternatives. In coastal areas, the most rapidly increasing form of new energy is offshore wind energy.
The large spectrum of industrial and research activities concerning OWF is driven by ambitious goals towards climate neutrality, as defined by the European Green Deal. The pressure to rapidly advance OWF technology is further amplified by the recent energy crisis. Wind Europe envisions 450 GW of offshore wind energy generation by 2050 [1]. Although major OWF operations have taken place in the northern European seas (up to 380 GW), there are also planned OWFs in the Mediterranean and Black Seas (Figure 1). More than 26 GW of this energy production is envisioned to take place in northern Baltic Sea areas with annual wintertime sea ice cover. Planning an OWF in cold areas differs from ice-free regions in many respects, and this requires specific observations, including the properties and dynamics of sea ice and icing of structures [2]. The icing of structures also causes significant risks for maintenance personnel during the winter period and directly impacts production due to the icing of blades.
The OWF industry involves several different sectors, and the value chain of the OWF industry can be divided into four phases: the development phase (4–6 years), the construction phase (2–4 years), the operation phase (up to 20 years), and the deconstruction phase. During the development phase, the site must be optimally designed so that the farm will demonstrate both high power productivity and safety at a relatively low cost and that it will meet environmental protection requirements. During the following phases, marine forecasts are required for the construction, operation, and maintenance of OWFs. Observations on-site and nearby will be needed concerning air, seawater, seabed, and biota to support both short-term operations and long-term planning and impact assessment.
OWF applications both affect and are affected by several natural and socioeconomic players, between which there is high connectivity. There are two major connectivity aspects to be considered: in space, the OWFs are located in shallow water areas with high land–coast–offshore connectivity (Figure 2); in processes, OWF applications are featured with physical–biogeochemical–ecological–socioeconomic connectivity (Figure 3) [3,4,5]. Spatial connectivity is of high relevance to OWF for several reasons (Figure 2):
  • Most OWFs are located in the transition zone between the oceanic and land atmospheric boundary layer [6], where a complex transformation process (including the formation of an intermediate boundary layer (IBL)) takes place, which is conditioned by different ocean processes, e.g., ocean waves and water temperatures.
  • OWFs are known to potentially add to the connectivity between different ecological habitats by serving as a habitat themselves. The fact that OWF areas are declared as no-fishing zones plays an important role in this context as well.
  • With the growing number and size of OWF installations, the respective impacts on the environment will take place on larger scales and thus contribute to regional connectivity. This concerns the release and drift of substances as much as the impacts on momentum and heat fluxes between the ocean and the atmosphere.
  • Sea cables are required to connect OWFs to land, and this comes with several challenges, e.g., related to morphodynamic processes or heating of the sea floor.
  • Artificial islands are a recent development leading to new requirements concerning observations and modeling.
The impacts of OWFs on the environment cover a large spectrum of physical, chemical, and ecological system components. With the ongoing growth of installations, short-term operational aspects (e.g., shadowing of one wind farm by another wind farm) must be considered, as well as long-term impacts on ecological systems. The OWF topic is particularly challenging with respect to the information required concerning the multi-scale processes in the ocean/atmosphere boundary layer and marine ecosystems, as shown in Figure 3.

1.2. Observation Requirements and Gap Analysis for OWF

To improve the safety and efficiency of the OWF business, a data-driven approach has been adopted by the OWF industry. The digital information for supporting OWF business is generated by monitoring and modeling technologies. A set of monitoring platforms has been applied [7], e.g., grab and sampling, epi-benthic beam trawling, and drop down video (DDV) for benthic surveys; beam trawls, otter trawls, lobster pots, gill nets, plankton nets, or local fishing vessels for fishery and shell fish surveys; boat-based and digital aerial surveys, GPS tracking, and radar and coastal vantage point (VP) surveys for ornithological environmental surveys; visual surveys, static and towed acoustic monitoring, tagging of individuals with satellite transmitters, and remotely controlled video monitoring for marine mammal environmental surveys; met mast, wave buoys, current meters, (floating) lidar for resource assessment, and metocean monitoring; seismic methods, echo sounding, magnetometry, and acoustic seismic profiling for geophysical surveys; vibrocores, boreholes with soil/rock sampling, and cone penetration testing (CPT) for geotechnical surveys; supervisory control and data acquisition (SCADA), remotely-operated vehicles (ROVs), autonomous underwater vehicles (AUVs), and unmanned aerial vehicles (UAVs, mostly multi-rotor copter drones equipped with a digital, thermographic camera) for operation and maintenance (inspection, repair) monitoring. Emerging cost-effective technologies such as ferrybox, HF radar [8], and LoRa (long range)-based wireless sensor networks for monitoring the quality of water in coastal areas [9,10] can also be deployed in coastal areas to provide a significant amount of high-resolution observations for OWF applications. The latter provides a basis for using the Internet of Things (IoT) in marine monitoring for OWF applications.
In addition to the integrated use of monitoring platforms, monitoring strategies, including observation requirements, data adequacy, and sampling strategies for the entire OWF value chain, have also become an important issue as they may significantly reduce the cost and risks of the implementation and operation of OWFs. A summary of observation requirements was provided in an OWF guide report by The Crown Estate and the Offshore Renewable Energy Catapult in 2019 [7]. A summary is provided in Tables S1–S3, including surveys on geophysics, geotechnology, hydrography, benthic, fish and shellfish, habitat, birds, marine mammals, and human impacts; monitoring for resource and metocean assessment, data requirements for weather forecasting, metocean conditions, data for corrosion protection, scour protection, offshore cable installation and protection, operation, maintenance and condition monitoring, and decommissioning. However, the description in the guide is very brief. In terms of in situ monitoring activities, only the functions, methodologies, and some measuring variables are mentioned; detailed requirements for spatiotemporal dimensions and sampling strategies are still missing. In recent years, some studies have investigated more detailed observation requirements in a specific application area. Monitoring requirements and strategy for OWF structure health were investigated by Martinez-Luengo et al. in 2016 [11]. In Europe, DG-MARE contracted several so-called “Sea basin check point” projects to assess if European marine data are adequate for offshore wind siting in European regional seas [12]. A fit-for-purpose observation requirement and gap assessment for OWF siting in the Baltic Sea was provided by She and Murawski in 2019 [13]. This study first identified user requirements, targeted information products, and observation and model requirements, then generated the information products based on an integrated modeling–monitoring approach. In this process, the availability of existing observations was mapped, the adequacy of observations was evaluated, and gaps were identified for use in the information product generation. OWF impacts on biodiversity and fisheries are a major focus of many studies. A review of the monitoring requirements and strategy for biodiversity in the Baltic–North Sea was provided by [14]. The NRDC (Natural Resources Defence Council) in the USA also initiated a monitoring guide for marine life during offshore wind energy development in 2023 [15].
There are still a few gaps in the knowledge base regarding the observation requirements and data adequacy assessment for the OWF industry. First, there is a lack of fit-for-purpose analysis for multi-application areas. The current analysis mainly focuses on one application. In addition, a fit-for-purpose assessment regarding targeted information products is often missing [13]. Second, recent research reveals several emerging application areas related to OWF which need extensive monitoring, e.g., multi-use of OWF platforms [16], wake and lee effects of OWFs on atmosphere and ocean environment [17,18,19,20], monitoring for sea bed cable protection [21,22], contamination caused by OWF [23,24], and OWF-related security issues [25,26,27,28]. Observation requirements and adequacy analysis are rarely performed in these emerging application areas. Third, models play an important role in providing the required information in different OWF applications. The capacity of modeling and integration of modeling and monitoring for specific applications is therefore essential for identifying observation requirements and gaps. In addition, remote sensing is also a significant source of surface observations. By integrating in situ remote sensing and models, the fit-for-purpose observation assessment and gap analysis for multi-applications produce more robust results. However, modeling–monitoring integration and the use of multi-source datasets have not been sufficiently addressed in the previous data gap analysis. Fourth, the OWF is a sector with high connectivity in space and human–nature systems. Such connectivity represents links between subsystems with multiple scales and multiple purposes. Depending on OWF applications, information may be required for different scales. For the spatial scale, observations are required to resolve the wind turbine-to-farm scale, inter-farm scale, farm-to-coast scale, and cross-border/regional scale; for the temporal scale, this can be an operational (synoptic) scale or long-term (OWF life span) scale. Existing observation requirements and gap analysis for the OWF sector have not focused on resolving connectivity with multiple spatiotemporal scales.
The purpose of this study is to fill the above research gaps: (i) the observation and gap analysis is based on an integrated monitoring–modeling approach, and satellite and in situ observations, models, and data assimilation are considered for the analysis; (ii) the analysis is performed for six OWF application areas, including four emerging areas for which a fit-for-purpose observation requirement and gap assessment has not been addressed, i.e., optimized monitoring for the protection of sea bed cables; wake and lee effects on atmosphere, sea, and shoreline change; OWF-related contamination; OWF impacts on transport and security. Two other application areas, operation and maintenance (O&M) and ecological impact, as basic OWF applications, have always been affected by the rapid expansion of OWFs and thus pose new challenges; (iii) a fit-for-purpose observation requirement and gap assessment method will be developed, with defined targeted information products in different applications; (iv) the observation requirements and gaps are analyzed for resolving multi-scale processes wherever relevant, e.g., wind-turbine-to-farm scale, inter-farm scale, farm-to-coast scale, and cross-border/regional scale in space, and synoptic and/or long-term (OWF life span) scales in time.
The above research is implemented using a six-step approach: first, the application areas are introduced, and key information products required for each application are identified; second, we propose integrated monitoring–modeling solutions based on state-of-the-art methods to generate the necessary information products; third, required marine observations and modeling capacities for implementing the solutions are identified; fourth, the availability of current monitoring (both in situ and satellite) and modeling capacities are mapped; fifth, based on the work in the third and fourth steps, the adequacy of current capacity can be evaluated, and related gaps can be identified; finally, we provide recommendations to fill these gaps. Due to the large number of application areas and the complexity of the assessment analysis, the publication of the results is divided into two parts: results in steps 1–3 are presented in Part I, and steps 4–6 in Part II.
Part I is organized as follows: Section 2 describes the method and materials; Section 3 introduces application areas and defines key information products; Section 4 identifies the existing and/or potential solutions for generating the products, as well as the associated marine data requirements; the discussion is presented in Section 5, and the conclusion is provided in Section 6.

2. Methodology

The fit-for-purpose analysis method on marine observation requirement and adequacy assessment is adopted from [13], developed and applied in EMODnet Sea Basin Checkpoint projects [12]. Part I implements research steps 1–3. This study is based on the authors’ knowledge and research experiences in the related application areas and literature review to identify existing knowledge gaps, user requirements on key information products, potential solutions, and observation requirements. The authors are involved in a variety of research projects, e.g., JERICO—Joint European Research Infrastructure for Coastal Observation, EMODnet Sea Basin Checkpoint projects, OLAMUR—Offshore Low-Trophic Aquaculture in Multi-use Scenario Realisation in North and Baltic Seas, and national information service projects for offshore wind farms, operational oceanography, and environment assessment in Denmark, Finland, Germany, The Netherlands, Norway, and Spain. These projects cover research (observation, modeling, and model–observation integration) and information services on all focused application areas. The individual knowledge and experiences also cover state-of-the-art methods at the institutional and national levels.

2.1. Step 1: User Requirements for Key Information Products

The user requirements for key information products are considered from three categories of users: governmental agencies, OWF operators, and the research community. Requirements from governmental agencies mainly concern the OWF’s impacts on the marine environment and ecosystems and confliction with other sea-going activities, which is reflected in the application areas of ecological impact, contamination, and transport and security. Requirements from OWF operators are to reach low cost, low risk, and high efficiency, which is the case in the application areas of O&M and optimized monitoring for sea bed cable protection. Requirements from the research communities include understanding OWF impact mechanisms, filling knowledge gaps, improving the quality of information products, and resolving OWF impacts in the forecast models. This is the case in all six application areas, particularly in wake and lee effects, O&M, and ecological impact applications. These requirements are defined based on the most recent publications, research, and service projects.

2.2. Step 2: Identifying Potential Solutions Based on Integrated Monitoring–Modeling Approach

In this part of the research, solutions for generating the key information products will be recommended based on the best practices currently available. If not available, state-of-the-art monitoring and modeling capacities will be combined to form a potential solution to generate the key information products. In this study, best practices in different application areas tend to be linked with specific national and institutional research and information service practices for OWFs. One may find that O&M-related analysis is mainly based on German practices, sea bed cable-related analysis is mainly based on Danish practices, wake and lee effects are mainly based on Danish and German practices, transport and security are mainly based on Finnish practices, thus focusing on icing waters, and ecological impact related analysis is mainly based on Norwegian and Dutch practices.

2.3. Step 3: Identifying Requirements for Using Observations and Improving Models

Addressing the challenges related to the growing number of OWF installations in diverse environments will require a significant effort both in improving numerical modeling and in the integrated use of modeling and observations, including both satellite and in situ data. On the one hand, there are still many uncertainties about suitable parameterization to include OWFs in models and forecasting sediment transport in the seabed. Optimization and validation of such new model components require dedicated observations of various parameters on a wide range of spatial and temporal scales. On the other hand, OWF installations add complexity to the environment with new challenges regarding forecasts, e.g., OWF will have an increasing impact on the routine observations, which are currently used in data assimilations systems at operational forecast centers. In the six application areas, a large set of models will be used. The requirements for using observations to improve modeling are evaluated with a similar method in Section 2.2.

3. Application Areas, Challenges, and Required Information Products

In this section, the six application areas of the OWF sector with high connectivity will be introduced, and challenges and required information products in the six application areas will be identified.

3.1. OWF Operation and Maintenance

Operation and maintenance (O&M) can contribute approximately 30% to the total lifetime costs of an offshore wind farm. Therefore, the optimization of the respective activities is a major factor in the economic success of this technology. In general, O&M costs contain a large variety of components, e.g., spare parts, regular maintenance, insurance, administration, and repair, and each of these items has individual requirements with respect to observation-based information products, as shown in Tables S2 and S3. In the following, we will concentrate on two activities that lead to information demand specifically for the ocean:
  • Ship operations for OWF maintenance.
  • OWF fatigue assessments are needed for lifetime extensions.
According to industry standards, O&M operations are split into two main categories [29]. The first type of operation is “weather-restricted” activities, where the operation is relatively short (typically 72 h or less), and metocean forecasts can be used to obtain information concerning the conditions to be expected. If the operation is longer than that, the activity is classified as “weather-unrestricted”, and many more conservative assumptions about the conditions based on long-term extreme statistics must be used to make decisions about the mission.
Usually, strict limits exist for sea state parameters to allow maintenance ships to anchor at offshore wind turbines and to transfer personnel. Typically, insurance companies define significant wave heights of approximately 1.5 m, below which maintenance operations can be conducted [30]. The exact limit depends on the ship size and type. As the costs for the operation of maintenance ships are a major factor, optimized planning of these operations is crucial. Decisions about whether to leave the harbor and go out to an OWF are made based on sea state forecasts, which are, of course, affected by errors.
A strategy for an optimal decision regarding an O&M operation can be designed if two additional pieces of information are available, i.e., the accuracy of the wave forecast provided by a probability density function and the costs associated with the decisions on different operation scenarios.
In this case, the expected costs for a decision to go out or stay in the harbor can be estimated as
               cost(“stay in harbour”) = cost(“B”) × Prob(Hs > limit) + cost(“D”) × Prob(Hs < limit)
cost(“go out”) = cost(“A”) × Prob(Hs < limit) + cost(“C”) × Prob(Hs > limit),
and the scenario with the lowest expected costs can be chosen.
To make this optimal decision, a wave forecast product, together with its uncertainty estimation, is required. The product should cover the area of OWFs and surrounding coastal waters. We will explain in Section 4 that such a product contains several important connectivity aspects.
The second application in the context of O&M is related to OWF lifetime extensions. Typical lifetimes of OWFs are 25–30 years, and any potential extension of that lifetime has beneficial consequences for the overall costs of the OWF life cycle. One important factor for a decision concerning a lifetime extension is the fatigue and extreme loads experienced by the OWF throughout its lifetime. As before, ocean wave conditions, particularly extreme sea states (and in the northern sea areas, sea ice), play an important role in this context. Similar to the case of the wave forecast, such a product contains several connectivity aspects; however, the details are a little bit different and will be explained further in the next section.

3.2. Protection of Submarine Cables

There are several challenges related to sea bed geological properties in the installation and protection of submarine cables. These include bedrock and hard sediments, boulder fields, sea bed gradients, mobile sediments, acoustic blanking, gas/fluid seepage features, sediment instability, and man-made activities and features such as fishing and debris. Among them, the responses to the mobile sediment and sediment instability are extremely challenging as the situations are highly dynamic and variable. A comprehensive geological survey is required to assess all these factors before installing the cable (Table S2). Near and offshore sea beds can be highly variable in space with sand dunes, channels, bunkers, and depressions, as shown by existing surveys [31]. Most often, these features are related to sediment transport, entrainment, and erosion. Since these processes are highly dynamic, geological properties in the areas with mobile sediments will also be dynamic. The moving sediments may bury or expose the cable, which should be avoided since excess burial depth may result in overheating, and exposure will leave cables vulnerable to damage.
Several solutions have been applied for protecting cables in mobile sediment areas, e.g., pre-dredging or pre-sweeping the cable route prior to laying and trenching, using rock placement on top of the laid cable. However, due to the dynamic sediment environment, ongoing maintenance is required. Frequent burial depth measurements and burial remediation, for example, on a yearly basis in critical areas, are often used as an economically viable mitigation method. For the industry, it is essential to know where the critical areas are and how fast the burial depth changes in the critical areas. In addition, the impact of sea ice on cable protection needs to be taken into account in the northern Baltic Sea since packed sea ice can reach depths of tens of meters [32]. Hence, the required information product is the changing rate of the sea bed sediment layer and the packed sea ice information. The product should cover areas around the cable arrays.
For this analysis, we use cable protection in Danish waters as an example (Figure 4). Danish cables are placed not only in Danish waters but also connect to Norway, Sweden, Germany, the UK, and other countries. In Denmark, submarine cable protection is managed at company and community levels, promoted and coordinated by the Danish Cable Protection Committee (DKCPC), an association of gas, telecommunication, and electricity companies owning submarine cables and pipelines in Danish maritime territory.

3.3. Wake and Lee Effects

Recent research found that OWFs have significant wake effects, which have been captured by both in situ [17] and satellite observations, as shown in Figure 5. OWFs can cause a 2–20% reduction in mean downstream wind speed at 10 m above mean sea level, with some wakes extending over 100 km. The average wind wakes are 20–40 km in size, suggesting that future offshore wind farms should be built at least that distance from the nearest neighboring wind farm site [18]. The OWF wake effect also changes air–sea boundary layers such as air and sea temperature, visibility, and icing, as well as changes the local waves, currents, water mixing, suspended particulate matter (SPM) transport [33], and sea ice formation. The wake effect is largely determined by OWFs’ output power capacity, the farm layout, and air–sea temperature differences [34]. The change in the winds may significantly affect wind power prediction, and changes in water mixing and SPM may degrade water quality and further affect marine ecosystems. Hence, wake effects should be included in weather, ocean, and ecological models to provide better predictions.
The hydrodynamic impacts are transferred to the ocean via two routes: (1) modification of the wind field affecting the wave and current fields, and (2) wind turbine foundations’ direct effects on ocean waves and currents and consequently on turbulence, mixing, and vertical stratification [35]. Existing studies [19,20,36,37] found that wind turbine foundations could extract energy from the background currents, enhancing turbulence mixing in the wakes.
A modeling experiment showed that the wave height could easily be reduced in the order of 4–5% 2 km down-wind of the OWF and up to 2% 10 km down-wind. The direction of the incoming waves is also modified [38]. The lee effects of the OWF result in sediment accumulations similar to what can be seen behind shore parallel offshore breakwaters. The sediment is accumulated as a salient, for which the sand can be taken from neighboring beaches, thus leading to shoreline erosion. The change in shoreline is on a scale of a few meters every ten years, depending on the location and layout of the OWF and the natural conditions (nearshore currents, waves, and beach types), etc.
In this application, OWF users will require improved weather–ocean–ice–wave and sediment–biogeochemistry predictions by resolving the wake effects and assessing their long-term impacts. The information products required in this application comprise the change in weather and ocean conditions (e.g., winds, waves, currents, SPM, turbidity, and sea bed sediments) and long-term shoreline change rate per coastal stretch due to OWFs.
For the research community, parameterizations of OWF impacts in weather–ocean–wave–SPM models are still underdeveloped; thus, observation products on wind profiles, waves, currents, T/S, and SPM in the wake area are required to calibrate and optimize model parameterizations.

3.4. Impacts of OWF on Transport, Maritime Safety, and Weather Forecasting

OWFs also impact the human use of marine areas. There are two specific aspects relevant to Northeast Europe. Firstly, the Northern Baltic Sea is covered with seasonal ice, typically between November and May [39]. In addition to the direct mechanical impacts on windmills, large OWFs impact the normal movement of sea ice by creating artificial areas where sea ice fields freeze more easily, and fast ice may form instead of moving ice fields. Thus, the locations of OWFs have an impact both on local ecosystems and shipping traffic requiring ice-breaking activities. The changes in sea ice may also impact the icing of windmill blades and thus reduce/increase the expected annual energy production depending on the direction of changes [40]. The sea ice also impacts the OWF inspection and maintenance (Section 3.1 and Section 4.1), such as the sea state.
Secondly, large wind farms have an impact on marine vessel radars [25], HF radars [26], marine surveillance radar networks [27], and weather radars [28]. The continuous movement of blades creates disturbances on the backscatter of the radar signals, and as the wind direction and speed continuously changes, forecasting the signal disturbances is challenging and, in some cases, not possible, even with state-of-the-art radar technology. The military aspects of this second challenge have led to a situation where large sea areas in the eastern Gulf of Finland, the Baltic Sea, are currently excluded from wind energy production. These military aspects are also connected to the protection of submarine cables; with an increasing share of energy produced with OWFs, submarine cables are part of critical infrastructure, and surveillance radars are thus an essential part of cable protection.
From a forecasting and research perspective, OWFs may influence observations of surface currents and waves from HF radars, sea ice movements from coastal radars [41,42], and meteorological observations over the sea from weather radars (providing, e.g., wind field observations used as inputs for wave forecasting models), and thus the existing and planned locations of OWF must be taken into account while designing the observing networks and methods to fill the meteorological observing gaps within and behind the OWF.
Due to security issues, a significant part of radar-related research is not public, and to support open discussion and fact-based decision-making, more open and independent academic research is necessary in this field of research [43].
In these applications, the national weather surveys and maritime authorities require methods and measurements to fill the radar observation gaps related to wind and precipitation observations and marine surveillance in the areas shadowed by the OWFs. Additionally, in situ observations are required to address the changes in ice field motion and sea ice processes.

3.5. Contamination Assessment and Response

OWFs can also be at the origin of a release of contaminants in the ocean. Protection systems used to ensure the durability of offshore infrastructures in the highly corrosive marine environment are based on either cathodic systems, increased steel thickness, or chemical coatings. These protection systems emit metals such as Aluminium, Zinc, Cadmium, and Indium (metal emissions) or organic compounds (chemical emissions) such as Bisphenol A [23,24]. These emissions can be as large as 45 tons of Aluminium and 2 tons of Zinc per year for a wind farm with 80 turbines [23]. Moreover, the transportation, construction, and maintenance of OWFs also imply an increase in ship traffic and the probability of marine pollution accidents.
The above emissions mostly occur in the OWF site, steadily for the OWF lifespan, and may also affect surrounding areas due to the transport of the contaminants emitted by the OWF. In such a case, the three-dimensional distribution of the pollutant concentration in the seawater, sediment, and biota, both in the OWF site and surrounding waters, is a key information product for impact assessment and response. Knowledge of the regional oceanographic connectivity and observations is necessary to characterize ocean transports from the OWF sites toward the rest of the ocean basins.

3.6. Ecological Impacts of OWFs

The construction and operation of OWFs can have significant impacts on marine ecosystems and the habitats of marine organisms through different pathways. Ecological impacts are mainly caused by changes in (1) noise, (2) habitat, (3) electromagnetic fields, and (4) water quality. Moreover, the rotator blades of the OWF can pose a collision risk to birds and bats. An overview of potential effects on the marine ecosystem is provided in [24,44] for floating OWFs by summarizing the existing literature.
Underwater noise: during the construction and operation of offshore wind farms, underwater noise is generated, which may affect marine life. The assessment should evaluate the sound propagation, intensity, and frequency to understand the potential impacts on fishes, mammals, and sea birds, particularly those that rely on acoustic communication.
Noise mainly acts as a disturbance that many swimming marine organisms would try to avoid. Fish, mammals, and many invertebrates can perceive vibrations associated with low-frequency sound and react via changes in behavior, physics, or physiology [45,46,47]. Most of the focus on invertebrates in the literature concerns the harmful effects of impulsive noise and vibrations [48,49], but continuous noise can also lead to behavioral changes [50]. Therefore, it is possible that increased noise levels are one of the reasons why the facilities are quickly colonized by bottom-dwelling invertebrates [51,52]. A three-dimensional noise distribution map in the OWF and surrounding waters, together with biodiversity data before and after the OWF installation, is required to conclude whether noise from wind turbines will have mostly positive or negative effects on invertebrates.
Habitat alteration: during the operation phase, both the benthic and pelagic habitats are changed by the presence of underwater structures, such as support foundations and cable protection systems, which can create artificial reefs. Studies from some European countries show that the turbine foundations have a clear positive effect on the occurrence of algae and benthic animals through fouling. This means that many species of fish are attracted to the facilities. It is uncertain whether the increase in the area around the wind power plants is only the movement of local fish or a real increase in the population [53]. Furthermore, the benthic habitat can be indirectly affected by enhanced turbulence in the wake and by reducing the impacts of bottom-trawling fisheries. Lastly, the pelagic habitat is affected through a chain of cascading effects through the ecosystem, starting from the direct impacts described above, with culminating effects throughout the food web within the OWF and stretching far beyond the OWF due to wake and lee effects. Due to the changes in benthic habitats, more opportunities for invasive species may be created. Understanding the nature and magnitude of these ecological impacts is crucial for the sustainable development of OWFs and minimizing their impacts on marine biodiversity. The information products needed for this application are habitat change and its potential impact on organisms and their associated ecosystems.
Electromagnetic fields (EMFs): submarine cables and electrical infrastructure associated with OWFs emit electromagnetic fields and potentially impact marine creatures [54]. Different fish species have shown different sensitivity to changes in EMF by either showing changes in behavior [55] or no reaction [56]. The information products required in this application are EMF levels and their potential effects on migratory patterns, behavior, and sensory systems of marine species.
Collision risk: offshore wind turbines can pose collision risks for birds and bats, especially during migration or feeding activities. Impact assessments analyze the species composition, flight patterns, and population densities to estimate the potential risks and inform mitigation measures. Observation of this direct impact on bird populations is complicated because birds that are hit cannot be collected below the wind turbines as is performed for wind turbines on land [57]. In the absence of observation data, models are commonly used to calculate collision risks, e.g., in [58].
Indirect effects: the ecological impact assessment should also consider the indirect effects of OWFs, such as changes in water quality, sedimentation, and the food chain. These factors can affect the availability of prey species for fishes, mammals, and sea birds. Modeling studies and satellite data show wake effects on vertical mixing, enhanced suspended sediment concentrations [59], the break-up of stratification, and big changes in primary production. This, in turn, is also likely to affect the carrying capacity for higher trophic levels.
Displacement and barrier effects: OWFs can cause temporary or permanent displacement of fishes, mammals, and sea birds from their natural habitats. Assessments examine potential changes in migration routes, foraging grounds, and breeding areas, as well as the overall impact on population dynamics.
Therefore, key information products required for the ecological impact assessment should be short- and long-term changes of ecosystem indicators, including (i) pressure indicators, e.g., underwater noise level, electromagnetic field level, physical and chemical environment, water quality (including contaminants directly released from the turbines), and habitat, and (ii) biota indicators, such as biomass for both low and high trophic levels, biodiversity, or taxa of conservation concern.

4. Solutions and Required Data and Modeling Technologies

With regard to the key information products identified in Section 3, effective solutions are required to generate the products. Such solutions are often based on integrating models (dynamic, statistical, and ML/AI algorithms) and in situ and remote sensing observations. In this section, we describe solutions for each product defined in Section 3 and identify the observation data and models required for the solutions.
It should be noted that, due to the fast-growing number of OWFs and spatial connection of atmosphere, coast, offshore, and marine ecosystems, most of the information products for OWFs, either local forecasts or assessment of the impacts, will need to consider impacts of all OWFs in the regional sea scale. Thus, the solutions here represent a regional-scale solution that fits the purposes of individual OWFs, the research community, and national and regional stakeholders.

4.1. OWF Operation and Maintenance

As mentioned in Section 3, to make the optimal decision for short-term OWF O&M, a wave forecast product, together with an uncertainty estimate, is required. This includes both the wind sea part generated by the local wind field and a swell component, which is generated by some distant high wind speed event earlier on. The swell can significantly impact ship operations, particularly if the swell periods match the eigenmodes of the ship. In practice, such a forecast is routinely generated by global–regional–local wave forecasting systems.
Global–regional wave monitoring and forecasting systems have been constantly improved in recent decades. For example, recent changes in the ocean wave model used in ECMWF’s Integrated Forecasting System (IFS) and Meteo France WAM model include new parametrizations for wind input and deep-water dissipation of waves, which improve forecasts of some of the most common ocean wave variables, including significant wave height [60]. The new formulation reduces the overprediction of long-period swell energy and small wave height underestimation in storm tracks. Wave forecasts on global and regional scales are regarded as sufficiently good for users. The focus of the O&M forecasting service is on the local forecast in the farm and areas between and farm and the coast. Due to the presence of OWFs and complex coastal topography, there are a few challenges in the local wave forecast:
  • The impact of OWFs on winds and waves is currently not resolved by weather and wave forecasts.
  • Wave propagation and dissipation terms in shallow waters and areas with land–sea blended grids require specific treatment [61]. Complex coastlines, including islands, will change wave propagation, but the model resolution is insufficient.
  • Interaction between waves and currents must be resolvedas the sea level becomes significant in coastal waters.
These issues will lead to forecast errors in current coastal wave models. The proposed solutions are: (i) to use shallow water wave models with improved shallow water wave source terms; (ii) to assimilate wave, currents, and sea level observations in a coupled wave–ocean forecasting system; (iii) to parameterize impacts of OWFs in weather, ocean, and wave models (more details will be provided in Section 4.3); (iv) to develop an individualized optimal local forecast by aggregating different forecasts and observations. When developing the above solutions, local wind, wave, and sea level observations in the OWF and nearby areas are essential for quantifying forecast uncertainties and optimizing the forecast [62]. Current data, e.g., measured by HF radar, are also useful for improving wave–current interactions in the wave forecast model. In icing seas, forecasts of sea ice conditions are essential for operating maintenance vessels. Sea ice forecasts and services are provided in Nordic countries using sea ice models. Observations on the type, concentration, and thickness of the sea ice are required to improve the model forecast and quantify the uncertainties. Currently, monitoring and forecasts of sea ice thickness and fast ice still pose major challenges. Wave forecasts in the ice-marginal zone (with an ice concentration of less than 85%) due to less resolved wave–ice interaction in the model still have large uncertainties. Observations in the ice-marginal zone are required to calibrate and validate the models.
The forecast of structural icing on wind turbines is another important factor, as it limits local maintenance operations. This relies on better parameterizing the OWFs’ impacts in the atmospheric boundary layer, which has not been sufficiently resolved in present-day numerical weather-prediction models. In such a case, local observations on the atmospheric boundary layer will be important for reducing the forecast uncertainties.
Another application area is OWF lifetime extensions. In this application, wave and sea ice time series data are required to estimate fatigue and extreme loads. In practice, this means that the temporal sampling of the time series must be sufficiently high to capture extreme conditions.

4.2. Protection of Submarine Cables

In order to provide the required information products for the cable protection problem caused by the mobile sediments, i.e., changes in cable burial depth, two solutions can be applied: a survey-based solution and a survey-modeling integrated solution.
Survey-based solution: first, multiple surveys with a certain elapsed time, e.g., one year, need to be conducted; then, based on the result, the speed and volume of sediment transport can be calculated. In this way, areas with high sediment mobility can be identified. It is often necessary to perform this as a pre-lay practice since post-lay activities can be very expensive and are not always effective. This also means years will pass before the cable installation if a survey-based solution is adopted.
Survey-modeling integrated solution: in this solution, in situ and satellite observations and models capable of simulating the sea sediment variability are integrated to produce the required information products. The survey-modeling integrated solution has several advantages. It can be performed in a large area, save both expenses and time (in the order of years) for cable installation and protection, and predict future changes in burial depth.
The model for this purpose consists of sediment transport and morphology modules, which support both bedload and suspended load transport of non-cohesive sediments and suspended load of cohesive sediments due to waves and currents. In the model, the sediment is categorized as “mud” (cohesive suspended load transport), “sand” (non-cohesive bedload and suspended load transport), and “bedload” (non-cohesive bedload only or total load transport) fractions. The simulation may include as many an arbitrary number of these fractions as computer memory and simulation time allow. The hydrodynamic and wave energy equations are solved to determine the suspended transport due to currents and waves for “sand” and “mud” fractions. The sea bed composition can be modeled either as a single well-mixed layer or as a multi-layer bed to keep track of the development of different layers of sediment over time. A comprehensive sediment and morphology transport model has been developed by industrial software developers such as Deltares (D-Morphology, https://oss.deltares.nl/web/delft3d/manuals, accessed on 8 June 2023).
Numerical models must be calibrated using historical survey data, including bathymetry, currents, substrate types and grain sizes, and the changing rate of burial depth. If the model is proven to be sufficiently good, it can be used to identify critical areas and predict the future evolution of the burial depth. In practice, the model development can be divided into two stages: the first stage is to develop large-scale drift models of suspended load and bedload, while the second stage is to develop downscaled fine-scale models which can be applied to a given case of cable protection. To develop and implement this integrated solution, waves, currents, fine-resolution bathymetry, and substrate types are required to configure the sediment transport models. Observations of ocean currents, grain size and related sedimentation rate, and sea bed sediment layer depth are necessary to calibrate and validate the model.
In ice-covered sea areas, submarine cables close to the sea surface may be impacted by moving sea ice. To avoid these adverse impacts, information on the maximum depths sea ice can reach is required. This can be achieved with a combination of sea ice models and in situ observations providing statistics of sea ice properties in a specific area.

4.3. Wake and Lee Effects

Since there are significant knowledge gaps on the wake and lee effects of OWFs, a process-oriented in situ monitoring and modeling approach is required both to improve the OWF parameterizations in the models and assess the differences in atmosphere, ocean, sediment, and coast morphology before and after the OWFs are deployed. For the selected OWF sites, relevant marine environment parameters should be monitored before and after OWF deployment so that the impacts of OWFs can be quantitatively assessed. However, due to natural variability, the OWF impact cannot be accurately assessed only using observations. It is necessary to use well-calibrated OWF-resolving atmospheric–hydrodynamic–wave–sea–ice models to simulate impacts. However, due to the resolution limits (currently a kilometer grid for weather and 10 s of meters grid for hydrodynamics) in these models, individual turbines will not be explicitly resolved; instead, their effects will be parameterized according to the model grid size. The data and knowledge obtained in the individual OWF impact study can be used to derive parameterizations of the wake and lee effects of OWFs. Such parameterizations can then be applied in coarser resolution, large-scale weather, ocean, and wave forecast models so that the OWF impacts can be simulated. Downstream impacts on sediment transport and coastal erosion can also be modeled, with forcing from the impact-resolving weather–ocean–wave–sea–ice models.
Key variables are required to calibrate and validate model forecasts and assessments, including winds, waves, currents, temperature/salinity profiles, turbidity, sea ice, substrate, SPM, and shoreline positions. Other data, such as OWF geographic and power configurations, are required for model parameterization. The area of interest is mainly in OWF and surrounding areas up to the coast, especially the wake area. For wake effect forecast application, hourly data for a short period, e.g., a few months to a year, will be required. For long-term impacts on the coastal morphology, multi-year or decadal observations will be required for the assessment, while the sampling frequency can be a few times a year or adaptive sampling focusing on severe erosion events.

4.4. Specific Impacts of OWF on Sea Ice and Safety

There are two important areas of particular interest, especially in the northern and eastern Baltic Sea, the impact of large OWFs on sea ice and the impact on radar observing networks.
In the northern seas, estimating and analyzing the impacts of OWF on marine transport and local ecosystems requires an understanding of the interactions between the OWF and sea ice, representing a knowledge gap. Typically, the resolution in existing sea ice models is not high enough to include processes in the scales of OWF. Thus, models with flexible grids are required. The development and validation of these models require detailed observations of sea ice properties, local meteorology, mechanical forcing, and wind tower design.
Addressing the second challenge created by the increasing number of OWFs on radars requires developments both on the observing and modeling sides. Part of the solution is to use additional weather and surveillance radars and marine weather stations to cover shadowed areas. In particular, additional observations of vertical wind profiles and precipitation are essential to maintain the accuracy of marine forecasts (relying on weather radars) at the current level. However, due to the seasonal ice cover, solutions based on measurement buoys are impossible, making the challenges sometimes difficult to solve. Additionally, further basic research is required to develop methods to estimate the impacts of OWFs on, for example, (radar) electromagnetic signal propagation in the marine boundary layers as the OWFs also have indirect impacts on radars due to boundary layer processes such as changes in the sea surface evaporation layer.

4.5. Contamination Assessment and Response

In order to derive the distribution of the major contaminants emitted from the offshore wind turbines in seawater and sediment and their impacts on biota, an integrated monitoring–modeling laboratory experiment is required. The laboratory experiment, together with field monitoring, will determine the emission rates of major metals and chemicals; numerical models are required to simulate the transport pathways of the chemicals, both in seawater and sediment. These models should include modules of hydrodynamics, waves, and particle sedimentation and resuspension. Field monitoring should be carried out to obtain contaminant concentrations and hydrodynamic and wave conditions, which can be used for calibrating and validating the models. The contaminant concentration in species such as seagrass, benthic, and fish can be obtained from monitoring data in biota, while the impacts of the contaminants must be assessed via toxicity experiments. The observation requirements for this application are summarized in Table A1. An accurate representation of ocean currents and their variability is required to track the path of contaminants released at sea. Operational ocean circulation models provide very valuable tools in this respect. These models are ideally coupled with wave models to account for the effect of wave-driven currents on surface drift. Wake and lee effects of OWFs on winds, waves, and currents should be resolved. A high resolution (i.e., a few hundred meters in terms of the grid size) is generally required to resolve the impact of OWFs. Satellite altimetry sea level observations can now cover coastal waters with a 1 km resolution [63]. Data-assimilative models which integrate this information and combine it with other multiplatform in situ measurements provide adequate tools to represent these observed fields as well as the smaller-scale variability associated with it. These models, by representing the full 4D variability of multivariate ocean fields, are able to describe the spatiotemporal ocean connectivity associated with ocean currents, which is especially useful for the identification of remote areas likely to be affected by the contamination possibly generated at OWF sites.

4.6. Ecological Impacts

As analyzed in Section 3.6, the key information products for assessing the ecosystem impacts of OWFs include short- and long-term changes in both pressure and biota indicators. To derive these indicators, information is required from all variables in the effect chain, starting from changes in vertical mixing around the wind turbines, resulting in changes in stratification, turbidity, light climate, primary production, and phytoplankton in the OWF and its wake. Furthermore, information is required on noise levels, changes in benthic substrate and benthic communities in the OWF, and changes in the abundance of zooplankton, fish, and marine mammals within the OWF and its wake. Since the identification of changes is the key objective of required information products, consistent observations over a sustained period are required, starting before the construction of the OWF. Ecological impacts are likely to reach far beyond the areas of individual OWFs. Particularly, if the number of OWFs increases as is presently foreseen, the wake effects of different OWFs are likely to interfere and lead to larger cumulative impacts than impacts from individual OWFs. Fish, marine mammals, and birds migrate over large areas, so changes in their abundance will not only be affected by the local effects of OWFs. Rather, they respond to ecosystem change over larger areas, across national borders, with a particular sensitivity to changes in their spawning and nursing grounds. Thus, understanding of ecological impacts of OWFs would require the sharing and integration of data between countries in combined information products.
It should be noted that in situ observations can have large gaps in space, while for most of the pressure indicators (e.g., noise, EMF) and some biota indicators (e.g., plankton), we require a continuous 3D distribution. An ideal solution is to use calibrated numerical models, including marine biogeochemical and ecosystem models, noise propagation models, and pollutant and sediment transport models. In addition, the models can also be used to estimate variables that are hard to observe (such as bird collisions), test different hypotheses on causal relations between different observed variables, and extrapolate to future scenarios.
Ecological impact assessments are conducted both before the construction of offshore wind farms and during the operation phase. Assessments before construction are used to apply for construction permits and optimize the location and design to minimize potential ecological risks. In this stage, potential impacts are mainly estimated from observations of the current situation and model simulations of future scenarios. During the operation phase, monitoring the change in noise level, water quality and habitat, and ecological impacts is required to assess the level of environmental change and check whether the ecosystem is unacceptably affected. To this end, long-term observation data are required for trend detection. Additionally, interpretation of any trends is required to detect the causes of the trends, and selecting adaptive management approaches is essential to ensure that any unforeseen impacts are identified and addressed promptly, helping to minimize adverse effects on marine species and their habitats.
Impact assessments often include recommendations for monitoring programs to track the long-term effects of offshore wind farms on marine life. They also propose mitigation measures, such as adjusting turbine design, optimizing cable routes, or implementing seasonal restrictions to minimize potential impacts on fish, mammals, and sea birds.

5. Discussion

Since this study mainly focuses on the monitoring requirements, several other important issues related to OWF observations, such as demands on coordinated data management between different sectors, data transmission, interoperability, and accessibility, have not been addressed. There are also emerging areas missing, such as the multi-use of OWF platforms, in this study. Furthermore, further research should be carried out to synthesize observation requirements resolving multi-scale processes and multi-application objectives. These are discussed below.

5.1. Multi-Use of OWF Platforms

The selection of applications is not exclusive in this study; other applications, such as optimal OWF siting and multi-use of offshore platforms, are also important when designing integrated monitoring for OWFs. Observation requirements and gap analysis of OWF siting have been investigated in previous studies [13]. The multi-use of OWF has been an intensive research area in the EU research framework FP7, Horizon 2020, and Horizon Europe [16]. The observation requirements for multi-use are related not only to OWF applications but also to specific co-utilization, e.g., aquaculture farms and tourism. Since the focus of this study is mainly on OWF-only applications, the topic of multi-use offshore platforms is not covered by this paper. A separate study on observation requirements and adequacy analysis for the multi-use of OWFs can be conducted in the future.

5.2. Model-Observation Integration in Areas with High Connectivity and Multiple Scales

Due to the high spatial connectivity of the applications in the land–coastal–open sea continuum, the observation requirements are considered in a multi-application, multi-scale, and multi-process framework with integrated monitoring–modeling solutions. The information products are required at four scales: local scale, i.e., within the farm and cable line area; inter-farm scale; coastal scale, i.e., between the farms and coasts; the cross-border or regional scale, which is between nations. In order to derive these multi-scale information products, both marine monitoring and modeling will be used. The monitoring will obtain real physical, chemical, and biological states of the ocean, but with spatial and temporal gaps. Models, with seamless and on-demand modeling capacity, will be able to resolve the multiple scales of spatial connectivity, coupled physical–chemical–biological marine system, as well as multiple time scales from days to decades, and finally produce four-dimensional gap-free data of the marine system state. However, model data may be far away from reality. Observations, both in situ and remote sensing, are required to calibrate the models and reduce the model error or initial field error via data assimilation. For each application area, an integrated monitoring–modeling approach has been recommended as a solution for generating the key information products. Additionally, addressing and understanding some of the impacts of OWFs require further basic research on the process level.

5.3. Coordinated Data Management for OWF Applications

The application areas in this paper showed many overlaps and linkages between variables for which information is required. This provides opportunities for synergies if the information is obtained with an integrated approach for multiple application areas. In this way, the observations and modeling approaches can serve multiple purposes, including providing realistic statuses of the air, sea, biota, and sea bed; model calibration and validation; improving forecasts using model–data integration. Winds, currents, waves, and ice (if relevant) are basic variables required for high-frequency (hourly or daily) long-term monitoring. Water temperature, salinity, and biogeochemical parameters can be sampled 4–24 times a year, while sediment, contaminants, habitat, and biodiversity only need to be surveyed 1–4 times a year. The monitoring should be carried out on-site and between OWF and coasts years before the OWF construction so that the impact of the OWF can be assessed.
There is also a demand for an efficient channel or framework for collaboration between governmental agencies, OWF companies, the research community, and aggregated data centers. The OWF sector, together with governmental agencies, will need to establish a framework for declassification of the environmental monitoring data created by the OWFs, similar to that practiced in The BVG Associates Limited in the UK. Community data centers, such as EMODnet in Europe, should also enhance dialogue and set up an agreement with the OWF sector so that the part of the open environment observations from the OWF can be smoothly transferred to the community database.

5.4. Data Transmission, Interoperability, and Accessibility

Data transmission: with the rapid expansion of OWFs and increasing environmental monitoring needs, efficient, low-cost, and near-real-time data transmission is becoming increasingly important. This includes the collection of turbine data using the SCADA system and environmental observations from multi-sensors and then transferring the data to land. Satellite-based data transfer has been used in this procedure, which is efficient but expensive. LoRaWAN (Long Range Wireless Area Network) is a low-power mode with long range (with gateways transmitting and receiving signals over a distance of over 10 km in open space), which has been tested for coastal water quality, aquaculture, and turbine monitoring communication, together with IoT technology. Combined with robotic monitoring platforms, such as drones, UAVs, and ROVs, it is expected that future collection and transmission of environmental data in OWF application areas can be significantly improved.
Data interoperability: in situ observations in OWFs and their wake areas are mainly determined by industrial companies (OWF operators and monitoring service providers) and research projects. Currently, there is a lack of common data standards between commercial monitoring (OWF industrial data), research monitoring, and environmental and operational monitoring. An industrial data standard that is interoperable with environmental and operational data standards will largely facilitate the use of multi-source observations.
Data accessibility: currently, most of the commercial monitoring data are confidential. This has hampered research and assessment activities for OWFs. A subset of commercial monitoring data, especially data for ecological impact assessment, should be made freely available. This has also been suggested by the Natural Resources Defence Council, a group of more than 20 environmental organizations, in a concise guide to the science-based principles and priorities for environmental monitoring that are crucial to advance responsible offshore wind development in the United States [15].

6. Conclusions

In this study, key information products, solutions for production, and observations required for the six OWF application areas with high connectivity have been identified to plan, operate, and assess the impacts of OWFs on the environment and marine ecosystems. The application areas cover information services for OWF operation and maintenance, optimizing monitoring for the protection of submarine cables, prediction of atmospheric and marine wake and lee effects, impacts on maritime transport and security, contamination monitoring and assessment, and ecological impact assessment. These application areas show many examples of spatial and interdisciplinary connectivity between different types of observation data required for different applications.
A fit-for-purpose observation requirement assessment approach is used first to identify user needs on key information products, then to suggest an integrated modeling–monitoring solution for deriving the information products, and finally, to identify observation demands with regard to the use of observations in implementing the solutions. The results should show that demands from governmental stakeholders, OWF operators, and the research community can only be fulfilled by multi-scale and multi-disciplinary observations and dedicated monitoring–modeling integration.
The identified observation requirements for the six OWF application areas are summarized in Table A1. Based on the outcomes of this paper, the availability and gaps of the observations will be analyzed, and the results will be reported as Part II of this study [64].

Supplementary Materials

The following supporting information can be downloaded at: https://www.mdpi.com/article/10.3390/jmse11081630/s1. Table S1. An overview of required environmental monitoring activities. Table S2. An overview of required metocean monitoring activities and geological and hydrographical surveys. Table S3. An overview of other required monitoring activities.

Author Contributions

Conceptualization: J.S. and J.S.-S.; methodology: J.S.; analysis: J.S.-S. is responsible for operation and maintenance related continents, J.S. is responsible for submarine cable protection and wake and lee effects, L.L. for maritime safety in icing waters and radar aspects, B.M. for contamination, A.B. and H.W. for OWF impacts on habitat, NIS, fish, sea bird, and marine mammals; writing—original draft preparation, all; writing—review and editing, all. All authors have read and agreed to the published version of the manuscript.

Funding

The presented work was financed by the European Union in the framework of the project JERICO S3 (Joint European Research Infrastructure of Coastal Observatories: Science, Service, Sustainability) (Grant agreement ID: 871153). The work of L.L. was also supported by the Academy of Finland, project number 338150, “Enabling forecasts on radar performance in the marine environment”, and The International Cooperative Engagement Program for Polar Research.

Institutional Review Board Statement

Not applicable.

Informed Consent Statement

Not applicable.

Data Availability Statement

No new data were created or analyzed in this study. Data sharing is not applicable to this article.

Acknowledgments

The presented work was conducted in the framework of the project JERICO S3 (Joint European Research Infrastructure of Coastal Observatories: Science, Service, Sustainability) supported by the European Union (Grant agreement ID: 871153).

Conflicts of Interest

The authors declare no conflict of interest.

Appendix A. Required Observations for OWF Applications with High Connectivity

Table A1. Observation requirements for OWF applications with high spatial connectivity.
Application Area & Information ProductPurpose of Using ObservationsVariablesSpatial NeedsTemporal Needs
O&M: Forecast and related uncertainties of waves, sea ice, sea level, currents and icingModel parameterization, cal/val, model-data integration for optimal forecastWaves
Surface winds
Surface currents
Sea ice properties
Icing, humidity, etc.
A few sites per OWF and connectivity areaHourly daily, real-time
O&M: Long-term and extreme loadfatigue/extreme load estimationWavesA few sites per OWFHourly, lifetime
Sea iceOWF areaDaily, lifetime
Sea bed cable protection: Shear stress, sediment layer thickness above cable for cable protectionInputs to modelBathymetryModel areaStatic
Sea bed substrateModel areaStatic
Riverine SPM dischargeModel areaDaily or hourly
Model cal/val, parameterization, process studyWavesCable areaHourly
SPM concentrationModel areahourly or daily
Sedimentation rateModel areaStatic
Sea bed sediment (size, layer thickness)Cable areaMonthly or quarterly
Wake/lee effects: Weather–ocean–wave–ice–SPM forecast with impacts of OWFsCalibrating and validating models; optimal forecast by integrating local observations and model forecastWind/current profiles, surface wave spectraOne site per OWFHourly for two periods before/after OWF deployment; or for a dedicated campaign period.
ABL variables, waves, T, SA few sites per OWF
Surface currentsA few sites per farm, 2D distribution
Shoreline positionsCoastal stretch, OWF downstream
Sea iceA few sites per OWF and model areaHourly daily
Security and marine forecasting: Impacts of OWF on radar signal propagationFill the spatial data gaps due to shadowing effectsPrecipitation, winds, radar targets3-dimensionalHourly
Contamination: 3D distribution of metal and chemical contaminant concentrationsCalibrate models, data assimilation, impact assessmentConcentration of Al, Zn, Cd, In, BBA, etc.; surface currentsSeawater, sediment, biota, both on-site and in surrounding areasLong-term, seasonal or annual sampling
Ecological impacts: Changes in abiotic conditions, leading to changes in biotaTrend detection, analysis of cause–effect relations, model validationNoise, bed topography and composition, vertical profiles of T, S, turbidity, light, population densities of biota: phytoplankton, zooplankton, benthos, fish, marine mammals, birdsIn OWFs and their lee area, vertical profiles of pelagic variablesLong-term consistent for trend detection, high temporal resolution for representativeness and detecting interactions between variables

References

  1. WindEurope. Our Energy, Our Future—How Offshore Wind Will Help Europe Go Carbon-Neutral? Colin, W., Ed.; WindEurope: Brussels, Belgium, 2019; Available online: https://www.windenergy.org (accessed on 10 August 2023).
  2. Tikanmäki, M.; Heinonen, J. Estimating extreme level ice and ridge thickness for offshore wind turbine design: Case study Kriegers Flak. Wind. Energy 2022, 25, 639–659. [Google Scholar] [CrossRef]
  3. Van der Molen, J.; García-García, L.M.; Whomersley, P.; Callaway, A.; Posen, P.E.; Hyder, K. Connectivity of larval stages of sedentary marine communities between hard substrates and offshore structures in the North Sea. Sci. Rep. 2018, 8, 14772. [Google Scholar] [CrossRef] [PubMed]
  4. Jaspers, C.; Huwer, B.; Antajan, E.; Hosia, A.; Hinrichsen, H.-H.; Biastoch, A.; Angel, D.; Asmus, R.; Augustin, C.; Bagheri, S.; et al. Ocean current connectivity propelling the secondary spread of a marine invasive comb jelly across western Eurasia. Glob. Ecol. Biogeogr. 2018, 27, 814–827. [Google Scholar] [CrossRef]
  5. Hinrichsen, H.-H.; Piatkowski, U.; Jaspers, C. Sightings of extraordinary marine species in the SW Baltic Sea linked to saline water inflows. J. Sea Res. 2022, 181, 102175. [Google Scholar] [CrossRef]
  6. Schulz-Stellenfleth, J.; Emeis, S.; Dörenkämper, M.; Bange, J.; Cañadillas, B.; Neumann, T.; Schneemann, J.; Weber, I.; Berge, K.Z.; Platis, A.; et al. Coastal impacts on offshore wind farms—A review focussing on the German Bight area. Meteorol. Z. 2022, 31, 289–315. [Google Scholar] [CrossRef]
  7. The Crown Estate; The Offshore Renewable Energy Catapult. Guide to an Offshore Wind Farm; BVG Associates Limited: Swindon, UK, 2019; p. 128. [Google Scholar]
  8. Baschek, B.; Schroeder, F.; Brix, H.; Riethmüller, R.; Badewien, T.H.; Breitbach, G.; Brügge, B.; Colijn, F.; Doerffer, R.; Eschenbach, C.; et al. The Coastal Observing System for Northern and Arctic Seas (COSYNA). Ocean Sci. 2017, 13, 379–410. [Google Scholar] [CrossRef]
  9. Sendra, S.; Parra, L.; Jimenez, J.M.; Garcia, L.; Lloret, J. LoRa-based Network for Water Quality Monitoring in Coastal Areas. Mob. Networks Appl. 2022, 27, 1–17. [Google Scholar] [CrossRef]
  10. Wu, T.-D.; Chen, Z.-J.; Chang, C.-C.; Wang, H.-F. Design of a Wireless Sensor Network for Open Ocean Aquaculture Based on 802.11 ac Wireless Bridge and LoRa™ Technology. In Proceedings of the International Workshop on Electromagnetics: Applications and Student Innovation Competition (iWEM), Makung, Taiwan, 26–28 August 2020; pp. 1–2. [Google Scholar] [CrossRef]
  11. Martinez-Luengo, M.; Kolios, A.; Wang, L. Structural health monitoring of offshore wind turbines: A review through the Statistical Pattern Recognition Paradigm. Renew. Sustain. Energy Rev. 2016, 64, 91–105. [Google Scholar] [CrossRef]
  12. Míguez, B.M.; Novellino, A.; Vinci, M.; Claus, S.; Calewaert, J.-B.; Vallius, H.; Schmitt, T.; Pititto, A.; Giorgetti, A.; Askew, N.; et al. The European Marine Observation and Data Network (EMODnet): Visions and Roles of the Gateway to Marine Data in Europe. Front. Mar. Sci. 2019, 6, 313. [Google Scholar] [CrossRef]
  13. She, J.; Murawski, J. Developing community marine data service for Blue Growth sectors. J. Oper. Oceanogr. 2019, 12 (Suppl. S2), S80–S96. [Google Scholar] [CrossRef]
  14. Stephenson, P.J. A Review of Biodiversity Data Needs and Monitoring Protocols for the Offshore Wind Energy Sector in the Baltic Sea and North Sea; Report for the Renewables Grid Initiative; Renewables Grid Initiative: Berlin, Germany, 2021. [Google Scholar]
  15. Natural Resources Defence Council. Monitoring of Marine Life during Offshore Wind Energy Development—Guidelines and Recommendations. NRDC Report. 2023. Available online: https://www.nrdc.org/sites/default/files/ow_marine-life_monitoring_guidelines.pdf (accessed on 10 August 2023).
  16. Abhinav, K.; Collu, M.; Benjamins, S.; Cai, H.; Hughes, A.; Jiang, B.; Jude, S.; Leithead, W.; Lin, C.; Liu, H.; et al. Offshore multi-purpose platforms for a Blue Growth: A technological, environmental and socio-economic review. Sci. Total Environ. 2020, 734, 138256. [Google Scholar] [CrossRef] [PubMed]
  17. Floeter, J.; van Beusekom, J.E.; Auch, D.; Callies, U.; Carpenter, J.; Dudeck, T.; Eberle, S.; Eckhardt, A.; Gloe, D.; Hänselmann, K.; et al. Pelagic effects of offshore wind farm foundations in the stratified North Sea. Prog. Oceanogr. 2017, 156, 154–173. [Google Scholar] [CrossRef]
  18. Vedel, H.; Fischereit, J.; Kaas, E. Including the Effect of Wind Turbines in the Harmonie NWP and Climate Models; Danish Meteorological Institute (DMI) Report 22-19; Danish Meteorological Institute: Copenhagen, Denmark, 2022; ISSN 2445-9127. ISBN 978-87-7478-720-4. [Google Scholar]
  19. Carpenter, J.R.; Merckelbach, L.; Callies, U.; Clark, S.; Gaslikova, L.; Baschek, B. Potential Impacts of Offshore Wind Farms on North Sea Stratification. PLoS ONE 2016, 11, e0160830. [Google Scholar] [CrossRef]
  20. Schultze, L.K.P.; Merckelbach, L.M.; Horstmann, J.; Raasch, S.; Carpenter, J.R. Increased Mixing and Turbulence in the Wake of Offshore Wind Farm Foundations. J. Geophys. Res. Oceans 2020, 125, e2019JC015858. [Google Scholar] [CrossRef]
  21. Taormina, B.; Bald, J.; Want, A.; Thouzeau, G.; Lejart, M.; Desroy, N.; Carlier, A. A review of potential impacts of submarine power cables on the marine environment: Knowledge gaps, recommendations and future directions. Renew. Sustain. Energy Rev. 2018, 96, 380–391. [Google Scholar] [CrossRef]
  22. Cao, C.; Ge, Y.; Ren, X.; Peng, X.; Chen, J.; Lu, Z.; Zheng, X. Experimental research on submarine cable monitoring method based on MEMS sensor. Micro Nano Eng. 2022, 15, 100130. [Google Scholar] [CrossRef]
  23. Kirchgeorg, T.; Weinberg, I.; Hörnig, M.; Baier, R.; Schmid, M.; Brockmeyer, B. Emissions from corrosion protection systems of offshore wind farms: Evaluation of the potential impact on the marine environment. Mar. Pollut. Bull. 2018, 136, 257–268. [Google Scholar] [CrossRef]
  24. Farr, H.; Ruttenberg, B.; Walter, R.K.; Wang, Y.-H.; White, C. Potential environmental effects of deepwater floating offshore wind energy facilities. Ocean Coast. Manag. 2021, 207, 105611. [Google Scholar] [CrossRef]
  25. NASEM, National Academies of Sciences, Engineering, and Medicine. Wind Turbine Generator Impacts to Marine Vessel Radar; The National Academies Press: Washington, DC, USA, 2022. [Google Scholar] [CrossRef]
  26. Trockel, D.; Rodriguez-Alegre, I.; Barrick, D.; Whelan, C. Impact Assessment and Mitigation of Offshore Wind Turbines on High Frequency Coastal Oceanographic Radar; OCS Study BOEM 2018-053; US Department of the Interior, Bureau of Ocean Energy Management: Sterling, VA, USA, 2018.
  27. U.S. Department of Energy (DOE). 2020. Available online: https://www.energy.gov/sites/prod/files/2020/04/f74/offshore-wind-turbine-radar-interference-mitigation-webinar-4-20-2020.pdf (accessed on 10 August 2023).
  28. Leijnse, H.; Teschl, R.; Paulitsch, H.; Teschl, F.; Holmes, G.; Fodnes Sidselrud, L. OPERA-4: On the Coexistence of Weather Radars and Wind Turbines. 2022. Available online: https://www.eumetnet.eu/wp-content/uploads/2022/08/OPERA_wind_turbine_report_20220225.pdf (accessed on 10 August 2023).
  29. De Matos e Sá, M. Short-Term O&M Planning for Offshore Wind Energy. Ph.D. Thesis, KTH Royal Institute of Technology, Stockholm, Sweden, 2022. Available online: https://www.diva-portal.org/smash/get/diva2:1726974/FULLTEXT01.pdf (accessed on 10 August 2023).
  30. Taylor, J.W.; Jeon, J. Probabilistic forecasting of wave height for offshore wind turbine maintenance. Eur. J. Oper. Res. 2018, 267, 877–890. [Google Scholar] [CrossRef]
  31. Energinet. Geological Survey Report Lot2: Thor Offshore Wind Farm Export Cable Route Investigation; 103282-ENN-MMT-SUR-REP-SURVLOT2 REVISION B; MMT SWEDEN AB: Västra Frölunda, Sweden, 2020. [Google Scholar]
  32. Timco, G.; Burden, R. An analysis of the shapes of sea ice ridges. Cold Reg. Sci. Technol. 1997, 25, 65–77. [Google Scholar] [CrossRef]
  33. Brandao, I.; van der Molen, J.; van der Wal, D. Effects of offshore wind farms on suspended particulate matter derived from satellite remote sensing. Sci. Total Environ. 2023, 866, 161114. [Google Scholar] [CrossRef] [PubMed]
  34. Djath, B.; Schulz-Stellenfleth, J.; Cañadillas, B. Impact of atmospheric stability on X-band and C-band synthetic aperture radar imagery of offshore windpark wakes. J. Renew. Sustain. Energy 2018, 10, 043301. [Google Scholar] [CrossRef]
  35. Van Berkel, J.; Burchard, H.; Christensen, A.; Mortensen, L.; Petersen, O.; Thomsen, F. The Effects of Offshore Wind Farms on Hydrodynamics and Implications for Fishes. Oceanography 2020, 33, 108–117. [Google Scholar] [CrossRef]
  36. Rennau, H.; Schimmels, S.; Burchard, H. On the effect of structure-induced resistance and mixing on inflows into the Baltic Sea: A numerical model study. Coast. Eng. 2012, 60, 53–68. [Google Scholar] [CrossRef]
  37. Cazenave, P.W.; Torres, R.; Allen, J.I. Unstructured grid modelling of offshore wind farm impacts on seasonally stratified shelf seas. Prog. Oceanogr. 2016, 145, 25–41. [Google Scholar] [CrossRef]
  38. Christensen, E.D.; Kristensen, S.E.; Deigaard, R. Impact of an offshore wind farm on wave conditions and shoreline development. In Proceedings of the 34th International Conference on Coastal Engineering, Seoul, Republic of Korea, 15–20 June 2014. [Google Scholar]
  39. Vihma, T.; Haapala, J.; Matthäus, W. Geophysics of sea ice in the Baltic Sea: A review. Prog. Oceanogr. 2009, 80, 129–148. [Google Scholar] [CrossRef]
  40. Battisti, L.; Fedrizzi, R.; Brighenti, A.; Laakso, T. Sea ice and icing risk for offshore wind turbines. In Offshore Wind and Other Marine Renewable Energies in Mediterranean and European Seas, Proceedings of the OWEMES European Seminars, Civitavecchia, Rome, Italy, 20–22 April 2006; OWEMES Association Onlus: Rome, Italy, 2006; ISBN 978-88-8286-283-1. [Google Scholar]
  41. Karvonen, J. Virtual radar ice buoys—A method for measuring fine-scale sea ice drift. Cryosphere 2016, 10, 29–42. [Google Scholar] [CrossRef]
  42. Oikkonen, A.; Haapala, J.; Lensu, M.; Karvonen, J.; Itkin, P. Small-scale sea ice deformation during N-ICE2015: From compact pack ice to marginal ice zone. J. Geophys. Res. Oceans 2017, 122, 5105–5120. [Google Scholar] [CrossRef]
  43. Rautiainen, L.; Tyynelä, J.; Lensu, M.; Siiriä, S.; Vakkari, V.; O’Connor, E.; Hämäläinen, K.; Lonka, H.; Stenbäck, K.; Koistinen, J.; et al. Utö Observatory for Analysing Atmospheric Ducting Events over Baltic Coastal and Marine Waters. Remote Sens. 2023, 15, 2989. [Google Scholar] [CrossRef]
  44. Mangi, S.C. The Impact of Offshore Wind Farms on Marine Ecosystems: A Review Taking an Ecosystem Services Perspective. Proc. IEEE 2013, 101, 999–1009. [Google Scholar] [CrossRef]
  45. Simpson, S.D.; Radford, A.N.; Nedelec, S.L.; Ferrari, M.C.O.; Chivers, D.P.; McCormick, M.I.; Meekan, M.G. Anthropogenic noise increases fish mortality by predation. Nat. Commun. 2016, 7, 10544. [Google Scholar] [CrossRef] [PubMed]
  46. Madsen, P.; Wahlberg, M.; Tougaard, J.; Lucke, K.; Tyack, P. Wind turbine underwater noise and marine mammals: Implications of current knowledge and data needs. Mar. Ecol. Prog. Ser. 2006, 309, 279–295. [Google Scholar] [CrossRef]
  47. Roberts, L.; Elliott, M. Good or bad vibrations? Impacts of anthropogenic vibration on the marine epibenthos. Sci. Total Environ. 2017, 595, 255–268. [Google Scholar] [CrossRef] [PubMed]
  48. Edmonds, N.J.; Firmin, C.J.; Goldsmith, D.; Faulkner, R.C.; Wood, D.T. A review of crustacean sensitivity to high amplitude underwater noise: Data needs for effective risk assessment in relation to UK commercial species. Mar. Pollut. Bull. 2016, 108, 5–11. [Google Scholar] [CrossRef]
  49. Roberts, L.; Breithaupt, T. Sensitivity of Crustaceans to Substrate-Borne Vibration. In The Effects of Noise on Aquatic Life II; Springer: New York, NY, USA, 2016; pp. 925–931. [Google Scholar] [CrossRef]
  50. Jolivet, A.; Tremblay, R.; Olivier, F.; Gervaise, C.; Sonier, R.; Genard, B.; Chauvaud, L. Validation of trophic and anthropic underwater noise as settlement trigger in blue mussels. Sci. Rep. 2016, 6, srep33829. [Google Scholar] [CrossRef]
  51. Stanley, J.A.; Wilkens, S.; McDonald, J.I.; Jeffs, A.G. Vessel noise promotes hull fouling. In The Effects of Noise on Aquatic Life II; Springer: New York, NY, USA, 2016; pp. 1097–1104. [Google Scholar]
  52. Solan, M.; Hauton, C.; Godbold, J.A.; Wood, C.L.; Leighton, T.G.; White, P. Anthropogenic sources of underwater sound can modify how sediment-dwelling invertebrates mediate ecosystem properties. Sci. Rep. 2016, 6, 20540. [Google Scholar] [CrossRef]
  53. Methratta, E.T.; Dardick, W.R. Meta-Analysis of Finfish Abundance at Offshore Wind Farms. Rev. Fish. Sci. Aquac. 2019, 27, 242–260. [Google Scholar] [CrossRef]
  54. Alberta, L.; Deschamps, F.; Joliveta, A.; Olivier, F.; Chauvaud, L.; Chauvaud, S. Acurrent synthesis on the effects of electric and magnetic fields emitted by submarine power cables on invertebrates. Mar. Environ. Res. 2020, 159, 104958. [Google Scholar] [CrossRef]
  55. Cresci, A.; Durif, C.M.F.; Larsen, T.; Bjelland, R.; Skiftesvik, A.B.; Browman, H.I. Magnetic fields produced by subsea high-voltage direct current cables reduce swimming activity of haddock larvae (Melanogrammus aeglefinus). PNAS Nexus 2022, 1, pgac175. [Google Scholar] [CrossRef]
  56. Cresci, A.; Perrichon, P.; Durif, C.M.; Sørhus, E.; Johnsen, E.; Bjelland, R.; Larsen, T.; Skiftesvik, A.B.; Browman, H.I. Magnetic fields generated by the DC cables of offshore wind farms have no effect on spatial distribution or swimming behaviour of lesser sandeel larvae (Ammodytes marinus). Environ. Res. 2022, 176, 105609. [Google Scholar]
  57. Krijgsveld, K.L.; Akershoek, K.; Schenk, F.; Dijk, F.; Dirksen, S. Collision Risk of Birds with Modern Large Wind Turbines. Ardea 2009, 97, 357–366. [Google Scholar] [CrossRef]
  58. Johnston, A.; Cook, A.S.C.P.; Wright, L.J.; Humphreys, E.M.; Burton, N.H.K. Modelling flight heights of marine birds to more accurately assess collision risk with offshore wind turbines. J. Appl. Ecol. 2014, 51, 31–41. [Google Scholar] [CrossRef]
  59. Vanhellemont, Q.; Ruddick, K. Turbid wakes associated with offshore wind turbines observed with Landsat 8. Remote. Sens. Environ. 2014, 145, 105–115. [Google Scholar] [CrossRef]
  60. Bidlot, J.-R. Model Upgrade Improves Ocean Wave Forecasts. ECMWF Newsletter 159. 2019. Available online: https://www.ecmwf.int/en/newsletter/159/news/model-upgrade-improves-ocean-wave-forecasts (accessed on 10 August 2023).
  61. Gorrell, L.; Raubenheimer, B.; Elgar, S.; Guza, R. SWAN predictions of waves observed in shallow water onshore of complex bathymetry. Coast. Eng. 2011, 58, 510–516. [Google Scholar] [CrossRef]
  62. Golbeck, I.; Li, X.; Janssen, F.; Brüning, T.; Nielsen, J.W.; Huess, V.; Söderkvist, J.; Büchmann, B.; Siiriä, S.-M.; Vähä-Piikkiö, O.; et al. Uncertainty estimation for operational ocean forecast products—A multi-model ensemble for the North Sea and the Baltic Sea. Ocean Dyn. 2015, 65, 1603–1631. [Google Scholar] [CrossRef]
  63. Pujol, M.-I.; Dupuy, S.; Vergara, O.; Román, A.S.; Faugère, Y.; Prandi, P.; Dabat, M.-L.; Dagneaux, Q.; Lievin, M.; Cadier, E.; et al. Refining the Resolution of DUACS Along-Track Level-3 Sea Level Altimetry Products. Remote. Sens. 2023, 15, 793. [Google Scholar] [CrossRef]
  64. Schulz-Stellenfleth, J.; Blauw, A.; Laakso, L.; Mourre, B.; She, J.; Wehde, H. Fit-for-purpose information in coastal seas with high connectivity for offshore wind farming applications. Part-II: Gap Analysis and Recommendations. J. Mar. Sci. Eng. 2023, 11, x. [Google Scholar]
Figure 1. Map of existing and planned OWFs in European coastal seas (source: EMODnet.eu, accessed on 8 June 2023).
Jmse 11 01630 g001
Figure 2. Spatial connectivity relations in offshore wind farm sector.
Jmse 11 01630 g002
Figure 3. Connectivity represented by interactive processes in the physical–ecological–social systems and their non-local impacts.
Jmse 11 01630 g003
Figure 4. Submarine cable lines connected in and to Denmark, as of 3 December 2022, including power cables (red) and telecommunication cables (green) (source: The Danish Cable Protection Committee (DKCPC)).
Jmse 11 01630 g004
Figure 5. SENTINEL-1A satellite radar image acquired on 1 April 2020, showing atmospheric wakes downstream of offshore wind parks in the German Bight (Copernicus 2020 data). The grey values correspond to the small-scale sea surface roughness, strongly correlated with near-surface wind speeds. The red circle indicates the location of the first German offshore windpark, “Alpha Ventus”, commissioned in 2010, with the measurement platform FINO-1 on the left side.
Jmse 11 01630 g005
Disclaimer/Publisher’s Note: The statements, opinions and data contained in all publications are solely those of the individual author(s) and contributor(s) and not of MDPI and/or the editor(s). MDPI and/or the editor(s) disclaim responsibility for any injury to people or property resulting from any ideas, methods, instructions or products referred to in the content.

