Article

Critical State Calculation of Saddle-Shaped Unstable Region of the Axial-Flow Pump Based on Bifurcation SST k–ω Model

College of Electrical, Energy and Power Engineering, Yangzhou University, Yangzhou 225009, China
*
Author to whom correspondence should be addressed.
J. Mar. Sci. Eng. 2023, 11(8), 1549; https://doi.org/10.3390/jmse11081549
Submission received: 5 July 2023 / Revised: 29 July 2023 / Accepted: 2 August 2023 / Published: 4 August 2023
(This article belongs to the Section Ocean Engineering)

Abstract

:
This study aims to investigate the critical state of the saddle-shaped unstable region of the axial-flow pump and propose a suitable criterion for identifying this state. The bifurcation SST k ω model considered the rotation effect is used in the present work and verified in the numerical calculation of a water jet pump. Then, it is used to simulate the critical state of the axial-flow pump. Results show that the leading-edge separation vortex generates at 0.6Qd, while the head declines only at 0.55Qd. Therefore, using the inflection point of the head-flow curve as the critical state criterion is unsuitable. In addition, the fixed monitoring point is unsuitable for identifying the critical state due to the insensitivity to the amplitude, main frequency, and periodicity changes at the critical state. Finally, to identify the critical state, it is essential to arrange a monitoring point at the leading edge of the blade suction near the shroud, which should rotate with the impeller. The critical state criterion is that the main frequency position of the pressure fluctuation signal is offset at the monitoring point, and the amplitude is increased by 10 times.

1. Introduction

Water jet pumps are essential power sources for modern ships and have undergone significant improvements through the efforts of numerous scholars [1,2,3,4,5,6,7,8]. However, design problems and changes in sailing water level can cause the pump to enter the unstable saddle-shaped region [9,10,11,12,13,14]. Similarly, axial-flow pumps, widely used for water transfer and supply, can also encounter this problem during operation [14,15,16,17,18,19]. The saddle-shaped unstable region should be avoided as it can result in internal flow disturbance, intensification of hydraulic vibration, and a sharp decline in efficiency [20,21,22,23]. Therefore, it is crucial to study the critical state of the saddle-shaped unstable region and develop objective criteria for identifying this state.
The critical state has been a topic of interest for many scholars [24,25,26]. Goltz et al. [24] used the inflection point of the head-flow curve as the criterion. In addition, visual observation experiments found that the reflux structure was captured at the leading edge of the blade suction near the shroud and the trailing edge near the hub in critical conditions. Toyokura [25] measured the velocity field of the impeller and the pressure distribution near the shroud on the open axial-flow pump test bench. At critical conditions, the radial velocity would suddenly increase, and the hydraulic performance would change abruptly. Rui [26] used computational fluid dynamics (CFD) to find that the axial velocity and velocity loop quantity at the impeller inlet would change significantly under critical conditions. However, taking that parameter as the criterion may not accurately identify the critical point due to a certain lag [10]. Therefore, this research aims to propose a more accurate criterion for critical state identification.
Concerning the research on the precursor problem of critical points in axial flow compressor [27,28,29,30,31], the pressure fluctuation signal monitored can be divided into two disturbance forms: modal wave and spike wave, both of which are pre-cursor characteristics of compressor stall [27]. Therefore, the change of pressure fluctuation signal is more suitable to be used as the criterion of the critical condition. However, the pressure fluctuation in the critical condition needs further study due to the differences in speed and fluid properties compared to compressors. Previous studies [32,33,34] have shown that under design conditions, the pressure fluctuation frequency in the impeller and the guide vane passage is mainly the periodic pressure fluctuation of blade frequency, rotation frequency, and frequency doubling [32]. Low-frequency pressure fluctuations mainly occur at the outlet of the guide vane and pump [33]. The pressure fluctuation amplitude will increase as the flow rate decreases. The low-frequency pressure fluctuation will increase sharply and gradually occupy a dominant position [34]. However, there is no criterion to identify the critical state based on pressure fluctuation. In addition, the previous research mainly focuses on the fixed monitoring point at the impeller and guide vane. The rotating monitoring points within the impeller need to be further studied.
Numerical simulation is an essential approach for research on the internal flow of axial-flow pumps. Accurate prediction of numerical simulation relies on selecting an appropriate turbulence model. Under off-design conditions, the internal flow field becomes highly disordered. The strong three-dimensional non-linear characteristics, rotation effect, and curvature effect pose a severe challenge to the turbulence model. Large-eddy simulation (LES) can capture all turbulent structures larger than the grid scale and obtain relatively accurate results. However, due to the high Reynolds number and complex system of axial-flow pumps, LES consumes a significant amount of computing resources. It cannot meet the practical requirements of general engineering. The Reynolds-averaged Navier–Stokes (RANS) model is still the most commonly used model in the CFD industry. However, it does not consider the rotation and streamlined curvature effects [35,36]. Therefore, it should incorporate the rotation effect into the unsteady RANS (URANS) model [37,38,39,40]. There are several methods [40,41,42,43,44,45,46,47,48,49,50] to incorporate the rotation effect into the URANS model. Through verification by many scholars [38,39,40,41], the bifurcation approach is the more accurate. Therefore, using the URANS model with the bifurcation approach is feasible to simulate the flow field in fluid machinery.
In the present work, the bifurcation SST k ω model is used in the simulation, and the reliability of the model is verified in the numerical calculation of a water jet pump. Then, it is used to simulate the critical state of the axial-flow pump.

2. Mathematical Description

2.1. Governing Equations

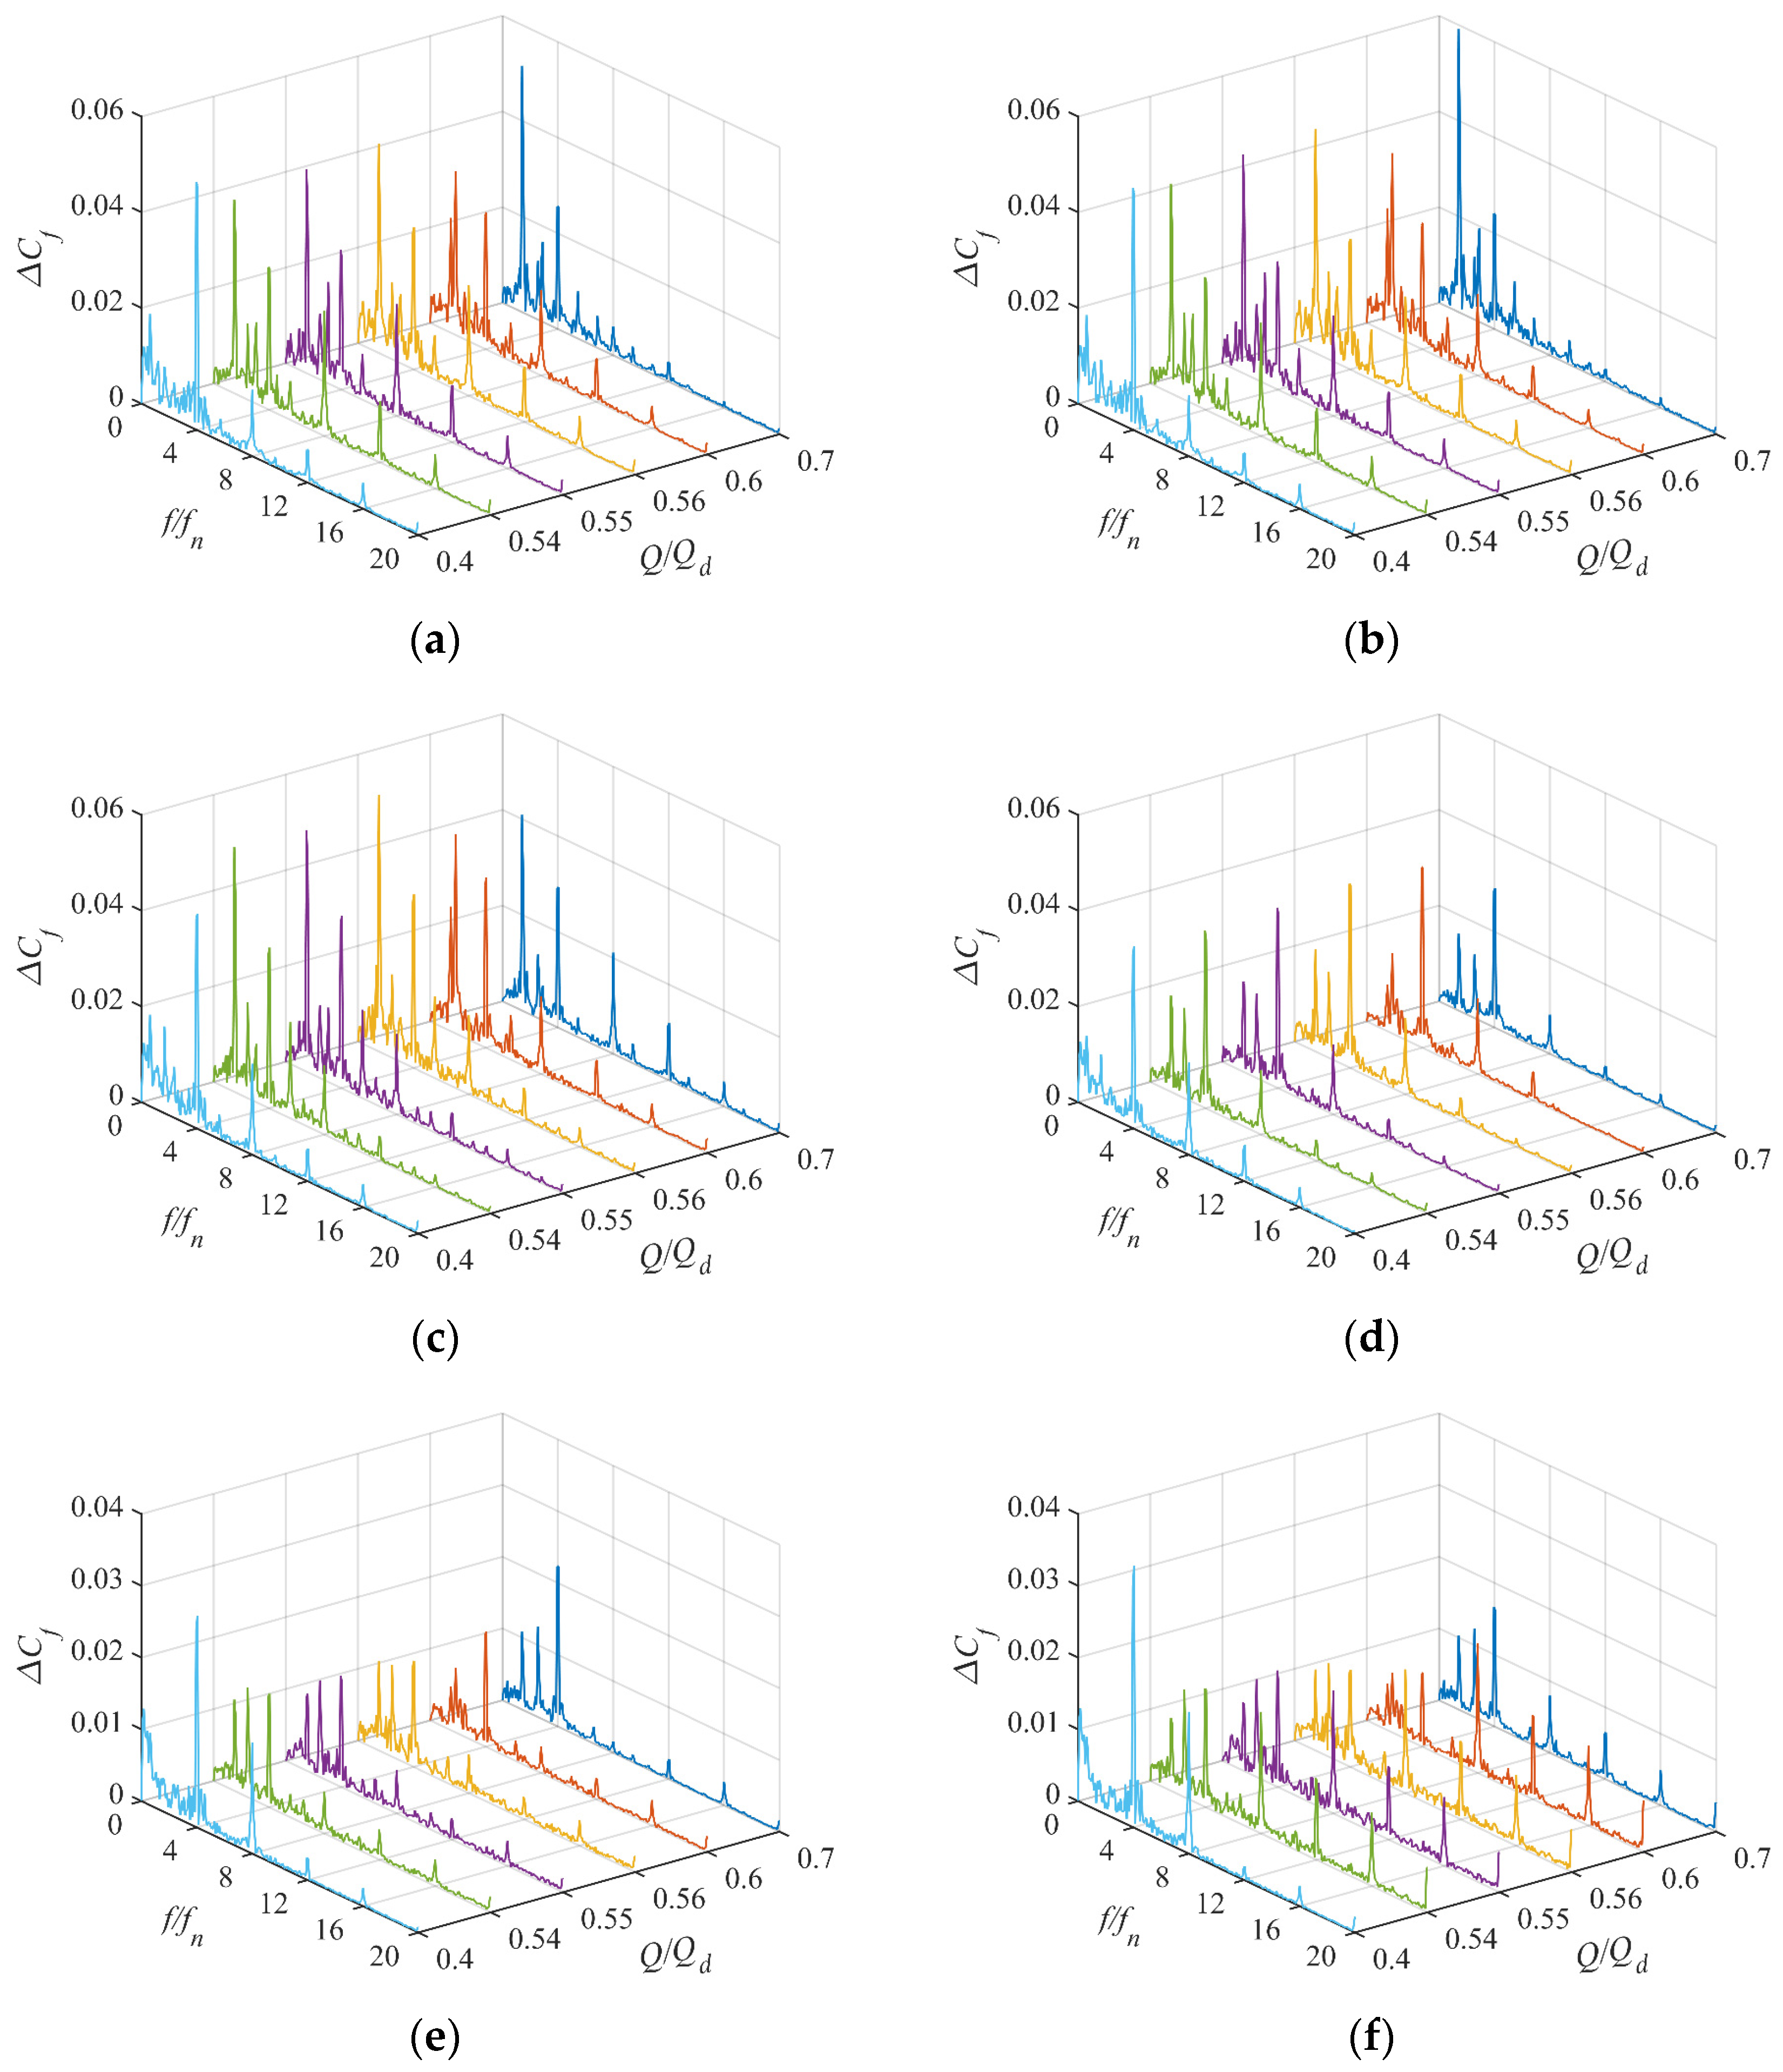
The governing equations are of the following form:
u ¯ i x i = 0
u ¯ i t + x j ( u ¯ i u ¯ j ) = 1 ρ p ¯ x i + ν 2 u ¯ i x j x j u i u j ¯ x j + S i
where u is the velocity, p is the pressure, ν is the kinetic viscosity, and S i is the source term. The line above the variables represents the average quantities.

2.2. Turbulence Models

2.2.1. The Original SST k–ω Model

The SST k ω model [51] is of the following form:
k t + u j k x j = P k β * k ω + x j ( ( ν + ν T σ k ) k x j )
ω t + u j ω x j = α ν T P k β ω 2 + 2 ( 1 F 1 ) σ ω 2 1 ω k x j ω x j + x j ( ( ν + ν T σ ω ) ω x j )
where F 1 is the blending function, the k ω model is used inside the boundary layer where F 1 = 1 , and the k ε model is used outside the boundary layer where F 1 = 0 , and where y is the distance to the closest wall node. The turbulent eddy viscosity is defined as follows:
ν T = C μ a 1 k max ( a 1 ω , S F 2 ) ,
where S is the invariant measure of the strain rate. The function F 2 controls Equation (5) and only works inside the boundary layer. Detailed forms of the F 1 and F 2 functions can be found in the literature [51]. A production limiter is used in the SST k ω model to prevent the build-up of turbulence in stagnation regions:
P k = μ t U i x j ( U i x j + U j x i ) P k = min ( P k , 10 β * ρ k ω ) .
The coefficients α , β , σ k , σ ω are blended in the k ε and k ω models using the blending function F 1 , for α , for example,
α = F 1 α 1 + ( 1 F 1 ) α 2 .
The subscript 1 represents the coefficients in the k ω model, the subscript 2 represents the coefficients in the k ε model. The constants are β = 0.09 , a 1 = 0.3 , C μ = 1 , α 1 = 5 / 9 , β 1 = 3 / 40 , σ k 1 = 0.85 , σ ω 1 = 0.5 , α 2 = 0.44 , β 2 = 0.0828 , σ k 2 = 1 , σ ω 2 = 0.856 .

2.2.2. The Modified Bifurcation SST k–ω Model (Named as BSkO Model)

In the incompressible homogeneous shear flow, in the k ε model, the k and ε equation of the model can be simplified to the following:
d k / d t = P ε ,
d ε / d t = ( C ε 1 P C ε 2 ε ) / T ,
where C ε 1 = 1.44 and C ε 2 = 1.92 . The dissipation rate ε = C μ k ω was inserted. Then, Equations (9) and (10) can be combined to be the following:
d d ( S t ) ( ε S k ) = ( ε S k ) 2 [ ( C ε 1 1 ) P R ( C ε 2 1 ) ] .
Setting the left side of Equation (10) as 0, with two equilibrium solutions result in two bifurcations. The detailed description of the coefficient derivation process can be found in the literature [40]. The final form of the bifurcation SST k ω model can be written as the following:
C μ = C μ ( 1 + γ 5 η 1 1 + γ 5 η 2 + γ 1 η 2 | η 3 | η 3 ) 1 1 + γ 2 | η 3 | + γ 3 η 3 1 + γ 4 | η 3 | .
The η i = 1 , 2 , 3 are the dimensionless velocity gradient invariants:
η 1 S i j * S i j * = 1 2 ( S k ε ) 2 , η 2 Ω i j * Ω i j * = 1 2 ( S k ε ) 2 ( 1 2 C r Ω F S ) 2 , η 3 η 2 η 1 .
The model coefficients γ i = 1 , 2 , 3 , 4 , 5 are given by
γ i = F 1 γ ω i + ( 1 F 1 ) γ k i .
The model coefficients are given by ( γ ω 1 , γ ω 2 , γ ω 3 , γ ω 4 , γ ω 5 ) = ( 0.062 , 0.8 , 0.4 , 0.4 , 0.025 ) and ( γ k 1 , γ k 2 , γ k 3 , γ k 4 , γ k 5 ) = ( 0.046 , 0.8 , 0.4 , 0.4 , 0.025 ) . A detailed description of the bifurcation SST k ω model can be found in the literature [40].

2.3. Calculation Method Verification

2.3.1. Computational Case

An axial water jet pump, namely, AxWJ-2, is utilized to validate the predictive capability of the BSkO model in the internal field of the pump. The simulation is conducted on the ANSYS CFX and compared with the experimental results in the literature [52]. The computational domain is similar to the experimental setup, as illustrated in Figure 1. The diameter of the inflow and rotor section is diameter (D) equal to 304.8 mm. The diameter of the outflow section is 0.7D. The rotor tip clearance is approximately 0.5 mm. The rotor and stator are configured with six and eight blades, respectively. The origin of the coordinate system is set in front of the rotor. Sections A and B are about 0.3D and 1.4D away from the zero in the Z-axis direction. Some extensions are added to the computational domain to minimize the boundary interference, resulting in a computational domain length of approximately 3D along the Z-axis.

2.3.2. Computational Setup

The entire axial water jet pump is divided into four parts, as illustrated in Figure 2, to generate the mesh. The unstructured tetrahedral grid is used in the inflow and outflow parts. The structured hexahedral grid is used in the rotor and stator parts. The mesh is refined near the sidewalls and rotor tip. The present work uses a grid with 8.33 million cells, and the average value for y+ is about 30, the same as in the literature [53]. A detailed description of the grid independence analysis can be found in the literature [53].
The total pressure and turbulence intensity of 5% is imposed on the inlet. The mass flow (determined by the experiment) is imposed on the outlet. The no-slip wall conditions are imposed on all physical surfaces of the pump. The rotor domain is set to rotate at 2000 r/min and use the interface models to connect to the stationary parts. The frozen rotor type is set for these interfaces in the steady-state calculation. The transient rotor–stator type is set for these interfaces in the transient calculation. A time step of 8.33 × 10⁻⁵ s (time for impeller rotation of 1°) was used to track the flow revolution to ensure computational accuracy and efficiency. The convergence criterion was set to a root mean square (RMS) residual level of 1 × 10⁻⁴ for pressure and velocity.

2.3.3. Results and Discussion

According to the experimental results, the non-dimensional flow coefficient (Q*), the head coefficient (H*), and the power coefficient (P*) are used to describe the operating conditions. A detailed description of the expressions for the parameters can be found in the literature [53].
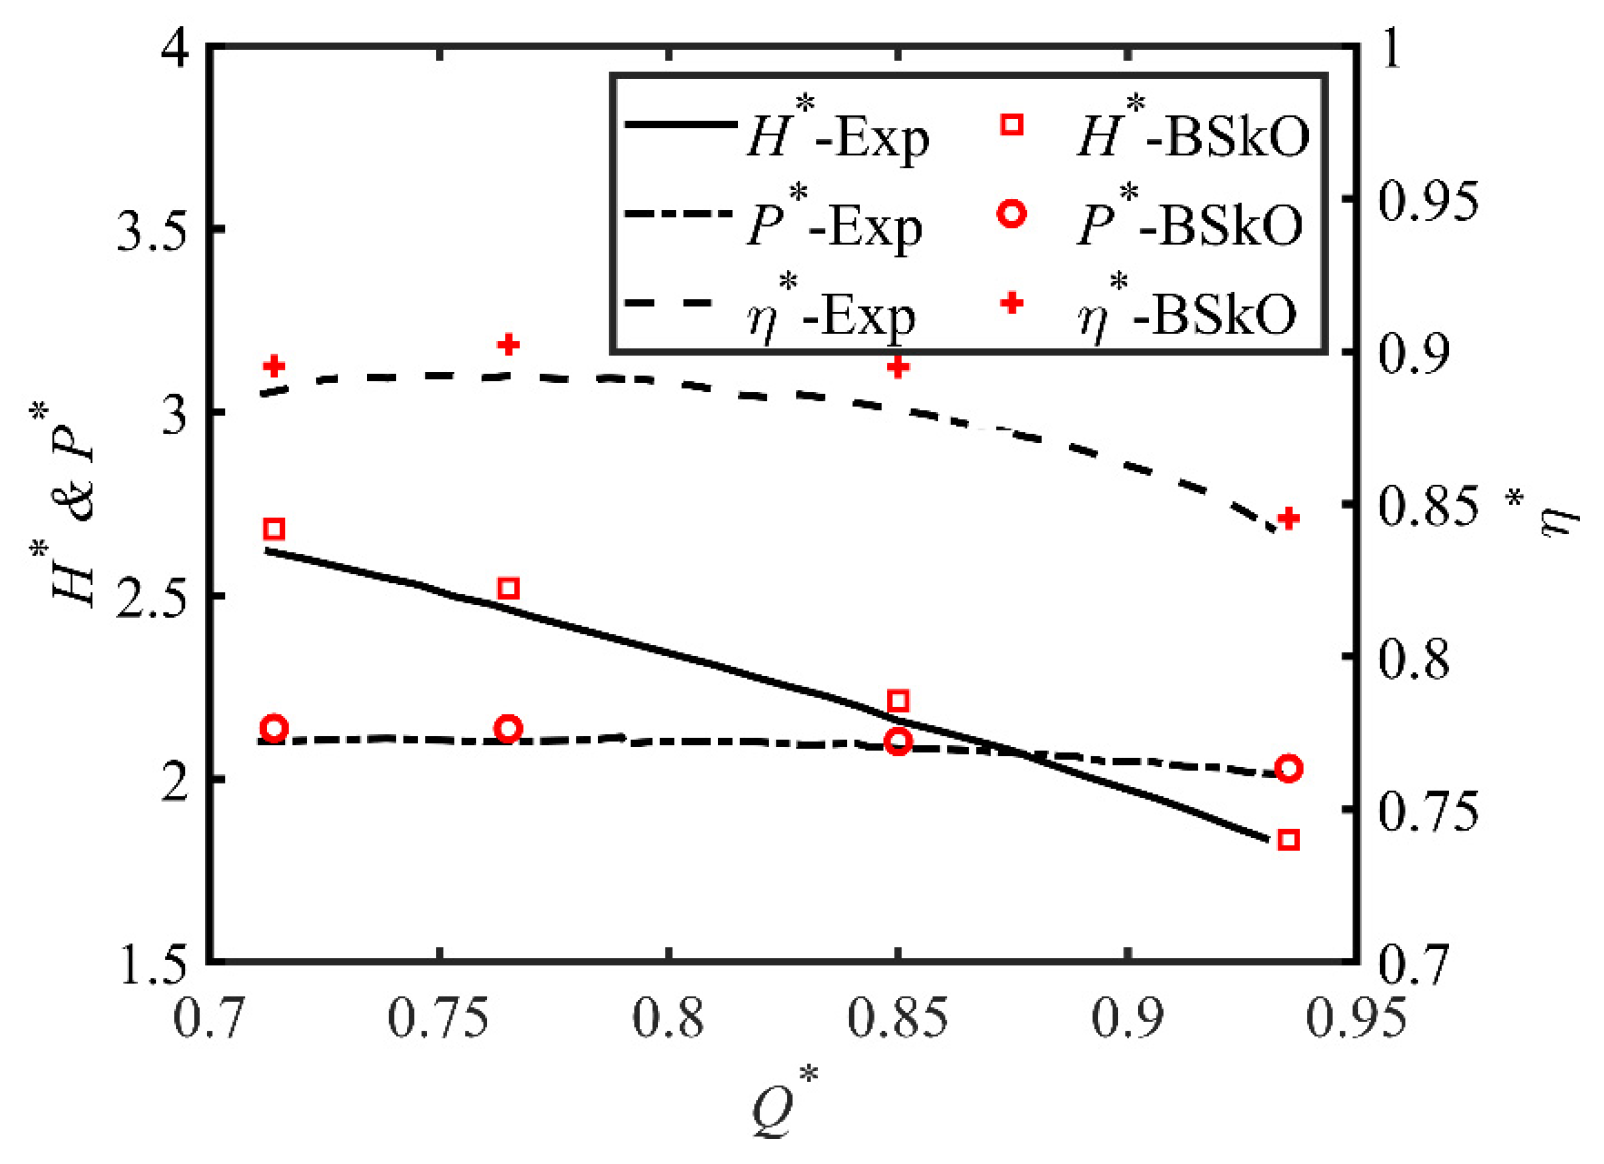
Figure 3 compares the performance curve of the BSkO model with the experiment result [52]. Overall, the results of the BSkO model agree well with the experiment results. The average relative error quantitative deviation of the head, efficiency, and power coefficients is 2.1%, 1.13%, and 1.27%, respectively. The maximum deviation is less than 2.6%, indicating that the calculation accuracy meets the requirements.
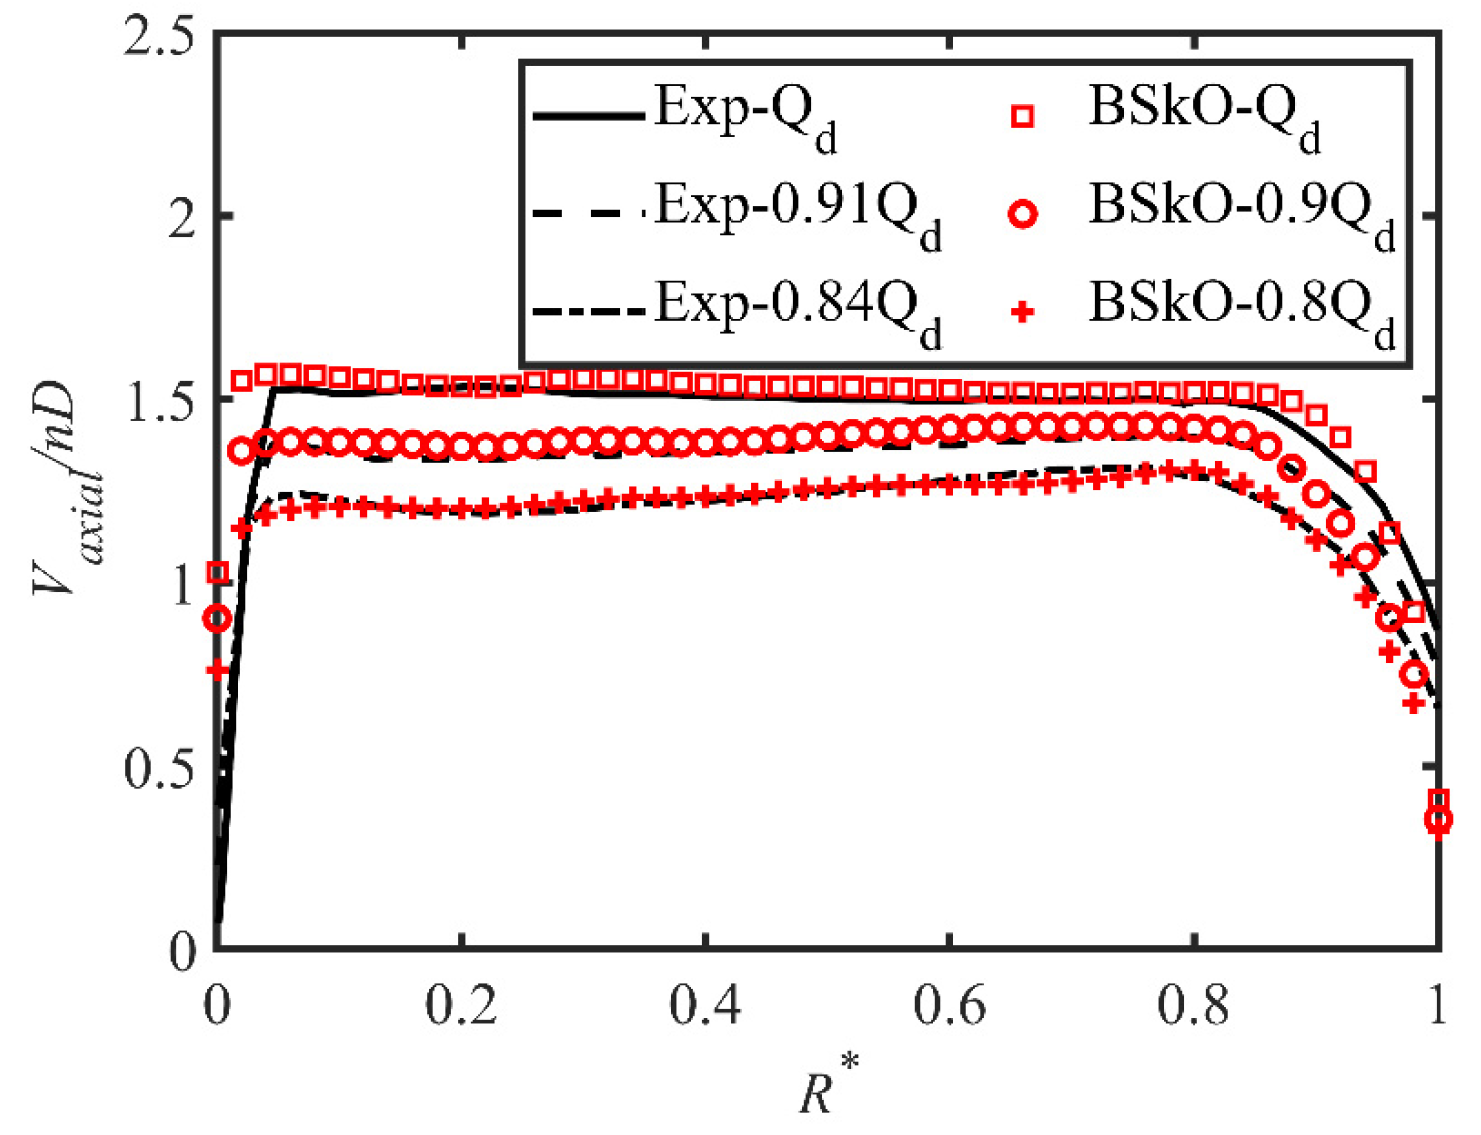
Figure 4 shows the axial velocity components along the radius of the rotor outlet section. The transient calculation was used to obtain this distribution, where the velocity components at the same radius were averaged along the circumference and subjected to dimensionless processing. The experimental results comprised axial velocity components under three different flow conditions, while the numerical simulation was used to calculate similar operating conditions. The dimensionless radius R is defined as follows:
R = r R h R c R h .
where r represents any radius position, Rh is the hub radius, and Rc is the shroud radius. The figure shows that the axial velocity at the rotor outlet increases with flow rate, with a relatively uniform distribution along the radius. However, a 10% to 20% decrease in velocity is observed near the blade tip, particularly under low-flow conditions. Furthermore, the calculated velocity components exhibit a faster decrease in the near hub region with R* < 0.1 as the radius decreases. Considering the strength of the connection between the blade and the hub wall, the transition zone from the blade surface to the hub surface was chamfered [54]. Nonetheless, the numerical simulation calculation model did not incorporate the rounded part, resulting in differences in the axial velocity components near the hub.
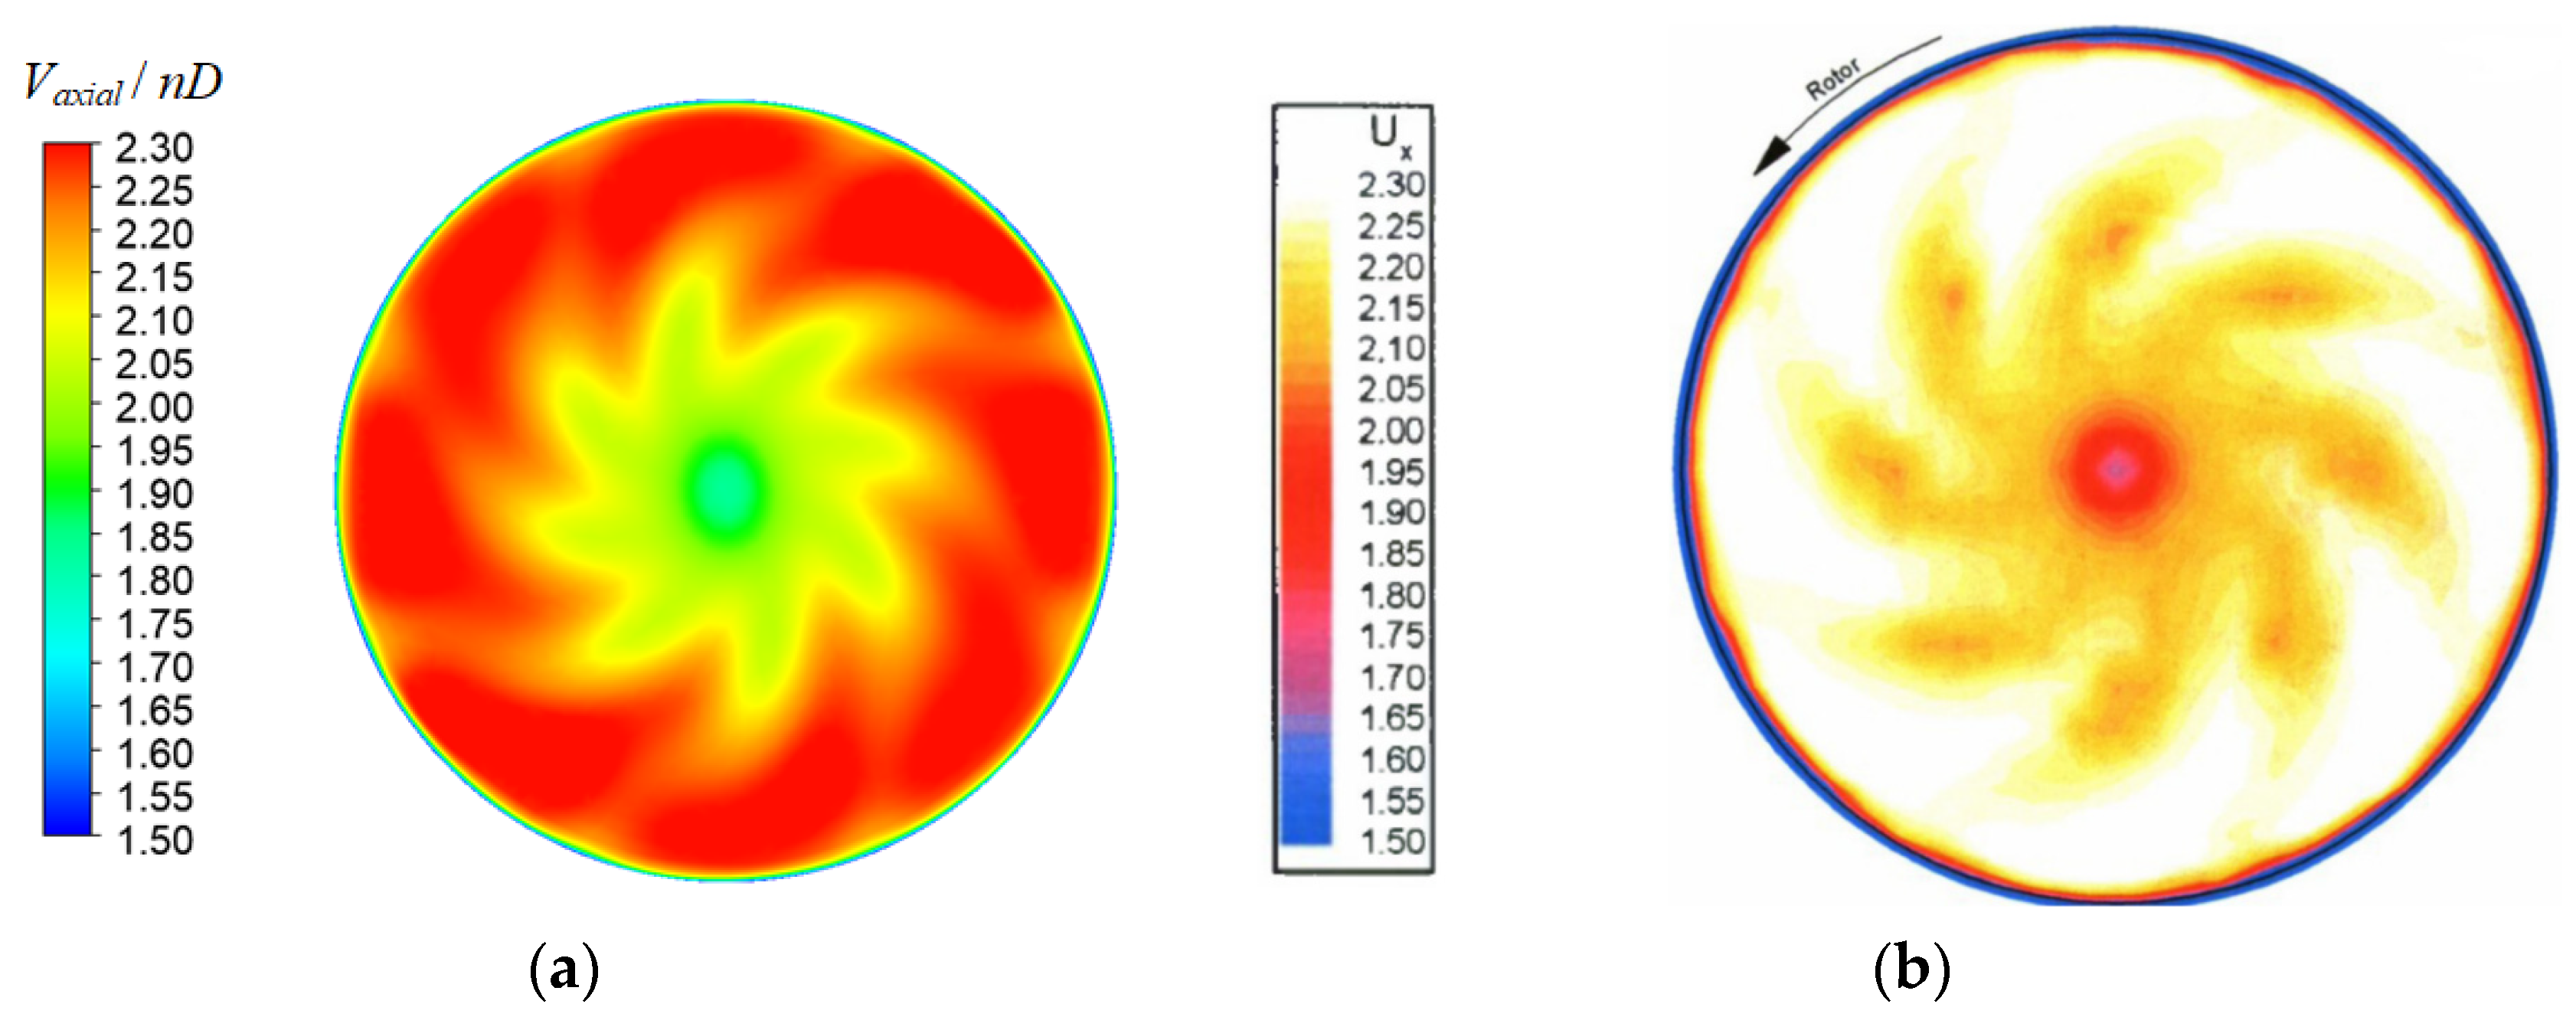
Figure 5 shows the contour plot of the axial velocity at the outlet section, which is made dimensionless with nD. The velocity contour plot on the outlet section reflects the distribution of the stator wake flow field. Figure 5 shows the area that presents eight low-speed wake regions corresponding to the stator blades. Overall, the velocity value increases with the radius, and a peak velocity appears near the axis within a small radius range. The shroud side is affected by the wall, which results in a decrease in velocity.
Therefore, in terms of the overall flow field prediction effect, the numerical simulation calculation results demonstrate relatively high reliability, which directly reflects the rationality of numerical simulation in predicting the rotor outlet and outlet flow fields of the stator. These results can be utilized for further research.

3. Numerical Simulation

3.1. Case Description and Computational Setup

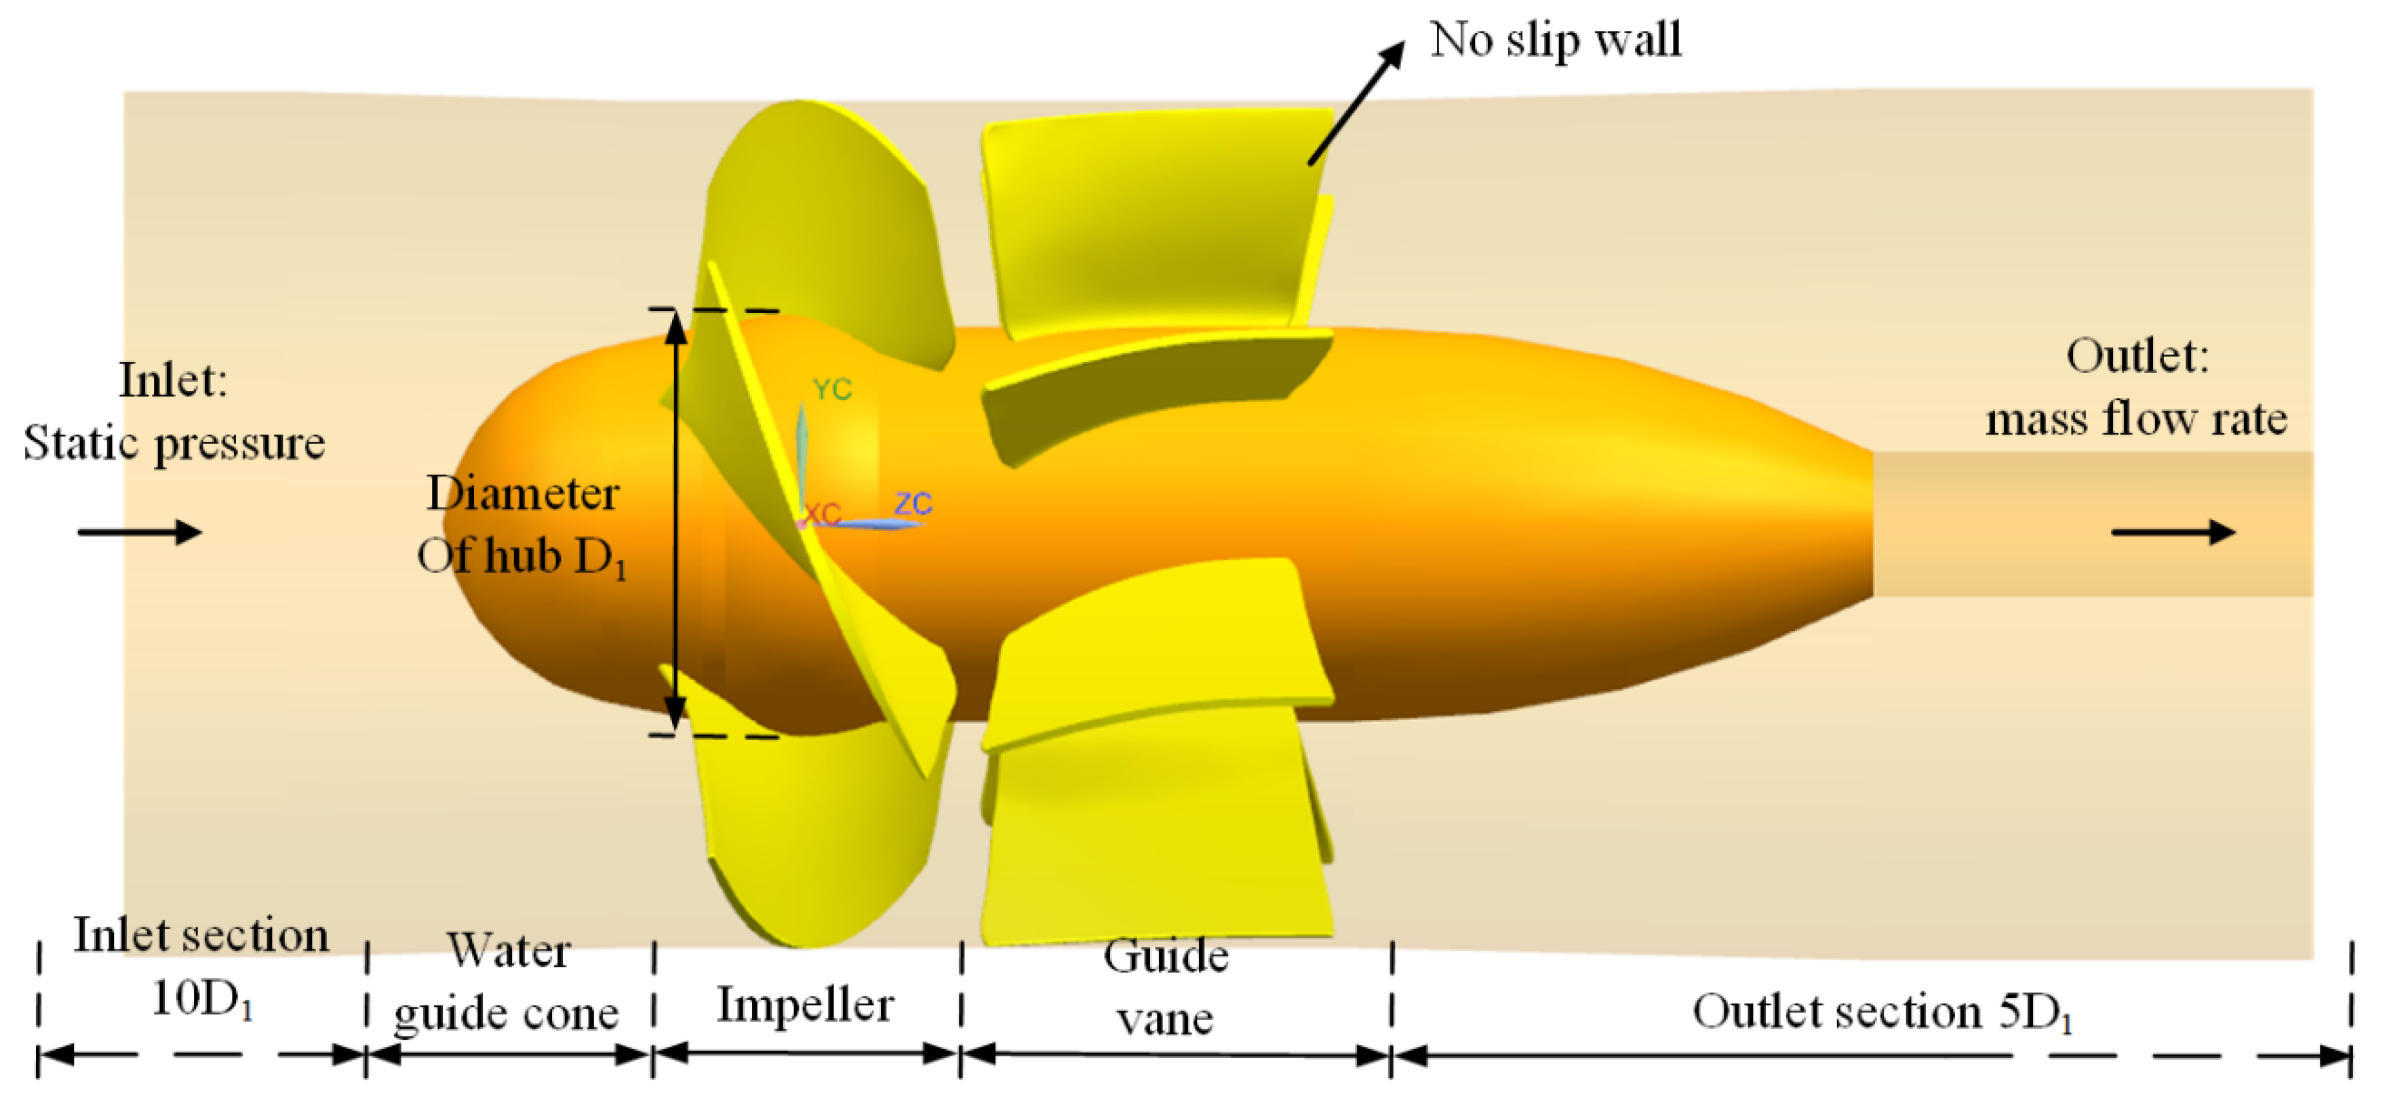
In this study, the numerical simulation was performed using an axial pump (ZLQ-6) as the test subject. The computational domain is divided into five parts, as shown in Figure 6. The diameter (D1) of the hub is 820 mm, and the diameter of the shroud is 1640 mm. The length of the inlet and outlet sections is 10 D1 and 5 D1, respectively. There are four and seven blades in the impeller and guide vane, respectively.
The static pressure and turbulence intensity of 5% is imposed on the inlet. The mass flow is imposed on the outlet. The no-slip wall conditions are imposed on all walls of the pump. In this case, Multiple Reference Frame (MRF) is used. The impeller domain is set to rotate with 250 r/min and use the interface models to connect to the stationary parts, similar to the numerical simulation of the water jet pump. The time step 6.667 × 10⁻⁴ s (time for impeller rotation of 1°) is used in the simulation, and the RMS residual level of 1 × 10⁻⁴ is the convergence criterion. The discretization of the equations is also the same as the water jet pump.
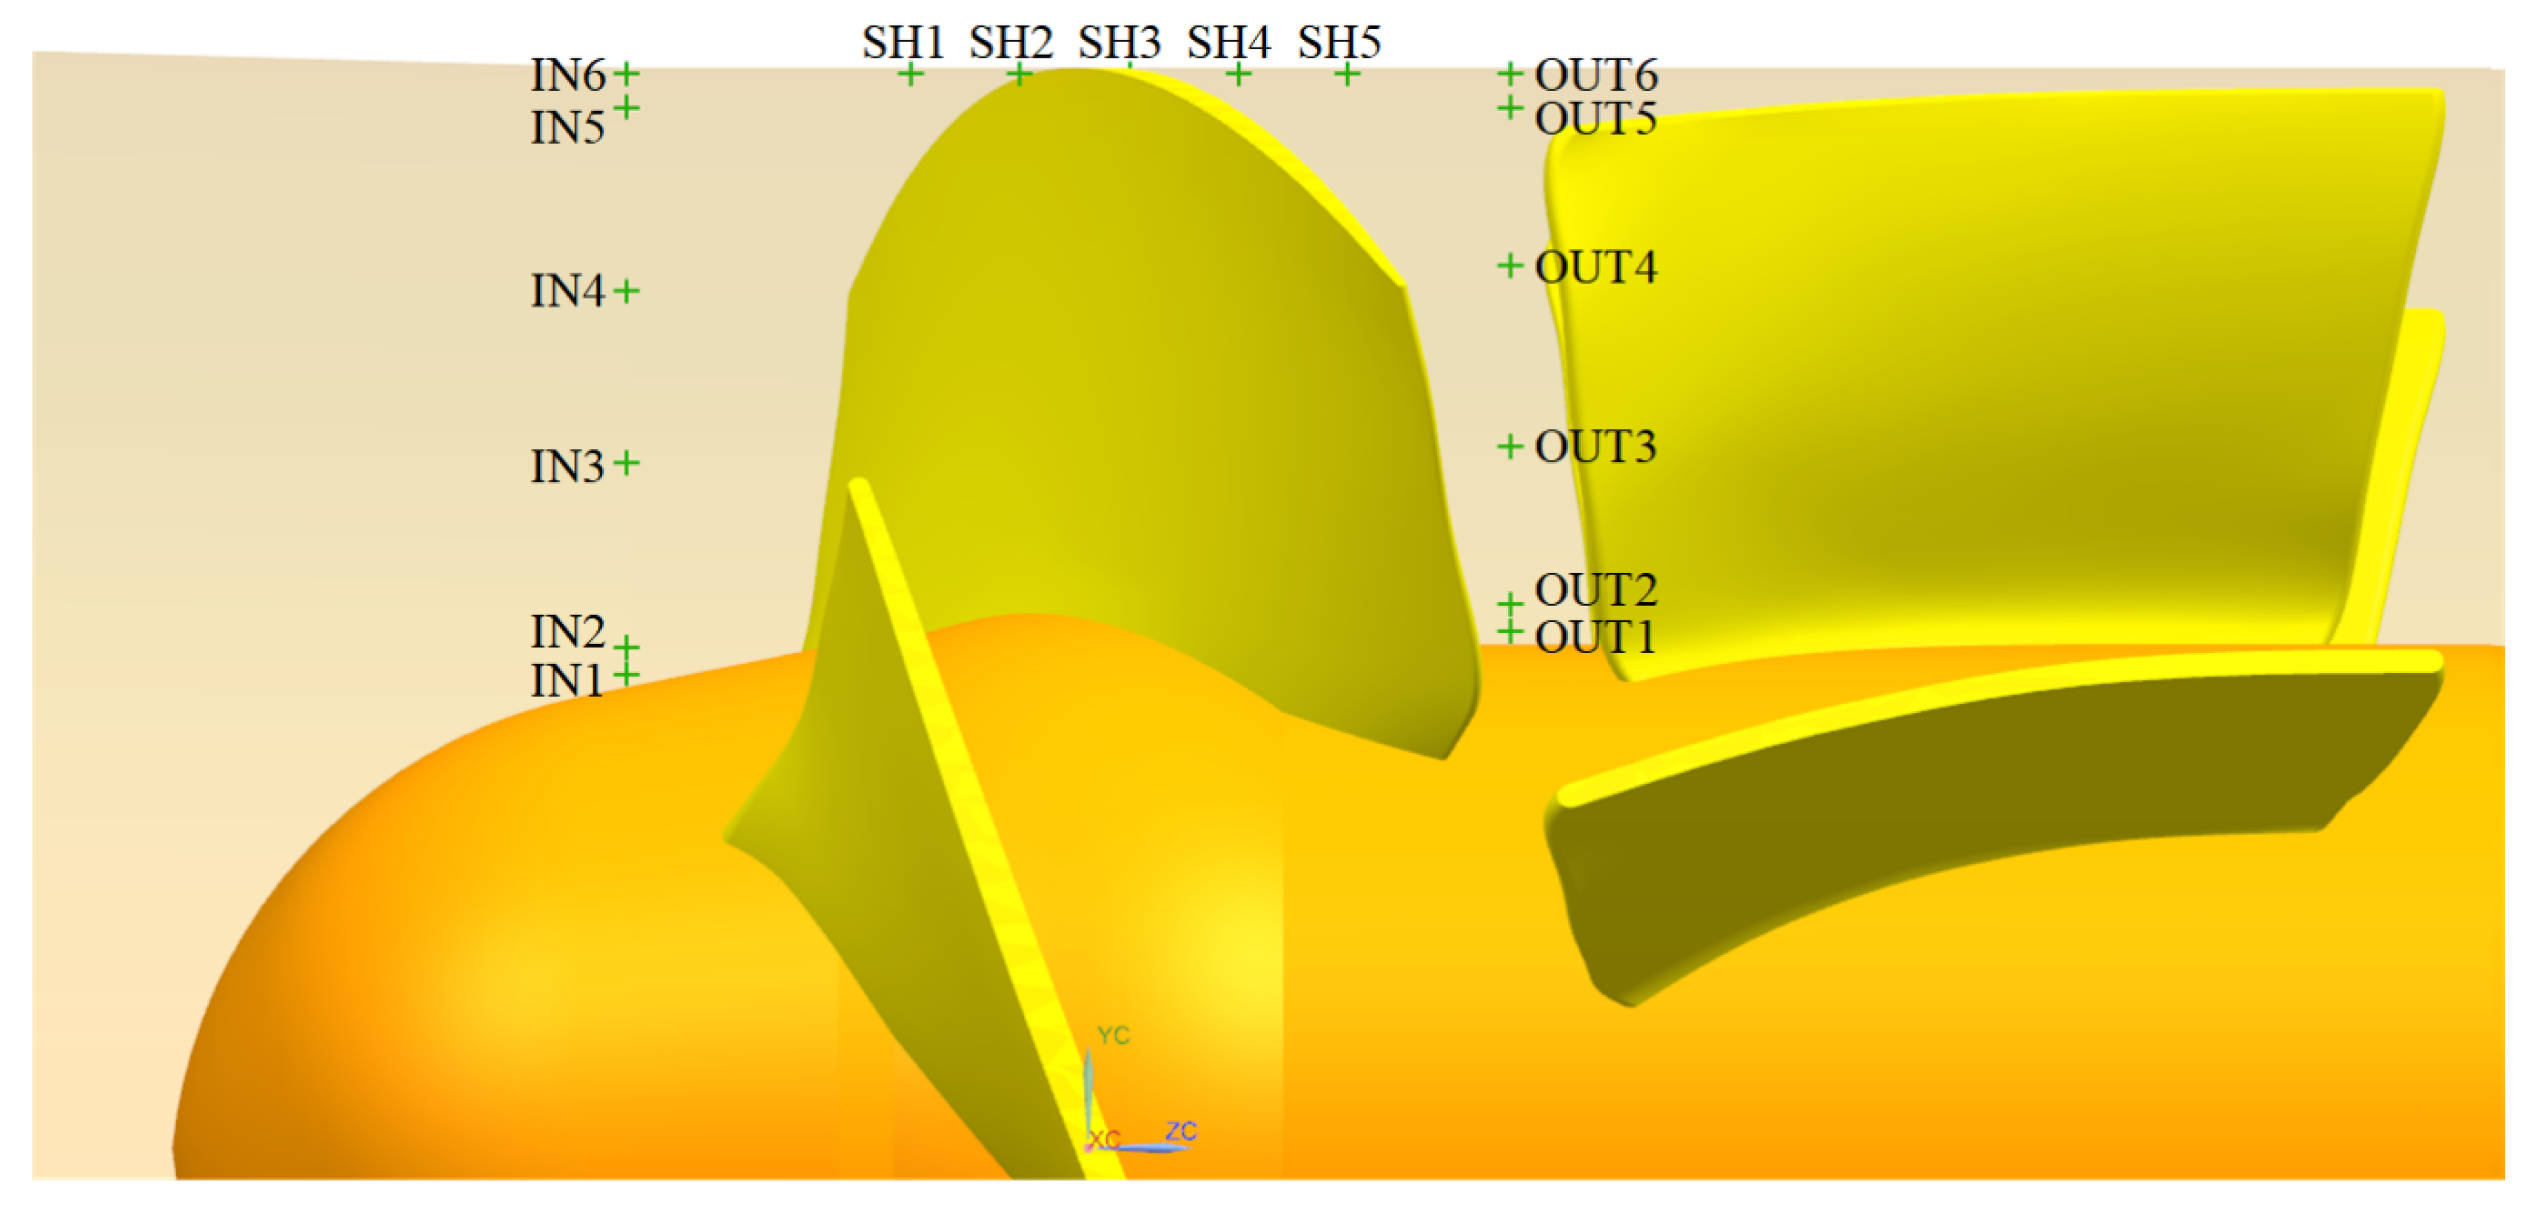
Figure 7 depicts a schematic diagram showing the locations of the fixed monitoring points, which include six points along the radius of the impeller inlet (IN1-IN6), impeller outlet (OUT1-OUT6), and five points along the Z-axial direction of the impeller (SH1-SH5).
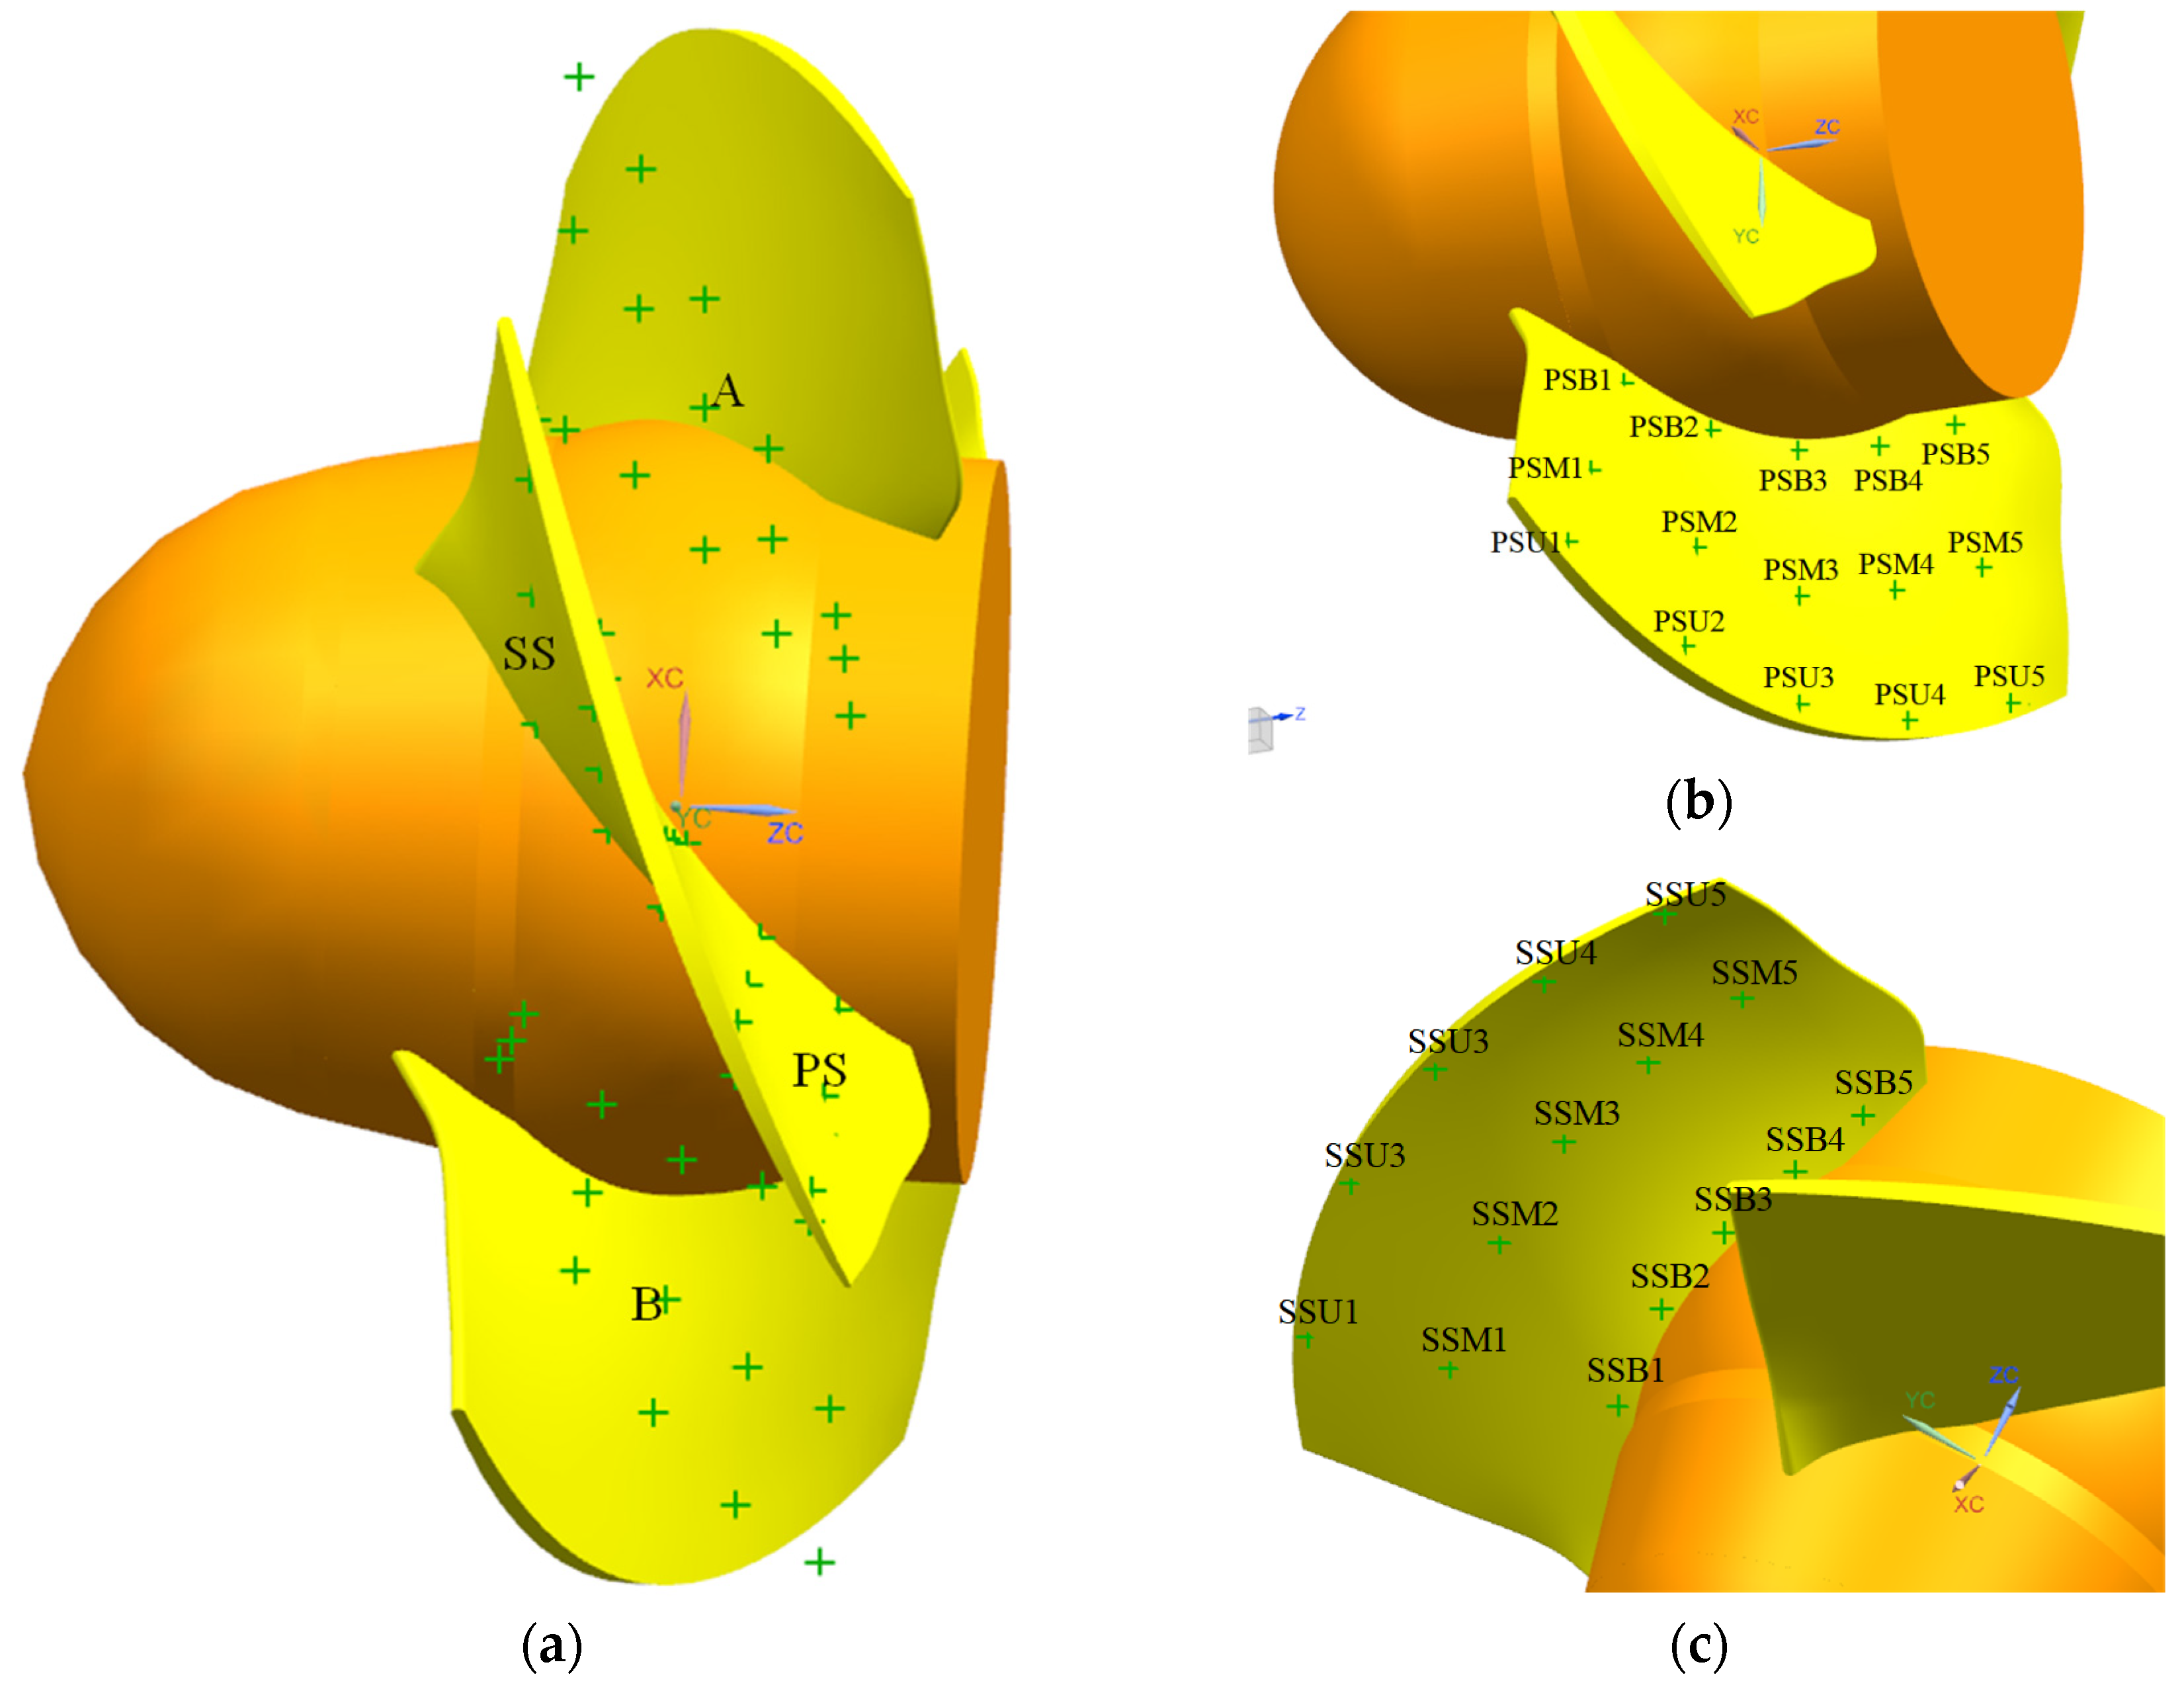
Figure 8a shows that the rotating monitoring points were arranged on the blade surface and impeller passage, with each point located within the rotating coordinate system of the impeller motion and the relative position of the impeller remaining unchanged to understand better the internal flow field effects on the pressure fluctuation characteristics. Figure 8b shows the monitoring points blade was divided into three rows on the pressure surface (PS), comprising fifteen pressure monitoring points, with PSB1-PSB5 situated near the hub, PSM1-PSM5 situated near the middle of the blade, and PSU1-PSU5 near the shroud. Similarly, Figure 8c shows the fifteen pressure monitoring points on the suction surface (SS), denoted as SSB1-SSB5, SSM1-SSM5, and SSU1-SSU5. Furthermore, passage A (APAS) and passage B (BPAS) were outfitted with fifteen pressure monitoring points each, designated as APASB1-APASB5, APASM1-APASM5, APASU1-APASU5, BPASB1-BPASB5, BPASM1-BPASM5, and BPASU1-BPASU5. The Z coordinates of each point corresponded to SH1-SH5.
Calculate the pressure fluctuation coefficient Cf based on the values at each monitoring point, defined by
C f = p p ¯ 0.5 ρ u 2 2 .
where p is the pressure at a certain time, p ¯ is the average pressure, u2 is the impeller outlet circumferential velocity, and ρ is the density.
Similarly, the pressure coefficient Cp is defined as
C p = p p ¯ i n 0.5 ρ u 2 2 ,
where p ¯ i n represents the average pressure at the inlet section.

3.2. Mesh Generation and Validation

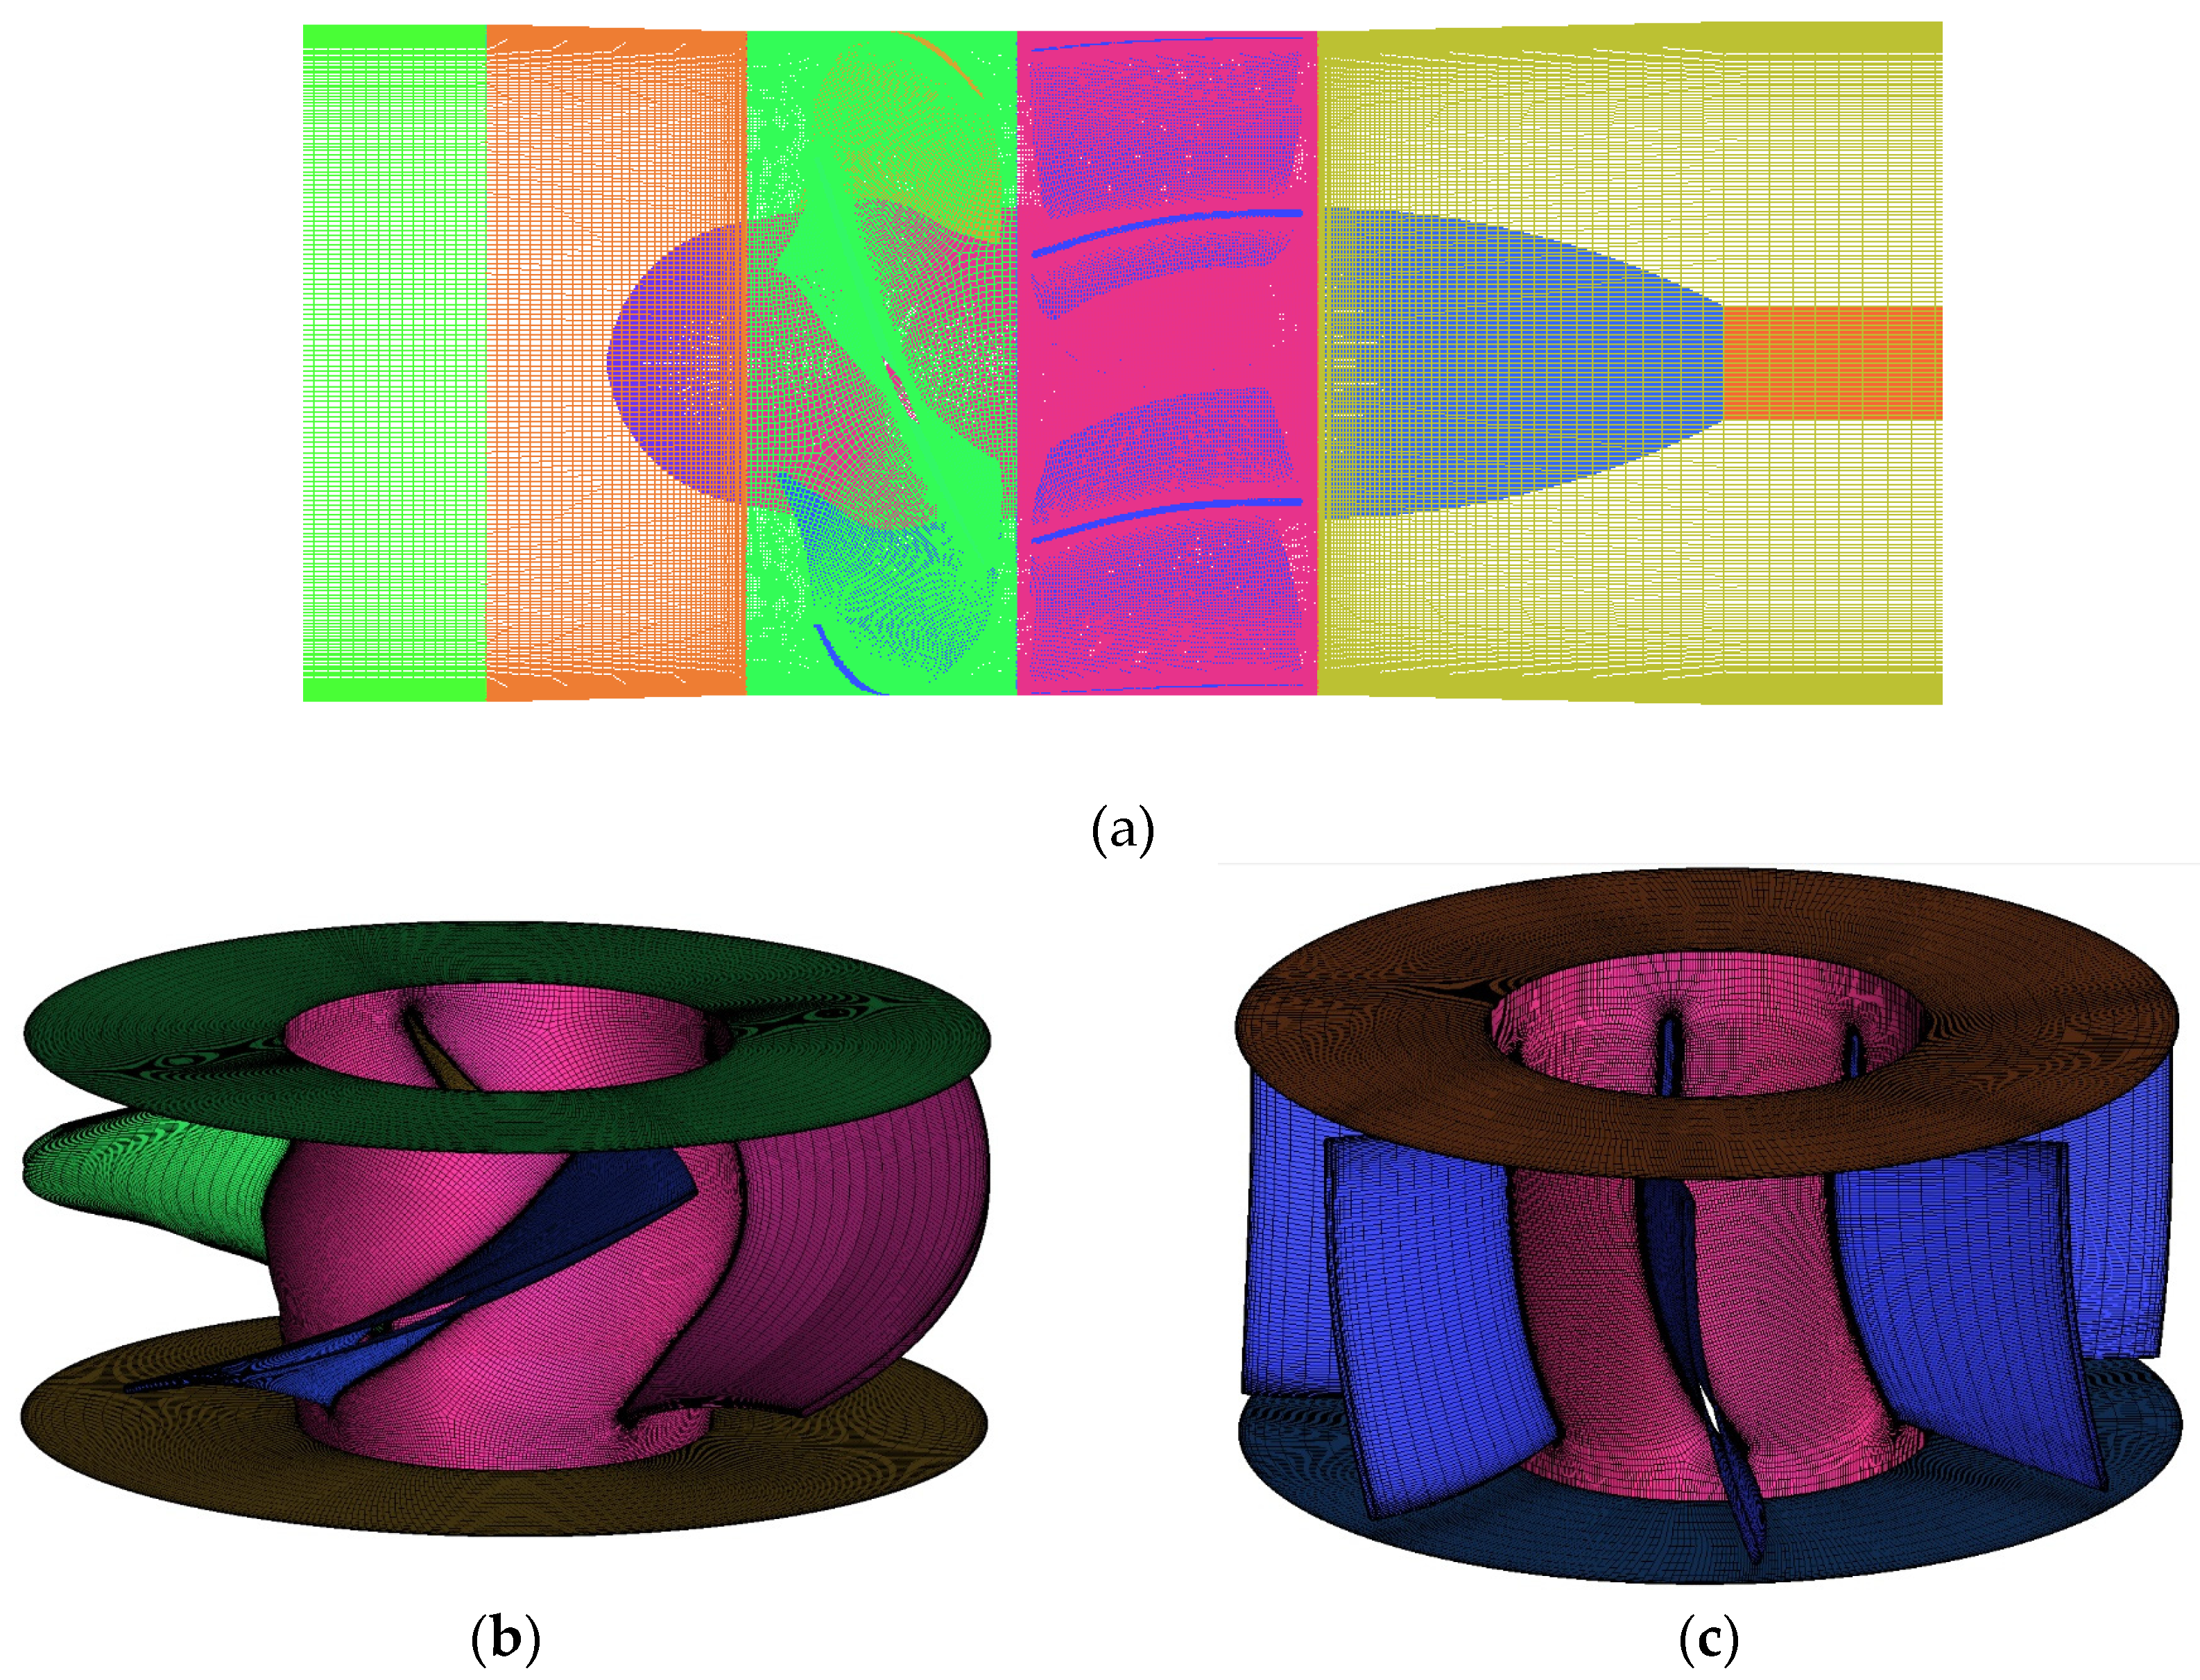
Figure 9 shows the grid used in the simulation. Figure 9a shows that there are five parts of the axial pump. The structured hexahedral grid is adopted on the full pump and with a mesh refinement near the wall. Figure 9b,c show the local mesh for certain parts.
The discretization error estimation was performed using the grid convergence index (GCI) method [55]. This method has been extensively evaluated over several hundred computational fluid dynamics (CFD) cases [53,56]. According to the recommendations of the GCI method, three kinds of grids (i.e., 12.789 million, 5.678 million, and 2.429 million) were applied to the numerical simulation to calculate key variables (φ). The head (H) and efficiency (η) of the pump performance parameters were treated as key variables for some important flow rate conditions (0.55Qd, 0.6Qd, and 1.0Qd, where Qd represents the design flow rate).
The three sets of grids were classified as fine, medium, and coarse meshes, with subscripts 1, 2, and 3, respectively. The simulation results were obtained as φ1, φ2, and φ3. Based on Richardson extrapolation [57], an extrapolated value of φext of fine mesh results can be solved by iteration. Table 1 shows the results of the discretization error. The results indicate that the extrapolated relative errors (eext) were lower than 2%, except for the H at 1.0Qd. At the same time, the fine-grid convergence index (GCIfine) was lower than 1%.
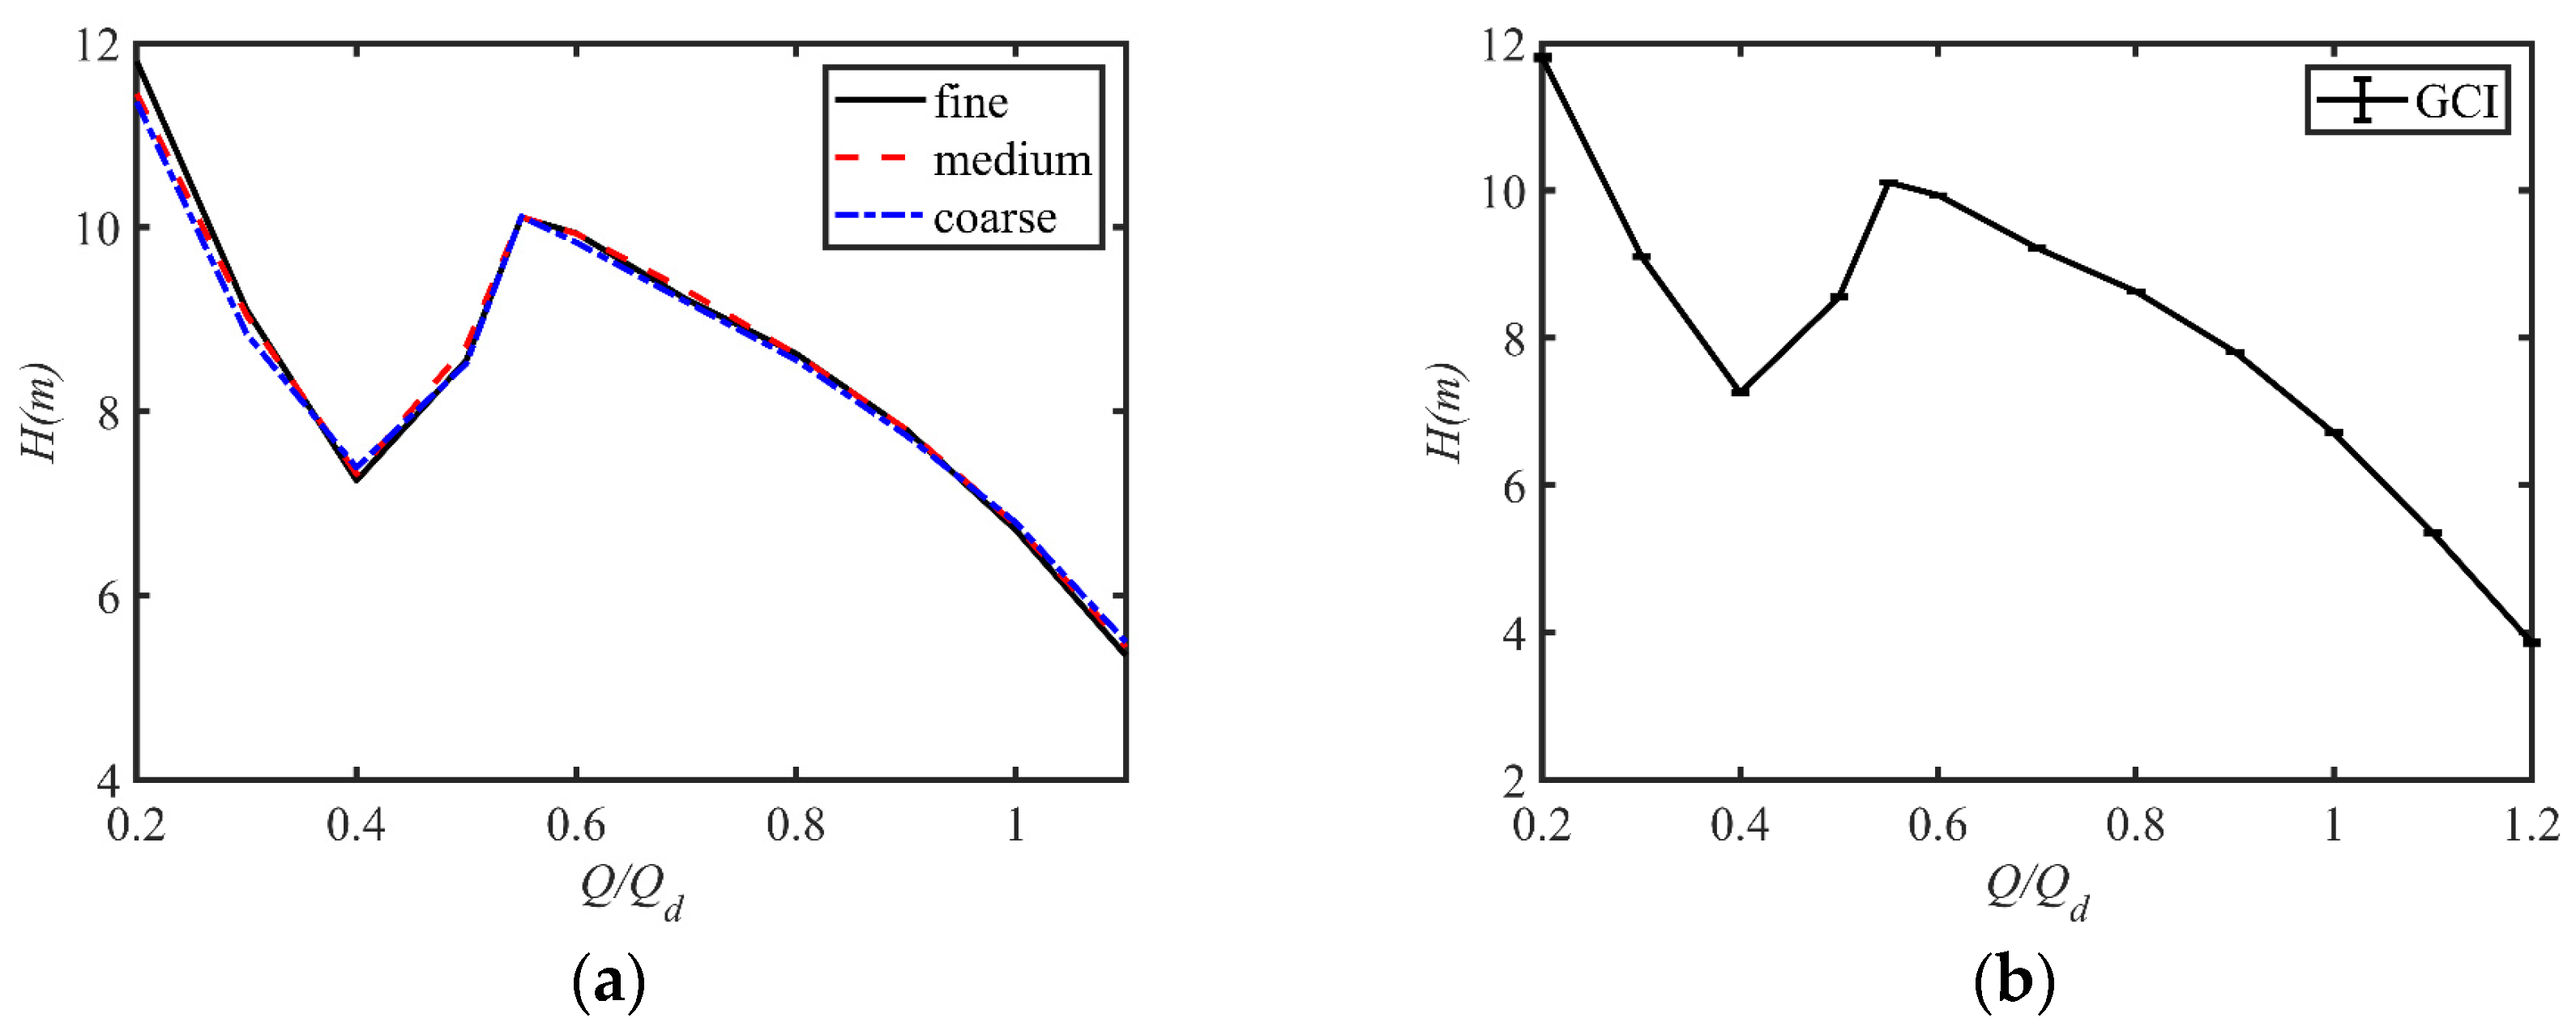
Figure 10a shows the head-flow curves of three distinct sets of grids. The numerical results obtained from these grids exhibit a high degree of similarity. To further evaluate the grid convergence, the GCIfine was calculated for all flow rate conditions and plotted as error bars in Figure 10b. The maximum value of GCIfine is less than 1.5%, indicating that the fine-grid solution suits this study. Therefore, the fine grid with 12.789 million cells is chosen for the present work. The near-wall flow is solved using the wall function, with an average value of y+ of approximately 18 on the blade wall.

4. Results and Discussion

4.1. The Internal Flow Pattern of the Impeller

Figure 10a shows that the head decline occurs at 0.55Qd. According to the research of Goltz et al. [24], 0.55Qd can be preliminarily considered the critical state. Therefore, the present study focuses on working conditions near 0.55Qd, specifically 0.6Qd, 0.56Qd, 0.55Qd, and 0.54Qd. In addition, conditions 0.7Qd and 0.4Qd are compared with critical state conditions.
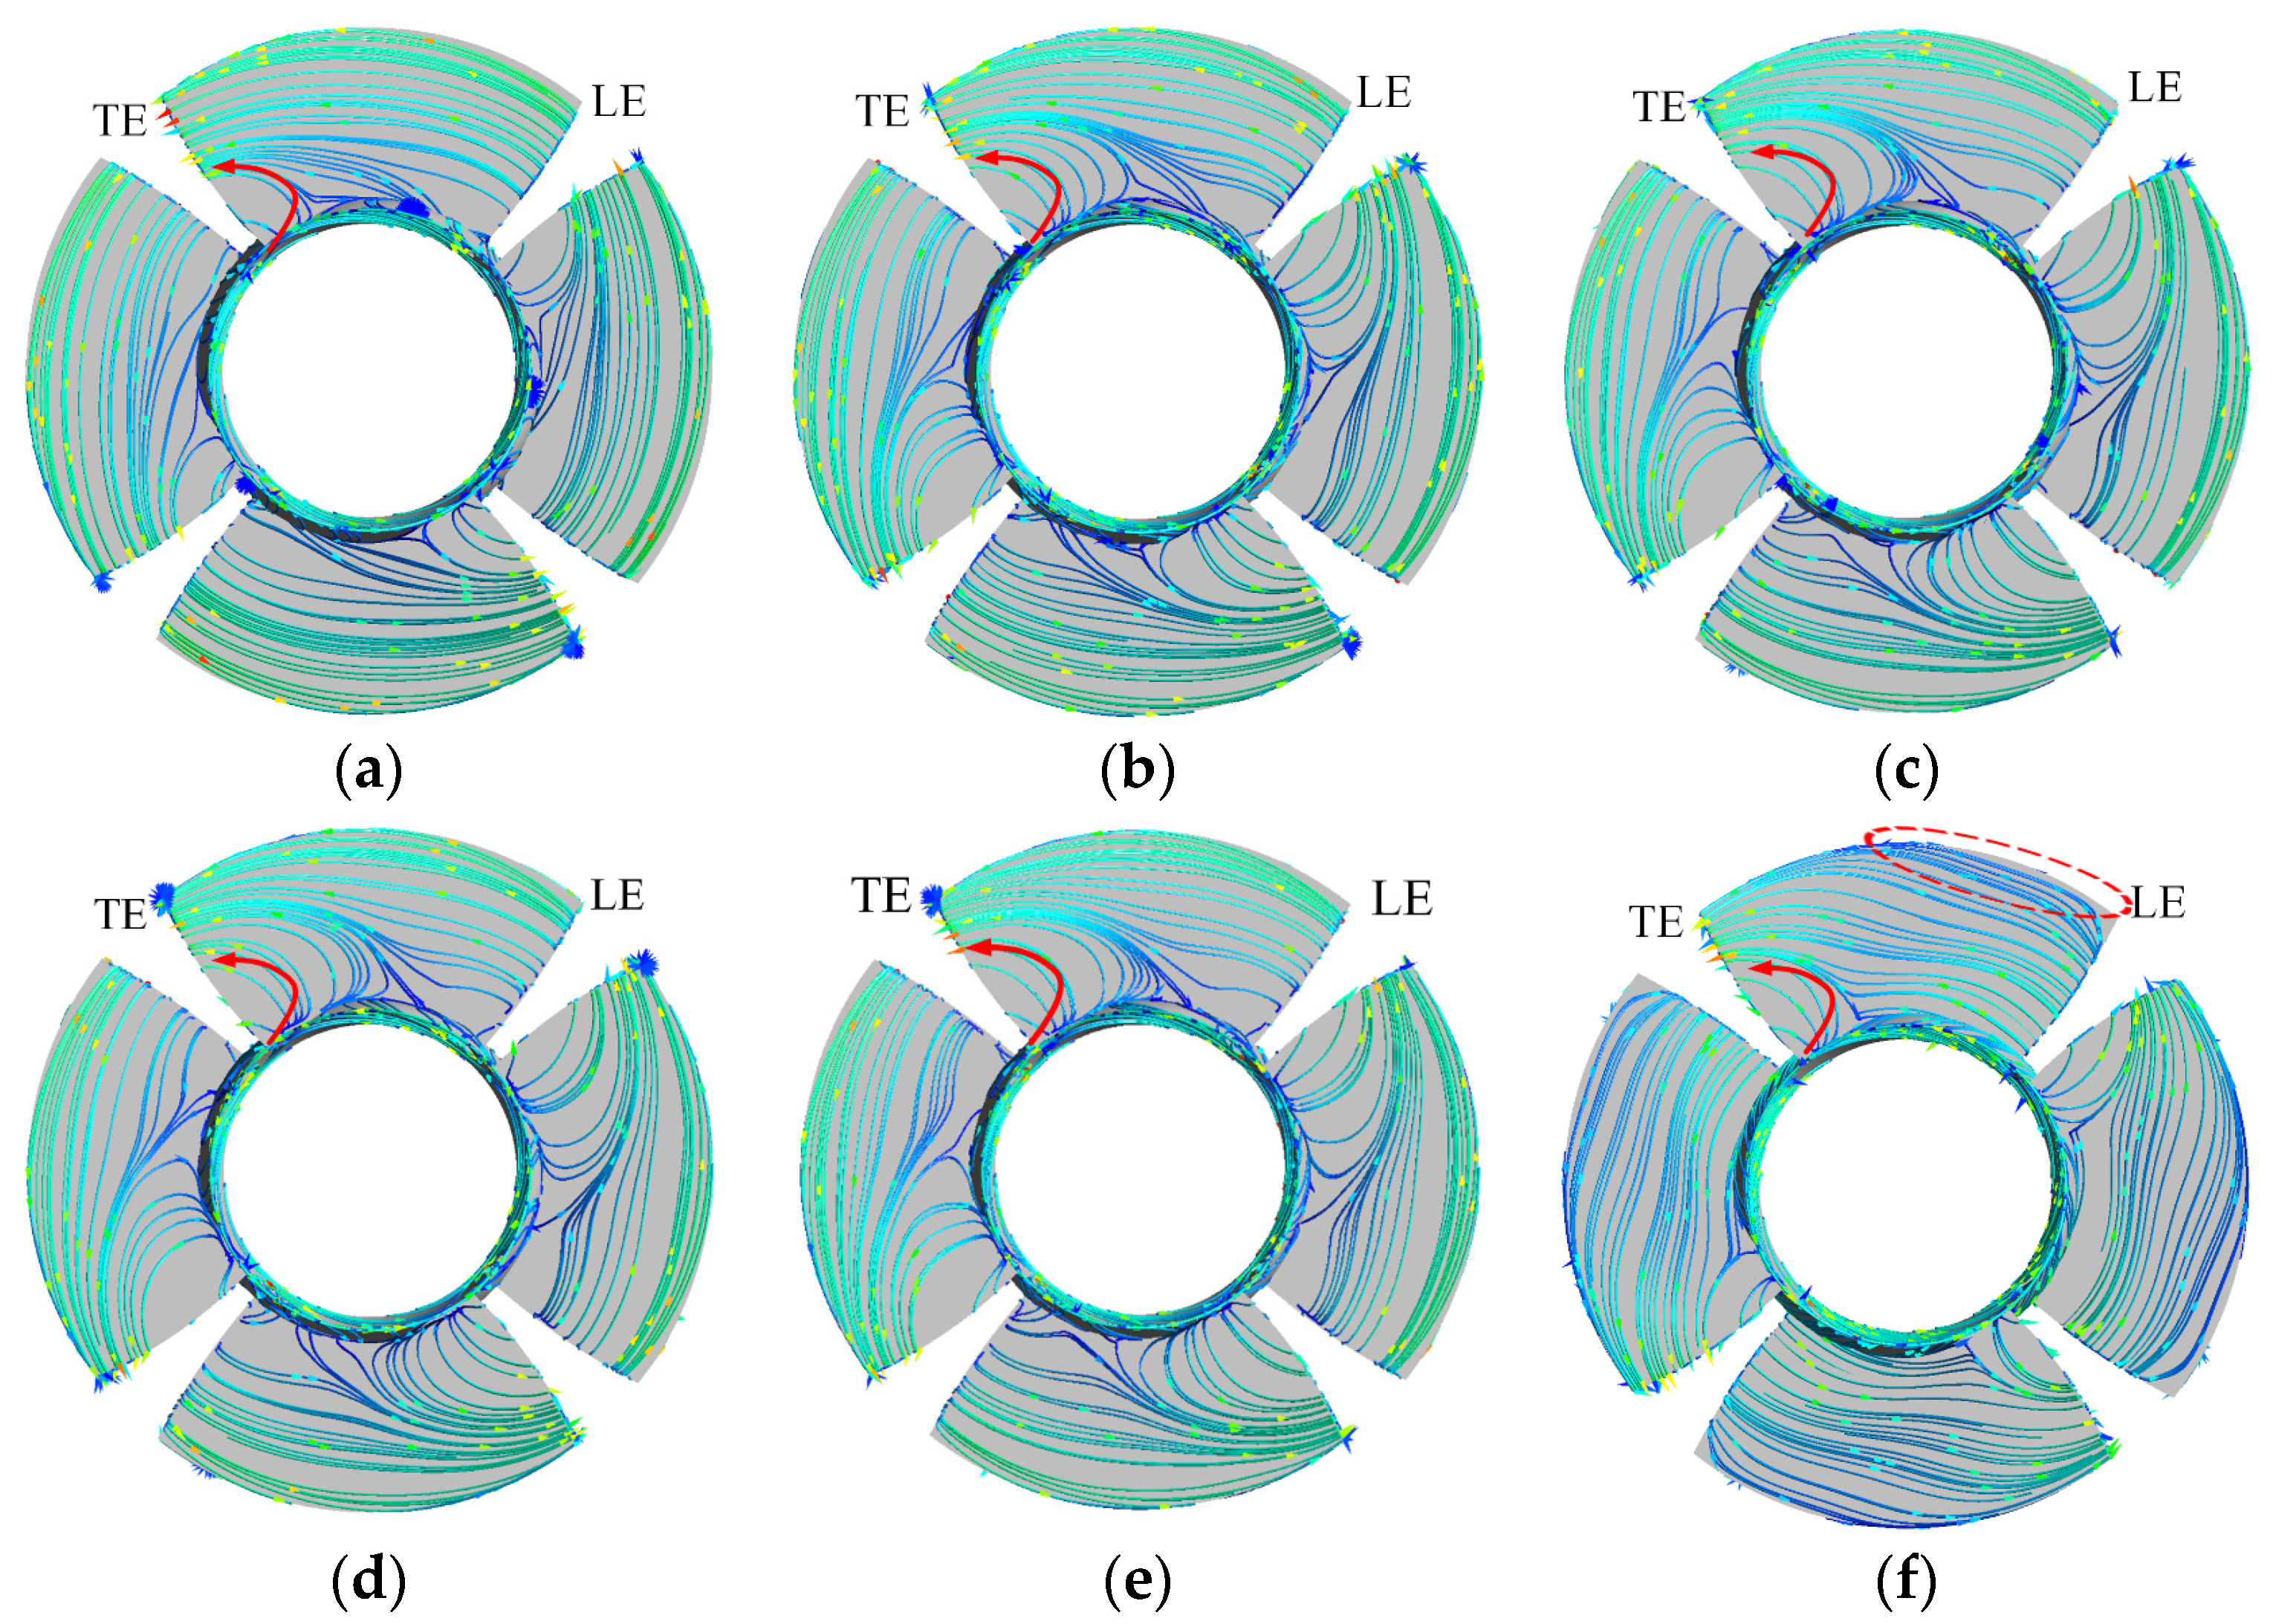
Figure 11 shows the surface streamline of the PS at different flow rates, which near the shroud exhibits a smooth profile without any apparent separation flow, except for the 0.4Qd. However, the inverse pressure gradient between the impeller and guide vane intensifies as the flow rate decreases. The trailing edge (TE) of the blade near the hub generates a TE backflow, which collides with the PS of adjacent blades and manifests as radial flow from the hub to shroud on the PS. Furthermore, the streamlined distribution of the PS remains similar across all conditions, indicating that the flow structure caused by TE backflow remains relatively unchanged.
Figure 12 shows the surface streamline of the SS at different flow rates. Compared with the results of the PS, the biggest difference is that the streamline near the shroud changes significantly with the flow rate decrease. There is a small leading-edge separation vortex (LESV) in the leading edge (LE) of the SS near the shroud at 0.6Qd, similar to the results of the critical condition in Goltz’s [24] experiment. Then, as the flow rate decrease, its range expands. At 0.4Qd working condition, in addition to the LESV, obvious backflow also appears at the TE of the SS near the shroud.
As shown in Figure 11 and Figure 12, the flow near the shroud on SS shows obvious difference at different flow rates. Therefore, the circumferential unfolding diagram is established for further study. Figure 13 shows the circumference unfolding diagram at the radial position r/R = 0.98. When r/R = 1 is the shroud and r/R = 0 is the hub.
Figure 14 shows the internal flow of the spanwise section of the blade at different flow rates. The flow pattern is smooth and orderly at 0.7Qd, as Figure 14a depicts. The red arrow indicates that the flow moves along the blade surface, and only a minor shedding flow occurs at the TE of the SS, as shown by the black arrow. Notably, there is no backflow at the LE of the SS. In contrast, at 0.6Qd, as illustrated in Figure 14b, a small backflow appears at the LE of the SS, forming a LESV, as shown by the magenta arrow. It is consistent with the results in Figure 12b. The flow in the impeller is relatively smooth and orderly, and the blade trailing edge shedding flow (TESF), shown by the black arrow, quickly merges with the mainstream. Figure 14b,e shows that the region of the LESV, shown by the magenta arrow, increases as the flow rate decreases. Meanwhile, the flow in the impeller near the PS is relatively stable, and the range of the TESF is expanding, thereby impacting the mainstream flow. Figure 14f shows that at 0.4Qd, the backflow area of the LE of the SS is substantial. Furthermore, a large range of backflow areas appears at the TE of the SS, flowing towards the LE, as indicated by the green arrow. In addition, there is a flow in the impeller passage from the TE of the SS to the LE of the PS of the adjacent blade, as shown by the purple arrow. This flow structure is similar to the structure of the tornado-like separation vortex (TLSV) observed in Goltz’s [24] experiment under the deep stall condition. The existence of TLSV obstructs the flow and impairs the operation of the axial-flow pump. As the blue arrow indicates, a portion of the mainstream is squeezed out, resulting in a large backflow at the inlet of the impeller.
The Q-criterion is used in the present study:
Q = 1 2 ( Ω i j Ω i j S i j S i j ) .
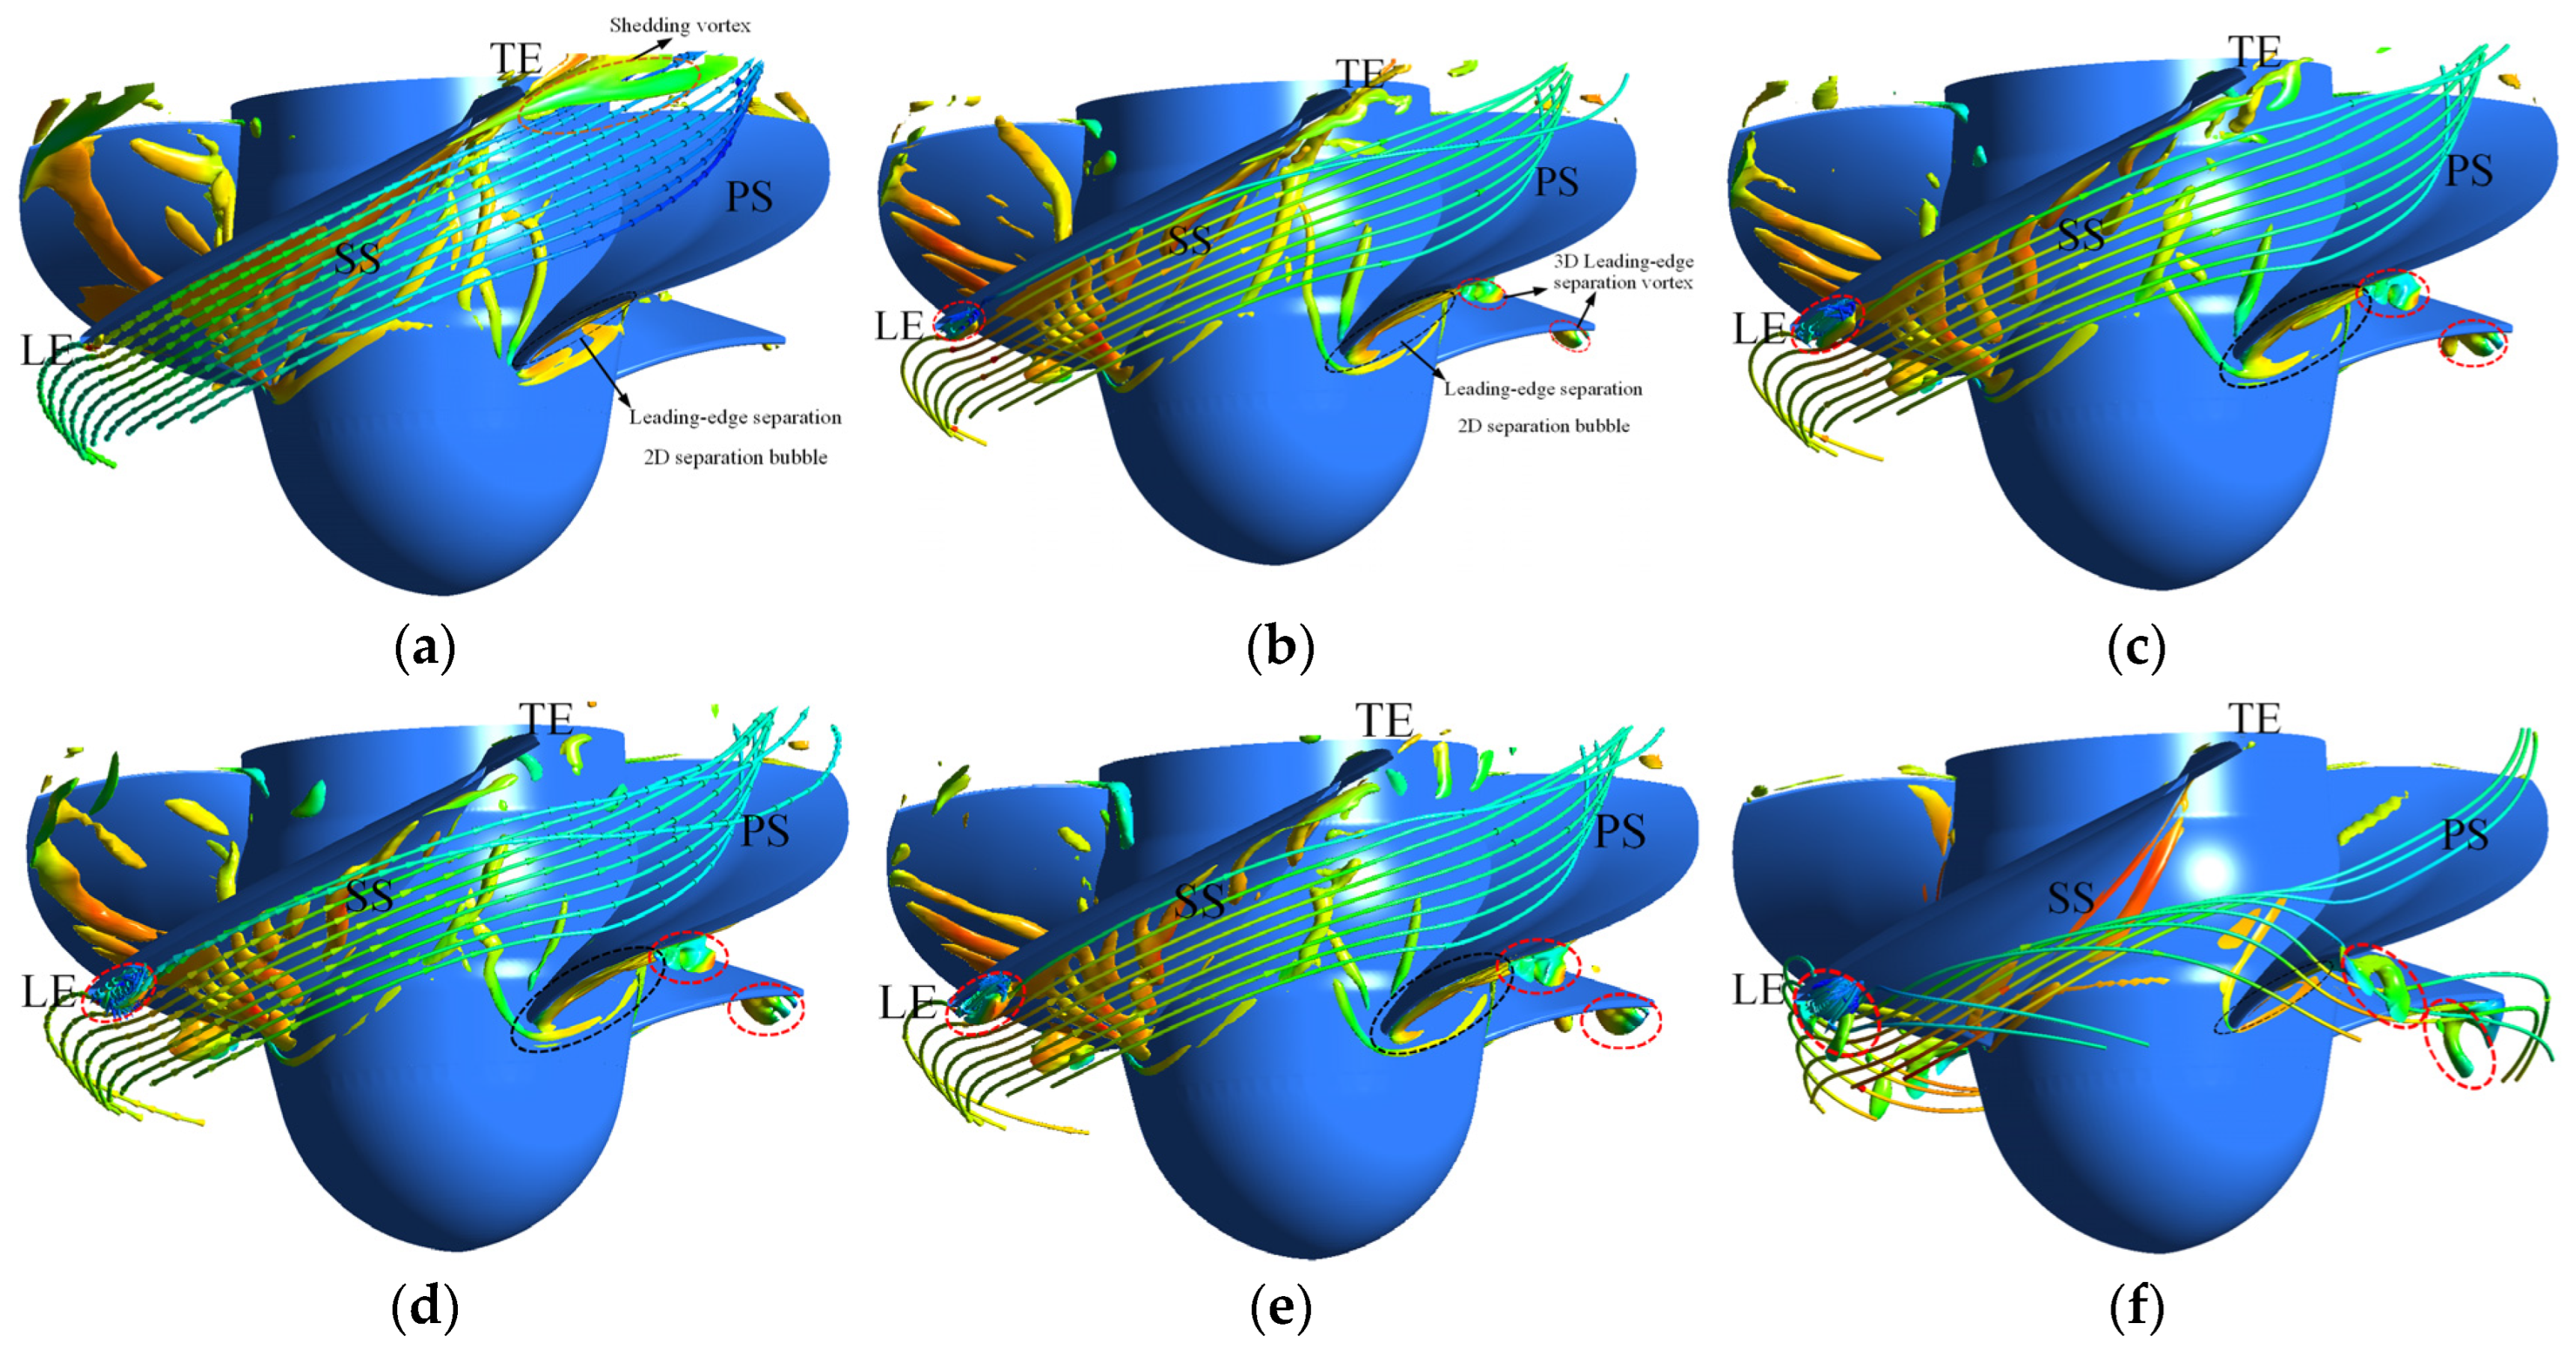
where Ω i j is the rotation rate tensor, and S i j is the strain rate tensors. Figure 15 shows Q = 6000 s−2 iso-surface of the vortex structure calculated using the BSkO model under different working conditions. Figure 15 reveals that the region within a wall-normal distance of 5 mm lacks a vortex structure to enhance the clarity of the LESV structure. The Q-criterion iso-surface is colored using the magnitude of the axial velocity. Furthermore, the starting line of the streamline is established at the center of the LESV, and a three-dimensional streamline diagram is generated near the LESV.
Figure 15a shows that at 0.7Qd, the black dotted circle denotes the position where the LE separation emerges on the blade suction surface, resembling a two-dimensional separation bubble attached to the LE of the blade. However, no three-dimensional LESV is formed at this condition. Meanwhile, the orange dashed line circle in the figure indicates the presence of a certain shedding vortex at the TE of the blade. Similar to the result in Figure 14a, the flow lines in the impeller passage are relatively smooth and orderly. Subsequently, Figure 15b,e shows that the LE separation flow marked by the black dashed circle is significantly amplified with the decrease in flow rate, and the formation of a three-dimensional attached vortex occurs at 0.6Qd, as demonstrated by the red dashed circle in the figure. As the flow rate further decreases, the 3-D LESV gradually increases, and the streamline gathers around the LESV. Due to the interference of the LESV, the streamline near the SS is also affected, gradually deviating from the mainstream and reducing the TESV. At 0.4Qd, approximately half of the streamline near the shroud flows towards the impeller inlet direction and the adjacent flow passage. In addition, as indicated by the black dashed circle annotations, the LE separation is weakened. It falls off the LE surface of the blade, which is consistent with Yamada’s [28] studies in axial flow compressors.
The vorticity transport equation is used to examine the vortex distribution near the LESV to further analyze the impact of the vortex due to flow rate variation. In the absence of cavitation, turbulence in axial-flow pumps is generally considered to satisfy the conditions of incompressibility, mass force potential, and positive fluid pressure. Therefore, the classical three-dimensional total vorticity transport equation [58] was simplified in this study as follows:
d ω d t = ( ω ) V + ν Δ ω
where the first term on the right side is the vorticity stretching term, and the second is the viscosity term. Equation (16) describes the kinematic properties of the existing vorticity in the flow field, such as convection, tension, torsion, and diffusion [59]. Regarding the dynamic mechanism of vorticity generation, the viscous effect is mainly reflected in the interaction between the fluid and solid walls. However, according to Ji’s research [60], the viscosity term is too small to be ignored, and hence, it is not considered in the subsequent discussion. On the other hand, the vorticity stretching term contains various deformation information such as stretching, inclination, torsion, bending, etc., accompanied by severe shear mixing [61]. It represents the stretching and deformation of vortex structures caused by velocity gradient.
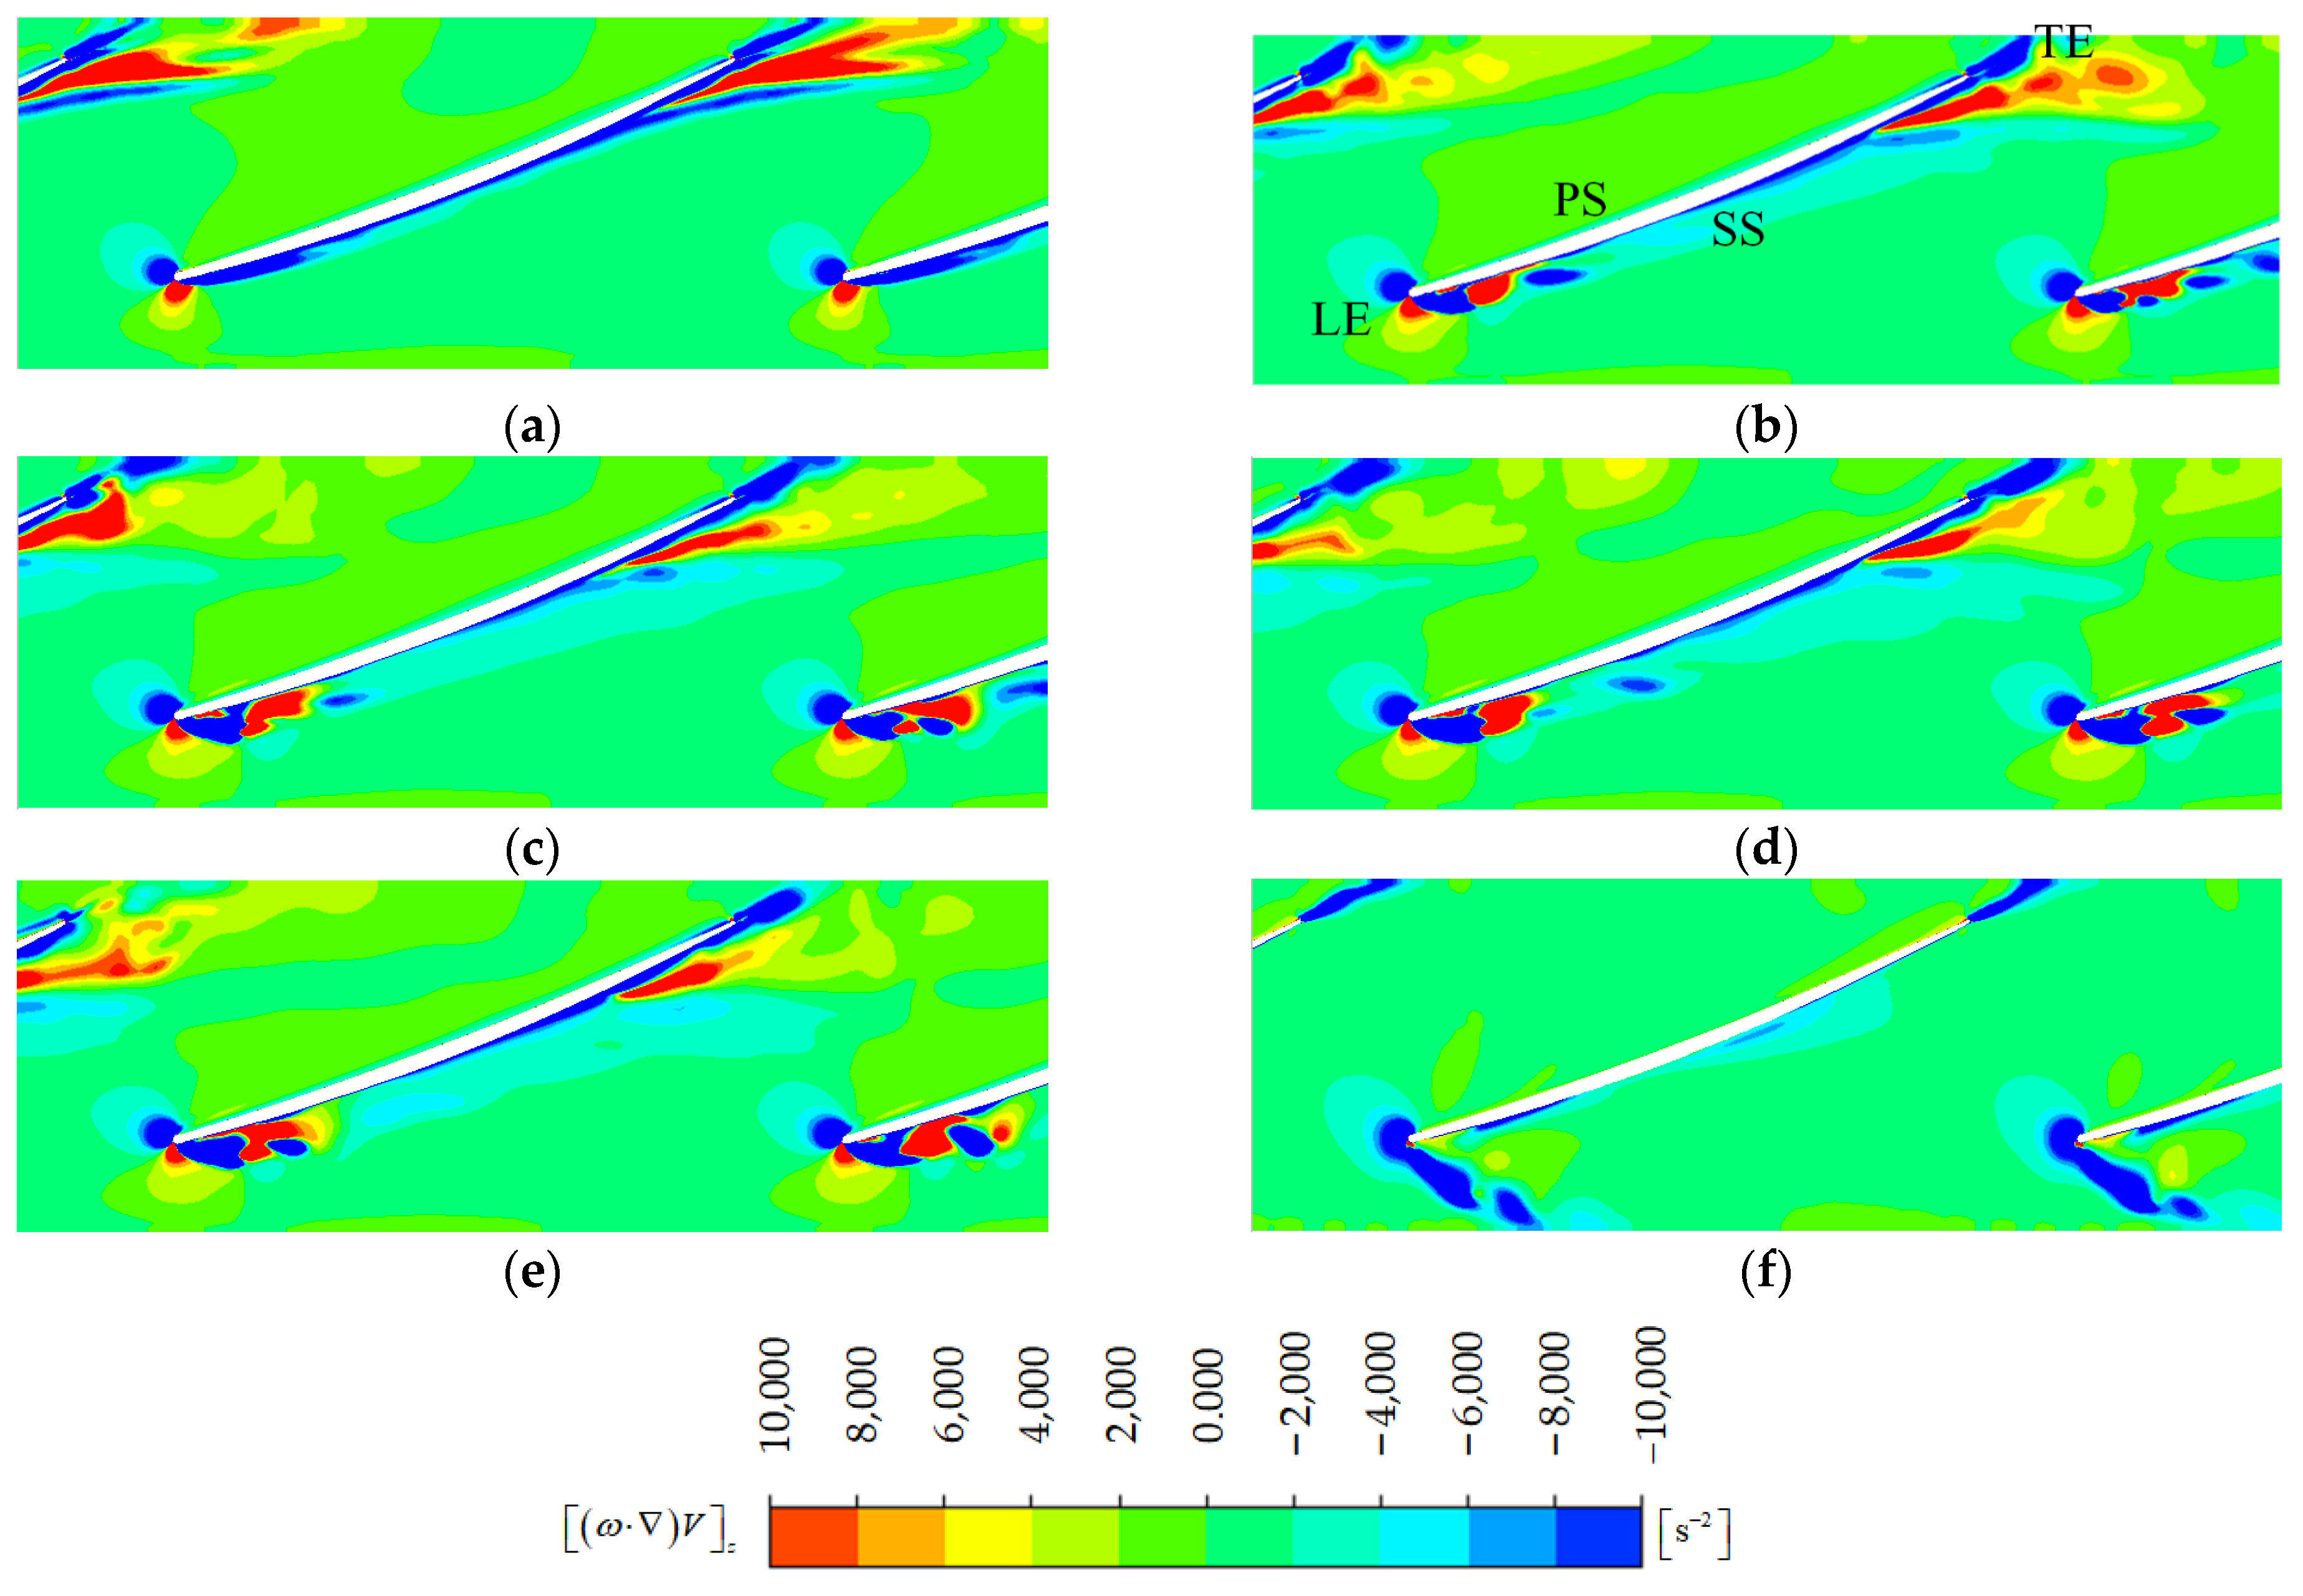
Figure 16 shows the spanwise component of the vorticity stretching term diagram at different flow rates of the spanwise section at r/R = 0.98. Through the analysis of the vorticity stretching term in the vorticity transport equation, it can be observed that its distribution trend is similar to the result in Figure 15. This finding proves that the vorticity stretching term plays a leading role in generating vortex in the flow field. It can be seen as a reflection of the conservation theorem of angular momentum [58]. The distortion and deformation of the vortex structure will make the momentum of particles on the same flow line smaller and the angular momentum increase, thus promoting the generation of vorticity.
Figure 16 also clearly shows that a distinct peak value of the vorticity stretching term emerges at the LE of the SS at 0.6Qd as the flow rate decreases. This signifies a sharp change in the velocity gradient at this position, and the distortion of the streamline facilitates the formation of the LESV. As observed in Figure 15, the vorticity stretching term moves closer to the LE with a further reduction in flow rate, ultimately separating the LESV from the blade surface.
To further analyze the energy characteristics at critical conditions, Figure 17 shows the contour of the average turbulent dissipation rate distribution of the spanwise section of the impeller at different flow rates at r/R = 0.98. The results of the 0.56Qd and 0.55Qd conditions are very similar to those of the 0.55Qd conditions and, therefore, are not presented here.
Figure 17 shows that the regions with larger values are situated at the LE of the SS, and the area of this region gradually expands with the decrease in flow rate. This phenomenon represents the generation and dissipation of vortices at the position of the suction front edge, consistent with the findings in Figure 15 and Figure 16. Furthermore, under the conditions of 0.6Qd and 0.55Qd, this region remains stably attached to the LE of the SS. In contrast, this region is no longer attached to the SS at 0.4Qd. It is divided into two parts, with one part moving towards the LE of the PS and the other moving towards the flow passage. This results in an overall enhanced distribution in the flow passage, consistent with the results in Figure 16.
In summary, following the criterion proposed by Goltz [24], 0.55Qd is regarded as the critical state. However, according to the study in this paper, at 0.6Qd, the flow field characteristics change significantly, forming the three-dimensional LESV. Although the head has not yet undergone any significant change in the critical state, the internal flow exhibits a significant difference. Therefore, using the inflection point of the head-flow curve as the critical state criterion is unsuitable.

4.2. The internal Pressure Fluctuation of the Impeller

According to the results in Section 4.1, it is evident that the internal flow pattern undergoes significant changes at 0.6Qd. However, due to the complexity of the actual operating conditions, it is challenging to observe these changes directly. Thus, analyzing the pressure fluctuation signal inside the impeller becomes necessary. Moreover, analyzing pressure data from different flow rates provides valuable insights into the flow field characteristics.
To this end, we begin by analyzing the results obtained from fixed monitoring points near the impeller inlet, outlet, and shroud, as depicted in Figure 7. Notably, the rotation frequency fn of the impeller spindle is consistent with the spindle speed n (4.1667 r/s), with a value of 4.1667 Hz. The impeller blade frequency fR = 4fn is approximately 16.667Hz, while the guide vance blade frequency fs = 7fn is approximately 29.1667 Hz. The sampling frequency used for the analysis is 1500 Hz. Drawing from previous research experience outlined in the literature [53], the sampling time of eight times the flow cycle is selected for fluctuation analysis, ensuring the computational accuracy requirements are met.

4.2.1. The Pressure Fluctuation at the Fixed Monitoring Point

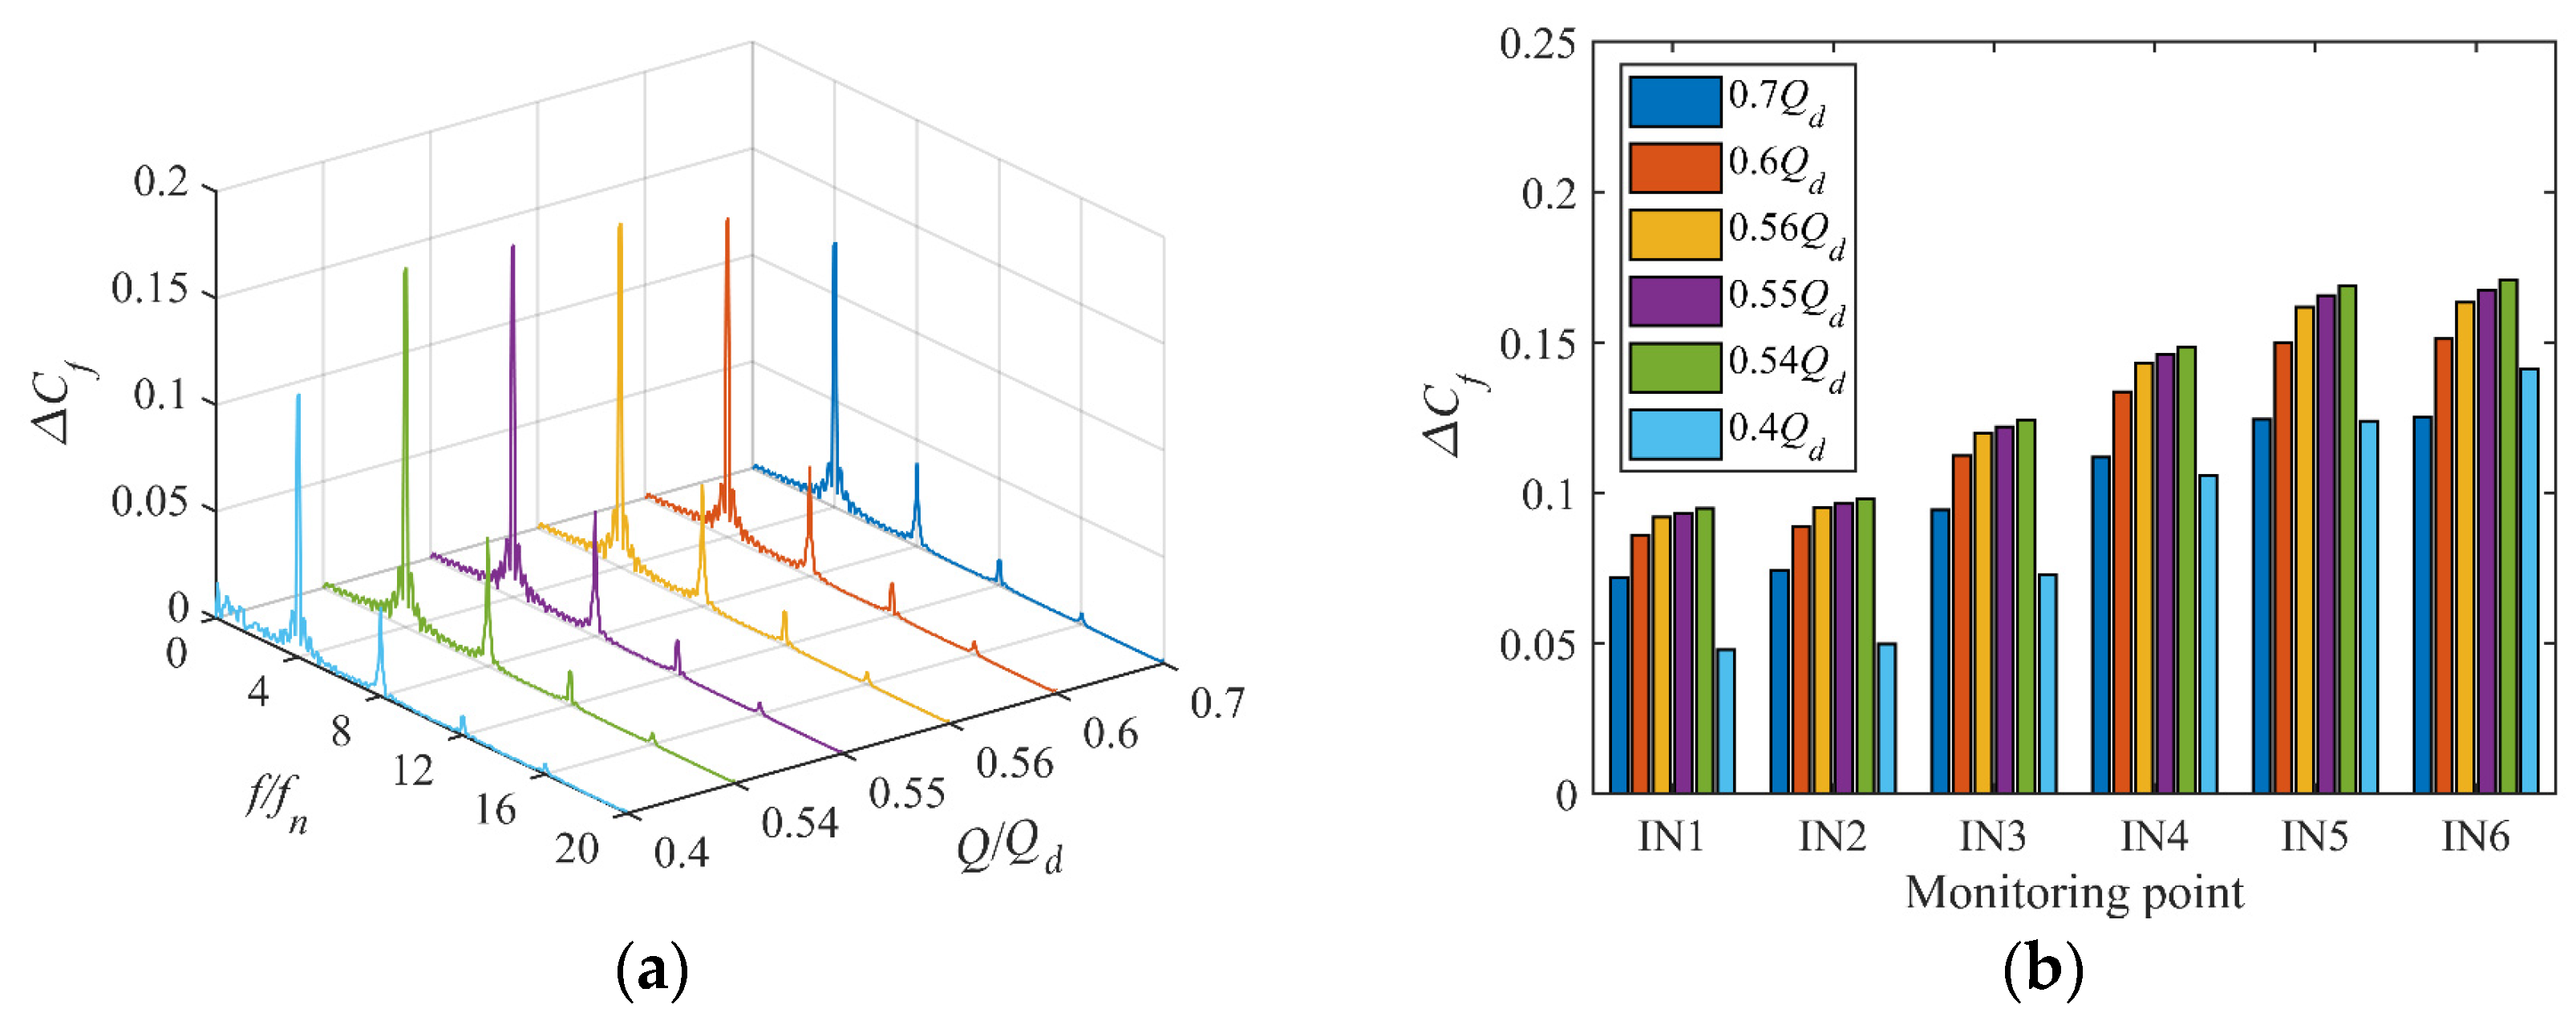
The Cf was calculated for different working conditions by performing Fast Fourier Transform (FFT) on the pressure data obtained from each monitoring point. As for the Cf of the impeller inlet, the frequency domain trends were consistent across all monitoring points. The main pressure fluctuation frequency at each point was four times the rotational frequency, i.e., the impeller blade frequency fR, with the second frequency doubling the blade frequency. Therefore, Figure 18a only shows the frequency domain diagram at the IN5 monitoring point near the shroud surface. Certainly, there are significant differences in the fluctuation amplitude of different monitoring points. Therefore, Figure 18b shows the fluctuation amplitude of each monitoring point at the impeller inlet at different flow rates. Figure 18b shows that the amplitude of Cf along the radial direction at the impeller inlet increases gradually.
Figure 18 shows that the amplitude of Cf increases as the decreased flow rate starts from 0.7Qd, while it significantly decreases when reaching 0.4Qd.
Figure 19 shows the frequency domain diagram of Cf located at the impeller outlet. A significant change in the frequency domain diagram of the Cf is observed compared to the results obtained at each monitoring point at the impeller inlet, as shown in Figure 18. Specifically, the main frequency of monitoring points (OUT1, OUT2, and OUT3) located closer to the hub is greatly affected by the outlet backflow, with a main frequency of about 2.5 fn. Conversely, the main frequency of monitoring points (OUT4, OUT5, and OUT6) located closer to the shroud is still 4 fn, which is significantly affected by the number of blades. Under the 0.4Qd, the main frequency of each monitoring point is still 4 fn, but there are obvious low-frequency bands. The pressure fluctuation amplitude of each monitoring point does not follow a uniform pattern with the change in flow rate. However, the amplitude of each monitoring point gradually decreases along the radial direction towards the shroud.
To analyze the Cf characteristics of the shroud under different flow conditions, Figure 20a shows the frequency domain diagrams of the Cf at the monitoring points of the impeller shroud under different flow conditions, taking the SH3 monitoring point located in the middle of the impeller as an example. The results of other monitoring points are similar. The frequency domain diagram of the shroud monitoring point is akin to that of the impeller inlet monitoring point shown in Figure 18. The main frequency characteristic is still determined by the rotation frequency of the impeller, which is the blade frequency 4 fn, and the secondary frequencies are all double the impeller blade frequency. Furthermore, the amplitude of the shroud monitoring point gradually decreases as the flow rate decreases.
Figure 20b shows the amplitude of the Cf corresponding to the main frequency at each point on the shroud. It compares it with the pressure monitoring points located at the inlet and outlet of the impeller. The results reveal that the amplitude of each point on the shroud is significantly higher than that of the inlet and outlet of the impeller, with the maximum amplitude occurring in the front section of the shroud. Moreover, the amplitude of the Cf at the inlet of the impeller is greater than that at the outlet of the impeller, and the amplitude of the Cf from the inlet to the outlet of the impeller initially increases and then decreases, which is consistent with the findings reported in the literature [34].
In summary, the frequency domain distribution trend of the fixed monitoring points near the inlet and outlet of the impeller and the shroud under different flow rates are consistent with the results in the literature [32,33,34], which indirectly proves the accuracy of this calculation method. However, at 0.6Qd or 0.55Qd, the frequency domain distribution of fixed monitoring points did not exhibit significant changes in amplitude, main frequency, and periodicity. Therefore, the Cf value of the fixed monitoring point is not suitable for identifying the critical state.

4.2.2. The Pressure Fluctuation at the Rotation Monitoring Point

To further investigate the Cf of the blade surface and passage at critical working conditions in the saddle-shaped unstable region of an axial-flow pump, pressure data from rotating monitoring points, as shown in Figure 8, were analyzed. As elucidated in Section 4.1, the flow field characteristics at the suction surface near the shroud change with the flow rate. Therefore, the pressure data at the five monitoring points (SSU1-5) were scrutinized.
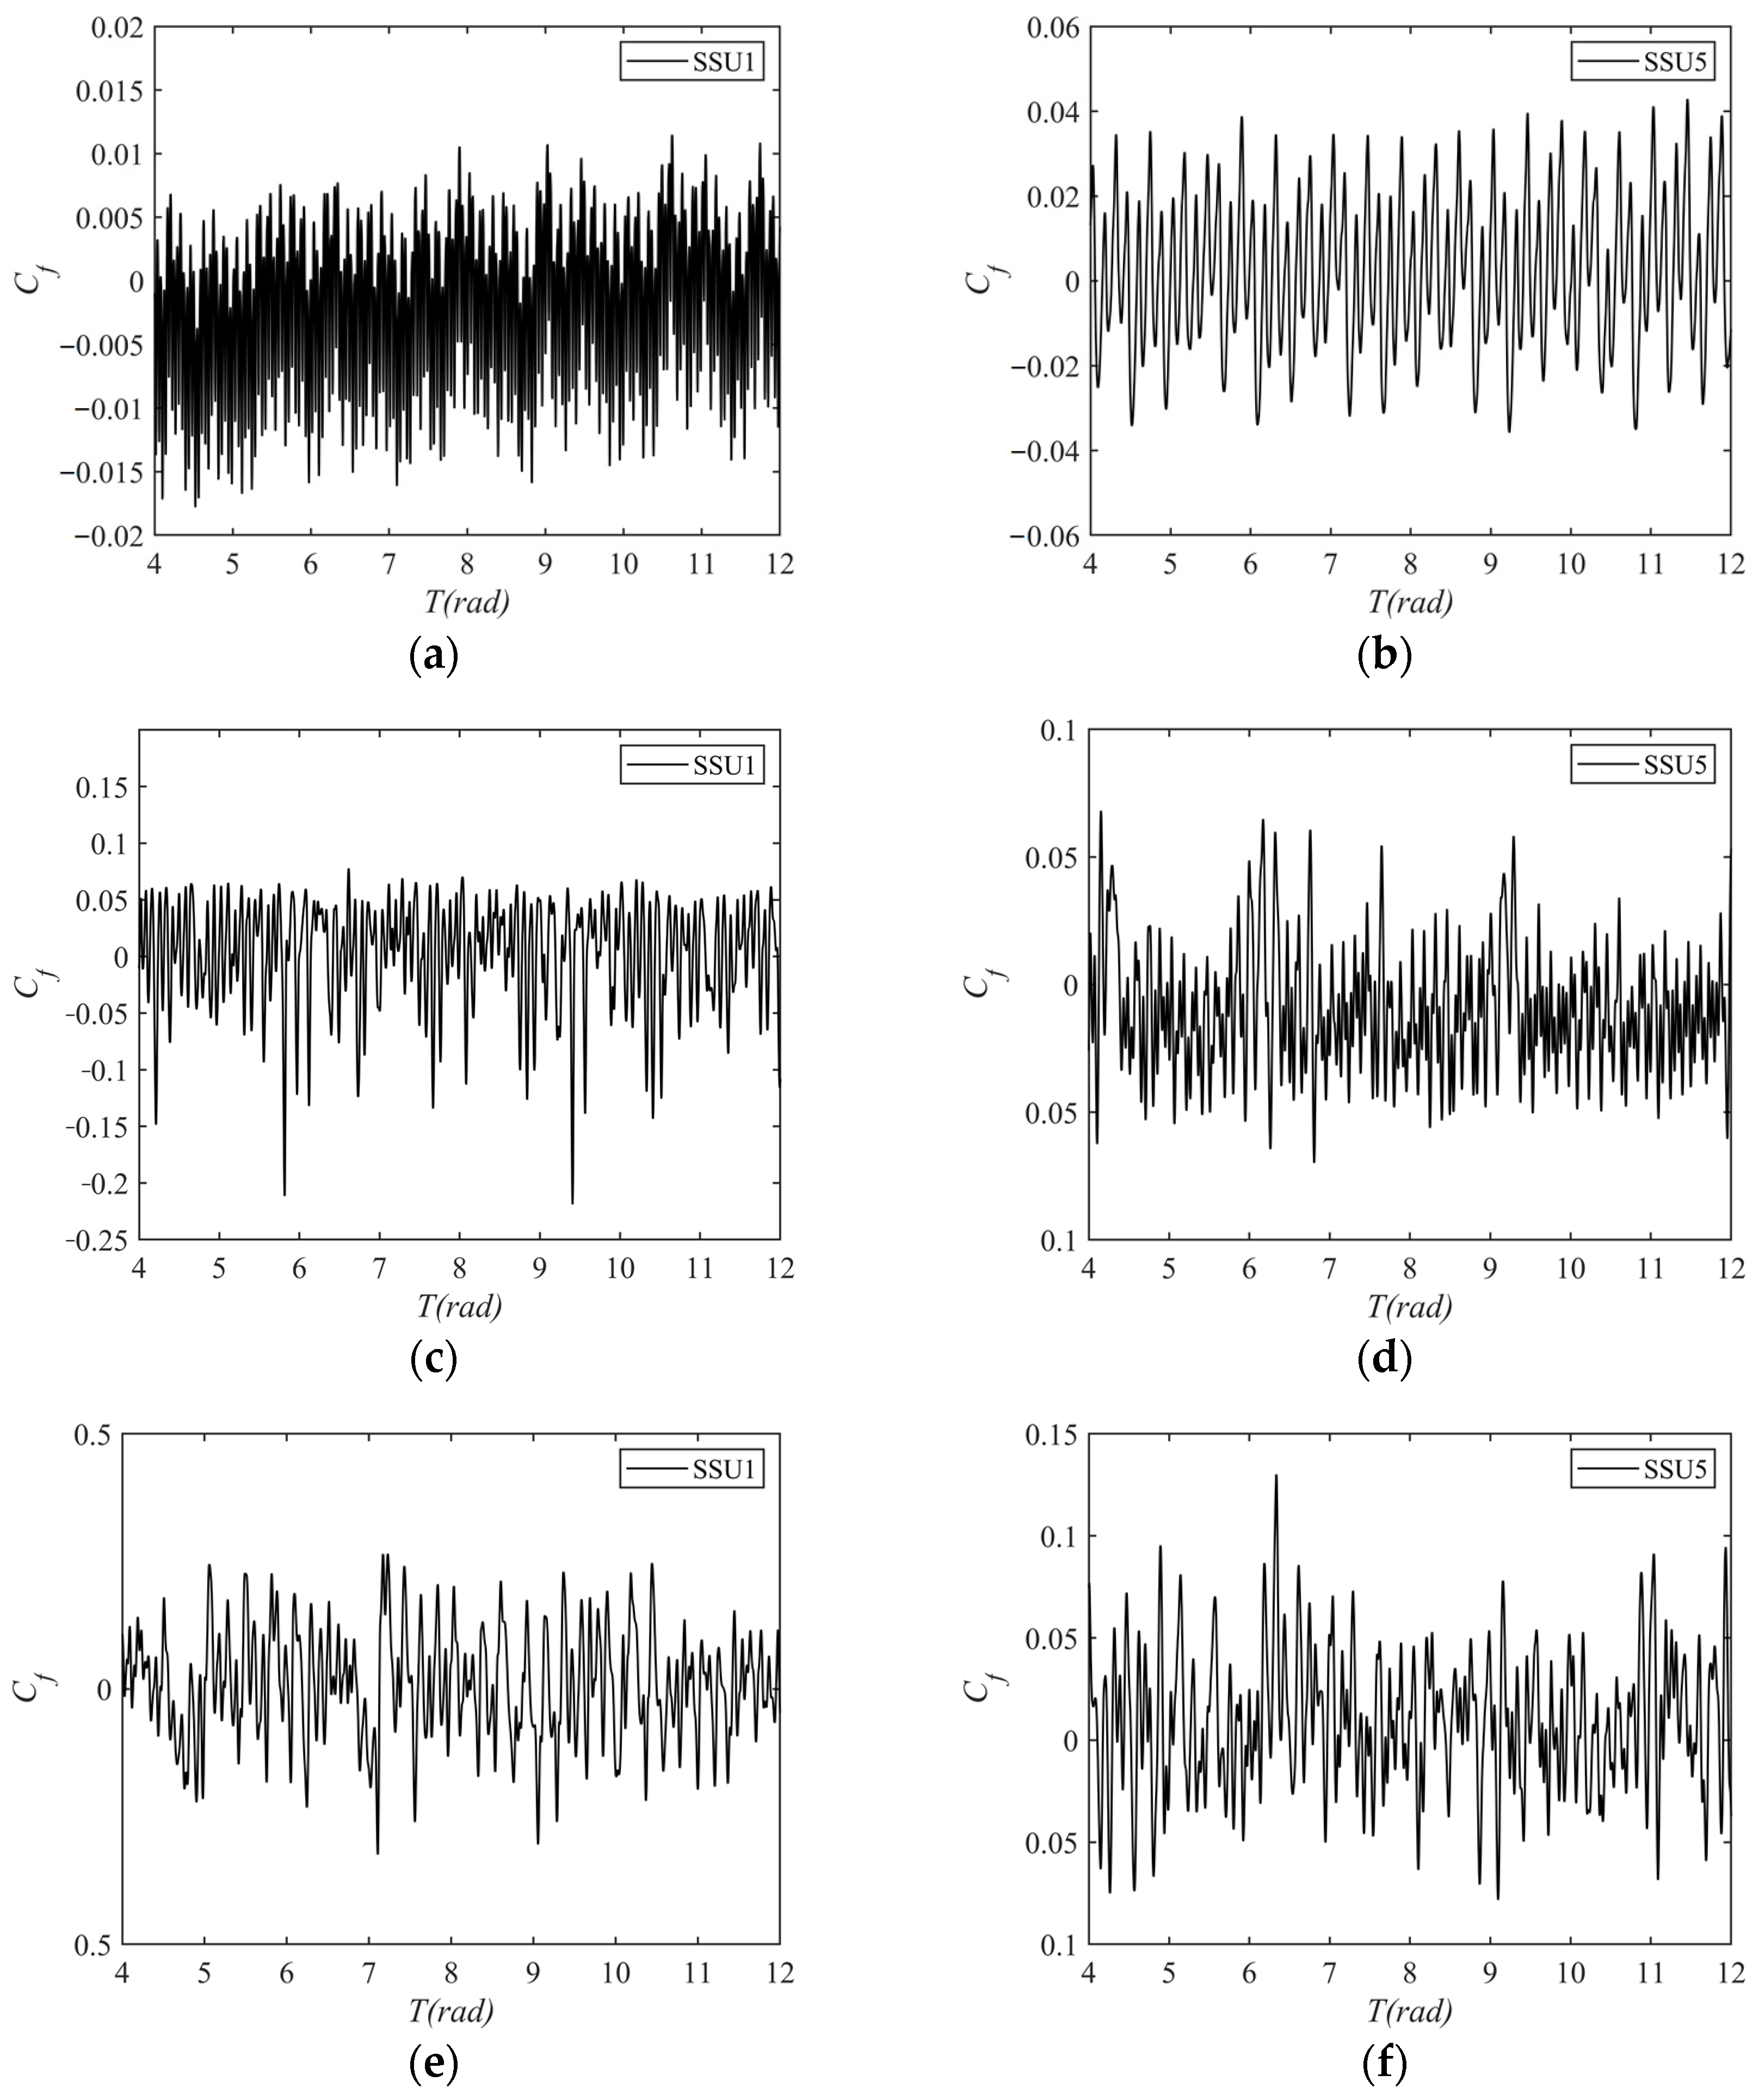
Figure 21 shows the time domain diagrams of 8T (impeller rotation cycles) at two pressure monitoring points near the leading and trailing edges of the blade suction surface under three working conditions of 0.7Qd, 0.6Qd, and 0.55Qd. The figure shows that the Cf amplitude at 0.7Qd is relatively small, and the Cf amplitude rapidly increases as the flow rate decreases. Furthermore, the Cf curve at point SSU1 near the LE of the blade fluctuated significantly over time at 0.7Qd. As the monitoring point moves downstream along the blade suction direction to the point SSU5, the Cf of the peak value of Cf gradually weakens with time, which changes relatively uniformly with time. However, the periodicity of Cf over time is significantly reduced due to the presence of LESV under both 0.6Qd and 0.55Qd working conditions. Moreover, the Cf amplitude at the upstream LE is much greater than that at the downstream TE, which is exactly the opposite of the result under the 0.7Qd working condition.
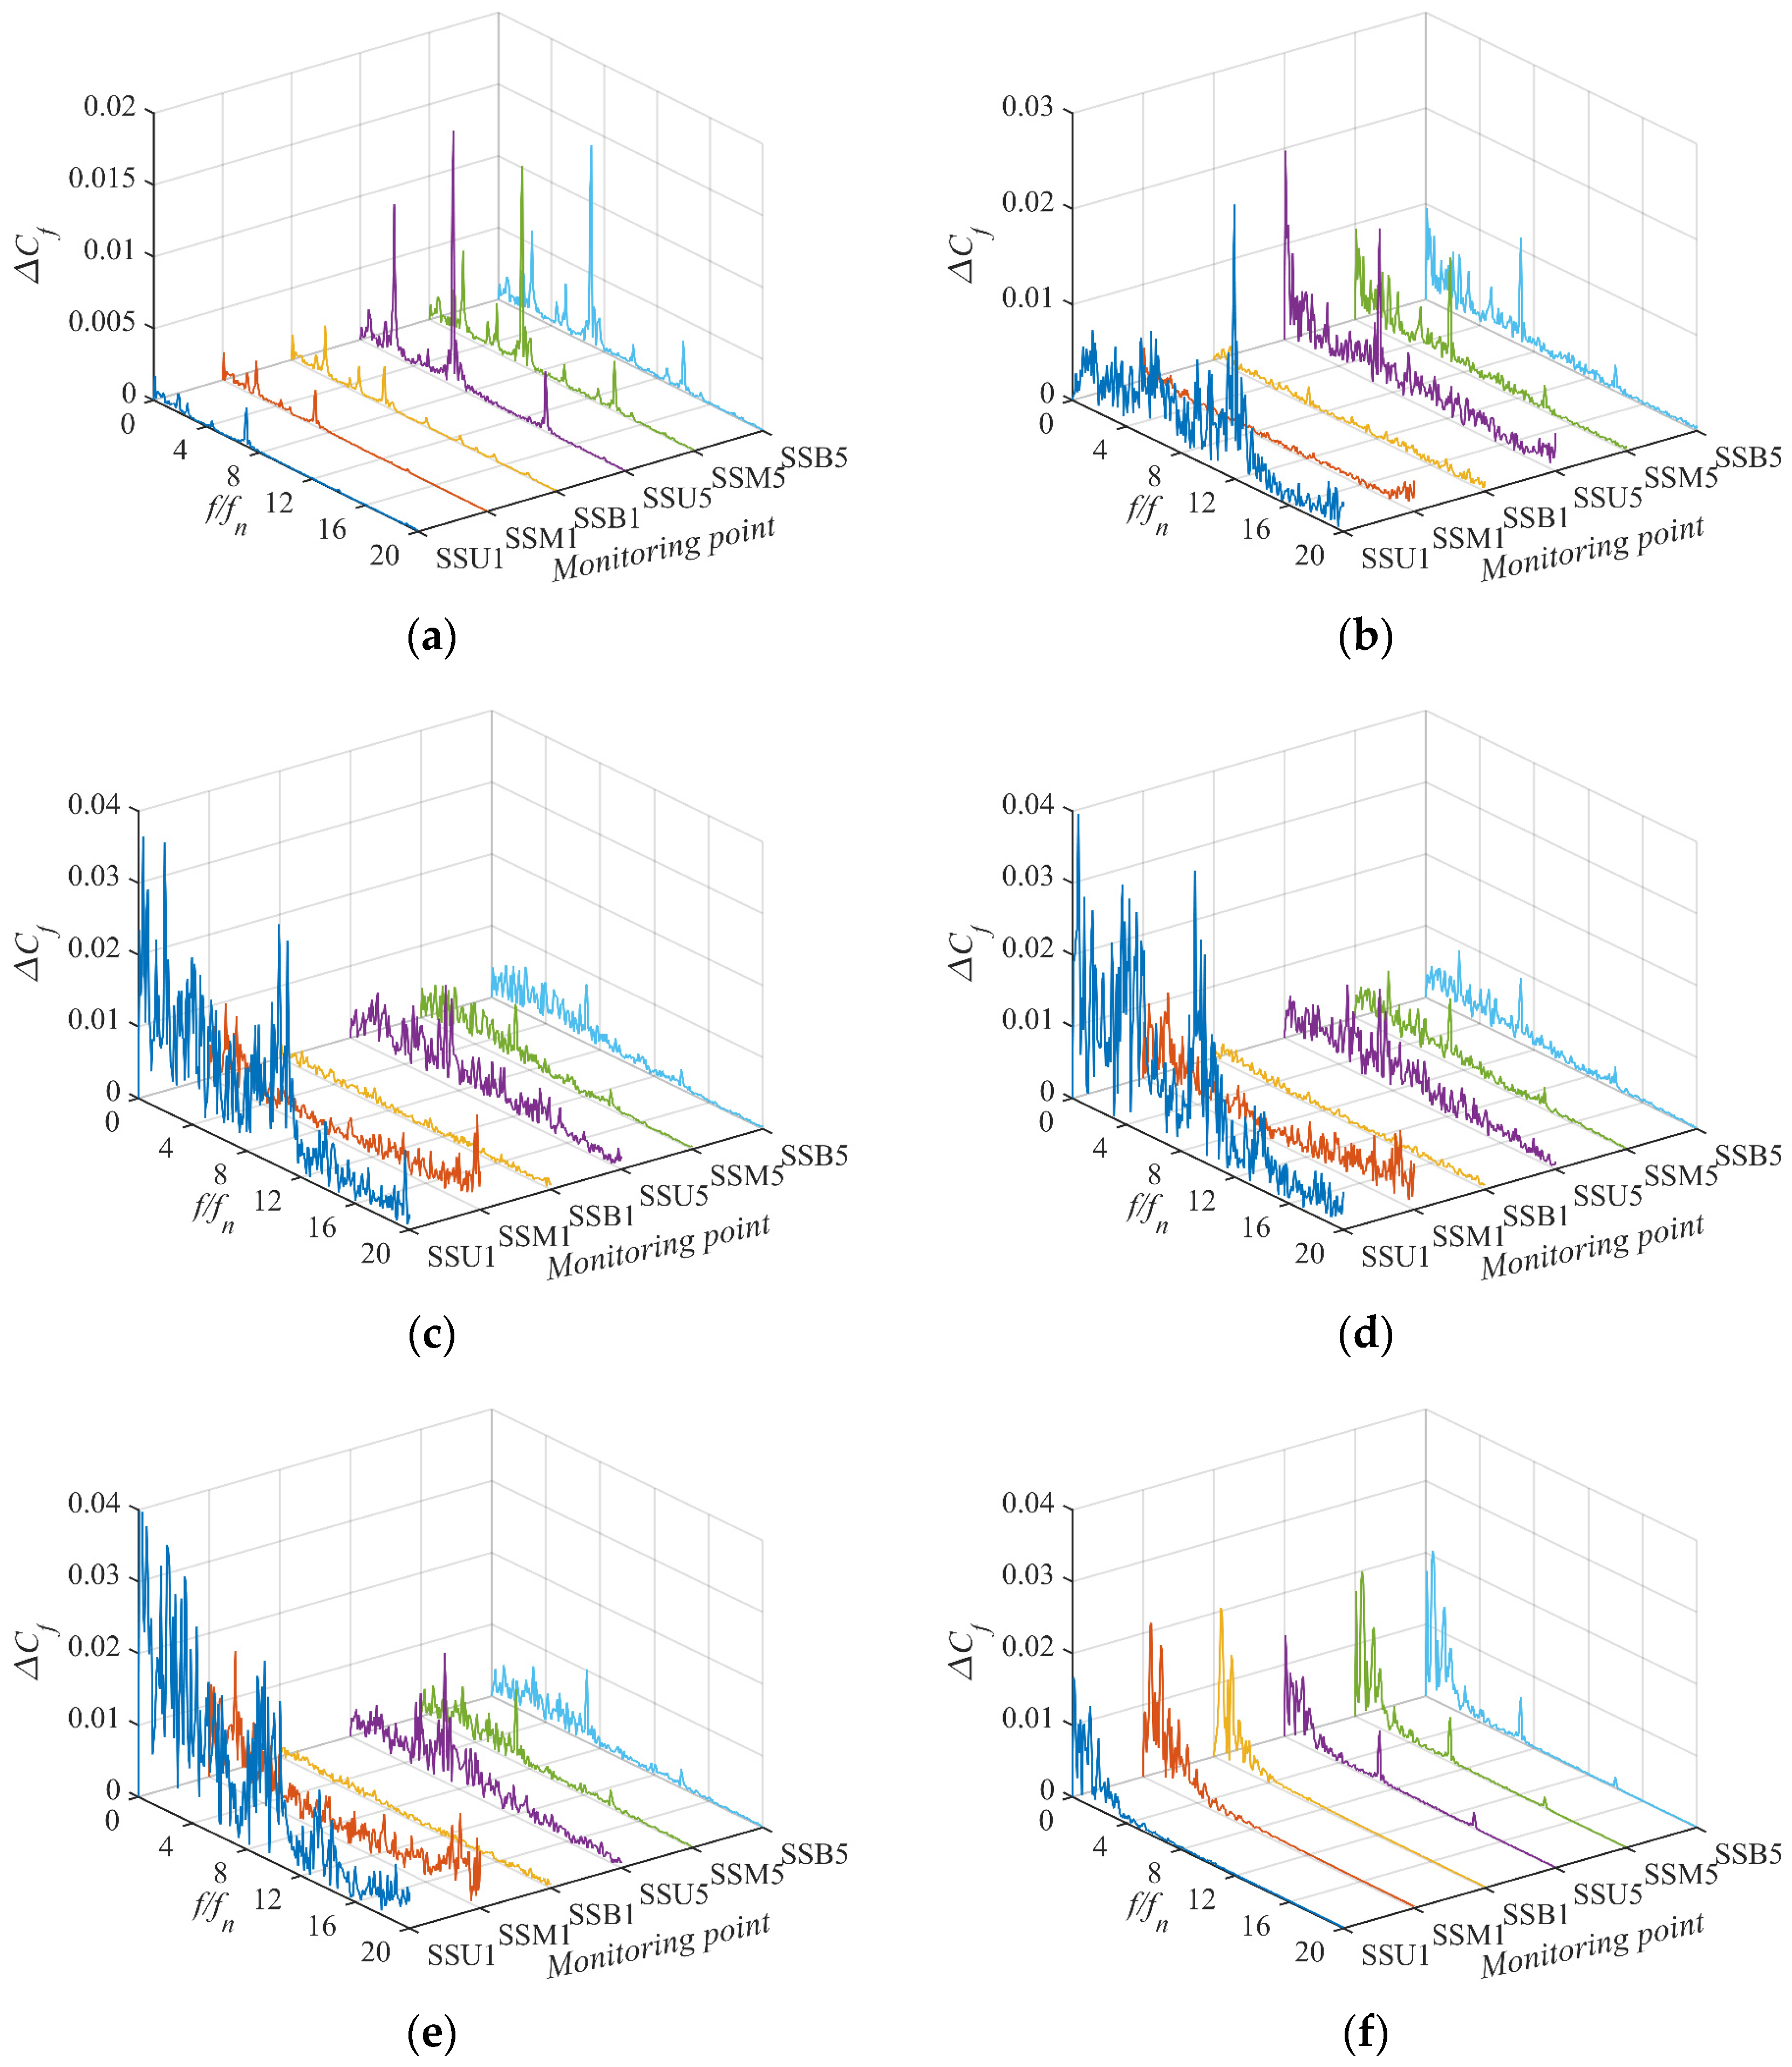
Figure 22 shows the frequency domain diagram of Cf at different monitoring points on the SS of the impeller blade under different flow conditions. The axial-flow pump did not enter the saddle-shaped unstable region at 0.7Qd, and the main frequency of the pressure monitoring points on the suction surface of the impeller blade was seven times the rotational frequency fn, that is, the guide vane blade passed the frequency fs. Figure 22a shows the Cf amplitude of the blade surface increases along the flow direction due to the dynamic and static interference of the downstream guide vane. The closer the guide vane is, the higher the Cf amplitude is.
Figure 22b shows the LESV begins to form at 0.6Qd, the Cf amplitude of the monitoring point SSU1 near it increases significantly, and an obvious wide band is generated. No significant change in the amplitude of other monitoring points occurs, but a wide band appears. The main frequency of the two monitoring points, SSU1 and SSU2, is twelve times the rotational frequency, influenced by the leading-edge separation vortex. In contrast, the main frequency of the remaining three monitoring points is still seven times the rotational frequency, influenced by the guide vane. This indicates that the area affected by the leading-edge separation vortex is relatively small under this working condition. As the flow rate continues to decrease, the amplitude of Cf in the low-frequency region of the SSU1 monitoring point is larger than that of the 0.6Qd working condition. Meanwhile, it is much larger than that of other monitoring points.
Figure 22c,e show that the influence area of the LESV expands, and there is a wide band at each monitoring point without an obvious main frequency. The axial-flow pump completely entered the saddle-shaped unstable region at 0.4Qd. Figure 14f shows that a large range of backflow areas appears at the TE of the SS. Therefore, the frequency domain diagram of each monitoring point is similar, as shown in Figure 22f. At the same time, its amplitude slightly decreases compared to the SSU1 monitoring point with the critical state, and the seven times the rotational frequency affected by the guide vane passage frequency begins to appear again.
Figure 23 shows the frequency domain diagram of the Cf on the SS of impeller blades at different monitoring points under different flow conditions. Six monitoring points distributed on the blade SS were analyzed, and their location diagram is shown in Figure 8c.
Figure 23a shows that at 0.7Qd, the Cf amplitude is much larger at the TE of the blade SS due to being closer to the guide vane position than that at the LE, consistent with the conclusion in Figure 22. Moreover, there is little difference in the Cf amplitude of the blade suction surface along the radial monitoring points. Figure 23b shows that a relatively obvious wide band appears at each monitoring point of the suction surface compared with the result at 0.7Qd due to the formation of the LESV. In addition, the Cf amplitude of SSU1 monitoring points near the LESV increases significantly, much larger than that of the monitoring points near the hub (SSB1) and in the middle (SSM1) of the blade LE. At this time, the TE of the blade SS is still less affected by the LESV, the main frequency is still 7fn affected by the guide vane, and the amplitude of each monitoring point along the radial direction is not significantly different.
As the flow rate continues to decrease, Figure 23c,e shows that the influence range of the LESV is slightly enhanced. In the radial aspect, the Cf amplitude of the monitoring point SSM1 increases somewhat, which is larger than that of the SSB1. In the streamwise aspect, the wide band of each monitoring point at the TE of the SS is more evident, and there is no clear main frequency. Figure 23f shows that at 0.4Qd, there is little difference in Cf amplitude of each point on the suction surface, and the frequency is concentrated in the low band less than four times the rotation frequency.
Figure 24 shows the frequency domain diagram of the Cf on the suction and pressure surface of impeller blades, as well as the A and B flow passages at U1 monitoring points under different flow conditions. Notably, APASU1 and BPASU1 in Figure 24 represent the U1 monitoring points in passages A and B, respectively. The positions of passages A and B are shown in Figure 8a.
Figure 24 shows that the Cf amplitude on the blade surface and in the passage is minimal, under the 0.7Qd, with the Cf amplitude on the SS being particularly low. However, when the flow rate drops to 0.6Qd, the formation of the LESV results in a significant increase in the Cf amplitude at the monitoring point SSU1, which is much higher than the PS and flow passage results. At 0.4Qd, the impeller flow passage and pressure surface form a wide range of secondary flow, as shown in Figure 14f, rapidly increasing the Cf amplitude in the blade pressure surface and flow passage. Meanwhile, the impact caused by the LESV is slightly weakened. Ultimately, the Cf amplitude on the blade surface and passages becomes similar.
Compared with the amplitude of the corresponding monitoring point fixed on the impeller shroud (Figure 22), the blade surface and passages exhibit smaller pressure fluctuation coefficient amplitudes overall.

5. Conclusions

Based on the bifurcation approach, the SST k ω model is modified to account for the rotation effect. The reliability of the BSkO model has been validated through numerical calculations of a water jet pump. Subsequently, it is used to calculate the critical state of the axial-flow pump. Based on the analysis, the following conclusions can be drawn:
  • The head starts to decline when the flow rate drops to 0.55Qd, whereas the internal flow field characteristics in the impeller exhibit changes at 0.6Qd. Therefore, there is a certain lag that uses the inflection point of the head-flow curve as the critical state criterion for the axial-flow pump to enter the saddle-shaped unstable region.
  • The leading-edge separation occurs at the LE of the blade SS at 0.7Qd, resembling a two-dimensional separation bubble. However, there is no three-dimensional LESV formed. As the flow rate decreases, the three-dimensional LESV is formed at 0.6Qd, gradually increasing in size as the flow rate drops further. At 0.4Qd, the leading-edge separation weakens and detaches from the leading-edge surface of the blade.
  • As the flow rate decreases, a significant increase in the vorticity stretching term occurs at the leading edge of the blade suction surface at 0.6Qd. This indicates a sharp change in velocity gradient, which causes distortion of the streamline and promotes the formation of the LESV. The vorticity stretching term moves toward the leading edge as the flow rate decreases. Finally, the LESV breaks away from the blade surface.
  • The frequency domain distribution of fixed monitoring points did not exhibit significant amplitude, main frequency, and periodicity changes at the critical condition. Therefore, the fixed monitoring point is unsuitable for identifying the critical state. However, the SSU1 monitoring points located on the leading edge of the blade suction near the shroud rotate with the impeller, and its frequency domain diagram changes significantly with the flow rate. Therefore, it is suitable to be used as the criterion to monitor the critical state. When the amplitude of the pressure fluctuation coefficient is increased by ten times, the main frequency position is shifted, and accompanied by abundant low-frequency fluctuations, and the axial-flow pump enters the critical state.
  • The pressure fluctuation coefficient amplitude of the monitoring points rotating with the impeller is significantly lower than that of the fixed monitoring points. At the leading edge of the blade suction surface, the amplitude of the SSU1 is much larger than SSM1 and SSB1. As the flow rate decreases, the influence range of the leading-edge separation vortex increases, resulting in a slight increase in the pressure fluctuation amplitude of the SSM1, which is larger than that of SSB1. At the trailing edge of the blade suction surface, there is a slight difference in the radial direction. Furthermore, the amplitude of the SSU1 is much larger than the PSU1, APASU1, and BPASU1.

Author Contributions

Conceptualization, B.Q. and K.P.; methodology, K.P., K.Y. and X.H.; software, K.P. and K.Y.; validation, K.P., Q.G. and K.Y.; formal analysis, K.P.; investigation, Q.G.; resources, B.Q.; data curation, B.Q.; writing—original draft preparation, K.P.; writing—review and editing, X.H. and B.Q.; visualization, K.P.; supervision, X.H.; project administration, Q.G.; funding acquisition, B.Q., X.H. and Q.G. All authors have read and agreed to the published version of the manuscript.

Funding

This research was funded by the National Natural Science Foundation of China, grant numbers 52179091 and 52276041, and Jiangsu Provincial Water Conservancy Technology Project, grant number 2022016. This research was also funded by the Jiangsu Funding Program for Excellent Postdoctoral Talent, grant numbers 2022ZB621.

Institutional Review Board Statement

Not applicable.

Informed Consent Statement

Not applicable.

Data Availability Statement

The data that support the findings of this study are available from the corresponding author upon reasonable request.

Acknowledgments

The authors are grateful to the reviewers and the editors for their comments to improve the quality of this paper. The authors are grateful for funding the “Key Discipline of Power Engineering and Engineering Thermophysics Project” project of Yangzhou University.

Conflicts of Interest

The authors declare no conflict of interest.

References

  1. Guo, Z.; Xia, W.; Qian, Z. Study on noise of an axial flow waterjet pump with wavy leading edge. Ocean. Eng. 2022, 261, 112117. [Google Scholar] [CrossRef]
  2. Huang, R.; Wang, Y.; Du, T.; Luo, X.; Zhang, W.; Dai, Y. Mechanism analyses of the unsteady vortical cavitation behaviors for a waterjet pump in a non-uniform inflow. Ocean. Eng. 2021, 233, 108798. [Google Scholar] [CrossRef]
  3. Gong, J.; Wu, Z.; Ding, J.; Jiang, J.; Zhang, Z. Numerical analysis of propulsion performance of a waterjet-propelled vehicle in steady drift. Ocean. Eng. 2022, 266, 113136. [Google Scholar] [CrossRef]
  4. Lavis, D.R.; Forstell, B.G.; Purnell, J.G. Compact waterjets for high-speed ships. Ships Offshore Struct. 2007, 2, 115–125. [Google Scholar] [CrossRef]
  5. Zhang, L.; Zhang, J.N.; Shang, Y.C. A potential flow theory and boundary layer theory based hybrid method for waterjet propulsion. J. Mar. Sci. Eng. 2019, 7, 113. [Google Scholar] [CrossRef] [Green Version]
  6. Wang, X.; Zhang, Z.; Zhang, M. Three-dimensional inverse design and hydrodynamic performance analysis of contra-rotating axial flow pump. Adv. Eng. Res. 2017, 114, 601–608. [Google Scholar] [CrossRef] [Green Version]
  7. Wang, X.E.; Zhang, Z.S.; Zhang, M. Design and Performance Analysis of Contra-rotating Pumpjet Propulsor under Condition of Torque Unbalance. In Proceedings of the MATEC Web of Conferences, Darmstadt, Germany, 18–20 April 2018. [Google Scholar] [CrossRef] [Green Version]
  8. Cao, L.; Watanabe, S.; Imanishi, T.; Yoshimura, H.; Furukawa, A. Experimental analysis of flow structure in contra-rotating axial flow pump designed with different rotational speed concept. J. Therm. Sci. 2013, 22, 345–351. [Google Scholar] [CrossRef]
  9. Zheng, F.; Zhang, X.; Chen, T.; Huang, B.; Xu, J.; Wang, G. Strong transient characteristics in axial flow waterjet pump during rapid starting period with special emphasis on saddle zone. Ocean. Eng. 2023, 269, 113506. [Google Scholar] [CrossRef]
  10. Li, C.; Weijun, Q. Rotating stall region of water-jet pump. Trans. Famena 2014, 38, 31–40. [Google Scholar]
  11. Shen, J.; Pei, J.; Wang, W.; Yuan, S. Instability characteristics regarding the saddle-shaped region in a reversible mixed-flow pump applied to the low-head pumped storage. J. Energy Storage 2023, 63, 107035. [Google Scholar] [CrossRef]
  12. Xia, C.; Cheng, L.; Luo, C.; Jiao, W.; Zhang, D. Hydraulic characteristics and measurement of rotating stall suppression in a waterjet propulsion system. Trans. Famena 2018, 42, 85–100. [Google Scholar] [CrossRef]
  13. Hu, F.; Wu, P.; Wu, D.; Wang, L. Numerical study on the stall behavior of a water jet mixed-flow pump. J. Mar. Sci. Technol. 2014, 19, 438–449. [Google Scholar] [CrossRef]
  14. Zhang, Y.; Wu, Y. A review of rotating stall in reversible pump turbine. Proc. Inst. Mech. Eng. Part C J. Mech. Eng. Sci. 2017, 231, 1181–1204. [Google Scholar] [CrossRef]
  15. Shen, X.; Zhao, X.; Xu, B.; Zhang, D.; Yang, G.; Shi, W.; Esch, B.P.M. Unsteady characteristics of tip leakage vortex structure and dynamics in an axial flow pump. Ocean. Eng. 2022, 266, 112850. [Google Scholar] [CrossRef]
  16. Mu, T.; Zhang, R.; Xu, H.; Fei, Z.; Feng, J.; Jin, Y.; Zheng, Y. Improvement of energy performance of the axial-flow pump by groove flow control technology based on the entropy theory. Energy 2023, 274, 127380. [Google Scholar] [CrossRef]
  17. Liu, C. Researches and developments of axial-flow pump system. Trans. Chin. Soc. Agric. Mach. 2015, 46, 49–59. [Google Scholar] [CrossRef]
  18. Xu, L.; Lu, L.; Chen, W.; Wang, G. Flow pattern analysis on inlet and outlet conduit of shaft tubular pump system of Pizhou pumping station in South-to-North Water Diversion Project. Trans. Chin. Soc. Agric. Eng. 2012, 28, 50–56. [Google Scholar] [CrossRef]
  19. Zhang, D.S.; Shi, W.D.; Chen, B.; Guan, X.F. Unsteady flow analysis and experimental investigation of axial-flow pump. J. Hydrodyn. 2010, 22, 35–43. [Google Scholar] [CrossRef]
  20. Li, W.; Li, S.; Ji, L.; Li, E.; Shi, W.; Agarwal, R.; Awais, M. Effect of inlet elbow on rotation stall in waterjet propulsion pump. Fundam. Res. 2022. [Google Scholar] [CrossRef]
  21. Li, Z.; Yang, M.G.; Zhang, N.; Gao, B. Experimental study on vibration characteristics of axial-flow pump under different operating conditions. J. Eng. Thermophys. 2013, 34, 866–869. [Google Scholar]
  22. Pérez Flores, P.; Kosyna, G.; Wulff, D. Suppression of performance curve instability of an axial-flow pump by using a double-inlet-nozzle. Int. J. Rotating Mach. 2008, 2008, 536850. [Google Scholar] [CrossRef] [Green Version]
  23. Goltz, I.; Kosyna, G.; Delgado, A. Eliminating the head instability of an axial-flow pump using axial grooves. Proc. Inst. Mech. Eng. Part A J. Power Energy 2013, 227, 206–215. [Google Scholar] [CrossRef]
  24. Goltz, I.; Kosyna, G.; Stark, U.; Saathoff, H.; Bross, S. Stall inception phenomena in a single-stage axial-flow pump. Proc. Inst. Mech. Eng. Part A J. Power Energy 2003, 217, 471–479. [Google Scholar] [CrossRef]
  25. Toyokura, T. Studies on the Characteristics of Axial-Flow Pumps: Part 1, General Tendencies of the Characteristics of Pumps. Bull. JSME 1961, 4, 287–293. [Google Scholar] [CrossRef]
  26. Zhang, R. Research on the Stall and Cavitation Flow Characteristics and the Performance Improvement of Axial-Flow Pump. Ph.D. Thesis, Shanghai University, Shanghai, China, 2014. [Google Scholar]
  27. Day, I.J. Stall, surge, and 75 years of research. J. Turbomach. 2016, 138, 011001. [Google Scholar] [CrossRef]
  28. Yamada, K.; Kikuta, H.; Iwakiri, K.; Furukawa, M.; Gunjishima, S. An Explanation for Flow Features of Spike-Type Stall Inception in an Axial Compressor Rotor. J. Turbomach. 2012, 135, 021023. [Google Scholar] [CrossRef]
  29. Paduano, J.D.; Greitzer, E.M.; Epstein, A.H. Compression system stability and active control. Annu. Rev. Fluid Mech. 2001, 33, 491–517. [Google Scholar] [CrossRef]
  30. Tan, C.S.; Day, I.; Morris, S.; Wadia, A. Spike-type compressor stall inception, detection, and control. Annu. Rev. Fluid Mech. 2010, 422, 275–300. [Google Scholar] [CrossRef]
  31. Tahara, N.; Kurosaki, M.; Ohta, Y.; Outa, E.; Nakajima, T.; Nakakita, T. Early stall warning technique for axial-flow compressors. J. Turbomach. 2007, 129, 375–384. [Google Scholar] [CrossRef]
  32. Wang, F.J.; Zhang, L.; Zhang, Z.M. Analysis on pressure fluctuation of unsteady flow in axial-flow pump. J. Hydraul. Eng. 2007, 38, 1003–1009. [Google Scholar]
  33. Zheng, Y.; Liu, J.; Zhou, D.Q.; Mao, Y.T.; Liu, M.Q. Pressure pulsation of model test in large-size axial-flow pump. J. Drain. Irrig. Mach. Eng. 2010, 28, 51–55. [Google Scholar]
  34. Zhang, D.S.; Wang, H.Y.; Shi, W.D.; Pan, D.Z.; Shao, P.P. Experimental investigation of pressure fluctuation with multiple flow rates in scaled axial flow pump. Trans. Chin. Soc. Agric. Mach. 2014, 45, 139–145. [Google Scholar]
  35. Durbin, P.A. Some Recent Developments in Turbulence Closure Modeling. Annu. Rev. Fluid Mech. 2018, 50, 77–103. [Google Scholar] [CrossRef]
  36. Huang, X.; Yang, W.; Li, Y.; Qiu, B.; Guo, Q.; Liu, Z. Review on the sensitization of turbulence models to rotation/curvature and the application to rotating machinery. Appl. Math. Comput. 2019, 341, 46–69. [Google Scholar] [CrossRef]
  37. Pettersson Reif, B.A.; Durbin, P.A.; Ooi, A. Modeling rotational effects in eddy-viscosity closures. Int. J. Heat Fluid Flow 1999, 20, 563–573. [Google Scholar] [CrossRef]
  38. Arolla, S.K.; Durbin, P.A. Modeling rotation and curvature effects within scalar eddy viscosity model framework. Int. J. Heat Fluid Flow 2013, 39, 78–89. [Google Scholar] [CrossRef] [Green Version]
  39. Durbin, P.A.; Reif, B.A.P. Statistical Theory and Modeling for Turbulent Flows, 2nd ed.; John Wiley and Sons: New York, NY, USA, 2010; pp. 231–235. [Google Scholar] [CrossRef] [Green Version]
  40. Pang, K.W.; Huang, X.B.; Liu, Z.Q.; Li, Y.J.; Yang, W.; Lu, J.X. Research on the bifurcation approach for turbulent flows with rotation and curvature: Effect of the base models. Eng. Comput. 2023, 40, 62–99. [Google Scholar] [CrossRef]
  41. Pang, K.W.; Huang, X.B.; Liu, Z.Q.; Li, Y.J.; Yang, W. A Hybrid Model Based on the Bifurcation Approach for Internal Turbulent Flow with Rotation and Streamline Curvature Effects. J. Mar. Sci. Eng. 2022, 10, 2022. [Google Scholar] [CrossRef]
  42. Klein, T.S.; Craft, T.J.; Iacovides, H. Assessment of the performance of different classes of turbulence models in a wide range of non-equilibrium flows. Int. J. Heat Fluid Flow 2015, 51, 229–256. [Google Scholar] [CrossRef]
  43. Argyropoulos, C.D.; Markatos, N.C. Recent advances on the numerical modelling of turbulent flows. Appl. Math. Model. 2015, 39, 693–732. [Google Scholar] [CrossRef]
  44. Liu, B.; Yang, W.; Li, S.; Huang, X. A nonlinear partially-averaged Navier-Stokes model with near-wall correction for separated turbulent flow. Mod. Phys. Lett. B 2021, 35, 2150262. [Google Scholar] [CrossRef]
  45. Pope, S.B. A more general effective-viscosity hypothesis. J. Fluid Mech. 1975, 72, 331–340. [Google Scholar] [CrossRef] [Green Version]
  46. Spalart, P.R.; Shur, M. On the Sensitization of Turbulence Models to Rotation and Curvature. Aerosp. Sci. Technol. 1997, 1, 297–302. [Google Scholar] [CrossRef]
  47. Cazalbou, J.B.; Chassaing, P.; Dufour, G.; Carbonneau, X. Two-equation modeling of turbulent rotating flows. Phys. Fluids 2005, 17, 055110. [Google Scholar] [CrossRef]
  48. Smirnov, P.E.; Menter, F.R. Sensitization of the SST turbulence model to rotation and curvature by applying the Spalart-Shur correction term. J. Turbomach. 2009, 131, 041010. [Google Scholar] [CrossRef]
  49. Durbin, P. Review: Adapting scalar turbulence closure models for rotation and curvature. J. Fluids Eng. Trans. ASME 2011, 133, 061205. [Google Scholar] [CrossRef] [Green Version]
  50. Toh, Y.H.; Ng, B.F. Eddy viscosity modeling around curved boundaries through bifurcation approach and theory of rotating turbulence. Phys. Fluids 2021, 33, 075118. [Google Scholar] [CrossRef]
  51. Menter, F.R.; Kuntz, M.; Langtry, R. Ten Years of Industrial Experience with the SST Turbulence Model. Turbul. Heat Mass Transf. 2003, 4, 625–632. [Google Scholar]
  52. Chesnakas, C.J.; Donnelly, M.J.; Pfitsch, D.W.; Becnel, A.J.; Schroeder, S.D. Performance Evaluation of the ONR Axial Waterjet 2 (AxWJ-2). In Hydromechanics Department Report; No. NSWCCD-50-TR-2009/089. 2009. Available online: https://apps.dtic.mil/sti/pdfs/ADA516369.pdf (accessed on 4 July 2023).
  53. Guo, Q.; Huang, X.B.; Qiu, B.Y. Numerical investigation of the blade tip leakage vortex cavitation in a waterjet pump. Ocean. Eng. 2019, 187, 106170. [Google Scholar] [CrossRef]
  54. Michael, T.J.; Schroeder, S.D.; Becnel, A.J. Design of the ONR AxWJ-2 Axial Flow Water Jet Pump. In Hydromechanics Department Report; No. NSWCCD-50-TR-2008/066. 2008. Available online: https://apps.dtic.mil/sti/citations/ADA489739 (accessed on 4 July 2023).
  55. Celik, I.B.; Cehreli, Z.N.; Yavuz, I. Index of resolution quality for large eddy simulations. J. Fluids Eng. Trans. ASME 2005, 127, 949–958. [Google Scholar] [CrossRef]
  56. Pang, K.W.; Li, Y.J.; Yang, W.; Liu, Z.Q. A cavitation model considering thermodynamic and viscosity effects. Eng. Comput. 2018, 35, 2308–2326. [Google Scholar] [CrossRef]
  57. Richardson, L.F.; Gaunt, J.A. The Deferred Approach to the Limit. Philos. Trans. R. Soc. Lond. Ser. A 1927, 226, 299–361. [Google Scholar]
  58. Wu, J.Z.; Ma, H.Y.; Zhou, M.D. Vorticity and Vortex Dynamics; Springer: Berlin/Heidelberg, Germany, 2006; pp. 55–65. [Google Scholar] [CrossRef]
  59. Fric, T.F.; Roshko, A. Vortical structure in the wake of a transverse jet. J. Fluid Mech. 1994, 279, 1–47. [Google Scholar] [CrossRef] [Green Version]
  60. Ji, B.; Luo, X.; Arndt, R.E.A.; Wu, Y. Numerical simulation of three dimensional cavitation shedding dynamics with special emphasis on cavitation-vortex interaction. Ocean. Eng. 2014, 87, 64–77. [Google Scholar] [CrossRef]
  61. Dong, X.R.; Tian, S.L.; Liu, C.Q. Correlation analysis on volume vorticity and vortex in late boundary layer transition. Phys. Fluids 2018, 30, 014105. [Google Scholar] [CrossRef]
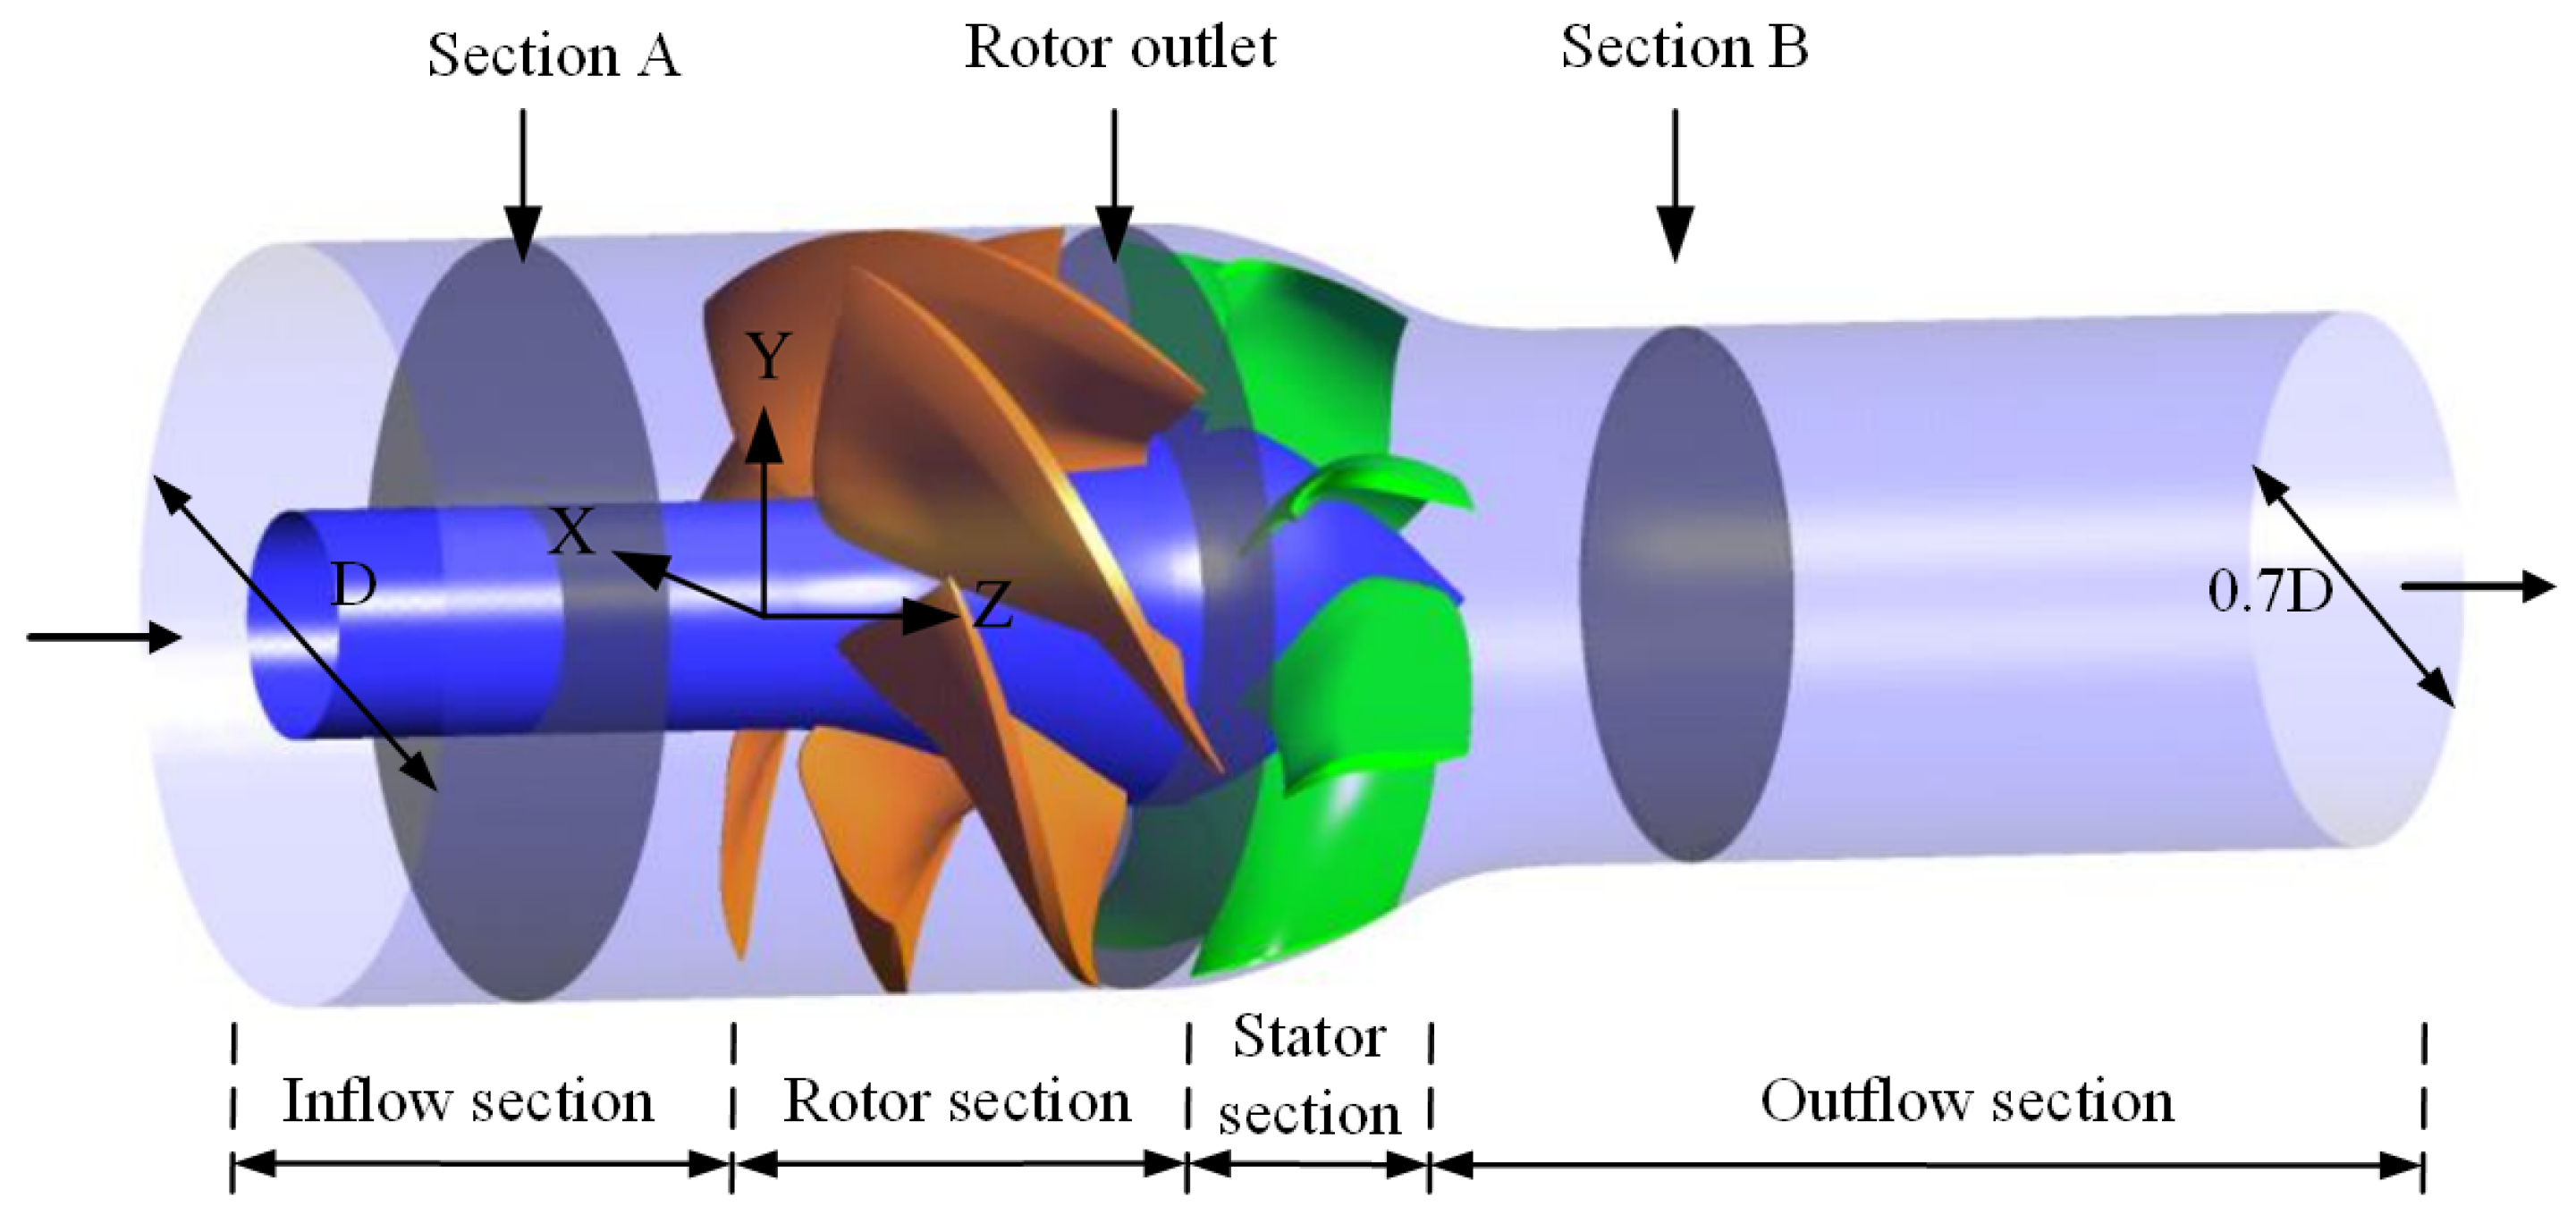
Figure 1. The sketch of the axial water jet pump (AxWJ-2).
Jmse 11 01549 g001
Figure 2. Schematic diagram of the grid used in the axial water jet pump.
Jmse 11 01549 g002
Figure 3. Comparison of performance curve of the water jet pump with CFD and experiment. Experiment data from Chesnakas et al. [52]. Q*: non-dimensional flow coefficient. H*: non-dimensional head coefficient. P*: non-dimensional power coefficient. η : non-dimensional efficiency.
Jmse 11 01549 g003
Figure 4. Comparison of axial velocity component along the radius of the rotor outlet section with CFD and experiment. Experiment data from Chesnakas et al. [52]. R is the dimensionless radius.
Jmse 11 01549 g004
Figure 5. Contour plots of axial velocity distribution of outlet section under design condition. (a) Numerical simulation results. (b) Experimental results. Experiment data from Chesnakas et al. [52].
Jmse 11 01549 g005
Figure 6. The sketch of the axial pump and the boundary conditions.
Jmse 11 01549 g006
Figure 7. The schematic diagram of the locations of the fixed monitoring points.
Jmse 11 01549 g007
Figure 8. The schematic diagram of the locations of the rotating monitoring points. (a) Schematic diagram of pressure monitoring points arranged on the blade pressure surface, suction surface, and two passages A and B. (b) Schematic diagram of the locations of pressure monitoring points arranged on the pressure surface of the blade. (c) Schematic diagram of the locations of suction monitoring points arranged on the pressure surface of the blade.
Jmse 11 01549 g008
Figure 9. Schematic diagram of the grid used in the axial-flow pump. (a) Grid distribution in the full computing domain. (b) Grid distribution in the impeller. (c) Grid distribution in the guide vance.
Jmse 11 01549 g009
Figure 10. The discretization error estimation with the grid convergence index (GCI) method. (a) The head-flow curves of three sets of grids. (b) Fine-grid solution with discretization error bars (representing GCI).
Jmse 11 01549 g010
Figure 11. Streamline distribution diagram of blade PS under different flow conditions. Tailing edge of the blade (TE). Leading edge of the blade (LE). (a) 0.7Qd; (b) 0.6Qd; (c) 0.56Qd; (d) 0.55Qd, (e) 0.54Qd; (f) 0.4Qd.
Jmse 11 01549 g011
Figure 12. Streamline distribution diagram of SS at different flow rates. (a) 0.7Qd; (b) 0.6Qd; (c) 0.56Qd; (d) 0.55Qd; (e) 0.54Qd; (f) 0.4Qd.
Jmse 11 01549 g012
Figure 13. Schematic diagram of the position of the circumferential unfolding surface near the shroud (r/R = 0.98).
Jmse 11 01549 g013
Figure 14. Velocity vector diagram in impeller under different flow conditions on spanwise section at r/R = 0.98. (a) 0.7Qd; (b) 0.6Qd; (c) 0.56Qd; (d) 0.55Qd; (e) 0.54Qd; (f) 0.4Qd. Red arrow: the mainstream. Black arrow: the blade trailing edge shedding flow. Magenta arrow: the leading-edge separation vortex. Green arrow: the backflow near the trailing edge. Purple arrow: the tornado-like separation vortex. Blue arrow: the backflow at impeller inlet.
Jmse 11 01549 g014
Figure 15. The Q-criterion iso-surface of the impeller at a certain time under different working conditions. At the same time, the streamlines gather around the leading-edge separation vortex. (a) 0.7Qd; (b) 0.6Qd; (c) 0.56Qd; (d) 0.55Qd; (e) 0.54Qd; (f) 0.4Qd.
Jmse 11 01549 g015
Figure 16. The vorticity stretching term distribution on the spanwise section of the impeller under different flow conditions at r/R = 0.98. (a) 0.7Qd; (b) 0.6Qd; (c) 0.56Qd; (d) 0.55Qd; (e) 0.54Qd; (f) 0.4Qd.
Jmse 11 01549 g016
Figure 17. The contour of average turbulent dissipation rate distribution on the spanwise section of the impeller under different flow conditions at r/R = 0.98. (a) 0.7Qd; (b) 0.6Qd; (c) 0.55Qd; (d) 0.4Qd.
Jmse 11 01549 g017
Figure 18. Impeller inlet pressure fluctuation coefficient at different flow conditions. (a) Frequency domain diagram of Cf near shroud wall IN5 monitoring point. (b) Cf amplitude of monitoring points at the impeller inlet.
Jmse 11 01549 g018
Figure 19. The frequency domain diagram of pressure fluctuation at each monitoring point at the impeller outlet under different flow conditions. (a) OUT1 monitoring point; (b) OUT2 monitoring point; (c) OUT3 monitoring point; (d) OUT4 monitoring point; (e) OUT5 monitoring point; (f) OUT6 monitoring point.
Jmse 11 01549 g019
Figure 20. Impeller outlet pressure fluctuation coefficient under different flow conditions. (a) Frequency domain diagram of pressure fluctuation SH3 monitoring point. (b) Fluctuation amplitude of monitoring points at impeller outlet.
Jmse 11 01549 g020
Figure 21. Time domain diagram of suction surface pressure fluctuation of impeller blade under different flow conditions at SSU1 and SSU5 monitoring points. (a) SSU1 monitoring point under 0.7Qd; (b) SSU5 monitoring point under 0.7Qd; (c) SSU1 monitoring point under 0.6Qd; (d) SSU5 monitoring point under 0.6Qd; (e) SSU1 monitoring point under 0.55Qd; (f) SSU5 monitoring point under 0.55Qd.
Jmse 11 01549 g021
Figure 22. Frequency domain diagram of pressure fluctuation at different monitoring points of the suction surface of the impeller blade under different flow conditions. (a) 0.7Qd; (b) 0.6Qd; (c) 0.56Qd; (d) 0.55Qd; (e) 0.54Qd; (f) 0.4Qd.
Jmse 11 01549 g022
Figure 23. Frequency domain diagram of pressure fluctuation in suction surface of impeller blades at different monitoring points under different flow conditions. (a) 0.7Qd; (b) 0.6Qd; (c) 0.56Qd; (d) 0.55Qd; (e) 0.54Qd; (f) 0.4Qd.
Jmse 11 01549 g023
Figure 24. Frequency domain diagram of pressure fluctuation in the suction surface and pressure surface of impeller blades and A and B flow passages of the impeller at U1 monitoring points under different flow conditions. (a) 0.7Qd; (b) 0.6Qd; (c) 0.56Qd; (d) 0.55Qd; (e) 0.54Qd; (f) 0.4Qd.
Jmse 11 01549 g024
Table 1. Calculations of the discretization error for the mesh.
0.55Qd—H0.6Qd—H1.0Qd—H0.55Qd—η0.6Qd—η1.0Qd—η
φ110.10847 m9.93663 m6.71020 m61.91716%67.94442%88.71793%
φ210.11245 m9.93153 m6.76776 m61.72005%67.69318%89.09831%
φ310.11776 m9.83582 m6.79235 m60.95363%66.25159%88.60572%
φext10.12525 m9.91512 m6.95290 m61.08598%66.88495%90.32200%
eext0.217%0.166%3.491%1.361%1.584%1.776%
GCIfine0.0235%0.0307%0.512%0.112%0.130%0.1507%
Disclaimer/Publisher’s Note: The statements, opinions and data contained in all publications are solely those of the individual author(s) and contributor(s) and not of MDPI and/or the editor(s). MDPI and/or the editor(s) disclaim responsibility for any injury to people or property resulting from any ideas, methods, instructions or products referred to in the content.