Article

Critical Node Identification of Multi-UUV Formation Based on Network Structure Entropy

1
School of Marine Science and Technology, Northwestern Polytechnical University, Xi’an 710072, China
2
Research & Development Institute of Northwestern Polytechnical University, Shenzhen 518057, China
*
Author to whom correspondence should be addressed.
J. Mar. Sci. Eng. 2023, 11(8), 1538; https://doi.org/10.3390/jmse11081538
Submission received: 7 July 2023 / Revised: 29 July 2023 / Accepted: 30 July 2023 / Published: 1 August 2023
(This article belongs to the Special Issue Autonomous Marine Vehicle Operations)

Abstract

:
In order to identify and attack the multi-UUV (unmanned underwater vehicle) groups, this paper proposes a method for identifying the critical nodes of multi-UUV formations. This method helps in combating multi-UUV formations by identifying the key nodes to attack them. Moreover, these multi-UUV formations are considered to have an unknown structure as the research object. Therefore, the network structure of the formation is reconstructed according to its space–time trajectory, and the importance of nodes is determined based on network structure entropy. As for the methodology, firstly, based on the swarm intelligence behavior method, the motion similarity of multi-UUV nodes in the formation is analyzed in pairs; furthermore, the leader–follower relationship and the network structure of the formation are calculated successively. Then, based on this network structure, the importance of the network nodes is further determined by the network structure entropy method. Finally, through simulation and experiments, it is verified that the algorithm can accurately construct the network structure of the unknown multi-UUV formation, and the accuracy of the calculated time delay data reaches 84.6%, and compared with the traditional information entropy algorithm, the ordering of the important nodes obtained by this algorithm is more in line with the underwater formation network.

1. Introduction

Compared to a single UUV, multi-UUV formations have the advantages of modularity, high fault tolerance, high efficiency, etc., and they can also complete more challenging work through cooperation between them [1]. While the technology of using multiple UUV formations for coordinated search and exploration operations is becoming more sophisticated, this technology poses a threat to national maritime security. Facing the increasingly complex UUV formation structure, it is of great significance to effectively configure the UUV nodes in different positions according to the position relationship and the importance of UUV nodes in the cluster, save the equipment costs, improve the formation operation efficiency, or strike the important nodes of the enemy’s UUV formation to reduce the efficiency of the formation operation at a minimum cost [2].
The coordinated behavior of the underwater formations can be viewed as a form of grouping of collaborative intelligence, which represents the traits of a group intelligence behavior displayed by individuals with simple intelligence through mutual cooperation and organization while maintaining the naturally distributed and self-organizing characteristics [3,4]. In nature, there are several groups of cooperative intelligent behaviors, such as flocks of birds and fish migrating in groups to adapt to air or seawater [5,6]. For instance, using high-precision GPS tracking of pairs of pigeons, Biro et al. found that if the conflict between two birds’ directional preferences was small, individuals averaged their routes [7]. This study shows that there is a leadership relationship exists between pairs of pigeons when the directional relationship between them exceeds a certain value. Based on the behavioral characteristics of crowd intelligence, several scholars have carried out a lot of research on this topic. Based on the leadership stability of the flock, Huo et al. designed a control model suitable for heterogeneous formation flight of UAVs, aiming to effectively avoid obstacles in unknown environments [8]. Moreover, Park and Kahng proposed a synchronous leader–follower switching method by observing the migration pattern of birds [9]. Furthermore, for hierarchical leader–follower networks with time-varying layer-to-layer delay, Xu et al. propose a new Hierarchical Event-based Control (HEC) algorithm [10].
With the increase in UUV formation members, a complex network, along with complex interaction relationships and a large number of nodes, has been formed; therefore, it is necessary to further explore the impact of nodes on the entire network and improve the management and the control efficiency of the actual UUV network [11]. Currently, the identification methods of the critical nodes are mainly divided into adjacent node methods and path propagation methods, such as the degree centrality method [12], the local centrality method [13], and the mesocentric method [14]. For instance, Kitsak et al. believed that the location of a node in the center of the network indicates that the node is more critical, and they proposed a K-core decomposition method based on this theory [15]. Moreover, Yu et al. identified the key nodes from the perspective of entropy by using the impact of node clustering coefficient and the number of first and second-order neighbors on the node importance [16]. In addition, Wang et al. proposed a novel community-based method to identify a set of vital nodes for influence maximization in the attributed networks [17]. Finally, Jiang et al. developed an attenuation-based supra-adjacency matrix (ASAM) modeling method to further evaluate the importance of the nodes by calculating the similarity between adjacent layers and the cross-layer networks [18].
For underwater confrontation scenarios, Liu et al. proposed a multi-UUV maneuvering decision-making algorithm for a counter-game with a dynamic target scenario [19]. The algorithm uses interval intuitionistic fuzzy rules to model the game and uses fractional order recurrent neural networks (RNN) to achieve optimal maneuvering strategies for the confrontation. From another point of view, considering the characteristics of large delay of underwater communication, the algorithm proposed in this paper is to reconstruct the network structure of enemy formation based on the time delay from the perspective of identification-strike, and then rank the importance of nodes based on the network, in order to strike the critical nodes of enemy formation to maximize the destruction of enemy combat effectiveness for confrontation. The innovations of this paper mainly include: 1. proposing a network reconstruction algorithm for unknown structure underwater formation, and reconstructing the formation network structure through its spatiotemporal trajectory; 2. based on the formation network, proposing a critical node identification algorithm with comprehensive importance network structure entropy to analyze the importance of each node in the multi-UUV formation.
To sum up, this paper is divided as follows: in Section 2, the formation network reconstruction is provided whereas the key node identification algorithm is presented in Section 3. As for Section 4, it represents the results and the discussion and finally, the conclusion and some future works are proposed in Section 5.

2. Formation Network Reconstruction

2.1. Leader–Follower Relationship

According to the analysis method of group intelligence behavior, the formation with group intelligence has some similarity with the leader in behavioral actions, and there is a hierarchical relationship characterized by the time delay between individuals [20]. For example, in a pigeon flock, the follower pigeons will observe the movements of the leader pigeons visually and make corresponding movements to maintain the consistency of the formation. In the underwater formation, other UUVs follow the trajectory of the leader UUV and keep the relative angle and distance to stabilize the formation, i.e., there are also motion similarities between individuals and leaders in the group. In reverse analysis, the leader–follower relation between UUVs in underwater formations can be derived based on their motion similarity analysis. The spatiotemporal trajectory data of UUV nodes is analyzed in arbitrary pairs by using the correlation function, and the obtained correlation coefficient can be used to characterize the motion similarity between the paired UUVs. Moreover, when the corresponding motion correlation coefficient remains at a fairly high value at any given moment, it can be regarded as the behavior of one UUV being “inherited” by another one, that is, it is considered that there is a leader–follower relation between the UUVs. Among them, the “inherited” behavior is to follow the UUV whereas the other is to pilot the UUV. To quantify this link, the spatiotemporal trajectory function of any UUV in the formation and other UUVs is analyzed to determine the motion correlation, and the motion similarity function is established as follows:
R i j t τ = d o t u i t ,   u j t + τ
where u i t represents the UUV i ’s normalized speed at moment t , u j t + τ represents the UUV j ’s normalized speed at moment t + τ , τ is time delay which is a variable, d o t is the inner product operator sign, and R i j t τ is the function of the motion correlation coefficient between UUV i and UUV j at time t but for different delay times.
In addition, we set a threshold R T : when the motion correlation coefficient at a certain point in time is bigger than the threshold (e.g., R i j t τ > R T ), it is believed that there is a leader–follower relation between the two UUVs at this moment. Therefore, in order to better determine the appropriate delay time, in the actual calculation process, individual motion correlation coefficients, having smaller values than the threshold, and mainly caused by the instability of the data or the error of acquiring the data, are used. Thus, the average motion correlation coefficient is determined as follows:
R i j τ = 1 m t 1 Σ m t 1 t = 1 R i j t τ
where m t is the number of spatiotemporal trajectories, t 1 , m t 1 , that is, a total of m t 1 motion correlation coefficients are generated in m t trajectory points at time delay τ . R i j τ is the average motion correlation coefficient between the UUV i and UUV j at different delay times τ . Moreover, the similarity of motion between the pairs of UUV is determined.
By establishing the above similar motion model, the correlation coefficient R i j τ relative to the action between the paired UUVs under different time delays τ is obtained, and the threshold to R T is set. Moreover, if R i j τ > R T is obtained for any value of τ , it is considered that there is a leader–follower relationship between the paired vehicle; therefore, the delay time τ resulting in the maximum value of R i j τ is defined to be the relevant time delay between the paired UUV i and UUV j , and it will be denoted by τ i j * . Thus, the next step consists of setting the time delay matrix T n × n = τ i j * to represent the delay relationship between the formation UUVs: when τ i j * is positive, it means that the navigation direction of UUV i is ahead of the UUV j , that is, UUV i is the leader, and UUV j is the following UUV. However, if τ i j * is negative, the roles of the UUVs are the opposite.

2.2. Formation Hierarchy

Limited by the narrow bandwidth of the underwater acoustic channel and the UUV formation method, the UUV formation movement mostly adopts a hierarchical interaction structure [21]. Moreover, it is faster and more efficient in navigation and command execution than in the equal interaction structure. While using hierarchical interaction in the underwater unmanned cluster formation, there is a hierarchical structure relationship between UUVs, and the higher the level of UUVs, the better its control and the greater the importance in the formation network will be.
Based on the similar motion model, the leader–follower relationship between all UUVs and other UUVs in the formation is obtained and the hierarchical relationship of the entire network is analyzed. In the leader–following model, the movement command is issued according to the hierarchy, and the UUV at the top of the hierarchy has a certain leadership relationship with the other UUVs. However, when both UUV i and UUV j of the previous level have a leadership relationship with the UUV k pair of the next level, returning to the judgment of the time delay τ * is performed: if τ j i * > τ k i * > 0 , it Is considered that it has a leadership following relationship of the UUV with a smaller delay, that is, UUV k has a leadership relationship with UUV j .

2.3. Network Weight Matrix

In the network topology diagram, there is a certain weight coefficient between the two nodes to characterize the location proximity relationship between them. For example, when vertices represent some physical locations, the weight of the edge between two vertices can be set to the actual distance. During network formation, the distance between the different UUVs reflects the proximity relationship between the nodes, and here the normalized distance is used to represent the weight of the connected edges of nodes, usually the closer the distance the more reliable the interaction between two nodes is, and the weight of the connected edges is considered to be higher. Moreover, the distance d i j between UUV i and UUV j is normalized as one of the factors affecting the weights on the edges; thus, one can get the following equation:
D i j = d i j min i , j d i j max i , j d i j min i , j d i j
where D i j is the result of normalized distance d i j . In addition, considering that the correlation between the different UUVs is related to the motion similarity, higher motion similarity implies higher inheritance, and the more important the connected edge is considered to be. Thus, the average motion correlation coefficient R i j τ * of UUV i and UUV j at the time delay τ i j * is introduced into the weights on the edges of both nodes i and j in the network topology. It is then combined with the above-normalized distance in order to obtain the weight on the edge formed by both nodes:
w i j = 1 D i j + R i j τ *

2.4. Mobile Formation Network Structure

According to the above steps, the leader–follower relationship, the hierarchical structure, and the weights on the edges of two nodes in the network were obtained. Therefore, the adjacency matrix A n × n = a i j , pointed to the network nodes, and the weight matrix W n × n = ω i j representing the weights of the nodes, was established. In this matrix, if there is a leader–following relationship between nodes, the value of the cell will be equal to one (e.g., a i j = 1 ), and vice versa, the absence of a relation yields a null value (e.g., a i j = 0 ). Based on these definitions, we attained a map of the network topology of the mobile UUV formation. The following guidelines are made when creating the network topology diagram, though, in order to be more in line with the characteristics of the underwater cluster formation. This is because underwater communication has a distance limit, each UUV in the unmanned cluster formation has a different task, and the sensors carried on the boat are also different. Information is only dealt with layer by layer across neighboring levels; each UUV only receives instructions provided by one UUV, but can issue instructions to several UUVs. Thus, through regular filtering, the network structure reconstruction of the mobile UUV formation is completed.

3. Key node Identification Algorithm

3.1. Network Structure Model

In order to represent the connection between the different individuals in the mobile UUV formation in a more intuitive and clear way, the use of diagrams, where the nodes represent UUVs and the edges represent the interconnections between UUVs, was the applied solution. This network structure model is usually expressed as G = V , E , W , where V = v 1 , v 2 , , v n is the set of network nodes and n = V is the total number of nodes in the network. Moreover, E = e 1 , e 2 , , e m is the set of edges between nodes, and m = E is the total number of edges in the network. Finally, W = w i j N × N represents the weight matrix where w i j represents the weight value on the edge of nodes i and j , and generally has w i j w j i in directed networks. As for a weighted network, it can be thought of as a weighted network with all the weight values of 1. Finally, it is important to mention that there are four basic types of networks: undirected networks, weighted undirected networks, unweighted directed networks, and weighted directed networks [22]. All types are shown in Figure 1:

3.2. Network Structure Entropy

In the network topology, the performance of the network scalelessness is considered a kind of network “heterogeneity”, and this “heterogeneity” of complex networks can be described using the concept of “entropy”, that is, the entropy of the network structure [23].
In order to better establish the entropy model based on the network structure, the following keywords have been defined:
(1) Degree value. The degree value of a node is called the node strength, and the degree k i of node v i is defined as the number of nodes directly connected to the node v i . Moreover, k i is expressed using the following relation:
k i = Σ n j   Γ i v i j
where Γ i is the collection of neighbor nodes of the particle node v i . As for the weighted network,
k i = Σ j   Γ i w i j
where w i j is the weight on the edge connecting node v i to node v j . In a directed network, the degree value of a node is divided into an outdegree value and an in-degree value, and it is generally believed that both values have different effects on the node, that is
k i = λ k i i n + 1 λ k i o u t
where k i i n and k i o u t are the indegree and outdegree values of node v i , respectively, and λ is the influence coefficient. When λ > 0.5 , the relevance of the node is thought to be more influenced by its input strength.
(2) Adjacency. To more accurately reflect the impact of a node on its connected neighbor nodes, the adjacency of a node is defined as follows:
Q i = w   Γ i k i w + w   Γ i k w i
where k i w and k w i are the degree value of the node pointing to v i and the node pointed by v i in the neighboring nodes of node v i , Γ i is the set of neighbor nodes of node v i , and Q i is the degree of adjacency of node v i (the greater the value of Q i is, the higher its impact on neighboring nodes will be).
(3) Importance. The nodes in the network affect each other, and considering only the degree value will lose the influence of indirect neighbors on the nodes, and considering the global nodes will increase the complexity of the algorithm, and the effect may not be very good. The influence of a node is limited, and it only has a large influence on its nearby neighbors. The probability function is used to describe the chance to select a given node among its neighbors, which is defined as:
p i = k i Q j ,   j Γ i
In the entropy of network structures based on the node degree, the probability functions can be used to express the importance of nodes. However, in underwater mobile formations, often the higher the level of UUV is, the greater its importance will be. Therefore, considering the importance of the degree and level of nodes, the comprehensive importance is introduced to express the importance of the network nodes. Considering that the control commands and the information transmission in the formation are carried out layer by layer, the high-level UUV will have an impact on the low-level UUV; therefore, for an N-level network, the importance of the hierarchical nodes should be continuously reduced, and the weight factor δ i of the nodes on the level n is expressed as follows:
δ i = 1 N N n + 1
The comprehensive importance of the node is calculated as follows:
H i = p i δ i = k i Q j 1 N N n + 1
(4) Network structure entropy. Information entropy uses probabilistic and statistical methods to measure the complexity of a system, which represents the expectation of the amount of information brought by all possible events, and it can be used as well to measure the importance of network nodes. Consider the unrelated events x and y to be equal to the sum of the information obtained when the observed events occur at the same time, that is h x , y = h x + h y , and p x , y = p x × p y . Therefore, it can be obtained that h x must be related to the logarithm of p x . Thus, the relation between both variables can be written as follows:
h x = log 2 p x
Moreover, the expected amount of information is defined as follows:
E = E h x = Σ n i = 1 p x log 2 p x
Make sure, at this level, that the information entropy value is always positive, take the absolute value of the node information entropy when calculating it, and replace the probability function with the comprehensive importance H i to obtain the entropy E i of the collar network structure. Therefore, the resulting equation is as follows:
E i = j Γ i H i log 2 H i

3.3. Critical Node Identification Algorithm

By analyzing the interaction between the nodes and their indirect nodes, the entropy of the network structure is used to measure the importance of several nodes in the network. Considering that in the formation network structure, the instruction is transmitted from a high level to a low-level UUV, the node importance of the directed network is only analyzed; therefore, it is considered that the entry value of the node is smaller than the influence of the degree value on the node, and the impact factor is λ = 0.45 . In more detail, the milestone algorithm steps are presented as follows:
Step 1: Analyze the formation network according to the mobile UUV formation spatiotemporal trajectory meter and get the adjacency matrix A and the weight matrix W .
Step 2: Calculate the node degree value according to the difference between the node outdegree and indegree:
k i in = j Γ i w j i
k i o u t = j Γ i w i j
k i = λ k i i n + 1 λ k i o u t
Step 3: Calculate the degree of adjacency:
Q j = λ w Γ j k w j + 1 λ w Γ j k w j
Step 4: Calculate the overall importance:
p i = k i Q j ,   j Γ i
H i = p i δ i
Step 5: Calculate the entropy of the network structure:
E i = j Γ i H i log 2 H i
The calculation process is shown in Figure 2. Based on the above steps, the network structure entropy of each node in the network can be calculated. According to the size of entropy, each node is ordered, and the node entropy value is classified from large to small corresponding to the importance of this node.

4. Validation and Analysis

The identification of the key nodes of the mobile UUV formation is to establish the network topology of the mobile formation by analyzing spatiotemporal trajectories in order to further rank the importance of the nodes by the key node identification algorithm. Therefore, this section sets up the simulation experiments and the lake experiments to verify the efficiency of the proposed algorithm.

4.1. Simulation and Experiments Analysis

In order to verify the effectiveness of the key node identification algorithm based on the entropy of the network structure, this section uses Matlab© to perform the simulation experiments. Based on the leader–follower formation control model, we considered one leader and seven followers to navigate a “U” trajectory in a triangular formation to verify the discrimination effect of the algorithm. In this simulation, the distance matrix d and delay matrix T are set as follows. (In the matrix d   A   W , the element 0 indicates that the two nodes are not directly related and have no real physical significance):
d = 0 10 10 0 0 0 0 0 10 0 0 0 6 0 6 0 10 0 0 6 0 6 0 0 0 0 6 0 0 0 0 5 0 6 0 0 0 0 0 0 0 0 6 0 0 0 0 0 0 6 0 0 0 0 0 0 0 0 0 5 0 0 0 0 , T = 0 1 2 3 3 3 3 4 1 0 0 1 2 1 2 3 2 0 0 1 1 1 1 2 3 1 1 0 0 0 0 1 3 2 1 0 0 0 0 1 3 1 1 0 0 0 0 1 3 2 1 0 0 0 0 1 4 3 1 1 1 1 1 0
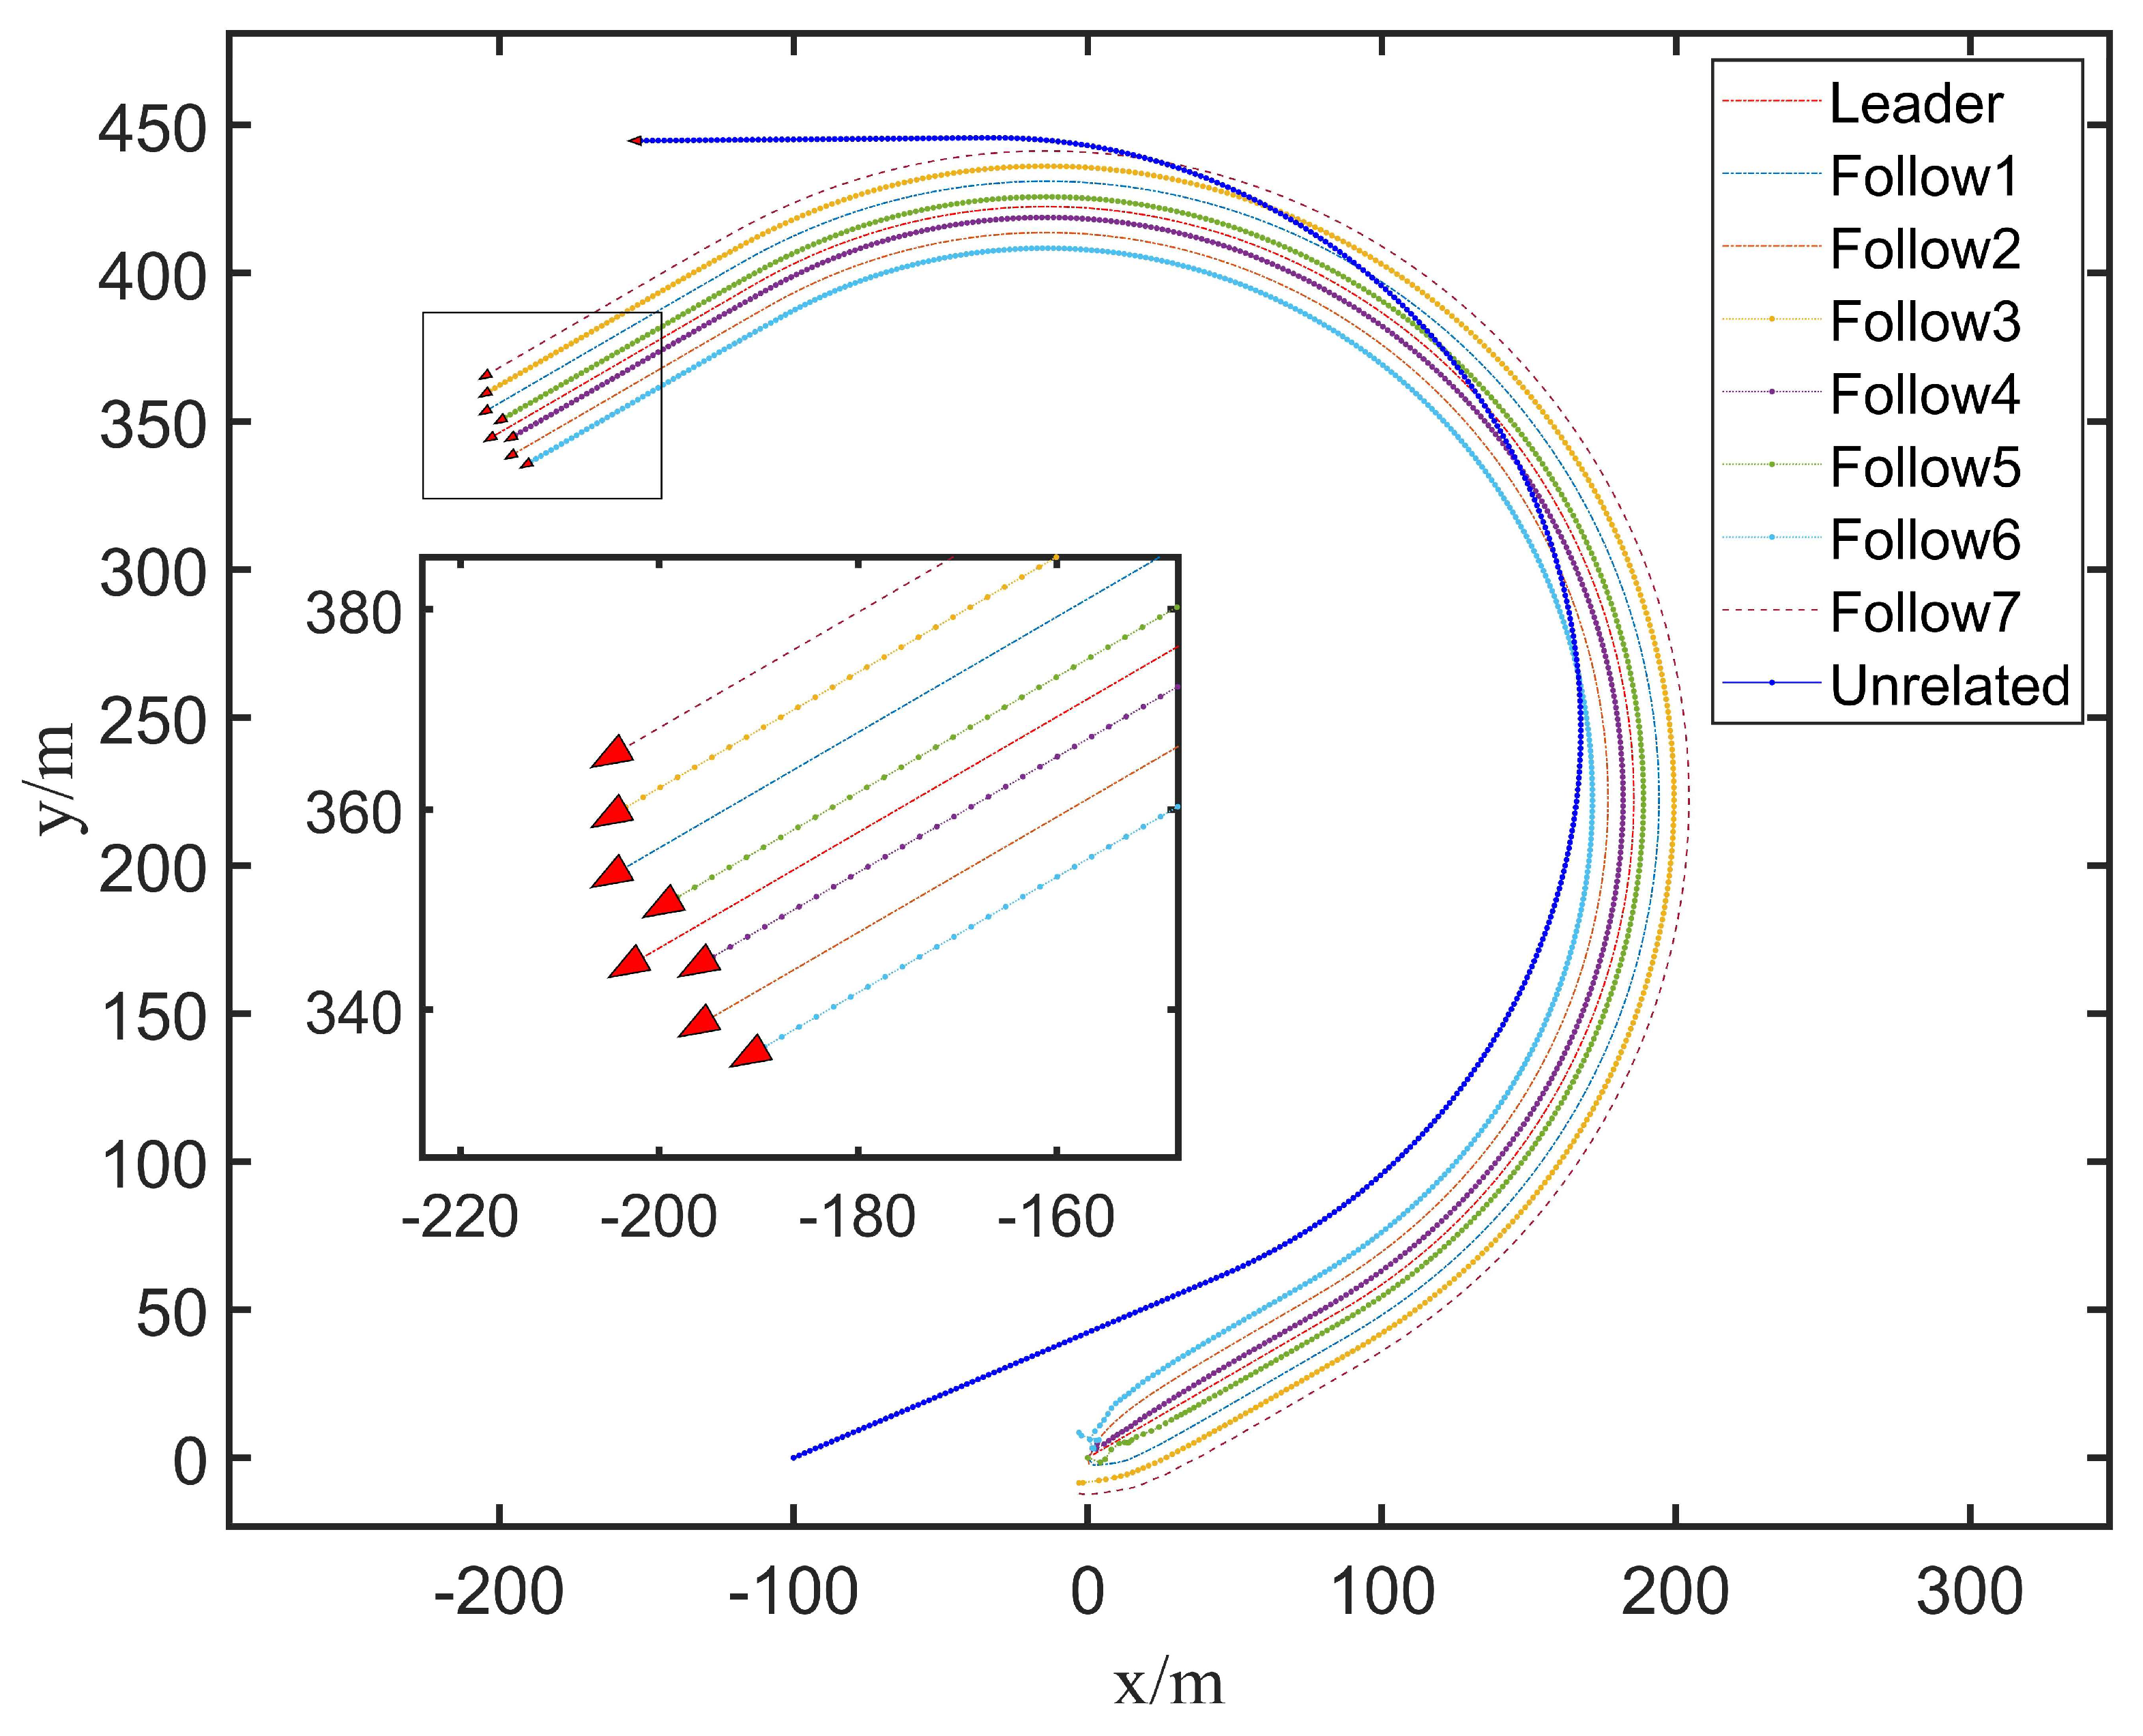
In addition, we added the trajectory of an unrelated UUV to the formation in the simulation to compare and judge the effects of this additional feature. Therefore, the simulation results are displayed in Figure 3.
Figure 3 shows that the follower trajectories the leader well at a predetermined angle and distance based on the influence of the controller. Then, a pairwise analysis was performed on the spatiotemporal trajectories of all UUVs using the aforementioned motion similarity model. The delay matrix and the motion correlation coefficient (refer to Table 1) of the UUV formation are calculated as follows:
T U = 0 1 2 3 3 3 3 4 6 1 0 0 2 2 1 2 3 6 2 0 0 1 2 1 2 3 6 3 2 1 0 0 0 0 1 6 3 2 2 0 0 0 0 1 6 3 1 1 0 0 0 0 2 6 3 2 2 0 0 0 0 1 6 4 3 3 1 1 2 1 0 6 6 6 6 6 6 6 6 6 0
By comparing the time delay matrix T and T U , the accuracy of the time delay data obtained by the algorithm was 84.6%, and in addition, the erroneous time delay data did not appear between nodes with the direct leader–follower relationships, and the erroneous data did not affect the accuracy of the subsequent reconstruction of the formation network structure. Based on the above delay matrix, the time delay between UUVs with a leader–following relationship represents an antisymmetric transfer, and the positive and negative delays indicate whether the UUV is following or being followed. Moreover, these values also specified the delay time for the follower to receive the leader’s movement information and take action, which is in line with the law of following a relationship. When the time delay was null, it means that there was no leader–following relationship between the paired UUVs.
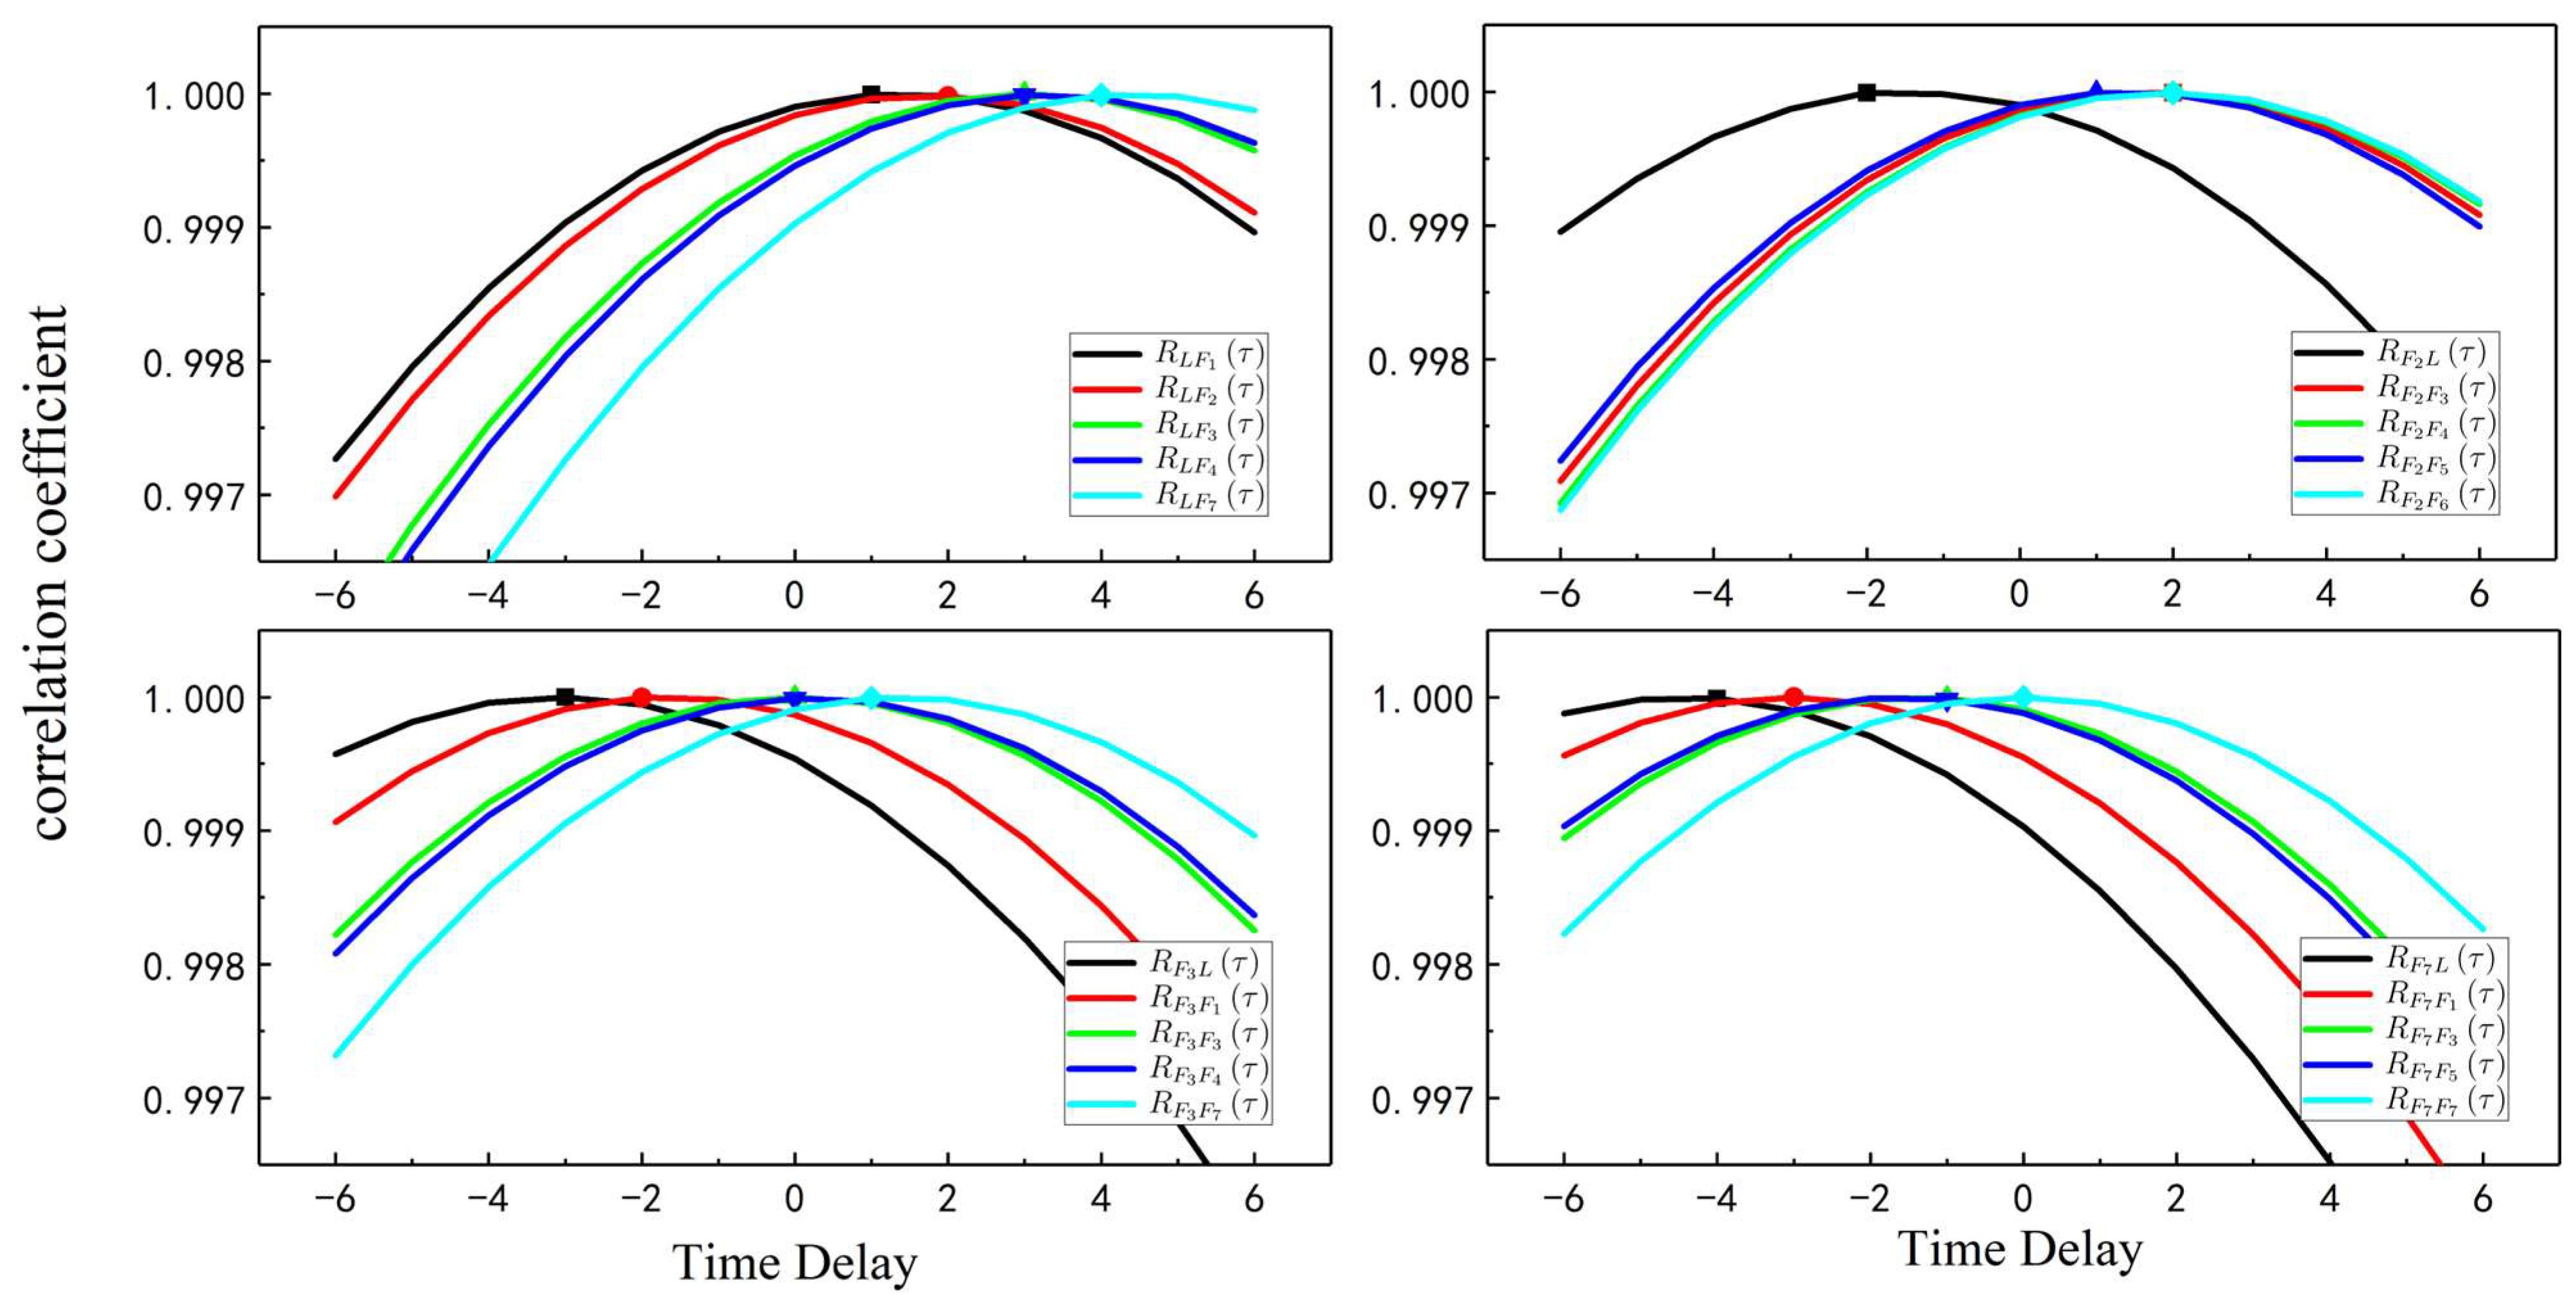
Referring to Table 1, the correlation coefficient corresponds to the time delay, and the motion correlation coefficient between the UUVs is varying at different time delays, as shown in Figure 4. Since the leader following the model does not introduce errors, such as propulsion, hydroacoustic delay, and complex environmental interference, the motion correlation coefficient between each UUV at the corresponding delay time was very large; however, when being compared to the motion correlation coefficient of the unrelated-UUV, there was a significant gap, and the unrelated UUV’s motion correlation coefficient was much smaller than others. Setting the threshold value R min = 0.9 , and as R u n r e t a e d τ * < R min , the correlation coefficient of the motion of the unrelated UUV and any other UUV was less than the threshold; therefore, it is considered that the unrelated UUV does not have a leader–follower relationship with any other UUV.
Referring to the T U matrix Equation (23), and according to the size of the delay, the leader–following relationship of UUVs between pairs was judged, and it was sorted according to the leader–follower level, and the following points were calculated: all followers had a following relationship for the leader, whereas Follow1 and Follow2 had a leadership relationship for the remaining UUVs, and Follow3, Follow4, Follow5, and Follow6 had a leadership relationship for Follow7.
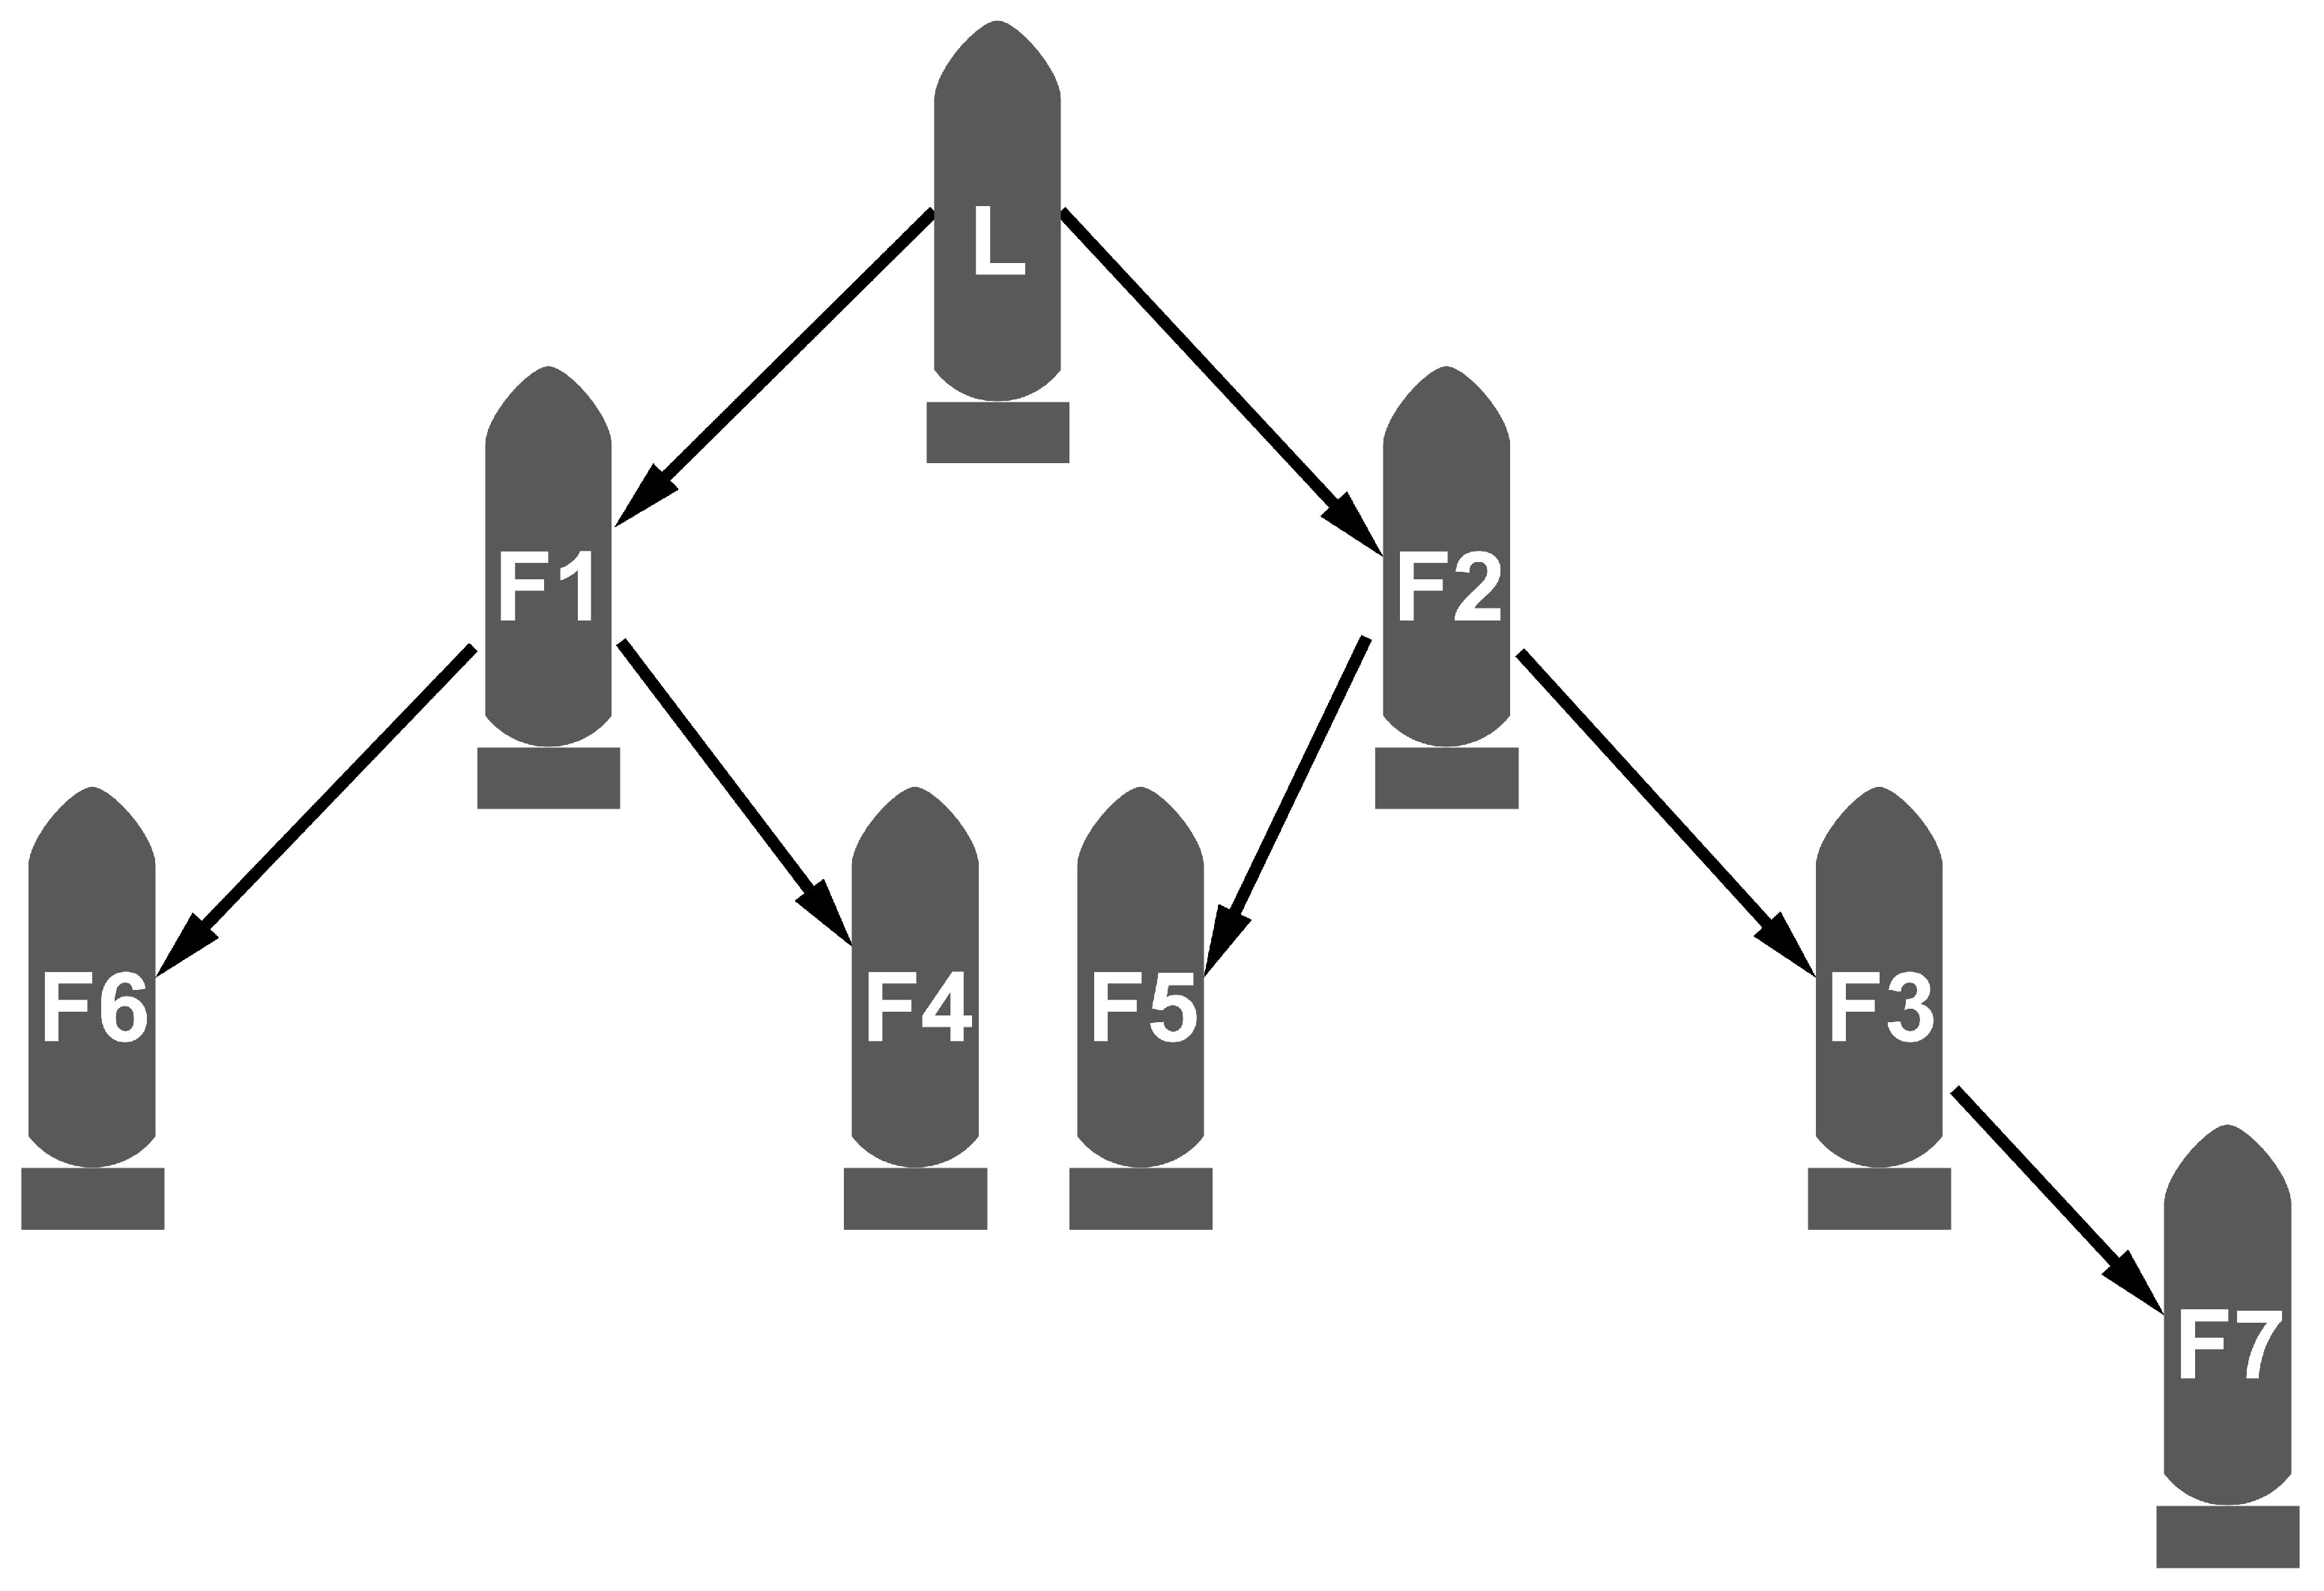
Therefore, the formation network hierarchy was obtained: the UUV leader belonged to the first level, Follow1, Follow2 were part of the second level, Follow3, Follow4, Follow5, and Follow6 belonged to the third level, and, finally, Follow7 belonged to the fourth level. The network relationship, obtained through the above analysis, was still relatively complex where one UUV had a following relationship with multiple UUVs at the same time. Considering the communication restrictions of the underwater formation, etc., it was considered to have a following relationship with the nearest vehicle. Through the analysis of the network again using this rule, the network structure of the formation can be obtained, as shown in Figure 5.
Therefore, the collar matrix A of the formation network was obtained as follows, and, when being combined with the behavioral correlation coefficient matrix, it was brought into the established node edge weight coefficient model; hence, the weight coefficient matrix W of the formation network can be expressed as follows:
A = 0 1 1 0 0 0 0 0 1 0 0 0 1 0 1 0 1 0 0 1 0 1 0 0 0 0 1 0 0 0 0 1 0 1 0 0 0 0 0 0 0 0 1 0 0 0 0 0 0 1 0 0 0 0 0 0 0 0 0 1 0 0 0 0
W = 0 2 2 0 0 0 0 0 2 0 0 0 1.2 0 1.2 0 2 0 0 1.2 0 1.2 0 0 0 0 1.2 0 0 0 0 1 0 1.2 0 0 0 0 0 0 0 0 1.2 0 0 0 0 0 0 1.2 0 0 0 0 0 0 0 0 0 1 0 0 0 0
According to the formation network structure and its corresponding collar relationship and weight coefficient matrices, the node importance is calculated by using the network structure entropy model. Firstly, according to the adjacency and the weight matrices of the network, the input intensity value k i i n and the output intensity value k i o u t of each node are calculated. Moreover, according to Equation (17), the comprehensive strength value of each node is calculated to get Table 2.
Then, also taking λ = 0.45 , according to Equation (18), the comprehensive adjacency strength value q of the node is calculated as shown in Table 3.
Finally, according to Equation (21), the entropy of each network structure is calculated, and the following results are presented in Table 4.
Based on the entropy of the network structure calculated above, the followers can be arranged using the following order: Follow2 > Follow1 > Leader > Follow3 > Follow5 > Follow4 = Follow6 > Follow7. According to the network structure, the relevance of the Follow1 and Follow2 nodes was higher, since Follow1 and Follow2 regulated information relative to the input and output flows. Moreover, Follow3 controlled Follow7; therefore, it was more critical than other followers of the same level. Finally, Follow4, Follow5, and Follow6 were all considered as edge nodes of the formation network; thus, their information entropy was basically the same, and this was conforming to the network structure law.
By using the traditional information entropy algorithm [24], the information entropy of each node under the network result was calculated as shown in Table 5.
In the above table, the order of the information entropy of the nodes is: Follower1 > Follower2 > Follower3 > Leader > Follower5 > Follower4 = Follower6 > Follower7, but we believe that the node leader was more important than the node Follower3, and the node Follower2 was more important than the node Follower1. Compared with the network structure entropy results in Table 4, it can be obtained that the improved algorithm in this paper was more in line with the actual situation in ordering the important nodes of the underwater network structure than the traditional information entropy algorithm.

4.2. Lake Experiments and Analysis

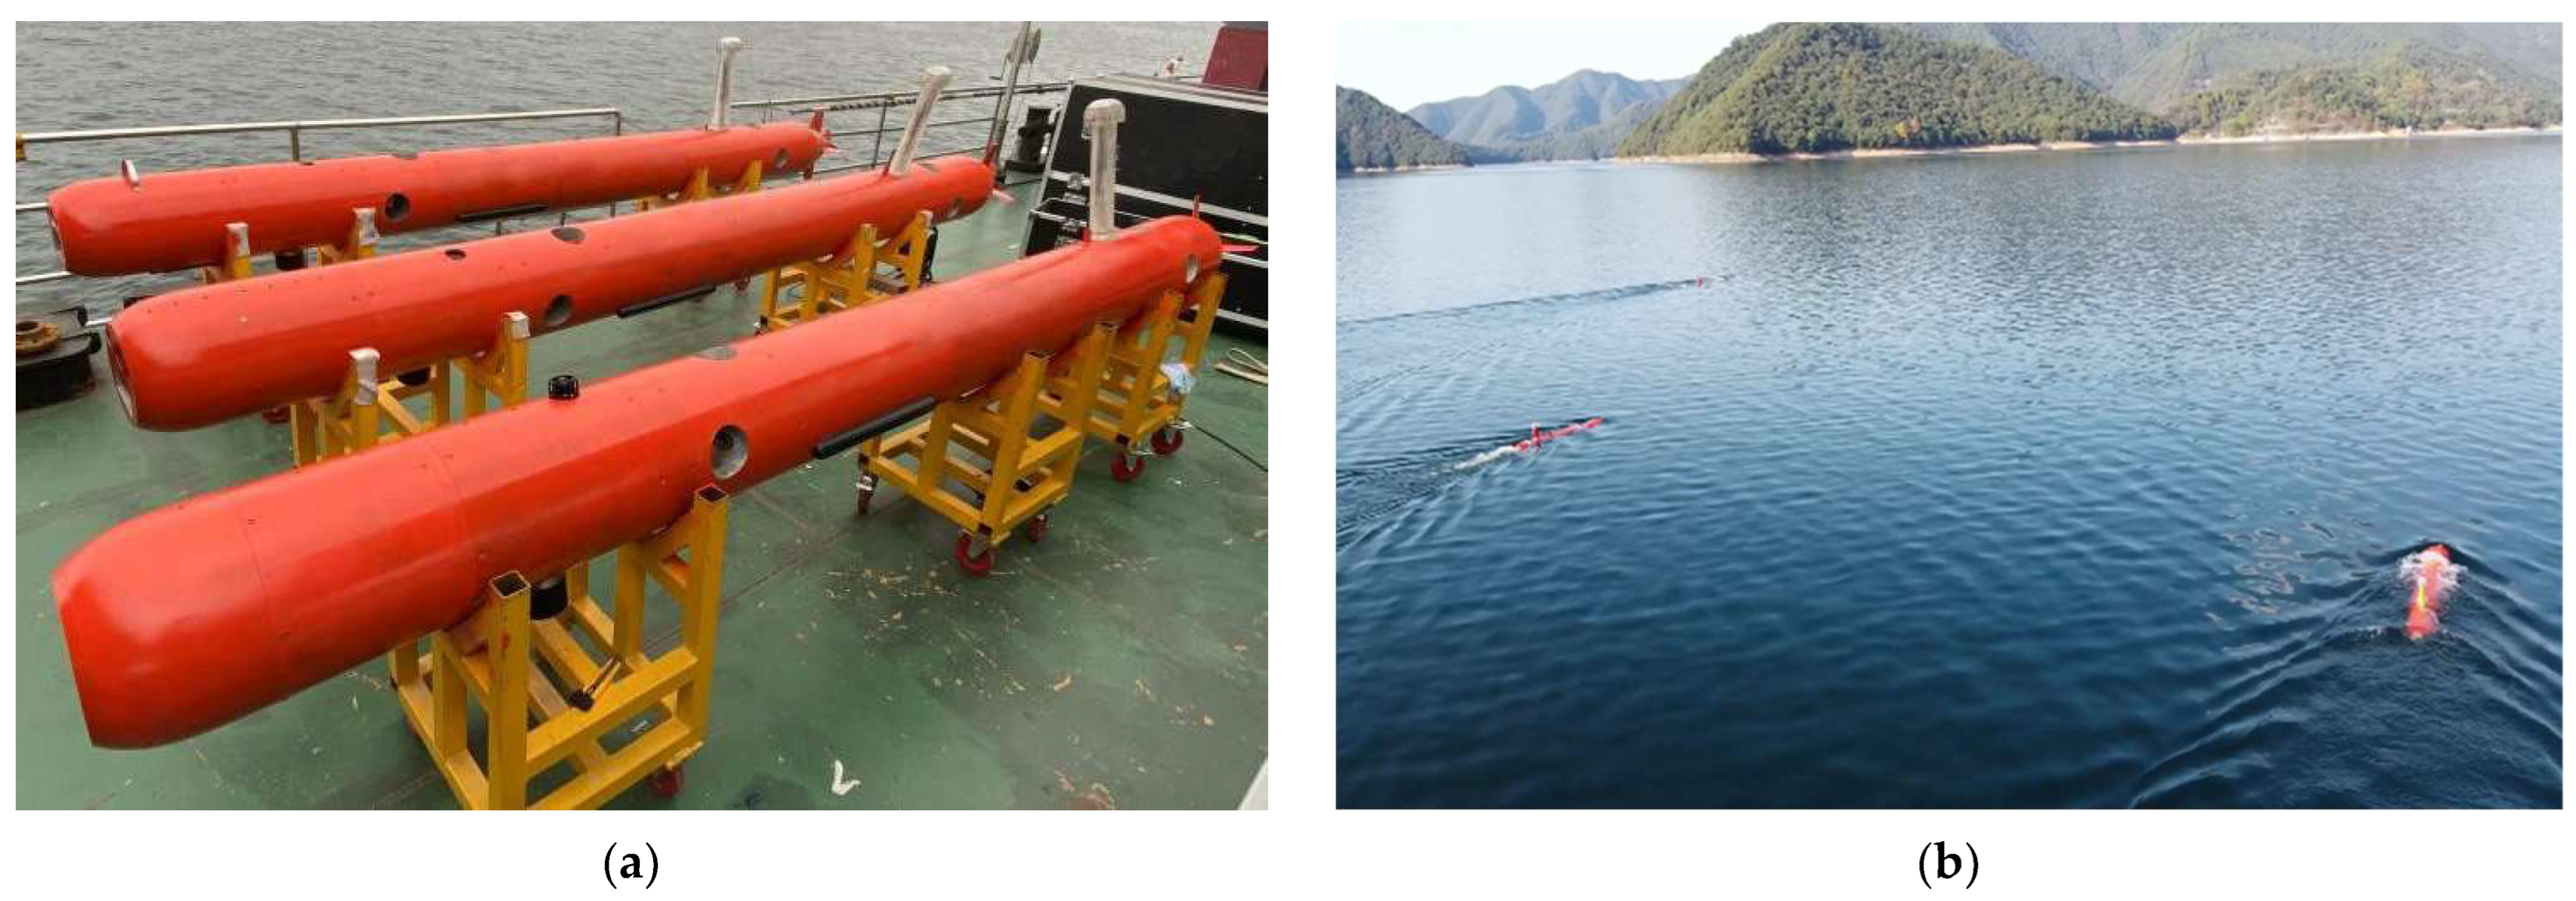
In order to verify the effectiveness of critical node identification of the multi-UUV formation algorithm proposed in this paper, the lake formation experiment was carried out, and the real dead reckoning data were obtained to place the detection of UUV formations. Therefore, three vehicles set up the trajectory of vehicles, not linked to the formation navigation, while sailing in linear and triangular formations on the Qiandao Lake in Hangzhou City as the test location in order to confirm that the algorithm can successfully recognize different network structures. Figure 6a shows the experiment platform and 
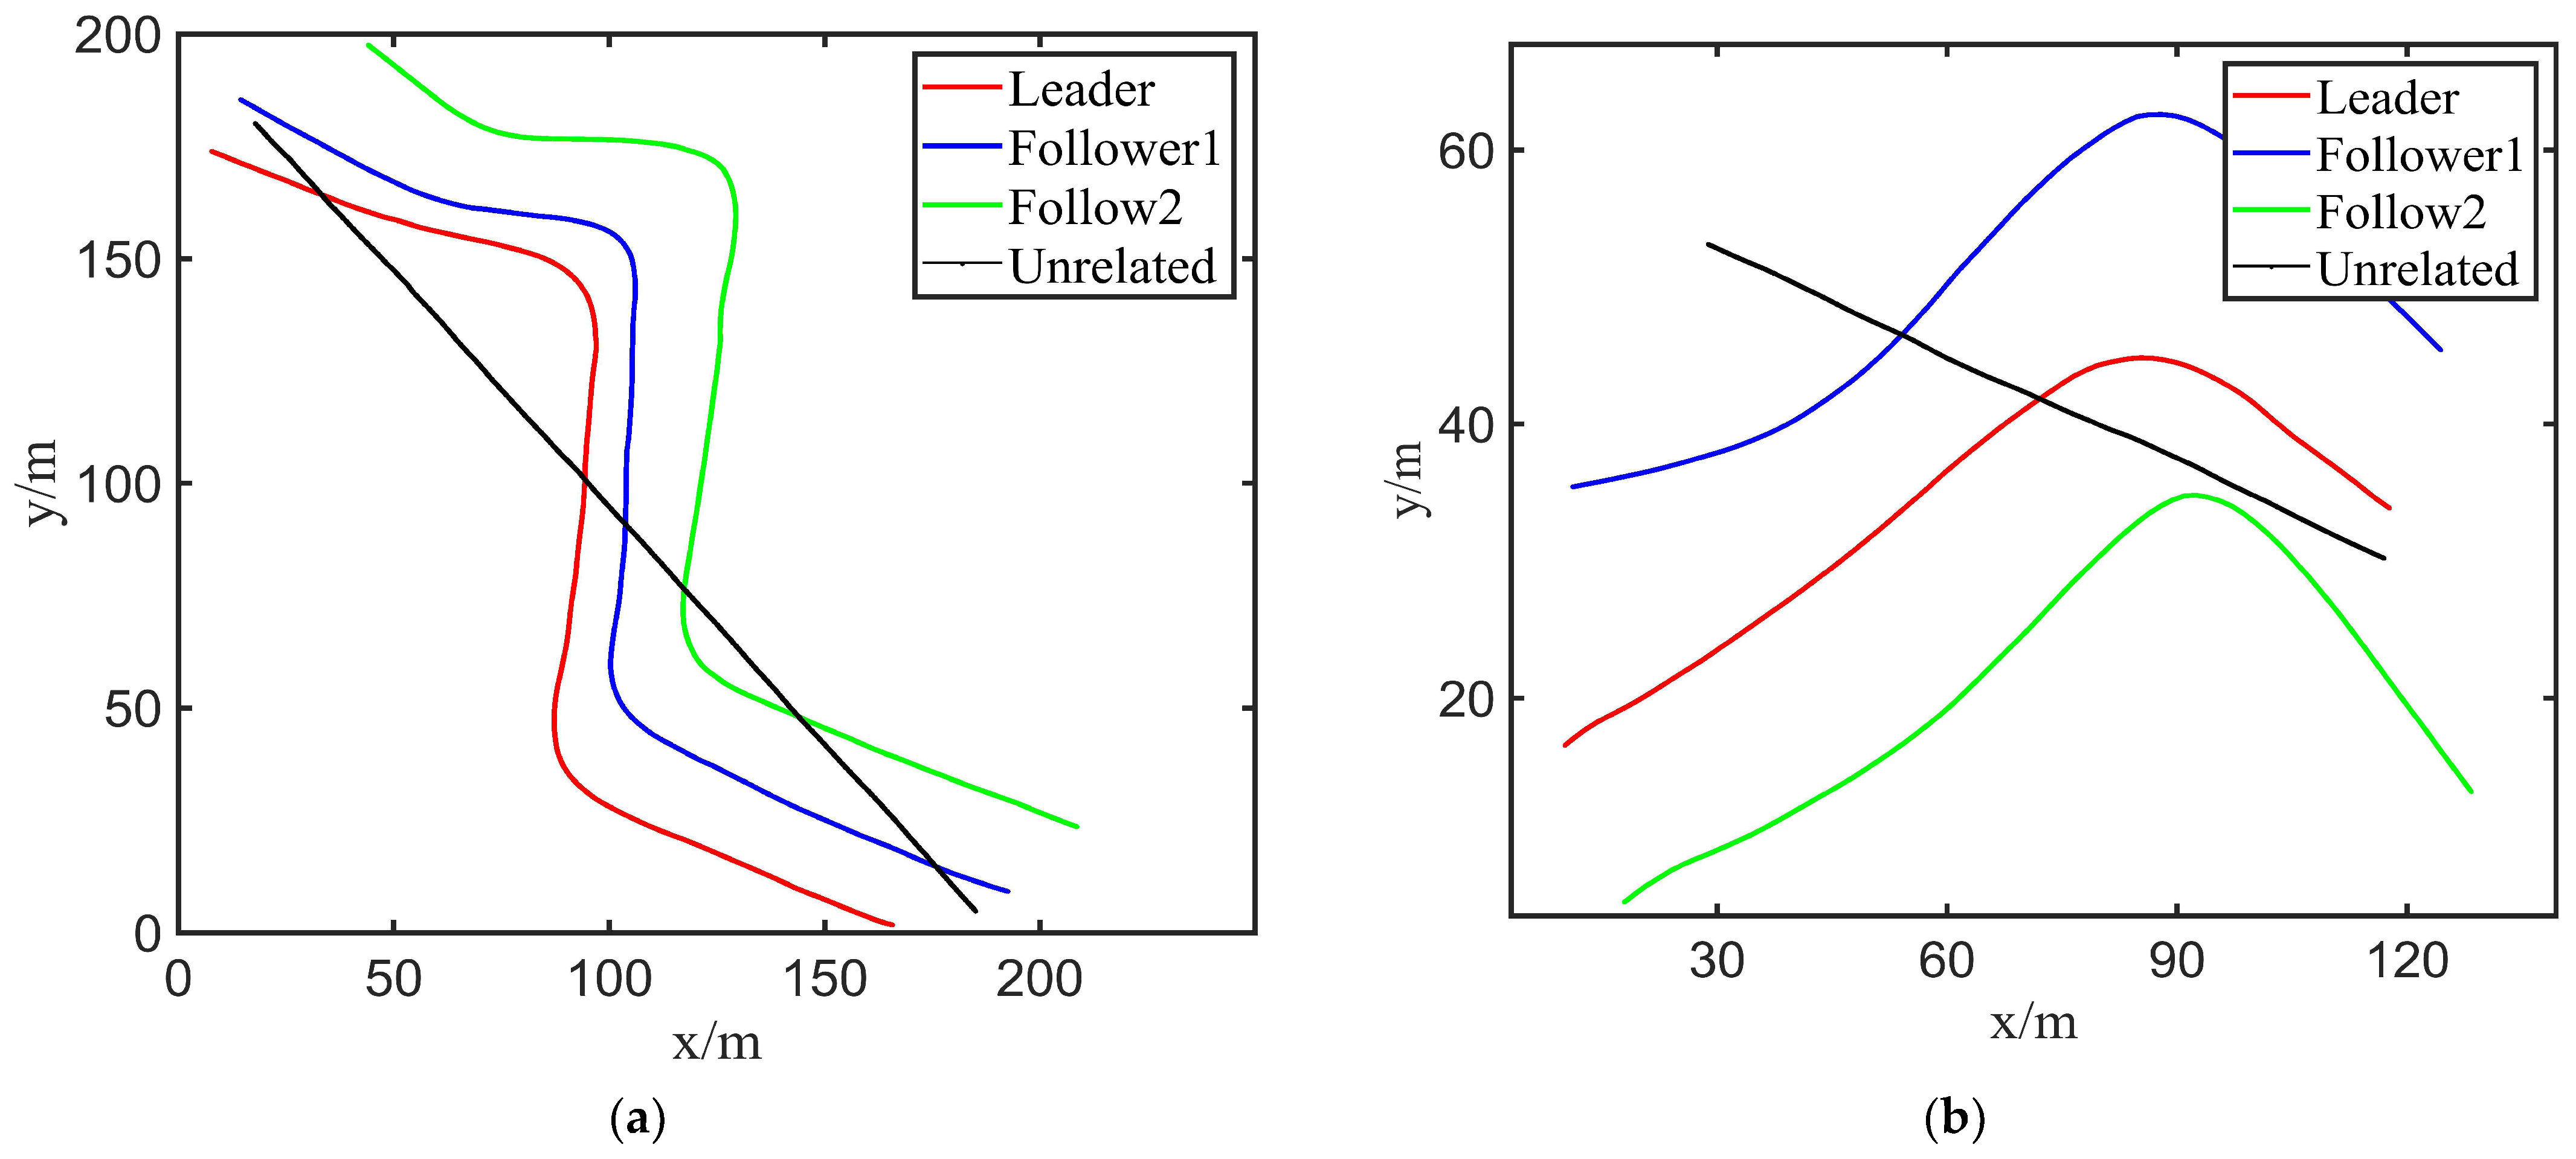
Figure 6b shows UUV formation sailing on the water. Two sets of trajectory points recorded by the UUV itself are shown in Figure 7:
Referring to the paths of Figure 7, the follower has several degrees of error with respect to the leader’s trajectory, but the trajectory it follows has generally the same shape. The space–time UUV trajectories were substituted every two pairs with the motion similarity model to obtain the following motion correlation coefficient (refer to Equation (25)) and time delay tables (refer to Table 6 and Table 7):
In the above motion correlation coefficients table, the average motion similarity between the leaders and the followers was high; however, the motion similarity coefficients of spatiotemporal trajectories of unrelated UUV and other UUVs were quite different compared to others. Setting the threshold R min = 0.9 , the similarity coefficient of the motion between the unrelated UUV and any other UUV was below the threshold; therefore, it is considered that there is no leader–follower relationship with any other UUV.
T l i n e = 0 3 5 6 3 0 3 6 5 3 0 6 6 6 6 0 ,   T t r i = 0 2 1 5 2 0 0 5 1 0 0 5 5 5 5 0
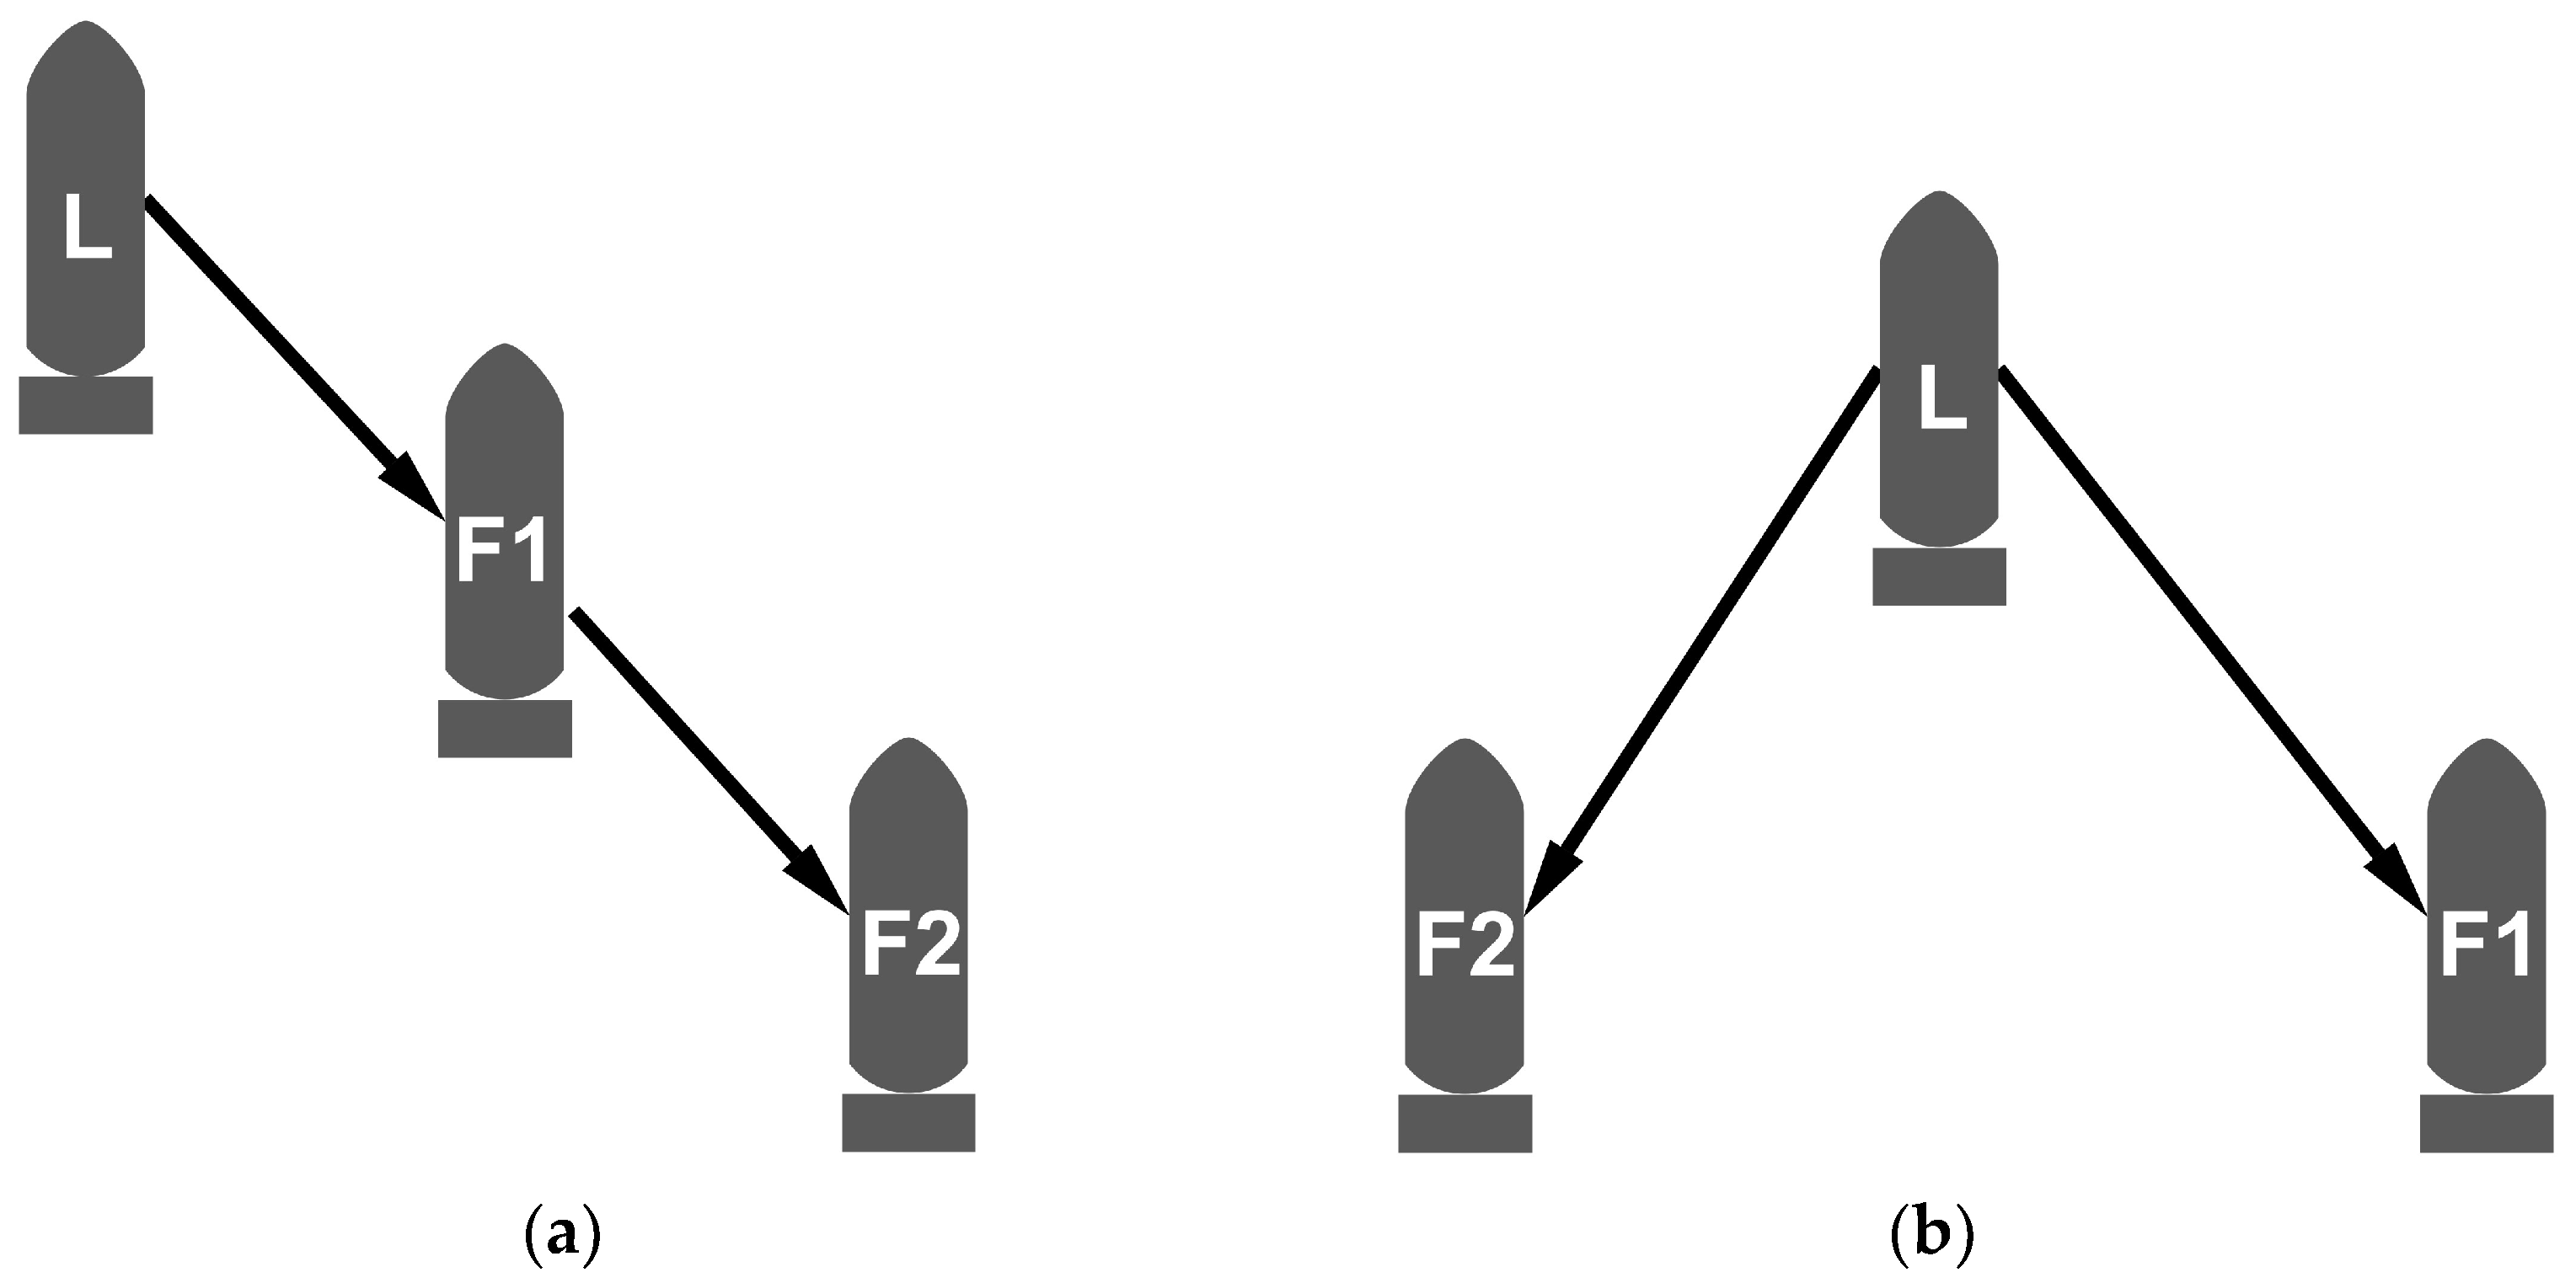
In the above time delay matrix, when the formation was carried out in a liner shape, if the UUV leader is the leader, the time delay between it and Follow1 and Follow2 is greater than zero. However, when Follow1 was the leader, the time delay between it and the UUV leader was less than zero, and the time delay with Follow2 was greater than zero. Therefore, the UUV leader had the leadership relationships for Follow1 and Follow2, and Follow1 also had leadership relationships for Follow2, which resulted in the structural relationship shown in Figure 8a. When moving in a triangle, the UUV leader had a leadership relationship with Follow1 and Follow2. Regardless of whether Follow1 or Follow2 were leaders or followers, the time delay between them was equal to zero, that is, there was no leader–following relationship, belonging to the same level, and the structural relationship, shown in Figure 8b, can be obtained, which was in line with the experimental setting.
Thus, the adjacency matrix A 1 and A 2 of the formation network was obtained:
A 1 = 0 1 0 1 0 1 0 1 0 ,   A 2 = 0 1 1 1 0 0 1 0 0
In this experiment, the distances between the vehicles were all the same, and, combined with the motion similarity coefficient, the weight matrices under the two formations can be obtained:
W 1 = 0 1.005 0 1.005 0 1.01 0 1.01 0 ,   W 2 = 0 1.004 1.003 1.004 0 0 1.003 0 0
According to the weight coefficient matrix, we found out that the difference between the weight coefficients was very small, so the directed weightless network structure entropy algorithm was applied to calculate the importance between the nodes.
According to the Equation (17), the comprehensive strength value of each node in both networks is calculated to get Table 8 and Table 9.
Then, also taking λ = 0.45 , according to the Equation (18), the comprehensive adjacency strength value of the node in both networks was calculated as shown in Table 10 and Table 11.
Finally, according to Equation (21), the entropy of each network structure was calculated, and the following results of both networks are presented in Table 12 and Table 13.
According to the node network structure entropy obtained in the above tables, the size of the entropy of each node was ordered, in the liner shape formation, as Follow1 was responsible for connecting the UUV leader and Follow2 in the middle position of the line shape; therefore, this position was more critical, and the UUV leader was responsible for piloting and sending data, so its importance was greater than that of Follow2.
As for the triangular formation, the UUV leader was responsible for connecting Follow1 and Follow2, and it was also responsible for calculating and sending the route data, which was more critical than the other two; moreover, the other two followers had the same position, the same role, and the same importance.
In this paper, the trajectory used was recorded by the aircraft itself. The experiment in this paper was mainly to prove that under a series of continuous spatiotemporal trajectories, the algorithm of this paper can be used to reconstruct the network structure of unknown formations and effectively rank the importance of nodes. However, in real situations, the results obtained when observing the formation’s trajectory through sonar equipment or other methods will not be so dense, and the results obtained due to sensor interference will be biased. It is possible to consider adding an error model and using a filtering algorithm to process the tracks detected by the sonar.

5. Conclusions

Aiming at the critical node identification problem of UUV formation, this paper proposed a formation key node identification method, based on network structure entropy, which establishes the network structure of mobile UUV formation by presenting the motion similarity model, and then calculating the information entropy of network nodes by using the weighted network structure entropy algorithm to determine the importance of each node. The simulation experiments and lake experiments in this paper fully verify the effectiveness of the identification algorithm, which can be calculated from the spatiotemporal trajectory of the formation to calculate the importance ranking of the formation nodes, and also verify that it is feasible to use this method for underwater cluster countermeasures. As for future works, it should be considered to use sonar equipment to acquire formation trajectory data with disturbances to further validate the effectiveness of the algorithm. In the next step, it is planned to further enhance the structure reconstruction of unknown multi-UUV formations in other complex situations for discontinuous multi-UUV spatiotemporal trajectories, considering the impact of the hydroacoustic communication packet’s loss and other effects on the control formation for more accurate critical node identification.

Author Contributions

Conceptualization, L.L.; Data curation, Y.C. and X.Z.; Funding acquisition, L.L.; Methodology, Y.C.; Project administration, L.Z.; Resources, Y.Y.; Software, B.Z.; Supervision, G.P.; Validation, L.L. and R.R.; Writing—original draft, Y.C.; Writing—review & editing, W.Q. and R.R. All authors have read and agreed to the published version of the manuscript.

Funding

This work was supported in part by the Local Science and Technology Special Foundation under the Guidance of the Central Government of Shenzhen under Grant 2021Szvup111; in part by the Shenzhen Science and Technology Program under Grant JCYJ20210324122010027 and JCYJ20210324122406019; in part by the National Natural Science Foundation of China under Grant 52001259, Grant 11902252, and Grant 51979229; in part by the National Research and Development Project under Grant 2021YFC2803001; in part by the Maritime Defense Technology Innovation Center Innovation Fund under Grant JJ-2021-702-09; and in part by the China Postdoctoral Science Foundation under Grant 2020M673484.

Institutional Review Board Statement

Not applicable.

Informed Consent Statement

Not applicable.

Data Availability Statement

The data that support the findings of this study are available within the article.

Conflicts of Interest

The authors declare no conflict of interest.

References

  1. Das, B.; Subudhi, B.; Pati Bibhuti, B. Cooperative Formation Control of Autonomous Underwater Vehicles: An Overview. Int. J. Autom. Comput. 2016, 13, 199–225. [Google Scholar] [CrossRef]
  2. Khawaja, W.; Semkin, V.; Ratyal, N.I.; Yaqoob, Q.; Gul, J.; Guvenc, I. Threats from and Countermeasures for Unmanned Aerial and Underwater Vehicles. Sensors 2022, 22, 3896. [Google Scholar] [CrossRef] [PubMed]
  3. Wang, G.-Y.; Cheng, D.-D.; Xia, D.-Y.; Jiang, H.-H. Swarm Intelligence Research: From Bio-inspired Single-population Swarm Intelligence to Human-machine Hybrid Swarm Intelligence. Mach. Intell. Res. 2023, 20, 121–144. [Google Scholar] [CrossRef]
  4. Kumoye, A.O.; Prasad, R.; Fonkam, M. Swarm Intelligence Algorithm and its Application: A Critical Review. In Proceedings of the 2020 International Conference in Mathematics, Computer Engineering and Computer Science (ICMCECS), Ayobo, Nigeria, 18–21 March 2020. [Google Scholar]
  5. Jung, N.; Weon, B.M.; Kim, P. Effects of adaptive acceleration response of birds on collective behaviors. J. Phys. Complex. 2022, 3, 015014. [Google Scholar] [CrossRef]
  6. Mugica, J.; Torrents, J.; Cristin, J.; Puy, A.; Miguel, M.C.; Pastor-Satorras, R. Scale-free behavioral cascades and effective leadership in schooling fish. Sci. Rep. 2022, 12, 10783. [Google Scholar] [CrossRef]
  7. Biro, D.; Sumpter, D.J.T.; Meade, J.; Guilford, T. From Compromise to Leadership in Pigeon Homing. Curr. Biol. 2006, 16, 2123–2128. [Google Scholar] [CrossRef] [Green Version]
  8. Huo, M.Z.; Duan, H.B.; Ding, X.L. Manned Aircraft and Unmanned Aerial Vehicle Heterogeneous Formation Flight Control via Heterogeneous Pigeon Flock Consistency. Unmanned Syst. 2021, 9, 227–236. [Google Scholar] [CrossRef]
  9. Park, J.; Kahng, B. Synchronization in leader-follower switching dynamics. Phys. Rev. Res. 2020, 2, 032061. [Google Scholar] [CrossRef]
  10. Xu, G.H.; Xu, M.; Ge, M.F.; Ding, T.F.; Qi, F.; Li, M. Distributed Event-Based Control of Hierarchical Leader-Follower Networks with Time-Varying Layer-To-Layer Delays. Energies 2020, 13, 1808. [Google Scholar] [CrossRef] [Green Version]
  11. Ugurlu, O. Comparative analysis of centrality measures for identifying critical nodes in complex networks. J. Comput. Sci. 2022, 62. [Google Scholar] [CrossRef]
  12. Cai, B.; Zeng, L.N.; Wang, Y.P.; Li, H.J.; Hu, Y.M. Community Detection Method Based on Node Density, Degree Centrality, and K-Means Clustering in Complex Network. Entropy 2019, 21, 1145. [Google Scholar] [CrossRef] [Green Version]
  13. Yang, X.H.; Xiong, Z.; Ma, F.N.; Chen, X.Z.; Ruan, Z.Y.; Jiang, P.; Xu, X.L. Identifying influential spreaders in complex networks based on network embedding and node local centrality. Phys. A-Stat. Mech. Its Appl. 2021, 573, 125971. [Google Scholar] [CrossRef]
  14. Wandelt, S.; Shi, X.; Sun, X.Q. Approximation of Interactive Betweenness Centrality in Large Complex Networks. Complexity 2020, 2020, 4046027. [Google Scholar] [CrossRef]
  15. Kitsak, M.; Gallos, L.K.; Havlin, S.; Liljeros, F.; Muchnik, L.; Stanley, H.E.; Makse, H.A. Identification of influential spreaders in complex networks. Nat. Phys. 2010, 6, 888–893. [Google Scholar] [CrossRef] [Green Version]
  16. Yu, Y.; Zhou, B.; Chen, L.J.; Gao, T.; Liu, J.Z. Identifying Important Nodes in Complex Networks Based on Node Propagation Entropy. Entropy 2022, 24, 275. [Google Scholar] [CrossRef]
  17. Wang, Y.; Zheng, Y.; Liu, Y. Identifying vital nodes for influence maximization in attributed networks. Sci. Rep. 2022, 12, 22630. [Google Scholar] [CrossRef]
  18. Jiang, J.-L.; Fang, H.; Li, S.-Q.; Li, W.-M. Identifying important nodes for temporal networks based on the ASAM model. Phys. A Stat. Mech. Its Appl. 2022, 586, 126455. [Google Scholar] [CrossRef]
  19. Liu, L.; Zhang, S.; Zhang, L.; Pan, G.; Yu, J. Multi-UUV Maneuvering Counter-Game for Dynamic Target Scenario Based on Fractional-Order Recurrent Neural Network. IEEE Trans. Cybern. 2022, 53, 4015–4028. [Google Scholar] [CrossRef]
  20. Nagy, M.; Vasarhelyi, G.; Pettit, B.; Roberts-Mariani, I.; Vicsek, T.; Biro, D. Context-dependent hierarchies in pigeons. Proc. Natl. Acad. Sci. USA 2013, 110, 13049–13054. [Google Scholar] [CrossRef]
  21. Zhang, W.; Wang, N.; Wei, S.; Du, X.; Yan, Z. Overview of unmanned underwater vehicle swarm development status and key technologies. J. Harbin Eng. Univ. 2020, 41, 289–297. [Google Scholar]
  22. Yang, P.; Xu, C.; Chen, H. Multi-attribute ranking method for identifying key nodes in complex networks based on GRA. Int. J. Mod. Phys. B. Condens. Matter Phys. Stat. Phys. Appl. Phys. 2018, 32, 1850363. [Google Scholar] [CrossRef]
  23. Tyrsin, A.N. Entropy Modeling of Network Structures. Autom. Remote Control 2022, 83, 1608–1618. [Google Scholar] [CrossRef]
  24. Zhang, Q.; Li, M.; Deng, Y. A betweenness structure entropy of complex networks. Chaos Solitons Fractals 2022, 161, 112264. [Google Scholar] [CrossRef]
Figure 1. Four network types.
Jmse 11 01538 g001
Figure 2. Algorithm flow of critical node identification.
Jmse 11 01538 g002
Figure 3. “U”−shaped formation trajectory. It shows the trajectories of each node navigating in formation in the simulation, and the enlarged portion of the figure shows the structure of the formation.
Jmse 11 01538 g003
Figure 4. Correlation coefficient and time delay function.
Jmse 11 01538 g004
Figure 5. Mobile UUV formation network structure. The letters L and F stand for leader UUV and follower UUV; F1 denotes Follow1 UUV and F2 denotes Follow2 UUV and so on. The arrows indicate the direction of information transmission in the formation network.
Jmse 11 01538 g005
Figure 6. Photos of lake experiments. (a) Experiment platform, (b) UUV formation navigation.
Jmse 11 01538 g006
Figure 7. UUV formation waypoints in two groups of different formations. (a) Liner shape navigation trajectory, (b) triangular navigation trajectory.
Jmse 11 01538 g007
Figure 8. Multi-UUV formation. (a) Linear shape formation structure, (b) Triangular shape formation structure. The letters L and F stand for leader UUV and follower UUV; F1 denotes Follow1 UUV and F2 denotes Follow2 UUV. The arrows indicate the direction of information transmission in the formation network.
Jmse 11 01538 g008
Table 1. “U” shape trajectory motion correlation coefficient.
FollowerLeaderFollow1Follow2Follow3Follow4Follow5Follow6Follow7Unrelated
Leader
Leader11.00001.00001.00001.00001.00001.00001.00000.8271
Follow11.000011.00001.00001.00001.00001.00001.00000.8347
Follow21.00001.000011.00001.00001.00001.00001.00000.8363
Follow31.00001.00001.000011.00001.00001.00001.00000.8438
Follow41.00001.00001.00001.000011.00001.00001.00000.8444
Follow51.00001.00001.00001.00001.000011.00001.00000.8424
Follow61.00001.00001.00001.00001.00001.000011.00000.8448
Follow71.00001.00001.00001.00001.00001.00001.000010.8507
Unrelated0.82500.83260.83410.84160.84230.84020.84270.84861
Table 2. Node comprehensive strength value.
NodeLeaderFollow1Follow2Follow3Follow4Follow5Follow6Follow7
k i 0.62.062.061.171.021.021.020.85
Table 3. Node adjacency strength value.
NodeLeaderFollow1Follow2Follow3Follow4Follow5Follow6Follow7
Q i 0.922.152.72.552.552.551.7
Table 4. Node network structure entropy.
NodeLeaderFollow1Follow2Follow3Follow4Follow5Follow6Follow7
E i 2.6225.2264.1521.3650.4860.4560.4860.367
Table 5. Node information entropy.
NodeLeaderFollow1Follow2Follow3Follow4Follow5Follow6Follow7
value5.67420.37217.3749.9700.3030.4150.3030.255
Table 6. Liner shape motion correlation coefficient.
FollowerLeaderFollow1Follow2Unrelated
Leader
Leader10.9950.9870.769
Follow10.99510.9900.748
Follow20.9870.99010.788
Unrelated0.7670.7420.7881
Table 7. Triangular motion correlation coefficient.
FollowerLeaderFollow1Follow2Unrelated
Leader
Leader10.9960.9970.883
Follow10.99710.9990.861
Follow20.9970.99910.858
Unrelated0.8560.8390.8281
Table 8. Liner shape node comprehensive strength value.
NodeLeaderFollow1Follow2
k i 1.1030.4510.451
Table 9. Triangular node comprehensive strength value.
NodeLeaderFollow1Follow2
k i 0.5531.0090.456
Table 10. Liner shape node adjacency strength value.
NodeLeaderFollow1Follow2
Q i 0.496 0.496 0.496
Table 11. Triangular node adjacency strength value.
NodeLeaderFollow1Follow2
Q i 0.555 0.499 0.454
Table 12. Liner shape node network structure entropy.
NodeLeaderFollow1Follow2
Ei0.1624.1280.120
Table 13. Triangular node network structure entropy.
NodeLeaderFollow1Follow2
Ei5.1200.1250.125
Disclaimer/Publisher’s Note: The statements, opinions and data contained in all publications are solely those of the individual author(s) and contributor(s) and not of MDPI and/or the editor(s). MDPI and/or the editor(s) disclaim responsibility for any injury to people or property resulting from any ideas, methods, instructions or products referred to in the content.

