Abstract
This experimental study investigated the hydrodynamic performance of the first free-surface semicircular breakwater supported on piles under regular waves. The research focused on SCB models with porosity levels of 0%, 9%, 18%, and 27%. Experimental tests were conducted in a wave flume to evaluate the transmission (CT), reflection (CR), and energy dissipation (CL) coefficients of the SCB models. Wave disturbance coefficients (CF) in front of the breakwater and within the breakwater chamber (CC) were also examined. Horizontal wave loading was measured using normalized force coefficients (Fn), including force coefficients of wave crests (Fn,c) and wave troughs (Fn,t). Empirical formulas were proposed to provide a quick estimate of the hydrodynamic performance, showing good agreement with the measured data. The findings highlight the impact of varying porosity levels on wave attenuation, with the impermeable SCB model (0% porosity) exhibiting superior performance compared to the perforated SCB models. This research contributes valuable insights into optimizing SCB model design and enables efficient estimation of its hydrodynamic performance under regular wave conditions. The results provide valuable guidance for the design and implementation of SCB structures, enhancing their effectiveness in wave attenuation applications.
1. Introduction
Coastal zones around the world face significant challenges due to their increasing use for various purposes, including harbors, fisheries, recreational facilities, and resource extraction [1,2]. However, the utilization of these areas is hindered by natural factors such as high wave action, storm surges, tsunamis, and coastal erosion [1]. To address these issues and protect coastal regions, breakwaters have been developed [2].
Conventional breakwaters, while effective, often require large-scale construction materials, effort, and cost. Poor design and management can also have detrimental effects on neighboring coastal environments [3]. In response, lightweight alternatives to conventional breakwaters have been proposed and tested, including free-surface breakwaters. [4]. Free-surface breakwaters serve as barriers positioned at the seawater level, strategically placed to maximize the energy flux [5]. These barriers are designed to have a height significantly smaller than the water depth, allowing water circulation beneath them. They can be constructed using piles, jacket structures, or even held afloat by mooring cables. These breakwaters effectively control wave height through reflection and energy dissipation, proving most efficient when dealing with small waves and limited wave periods [6].
Extensive research has been conducted on free-surface breakwaters, specifically on the design and performance evaluation of these structures. These structures play a crucial role in wave attenuation and ensuring navigation safety in coastal areas. Various types of fixed free-surface breakwaters have been extensively studied, offering different forms and functionalities. Fixed free-surface breakwaters have been classified into four distinct categories based on their configurations: solid-type, plate-type, caisson-type, and multipart-type [7]. Each category encompasses specific design features and considerations.
The solid-type breakwaters are equipped with barriers of high effective mass for wave damping. The box-type barrier has the simplest form of design and effectively limits the wave transmission by reflecting the incident wave energy to the seaside of the structure. The efficiency of the breakwater can be further enhanced by (i) increasing the immersion depth of the structure [8], (ii) introducing a double barrier parted with a distance [9], and (iii) adding a keel plate to the bottom of the barrier [9]. According to [10], the trapezoidal barrier was found to be more functionally viable than the box-type barrier as it induced a higher degree of hydrodynamic interactions around the structure. Curved surface barriers, i.e., cylindrical barriers [11] and the quadrant front face barrier [12], are other solid-type breakwaters proposed as wave attenuators.
A horizontal plate is the most typical wave barrier in this breakwater category. In comparison with the single-plate breakwater, the twin-plate breakwater was found to be more reflective [13], particularly when the spacing of the twin plates was 40% of the water depth [14]. More complex structures assembled with multiple plates were proposed to increase the hydraulic efficiency of breakwaters. These include T-type [15], ⊥-type [16], and H-type barriers [17].
Caisson-type breakwaters are generally more cost effective than the solid-type breakwater due to reduced effective mass of the barriers. Some of the caisson-type breakwaters reported in the literature include U-type, П-type, Ш-type, and “-type barriers. The П-type barrier was reported to yield lower transmission rate compared to the U-type barrier [18]. Alternatively, an absorbing porous caisson can be added to the seaside of the U-type barrier, forming a Ш-type breakwater for reduction of wave reflection in front of the structure [19]. According to [7], the perforated “-type breakwater was a good energy dissipater with low wave reflection, and its wave attenuation capability was comparable to that of some of the solid-type breakwaters.
Multipart-type breakwaters are superstructures that comprise a large number of discrete constituents for energy dissipation. Examples of such breakwaters are multiple-layer breakwaters [20] and porous-pile breakwaters [20]. These structures are usually highly porous to water flow, resulting in relatively small wave reflection and horizontal wave forces on the structures.
In recent years, submerged breakwaters, such as the Bragg breakwater, have emerged as effective solutions for mitigating wave effects on coastal structures [21]. The Bragg breakwater utilizes Bragg resonance to produce strong wave reflection, providing potential benefits for coastal protection and beyond. The behavior of transmission, reflection, and energy dissipation coefficients in relation to breakwater performance has been investigated in various publications. It has been demonstrated that the porous-effect parameter plays a major role in attenuating wave energy [22], and comparisons between perforated and non-perforated solutions have shown similar hydrodynamic performance in terms of the wave reflectivity coefficient and transmission characteristics [23]. These findings indicate that perforated semicircular breakwaters not only attenuate waves but also create a favorable environment for biological activity. Future research should explore aspects related to the location of the structure, the interaction between the structure and biology, and the potential generation of upwelling to enhance biological production and attract fish species [23].
Motivated by the successful implementation of bottom-mounted semicircular breakwaters in the ports of Miyazaki (Japan), Tianjin (China), Yangtze Estuary (China), Nha Mat Bac Lieu (Vietnam), and Ca Mau (Vietnam) [24,25,26] for sea defense, extensive research has been conducted by researchers from Japan, China, and India [25,27,28,29,30,31]. These studies primarily focused on bottom-seated semicircular breakwaters, leaving a notable gap in the literature regarding the investigation of free-surface semicircular breakwaters (SCBs). SCB refers to a breakwater structure with a free surface, allowing interaction between waves and the structure. The presence of the free-surface influences wave energy dissipation and wave transformation mechanisms. To address this research gap, the present study aimed to evaluate the hydrodynamic characteristics of laboratory-scale new free-surface SCB models with varying levels of porosity. By using free-surface SCB models, there is a promising opportunity to achieve better performance characteristics compared to that of conventional breakwaters. The objective is to minimize wave reflection, achieve desirable wave attenuation, and enhance navigation safety and the utilization of coastal areas.
2. Materials and Methods
2.1. Test Models
The semicircular breakwater models used in this study are shown in Figure 1. These models were constructed using a semi-cylindrical PVC tube with a 0.01 m wall thickness to test the effects of four various front seawall porosities (p = 0%, 9%, 18%, and 27%). These are defined as SCB0 (no perforations or 0% porosity), SCB9 (9% porosity), SCB18 (18% porosity), and SCB27 (27% porosity). For perforated models, the openings at the front wall were designed to promote energy dissipation during the passage of water flow; the openings at the rear wall close to the crown were designed to infiltrate the overtopping waves into the breakwater’s chamber as well as to allow wave run-up at the interior rear wall to escape. Table 1 provides the sizes of the rectangular openings and other details for the models. The breakwater had a radius of 0.25 m and a length perpendicular to the direction of the waves of 0.4 m. Two semicircle-shaped clear Perspex sheets were attached to the ends of the model to enhance its stability during wave impact.
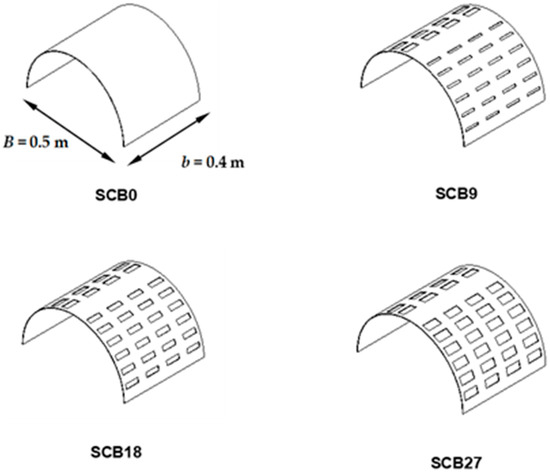
Figure 1.
Configuration of (SCB) test model with rectangular perforations.

Table 1.
Characteristics of semicircular breakwater models.
2.2. Instrumentation
The experimental work was conducted at the Hydraulics Laboratory of the School of Engineering, University of Edinburgh. To generate unidirectional regular and irregular waves, a wave flume with dimensions of 22 m in length, 0.4 m in width, and 0.7 m in depth was employed (refer to Figure 2). The process of wave generation was carried out through the utilization of a flap-type active absorption wave generator, which was developed by Edinburgh Designs. Passive wave absorbing “beaches” were installed at the down-wave end of the wave flume during the experiments in order to reduce wave reflection from the end wall. The flume was equipped with six resistance-type wave probes (WP1 to WP6) that were strategically positioned to measure water surface elevations at different locations. Using the least squares method, incident and reflected waves were separated for the first three probes (WP1 to WP3) that were placed closest to the wave generator [32]. WP4, positioned at a distance of 50 mm from the seaward wall of the model, measured the water surface elevation in front of the model, providing information on Hf wave heights at that specific location. WP6, located 2.5 m from the leeward wall of the model, measured transmitted waves and offered insights into Ht wave heights at that particular position. For the perforated models, WP5 was positioned through one of the rectangular openings near the crown, allowing for the measurement of Hc wave heights and capturing the fluctuation of water level within the interference chamber. In the case of the SCB0 model, a small opening was made at the crown of the breakwater to insert WP5 for water level measurement. These Hc wave heights provided valuable data on the water level fluctuations in specific areas of interest. Additionally, two load cells (LC1 and LC2) were attached at the crest of the submerged breakwater (SCB) model to measure the horizontal wave forces. The utilization of two load cells (LC1 and LC2) at both ends of the breakwater presented several advantages, despite the symmetrical nature of the model. Firstly, this configuration enabled the accurate measurement of forces and load distribution at the breakwater’s ends, facilitating valuable insights into its response to applied loads. Additionally, the implementation of two load cells offered redundancy and allowed for the cross-validation of measurements, ensuring the reliability and accuracy of the collected data. It should be noted that due to resource limitations, only two load cells were available for use. Nonetheless, these two load cells effectively provided the necessary information pertaining to load distribution and the behavior of the breakwater model. Prior to each experimental session, both the wave probes and load cells underwent meticulous calibration.
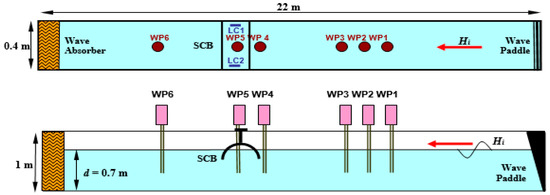
Figure 2.
Plan and cross-sectional views of experimental setup.
2.3. Experimental Procedure
The experimental models underwent testing with regular waves at varying periods, ranging from 0.7 s to 1.8 s in increments of 0.1 s. To capture a range of wave conditions, multiple incident wave heights between 0.02 m and 0.20 m were selected for each wave period. This ensured a wave steepness, Hi/L (where L represents the wavelength calculated based on water depth and wave period), ranging from 0.02 to 0.12. The sampling duration for each test run was 20 s, with a sampling frequency of 50 Hz. Data collection commenced after a sufficient number of wave cycles passed through the breakwater. In this experimental study, three relative depths of immersion were investigated, achieved by lowering the models by 0.05 m, 0.10 m, and 0.15 m relative to the still water level. This resulted in a ratio of D/d = 0.071, 0.143, and 0.214, where D represents the draft of the model and d denotes the water depth. The experimental conditions encompassed both deep and transitional water scenarios. Data acquisition and analysis were performed using Aalborg University’s WAVELAB software. In total, 822 test runs were conducted as part of this study.
2.4. Evaluation Measures for Performance
The evaluation of a breakwater’s performance is typically conducted through the utilization of transmission coefficient (CT), reflection coefficient (CR), and energy dissipation coefficients (CL) [33]. These coefficients are mathematically represented as:
where Hi, Ht, and Hr denote the mean values of the incident, transmitted, and reflected waves, respectively. The estimation of energy dissipation at the breakwater is a challenging task due to the intricacy involved in its measurement. As a result, the law of conservation of energy, as demonstrated by Equation (3), is utilized to approximate the quantity of energy loss.
In this work, the wave modifications in front of the breakwater and within its chamber are represented by the coefficients of wave disturbance, such that the wave characteristics in front of the breakwater are quantified by CF.
and CC provides a quantitative measure of those within the breakwater’s chamber.
where Hf and Hc are the average wave heights at the front of the breakwater and the chamber of the breakwater, respectively. A value of 1.0 for CF and CC would indicate that the climate of the waves at their respective locations has not changed.
3. Results and Discussion
3.1. Wave Transmission
The relationship between the wave transmission coefficient (CT) and the relative width of the breakwater (B/L) is depicted in Figure 3 for the SCB0, SCB9, SCB18, and SCB27 test models. The plots present various ranges of Hi/L and relative breakwater drafts (D/d) at values of 0.071, 0.143, and 0.214. It is evident that the SCB0 model demonstrated the smallest CT values, indicating the highest wave attenuation capacity among the tested models. For the perforated models, the influence of porosity on CT variation was minimal. Upon closer examination, it is apparent that the SCB27 model exhibited the least wave attenuation among the perforated models. Wave steepness had a more significant impact on the wave transmission characteristics of the perforated models, particularly noticeable at D/d = 0.071, where steep waves resulted in smaller CT values for perforated breakwaters.
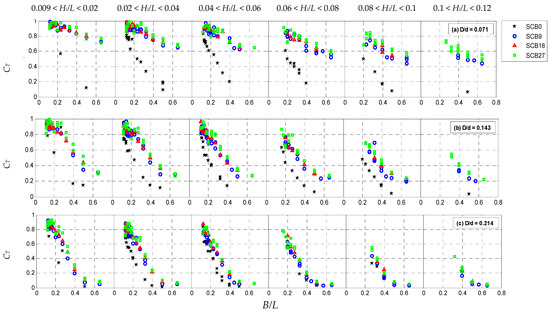
Figure 3.
Wave transmission coefficients (CT) for the SCB models at different relative breakwater drafts (D/d) and wave steepness (Hi/L).
Limitations were encountered in acquiring all the desired wave cases due to the capabilities of the wave generator and various experimental constraints. It should be noted that the recommended range of wave parameters, including minimum and maximum values, is specified in the wave generator’s manual. To explore the behavior of the SCB0, SCB18, and other models beyond these limits, additional runs were conducted that extended beyond the prescribed range. While these additional runs yielded valuable data, they were unable to cover all the desired wave cases. These limitations emphasize the need to consider the specified range of wave parameters and their impact on the analysis and interpretation of the results. Despite these limitations, the obtained results still provide valuable insights into the behavior and performance of the SCB models within the range of successfully generated wave conditions.
Generally, irrespective of wave steepness and breakwater draft, CT decreased as B/L increased for all the test models. The smaller CT values observed at larger B/L suggest that the breakwater models performed better when subjected to waves with shorter periods. Furthermore, the plots clearly illustrate that the change in D/d influenced the wave transmission characteristics of the breakwater. Specifically, for a given B/L and a selected breakwater, the CT value decreased as D/d increased. Comparing the results also reveals that the rate of decrease in CT for the perforated models was more rapid compared to the impervious model (SCB0) as D/d increased. At D/d = 0.214, the efficiency of the perforated models improved to such an extent that their performance became almost comparable to that of the SCB0 model, especially for larger Hi/L ranges.
3.2. Wave Reflection
The relationship between reflection coefficients (CR) and the relative breakwater width (B/L), relative wave height (Hi/L), and relative breakwater draft (D/d) is depicted in Figure 4. The plots reveal that the CR of the impermeable SCB0 model increased with an increase in B/L and a decrease in Hi/L, indicating higher reflectivity for shorter-period waves and smaller wave heights. The maximum CR values obtained for D/d = 0.071, 0.143, and 0.214 were 0.83, 0.87, and 0.86, respectively.
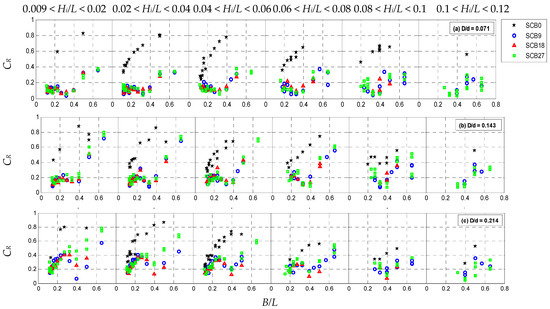
Figure 4.
Wave reflection coefficients (CR) for the SCB models at varying relative breakwater drafts (D/d) and wave steepness (Hi/L).
Regarding perforated models, Figure 4 indicates that the impact of breakwater porosity was still uncertain. However, it is evident that the CR values of the perforated models were significantly lower than those of the impermeable SCB0 model, indicating poor wave reflection capabilities. Specifically, there were modest undulations in the CR values of the perforated models, with peaks at 0.2 < B/L > 0.3 and troughs at 0.3 < B/L > 0.4, followed by a substantial increase in CR for B/L > 0.4. This behavior, known as the Bragg effect, was also observed in other types of free-surface breakwaters, such as caisson-type breakwaters [34], quadrant front face breakwaters [35], H-type breakwaters [36], and porous-pile breakwaters [37]. Additionally, wave steepness strongly influenced CR, as the perforated models became more reflective when exposed to low steepness waves, particularly for the higher range of D/d.
3.3. Energy Dissipation
3.3.1. Wave Action and Behavior in SCB Models
The mechanisms of energy dissipation observed in the SCB models were examined using still images and videos. Figure 5 presents a sequential representation of the wave action on the SCB0 and SCB27 models. Both models were placed in a water depth of 0.10 m and subjected to waves with a period of 1 s and a height of 0.16 m. The waves propagated from the right side to the left side in the images. Both models showed that the bottom of the front wall was reached during the trough of a wave cycle when t/T equaled 0. At this point, just below the front wall, the SCB0 model caused eddies to form.
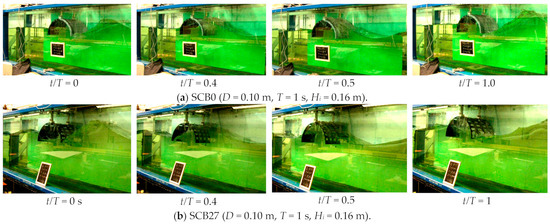
Figure 5.
Wave–structure interactions for the (a) SCB0 and (b) SCB27 models showing wave propagation from the right side to the left side.
At t/T = 0.4, a rising wave crest interacted with the models, resulting in significant run-up and some overtopping on the SCB0 model. Additionally, a substantial amount of wave penetration occurred through the rectangular openings into the chamber of the SCB27 model. Subsequently, the water began to recede from the structures at t/T > 0.5 and completely rejoined the next incoming wave crest at t/T = 1.0. In the case of the SCB0 model, wave energy was dissipated through the formation of vortices around the lower edges of the breakwater. The wave condition within the chamber and on the lee side of the model was relatively calm. On the other hand, the SCB27 model, along with other perforated models, exhibited wave penetration through the openings, resulting in the development of a jet-type flow and vortices around the perforated front wall, as well as turbulent flow in the chamber.
3.3.2. Coefficient of Energy Dissipation
The energy dissipation coefficients, CL, as computed using Equation (3), can be observed in Figure 6. The CL values for the SCB0 model exhibited distinct differences compared to those of the perforated models. They showed smaller variations within the respective ranges of wave steepness and did not follow a clear pattern with B/L. Nevertheless, the CL of the SCB0 model increased at varying rates with D/d and Hi/L. The maximum CL values obtained for D/d = 0.071, 0.143, and 0.214 were 0.65, 0.80, and 0.85, respectively, often occurring at the higher range of wave steepness. The SCB0 model demonstrated superior energy dissipation compared to the perforated models when subjected to longer-period waves and smaller immersion depths. Furthermore, it should be noted that the energy dissipation for permeable breakwaters was higher than that of SCB0 for all D/d values and wave steepness when B/L was higher than 0.3. However, it is important to highlight that the opposite trend was observed when B/L was less than 0.3, where SCB0 exhibited higher energy dissipation compared to permeable breakwaters. For the perforated SCB models, the maximum CL values exceeding 0.8 were attained within the range of 0.4 < B/L < 0.5, particularly for D/d = 0.143 and 0.214. Beyond B/L > 0.5, a slight degradation in the dissipation performance of the perforated SCB models was observed. Nevertheless, the overall wave attenuation improvement remained unaffected due to the compensatory effect of a rapid increase in wave reflection at larger B/L values, as observed in Figure 4. The porosity of the breakwater played a role in CL for the perforated models, with SCB9 exhibiting the highest dissipative characteristics, followed by SCB18 and SCB27. Moreover, breakwaters with greater immersion depths demonstrated enhanced dissipative characteristics by providing a larger geometrical domain for wave–structure interactions to occur. Furthermore, the influence of wave steepness on CL was significant for the perforated models, as waves with higher steepness resulted in greater energy dissipation when interacting with the porous structures. In summary, when exposed to relatively short-period waves, the perforated SCB models can be considered more effective in dissipating energy compared to the SCB0 model.
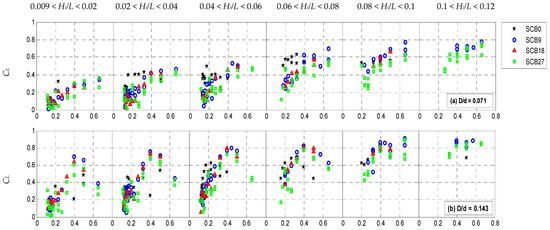

Figure 6.
Energy dissipation coefficients, CL, for the SCB models at varying relative breakwater drafts (D/d) and wave steepness (Hi/L).
3.4. Climate of the Waves in Front of the Breakwaters
The wave disturbance coefficient, CF, which provides insight into the alteration of wave conditions directly in front of the test models, can be observed in Figure 7. For the SCB0 model, the CF values consistently exceeded 1.0 for all test cases and reached a maximum of approximately 2.2 at D/d = 0.214. These elevated CF values indicate significant wave activity in front of the SCB0 model. This can be attributed to the obstruction of flow energy by the solid front wall, resulting in the accumulation of a substantial water mass in front of the breakwater. A deeper breakwater draft corresponded to a larger intercepted water domain, thus enhancing wave reflection. This observation is further supported by the CR plots in Figure 4, which exhibit a somewhat analogous trend to CF. Additionally, the CF of the impermeable model demonstrated minimal variation with changes in Hi/L across all tested D/d values.
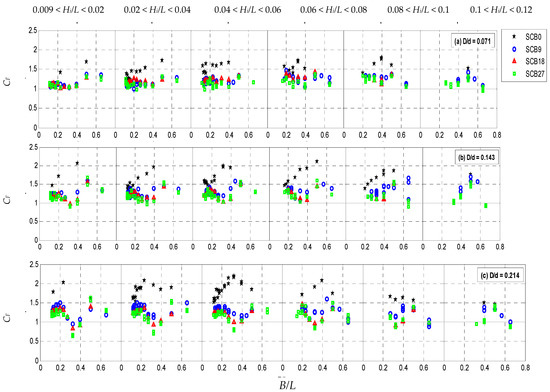
Figure 7.
Wave disturbance coefficients in front of the breakwater, CF, for the SCB models at varying relative breakwater drafts (D/d) and wave steepness (Hi/L).
In contrast, the wave climate in front of the perforated SCB models was relatively mild, with CF values ranging from 0.6 to 1.7. A careful examination of the plots in Figure 7 reveals a similar trend between CF and CR (as shown in Figure 4) for all tested D/d ratios. Greater fluctuations in CF values are observed as the value of D/d increases. Furthermore, the porosity of the breakwater exhibits some influence, particularly at higher D/d ratios, where the SCB27 model yields the lowest CF values. This suggests a direct association between wave activity in front of the perforated model and wave reflection by the front wall. Moreover, wave steepness had limited influence on CF for the perforated models.
3.5. Breakwater Chamber Wave Climate
The wave activity within the breakwater’s chamber, represented by CC, can be observed in Figure 8. It is evident that the wave activity in the chamber of the SCB0 model was relatively low, with CC values consistently below 1 for all test cases. The observed CC values for the SCB0 model at D/d = 0.071, 0.143, and 0.214 ranged from 0.21 to 0.82, 0.14 to 0.76, and 0.06 to 0.31, respectively. These values indicate that a greater immersion depth of the SCB0 model led to increased tranquility within the breakwater’s chamber. This calming effect is primarily attributed to air compression within the chamber. However, it is important to note that the limited dissipation capacity of the non-porous SCB0 model also contributed to the observed low wave activity within the chamber. While the possibility of energy diffraction effects influencing the wave activity cannot be completely ruled out, the absence of literal flow through the SCB0 model suggests that the impact of these effects was minimal.
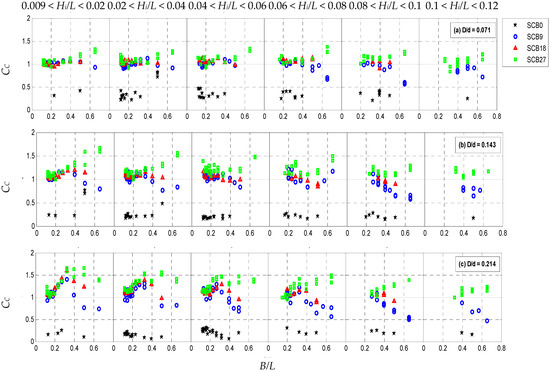
Figure 8.
Wave disturbance coefficients in breakwater’s chamber, Cc, for the SCB models at varying relative breakwater drafts (D/d) and wave steepness (Hi/L).
In permeable SCB models, the wave climate inside the breakwater’s chamber was significantly affected by the porosity of the front curving walls. Higher porosity resulted in increased wave activity within the chamber of the breakwaters. At D/d = 0.071, CC values for the permeable models mostly ranged between 0.8 and 1.2. At D/d = 0.143, the variation of CC with breakwater porosity became more distinct. The CC values for the SCB27 model consistently exceeded unity across all Hi/L ranges. At D/d = 0.214, the impact of breakwater porosity on CC became significant. The wave climate within the chamber of the SCB9 model was relatively mild compared to that of the SCB27 model for the entire range of Hi/L. Regarding wave steepness, the CC values for the perforated models gradually decreased with an increase in Hi/L for all D/d ratios.
3.6. Horizontal Wave Force
The normalized horizontal wave force by wave crests (Fn,c) and troughs (Fn,c) are plotted as functions of Hi/D and D/d in Figure 9. Note that Fn,c is taken as positive and Fn,t as negative. The effect of porosity on the force coefficients of the SCB models was generally found to be less significant, however, the influence of D/d on the force coefficients was dominant, i.e., higher force coefficients were obtained for larger D/d values.
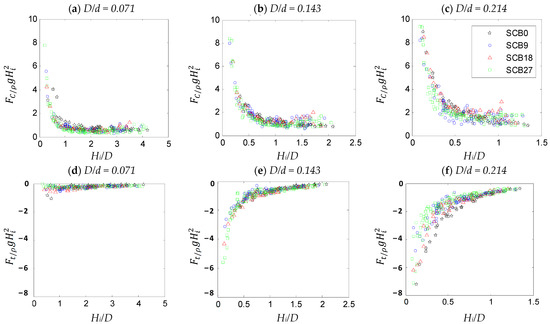
Figure 9.
Horizontal force coefficients for wave crest (top) and trough (bottom) conditions in SCB models.
As Hi/D increased, the force coefficients of D/d = 0.071, 0.143 and 0.214 gradually diminished to a value of less than 2.0 especially for Hi/D > 0.5. The waves corresponding of smaller Hi/D (i.e., smaller wave heights) were fully intercepted by the breakwater draft leading to high force coefficients. Conversely, the waves with higher Hi/D produced relatively small force coefficients due to energy loss by wave overtopping above the structure, transmission of wave trough beneath the structure and energy dissipation at the structure.
3.7. Empirical Analysis
The SCB models’ hydraulic performance was primarily affected by their geometry, incident wave characteristics, and the effect of water depth. Various non-dimensional parameters, such as the relative breakwater width (B/L), the relative breakwater draft (D/d), the wave steepness (Hi/L), the porosity of the breakwater (p), and the water depth-to-breakwater width ratio (d/B) associated with the hydraulic coefficients were identified and expressed as:
The horizontal wave force acting on the SCB models (for a unit width) by the wave crests and troughs were normalized in the form of the force coefficients as Fn,c and Fn,t, respectively:
where ρ is water density and g is the gravity acceleration. The influence of wave period to the horizontal force is relatively small [38]; therefore, it was excluded from the analysis. In this study, the test models were fixed at d/B = 1.4 throughout the experiments. Note that the effect of varying d/B ratios is under investigation and will be reported in the future.
A number of empirical formulae for the prediction of the overall hydrodynamic performance of the SCB models were developed using multiple regression methods. While previous research focused on random waves [5], the current study investigated the behavior of semicircular breakwaters under regular wave conditions. However, the empirical relationships derived from previous work [5] are still relevant and provided a basis for the calculation of the CT and CR coefficients in Equation (8), as well as the Fn,c and Fn,t coefficients in Equation (9). This research acknowledges the previous findings and adapted them to the specific context of regular waves, ensuring a consistent and informed approach to predicting hydrodynamic performance.
The general prediction formulae for CT, CR, Fn,c, and Fn,t are as follows:
The coefficients for respective Π terms in Equations (10) and (11) are tabulated in Table 2.

Table 2.
Empirical coefficients for CT, CR, Fn,t, and Fn,c.
The disparity in the values of the xi coefficients supporting the CR formulation in perforated SCBs, particularly x2, x6, and x9, can be attributed to the empirical nature of the model. Empirical models rely on observed data and may involve simplifications and assumptions, leading to variations in the coefficient values. Factors such as breakwater geometry, wave conditions, and boundary conditions contribute to these variations. The empirical model was further improved by incorporating correction factors to the respective coefficients as:

Table 3.
Correction factors for CT, CR, Fn,t, and Fn,c.
The correction factors (c1 and c2) in Equation (12) were justified based on a rigorous calibration process that involved comparing the model predictions with experimental or field data. These factors were introduced to account for any disparities between the predicted coefficients and the actual hydrodynamic behavior of perforated semicircular breakwaters. By fine-tuning the models through statistical analysis and optimization techniques, the correction factors helped improve the accuracy of the empirical models in capturing complex flow phenomena and interactions. Their values were determined to minimize the discrepancies and ensure a better representation of the real-world hydrodynamic performance. It is important to stress that the proposed empirical equations are applicable only when the following conditions are compiled:
The experimental results in Figure 10 and Figure 11 were used to validate the computed results from the empirical models for CT and CR and Fn,c and Fn,t, respectively. The statistical evaluation of the empirical models’ accuracy was conducted through the utilization of indicators such as the mean absolute deviation (MAD), the mean bias error (MBE), the root mean square error (RMSE), and the coefficient of determination (R2), which are presented in Table 4. Overall, the proposed empirical formulas for the respective SCB models demonstrated good estimation of CT, CR, and Fn,t. However, the prediction for Fn,c was relatively weak as it tended to underestimate the force coefficients, especially at higher values of Fn,c.
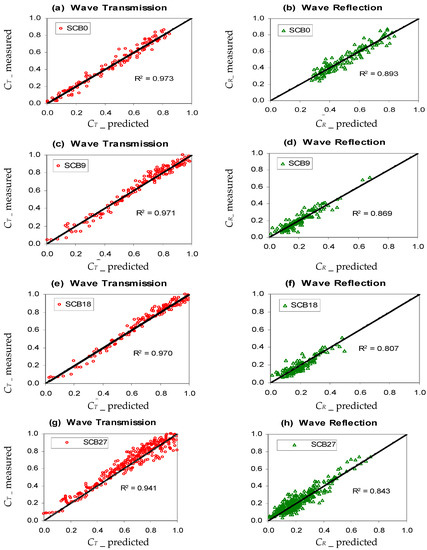
Figure 10.
Validation of empirical model: CT and CR.
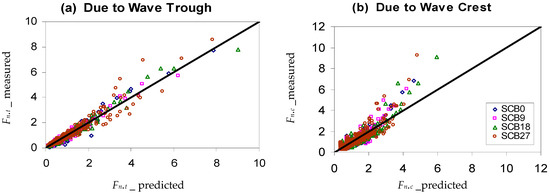
Figure 11.
Validation of empirical model: Fn,t and Fn,c.

Table 4.
Evaluation parameters for empirical models.
The proposed empirical equations provide convenient means for estimating the hydrodynamic performance of fixed free-surface semicircular breakwaters in a timely manner. However, it is important to approach these equations with caution and apply sensible engineering judgment. This is because the input data used in the analysis were obtained solely from small-scale physical model tests conducted at a scale of 1:20, which may have been influenced by laboratory and scale effects. These effects stemmed from differences between the model and the real-world system, potentially affecting the accuracy and generalization of the empirical equations. To ensure their validity, it is important to acknowledge these factors and consider the need for further validation through larger-scale experiments or field measurements. This expanded data collection would enhance the reliability and applicability of the empirical equations. Additionally, it should be noted that the influence of the parameter d/B has only been examined for a single value so far, and its impact should be further investigated for other values of d/B.
4. Conclusions
In this study, the hydrodynamic performance of the first free-surface semicircular breakwater supported on piles under regular waves was investigated through physical modeling. The breakwater’s porosity was varied, ranging from no perforation to 9%, 18%, and 27%. The hydraulic characteristics of the breakwaters were evaluated by analyzing the transmission coefficient (CT), reflection coefficient (CR), and energy dissipation coefficient (CL) as functions of breakwater porosity (p), relative breakwater width (B/L), relative breakwater draft (D/d), and wave steepness (Hi/L). The main findings of this study can be summarized as follows:
- The relative breakwater width (B/L) and relative breakwater draft (D/d) had a significant impact on the CT, CR, and CL of the breakwater models.
- Wave transmission decreased for the breakwater models when exposed to steep waves and larger immersion depths.
- The impact of breakwater porosity on energy coefficients was found to be negligible for the perforated models (SCB9, SCB18, and SCB27).
- The impervious model (SCB0) exhibited higher efficiency in reducing wave height compared to the perforated breakwaters.
- The impervious model (SCB0) acted as a highly reflective structure, leading to increased wave activity in front of the breakwater.
- Despite their lower reflectivity, the permeable breakwaters showed high levels of wave dissipation, especially for shorter-period waves.
- Water accumulation in front of the permeable breakwaters was relatively smaller compared to the impervious model.
- Wave activity within the breakwater’s chamber was less significant for the impervious model than for the perforated models.
- The wave force coefficients were sensitive to the wave height-to-breakwater draft ratio (Hi/D) and the relative breakwater draft (D/d).
- The multiple regression models used for parametric analysis showed good agreement with the measured data.
Furthermore, it is important to identify potential areas for future research to further advance the understanding of hydrodynamic performance in fixed free-surface semicircular breakwaters. Firstly, conducting large-scale experimental validations using prototypes or field measurements would provide valuable data for validating and refining the proposed empirical equations. Additionally, investigating the influence of various d/B values on the hydrodynamic behavior of semicircular breakwaters would enhance the applicability of the models to a wider range of design scenarios. Moreover, considering the effects of tide on the hydrodynamic performance of semicircular breakwaters would provide valuable insights into their behavior under varying tidal conditions. Furthermore, incorporating a comprehensive analysis of sliding stability by considering the weight of the structure/model and its interaction with the foundation would contribute to a more comprehensive understanding of breakwater stability. These avenues for future research will contribute to improving the accuracy and reliability of hydrodynamic predictions for semicircular breakwaters.
Author Contributions
H.M.T.: conceptualization, data curation, formal analysis, visualization, writing—original draft. F.A.H.A.-T.: formal analysis, visualization, writing—original draft; V.V.: supervision, resources, conceptualization, writing—review and editing; Z.M.: supervision, writing—review and editing. All authors have read and agreed to the published version of the manuscript.
Funding
Ministry of Higher Education Malaysia (KPT), Fundamental Research Grant Scheme (FRGS/1/2018/TK10/UTP/02/8), and YUTP Board, YUTP-PRG (015PBC-022).
Institutional Review Board Statement
Not applicable.
Informed Consent Statement
Not applicable.
Data Availability Statement
Not applicable.
Acknowledgments
The authors would like to thank Ministry of Higher Education (MOE), Malaysia for providing financial assistance under the Fundamental Research Grant Scheme. (FRGS/1/2018/TK10/UTP/02/8), and YUTP Board for funding this paper through YUTP-PRG (015PBC-022).
Conflicts of Interest
The authors declare no conflict of interest.
Notation
| B | = | Breakwater width [m] |
| CC | = | Coefficient of climate change at the breakwater chamber |
| CF | = | Coefficient of climate change at the breakwater front |
| CL | = | Coefficient of energy dissipation |
| CR | = | Coefficient of wave reflection |
| CT | = | Coefficient of wave transmission |
| D | = | Breakwater draft/depth of immersion [m] |
| d | = | Depth of water [m] |
| F | = | Wave crests/troughs’ average horizontal wave force [N] |
| Fn,c | = | Wave-crest force coefficient |
| Fn,t | = | wave trough force coefficient |
| g | = | Gravity acceleration [m/s2] |
| Hc | = | Average breakwater chamber wave height [m] |
| Hf | = | Average front breakwater wave height [m] |
| Hi | = | Height of incident waves on average [m] |
| Hr | = | Height of reflected waves on average [m] |
| Ht | = | Height of transmitted waves on average [m] |
| L | = | Wavelength of the wave [m] |
| p | = | Front SCB curve wall permeability |
| T | = | Period of waves [s] |
| ρ | = | Water density [kg/m3] |
References
- Mizutani, N.; Rahman, M.A. Performance of submerged floating breakwater supported by perforated plates under wave action and its dynamics. In Civil Engineering in the Oceans VI; ASCE: Reston, VA, USA, 2006; pp. 329–341. [Google Scholar]
- Wang, C.; Nguyen, H. Floating Breakwaters: Sustainable Solution for Creating Sheltered Sea Space. In ICSCEA 2021: Proceedings of the Second International Conference on Sustainable Civil Engineering and Architecture, Ho Chi Minh City, Vietnam, 30 October 2021; Springer: Berlin/Heidelberg, Germany, 2022; pp. 3–20. [Google Scholar]
- Teh, H.; Azizan, M.; Kurian, V.; Hashim, A.M. Use of a floating breakwater system as an environmentally friendly method of coastal shelter. In Coastal Cities and Their Sustainable Future; WIT Press: Southampton, UK, 2015; Volume 148, pp. 309–318. [Google Scholar]
- Kolahdoozan, M.; Alizadeh, M.J.; Tahershamsi, A.; Abdolali, A. Experimental study of the performance of floating breakwaters with heave motion. Civ. Eng. Infrastruct. J. 2014, 47, 59–70. [Google Scholar]
- Teh, H.M.; Venugopal, V.; Bruce, T. Hydrodynamic characteristics of a free-surface semicircular breakwater exposed to irregular waves. J. Waterw. Port Coast. Ocean Eng. 2012, 138, 149–163. [Google Scholar] [CrossRef]
- Wang, Y.; Wang, G.; Li, G. Experimental study on the performance of the multiple-layer breakwater. Ocean Eng. 2006, 33, 1829–1839. [Google Scholar] [CrossRef]
- Teh, H.M.; Venugopal, V.; Bruce, T. Hydrodynamic performance of a free surface semicircular perforated breakwater. Coast. Eng. Proc. 2010, 32, 20. [Google Scholar] [CrossRef]
- Koftis, T.; Prinos, P. On the hydrodynamic efficiency of floating breakwaters. In Proceedings of the 1st International Conference on Coastal Zone Management and Engineering in the Middle East, Dubai, United Arab Emirates, 27–29 November 2005. [Google Scholar]
- Koutandos, E. Hydrodynamic analysis of a skirt breakwater. In Proceedings of the Institution of Civil Engineers-Maritime Engineering; Thomas Telford Ltd.: London, UK, 2007; pp. 121–133. [Google Scholar]
- Evan, K.; Panyotis, P. In design formulae for wave transmission behind floating breakwaters. In Proceedings of the Korea Water Resources Association Conference, 2005; Korea Water Resources Association: Deajeon, Republic of Korea, 2005; pp. 906–907. [Google Scholar]
- Li, D.; Panchang, V.; Tang, Z.; Demirbilek, Z.; Ramsden, J. Evaluation of an approximate method for incorporating floating docks in harbor wave prediction models. Can. J. Civ. Eng. 2005, 32, 1082–1092. [Google Scholar] [CrossRef]
- Sundar, V.; Subbarao, B. Hydrodynamic performance characteristics of quadrant front-face pile-supported breakwater. J. Waterw. Port Coast. Ocean Eng. 2003, 129, 22–33. [Google Scholar] [CrossRef]
- Patarapanich, M.; Cheong, H.-F. Reflection and transmission characteristics of regular and random waves from a submerged horizontal plate. Coast. Eng. 1989, 13, 161–182. [Google Scholar] [CrossRef]
- Neelamani, S.; Gayathri, T.J. Wave interaction with twin plate wave barrier. Ocean Eng. 2006, 33, 495–516. [Google Scholar] [CrossRef]
- Neelamani, S.; Rajendran, R. Wave interaction with T-type breakwaters. Ocean Eng. 2002, 29, 151–175. [Google Scholar] [CrossRef]
- Neelamani, S.; Rajendran, R. Wave interaction with ‘⊥’-type breakwaters. Ocean Eng. 2002, 29, 561–589. [Google Scholar] [CrossRef]
- Neelamani, S.; Vedagiri, M.J. Wave interaction with partially immersed twin vertical barriers. Ocean Eng. 2002, 29, 215–238. [Google Scholar] [CrossRef]
- Günaydın, K.; Kabdaşlı, M.J. Investigation of Π-type breakwaters performance under regular and irregular waves. Ocean Eng. 2007, 34, 1028–1043. [Google Scholar] [CrossRef]
- Brossard, J.; Jarno-Druaux, A.; Marin, F.; Tabet-Aoul, E.J. Fixed absorbing semi-immersed breakwater. Coast. Eng. 2003, 49, 25–41. [Google Scholar] [CrossRef]
- Koraim, A.S. Hydrodynamic efficiency of suspended horizontal rows of half pipes used as a new type breakwater. Ocean Eng. 2013, 64, 1–22. [Google Scholar] [CrossRef]
- Gao, J.; Ma, X.; Dong, G.; Chen, H.; Liu, Q.; Zang, J.J. Investigation on the effects of Bragg reflection on harbor oscillations. Coast. Eng. 2021, 170, 103977. [Google Scholar] [CrossRef]
- Tsai, C.-C.; Behera, H.; Hsu, T.-W. Analysis of water wave interaction with multiple submerged semi-circular porous structures. Arch. Appl. Mech. 2023, 93, 2693–2709. [Google Scholar] [CrossRef]
- Gomes, A.; Pinho, J.L.; Valente, T.; Antunes do Carmo, J.S.; Hegde, V.A. Performance assessment of a semi-circular breakwater through CFD modelling. J. Mar. Sci. Eng. 2020, 8, 226. [Google Scholar] [CrossRef]
- Tanimoto, K. Japanese experiences on composite breakwaters. In Proceedings of the International Workshop on Wave Barriers in Deepwaters, Yokosuka, Japan, 10–14 January 1994. [Google Scholar]
- Zhang, N.-C.; Wang, L.-Q.; Yu, Y.-X. Oblique irregular waves load on semicircular breakwater. Coast. Eng. J. 2005, 47, 183–204. [Google Scholar] [CrossRef]
- Le Xuan, T.; Ba, H.T.; Thanh, V.Q.; Wright, D.P.; Tanim, A.H.; Anh, D.T. Evaluation of coastal protection strategies and proposing multiple lines of defense under climate change in the Mekong Delta for sustainable shoreline protection. Ocean Coast. Manag. 2022, 228, 106301. [Google Scholar] [CrossRef]
- Tanimoto, K.; Namerikawa, N.; Ishimaru, Y.; Sekimoto, T.J. A hydraulic experimental study on semi-circular caisson breakwaters. Port Harb. Res. Inst. 1989, 23, 3–32. [Google Scholar]
- Sasajima, H. Field demonstration test on a semi-circular breakwater. In Proceedings of the International Conference on Hydro-Technical Engineering for Port & Harbor Construction, HYDRO-PORT’94, Yokosuka, Japan, 19–21 October 1994; pp. 593–615. [Google Scholar]
- Xie, S.J. Waves forces on submerged semicircular breakwater and similar structures. China Ocean Eng. 1999, 13, 63–72. [Google Scholar]
- Dhinakaran, G.; Sundar, V.; Sundaravadivelu, R.; Graw, K.J. Dynamic pressures and forces exerted on impermeable and seaside perforated semicircular breakwaters due to regular waves. Ocean Eng. 2002, 29, 1981–2004. [Google Scholar] [CrossRef]
- Yuan, D.; Tao, J.J. Wave forces on submerged, alternately submerged, and emerged semicircular breakwaters. Coast. Eng. 2003, 48, 75–93. [Google Scholar] [CrossRef]
- Mansard, E.P.; Funke, E. The measurement of incident and reflected spectra using a least squares method. Coast. Eng. 1980, 1980, 154–172. [Google Scholar]
- Burcharth, H.; Hughes, S.A. Fundamentals of design. In Coastal Engineering Manual; Coastal Engineering Research Center: Chicago, IL, USA, 2003; pp. VI-5-i–VI-5-316. [Google Scholar]
- Mohapatra, A.K.; Sahoo, T. Surface gravity wave interaction with a submerged composite wavy porous plate attached to a vertical wall. J. Offshore Mech. Arct. Eng. 2022, 144, 011904. [Google Scholar] [CrossRef]
- Jeya, T.J.; Sriram, V.; Sundar, V. Hydrodynamic characteristics of vertical and quadrant face pile supported breakwater under oblique waves. J. Eng. Marit. Environ. 2022, 236, 62–73. [Google Scholar] [CrossRef]
- Silavaraj, t. Numerical Analysis on Hydraulic Performance of the Fixed Free Surface H-Type Breakwater. Ph.D. Thesis, Universiti Teknologi Petronas, Seri Iskandar, Malaysia, 2020. [Google Scholar]
- Hsiao, S.-S.; Fang, H.-M.; Chang, C.-M.; Lee, T.-s.; Huang, H.-Y. In Experimental study of the wave energy dissipation due to the porous-piled structure. In Proceedings of the Eighteenth International Offshore and Polar Engineering Conference, Vancouver, BC, Canada, 6–11 July 2008; OnePetro: Richardson, TX, USA, 2008. [Google Scholar]
- Teh, H.M.; Venugopal, V.; Bruce, T. Performance analysis of a semicircular free surface breakwater. In Proceedings of the International Conference on Offshore Mechanics and Arctic Engineering, Rotterdam, The Netherlands, 19–24 June 2011; pp. 487–497. [Google Scholar]
Disclaimer/Publisher’s Note: The statements, opinions and data contained in all publications are solely those of the individual author(s) and contributor(s) and not of MDPI and/or the editor(s). MDPI and/or the editor(s) disclaim responsibility for any injury to people or property resulting from any ideas, methods, instructions or products referred to in the content. |
© 2023 by the authors. Licensee MDPI, Basel, Switzerland. This article is an open access article distributed under the terms and conditions of the Creative Commons Attribution (CC BY) license (https://creativecommons.org/licenses/by/4.0/).