Article

Prediction of Wave Forces on the Box-Girder Superstructure of the Offshore Bridge with the Influence of Floating Breakwater

1
School of Civil Engineering, Chongqing Jiaotong University, Chongqing 400074, China
2
Sichuan Highway Engineering Consult Supervision Company Ltd., Chengdu 610041, China
3
School of Civil Engineering, Southwest Jiaotong University, Chengdu 610031, China
4
Chongqing Zhongjian Engineering Quality Inspection Co., Ltd., Chongqing 400025, China
*
Authors to whom correspondence should be addressed.
J. Mar. Sci. Eng. 2023, 11(7), 1326; https://doi.org/10.3390/jmse11071326
Submission received: 31 May 2023 / Revised: 25 June 2023 / Accepted: 28 June 2023 / Published: 29 June 2023

Abstract

:
In recent years, with global warming and frequent natural disasters, existing offshore bridges are facing the risk of extreme wave action. The research on disaster prevention and mitigation measures of the box-girder superstructure of offshore bridges under extreme wave action is still scarce. In this paper, a numerical model based on the RANS equation and k-ε turbulence model is established to study the wave forces on the box-girder superstructures of offshore bridges with the influence of a floating breakwater. A numerical method for studying the interaction of waves and structures is proposed and verified through experimental data. The effects of many parameters of the floating breakwater on wave attenuation are investigated and a prediction model of the wave reduction rate based on neural network algorithm is proposed. The results show that the reduction rate of wave forces for fixed breakwaters can reach more than 30%, which indicates that a floating breakwater has a significant effect in reducing the wave forces on the box-girder superstructure. The wave reduction performances of the displacement-restricted breakwater and the fixed breakwater are better than that of an elastic restricted breakwater. The prediction model proposed based on the BP neural network is accurate in estimating the maximum wave forces on the box-girder superstructure with the influence of the floating breakwater.

1. Introduction

Unlike inland bridges, offshore bridges are located in a complex and severe marine dynamic environment, with gale-force winds and huge waves. In recent years, there have been extreme marine disasters, and these extreme disasters have resulted in the destruction of a large number of offshore bridges [1,2,3,4]. For example, Hurricane Ivan swept along the Atlantic coast at 265 km/h in 2004, destroying dozens of offshore bridges, and Hurricane Katrina swept through the Gulf of Mexico in 2005, damaging 44 offshore bridges in Louisiana, Mississippi and Alabama in the United States, and costing more than USD 1 billion to repair or rebuild the damaged offshore bridges [5,6,7,8,9].
To gain a complete and accurate understanding of the damage to offshore bridges caused by hurricane disasters, a number of researchers carried out on-site investigations immediately after such a disaster, analyzing the types of damage to offshore bridges and the causes of their destruction. Douglass et al. [10] investigated the damage to bridge superstructures along the coasts of Alabama, Florida and Mississippi during Hurricane Ivan and Hurricane Katrina. The study indicated that extreme waves directly impacted bridge superstructures due to storm surges and significant water level rises, resulting in the failure of offshore bridges. Robertson et al. [11] reported that Hurricane Katrina caused varying degrees of displacement of the bridge superstructure on five spans, despite the bolted connections between the superstructure and substructure of the bridge. Padgett et al. [12] described the model of bridge damage observed after Hurricane Katrina, including damage caused by storm surges, wind, debris impact, scour and flooding, and the repair measures used to rapidly restore the bridge and transportation system. Using data from 44 damaged bridges, relationships were developed between storm surge elevation, damage and repair costs.
Guo et al. [13] and Fang [14] conducted a 1:10 model test for the full span bridge structure of a 20 m-span T-girder bridge. The experimental test simulated extreme waves with regular waves and analyzed the effects of wave height, wave period and clearance height of the superstructure on the wave forces. Their study found that the impact force on the main girder was comparable in magnitude to the quasi-static force, and the impact force reached its maximum at zero clearance at the bottom of the main girder. Istrati [15,16] conducted a 1:5 large-scale wave and T-type girder coupling test in a wave flume at the University of Oregon, using the I-10 bridge in Escambia Bay, Florida, as a prototype. The experimental test was conducted by supporting the main girder on a horizontal chute to simulate vibration along the horizontal direction, and by placing connection springs of different stiffnesses between the main girder and the connection frame to simulate the restraining effect of the substructure and the support on the superstructure. The experimental test results show that the horizontal force on the T-type girder after considering the vibration of the girder in the horizontal direction is significantly different from that of the fixed one. Qu et al. [17] investigated the hydrodynamic characteristics of a T-type girder bridge under extreme wave action using the open-source software REEF3D, and analyzed the effects of parameters such as wave height, wave period and water depth. He found that the vertical wave force increased with the increase in the focused wave period, while the horizontal force showed a linear increase and then a decrease, and the water depth had little effect on the wave force, especially the vertical wave force.
The cross-sectional characteristics of offshore bridge superstructures, which have different cross-sectional shapes and variable cross-sectional dimensions, are the key factors affecting the wave forces. Huang et al. [18,19] investigated the effects of cross-sectional dimension parameters on wave forces for single box-girder superstructures using numerical simulations. They also conducted a parametric study on the cross-sectional dimensions of fully submerged box-girder superstructures using the potential flow theory, and showed that the structural dimensional parameters have a great influence on the wave force on the box-girder superstructure [20,21]. They found that the increase in relative web width, relative flange thickness and relative box beam height leads to a decrease in the dimensionless vertical wave force of the superstructure, but at the same time causes an increase in the dimensionless horizontal wave force. To investigate the differences in wave forces between box-girder and T-type girder bridges, Yang et al. [22] used numerical methods to simulate the wave action on the box-girder superstructure and T-type girders (both girders have the same girder height, girder width and deck thickness). It was shown that the wave forces on these two girders were significantly different, especially when the girders were not submerged. In general, the horizontal forces on a T-type girder are higher than those on a box-girder superstructure, while the vertical forces on a box-girder superstructure are higher than those on a T-type girder.
To reduce the extreme wave forces on a bridge superstructure and its damage failure, the measures to resist the effects of extreme waves on bridge superstructures can be divided into two categories: One is to reduce the wave force on the superstructure by optimizing the local structure form. The other is the installation of breakwaters on the seaward side [23]. Xue et al. [24] conducted a study on the effect of tri-semicircle-shaped submerged breakwaters on the reduction in wave forces on bridge superstructures, considering the effects of parameters such as breakwater cross-sectional shape and breakwater–bridge spacing. The results show that the breakwater can effectively reduce both horizontal and vertical wave forces on the bridge superstructure. Qu et al. [25] investigated the wave force reduction effect of a fixed breakwater on offshore bridge superstructures by numerical simulation, and parametrically analyzed the effects of wave height, inundation depth, water depth and distance between a floating breakwater and a bridge on the wave force on the bridge superstructure. The study shows that the inundation depth and the distance between the floating breakwater and the bridge superstructure are important factors affecting the wave force reduction effect. Compared to a case without a breakwater, the horizontal and vertical wave forces on the bridge superstructure are significantly reduced after the installation of the floating breakwater. In comparison, the reduction in vertical wave force caused by the floating breakwater is more significant than that of horizontal wave force. A wave–structure coupling method was proposed and utilized to numerically investigate the focused wave forces on a two-dimensional coastal bridge with a box-girder superstructure under the influence of a pile-restrained floating breakwater by Huang et al. [26]. A study of the effectiveness of floating breakwaters in protecting a box-girder superstructure from extreme wave damage was conducted by them, and the effects of floating breakwater control parameters on extreme wave forces were investigated. The results suggest that the nondimensional height of the floating breakwater with displacement constraint should be within the range of 0.4–1.2, and the wave reduction effect can reach 23.4% to 45.9% and 22.1% to 49.6% for the horizontal and vertical focused wave forces on the box-girder superstructure, respectively. The above studies show that the use of a floating breakwater is an effective wave attenuation method for bridge superstructures, but there are still few relevant studies, and there is an urgent need to further investigate the wave attenuation effect of bridge superstructures under the influence of the floating breakwater, and to propose an effective estimation method based on the artificial intelligence method to clarify the effect of each parameter on the wave attenuation effect.
In the next section, a numerical method for studying the interaction of waves and structures is proposed and verified. The neural network algorithm used to predict the wave reduction rate is described in Section 3. The effect of each parameter of the pile-restrained floating breakwater on the wave attenuation effect is investigated and the prediction model of the wave reduction rate based on a neural network algorithm is also proposed in the Section 4. Finally, several conclusions are summarized in the last section.

2. Numerical Methodology

2.1. Wave–Structure Interaction

In this study, the wave is assumed to be an incompressible viscous fluid, and the wave motion is described by the Reynolds-time homogeneous Navier–Stokes (RANS) equations, whose mass and momentum conservation equations are as follows:
u ¯ i x i = 0
ρ u ¯ i t + ρ u ¯ j u ¯ i x j = P ¯ x i + μ 2 u ¯ i x i x j ρ u i u j ¯ x j
where the subscripts i and j represent the (x, y) direction in the Cartesian coordinate system, u i ¯ is the average velocity in the xi direction, u i is the fluctuating velocity in the xi direction, the instantaneous fluid velocity u i = u i ¯ + u i in the xi direction, ρ is the fluid density, p ¯ is the average pressure, μ is the fluid viscosity, and ρ u i u j ¯ is the Reynolds stress. The study adopts the k-ε turbulence model, and the transport equations corresponding to the turbulent kinetic energy k and the turbulent dissipation rate ε are as follows:
k t + k u i x i = x j μ ρ + μ t ρ σ k k x j + G k + G b Y M + S k ρ ε
ε t + ε u i x j = x j μ ρ + μ t ρ σ ε ε x j + C 1 ε ε k ρ ( G k + C 3 ε G b ) - C 2 ε ε 2 k + S ε ρ
where Gk is the turbulent energy generation term caused by the mean velocity gradient, Gb is the turbulent energy generation term caused by buoyancy, YM represents the contribution of pulsation expansion in turbulence, C1ε, C2ε and C3ε are empirical constants, σk and σε are the Prandtl numbers corresponding to the turbulent energy k and dissipation rate ε, respectively, and Sk and Sε are source terms. The introduction of a turbulence model is instrumental in enhancing the precision of the calculation of wave forces on offshore bridge superstructures and wave–structure interactions [3,26].
The calculation process involves capturing the liquid–gas two-phase flow interface. The volume fraction of fluid (VOF) method is a widely used method for capturing the liquid–gas interface in CFD software [27,28]. This method measures the distribution of different fluids (gas or liquid) in the computational grid by introducing the phase fraction α, which is an arbitrary value between 0 and 1. When α = 1, the grid is characterized by water, when α = 0, the grid is characterized by air, and when 0 < α < 1, the grid is characterized by the presence of both water and air. The fluid–structure interaction must be considered because the pile-restrained floating breakwater, which can move vertically, is used in the study to investigate its reduction effect on the wave force of the bridge superstructure. We can simulate the structural vibration system of the pile-restrained floating breakwater using a mass spring-damping system. The overlapping mesh method is used to simulate the fluid–structure coupling between the wave and floating breakwater, which divides the complex flow field region into a background mesh region and one or more sub-grid regions. The background mesh region is a fixed, immobile region containing the entire flow field, and the sub-grid regions are mobile mesh regions generated according to the motion requirements of the moving floating breakwater. Each region is generated independently; the sub-grid regions are nested within the background grid, and the sub-grids may also overlap with each other. Through the interpolation relationship established between multiple sets of meshes, the flow field information is transferred and exchanged between multiple sets of meshes to realize fluid simulation and the calculation of the whole flow field.
The open-source software OpenFOAM used in this study uses the separation method to solve the fluid–structure coupling problem. OpenFOAM is based on the finite volume method and used to discretize the fluid governing equations, and then the fluid pressure and viscous force are transferred to the structure through interface information transfer, while the structure velocity and displacement are fed back to the fluid, and the fluid domain updates the mesh and repeats the above process to realize the simulation of the fluid–structure coupling problem [6,22]. The PIMPLE solver (SIMPLE (Semi-Implicit Method for Pressure-Linked Equations) combined with PISO (Pressure-Implicit with Splitting of Operators)) is used to decouple the pressure and velocity component, and the algorithm can solve the simulation of transient flow fields with large time steps.

2.2. Verification of the Wave Genertation and the Fluid–Structure Interaction

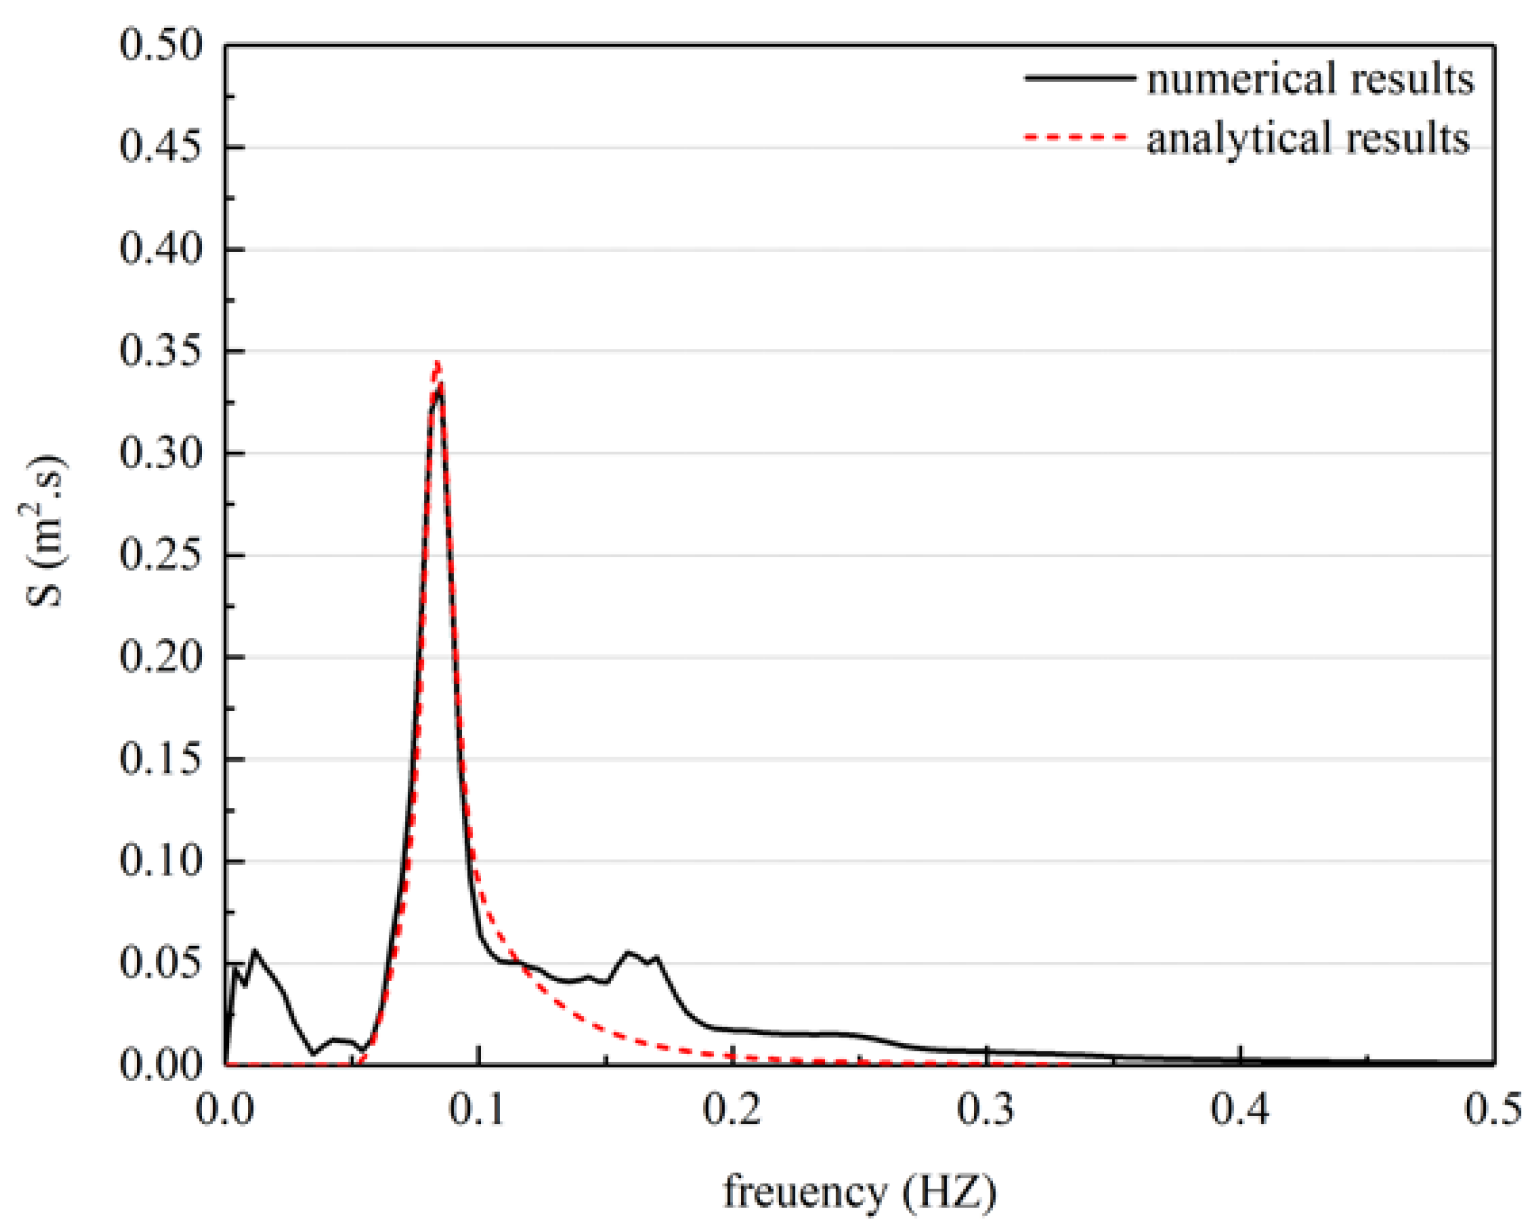
In the present work, focused waves are used for simulating extreme waves, considering only one set of wave conditions: water depth d = 30 m, maximum focused wave amplitude Af = 5 m, peak frequency fp = 0.1 Hz, and constituent wave frequency range f = 0.5fp~2fp = 0.05 Hz~0.2 Hz. Using OpenFOAM to construct a 2D numerical wave tank, the focus position of the focused wave is set to xb = 800 m, and the focus time is set to tb = 150 s. Figure 1 shows the results of comparing the numerical wave surface (η) with the theoretical result. As shown in the figure, the numerical wavefront generally agrees well with the theoretical wavefront. Figure 2 shows the comparison of the wave spectra between the numerical and theoretical results. The numerical and theoretical wave spectra densities (S) are in good agreement, and the energy distributions in the low-frequency and high-frequency parts are slightly higher than the theoretical wave spectrum, while the energy distribution in the peak-frequency part is slightly lower than the theoretical value, which is mainly due to the transfer of energy from the peak-frequency region to other regions due to wave–wave interaction.
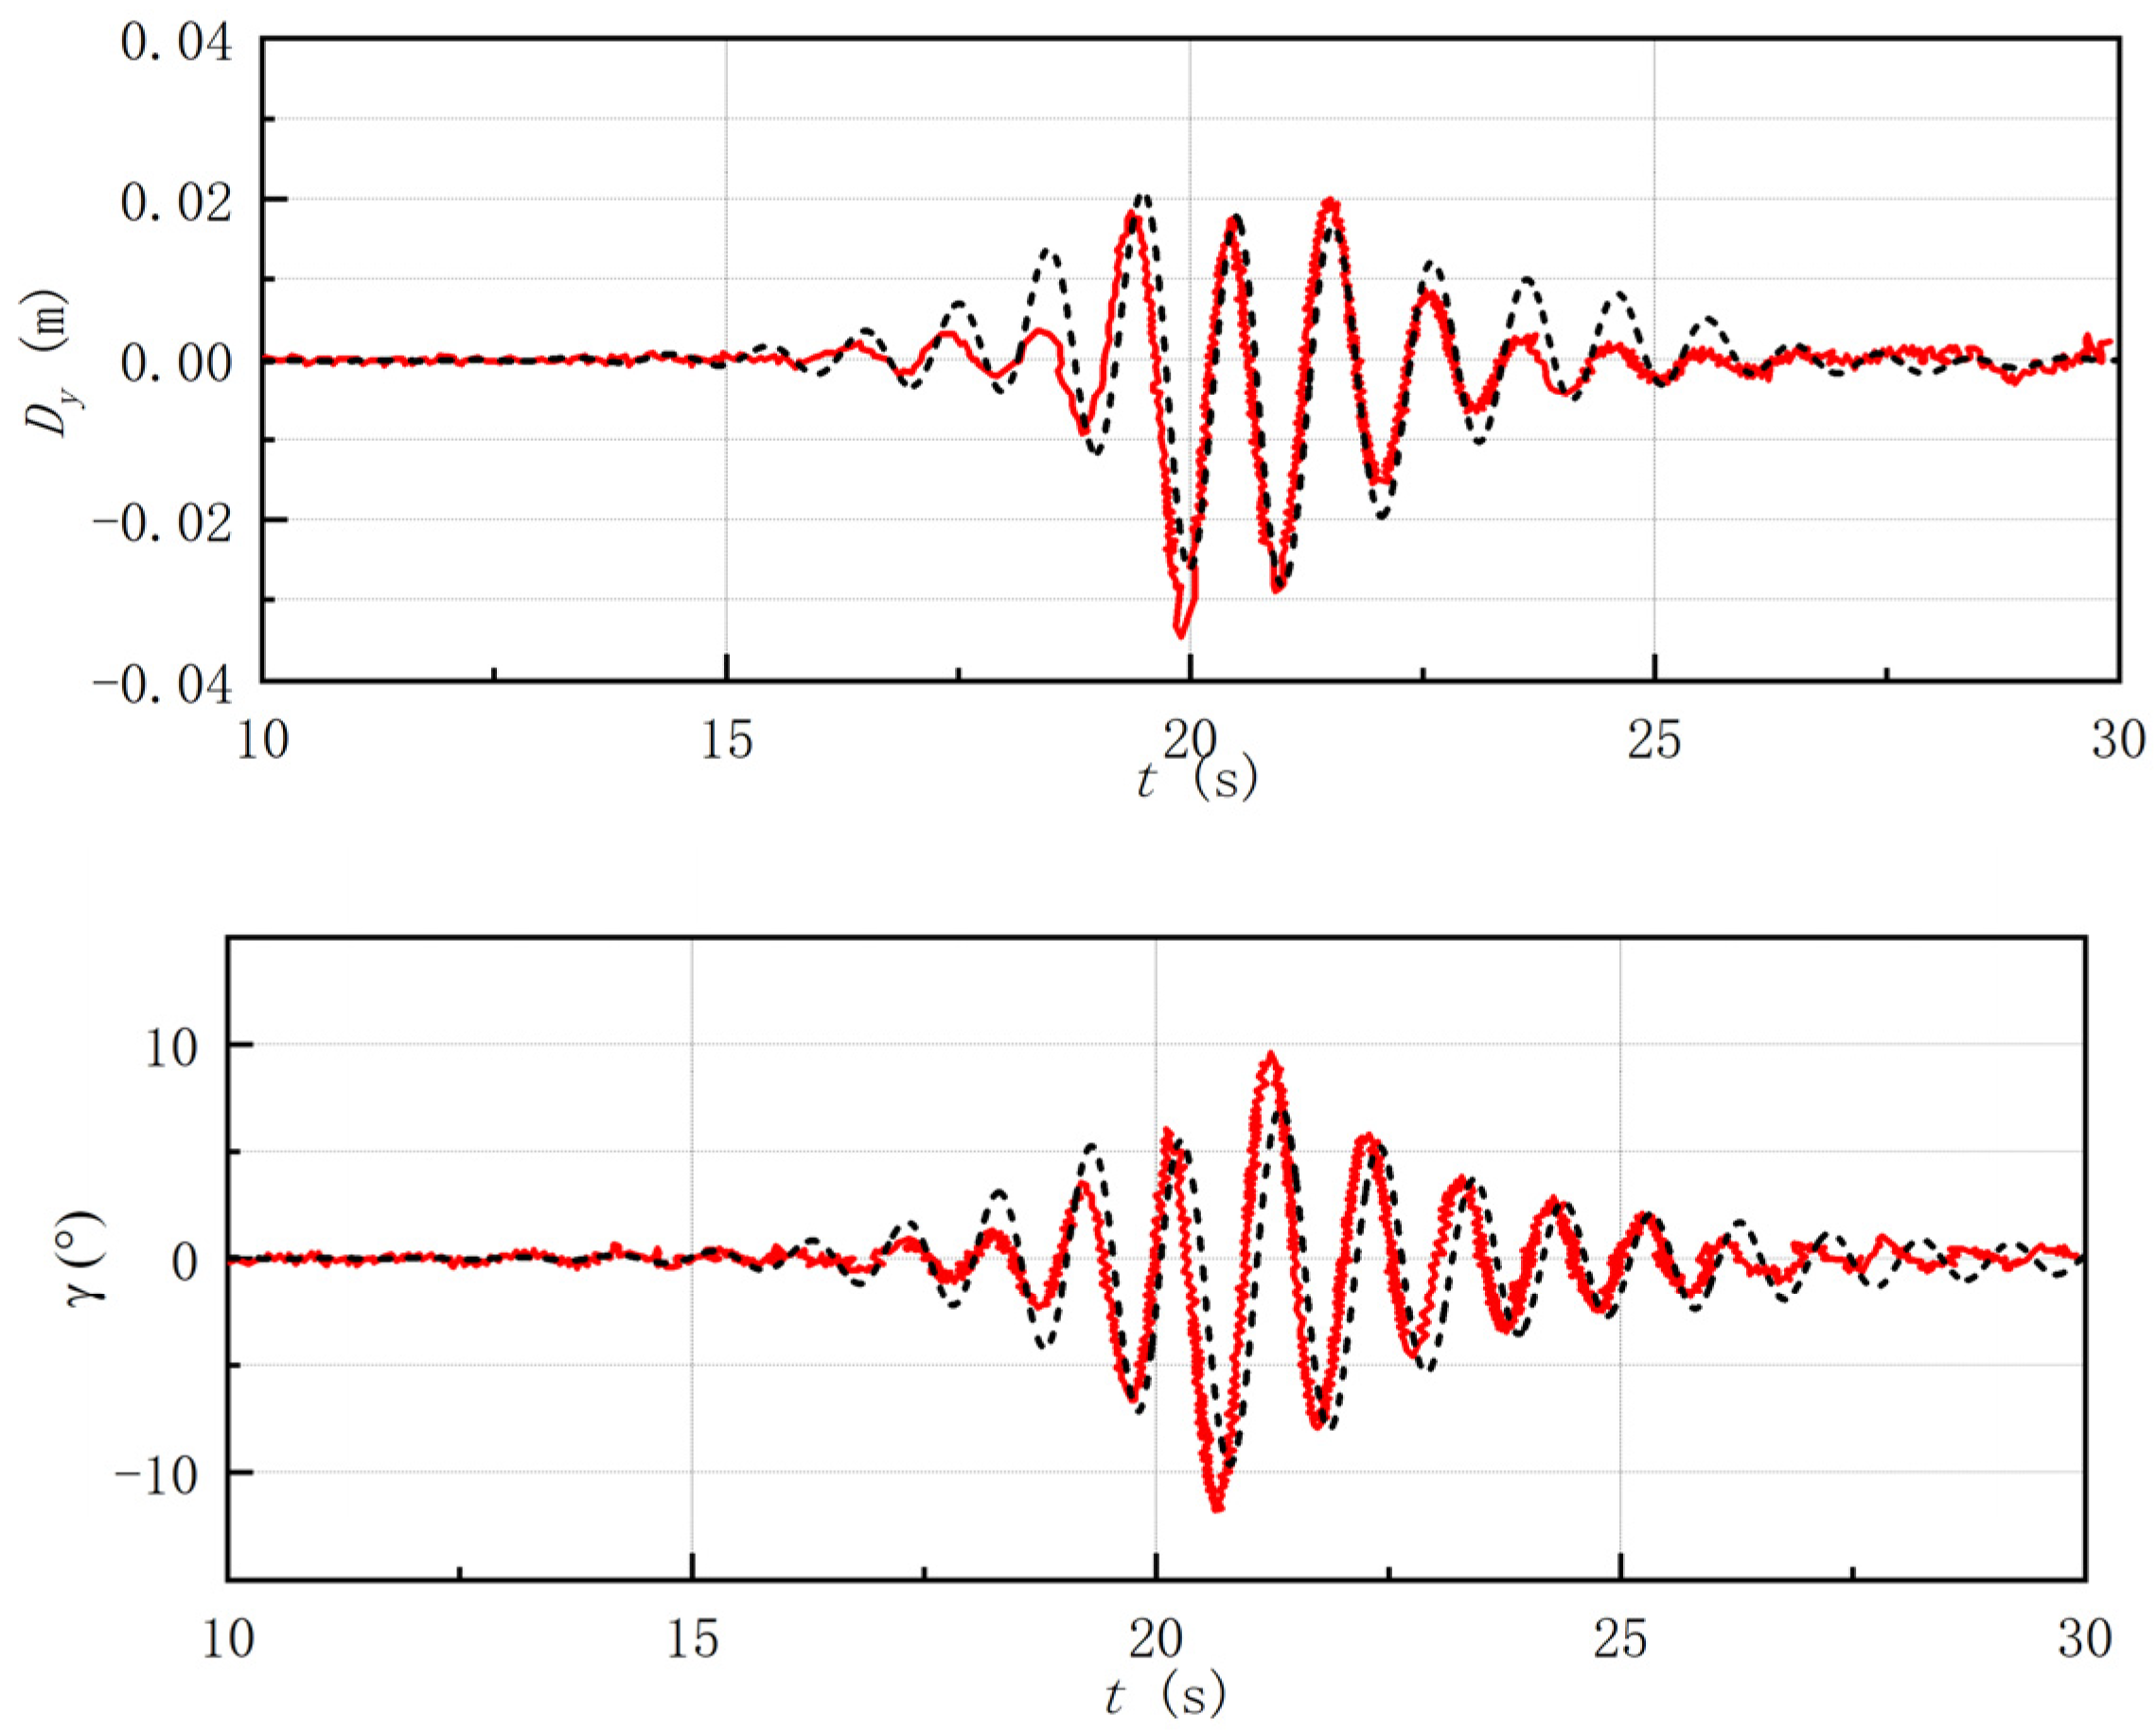
Meanwhile, to further verify the computational accuracy of the wave–structure coupling simulation method described above, the simulation of wave–floating body interaction was carried out and compared with the coupling test carried out by Zhao et al. [29]. The floating structure was placed at a position 7 m downstream of the wave plate, and the floating structure was hinged to a vertical link connected to a pulley car at the top of the flume. Under wave action, the floating structure is capable of free deflection and free torsional motion, and is restrained in the horizontal direction by two springs with stiffness k = 3.82 N/m. The vertical displacements and torsion angles of the floating structure under the action of regular, focused and combined waves were measured. Based on the size of the wave flume and the test arrangement, a 1:1 numerical model was constructed using the fluid–structure coupling simulation method proposed in this study. The numerical calculations of the vertical displacement (Dy) and torsion angle (θ) of the structure are compared with the test results, as shown in Figure 3. Figure 3 shows that the numerical model established in this study can simulate the wave–structure coupling action and be used to accurately calculate the dynamic response of the floating structure.

3. Neural Network Algorithm

In this study, CFD numerical simulation results of the wave forces on the box-girder superstructure of the offshore bridge under the influence of a pile-restrained floating breakwater are used as sample data. The back-propagation (BP) neural network method is used for training. In this study, the wave force acting on the box-girder superstructure is influenced by multiple factors, such as wave amplitude and the size and characteristics of the floating breakwater. This results in a nonlinear correlation law. Furthermore, due to their ability to automatically learn input–output samples, neural networks can approximate any complex nonlinear mapping with arbitrary precision. Therefore, a neural network is employed in this study to forecast the maximum wave forces acting on the box-girder superstructure under varying wave parameters and characteristics of the floating breakwater. First, based on the k-fold cross-validation method, the data are divided into a training set and a validation set. Then, the models with different network parameter configurations are trained using the training set, and the performances of different models are determined by the validation set to select the optimal model as the final model for constructing a prediction model of the attenuation rate of wave forces on the box-girder superstructure of an offshore bridge, considering the influence of a pile-restrained floating breakwater.
A BP neural network is a type of feed-forward neural network with backward error propagation, generally consisting of an input layer, an output layer, and a single or multi-layer hidden layer of neurons between the input and output layers, where the input layer neurons receive external input signals, the hidden layer and output layer neurons process the signals, and the final result is output by the output layer neurons. The neurons in each layer of the BP neural network are fully connected to the neurons in the next layer, and there are no connections between neurons in the same layer or between layers. First, the input layer neuron receives the external input signal and inputs it to the hidden layer neuron through the weight connection; then, the input result of the hidden layer neuron is processed non-linearly through the activation function. Then, the above values are weight-connected and the signal is passed to the output layer neuron; finally, the appropriate activation function is selected to transform the output. The above process is equivalent to completing the process of passing the signal from the input layer to the output layer, while the training process of the BP algorithm is equivalent to iteratively updating the weights and biases in the network structure and finally obtaining the desired output by back-propagating the error between the output result and the sample after each time the output result is obtained. The BP algorithm is generally based on the gradient descent strategy for iteratively updating the weights and biases, while the learning rate controls the update step in each iteration round [30,31,32].
In the process of model learning, it is possible to learn sample features “too well”, taking some features of the training sample itself as a “universal law” that all potential samples have, known in machine learning as “overfitting” (as shown in Figure 4). This can lead to a bias in the model’s predictions when it encounters new samples. In addition, there may be cases where the model has low learning ability and is unable to learn the general pattern of the sample, i.e., “underfitting”. Therefore, the model needs to be evaluated after training to see if it has the ability to generalize, which means that the model needs to be evaluated using a test set in addition to the training set.
Therefore, the k-fold cross-validation method is used to partition the data set, and each subset is obtained by stratified sampling from the total data set D to ensure that the data distribution is consistent across the subsets. On this basis, the k-1 subsets are combined each time as the training set for model training, and the remaining one is used as the test set for model testing, so that k sets of training and test set data can be obtained. The model is then trained and tested k times, and the average error of the k test errors is finally returned, and the model with the smallest average error is then selected as the final model. At the same time, the Root Mean Square Error (RMSE) and the Goodness of Fit (R2), typical evaluation indicators of regression class models, as shown below, are used as evaluation indicators of the prediction model.
R M S E ( y , y ^ ) = 1 m i = 1 m ( y ( i ) y ^ ( i ) ) 2
R 2 ( y , y ^ ) = 1 S S E S S T = 1 i = 0 m ( y ( i ) y ^ ( i ) ) 2 i = 0 m ( y ( i ) y ¯ ( i ) ) 2
where y(i) and y(i) are the expected and model-predicted values of the i-th sample, respectively, and m is the number of samples.

4. Parametric Study and Prediction Model

4.1. Parametric Study

Three possible vertical motion characteristics of the floating box are considered in the study: (1) The floating box does not generate any motion in the vertical direction, similar to the pier breakwater. In this case, the solidification mode is used to constrain the motion of the floating box in the numerical model. (2) The floating box shows a sinking motion in the vertical direction, but its motion is constrained. In this case, a spring restraint is used in the numerical model, and three restraint stiffnesses k = 10 kN/m, 50 kN/m and 100 kN/m are considered. (3) Considering that the displacement of the floating box is generally limited to a certain range in practical engineering, the third case, i.e., the limit restraint, is considered. In this case, when the displacement of the floating tank is within the displacement limit, the floating tank can freely sink and float, while when the displacement of the floating tank exceeds the displacement limit, a spring restraint with high rigidity is applied to the floating tank to restrain its movement. For convenience of description, the first type of breakwater is referred to as fixed breakwater, denoted by “S”, and the second type of breakwater is referred to as elastically restrained breakwater, denoted by “LS”, where “LS10”, “LS50” and “LS100” represent three groups of restraint stiffness k = 10 kN/m, 50 kN/m and 100 kN/m, respectively, and the third type of breakwater is referred to as displacement restrained breakwater, denoted by “DC”, where “DC0.5”, “DC1.5” and “DC2.5” represent three groups of displacement limits of ±0.5 m, ±1.5 m and ±2.5 m, respectively. The density of the floating tank is ρf = 500 kg/m3. When the waves are not acting, the floating breakwater is in a semi-submerged state and its center of mass is flush with the hydrostatic water surface.
The basic parameters of the numerical flume are set as follows: the wave flume is 1350 m long, 54 m high and 1 m wide, and the center of the box-girder superstructure is located at x = 800 m (as shown in Figure 5a). The wave-absorbing zone is set in the range of x = 0–200 m after the inlet boundary of the numerical flume, and x = 1000~1350 m before the output boundary. The numerical flume is bounded by inlet and pressure outlet boundaries on its left and right sides, respectively. Its structure surface serves as a wall boundary, while the bottom of the flume acts as a slip boundary. An empty condition is applied to the front–back boundary, whereas an atmospheric boundary condition governs the top of the numerical wave flume. Considering that the box-girder superstructure is submerged, the bottom surface is exactly flush with the water surface, and the bottom of the box-girder superstructure is Z = 30 m from the bottom of the wave flume. The cross-sectional dimensions of the box-girder superstructure are B = 15 m for the width of the deck, D = 2.7 m for the height of the girder, Bg = 7 m for the width of the bottom girder, and Dd = 0.6 m for the thickness of the deck. The distance between the center of the floating breakwater and the leading edge of the box-girder superstructure is Lf, and the width of the floating breakwater is Bf while the height is Hf.
The meshes were generated through the development of structured background meshes, which underwent refinement in the primary computational domain and further refinement near the girder model. A red nested mobile mesh was utilized at the breakwater location to monitor the movement of the floating breakwater. In the main computational domain, a range of mesh sizes were employed to assess mesh sensitivity. Figure 5c illustrates the variation in the maximum horizontal wave forces across different mesh sizes (indicated by total grid count) for a case with wave amplitude Af = 4 m. It is evident that with a total of 6.2 × 10⁶ grids, the numerical computation can be executed precisely and efficiently. After conducting a grid independence test, the optimal mesh size was determined as follows: A horizontal mesh size of 0.4 m was used in the near-inlet boundary zone, while a smaller mesh size of 0.1 m was employed in the main computational domain and an even finer mesh size of 0.03 m was utilized in the near-outlet boundary zone. In addition, vertical spatial distances of 0.4 m were applied to the atmosphere boundary region, whereas air–water interfaces and deeper water regions required more refined spacing, with values of 0.1 m and 0.03 m, respectively.
Considering five groups of wave amplitude Af = 3 m~5 m, the wave reduction performance of three types of floating breakwaters under the action of focused waves with different amplitudes is analyzed, keeping the structural parameters of the breakwater unchanged, the height of the floating breakwater Hf = 4 m, the width of the floating breakwater Bf = 5 m, and the distance between the floating box and the box-girder superstructure Lf = 10 m.
The time histories of wave forces on the box-girder superstructure (only the moment during the maximum focused wave action is given) are shown in Figure 6a–c for the cases with fixed, elastically restrained, and displacement-restricted breakwaters, respectively, where the maximum focused wave amplitude Af = 5 m. For comparison, the time histories of wave forces on the box-girder superstructure without the floating breakwater are also given (represented by “WO”). Comparing the cases with and without breakwaters, the installation of the floating breakwater does not significantly change the time history characteristics of wave forces on the box-girder superstructure, but exhibits the following characteristics:
(1)
There is an obvious phase difference between the peak wave force in the slamming phase and the peak wave force without breakwaters, and this phase difference varies under the influence of different types of breakwaters. For fixed breakwaters, the phase difference is significant. For elastically restrained breakwaters, the phase difference increases with increasing restraint stiffness. For the displacement-restricted breakwater, the phase difference increases with decreasing displacement limit. This is due to the fact that when the displacement amplitude of the floating box is small, the wave surface on the back of the breakwater rises rapidly due to the wave bypassing from below the breakwater, so the wave and the box-girder superstructure act in advance, and the phase difference increases;
(2)
The peak value of the slamming wave force decreases, especially under the influence of the fixed and displacement-restricted breakwater, and for the conditions shown in Figure 6, the maximum decrease can reach 49.0%. This indicates that the presence of fixed and displacement-restricted breakwaters weakens the slamming force on the box-girder superstructure;
(3)
The wave force on the box-girder superstructure in the climbing phase is slightly reduced, and the change curve of the vertical wave force shows a smoother shape, which also indicates that the slamming force component is weakened.
The displacement responses of the elastically constrained and displacement-constrained floating breakwater in Figure 6b,c are shown in Figure 7. As can be seen from the figure, although the elastically constrained floating breakwater has the same or an even larger displacement amplitude comparable to that of the constrained float box (e.g., the positive amplitude of the floating breakwater in the LS10 condition is comparable to that in the DC2.5 condition), its reduction effect on the wave force of the box-girder superstructure is weaker (see Figure 6b), which means that the wave reduction performance of the floating breakwater does not depend only on its floating amplitude, but also on its motion type.
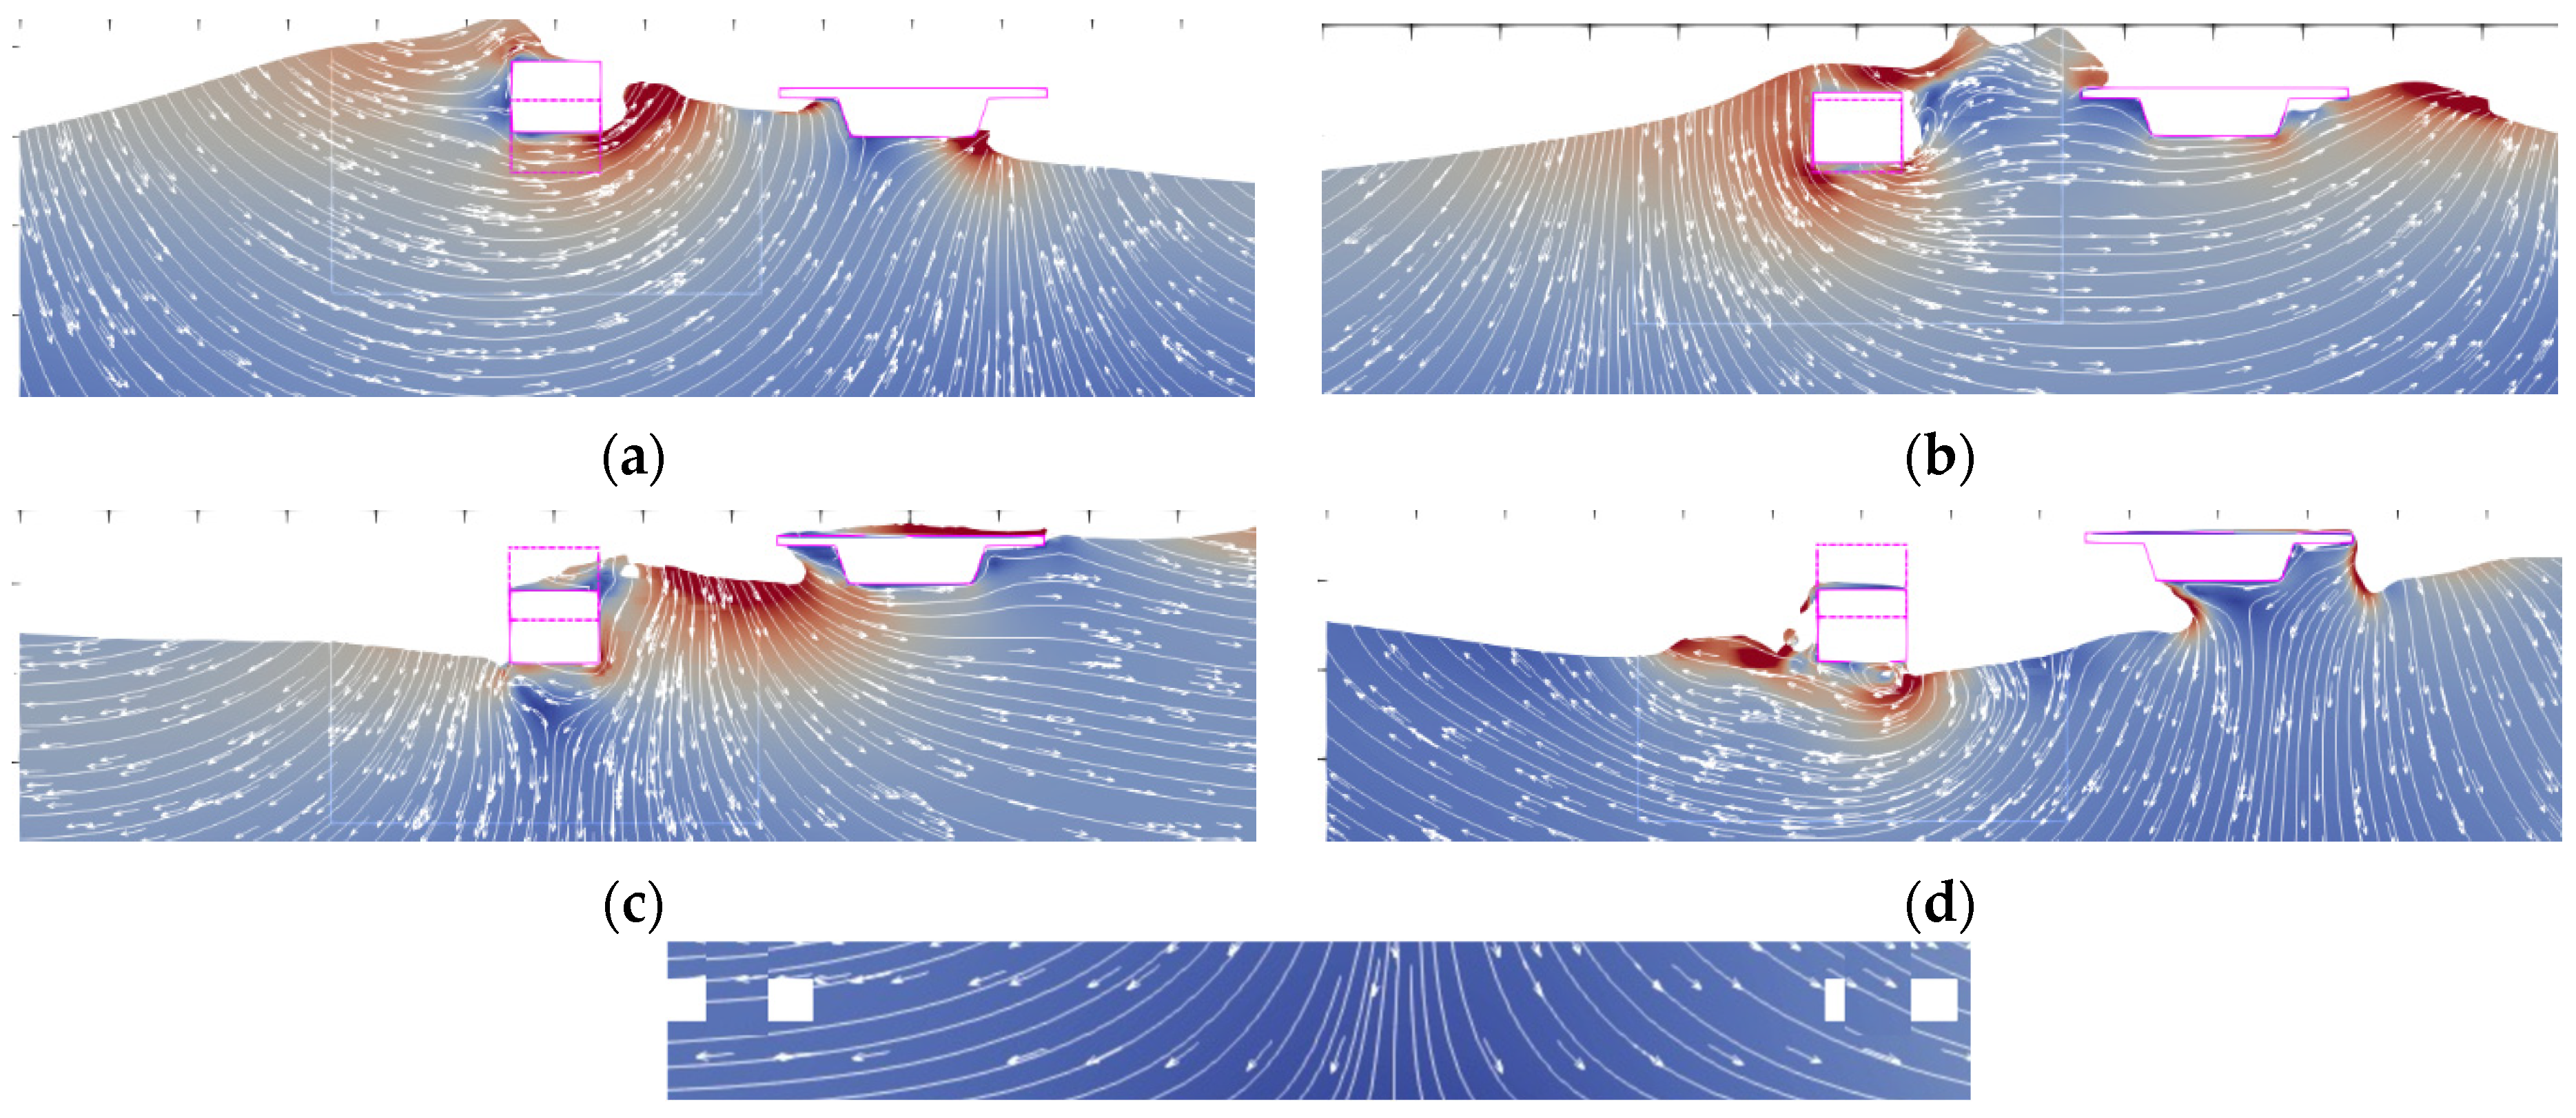
In order to further investigate the influence of breakwater motion characteristics on the wave force of the box-girder superstructure, the flow field diagrams at the characteristic moments after the installation of the fixed breakwater (S), elastic restrained breakwater (LS50), and the displacement-restricted breakwater (DC2.5) are shown in Figure 8, Figure 9 and Figure 10, respectively. Compared to the flow field distribution around the box-girder superstructure without a breakwater, the presence of the floating breakwater significantly changes the flow field distribution on the waveward side of the box-girder superstructure.
For the fixed breakwater, when the wave propagates to the position of the floating breakwater, a part of the wave runs up to the top of the floating breakwater, while a part of the wave forms a bypass flow along the bottom of the floating breakwater. Due to the wave bypass, the wave surface on the waveward side of the box-girder superstructure rises rapidly, and the wave surface submerges the bottom of the box-girder superstructure and the web on the waveward side, while the horizontal and vertical forces reach the maximum (Figure 8b). Compared with the flow field diagram at the same moment without the breakwater, the existence of the breakwater significantly weakens the wave energy between the wave crest and the box-girder superstructure on the wave side, and on the other hand, due to the wave bypass flow, the wave surface between the breakwater and the box-girder superstructure is significantly changed, and the liquid surface under the flange on the wave side is depressed, while the gas under the flange escapes. Under the combined influence of the above two factors, the wave force of the box-girder superstructure during the slamming stage is greatly reduced. As the wave continues to propagate, the wave at the top of the floating breakwater intersects with the wave bypassing below, and the interaction of these two parts of the wave causes the wave energy in the region to increase. Then, the wave hits the top deck of the box-girder superstructure. Compared with the case without wave protection, the wave surface morphology of the wave run-up on the top deck of the box-girder superstructure is significantly different.
The elastically and displacement-restrained breakwaters have similar effects on the flow field around the box-girder superstructure as the fixed breakwater. The presence of the breakwater significantly weakens the wave energy between the wave crest and the waveward side of the box-girder superstructure, and on the other hand, the wave surface between the breakwater and the box-girder superstructure is significantly modified due to wave bypassing and reflection. However, there are also differences between the flow fields due to the different motion characteristics of the breakwater. As in Figure 9a, the elastic restrained breakwater floats up, the water level on the waveward side of the box-girder superstructure increases, and the gas is trapped between the water and the flange on the waveward side, so the reduction effect of the elastic restrained breakwater on the wave force of the box-girder superstructure during the slamming stage is weak. For the displacement-restrained breakwater (e.g., Figure 10a), the floating breakwater floats up to cause a significant increase in the wake bypass fluid energy, while the wake bypass flow line of the floating breakwater is also different from that of the fixed and elastic restrained breakwater. Nevertheless, the wave force is significantly reduced in the slamming stage under the influence of the displacement-restrained breakwater due to the reduction in the wave surface below the flanking edge on the waveward side of the box-girder superstructure. As the floating breakwater gradually sinks to near the initial position, a large amount of gas is trapped at the rear of the displacement-restrained breakwater. As the floating tank continues to sink, the fluid flow and energy distribution around the breakwater are affected by the motion characteristics of the breakwater, showing significant differences, but due to the lowering of the water level, the impact on the flow field around the box-girder superstructure is smaller, so the impact on the wave force on the box-girder superstructure is smaller.
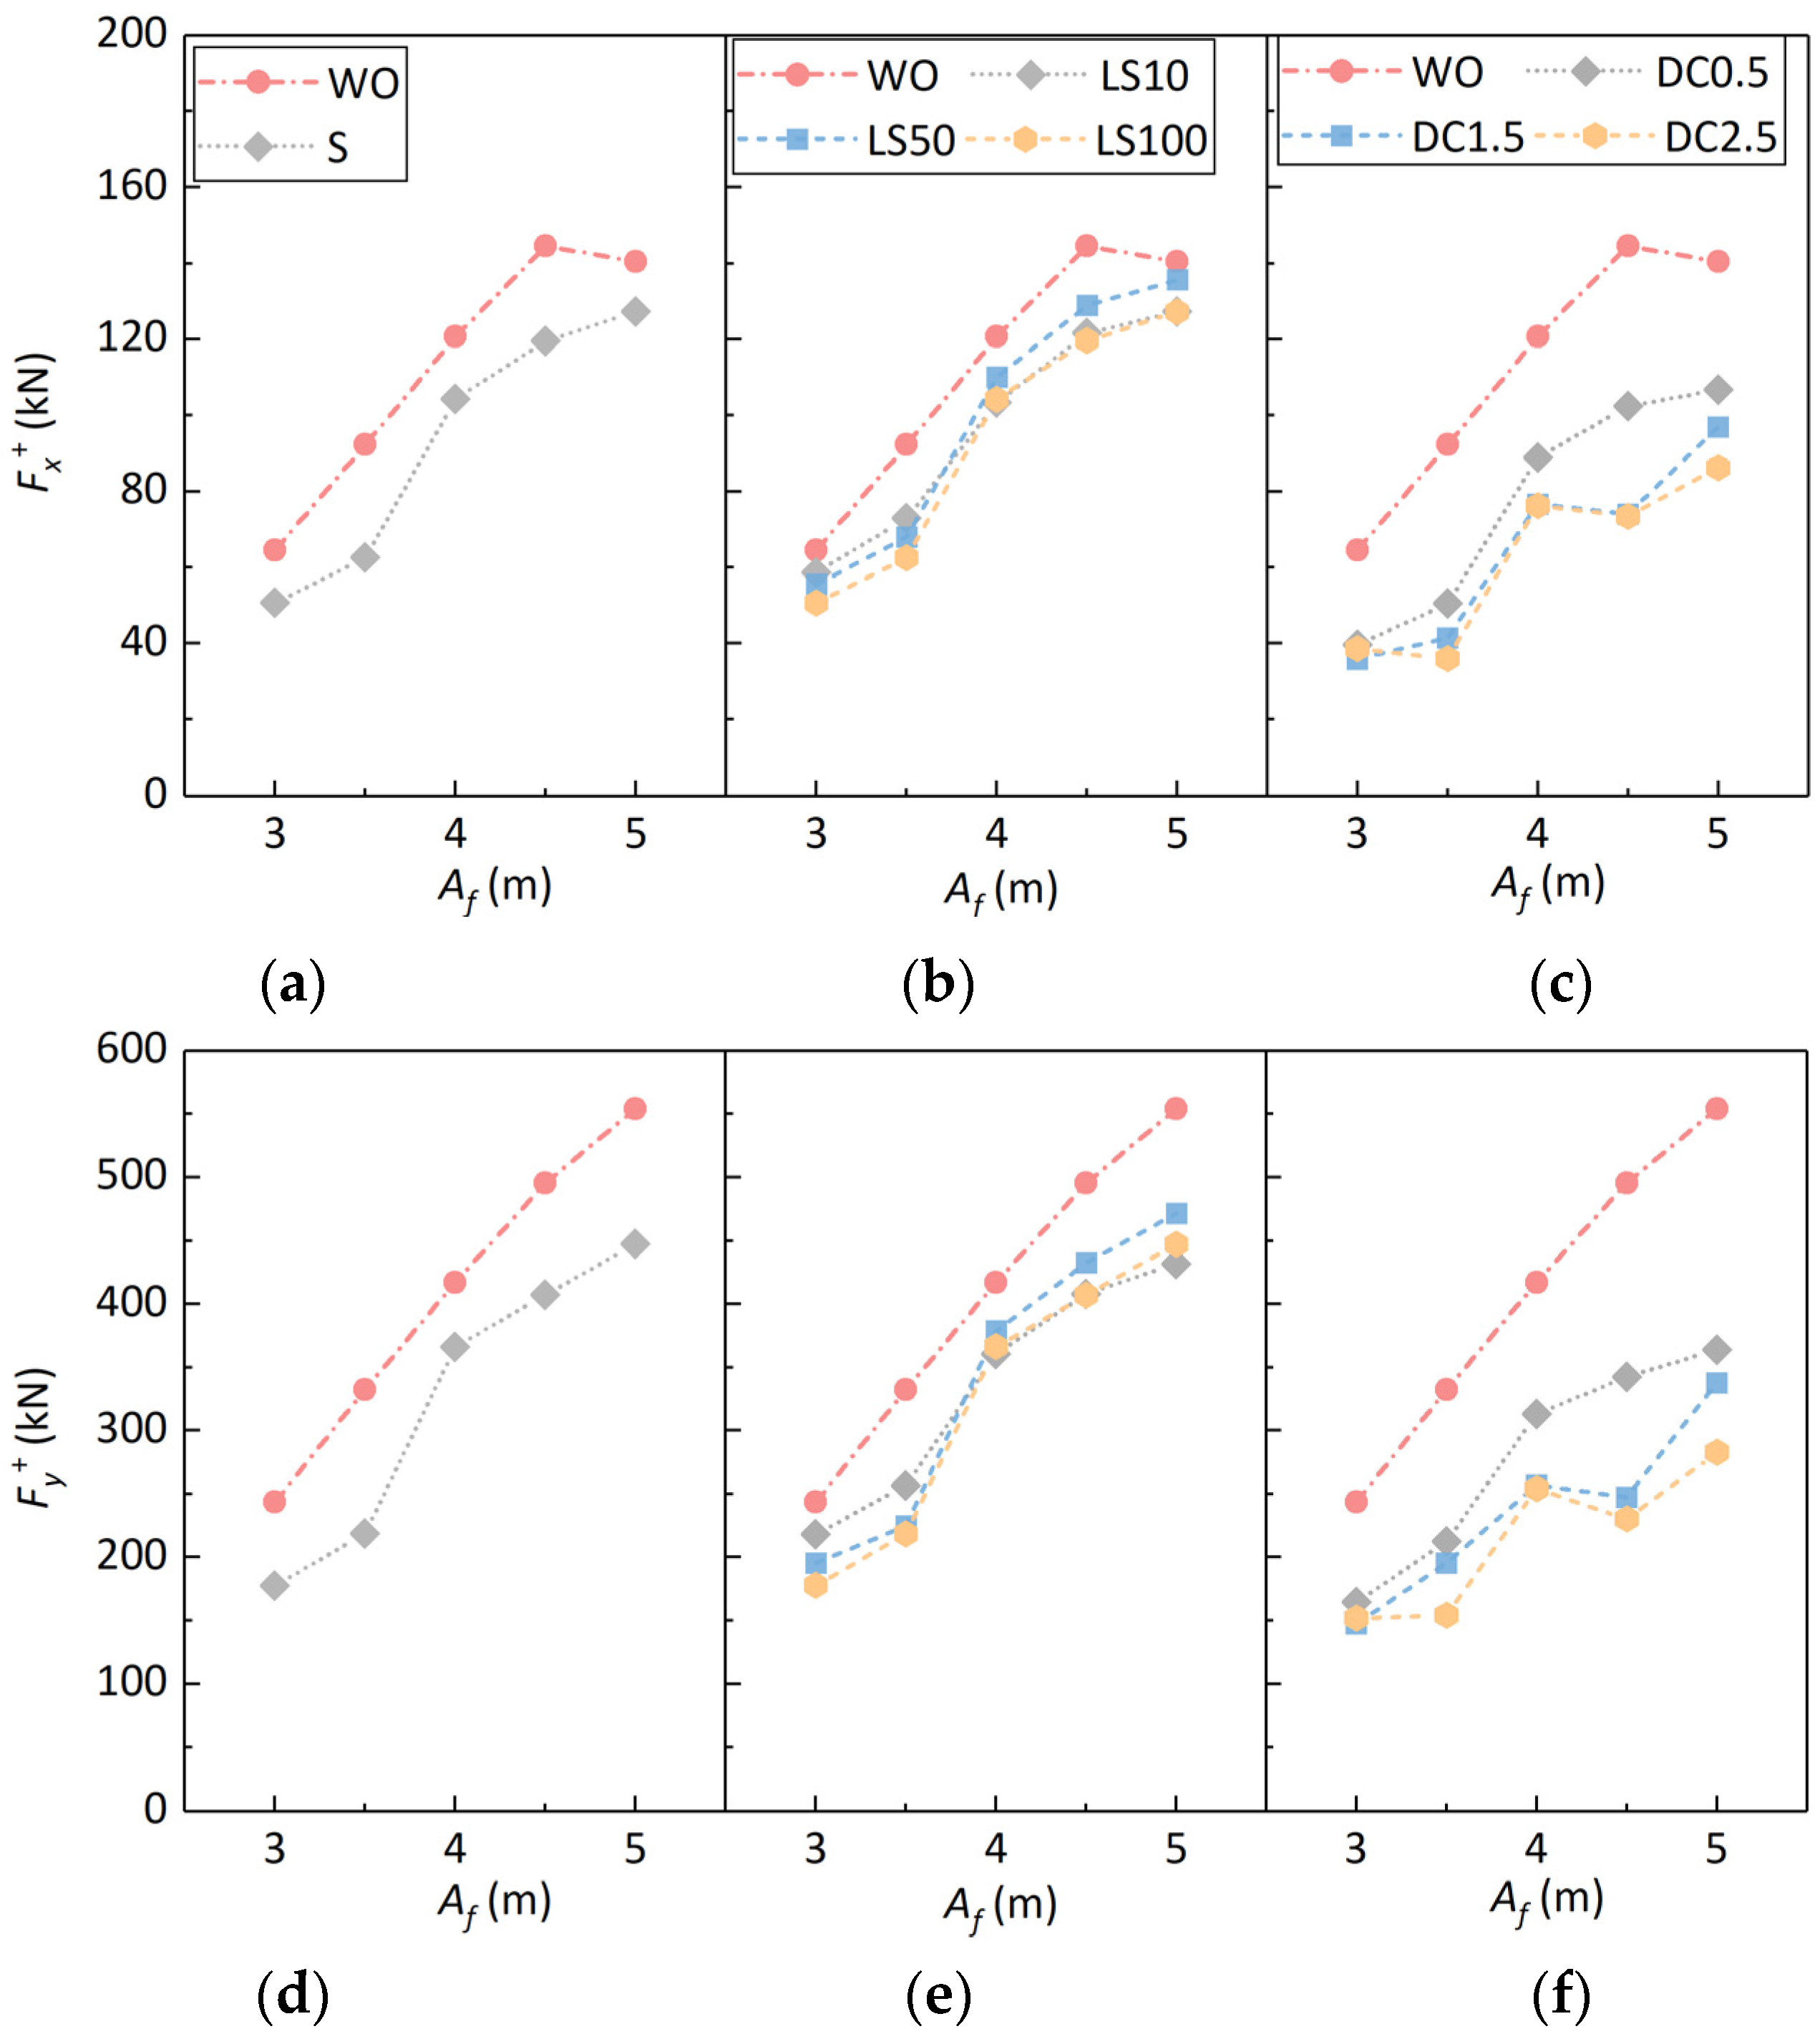
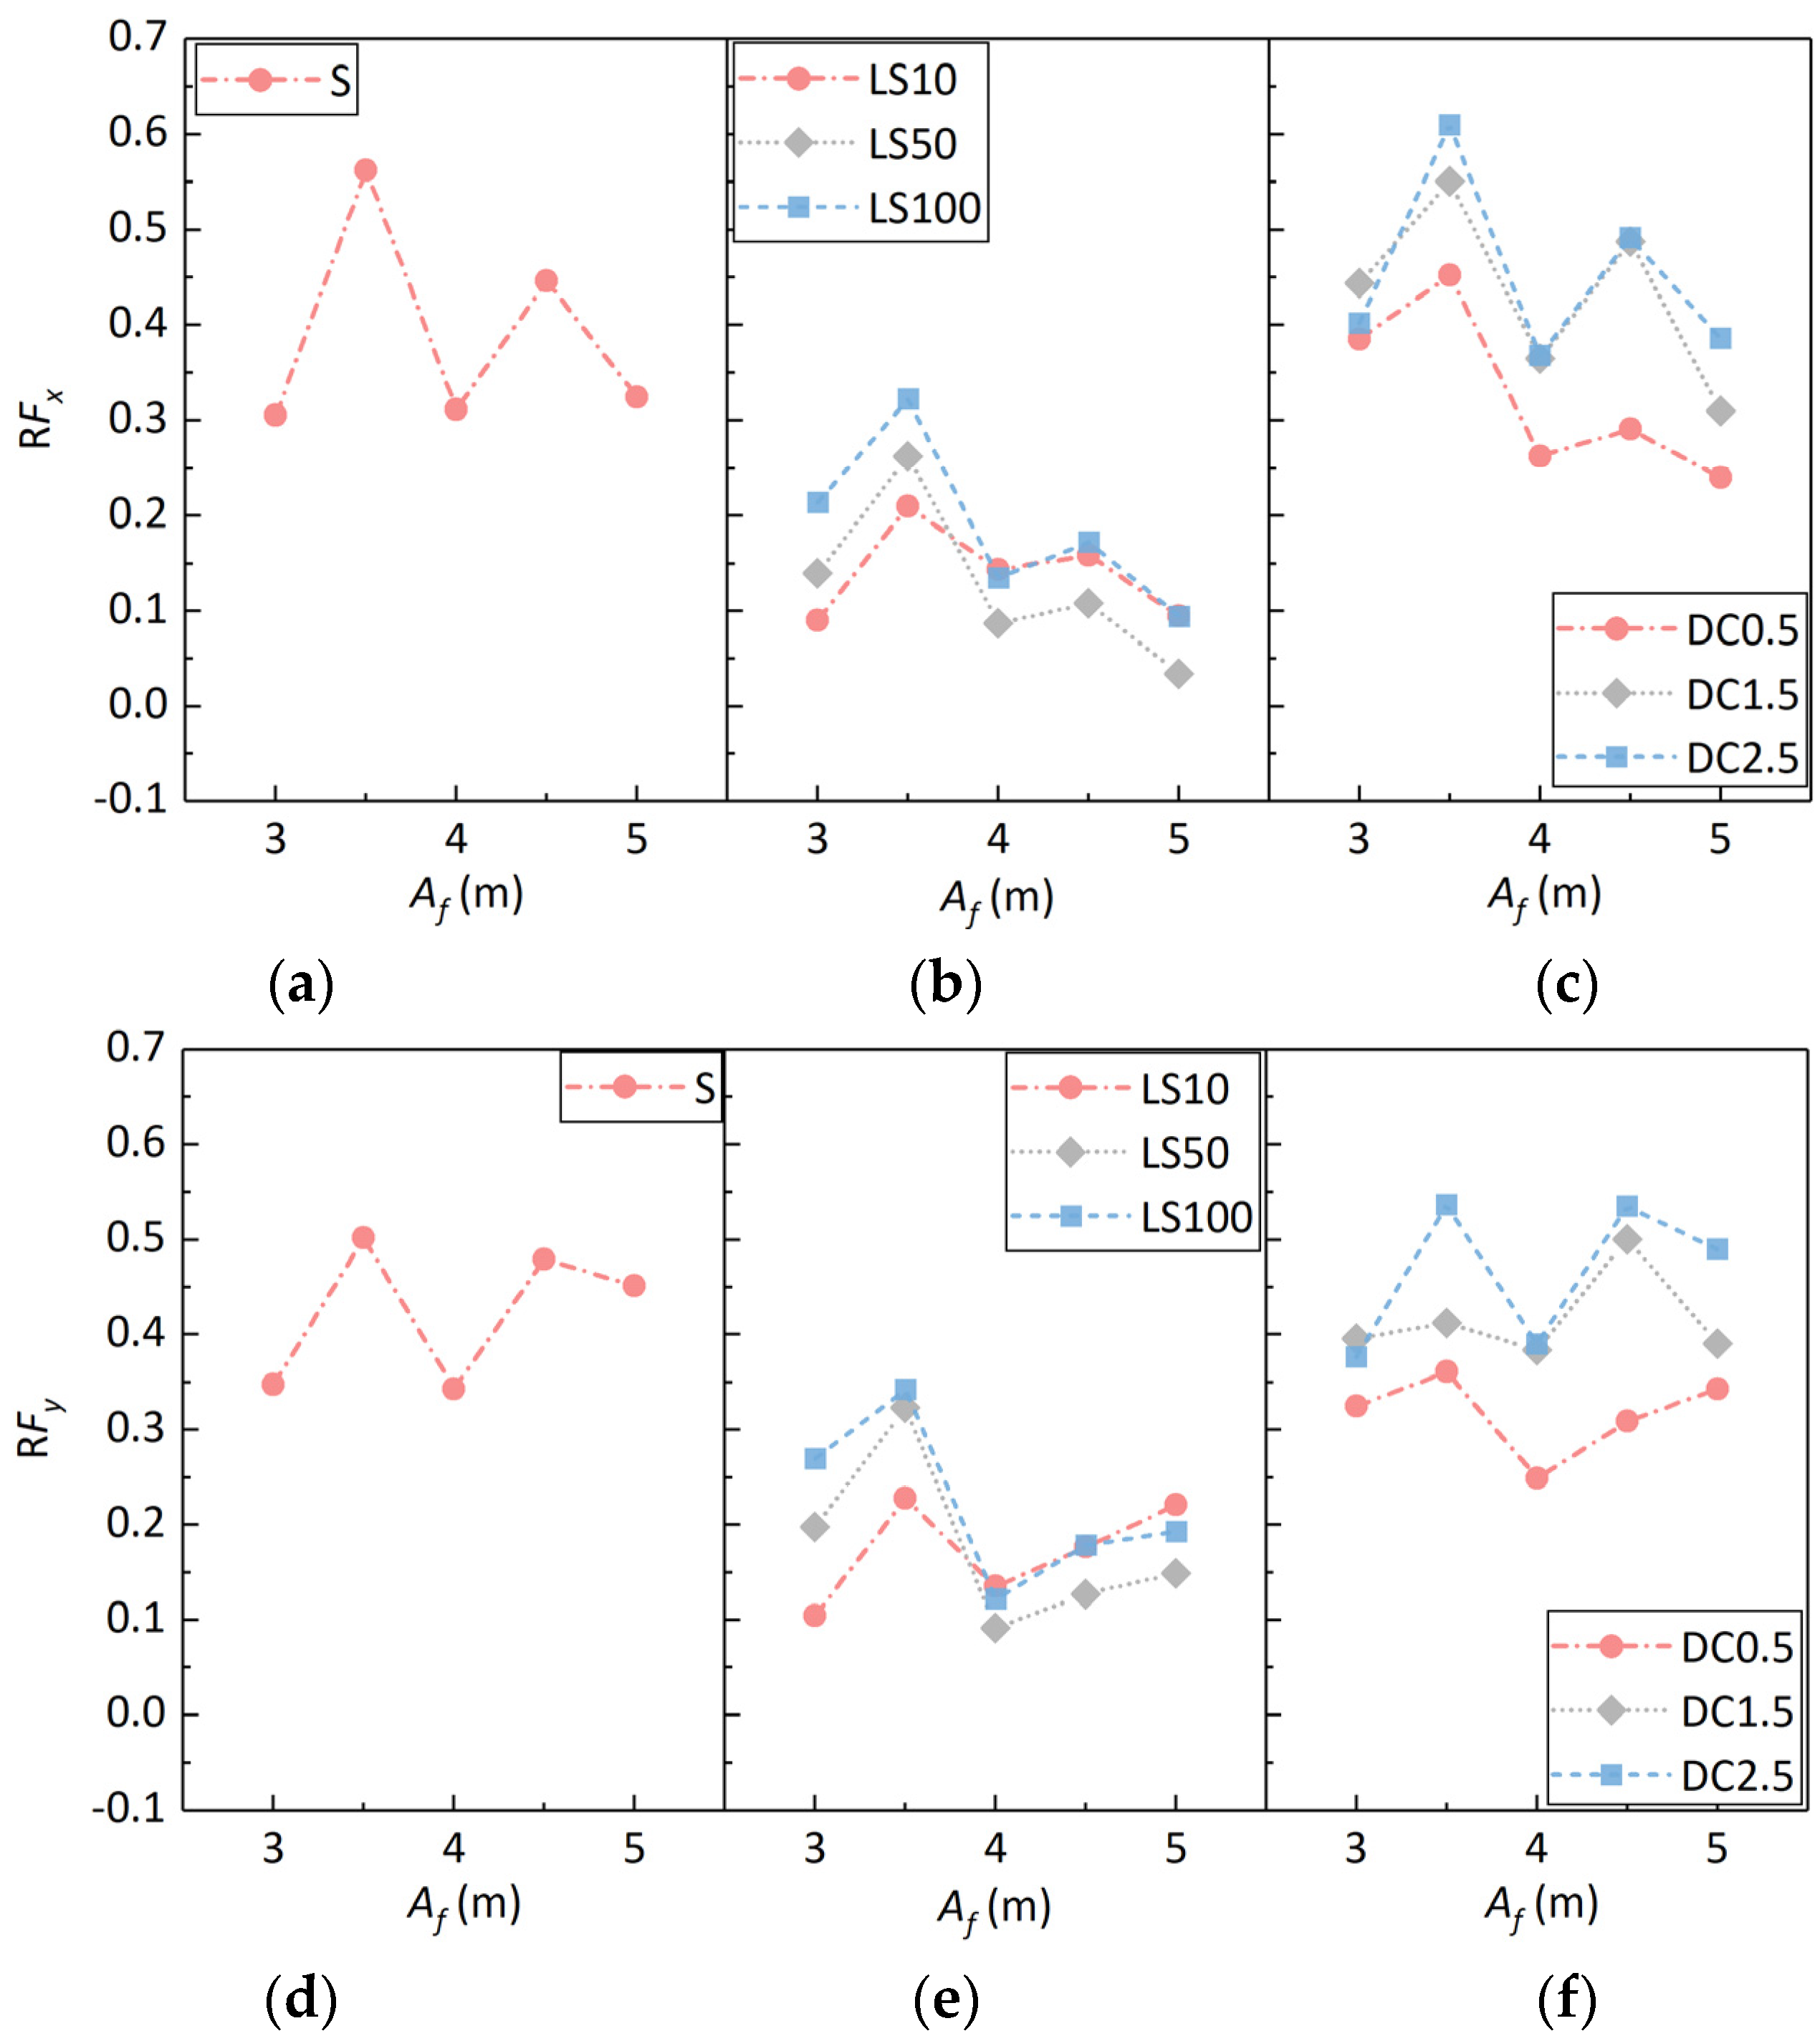
To further analyze the wave reduction effects of various types of breakwaters, a comparison of the maximum horizontal (Fx+) and vertical wave force (Fy+) on the box-girder superstructure with and without the breakwater under different wave amplitudes is given in Figure 11. Additionally, the maximum horizontal (Fx+) and vertical wave force (Fy+) in this study represent the peak values of the time history of wave forces acting on the box-girder superstructure under a specific wave case. Compared with the case without a breakwater, both the maximum horizontal force and the maximum vertical force on the box-girder superstructure are reduced after the breakwater is installed. However, the influence of the breakwater on the wave force of the box-girder superstructure varies for different motion characteristics of the floating breakwater. For this reason, the reduction rates of the maximum horizontal force and maximum vertical force (RFx and RFy) of the box-girder superstructure after installing breakwaters with different wave amplitudes are given in Figure 12a,b, respectively. A very interesting phenomenon is noted here; that is, with the increase in the wave amplitude, the horizontal wave force on the box girder does not increase linearly, but decreases after the wave amplitude reaches 4.5 m (as shown in Figure 11a). The elevated state of the box-girder superstructure may account for this phenomenon. When the wave amplitude falls within a certain range, the majority of waves exert force on the web of the box-girder superstructure, leading to an increase in horizontal wave forces. However, with the continuous increase in waves, an excessive wave amplitude leads to excessive wave run-ups when most of the waves interact with the box-girder superstructure, which consumes the energy of the wave action. On the contrary, the horizontal wave force on the box-girder superstructure is reduced.
The fixed breakwater, elastic restrained breakwater and displacement-restrained breakwater are all beneficial in reducing the maximum horizontal and vertical forces of the main beam, but there is no clear relationship between the reduction rate and the wave amplitude of the focused waves. For the fixed breakwater, the maximum reduction rate of wave force on the box girder superstructure was reached at the wave amplitude Af = 3.5 m. The reduction rates of horizontal force and vertical force reached 56.2% and 50.2%, respectively.
For the elastic restrained breakwater, the reduction rate reached its maximum at wave amplitude Af = 3.5 m. In addition, the restraint stiffness of the floating box also affected the reduction rate. For wave amplitude Af < 4 m, the larger the confinement stiffness, the larger the reduction rate, while for Af ≥ 4 m, the reduction rate of the wave force is similar for stiffness values of k = 10 kN/m and k = 100 kN/m, while the reduction rate of the wave force applied to the box-girder superstructure is small for k = 50 kN/m (e.g., Af = 5 m, RFx = 3.3%), which has almost no effect on the wave force on the box-girder superstructure.
Similar to the effects of fixed and elastic restrained breakwaters, the reduction rate of the horizontal force RFx also reached the maximum at Af = 3.5 m after the installation of the displacement restrained breakwater, and the maximum reduction rate reached 61.0%, which is better than that of the fixed breakwater. The reduction rate of the vertical force was affected by the displacement limit, and the reduction rate of the vertical force showed different trends with changes in wave amplitude for different displacement limits. For cases DC0.5 and DC2.5, the reduction rate of the vertical force reaches its maximum at Af = 3.5 m with RFy = 36.1% and 53.6%, respectively, while for DC1.5, the reduction rate of the vertical force reaches the maximum at Af = 3.5 m with RFy = 50.1%. When comparing the cases with different displacement limits, it can be found that the effect of displacement limits is smaller when the wave amplitude is small (Af = 3.0 m), and when the wave amplitude is larger than 3.0 m, the reduction effect of wave force is weaker for the case DC0.5, while the reduction effect of wave force is better for the cases of DC1.5 and DC2.5, and the larger the displacement limit is, the more obvious the reduction effect of wave force is at Af = 5.0 m. It can be observed that the weakening of wave force on the box-girder superstructure induced by the floating breakwater is not directly proportional to the amplitudes of waves. Generally, the most effective reduction in force is achieved when wave amplitudes are around 3.5 m. As the wave amplitude continues to increase, the interaction between the waves passing over the floating breakwater and the waves between the floating breakwater and the box-girder superstructure may lead to an increase in the speed of the water particles acting on the box-girder superstructure, thereby augmenting the wave forces exerted on the box-girder superstructure.
In the test region of this study, the reduction rate of horizontal force for fixed breakwaters reached 30.5~56.2%, and the reduction rate of vertical force reached 34.3~50.2%. The reduction rate of horizontal force for elastic restrained breakwaters ranged from 3.3% to approximately 32.2%, and the reduction rate of vertical force ranged from 9.1% to about 34.2%. The reduction rate of horizontal force for displacement-restricted breakwaters reached 24.0~61.0% and the reduction rate of vertical force was 24.9~53.6%. In general, the wave reduction performances of the displacement-restricted breakwater and the fixed breakwater were better, and the displacement-restricted breakwater with a displacement limit of 2.5 m had the best effect, being able to significantly reduce the horizontal and vertical forces on the box-girder superstructure.

4.2. Prediction Model

The number of samples used in the prediction model was 119. The maximum wave amplitude in the samples ranged from Af = 3 m to 5 m, the breakwater width ranged from B = 5 m to 25 m, the breakwater height ranged from H = 2 m to 10 m, the constrained stiffness ranged from k = 0 kN/m to 106 kN/m, et al. The range values of the relevant parameter are shown in Table 1. The model used 10-fold cross-validation to divide the sample dataset into 10 subsets. The model was trained and tested using 10 training sets/test sets, and the average of the 10 test errors was returned as the basis for the model evaluation. It is worth noting that out of the 10 datasets, 7 were designated as training sets, while the remaining 3 served as test sets.
Since the breakwater constraint in the test includes three types of motion—fixed, elastic constraint, and displacement constraint—the constraint stiffness (k) and displacement constraint (S) are included in the input parameters of the BP model to distinguish the different types of motion. The BP neural network model outputs the maximum horizontal and vertical forces, with input parameters including the maximum wave amplitude Af, breakwater width B, breakwater height H, breakwater spacing L, constraint stiffness k, and constraint displacement S.
There are many parameters involved in the BP neural network structure (such as batch size, learning rate, optimizer, activation function, number of structural layers, and number of neurons in the hidden layer), and the number of structural layers is two due to the selection of double hidden layers for this prediction. Different parameter configurations will have different training effects, so it is necessary to debug and compare and filter the parameters in the model in order to finally find a better solution through parameter tuning.
The optimization strategies used in the parameter debugging of the constructed horizontal and vertical force prediction model are as follows: (1) Based on the model network structure, the candidate values of the hyperparameters are given, and the candidate parameters used in this model are shown in Table 2. (2) The initial values of each hyperparameter are set as follows—the batch size is 30, the training period is 1000, the learning rate is 0.02, the activation function is relu, a double hidden layer network is used, and the number of neurons in both hidden layer 1 and hidden layer 2 is set to 40. (3) The parameters are optimized and updated in order according to the parameter order given in Table 2. When one parameter is optimized, the other parameters are fixed (where the other parameters are updated to the optimization result if they have been optimized and debugged, and the initial values are used if they have not been optimized and debugged). Then the current parameter candidates are traversed, the learning model is trained, and the better value of the current parameter is determined by model selection. The current parameter optimization results are taken into account in the optimization process of the next parameter until the optimization of all parameters in Table 2 is completed. (4) The parameter optimization is performed for several rounds by repeating step 3 to obtain a better parameter configuration. The model constructed in this section performs three rounds of hyperparameter optimization.
Taking the optimization process of each parameter in the first round as an example, the BP neural network is based on the gradient descent update strategy, and the batch size indicates the number of samples supplied to the program for training at each step. In this study, the small batch gradient method is used to determine alternative batch size candidates based on the number of training samples: 10, 20, 30, 40, 80, and 200. In the batch size selection, the other parameters are fixed and the initial values are used. The RMSEs of horizontal and vertical forces at different batch sizes and the Goodness of Fit R2 values are shown in Figure 13, which shows that as the batch size increases, the RMSEs of horizontal and vertical forces show first a decreasing and then an increasing trend, reaching the minimum value at the batch size of 40. The R2 values of horizontal force and vertical force are 0.83017 and 0.84240, respectively, under the current parameter configuration, and the hyperparameters of horizontal force and vertical force are updated to continue the hyperparameter optimization.
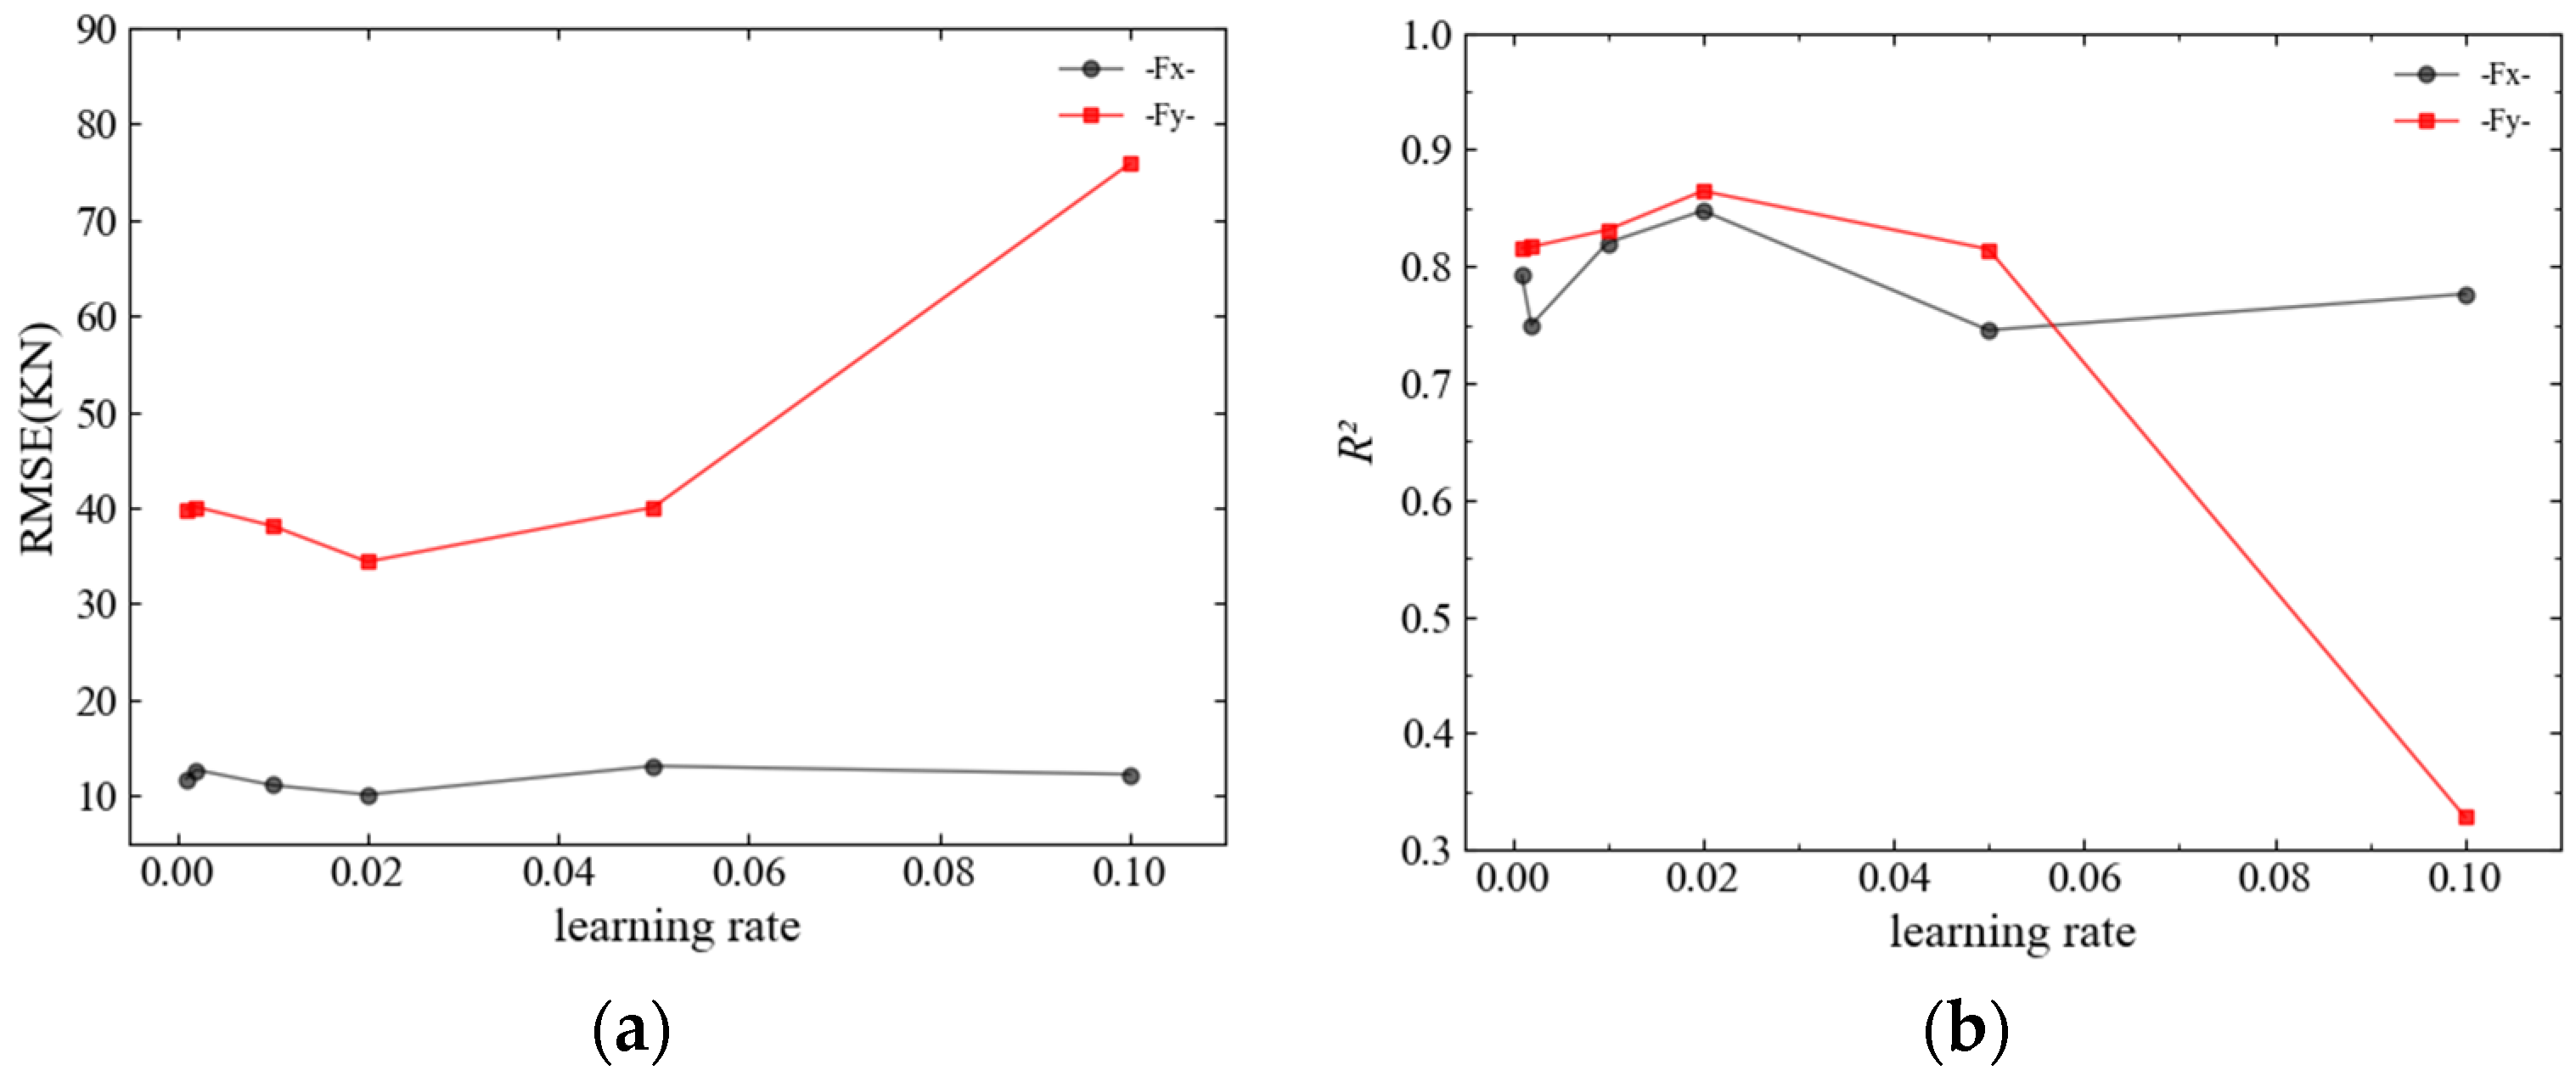
The BP neural network updates parameters based on the gradient descent method by setting the learning rate to control the size of the network weights updated at each iteration. The learning rate is between 0 and 1. A smaller learning rate can make the network converge more stably and accurately, but it will reduce the training speed; a larger learning rate can speed up the training speed of the network, but it may lead to unstable training or failure to converge. Therefore, it is necessary to choose the appropriate learning rate for neural network learning. The study takes the same value of learning rate for each layer of the network weight threshold update, and chooses the candidate values of 0.001, 0.002, 0.01, 0.02, 0.05 and 0.1 for learning rate debugging.
The RMSE and R2 values of the horizontal and vertical wave forces at different learning rates are shown in Figure 14. As can be seen from the figure, when the learning rate increases from 0.001 to 0.02, the RMSE for maximum vertical forces gradually decreases with the increasing learning rate. The horizontal force RMSE changes very little, and the minimum value is obtained when the learning rate is 0.02. When the learning rate is set as 0.02, the R2 of the horizontal force and the vertical force are 0.84749 and 0.86444, respectively.
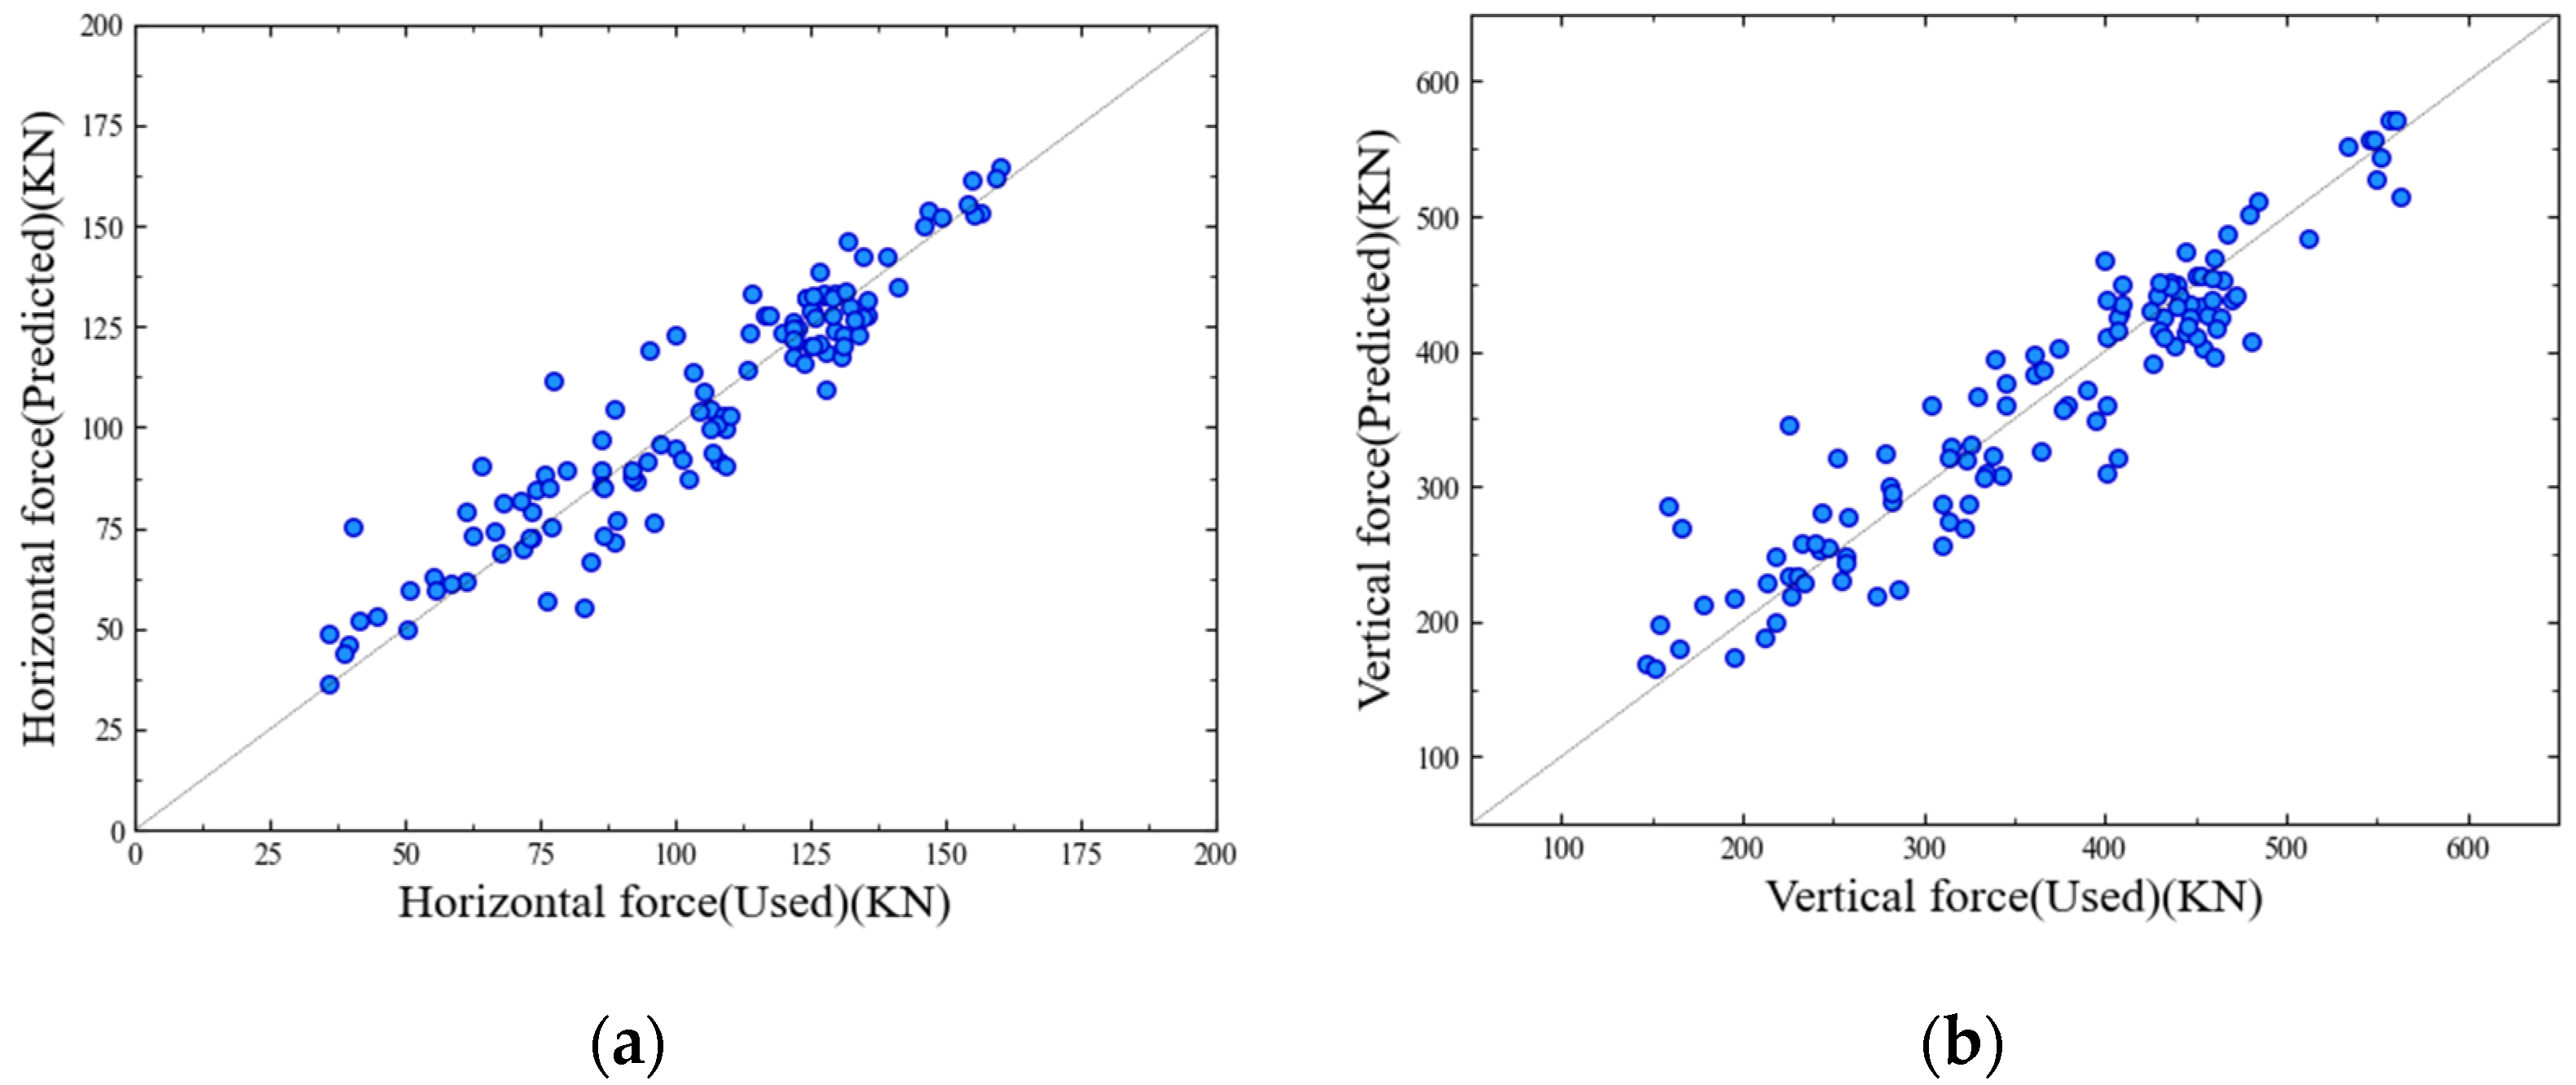
The same method is used to determine the optimal values of parameters such as training time, activation function, and number of hidden neurons in the first and second layers. The second and third rounds of hyperparameter optimization are repeated, and finally the optimal configuration of hyperparameters for the horizontal force prediction model is determined to be batch size 40, training period 800, learning rate 0.02, activation function relu, number of neurons in both the first and second hidden layers 40, and final R2 0.8474; the configuration of hyperparameters for the vertical force prediction model is set as batch size 40, training period 1400, learning rate 0.02, activation function relu, number of neurons in both the first and second hidden layers 40, and final R2 0.8644. The comparison between the prediction results and the actual numerical simulation results is given in Figure 15. The prediction model constructed by the BP neural network in this study agrees well with the numerical calculation results, with high accuracy.

5. Conclusions

The conclusions obtained in this paper are as follows:
  • The numerical model established in this study can simulate the wave–structure coupling action and accurately calculate the dynamic response of the floating structure;
  • The reduction rate of wave forces for fixed breakwaters can reach more than 30%, which indicates that a floating breakwater has a significant effect in reducing the wave forces on the box-girder superstructure;
  • The wave reduction performances of the displacement-restricted breakwater and the fixed breakwater are better than that of the elastic restricted breakwater;
  • The prediction model proposed based on the BP neural network is accurate in estimating the maximum wave forces on the box-girder superstructure with the influence of the floating breakwater. However, it should be noted that this study did not take into account the non-dimensionalization of training data, and the existing neural network prediction model is limited to the parameter range examined in this study. The accuracy and applicability of the model will be further expanded in future research.

Author Contributions

Writing—original draft preparation, data curation, S.W.; visualization, S.L.; conceptualization, writing—review and editing, C.X. and B.H.; supervision, M.L. and Z.Y. All authors have read and agreed to the published version of the manuscript.

Funding

The authors are grateful for the support in this research given by the National Natural Science Foundation of China (52008065), the Postdoctoral Research Foundation of China (2020M683229), the General Project of Chongqing Natural Science Foundation (cstc2021jcyj-msxm2491, cstc2021jcyj-msxmX1082), the Chongqing Municipal Education Commission Science and Technology Research Project (KJCXZD2020032, KJQN202000706), the Venture and Innovation Support Program for Chongqing Overseas Returnees (cx2020104), Chongqing Technology Innovation and Application Development Project (CSTB2022TIAD-KPX0205), the Fund of National Engineering Laboratory for Highway Tunnel Construction Technology (NELHTCT202102), and the Special Funding Project for Chongqing Postdoctoral Research.

Institutional Review Board Statement

Not applicable.

Informed Consent Statement

Not applicable.

Data Availability Statement

The reader can ask for all the related data from the corresponding author ([email protected]; [email protected]).

Conflicts of Interest

The authors declare no conflict of interest.

References

  1. Yeh, H.; Francis, M.; Prterson, C.; Katada, T.; Latha, G.; Chadha, R.K.; Singh, J.P.; Raghuraman, G. Effects of the 2004 great Sumatra tsunami: Southeast Indian coast. J. Waterw. Port Coast. Ocean Eng. 2007, 133, 382–400. [Google Scholar] [CrossRef]
  2. Luo, W.; Huang, B.; Tang, Y.; Ding, H.; Li, K.; Cheng, L.; Ren, Q. Numerical simulation of dynamic response of submerged floating tunnel under regular wave conditions. Shock Vib. 2022, 2022, 4940091. [Google Scholar] [CrossRef]
  3. Xu, G.; Cai, C.S. Numerical simulations of lateral restraining stiffness effect on bridge deck–wave interaction under solitary waves. Eng. Struct. 2015, 101, 337–351. [Google Scholar] [CrossRef]
  4. Istrati, D.; Hasanpour, A.; Buckle, I.G. Numerical Investigation of Tsunami-Borne Debris Damming Loads on a Coastal Bridge. In Proceedings of the 17th World Conference on Earthquake Engineering, Sendai, Japan, 27 September–2 October 2021. [Google Scholar]
  5. Xu, G.; Cai, C.S. Numerical investigation of the lateral restraining stiffness effect on the bridge deck-wave interaction under Stokes waves. Eng. Struct. 2017, 130, 112–123. [Google Scholar] [CrossRef] [Green Version]
  6. Huang, B.; Zhu, B.; Cui, S.; Duan, L.; Zhang, J. Experimental and numerical modelling of wave forces on coastal bridge superstructures with box girders, Part I: Regular waves. Ocean Eng. 2018, 149, 53–77. [Google Scholar] [CrossRef]
  7. Hayatdavoodi, M.; Ertekin, R.C. Wave forces on a submerged horizontal plate. Part II: Solitary and cnoidal waves. J. Fluids Struct. 2015, 54, 580–596. [Google Scholar] [CrossRef]
  8. Xu, G.; Cai, C.S.; Chen, Q. Countermeasure of air venting holes in the bridge deck–wave interaction under solitary waves. J. Perform. Constr. Facil. 2016, 31, 04016071. [Google Scholar] [CrossRef]
  9. Huang, B.; Zhu, B.; Cui, S.; Duan, L.; Cai, Z. Influence of current velocity on wave-current forces on coastal bridge decks with box girders. J. Bridge Eng. 2018, 23, 04018092. [Google Scholar] [CrossRef]
  10. Douglass, S.L.; Krolak, J. Highways in the Coastal Environment; Publication No FHWA-NHI-07-096; Office of Bridge Technology Federal Highway Administration: Washington, DC, USA, 2008.
  11. Robertson, I.N.; Riggs, H.R.; Yim, S.C.; Young, Y.L. Lessons from Hurricane Katrina Storm Surge on Bridges and Buildings. J. Waterw. Port Coast. Ocean. Eng. 2007, 133, 463–483. [Google Scholar] [CrossRef]
  12. Padgett, J.; DesRoches, R.; Nielson, B.; Yashinsky, M.; Kwon, O.-S.; Burdette, N.; Tavera, E. Bridge Damage and Repair Costs from Hurricane Katrina. J. Bridge Eng. 2008, 13, 6–14. [Google Scholar] [CrossRef] [Green Version]
  13. Guo, A.; Fang, Q.; Bai, X.; Li, H. Hydrodynamic Experiment of the Wave Force Acting on the Superstructures of Coastal Bridges. J. Bridge Eng. 2015, 20, 04015012. [Google Scholar] [CrossRef]
  14. Fang, Q.; Hong, R.; Guo, A.; Li, H. Experimental investigation of wave forces on coastal bridge decks subjected to oblique wave attack. J. Bridge Eng. 2019, 24, 04019011. [Google Scholar] [CrossRef]
  15. Istrati, D.; Buckle, I.G. Role of trapped air on the tsunami-induced transient loads and response of coastal bridges. Geosci. J. Spec. 2019, 9, 191. [Google Scholar] [CrossRef] [Green Version]
  16. Istrati, D.; Buckle, I.G.; Lomonaco, P.; Yim, S.; Itani, A. Large-scale experiments of tsunami impact forces on bridges: The role of fluid-structure interaction and airventing. In Proceedings of the 26th International Ocean and Polar Engineering Conference, Rhodes, Greece, 21–26 June 2016. [Google Scholar]
  17. Qu, K.; Sun, W.Y.; Ren, X.Y.; Kraatz, S.; Jiang, C.B. Numerical Investigation on the Hydrodynamic Characteristics of Coastal Bridge Decks under the Impact of Extreme Waves. J. Coast. Res. 2020, 37, 442–455. [Google Scholar] [CrossRef]
  18. Huang, B.; Duan, L.; Yang, Z.; Zhang, J.; Kang, A.; Zhu, B. Tsunami forces on a coastal bridge deck with a box girder. J. Bridge Eng. 2019, 24, 04019091. [Google Scholar] [CrossRef]
  19. Huang, B.; Yang, Z.; Zhu, B.; Zhang, J.; Kang, A.; Pan, L. Vulnerability assessment of coastal bridge superstructure with box girder under solitary wave forces through experimental study. Ocean Eng. 2019, 189, 106337. [Google Scholar] [CrossRef]
  20. Huang, B.; Ren, Q.; Cui, X.; Zhang, J.; Zhu, B. Study of wave forces acting on the box-girder superstructure of coastal bridges in the submerged condition based on potential flow theory. Adv. Bridge Eng. 2020, 1, 16. [Google Scholar] [CrossRef]
  21. Huang, B.; Luo, W.; Ren, Q.; Cui, X.; Zhang, J.; Zhu, B. Random wave forces on the submerged box-girder superstructure of coastal bridges based on potential flow theory. Ocean Eng. 2022, 248, 110739. [Google Scholar] [CrossRef]
  22. Yang, Z.; Huang, B.; Zhu, B.; Zhang, J.; Kang, A. Comparative study of tsunami-like wave-induced forces on medium-scale models of box girder and T-girder bridges. J. Bridge Eng. 2021, 262, 04020125. [Google Scholar] [CrossRef]
  23. Ning, D.; Zhao, X.; Goteman, M.; Kang, H. Hydrodynamic performance of a pilerestrained WEC-type floating breakwater: An experimental study. Renew. Energy 2016, 95, 531–541. [Google Scholar] [CrossRef]
  24. Xue, S.; Xie, W.; Xu, G.; Han, Y.; Wang, J. A novel combined countermeasure of fairing-openings for mitigating extreme wave forces on typical coastal low-lying bridges. Ocean Eng. 2022, 257, 111717. [Google Scholar] [CrossRef]
  25. Qu, K.; Sun, W.Y.; Kraatz, S.; Deng, B.; Jiang, C.B. Effects of floating breakwater on hydrodynamic load of low-lying bridge deck under impact of cnoidal wave. Ocean Eng. 2020, 203, 107217. [Google Scholar] [CrossRef]
  26. Huang, B.; Hou, J.; Yang, Z.; Zhou, J.; Ren, Q.; Zhu, B. Influences of the pile-restrained floating breakwater on extreme wave forces of coastal bridge with box-girder superstructure under the action of two-dimensional focused waves. Appl. Ocean. Res. 2023, 134, 103508. [Google Scholar] [CrossRef]
  27. Istrati, D.; Buckle, I.; Lomonaco, P.; Yim, S. Deciphering the tsunami wave impact and associated connection forces in open-girder coastal bridges. J. Mar. Sci. Eng. 2018, 6, 148. [Google Scholar] [CrossRef] [Green Version]
  28. Chen, X.; Zhan, J.; Chen, Q.; Cox, D. Numerical modeling of wave forces on movable bridge decks. J. Bridge Eng. 2016, 21, 04016055. [Google Scholar] [CrossRef]
  29. Zhao, X.; Hu, C. Numerical and experimental study on a 2-D floating body under extreme wave conditions. Appl. Ocean. Res. 2012, 35, 1–13. [Google Scholar] [CrossRef]
  30. Jin, W.; Zhao, J.L.; Luo, S.W.; Zhen, H. The improvements of BP neural network learning algorithm. In Proceedings of the 5th International Conference on Signal Processing, Beijing, China, 21–25 August 2000. [Google Scholar]
  31. Zhi, X.; Ye, S.J.; Zhong, B.; Sun, C.X. Bp neural network with rough set for short term load forecasting. Expert Syst. Appl. Int. J. 2009, 36, 273–279. [Google Scholar]
  32. Zhang, Y.; Wu, L. Stock market prediction of s&p 500 via combination of improved bco approach and bp neural network. Expert Syst. Appl. 2009, 36, 8849–8854. [Google Scholar]
Figure 1. Comparison of wave surface (η) between the numerical simulation and theoretical results.
Jmse 11 01326 g001
Figure 2. Comparison of wave spectra between the numerical simulation and theoretical results.
Jmse 11 01326 g002
Figure 3. Comparison of the vertical displacement (Dy) and torsion angle (θ) between the numerical simulation (red line) and experimental data (black line).
Jmse 11 01326 g003
Figure 4. Diagrams for overfitting, underfitting and fit cases.
Jmse 11 01326 g004
Figure 5. Arrangement diagram and grid settings of the numerical wave flume. (a) Model size and layout (unit: m); (b) grid mesh adapted in this paper; (c) grid independence test.
Jmse 11 01326 g005
Figure 6. Effect of floating breakwaters on the characteristics of the time history of wave forces on the box-girder superstructure. (a) Fixed breakwater; (b) elastically restrained breakwater; (c) displacement–constrained breakwater.
Jmse 11 01326 g006
Figure 7. Time histories of the displacement responses of the elastically constrained and displacement-constrained floating breakwater. (a) Elastically restrained breakwater; (b) displacement–constrained breakwater.
Jmse 11 01326 g007
Figure 8. Flow field diagram of wave–structure interaction after the installation of fixed breakwater (S). (a) Waves acting on the breakwater; (b) wave runups on the breakwater; (c) waves acting on the superstructure; (d) wave runups on the superstructure.
Jmse 11 01326 g008
Figure 9. Flow field diagram of wave–structure interaction after the installation of elastic restrained breakwater (LS50). (a) Waves acting on the breakwater; (b) wave runups on the breakwater; (c) waves acting on the superstructure; (d) wave runups on the superstructure.
Jmse 11 01326 g009
Figure 10. Flow field diagram of wave–structure interaction after the installation of a displacement-restricted breakwater (DC2.5). (a) Waves acting on the breakwater; (b) wave runups on the breakwater; (c) waves acting on the superstructure; (d) wave runups on the superstructure.
Jmse 11 01326 g010
Figure 11. Comparison of the maximum horizontal (Fx+) and vertical wave force (Fy+) on the box-girder superstructure with and without the breakwater under different wave amplitudes. (a) Fixed breakwater for the horizontal force; (b) elastically restrained breakwater for the horizontal force; (c) displacement−constrained breakwater for the horizontal force; (d) Fixed breakwater for the vertical force; (e) elastically restrained breakwater for the vertical force; (f) displacement−constrained breakwater for the vertical force.
Jmse 11 01326 g011
Figure 12. Reduction rates of the maximum horizontal force and maximum vertical force (RFx and RFy) of the box−girder superstructure after installing breakwaters with different wave amplitudes. (a) Fixed breakwater for the horizontal force; (b) elastically restrained breakwater for the horizontal force; (c) displacement−constrained breakwater for the horizontal force; (d) Fixed breakwater for the vertical force; (e) elastically restrained breakwater for the vertical force; (f) displacement−constrained breakwater for the vertical force.
Jmse 11 01326 g012
Figure 13. RMSE (a) and R2 (b) for predicting horizontal and vertical forces with different batch sizes.
Jmse 11 01326 g013
Figure 14. RMSE (a) and R2 (b) for predicting horizontal and vertical forces under different learning rates.
Jmse 11 01326 g014
Figure 15. Comparison between the prediction results and the actual numerical simulation results. (a) Horizontal force; (b) vertical force.
Jmse 11 01326 g015
Table 1. The range values of the relevant parameter for the wave force prediction model.
ParameterValue
Maximum wave amplitude Af (m)3, 3.5, 4, 4.5, 5
Breakwater width B (m)5, 10, 15, 20, 25
Breakwater height H (m)2, 4, 6, 8, 10
Distance from the girder L (m)10, 50, 100, 150, 200
Constrained stiffness K (kN/m)0, 10, 50, 100, 106
Constrained displacement S (m)0, 0.5, 1.5, 2.5, 5
Table 2. The candidate parameters used in this model.
Candidate ParametersValue
Batch size10, 20, 30, 40, 80, 200
Training period500, 600, 700, 800, 900, 1000, 1100, 1200, 1300, 1400, 1500
Learning rate0.001, 0.002, 0.01, 0.02, 0.05, 0.1
Activation functionrelu, celu, sigmod, tanh
Number of neurons in hidden layer 120, 25, 30, 35, 40, 45, 50, 55, 60, 65, 70, 75
Number of neurons in hidden layer 220, 25, 30, 35, 40, 45, 50, 55, 60, 65, 70, 75
Disclaimer/Publisher’s Note: The statements, opinions and data contained in all publications are solely those of the individual author(s) and contributor(s) and not of MDPI and/or the editor(s). MDPI and/or the editor(s) disclaim responsibility for any injury to people or property resulting from any ideas, methods, instructions or products referred to in the content.