Article

Pilot Acoustic Tomography Experiment in the Sea of Japan at 1073 km Distance

V.I. Il’ichev Pacific Oceanological Institute, Far Eastern Branch Russian Academy of Sciences, Vladivostok 690041, Russia
*
Author to whom correspondence should be addressed.
J. Mar. Sci. Eng. 2023, 11(7), 1325; https://doi.org/10.3390/jmse11071325
Submission received: 12 April 2023 / Revised: 14 June 2023 / Accepted: 26 June 2023 / Published: 29 June 2023
(This article belongs to the Section Physical Oceanography)

Abstract

:
This article discusses the results obtained from performing a test acoustic-hydrological experiment in August 2022 at a marine test site from the coast of Sakhalin Island to the Kita-Yamato Bank in the Sea of Japan. A methodology for preliminary studies in the water area is presented. It is designed to study the climatic variability of the temperature regimes of the aquatic environment based on numerical modeling using the RAY computer program and the NEMO ocean hydrodynamic circulation model. One of the main results is the value of the average temperature of the marine environment calculated with high accuracy on the axis of the underwater sound channel in the Sea of Japan on a thousand-kilometer acoustic path when crossing the vortex system. The appearance of the measuring system, technical means, and methods described in the article can be used as the basis for organizing high-precision operational monitoring of thermodynamic processes in extended marine areas.

1. Introduction

In the past few decades of intensive study and development of sea and ocean technologies, remote methods of hydroacoustic thermometry in the study of hydrophysical characteristics and thermodynamic processes have developed significantly. They have an undeniable advantage over any other contact methods for the research and diagnosis of water masses in large-scale water areas [1,2,3,4,5]. Unfortunately, most of the experimental and theoretical works devoted to acoustic thermometry at distances of thousands of kilometers were carried out in marine areas of southern latitudes with the axis of the underwater sound channel (USC) at depths of 800–1000 m [6,7,8,9,10,11]. Basically, the experiments were carried out with the placement of signal sources on the USC axis. Consideration of these results concerning the sea areas of northern latitudes with a depth of the USC axis from 50 to 300 m does not seem correct.
For the effective implementation of acoustic thermometry in the northern latitudes, methods were proposed and tested with acoustic sources mounted on the shelf [12,13,14,15]. One of the main fundamental scientific results determining the concept of developing acoustic thermometry tools is the application of the acoustic “mudslide” effect. The effect was discovered by American scientists [16] near the Hawaiian Islands and confirmed for the hydrological conditions of the Sea of Japan. This effect is due to the focusing of acoustic energy in the near-bottom layer on the shelf, its transition to the axis of the underwater sound channel (USC) in the deep sea, and propagation with minimal attenuation over long distances. When constructing advanced measuring systems for acoustic thermometry (AMSAT), the use of this effect makes it possible to effectively solve such crucial problems as the safe placement of AMSAT emitting segments near the coastline with cable control, reliable reception, and high accuracy of measuring distances between corresponding points. The concept of developing rapidly deployable AMSAT is based on experimental and theoretical results in the study of the patterns of propagation of pseudo-random signals of the M-sequence type in complex hydrological and bathymetric conditions. The remarkable and unique properties of the underwater sound channel have been studied in detail and reliably, which made it possible to formulate the main idea for developing the concept of creating a long-range AMSAT. The advantage of solving the problem with the proposed method is the possibility of using AMSAT in all weather conditions and under the ice because signal sources can be controlled from the shore. The solution to the problem of increasing the range of AMSAT can be achieved by lowering the signal frequency and an acceptable increase in the weight and size characteristics of the acoustic sources without requiring an increase in the dimensions and power of the receiving acoustic antenna. In addition, if the AMSAT source unit is installed in controlled conditions near the coast, reliability and performance are improved due to the ability to check and refine the location using echo sounders and a satellite navigation system. The availability of the AMSAT source unit for repair and maintenance, reducing the risk of damage or lifting by fishing vessels, and reducing the cost of ship support due to the sufficiency for setting, removing, and servicing small or small-sized watercraft is ensured.
In the process of carrying out research and applied work of the Pacific Oceanological Institute of the Far Eastern Branch of the Russian Academy of Sciences (POI FEB RAS), the features of the formation of sound velocity fields in the water area of the northwestern part of the Russian Federation economic zone in the Sea of Japan were studied. Every year, studies were carried out on one or two long (up to 200 miles) acoustic tracks with detailed hydroacoustic and hydrological measurements. Particular attention was paid to the remarkable properties of underwater sound channels, which ensure signal propagation near the USC axis for thousands of kilometers with minimal attenuation and near-zero grazing angles. It made it possible to consider the ray trajectories as rectilinear and to calculate, using known distances between sources and receivers, the average speeds of sound on the corresponding paths. Since there is a relationship between the speed of sound and temperature in the marine environment, the collected data were used to solve problems of studying the climatic variability of ocean temperature regimes using the example of the Sea of Japan, which is one of the key objects in the northwestern Pacific Ocean [17,18].
The purpose of the work discussed in the article was to conduct a pilot acoustic-hydrological experiment on a thousand-kilometer path in the Sea of Japan. The experiment was conducted in order to develop methods and means of acoustic thermometry for operational monitoring and modeling of climatic variability of temperature regimes in complex waveguides, including the shelf and the deep sea.
At the same time, the following tasks were solved:
  • development and approbation of the appearance of the measuring system for the study and control of temperature regimes in the Sea of Japan by the method of acoustic thermometry;
  • experimental studies of the features of the formation and interaction of hydroacoustic and hydrological fields on a long (over 1000 km) track when crossing a vortex system;
  • carrying out a numerical simulation of the processes of formation and interaction of hydroacoustic and hydrological fields along an extended acoustic path in the northeastern part of the Sea of Japan using the NEMO (Nucleus for European Modelling of the Ocean) ocean hydrodynamic circulation model and the RAY computer program.

2. Means and Methods

2.1. Method and Technical Implementation of Temperature Control in the Sea of Japan

The present article discusses the experimental and theoretical results of a study of the climatic variability of temperature regimes in the Sea of Japan. The data were obtained in August 2022, when performing a pilot acoustic-hydrological experiment on a marine test site from the Coast of Sakhalin Island to the Kita-Yamato Bank (track No. 3, Figure 1). The appearance and the structure of the system for monitoring the climatic variability of temperature regimes in the Far Eastern seas are based on the choice of critical water areas that affect the general nature of the structure and dynamics of water masses, and the placement of acoustic measuring complexes in them, structurally consisting of emitting and receiving elements. From the experience of experimental work of the V.I. Il’ichev Pacific Oceanological Institute Far Eastern Branch Russian Academy of Sciences (POI FEB RAS), these can be emitting and receiving elements placed in the water area of the Sea of Japan as follows (Figure 1). The central bottom-mounted receiving element (asterisk) will be placed on the bank of Kita-Yamato. Acoustic sources of pulsed broadband signals (red dots) will be bottom-mounted on the shelf zones near the lighthouse structures near the capes Gamov, Ostrovnoy, and the village Chekhov (Sakhalin Island) and connected by cable lines to coastal posts. The practical implementation of emission from these points and signal reception on the Kita-Yamato bank were repeatedly tested earlier in the course of various works of the POI FEB RAS.
The method of acoustic thermometry is based on spatially spaced and time-synchronized emission and the reception of probing acoustic signals on the USC axis of the diagnosed waveguides. When convolving the received signals with the masks of the emitted ones, the impulse responses of the corresponding waveguides are determined. Separate arrivals of acoustic energy are distinguished from the structure of impulse responses, and their propagation time is measured. Based on the known distance between the source and the receiver, the average speed of sound on the USC axis is calculated for all components. Further, using the Chen-Millero algorithm generally accepted in oceanology [19], the average temperatures in the waveguide are calculated.
An important circumstance in the choice of such a measurement scheme is the fact that track No. 3 in the northeast, described in the article, is a continuation of the well-studied acoustic paths Cape Schulz-Kita-Yamato (track No. 1) and Cape Ostrovnoy-Kita-Yamato (track No. 2). This makes it possible to extend the obtained results to the entire water area of the Sea of Japan.

2.2. Hydrological Situation in the Study Area

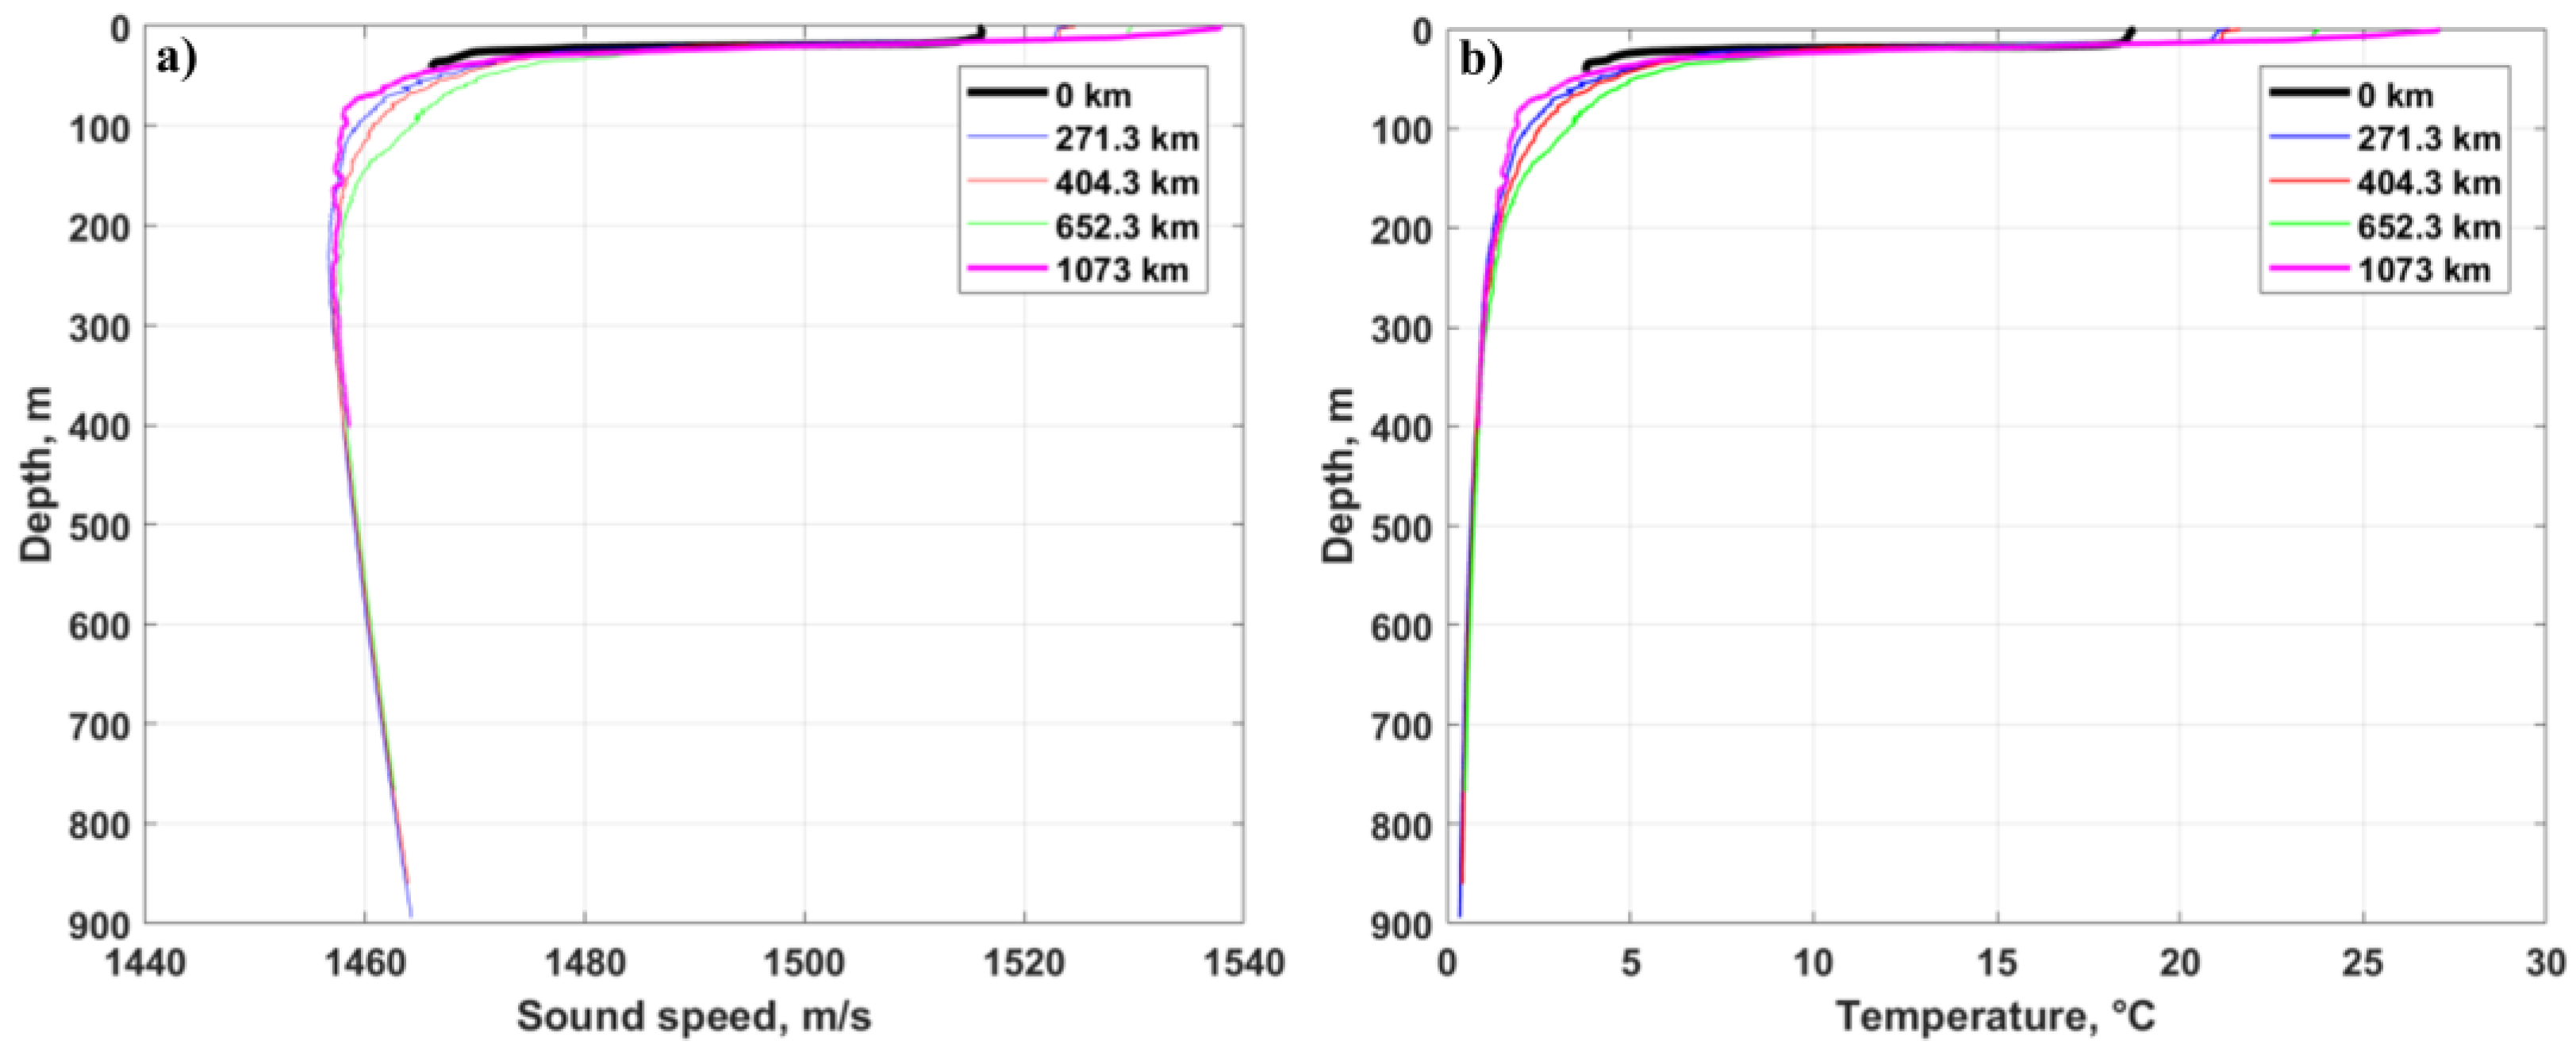
As part of the pilot experiment, studies were carried out on the features of the formation of the hydrological situation in the measurement area. Near the receiving system and at points at distances of 271.3 km, 404.3 km, and 652.5 km from the sound source, the vertical distribution of the speed of sound and temperature were measured (Figure 2a,b, Table 1). An analysis of these dependencies shows that the USC axis (minimum sound speed) at all points was at a depth of 200 m to 300 m.
In addition, it can be noted that there is a greater value of the speed of sound and a greater deepening of the USC axis at point No. 4 at a distance of 652.5 km from the source.
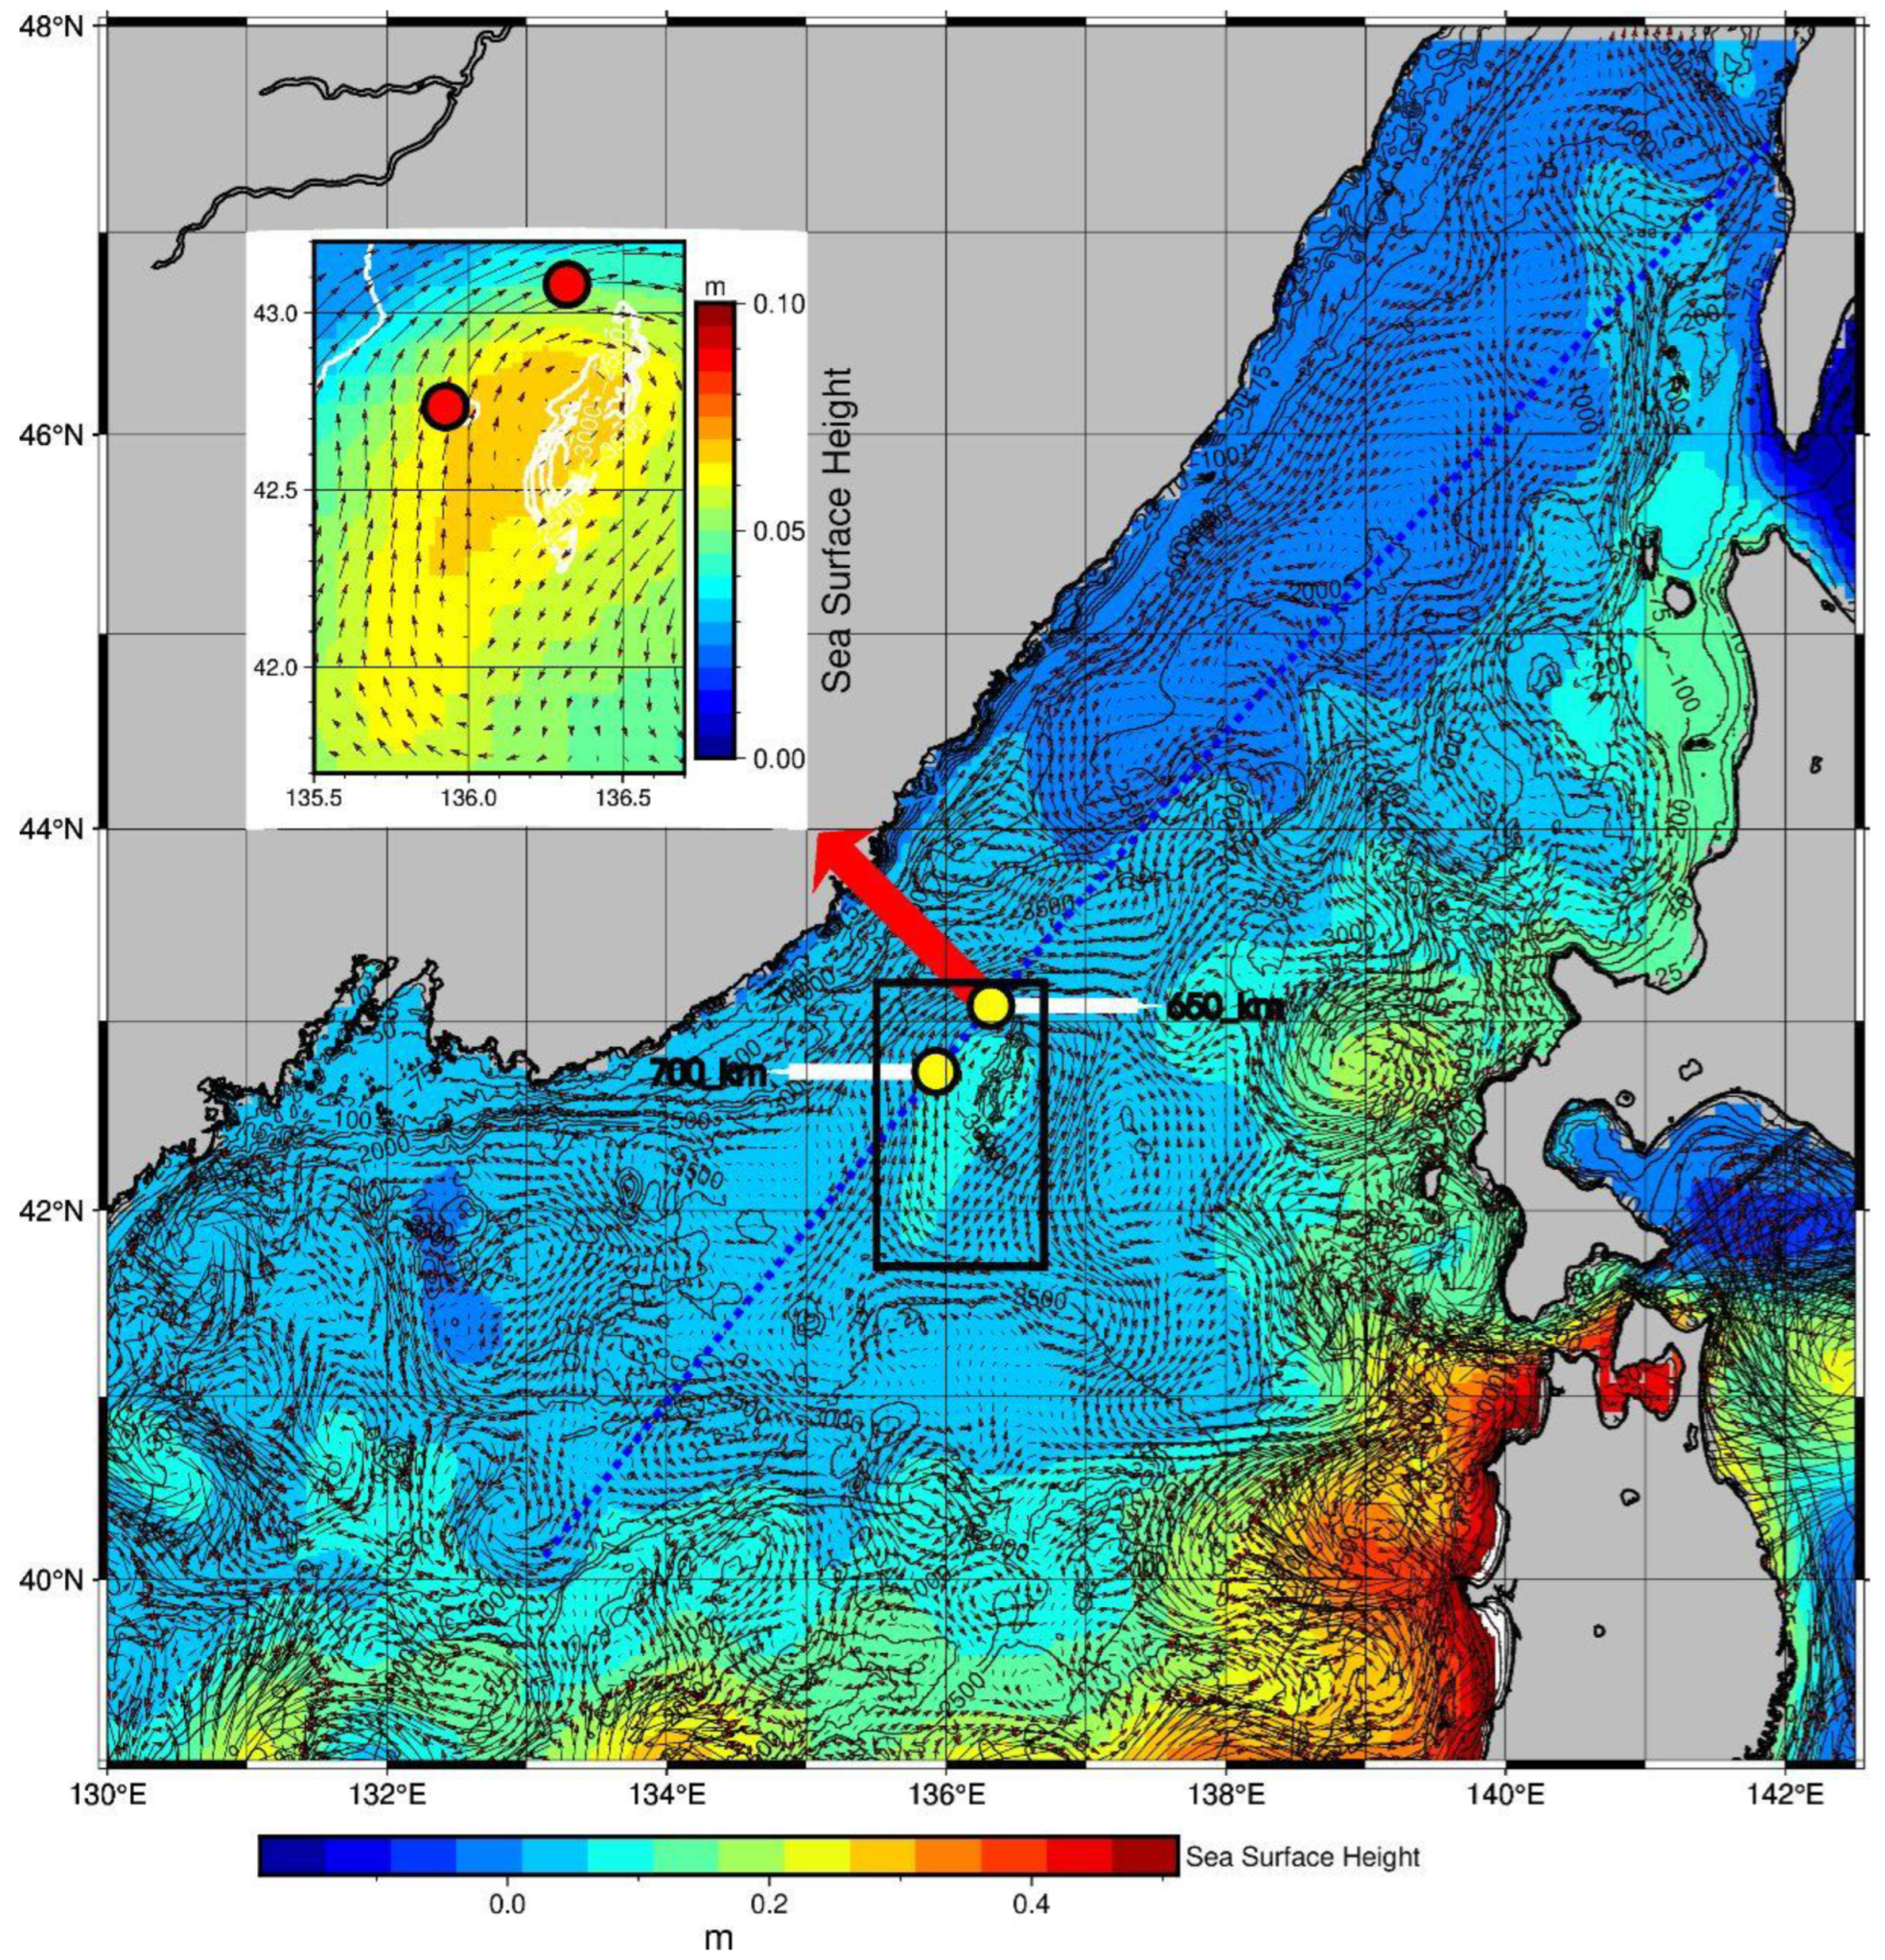
For a better analysis of the hydrological situation in the study area, data from the NEMO ocean circulation hydrodynamic model on sound velocity fields on a given path and in a given time interval were used. In Figure 3c, a segment from 600 to 700 km can be highlighted, in which larger values of the speed of sound on the USC axis and larger depths of its occurrence are noted. This corresponds to the data obtained from the CTD (conductivity, temperature, depth) probe (red dots in Figure 3a,b) and suggests the presence of a topographic anticyclonic eddy system with a warm core in the center of this section of the path. The assumption is based on the fixation of this eddy during the summer months (July, August, and September) and the presence of the underwater Bogorov Rise in this area (Figure 4).
Additionally, based on Figure 3a, significant fluctuations within a range of 500 km are observed, which may be attributed to a mesoscale eddy located around the Bogorov Ridge. The vertical section depicted in Figure 3c confirms the presence of eddies that can affect sound speed due to turbulence occurring at that distance. The impact of these eddies on circulation, as derived from altimetry and the NEMO model, is illustrated in Figure 4. The local inset in Figure 4, which focuses on the circulation over the Bogorov Ridge, reveals that the subsurface water flow direction is clockwise (cyclonic), which may cause anomalies in the sound speed profile.
Thus, when solving problems of acoustic thermometry, the data of the NEMO ocean circulation hydrodynamic model can replace or significantly expand the results of measurements by CTD probes.
The above thermometric observations are relevant because with the constant presence of a warm vortex in a given area, its size and depth can be of great practical importance for fisheries in the region.

3. Results

3.1. Acoustic Thermometry Results

The results of a pilot experiment in the Sea of Japan on acoustic thermometry using a receiving system mounted on the axis of an USC at a distance of 1073 km are discussed below.
The source was located near the coastline of Chekhov village (Sakhalin Island) at a depth of 41 m and a distance of 5 km from the continental slope (Figure 1). Every 6 min, a signal frame was emitted. The signal included several pseudo-random M-sequences with phase-shift keyed modulation: length of 1023 symbols with a filling of 4 periods of the carrier frequency per symbol (hereinafter M1023) and also 127-symbol M-sequence with 40 periods of carrier (central) frequency per symbol (hereinafter M127). All signals had a central frequency of 400 Hz; the difference was in frequency bands: M1023—300–500 Hz (symbol duration 0.01 s); M127—band 390–410 Hz (symbol duration 0.1 s). The acoustic pressure was near 8000 Pa at 1 m from the source. The receiving system was based on a radiohydroacoustic buoy that was drifting near the receiving vessel at ranges more than 1073 km from the source.
The receiving system’s hydrophone was submerged in the USC axis, ascertained by measuring the vertical distribution of sound speed (VDSS). The information from the emitter’s received signal was relayed to a surface radiohydroacoustic buoy and then transmitted via radio to the receiving vessel. The impulse characteristics of the waveguide, obtained by convolving the received signals with the emitted ones, are shown in Figure 5.
The placement of the source on the shelf in this scenario facilitates the occurrence of an acoustic phenomenon known as a “mudslide,” which involves the transfer of acoustic energy from the near-bottom region of the shelf to the underwater sound channel axis in the deep sea. As a result, all impulse responses exhibit the final maximum arrival of acoustic energy at 736.3 s, as it propagates along ray paths in close proximity to the USC axis with minimal velocity.
The absence of impulse responses during the period from 04:00 to 04:18 is due to power supply issues on the emitting vessel. Additionally, the shifts observed in the impulse responses at time moments 04:24, 05:42, and 06:00 were caused by a failure in the time synchronization system. It is possible that the GPS satellites were out of sight for the time synchronization module at the receiving point. The drift coordinates of the buoy were recorded every second by the GPS and were taken into account in calculations of the distance between the receiving system and the acoustic source (Figure 6). The distance from the source to the receiver was calculated for each moment of arrival of the acoustic signal. The distance was calculated using the algorithm [20] according to the GPS data of the source and receiver, taking into account the deepening of the USC axis. The correction in the calculation is due to a decrease in the radius of the Earth when deepening below sea level and, as a result, a decrease in the length of the arc connecting the corresponding points. The correction value is defined as:
Δ L = 2 π d L 4 × 10 7
where:
  • L—distance between emitting and receiving points at sea level, m;
  • 4 × 10⁷—mean circumference of the earth at sea level, m;
  • d—USC axis depth, m.
For distances between emission and reception points in the range 1072.950–1073.3 km (Figure 6) and USC axis depth 250 m, the correction should be equal to 42 m.
Figure 6. Drift trajectory of the receiving system with a change in the distance to the source.
Jmse 11 01325 g006
Through analysis of the buoy coordinates and corresponding time measurements, the average speed of sound was determined for each drift moment. The information was used to calculate the path-averaged sound speed. This, in combination with the known values of the USC axis depth and salinity, enabled the calculation of temperature using the widely accepted Chen–Millero algorithm in oceanology (Figure 7).
Data analysis reveals that both signals are suitable for solving the primary issue of thermometry, which is the detection and measurement of the time of maximum arrival near the USC axis. However, it is noteworthy that signals M127 provide a more informative representation of late ray arrivals propagating along steep trajectories due to their large averaging time of 0.1 s. Nevertheless, there is a shift in the average values of the speed of sound and temperature towards an increase in comparison with signal M1023. This is because the acoustic energy of rays propagating above and below the USC axis, but having different gradients of sound change with depth, is integrated. Therefore, the use of M1023 signals is preferable since time measurement is carried out using information from rays propagating closer to the USC axis. This approach implements the primary method’s main idea, where all fluctuations of the marine environment in the layer above the USC axis (e.g., sea waves, internal waves) do not affect the measurement results, and only large-scale processes of sound speed (temperatures) changes are recorded, such as frontal sections, eddy formations, etc.
The calculation of sound speed is subject to an error, denoted as ∆C, which is influenced by the length of the acoustic path, the time taken for propagation, and the temporal resolution of the acoustic signal ∆τ. The latter is equivalent to the duration of the M-sequence symbol [21]:
Δ C = L τ 2 Δ τ
where:
  • L—acoustic track length, m;
  • τ—travel time, s;
  • ∆τ—M-sequence symbol duration, s.
To calculate temperature based on salinity, pressure, and sound speed using the Chen–Millero algorithm, a temperature calculation error of ∆t = 0.007 °C is expected for the M1023 signal with a symbol duration of 0.01 s. For the M127 signal with a symbol duration of 0.1 s, the temperature calculation error is ∆t = 0.044 °C.
Acoustic measurements of the average temperature on the USC axis along a thousand-kilometer acoustic track for signals M1023 yielded a value of 1.189 degrees with an error of 0.007 degrees (average sound speed of 1457.16 m/s) and same 0.007 °C standard deviation. For M127 it is 1.211 ± 0.006 °C with instrumental error 0.044 °C. These measurements were taken across a vortex system, and monitoring temperatures along this path combined with NEMO model data can provide insights into the eddy system’s characteristics.
During the period from 2000 to 2022, the POI conducted research and applied work to study the formation of sound velocity fields in the southwestern part of the Russia economic zone of the Sea of Japan. Annual surveys were conducted on one or two long acoustic tracks, up to 380 km in length, with detailed hydrological measurements.
Figure 8 shows the dependence of sound velocities and depths of occurrence on the USC axis over the years on path 1 for the August-September period. Stable average sound velocities of 1455–1456 m/s were noted until 2018, after which they increased to 1457 m/s. This may be due to the Polar Front shifting northward and acoustic traces entering warm trans-Pacific waters. As the average sound speed and values measured at points 2–5 by CTD-probes along path 3 are also close to 1457 m/s, it can be assumed that the entire north-fallow part of the Sea of Japan was in these waters during this period.
The proposed measurement scheme, technical means, and methodology can be used to organize high-precision operational monitoring of climatic variability of temperature regimes in the entire economic zone of the Russian Federation of the Sea of Japan.

3.2. Numerical Simulation Results

For the physical interpretation of the obtained results and achieving the exact dimensions of the detected eddy system, the numerical simulation of the propagation of broadband pulsed signals was carried out using the RAY program [22,23]. The data from the NEMO ocean circulation hydrodynamic model, the characteristics of the bottom topography, and the measured VDSS at given points were used for the simulation (Figure 9).
Calculations showed that for given model parameters, an impulse response of M127 signals is formed on the receiving hydrophone, consisting of three arrivals with propagation times approximately equal to those obtained experimentally (Figure 9d,e). In this case, the grazing angles of ray arrivals ranged from 0 (first arrival) to 5 degrees (Figure 9c, blue dots). It indicates that the acoustic energy from the sea shelf moves to the USC axis in the deep sea and then propagates with minimal attenuation. Figure 9b illustrates this process of “capturing” the acoustic energy of the USC. It can be seen that at a distance of 600 to 730 km, the ray trajectories deepen to 300 m, which is consistent with the data of the NEMO model. The criterion for the adequacy of model calculations to the real process of propagation of broadband pulse signals is the similarity of the pulse characteristics, both in shape and in the times of individual arrivals of acoustic energy. In our case, it was possible to achieve the maximum similarity by selecting the horizontal size of the eddy equal to 130 km at a given time. Therefore, the RAY program can be successfully used as an additional tool for refining the results of acoustic thermometry to monitor climate variability in this area of the Sea of Japan.

4. Conclusions

The results of the experimental study demonstrate the effectiveness of using technical and computational tools together to improve the accuracy and expand the capabilities of acoustic thermometry in complex extended waveguides, such as the shelf and deep sea. For the first time, a methodology was developed and implemented on this coast with the placement of acoustic signal sources on the shelf near the coastline, significantly increasing the efficiency of practical implementation of thermometric measurement schemes in the sea. An average temperature value of 1.,189 degrees with an error of 0.007 degrees and same 0.007 °C standard deviation was obtained and confirmed by instrumental measurements on the USC axis in the Sea of Japan on a thousand-kilometer acoustic path.
The experiment and numerical simulation of the process of propagation of pulsed broadband signals along an extended (over 1000 km) acoustic path using the RAY computer program and data from the NEMO hybrid hydrodynamic ocean circulation model made it possible to identify and classify a significant (about 130 km) eddy system with a warm core in the center. It is important to note that the registered presence of a warm eddy in the area, its size, and depth can be of great practical importance for fisheries in the region.
Furthermore, the study shows that when solving problems related to acoustic thermometry, the data from the NEMO ocean circulation hydrodynamic model can replace or significantly expand the results of measurements by CTD probes. The results obtained are an effective completion of a cycle of experimental and theoretical studies aimed at the practical development of a measuring scheme for controlling the climatic variability of temperature regimes in the Sea of Japan.

Author Contributions

G.D.—problem statement, discussion and writing the article, Y.M.—problem statement, discussion and writing the article. A.G.—data processing, discussion and writing the article, participation in the experimental studies. V.B.—equipment development, discussion and writing the article, participation in the experimental studies. E.V.—data processing, participation in the experimental studies. M.L.—data processing, discussion and writing the article participation in the experimental studies. V.R.—equipment development, discussion and writing the article participation in the experimental studies. D.K. –discussion and writing the article. A.T.—equipment development, discussion and writing the article. S.S.—data processing, participation in the experimental studies. All authors have read and agreed to the published version of the manuscript.

Funding

Experimental studies were carried out within the framework of the state budget topic of the Pacific Ocean Institute of Far Eastern Branch of the Russian Academy of Sciences: “Development of new methods and means for research and development of marine areas. Development of methods for diagnosing and improving the efficiency of complex acoustic systems” (registration number: AAAA-A20-120031890011-8). Analysis and interpretation of the results were carried out within the framework of the project “Development of a climate monitoring system for the Far Eastern seas of Russia and the Northwestern Pacific Ocean based on multiplatform observations and operational hydrodynamic modeling”.

Institutional Review Board Statement

Not applicable.

Informed Consent Statement

Informed consent was obtained from all subjects involved in the study.

Data Availability Statement

Not applicable.

Acknowledgments

We would like to express our deep gratitude to all employees of the Acoustic Tomography laboratory.

Conflicts of Interest

The authors declare no conflict of interest.

References

  1. Munk, W.; Wunsh, C. Ocean acoustic tomography: A scheme for large scale. Deep-Sea Res. 1979, 26, 123–161. [Google Scholar] [CrossRef]
  2. Dushaw, B.D.; Worcester, P.F.; Munk, W.H.; Spindel, R.C.; Mercer, J.A.; Howe, B.M.; Metzger, K., Jr.; Birdsall, T.G.; Andrew, R.K.; Dzieciuch, M.A.; et al. A decade of acoustic thermometry in the North Pacific Ocean. J. Geophys. Res. 2009, 114, 1–24. [Google Scholar] [CrossRef]
  3. Mikhalevsky, P.N.; Gavrilov, A.N.; Baggeroer, A.B. The Transartic acoustic propagation experiment and climate monitoring in the Artic. IEEE J. Ocean. Eng. 1999, 24, 183–201. [Google Scholar] [CrossRef]
  4. Send, U.; Schott, F.; Gaillard, F.; Desaubies, Y. Observation of a deep convection regime with acoustic tomography. J. Geophys. Res. Oceans. 1995, 100, 6927–6941. [Google Scholar] [CrossRef]
  5. Send, U.; Krahmann, G.; Mauuary, D.; Desaubies, Y.; Gaillard, F.; Terre, T.; Papadakis, J.; Taroudakis, M.; Skarsoulis, E.; Millot, C. Acoustic observations of heat content across the Mediterranean Sea. Nature 1997, 385, 615–617. [Google Scholar] [CrossRef]
  6. Worcester, P.F.; Cornuelle, B.D.; Dzieciuch, M.A.; Munk, W.H.; Howe, B.M.; Mercer, J.A.; Baggeroer, A.B. A test of basin-scale acoustic thermometry using a large- aperture vertical array at 3250-km range in the eastern North Pacific Ocean. J. Acoust. Soc. Am. 1999, 105, 3185–3201. [Google Scholar] [CrossRef] [Green Version]
  7. Munk, W.H.; Spiesberger, J.L.; Metzger, K.A.; Forbes, M.G. Global ocean warming: An acoustic measure? J. Phys. Oceanogr. 1989, 19, 1765–1778. [Google Scholar] [CrossRef]
  8. Spiesberger, J.L. Basin-scale tomography: A new tool for studying weather and climate. J. Geophys. Res. 1991, 96, 4869–4889. [Google Scholar] [CrossRef]
  9. Ko, D.S.; De Ferrari, H.A.; Malanette-Rizzoli, P. Acoustic tomography in the Florida Strait: Temperature, Current and Vorticity Measurements. J. Geoph. Res. 1989, 94, 6197–6211. [Google Scholar] [CrossRef]
  10. Baggeroer, A.B.; Birdsall, T.G.; Clark, C.; Colosi, J.A.; Cornuelle, B.D.; Costa, D.; Dushaw, B.D.; Dzieciuch, M.; Forbes, A.M.G.; Hill, C.; et al. Ocean climate change: Comparison of acoustic tomography, satellite altimetry, and modeling. Science 1998, 281, 1327–1332. [Google Scholar]
  11. Howe, B.M.; Anderson, S.G.; Baggeroer, A.B.; Colosi, J.A.; Hardy, K.R.; Horwitt, D.; Karig, F.W.; Leach, S.; Mercer, J.A.; Metzger, K.; et al. Instrumentation for the Acoustic Thermometry of Ocean Climate (ATOC) prototype Pacific Ocean network. In Proceedings of the ‘Challenges of Our Changing Global Environment’. Conference Proceedings. OCEANS’95 MTS/IEEE, San Diego, CA, USA, 9–12 October 1995; pp. 1483–1500. [Google Scholar]
  12. Morgunov, Y.N.; Bezotvetnykh, V.V.; Burenin, A.V.; Voitenko, E.A. Study of how hydrological conditions affect the propagation of pseudorandom signals from the shelf in deep water. Acoust. Phys. 2016, 62, 350–356. [Google Scholar] [CrossRef]
  13. Akulichev, V.A.; Kamenev, S.I.; Morgunov, Y.N. Application of complex acoustic signals in communication systems and navigation of submersible units. Dokl. Earth Sci. 2009, 427, 837–839. [Google Scholar] [CrossRef]
  14. Akulichev, V.A.; Bezotvetnykh, V.V.; Burenin, A.V.; Voitenko, E.A.; Morgunov, Y.N. Experimental evaluation of the influence of the vertical sound velocity profile at the source site in shallow water on the formation of the pulse response characteristics in the deep sea. Acoust. Phys. 2010, 56, 47–48. [Google Scholar] [CrossRef]
  15. Morgunov, Y.N.; Golov, A.A.; Burenin, A.V.; Petrov, P.S. Studies of spatiotemporal structure of the acoustic field formed in deep water by a broadband pulsed signal source on the shelf of the Sea of Japan. Acoust. Phys. 2019, 65, 537–544. [Google Scholar] [CrossRef]
  16. Tappert, F.D.; Spiesberger, J.L.; Wolfson, M.A. Study of a novel range-dependent propagation effect with application to the axial injection of signals from the Kaneohe source. J. Acoust. Soc. Am. 2002, 111, 757. [Google Scholar] [CrossRef]
  17. Petrov, P.S.; Golov, A.A.; Bezotvetnykh, V.V.; Burenin, A.V.; Kozitskiy, S.B.; Sorokin, M.A.; Morgunov, Y.N. Experimental and theoretical study on arrival times and effective velocities in the case of long-range propagation of acoustical pulses along the shelf edge in a shallow sea. Acoust. Phys. 2020, 66, 21–32. [Google Scholar] [CrossRef]
  18. Dolgikh, G.; Morgunov, Y.; Burenin, A.; Bezotvetnykh, V.; Luchin, V.; Golov, A.; Tagiltsev, A. Methodology for the Practical Implementation of Monitoring Temperature Conditions over Vast Sea Areas Using Acoustic Thermometry. J. Mar. Sci. Eng. 2023, 11, 137. [Google Scholar] [CrossRef]
  19. Chen, C.-T.; Millero, F.J. Speed of sound in seawater at high pressures. J. Acoust. Soc. Am. 1977, 62, 1129–1135. [Google Scholar] [CrossRef]
  20. Charles, F.F. Karney. Algorithms for geodesics. J. Geod. 2013, 87, 43–55. [Google Scholar] [CrossRef] [Green Version]
  21. Kaneko, A.; Zhu, X.H.; Lin, J. Coastal Acoustic Tomography; Elsevier: Amsterdam, The Netherlands, 2020; pp. 1–362. [Google Scholar] [CrossRef]
  22. Bowlin, J.B.; Spiesberger, J.L.; Duda, T.F.; Freitag, L.E. Ocean Acoustical Ray-Tracing Software RAY; Woods Hole Oceanographic Technical Report; WHOI-93-10; Woods Hole Oceanographic Institution: Woods Hole, MA, USA, 1992; p. 49. [Google Scholar]
  23. Sorokin, M.A.; Petrov, P.S.; Kaplunenko, D.D.; Golov, A.A.; Morgunov, Y.N. To the issue of theoretical and experimental estimates of the group velocity of the acoustic signal modal components on long tracks using ocean circulation models. Underw. Investig. Robot. 2022, 2, 54–64. [Google Scholar] [CrossRef]
  24. Morgunov, Y.N.; Bezotvetnykh, V.V.; Golov, A.A.; Burenin, A.V.; Lebedev, M.S.; Petrov, P.S. Experimental study of the impulse response function variability of underwater sound channel in the Sea of Japan using pseudorandom sequences and its application to long-range acoustic navigation. Acoust. Phys. 2021, 67, 287–292. [Google Scholar] [CrossRef]
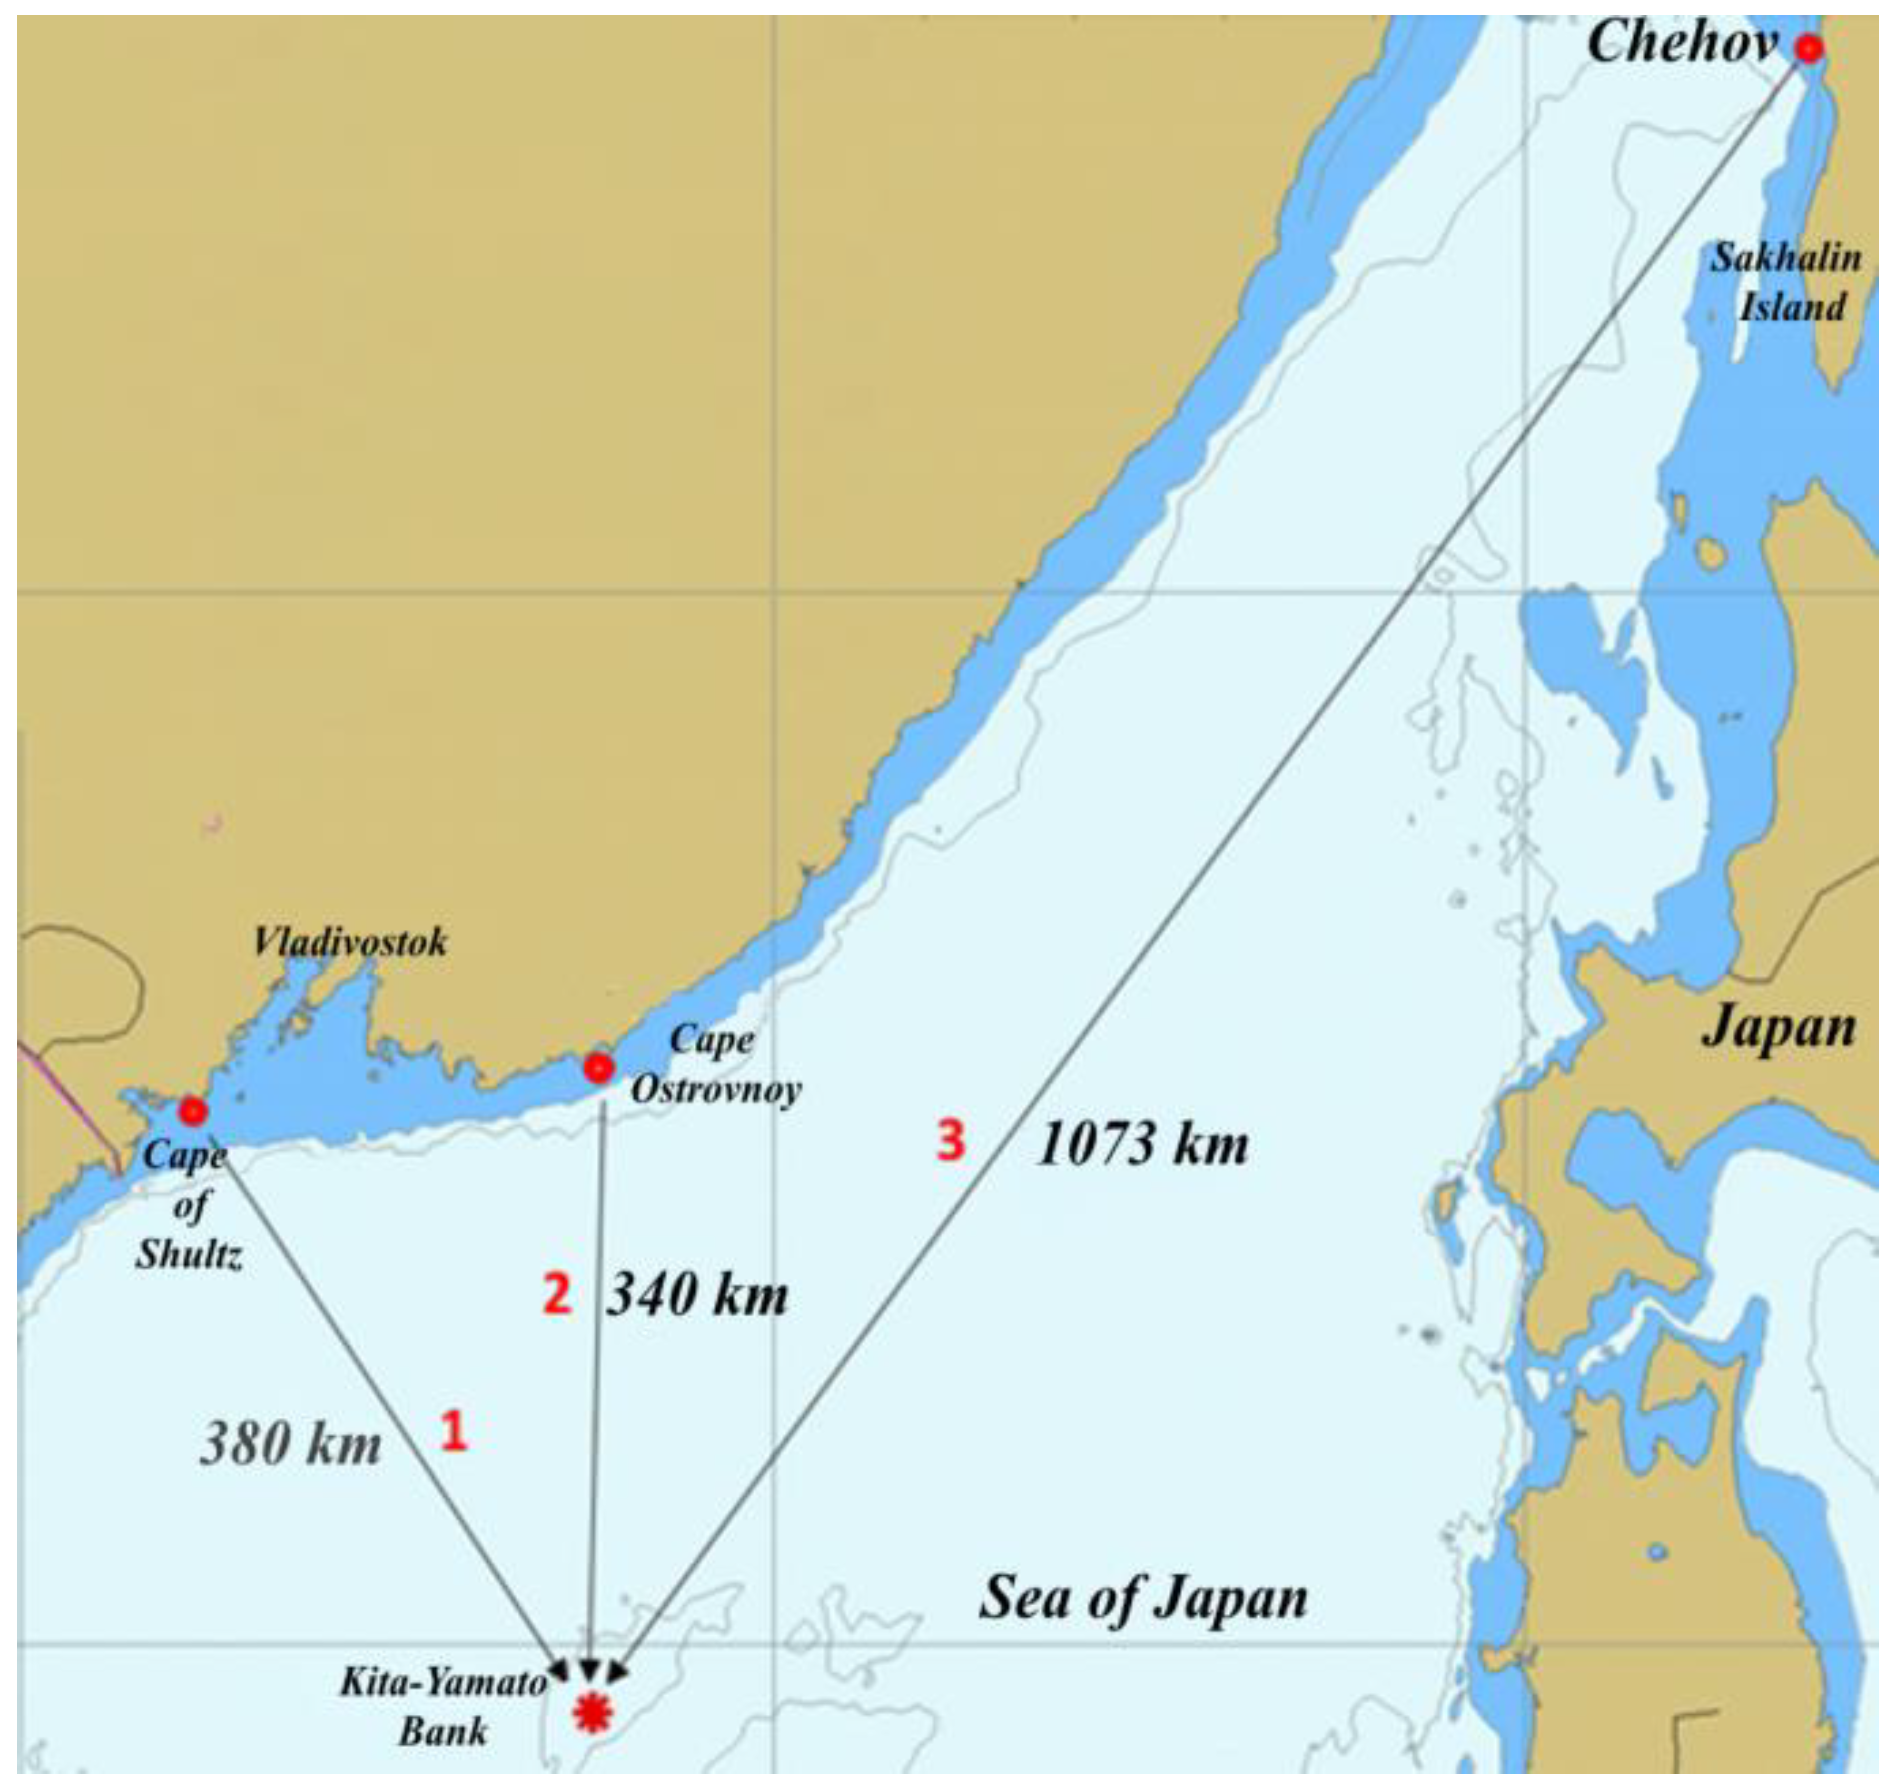
Figure 1. The appearance of the measuring system for the study and control of temperature regimes in the Sea of Japan.
Jmse 11 01325 g001
Figure 2. Measured by CTD—vertical distribution of sound speed (a) and temperature (b) by depth at given points.
Jmse 11 01325 g002
Figure 3. Data from the NEMO hybrid hydrodynamic ocean circulation model and the GEBCO (General Bathymetric Chart of the Oceans) terrestrial topography database: (a) sound velocity variation on the USC axis along the acoustic path; (b) change in the depth of the USC axis along the acoustic path; (c) sound velocity field and bottom topography along the acoustic path.
Jmse 11 01325 g003
Figure 4. Bottom relief and circulation of water masses according to the NEMO hybrid hydrodynamic ocean circulation model and the GEBCO terrestrial topography database.
Jmse 11 01325 g004
Figure 5. Obtained from signals with different symbol duration and amount of symbols impulse responses.
Jmse 11 01325 g005
Figure 7. Speed of sound and temperature on the USC axis, calculated from the last arrival of acoustic signals (blue—hourly averaging window, green—average value for all measurements).
Jmse 11 01325 g007
Figure 8. Speed of sound on the USC axis and the depth of the USC axis by data from direct CTD-measurements for the period 2006–2022 and data from the multiannual database collected in POI FEB RAS for 120 years. The distance is calculated from the Cape of Shultz (track 1).
Jmse 11 01325 g008
Figure 9. The results of modeling of the propagation of acoustic signals along a 1073 km long track using the RAY program: (a) VDSS at points along the path; (b) ray trajectories of acoustic signals for small source angles; (c) source and arrival angles; (d) model of arrivals of acoustic signals and the shape of the impulse response; (e) experimentally obtained impulse response for the M127 and M1023 signals. Horizontal lines present the level of the orthogonal channel correlation noise [24]. Below those lines signals cannot be detected.
Jmse 11 01325 g009
Table 1. USC parameters along the acoustic path.
NoDistance(km)Minimum of the Speed of Sound (m/s)Depth (m)
101466.02541.4
2271.31456.678228.5
3404.31457.067272.4
4652.51457.567317.5
510731457.0756242.9
Disclaimer/Publisher’s Note: The statements, opinions and data contained in all publications are solely those of the individual author(s) and contributor(s) and not of MDPI and/or the editor(s). MDPI and/or the editor(s) disclaim responsibility for any injury to people or property resulting from any ideas, methods, instructions or products referred to in the content.