Abstract
The accuracy of different types of El Niño-Southern Oscillation (ENSO) predictions is sensitive to initial errors in different key areas of the Pacific Ocean. To improve the accuracy of the forecast, assimilation techniques can be utilized to eliminate these initial errors. However, limited studies have measured the extent to which assimilating ocean temperature data from different key regions in the Pacific Ocean can enhance two types of ENSO predictions. In previous research, three critical regions were identified as having initial errors in ocean temperature most interfering with two types of El Niño predictions, namely the North Pacific for Victoria Mode-like initial errors, the South Pacific for South Pacific Meridional Mode-like initial errors, and the subsurface layer of the western equatorial Pacific. Based on these initial error patterns, we quantified the effect of assimilating ocean temperature observation datasets in these three key regions using the particle filter method. The result indicates that ocean temperature initial accuracy in the tropical western area near the thermocline region is important for improving the prediction skill of CP-El Niño compared with the other two sensitive areas. However, three key areas are all important for EP-El Niño predictions. The most critical area varies among different models. Assimilating observations from the north and south Pacific proves to be the most effective for improving both types of El Niño predictions compared to the other two areas’ choices. This suggests that the initial accuracy of ocean temperature in these two regions is less dependent on each other for enhancing El Niño predictions. Additionally, assimilating observations from all three sensitive areas has the best results. In conclusion, to enhance the accuracy of two types of El Niño predictions, we need to ensure the initial accuracy of ocean temperature in both tropical and extratropical regions simultaneously.
1. Introduction
The El Niño-Southern Oscillation (ENSO) is the primary cause of the most intense sea surface temperature (SST) variation in the tropical Pacific on the interannual time scale. It results in alternating warm (El Niño) and cold (La Niña) phases, having a profound impact on tropical weather as well as global climate [1,2,3,4,5,6,7]. Traditionally, the warming SST anomalies in El Niño events are mainly located in the eastern Pacific. However, a new flavor of El Niño with its maximum SSTA in the central Pacific has become more common since the 1990s [8,9]. Based on the locations of the maximum SSTA, the new type of El Niño is named CP-El Niño, while the conventional type is named EP-El Niño [10,11].
Although the self-sustaining nature of the tropical Pacific ocean-atmosphere system is conducive to better ENSO predictions up to one or two years in advance [12], ENSO diversity is certainly a crucial factor that hampered the accuracy of the ENSO prediction. Barnston et al. [13] implied that even though the models have been improved all the time, the El Niño prediction skill has decreased since the 2000s, with a large possibility of being influenced by the frequent occurrence of CP-El Niño. Moreover, distinguishing the type of El Niño when making El Niño predictions is also a huge challenge. Owing to the inability of the models to simulate the new flavor of El Niño, there is considerable room for enhancing the accuracy of classical dynamical models in forecasting the various types of El Niño occurrences [14,15,16,17]. For example, the useful prediction of CP-El Niño by using a multi-model ensemble system or advanced operational dynamical models can only be accurate up to one month in advance [14,18].
Observations are essential for comprehending the ENSO mechanism, refining models, and reducing initial errors in model prediction. To improve the prediction of ENSO, it is important to address the issue of initial errors in the ENSO prediction field, as suggested by Lorenz [19]. This falls under the first type of predictability problem. It is widely recognized that precise initial conditions play a pivotal role in predicting ENSO events [20,21,22]. In addition, the initial errors that have the most notable influence on ENSO prediction tend to present particular patterns. These special initial errors gradually evolve over time and ultimately lead to inaccurate predictions of ENSO-related SSTA [23,24,25,26,27,28,29]. This pertains to the idea of target observation, which refers to effectively improving predictions by ensuring the initial accuracy of variables in specific “key areas” or “sensitive areas” [30].
Extensive research has been conducted to investigate the sensitive area where the initial condition has the biggest impact on ENSO prediction. Specifically, employing the conditional nonlinear optimal perturbation (CNOP) method and the Zebiak-Cane model, Mu, Xu and Duan [23] demonstrated that certain initial errors exhibiting specific spatial patterns can result in substantial ENSO prediction errors, while others have negligible effect. Duan, Liu, Zhu and Mu [28] uncovered that initial errors with a zonal dipolar pattern of SSTA in the central and eastern equatorial Pacific can experience significant amplification during spring, commonly known as the spring predictability barrier (PB), causing pronounced uncertainties in ENSO predictions. Zhang, Duan and Zhi [25] investigated the initial errors in complex models by analyzing datasets from three Coupled Model Intercomparison Project (CMIP5) models. They discovered that the initial errors that lead to significant errors in predicting El Niño are similar in these three coupled general circulation models (GCMs). These errors display a dipole pattern along the thermocline in the equatorial Pacific. However, the above research only dealt with EP-El Niño predictions.
To take a step further, Hou, Duan and Zhi [27] delved deeper into El Niño predictability by examining the ocean temperature initial conditions for two types of El Niño and expanding their research to cover the entire Pacific Ocean. They utilized data from six CMIP5 models and a data analysis method for predictability dynamics to identify the initial error in Pacific Ocean temperature that causes the largest seasonal PB for both types of El Niño predictions. According to their research, initial errors over the extratropical Pacific are important for predicting both EP- and CP-El Niño. They also inferred that the initial errors covering the Victoria Mode (VM) area in the North Pacific are strongly related to the SSTA in the central tropical Pacific, while those covering the South Pacific Meridional Mode (SPMM) area and those located along the thermocline in the tropical Pacific are more likely to affect the eastern equatorial Pacific. These parts of the initial errors can evolve, interfere with each other, and finally undermine the El Niño predictions. Moreover, Hou et al. [31] designed a particle filter-based target observation method and quantified the relative significance of surface temperature accuracy in the entire Pacific Ocean for improving two types of El Niño predictions. However, their method only allows for the assimilation of one single sea surface temperature observation at a time. As a result, it was unfeasible to examine the joint effect of the initial error in various regions of the Pacific, as discussed by Hou et al. (2019).
As previously mentioned, reducing the initial errors in different parts of the Pacific Ocean is crucial for enhancing the accuracy of two types of El Niño forecasts. However, to our knowledge, the research quantifying the joint effect of the initial error in different regions of the Pacific Ocean by using assimilation methods is limited. Given the circumstances, it is crucial to address the following significant concerns to further explore the predictability dynamics of two types of El Niño events and thus help improve the prediction skills of ENSO. Can observations in different sensitive areas increase the accuracy of El Niño predictions? Furthermore, if so, how far can the El Niño prediction be improved by assimilating multiple observations from different sensitive areas? What is the difference between the results of the two types of El Niño predictions? These findings could shed light on enhancements in model development and operational ENSO predictions.
2. Materials and Methods
To maintain consistency with the work by Hou, Duan and Zhi [27], we have utilized the pi-control runs of the CMIP5 climate models. We have meticulously selected six models that accurately capture the main characteristics of two types of El Niño events and provide a reasonable depiction of ENSO diversity, as evaluated in studies by Kim and Yu [32], Bellenger et al. [33], and Hou and Tang [34]. The affiliations and related configurations can be found in Table 1. Our primary focus is on the initial error of ocean temperature in the Pacific, so we have obtained monthly sea surface temperature (SST) and ocean subsurface temperature (at depths of 5–155 m) from the output datasets of these six coupled models. Different models have varying resolutions and integration times. To simplify calculations, we opt to only use the first 500 years of integration in every model. After that, we interpolate the variables onto identical grids with a resolution of 2.5° × 2.5° by utilizing the bilinear interpolation method. All anomalies are calculated by first removing the monthly climatology mean.

Table 1.
List of models from CMIP5 analyzed in this study. All the datasets are available online at https://esgf-node.llnl.gov/search/cmip5/ (accessed on 15 December 2022).
Typically, assimilation experiments require real observational data. However, the pi-control model outputs do not directly correspond to real observations. Therefore, we opt to use the idea of OSSE (observing system simulation experiment), which involves fabricating observations using model data. We divided the 500-year model integration into 500 one-year intervals and selected a typical EP- or CP-El Niño year from January to December as the truth run. To identify the EP- and CP-El Niño events, we employ the method developed by Kug et al. [35]. This method involves calculating the SSTA over the Niño3 and Niño4 areas. An El Niño event is confirmed to have occurred when at least one of the two SSTAs exceeds 0.5 °C during the boreal winter (November, December, and January of the following year). When the SSTA in the Niño3 region is higher than in the Niño4 region, it is classified as an EP-El Niño. Conversely, when the SSTA in the Niño4 region is greater than in the Niño3 region, it is classified as a CP-El Niño. Once the truth run is selected, a normal-distributed observation error is added to create the “observation”. In addition, each one-year period, derived by breaking down the 500-year integration, can be regarded as a “prediction” for the “observation” with a 12-month lead time. 500 one-year segments forming a prediction ensemble for these specific EP- or CP-El Niño events.
To assimilate observation into our prediction ensemble, we utilize the Particle Filter (PF) method, referring to Kramer and Dijkstra [36], Hou, Tang, Duan and Shen [31], and Jiang et al. [37]. The core of this assimilation method is to adjust the weights of each ensemble member based on observational data. Therefore, this assimilation method is useful for both real assimilation systems using dynamical models and offline assimilation experiments where fabricated observations and predictions are used, as we demonstrated above. The mathematical expression for this method is presented below. The prediction ensemble provides a Monte Carlo sample, which can be expressed in the following manner:
The symbol represent the delta function, which has a value of zero everywhere except at the zero point. Furthermore, the integral over the entire domain of the function is equal to 1. The probability density function (PDF) of the state vector, represented by , is depicted as several “particles”, i.e., ensemble members, ( = 1, 2, …, N). is the weight of each particle. Initially (, the value of for each particle is the same and equals to 1/N. Afterwards, the weights are updated following the Bayes theory using sequential importance sampling (SIS) based on discrete observations, denoted as , at the time . After assimilation, the posterior conditional PDF of the new ensemble is expressed as follows:
Utilizing Equations (1) and (2), the weight at can be obtained, which is
In Equation (3), is the PDF of the observations given the model state . The PDF of the observation, denoted by , is a normalization factor that guarantees the weight sum equals one. Furthermore, is directly connected to the probability distribution of observation error. Assuming that the observation error follows a multivariate normal distribution with a covariance matrix of , then
The observation operator, denoted by , can be computed by selecting the corresponding model equivalents from the state vector. Therefore, the weight updates when assimilating observational data at one grid, according to Equation (4). Considering that our goal is to assimilate observation data from grid points at once. To accomplish this, the weight changes as follows:
However, once observations at are assimilated, the weight may end up being concentrated on only a few particles, resulting in what is known as particle degeneracy. An ensemble that is highly degenerate and only has a few particles with large weights cannot accurately predict Niño3 or Niño4 SSTA. To prevent degeneracy, a straightforward solution is to perform resampling. In our research, performing resampling involves copying particles with high weight and discarding those with low weight. Moreover, choosing the appropriate magnitude of the error covariance is another important factor in avoiding degeneracy. After conducting experiments, we set the observation error to 0.7 , where represents the variance of ocean temperature.
Another question is how to choose specific assimilation grid points. Hou et al. (2019) identified four ocean temperature initial error patterns that can cause seasonal PB and significantly impact the accuracy of El Niño predictions. They demonstrated that there are two distinct types of initial errors that result in significant summer PB in CP-El Niño predictions: CP-type-1 and CP-type-2 errors. Similarly, there are two initial error patterns that cause large spring PB in EP-El Niño predictions, referred to as EP-type-1 and EP-type-2 errors. The CP-type-1 errors and EP-type-1 errors are similar, both containing three parts of aggregated errors that result in larger negative prediction errors for El Niño predictions in boreal winter. Two of the aggregated error parts are negative, located in the lower levels of the western equatorial Pacific and the upper levels of the southeastern Pacific. The other is a positive initial error center located in the upper levels of the North Pacific. The CP-type-2 errors are mainly found in the VM area of the North Pacific. EP-type-2 errors have a similar spatial structure as EP-type-1 errors but with opposite signs. Based on their research, the sensitive areas or target areas for better prediction of two types of El Niño are the lower layers of the western equatorial Pacific (10° S–10° N, 130° E–150° W, 105–155 m), the upper levels of the northern Pacific (20° N–65° N, 170° E–100° W, 0–95 m), and the southeastern Pacific (40° S–20° S, 150° W–90° W, 0–60 m). Then the specific assimilation points in different areas can be chosen based on error values in different models and initial error patterns. Specifically, to choose the target observation grids for CP-and EP-El Niño prediction in the western equatorial Pacific, the first 10 grid points with the smallest CP-type-1 and EP-type-1 initial error values in the western Pacific subsurface section in each model are selected as the assimilation points, respectively. The assimilation points in the southern Pacific are chosen in the same way. The points for assimilation in the northern Pacific are chosen based on the ranking of CP-type-2 and EP-type-2 initial errors using the same method. The final assimilation grid points for each model and each El Niño type are shown in Figure 1.
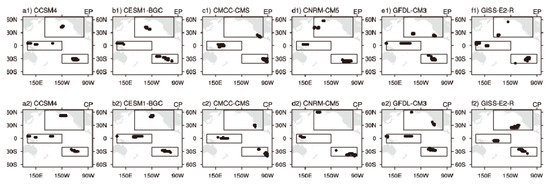
Figure 1.
Grids used to do assimilation experiments for EP-El Niño events (a1–f1) and CP-El Niño events (a2–f2) in (a) CCSM4, (b) CESM1-BGC, (c) CMCC-CMS, (d) CNRM-CM5, (e) GFDL-CM3, (f) GISS-E2-R.
The assimilation experiments are conducted in the following steps: For consistency with Hou et al. (2019), 13 typical EP(CP)-El Niño events from each model are selected and denoted as 13 one-year “observations” after adding observation errors to them from January to December. From January to March, the ocean temperature at various target areas’ assimilation points is assimilated by using the PF method. As introduced previously, the PF assimilation method basically changes the weights of the ensemble members. Therefore, the predicted ensemble members for April to December can be derived by using the new weights. In this way, predictions with lead times of 1–9 months are obtained. Afterward, the new assimilated ensembles are evaluated by being compared to the original ensemble. In addition, assimilation experiments by assimilating observations in multiple areas at once are conducted to explore the synergistic effect of different target areas on El Niño predictions. The experiment groups are specifically described in Table 2.
Table 2.
Description of the assimilation experiments based on the particle filter.
The assimilation experiments in this study are designed with two intentions: first, to verify that the El Niño prediction can be improved by assimilating observation data in the target areas; and second, to further investigate the joint effect of assimilating observation data in multiple areas on the El Niño prediction.
3. Results
3.1. Effect of Different Sensitive Areas on CP-El Niño Predictions
As previously illustrated, the original CP-El Niño prediction ensemble was composed by selecting all 500 one-year periods. The new ensemble is derived by assimilating observation data in different sensitive areas and then assessing it from different aspects. The aim is to explore to what extent the CP-El Niño prediction can improve by assimilating observations from different sensitive areas.
To evaluate if the assimilated ensembles can predict El Niño-like SSTA patterns during boreal winter, we start by assessing the tropical SSTA spatial patterns in December for all prediction cases. Figure 2 displays the spatial pattern of SSTA in the Tropical Pacific for different CP-El Niño observations (a1–a13) and predictions (b–h) obtained from the CCSM4 model. Rows b–h correspond to the results of the six assimilation experiments described in Table 2. In addition, the anomaly correlation coefficient (ACC) is calculated through a comparison of the spatial SSTA between the prediction and observation. The larger the ACC, the better the prediction. The origin ensemble, consisting of 500 one-year ensemble members, can only provide a climatology prediction. In this case, the prediction skill of the new ensemble improves after assimilation if its spatial ACC turns positive. When analyzing the results of assimilating ocean temperature data from only one sensitive area (Figure 2b–d), it is discovered that assimilating observation data from the western tropical Pacific subsurface has the greatest impact on improving the prediction accuracy for the CCSM4 model. 11 out of 13 predictions can predict an El Niño-like SSTA pattern. Assimilation of observational data from the South Pacific and North Pacific can also improve prediction skills in more than half of all cases. Each group’s average ACC is calculated, and the highest result is found in the tropical Pacific, while the lowest is in the North Pacific. Therefore, the accuracy of the ocean temperature in the western subsurface of the tropical Pacific is more important to El Niño predictions compared to the South and North Pacific in terms of improving the spatial SST pattern in December. When observation data from multiple sensitive areas is assimilated, the new ensemble improves more significantly than when only one sensitive area is assimilated. For the CCSM4 model, assimilating ocean temperature from all three sensitive areas can greatly improve the CP-El Niño prediction skills. The best result of assimilating observations from two sensitive areas is that of the tropical Pacific and the southeastern Pacific.
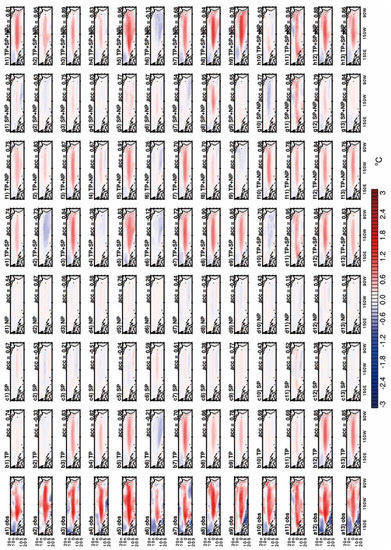
Figure 2.
The observation field of the SSTA (units:°C) in December consisted of 13 observations of CP-El Niño events (a1–a13) and the predictions (b–h) aiming at these 13 CP-El Niño events. (b–h) rows are spatial SSTA fields of the ensemble mean predictions after assimilating different sensitive areas described in Table 2. Different columns correspond to different CP-El Niño events. The number with the word “acc =” above each plot represents the spatial correlation coefficients between the observation and prediction ensemble mean. This result is obtained from the CCSM4 model.
However, it was found that the results are dependent on different models. To show the prediction skills of all models, the Taylor diagram is used. As shown in Figure 3, most of the assimilated prediction cases fall on the right half of the semicircle, indicating that most of the predictions for December have significantly improved their forecasting ability for the SSTA spatial structure in the tropical Pacific, with a lead time of 9 months in all models. By comparing the distances between different solid color points and the “REF” point, it can be found that the effect of assimilating three sensitive areas is better than that of assimilating two sensitive areas and even better than that of assimilating a single sensitive area. In addition, the average outcomes of all the model cases are calculated to make comparisons between the results of different assimilation experiments more effective. We first calculate the ACC and root mean square error (RMSE) for each prediction based on the SSTA pattern in the tropical Pacific in December. Then we compare the results of the predictions before and after assimilation to calculate the ACC improvement and the RMSE decrease for each assimilation case. The prediction before assimilation is a climatology prediction. The ratio of the RMSE decrease is obtained by dividing the decrease of the RMSE after assimilation by the RMSE before assimilation. We then conduct average calculations for all model cases to get average results for different assimilation experiment groups. The higher the ACC improvement and RMSE decrease ratios, the greater the improvement in our predictions. It is shown in Table 3 that assimilating multiple areas has better results than assimilating only one sensitive area. Assimilation of all three sensitive areas has the best results, reducing the RMSE by 38.841%. In addition, by comparing the results of assimilating data from two sensitive areas, the results of each model are different. It is worth noting that when assimilating only the North Pacific Ocean data, the prediction skills of most models are not significantly improved. However, when assimilating data from the North Pacific and one of the other two targeted areas, the prediction skill can be significantly improved.
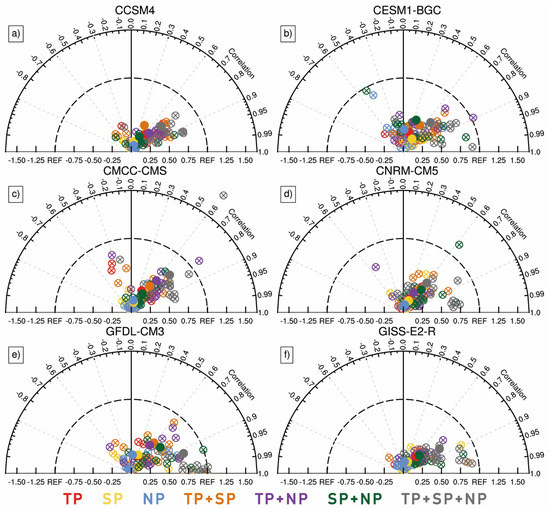
Figure 3.
Taylor diagram of the prediction results of SSTA spatial pattern in the tropical Pacific in December for 13 CP-El Niño events in different assimilation experimental groups for (a) CCSM4, (b) CESM1-BGC, (c) CMCC-CMS, (d) CNRM-CM5, (e) GFDL-CM3, and (f) GISS-E2-R. Different colors of dots in the figure represent different assimilation test groups. Hollow dots represent the results of different CP-El Niño prediction cases, and solid dots indicate the average of 13 CP-El Niño predictions.
Table 3.
The average ACC improvement (units: 1) and the average ratio of the RMSE decrease (units: %) for different assimilation experiments. ACC and RMSE are calculated based on CP-El Niño observation and prediction of the SSTA pattern in the tropical Pacific (20° S–20° N, 120° E–70° W) in December.
When evaluating the ENSO predictions, it is also important to assess the prediction skill of the Niño indexes. The flavor of the El Niño events is distinguished using the Niño3 and Niño4 indexes. Therefore, the Niño3 and Niño4 indexes in December are evaluated in all prediction cases. We count the number of ensembles that can predict an El Niño event and correctly identify its type. Here, we use loose criteria. An El Niño event is confirmed to have occurred when at least one of the two Niño indexes exceeds 0.5 °C in December. If the Niño3 index is greater than the Niño4 index, it is classified as an EP-El Niño. Otherwise, it is classified as a CP-El Niño. The result indicates that even though the tropical SSTA pattern becomes more accurate with the assimilation of ocean temperature observations from one or two specific areas, the ensembles still fail to make accurate predictions of the Niño index. Ensembles that assimilate data from only one sensitive area are not accurate in predicting the intensity of warming SSTA in both Niño3 and Niño4 areas, thus failing to predict the occurrence of El Niño events. As for the results of assimilating data from two sensitive areas, the ensemble group of TP + SP can predict 11 El Niño events out of all 78 cases; the ensemble group of TP + NP predicts 9 events; and the ensemble group of SP + NP predicts 5 events. Although these ensembles can detect the occurrence of El Niño, they struggle to accurately distinguish the type of El Niño. While 30 out of 78 ensembles predict El Niño events and 16 ensembles predict CP-El Niño events when assimilating data from all three targeted areas.
3.2. Effect of Different Sensitive Areas on EP-El Niño Predictions
The spatial pattern of the SSTA in the tropical area during December from the EP-El Niño assimilation experiments is evaluated (Figure 4), similar to the evaluation of CP-El Niño assimilation experiments. From CCSM, the improvement of the EP-El Niño spatial pattern is the most significant in the TP + SP + NP experiment group. When only assimilating one targeted area using CCSM4, the case of assimilating the observation in the tropical Pacific and the observation in the north Pacific can better simulate the intensity of SSTA warming in the tropical Pacific, while the SSTA warming predicted by assimilating the observation in the south Pacific alone is weak. Specifically, 11 out of 13 predictions for December in the SP experiment group can predict a warm phase in the tropical central-eastern Pacific. Furthermore, there are 8 and 10 in the TP and NP experiment groups, individually. When the observation in multiple sensitive areas is assimilated, the predicted intensity of SSTA warming in the tropical Pacific is closer to the observation than that of a single sensitive area. Moreover, compared with assimilating single or two sensitive area target observations, assimilating three sensitive area target observations has the best effect on improving prediction skills.
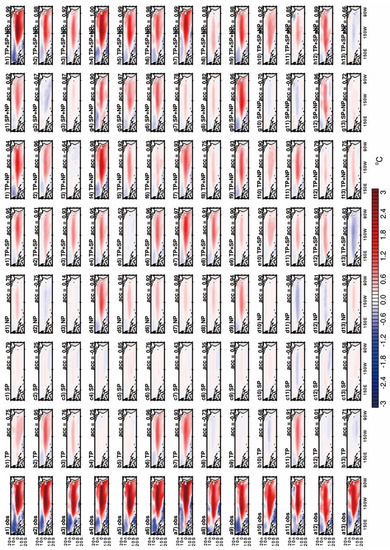
Figure 4.
As in Figure 2, but for the results of the EP-El Niño ensembles. (a) row contains the spatial SSTA fields of the observations of 13 EP-El Niño events. (b–h) rows are spatial SSTA fields of the ensemble mean predictions after assimilating different sensitive areas described in Table 2. Different columns correspond to different EP-El Niño events.
However, when evaluating the different results of the experiments in different models, the rank of the improvement of the EP-El Niño prediction in different experiment groups is different, as shown in the Taylor diagram (Figure 5). Specifically, the NP experiment group provides the most accurate EP-El Niño prediction in the CCSM4 and CESM1-BGC models. For the CMCC-CMS and CNRM-CM5 models, the TP experiment group yields the best prediction, while the SP experiment group produces the best results for the GFDL-CM3 and GISS-E2-R models. Comparing the results of the CP-El Niño assimilation experiment, some models are more sensitive to the initial states of the North Pacific and the South Pacific. Especially, the prediction of CP-El Niño events is not obviously improved by assimilating the target observation in the sensitive area of the North Pacific alone, but the prediction of EP-El Niño is improved in four models (CCSM4, CESM1-BGC, CMCC-CMS, and GFDL-CM3). In addition, though the results are to some extent case- and model-dependent, the prediction skills for the SSTA pattern in December of most cases are improved after assimilation. Based on the average result of the ACC improvement and RMSE decrease ratio, it is evident that the initial accuracy of the south and north sensitive areas plays a more significant role in predicting EP-El Niño compared to CP-El Niño. Therefore, it indicates that the accuracy of the initial ocean temperature state in both extra-tropical and tropical areas is crucial for EP-El Niño prediction.
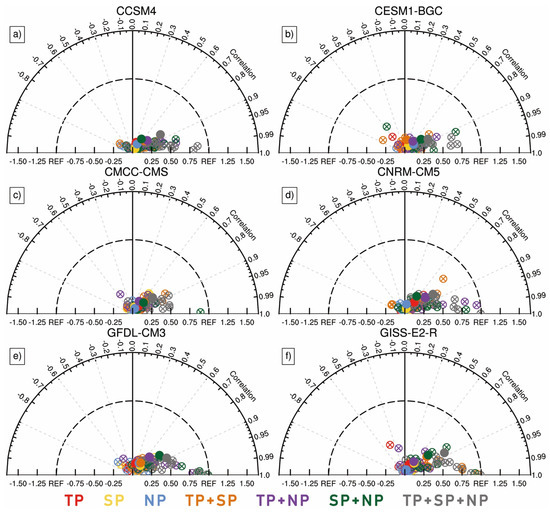
Figure 5.
As in Figure 3, but for the results of the EP-El Niño prediction ensembles. Different subfigures represent different results from (a) CCSM4, (b) CESM1-BGC, (c) CMCC-CMS, (d) CNRM-CM5, (e) GFDL-CM3, and (f) GISS-E2-R.
The prediction skill of the Niño index is also evaluated. Assimilating all three sensitive areas, 49 out of 78 ensembles can predict the occurrence of El Niño events, and most of them can predict the right type of El Niño. Compared with the results from the CP-El Niño experiment, it seems that models have the tendency to predict an EP-El Niño rather than a CP-El Niño even though the initial errors are removed. Furthermore, all experiment groups can provide more El Niño predictions than the experiment groups of CP-El Niño. It indicates that model development is still essential in order to predict the right type of El Niño events, especially for CP-El Niño events.
4. Implications for El Niño Predictions
The previous sections evaluated the prediction skills of different assimilation cases. In both EP- and CP-El Niño prediction cases, assimilating observations in all sensitive areas led to the most accurate El Niño predictions among all the cases, with a lead time of 9 months. In addition, assimilating observations from two target areas provides more accurate predictions compared to only assimilating observations from one target area. However, differences can also be found between the results of the two types of El Niño prediction cases by comparing Table 3 to Table 4.
Table 4.
As in Table 3, but for the result of the EP-El Niño predictions.
Based on the results of assimilating observations only from one sensitive area, the tropical western lower layers of the Pacific Ocean have a greater impact on the accuracy of CP-El Niño predictions than the other two sensitive areas. However, all three sensitive areas are crucial for predicting EP-El Niño. The initial accuracy of the South Pacific is more crucial for improving ACC in EP-El Niño prediction cases, while that of the tropical western Pacific is more important for decreasing RMSE. According to the results of assimilating observations from two sensitive areas, assimilating observations from the South Pacific and North Pacific can provide more accurate spatial SSTA patterns, as the ACC improvement is the largest for both CP- and EP-El Niño cases. It implies that the influence of these two areas is more independent of each other on the improvement of El Niño predictions. Therefore, reducing the initial error in these two areas in the spring can provide additional insights for predicting the two types of El Niño in December. By contrast, the state of the western tropical Pacific ocean temperature may be more related to that of the South Pacific or the North Pacific. In terms of assimilating observations from all sensitive areas, the improvement in EP-El Niño predictions is larger than that in CP-El Niño predictions. It indicates that these current advanced models are more effective in predicting EP-El Niño than CP-El Niño, even with assimilation. This can be attributed to the worse simulations for CP-El Niño events in these models.
Therefore, the initial ocean temperature accuracy in the tropical western lower layers near the thermocline is crucial for CP-El Niño predictions, in terms of both intensity and structure, and for EP-El Niño predictions, in terms of intensity. The initial ocean temperature accuracy in the south and north key areas is important for the prediction of the spatial pattern of SSTA in EP-El Niño predictions. Though Hou et al. (2019) indicate that the initial error in the North Pacific is a key factor that harms the prediction of CP-El Niño events, the prediction skill of CP-El Niño is not effectively enhanced by only assimilating the observations from the North Pacific Ocean. However, by assimilating data from the North Pacific and one of the other two key areas, the accuracy of CP-El Niño prediction can be greatly enhanced. This is consistent with Hou, Tang, Duan and Shen [31] and Fan et al. [38], who demonstrated that the tropical Pacific Ocean is always very important for the formation and prediction of El Niños, while the North Pacific can help to adjust the spatial SST patterns. For the South Pacific, it is important both for CP- and EP-El Niño predictions. And when it is assimilated with the North Pacific simultaneously, the prediction of El Niño can be effectively enhanced. It implies that the two areas of the extratropical Pacific can affect El Niño predictions in different ways with less interdependence.
5. Conclusions
This study expands on research conducted by Hou et al. (2019) that identified sensitive areas for two types of El Niño predictions through a data analysis method. It is indicated by Hou et al. (2019) that the lower layer of the western equatorial Pacific, the south Pacific covering the SPMM area, and the north Pacific covering the VM area are all important to improve two types of El Niño predictions. However, Hou et al. (2019) did not explore to what extent the predictions of the El Niño events improve by assimilating observation data from these three areas.
In this paper, we assimilated ocean temperature from different sensitive areas for ENSO predictions to explore to what extent the El Niño predictions can be improved by assimilating data from these areas and which sensitive area can most effectively improve El Niño predictions. The assimilation experiments are conducted using the PF method and ocean temperature data from CMIP5 pi-control outputs.
The results of CP-El Niño predictions indicate that the lower layer of the western tropical Pacific is the most sensitive area, and the south Pacific covering SPMM is the second sensitive area to improve CP-El Niño events. Moreover, if the ensemble sample is diverse enough, assimilating two sensitive areas gets better predictions than assimilating only one sensitive area. Furthermore, assimilating all three sensitive areas offers the best result. As for the results of EP-El Niño predictions, all three sensitive areas are crucial. The south and north Pacific ocean temperature states are important for the prediction of tropical spatial SSTA patterns, and the tropical western Pacific ocean temperature states are important for RMSE decreasing predictions. Moreover, assimilating observations from the south and north Pacific is the most helpful for improving ACC in both EP- and CP-El Niño predictions compared with assimilating observations from the other two areas’ choices. It indicates that the impact of the initial ocean temperature accuracy in the SPMM-like region and the VM-like region is less interdependent in enhancing El Niño predictions.
In this paper, we utilize the simple PF assimilation method. The assimilation process by using offline model data is kind of similar to analog data assimilation [39,40], which is both efficient and time-saving. However, as demonstrated in many studies, the big drawback of this method is that it cannot be used in high-dimensional situations due to particle degeneration [41,42,43]. In this study, we only assimilate data from no more than 30 points simultaneously. Therefore, it is still a huge challenge to improve the PF assimilation method. Furthermore, the study can only focus on the initial error. Whereas in the real-time predictions, the model errors also have a large influence on the ENSO predictions. Therefore, further experiments should be carried out in a coupled model where other better assimilation methods can be used. The question of how much the accuracy of prediction can be enhanced by assimilation data from sensitive areas when including model error needs to be addressed.
Author Contributions
Conceptualization, W.D. and M.H.; methodology, W.D.; software, M.H.; validation, M.H., W.D. and X.Z.; formal analysis, M.H.; data curation, M.H.; writing—original draft preparation, M.H.; writing—review and editing, W.D. and X.Z.; visualization, M.H.; supervision, W.D. and X.Z.; project administration, W.D.; funding acquisition, M.H. All authors have read and agreed to the published version of the manuscript.
Funding
The funding for this study is provided by the National Natural Science Foundation of China under Grant No. 42106004.
Institutional Review Board Statement
Not applicable.
Informed Consent Statement
Not applicable.
Data Availability Statement
The datasets utilized in this study are available online (https://esgf-node.llnl.gov/search/cmip5/, accessed on 15 December 2022) through the Climate Model Intercomparison Project (CMIP).
Acknowledgments
The authors thanked the three anonymous reviewers for their helpful feedback, which significantly enhanced the overall quality of the paper. The NCAR Command Language (version 6.4.0, http://dx.doi.org/10.5065/D6WD3XH5, accessed on 23 August 2020) was used to generate all figures in this study.
Conflicts of Interest
The authors declare no conflict of interest.
References
- Ashok, K.; Behera, S.K.; Rao, S.A.; Weng, H.; Yamagata, T. El Niño Modoki and its possible teleconnection. J. Geophys. Res. Oceans 2007, 112, C11007. [Google Scholar] [CrossRef]
- Barnston, A.G.; Tippett, M.K.; L’Heureux, M.L.; Li, S.; Dewitt, D.G. Skill of Real-Time Seasonal ENSO Model Predictions during 2002-11: Is Our Capability Increasing? Bull. Am. Meteorol. Soc. 2012, 93, 631–651. [Google Scholar] [CrossRef]
- Bellenger, H.; Guilyardi, E.; Leloup, J.; Lengaigne, M.; Vialard, J. ENSO representation in climate models: From CMIP3 to CMIP5. Clim. Dynam. 2014, 42, 1999–2018. [Google Scholar] [CrossRef]
- Bjerknes, J. Atmospheric Teleconnections from the Equatorial Pacific. Mon. Weather Rev. 1969, 97, 163–172. [Google Scholar] [CrossRef]
- Chen, D.K.; Zebiak, S.E.; Busalacchi, A.J.; Cane, M.A. An Improved Procedure for EI Niño Forecasting: Implications for Predictability. Science 1995, 269, 1699–1702. [Google Scholar] [CrossRef]
- Chen, D.K.; Cane, M.A.; Kaplan, A.; Zebiak, S.E.; Huang, D. Predictability of El Niño over the past 148 years. Nature 2004, 428, 733–736. [Google Scholar] [CrossRef]
- Ding, H.; Newman, M.; Alexander, M.; Wittenberg, A. Skillful Climate Forecasts of the Tropical Indo-Pacific Ocean Using Model-Analogs. J. Clim. 2018, 31, 5437–5459. [Google Scholar] [CrossRef]
- Duan, W.S.; Wei, C. The ‘spring predictability barrier’ for ENSO predictions and its possible mechanism: Results from a fully coupled model. Int. J. Climatol. 2012, 33, 1280–1292. [Google Scholar] [CrossRef]
- Duan, W.S.; Liu, X.C.; Zhu, K.Y.; Mu, M. Exploring the initial errors that cause a significant “spring predictability barrier” for El Niño events. J. Geophys. Res. Oceans 2009, 114, C04022. [Google Scholar] [CrossRef]
- Fan, H.; Yang, S.; Wang, C.; Lin, S. Revisiting Impacts of Tropical Pacific SST Anomalies on Pacific Meridional Mode during the Decay of Strong Eastern Pacific El Niño Events. J. Clim. 2023, 1, 1–34. [Google Scholar] [CrossRef]
- Fan, H.J.; Huang, B.H.; Yang, S.; Dong, W.J. Influence of Pacific Meridional Mode on ENSO evolution and predictability: Asymmetric modulation and ocean preconditioning. J. Clim. 2020, 34, 1881–1901. [Google Scholar] [CrossRef]
- Hou, M.; Tang, Y. Recent progress in simulating two types of ENSO -from CMIP5 to CMIP6. Front. Mar. Sci. 2022, 9, 986780. [Google Scholar] [CrossRef]
- Hou, M.; Tang, Y.; Duan, W.; Shen, Z. Toward an optimal observational array for improving two flavors of El Niño predictions in the whole Pacific. Clim. Dynam. 2022, 60, 831–850. [Google Scholar] [CrossRef]
- Hou, M.Y.; Duan, W.S.; Zhi, X.F. Season-dependent predictability barrier for two types of El Niño revealed by an approach to data analysis for predictability. Clim. Dynam. 2019, 53, 5561–5581. [Google Scholar] [CrossRef]
- Jeong, H.-I.; Lee, D.Y.; Ashok, K.; Ahn, J.-B.; Lee, J.-Y.; Luo, J.-J.; Schemm, J.-K.E.; Hendon, H.H.; Braganza, K.; Ham, Y.-G. Assessment of the APCC coupled MME suite in predicting the distinctive climate impacts of two flavors of ENSO during boreal winter. Clim. Dynam. 2012, 39, 475–493. [Google Scholar] [CrossRef]
- Jiang, L.; Duan, W.; Wang, H.; Liu, H.; Tao, L. Evaluation of the sensitivity on mesoscale eddy associated with the sea surface height anomaly forecasting in the Kuroshio Extension. Front. Mar. Sci. 2023, 10, 1097209. [Google Scholar] [CrossRef]
- Kao, H.Y.; Yu, J.Y. Contrasting Eastern-Pacific and Central-Pacific Types of ENSO. J. Clim. 2009, 22, 615–632. [Google Scholar] [CrossRef]
- Kim, S.T.; Yu, J.Y. The two types of ENSO in CMIP5 models. Geophys. Res. Lett. 2012, 39, 221–228. [Google Scholar] [CrossRef]
- Kramer, W.; Dijkstra, H.A. Optimal localized observations for advancing beyond the ENSO predictability barrier. Nonlinear Proc. Geoph. 2013, 20, 221–230. [Google Scholar] [CrossRef]
- Kug, J.S.; Jin, F.F.; An, S.I. Two types of El Niño events: Cold tongue El Niño and warm pool El Niño. J. Clim. 2009, 22, 1499–1515. [Google Scholar] [CrossRef]
- Kug, J.S.; Choi, J.; An, S.I.; Jin, F.F.; Wittenberg, A.T. Warm pool and cold tongue El Niño events as simulated by the GFDL CM2.1 coupled GCM. J. Clim. 2010, 23, 1226–1239. [Google Scholar] [CrossRef]
- Lguensat, R.; Tandeo, P.; Ailliot, P.; Pulido, M.; Fablet, R. The Analog Data Assimilation. Mon. Weather Rev. 2017, 145, 4093–4107. [Google Scholar] [CrossRef]
- Liu, T.; Song, X.; Tang, Y. The predictability study of the two flavors of ENSO in the CESM model from 1881 to 2017. Clim. Dynam. 2022, 59, 3343–3358. [Google Scholar] [CrossRef]
- Lorenz, E. The Physical Bases of Climate and climate Modelling. Clim. Predict. 1975, 16, 132–136. [Google Scholar]
- Moore, A.M.; Kleeman, R. The dynamics of error growth and predictability in a coupled model of ENSO. Q. J. R. Meteorol. Soc. 1996, 122, 1405–1446. [Google Scholar] [CrossRef]
- Mu, M.; Xu, H.; Duan, W.S. A kind of initial errors related to “spring predictability barrier” for El Niño events in Zebiak-Cane model. Geophys. Res. Lett. 2007, 34, L03709. [Google Scholar] [CrossRef]
- Mu, M.; Duan, W.S.; Chen, D.K.; Yu, W.D. Target observations for improving initialization of high-impact ocean-atmospheric environmental events forecasting. Natl. Sci. Rev. 2015, 2, 226–236. [Google Scholar] [CrossRef]
- Philander, S.G.H. El Niño Southern Oscillation phenomena. Nature 1983, 302, 295–301. [Google Scholar] [CrossRef]
- Qi, Q.; Duan, W.; Xu, H. The most sensitive initial error modes modulating intensities of CP- and EP-El Niño events. Dynam. Atmos. Oceans 2021, 96, 101257. [Google Scholar] [CrossRef]
- Ren, H.-L.; Scaife, A.A.; Dunstone, N.; Tian, B.; Liu, Y.; Ineson, S.; Lee, J.-Y.; Smith, D.; Liu, C.; Thompson, V.; et al. Seasonal predictability of winter ENSO types in operational dynamical model predictions. Clim. Dynam. 2018, 52, 3869–3890. [Google Scholar] [CrossRef]
- Robinson, G.; Grooms, I.; Kleiber, W. Improving Particle Filter Performance by Smoothing Observations. Mon. Weather. Rev. 2018, 146, 2433–2446. [Google Scholar] [CrossRef]
- Shen, Z.Q.; Tang, Y.M.; Li, X.J. A new formulation of vector weights in localized particle filter. Q. J. R. Meteorol. Soc. 2017, 143, 3269–3278. [Google Scholar] [CrossRef]
- Takahashi, K.; Montecinos, A.; Goubanova, K.; Dewitte, B. ENSO regimes: Reinterpreting the canonical and Modoki El Niño. Geophys. Res. Lett. 2011, 38, L10704. [Google Scholar] [CrossRef]
- Tang, Y.; Zhang, R.-H.; Liu, T.; Duan, W.; Yang, D.; Zheng, F.; Ren, H.; Lian, T.; Gao, C.; Chen, D.; et al. Progress in ENSO prediction and predictability study. Natl. Sci. Rev. 2018, 5, 826–839. [Google Scholar] [CrossRef]
- Tao, L.J.; Gao, C.; Zhang, R.H. ENSO Predictions in an Intermediate Coupled Model Influenced by Removing Initial Condition Errors in Sensitive Areas: A Target Observation Perspective. Adv. Atmos. Sci. 2018, 35, 853–867. [Google Scholar] [CrossRef]
- Van Leeuwen, P.J. Particle Filtering in Geophysical Systems. Mon. Weather Rev. 2009, 137, 4089–4114. [Google Scholar] [CrossRef]
- Wang, L.; Ren, H.; Zhu, J.; Huang, B. Improving prediction of two ENSO types using a multi-model ensemble based on stepwise pattern projection model. Clim. Dynam. 2020, 54, 3229–3243. [Google Scholar] [CrossRef]
- Webster, P.J.; Yang, S. Monsoon and Enso: Selectively Interactive Systems. Q. J. R. Meteorol. Soc. 1992, 118, 877–926. [Google Scholar] [CrossRef]
- Wu, L.; Zhang, H.J.; Chen, J.-M.; Feng, T. Impact of Two Types of El Niño on Tropical Cyclones over the Western North Pacific: Sensitivity to Location and Intensity of Pacific Warming. J. Clim. 2018, 31, 1725–1742. [Google Scholar] [CrossRef]
- Yang, X.; Huang, P.; Hu, P.; Wang, Z. Distinct Impacts of Two Types of summer ENSO with Different Temporal Evolutions on the Asian Summer Monsoon: Role of the Tropical Indo-western Pacific. J. Clim. 2023, 36, 3917–3936. [Google Scholar] [CrossRef]
- Yu, J.-Y.; Wang, X.; Yang, S.; Paek, H.; Chen, M. The Changing El Niño-Southern Oscillation and Associated Climate Extremes: Patterns and Mechanisms; John Wiley & Sons, Inc.: Hoboken, NJ, USA, 2017; pp. 1–38. [Google Scholar]
- Zhang, J.; Duan, W.S.; Zhi, X.F. Using CMIP5 model outputs to investigate the initial errors that cause the “spring predictability barrier” for El Niño events. Sci. China Earth Sci. 2015, 58, 685–696. [Google Scholar] [CrossRef]
- Zheng, F.; Yu, J.-Y. Contrasting the skills and biases of deterministic predictions for the two types of El Niño. Adv. Atmos. Sci. 2017, 34, 1395–1403. [Google Scholar] [CrossRef]
Disclaimer/Publisher’s Note: The statements, opinions and data contained in all publications are solely those of the individual author(s) and contributor(s) and not of MDPI and/or the editor(s). MDPI and/or the editor(s) disclaim responsibility for any injury to people or property resulting from any ideas, methods, instructions or products referred to in the content. |
© 2023 by the authors. Licensee MDPI, Basel, Switzerland. This article is an open access article distributed under the terms and conditions of the Creative Commons Attribution (CC BY) license (https://creativecommons.org/licenses/by/4.0/).