Article

Berth Allocation Considering Multiple Quays: A Practical Approach Using Cuckoo Search Optimization

by
Sheraz Aslam
,
Michalis P. Michaelides
and
Herodotos Herodotou
*
Department of Electrical Engineering, Computer Engineering and Informatics, Cyprus University of Technology, Limassol 3036, Cyprus
*
Author to whom correspondence should be addressed.
J. Mar. Sci. Eng. 2023, 11(7), 1280; https://doi.org/10.3390/jmse11071280
Submission received: 11 May 2023 / Revised: 21 June 2023 / Accepted: 22 June 2023 / Published: 24 June 2023
(This article belongs to the Special Issue Freight Transportation in Ports and Harbors)

Abstract

:
Maritime container terminals (MCTs) play a fundamental role in international maritime trade, handling inbound, outbound, and transshipped containers. The increasing number of ships and containers creates several challenges to MCTs, such as congestion, long waiting times before ships dock, delayed departures, and high service costs. The berth allocation problem (BAP) concerns allocating berthing positions to arriving ships to reduce total service cost, waiting times, and delays in vessels’ departures. In this work, we extend the study of continuous BAP, which considers a single quay (straight line) for berthing ships, to multiple quays, as found in many ports around the globe. Multi-Quay BAP (MQ-BAP) adds the additional dimension of assigning a preferred quay to each arriving ship, rather than just specifying the berthing position and time. In this study, we address MQ-BAP with the objective of minimizing the total service cost, which includes minimizing the waiting times and delays in the departure of ships. MQ-BAP is first formulated as a mixed-integer linear problem and then solved using the cuckoo search algorithm (CSA), a computational intelligence (CI)-based approach. In addition, the exact mixed-integer linear programming (MILP) method, two other state-of-the-art metaheuristic approaches, namely the genetic algorithm (GA) and particle swarm optimization (PSO), as well as a first come first serve (FCFS) approach, are also implemented for comparison purposes. Several experiments are conducted using both randomly generated and real data from the Port of Limassol, Cyprus, which has five quays serving commercial vessel traffic. The comparative analysis and experimental results show that the CSA-based method achieves the best overall results in affordable time as compared to the other CI-based methods, for all considered scenarios.

1. Introduction

Maritime transport accounts for 90% of the world’s seaborne trade and 74% of all goods imported or exported from Europe are carried by ships [1]. According to a recent United Nations Conference on Trade and Development (UNCTAD) report on maritime transport in 2021 [2], total global containerized trade increased by 45.45%, with twenty-foot equivalent units (TEUs) totaling 110 million in 2010 and rising to 160 million TEUs in 2021. The container traffic has also increased in 2021, although it decreased in 2020 compared to 2019 due to the pandemic situation. Maritime container terminals (MCTs) play a crucial role in meeting the growing demand for maritime transport. In order to meet the growing demand for MCTs, their operations need to be optimized using modern technologies and optimization-based approaches. Due to this practical need, the development of novel and efficient methods to optimize terminal operations has attracted considerable attention from academia and industry [3,4,5,6]. In [7], the authors investigate the factors affecting the various waiting times in the port of Limassol, Cyprus, from both quantitative and qualitative perspectives. For the shipping industry, and especially in the context of short sea shipping, the benefits become obvious for all stakeholders involved in the port call process, including shipping companies, port service providers, and ship agents, in terms of providing better information and decision support systems to increase their efficiency and that of the ports [8]. MCT operators must therefore adopt appropriate strategies and approaches to properly utilize port resources and avoid the problems mentioned above.
Port operations in MCTs consist of three fundamental operations, i.e., seaside, landside, and marshalling yard [9]. The seaside operations involve the process of loading and unloading incoming vessels, while the marshalling yard aims to store all incoming containers for further processing (delivery). The landside operations, on the other hand, include activities that link internal (terminal) and external (local) transportation. This study addresses one of the most important decision problems of seaside operations, the berth allocation problem (BAP). In terms of berthing layout, BAP at the MCT can be either discrete, continuous, or hybrid. In discrete BAP, the berthing layout is used to perform loading and unloading operations, with the entire wharf divided into a number of berthing positions, called berths. As for continuous BAP, the arriving vessels can moor anywhere on the quay, typically along numbered positions. The last type, hybrid BAP, combines the characteristics of the previous two layouts, i.e., discrete and continuous. In terms of problem type, BAP can be divided into three types, strategic, tactical, and operational [10]. At the strategic level, decisions can be made in a time frame of one year to several years. This longer time horizon includes decisions such as establishing shared or dedicated berths. At the tactical level, decisions are made on a time horizon that ranges from a week to several months. Some of the aspects that can be dealt with at this level are the allocation of quay cranes with the corresponding work profiles, the tactical shipyard templates, the transshipment flows between vessels, etc. The operational level involves decisions that span from one to several days. Such issues are usually aimed at minimizing berth idle times and container ship arrival and departure delays. This study focuses on the operational aspects of BAP.
Numerous studies deal only with the allocation of berths at a single quay, assuming that it forms one straight line in which vessels can be berthed according to their length and the positions of other vessels. For example, an exact approach to solve SQ-BAP is presented in [11], an evolutionary algorithm in [12], and a metaheuristic-based method in [13]. However, this assumption is not realistic for several ports around the globe, which consist of multiple separate line segments or quays for berthing [14]. For example, the Port of Limassol in Cyprus, has seven continuous berthing quays, as depicted in Figure 1. Considering multiple quays adds a new dimension to the BAP; the problem of assigning vessels to quays in addition to assigning berthing positions and times for each separate quay. This requires a multiple space–time representation, as can be seen in Figure 2.
On the contrary, very few studies propose solutions for the Multi-Quay BAP (MQ-BAP) [14,16,17]. These studies often make some unrealistic assumptions, do not consider practical constraints (like a penalty for non-optimal berthing positions, preferred and alternative berthing quays of each arriving ship, a safety time interval between consecutive vessels entering the port, as well as a safety time and distance between vessels berthed at a particular quay), are limited to solving small scale problems, and cannot provide optimal solutions for medium/large scale problems as elaborated in Section 2. These limitations motivate us to consider a formulation with several practical constraints and to propose a solution that can solve real port problems, which have been ignored in the current literature. Therefore, this paper extends single quay BAP to the case of MQ-BAP, proposing a solution for ports having multiple quays. Real data are used from the Port of Limassol, the largest port in Cyprus, to validate our method. The port has seven continuous quays, out of which five are used for commercial purposes. Some preliminary results from this study appeared in [18] and the unique contributions of this work are as follows:
  • Develop a mixed-integer linear programming (MILP) model for a realistic port environment that considers multiple quays and several practical constraints with the objective of minimizing the total service cost.
  • Propose the cuckoo search algorithm (CSA), a recently developed computational intelligence (CI)-based approach, to solve the problem in affordable computation time, since MQ-BAP is NP-hard and cannot be solved efficiently by exact methods.
  • Validate the performance of the developed method against the exact MILP method and three widely adopted approaches (genetic algorithm, particle swarm optimization, and first come first serve) using both random data as well as real data from the Port of Limassol, Cyprus.
Compared to our preliminary study [18], this work (i) extends the mathematical formulation to consider both continuous and discrete quays; (ii) introduces additional practical constraints, including safety entrance time, safety distance, and safety time between berths; (iii) implements and evaluates first come first serve (FCFS) method along with three popular metaheuristic-based algorithms (i.e., CSA, GA, PSO); and (iv) extends the experimental evaluation using real data from one month of operations at the Port of Limassol, Cyprus.
The remainder of the article is organized as follows. In Section 2, a literature review is provided. Section 3 first discusses the problem definition and then outlines mathematical formulations, as well as the assumptions and constraints of this study. The proposed metaheuristic methods are discussed in Section 4. Section 5 first presents the experimental settings and the datasets used, and then provides a detailed comparative analysis of all implemented methods. Section 6 provides a discussion on managerial insights, while Section 7 concludes the paper.

2. Literature Review

There exist several research studies that deal with different categories of BAP, i.e., discrete, continuous, and hybrid. In this section, we review related work in continuous and dynamic BAP employing metaheuristic/computational intelligence approaches.
The authors of [19] deal with the BAP in order to avoid delays in vessels’ departures. The BAP is formulated in three different ways, i.e., standard MILP, MILP based on sequence variables, and time-indexed variables-based MILP. Subsequently, these three models are solved on a CPLEX solver and simulation results demonstrate that the time-indexed-based MILP achieves higher efficiency with lower computation time. Another study also deals with BAP, while additionally considering uncertainties in the operational time of ships [11]. In particular, an exact approach is developed and K-means clustering is used to model the uncertainty. The proposed method performs well; however, it is only suitable for small data instances.
In [12], an evolutionary algorithm (EA) is proposed to deal with BAP, where the main objective is to reduce the weighted total service cost. In [20], a greedy randomized adaptive search procedure is developed to solve a continuous BAP with the goal of minimizing the total waiting time of moored vessels. They perform several simulations and implement two benchmark methods (exact method and stochastic beam search) to evaluate the performance of the proposed method.
Another work [21] also solves the continuous BAP and proposes a metaheuristic-based solution. The problem is formulated using MILP and solved by GA. They perform experiments on two datasets and the results are compared using the branch and bound method. Another GA-based solution is also developed in [22] for continuous BAP. The fundamental objective of this work is to minimize delays in departure times of ships. Alsoufi et al. develop a hybrid algorithm, which combines the best features of GA and an exact method, i.e., branch and cut, to solve continuous BAP [23]. Their proposed hybrid algorithm retains the efficiency of GA and the accuracy of the exact approach. Results from simulations show that the proposed method provides the berth allocation plan with minimum (or no) delays in departure times. A hybrid heuristic-based genetic algorithm (GA) is developed in [13] to solve the BAP to avoid the issue of high computation time in exact approaches. The authors combine dynamic programming (DP) with the standard GA to solve large-scale problems that minimize service cost [13].
A study presented in [24] proposes a solution for dynamic BAP, where a metaheuristic-based PSO algorithm is developed with the objective of reducing computation time. The authors of [25] deal with BAP, taking into account the uncertainty in handling times of vessels. They develop an optimization method to solve the BAP, combining particle swarm optimization and machine learning. Here, machine learning is used to check the relationship between handling time and weather conditions to model the uncertainty in handling time.
The computation time reduction is considered as an objective while investigating dynamic BAP in [26]. The authors proposed clustering search with simulated annealing to solve the problem in minimum computational time. Another study also deals with continuous BAP and proposes a hybrid simulated annealing (SA) algorithm [27]. In this study, a sequence pair representation is employed to model problem search space into two permutations, and a scenario-based method captures the uncertainty. Eventually, SA is exploited to determine berthing time and berthing position for arriving ships. A study presented in [28] solves a combined BAP and quay crane allocation problem. A generalized set partitioning model is developed to solve the combined problem. The study also discloses several experiments and results to show the effectiveness of the proposed model over benchmark methods.
The authors of [29] also solve continuous BAP by developing a cuckoo search algorithm, a metaheuristic approach, after formulating the problem as a mixed integer linear problem. For comparison purposes, benchmark data (containing 10 to 30 ships) is employed from current literature and benchmark approaches (i.e., GA and exact method) are also implemented. In [30], the authors expand upon their previous study by proposing a new model that includes extra practical constraints, including safety time interval between two ships, penalty for non-optimal berthing positions, and smaller time interval (i.e., 30 min).
All aforementioned studies from the related literature have considered a single continuous quay for solving the BAP. Only a limited number of studies have dealt with the Multi-Quay BAP (MQ-BAP). One study presented in [14] proposes a set of priority rules and using GA to address the MQ-BAP. However, in their problem formulation, the total length of the quay is evenly distributed among the number of quays, while the evaluation is only performed over random data. Another study proposes a solution for MQ-BAP using a set of heuristics based on general variable neighborhood search [16]. Even though this approach is shown to be very efficient in solving this problem, in certain cases it proposes solutions that are far (up to 40%) from the optimal. Another study presented in [17] also proposes a solution for multiple quays using fuzzy logic model. They consider two continuous-type quays for berthing arriving vessels and develop two fuzzy-based models, i.e., fuzzy MILP and fully fuzzy linear programming (FFLP). Based on several experiments, the authors of the study concluded that both proposed models can only solve MQ-BAP (two quays) and provide the optimal solution when considering 10 arriving ships; however, both models produce a non-optimal solution when considering 15–65 ships and they cannot solve a problem in instances of more than 65 ships. Furthermore, there are some studies that consider multiple quays in bulk ports, e.g., a study [31] deals with MQ-BAP in tidal bulk terminals and proposes iterated local search method to solve the problem. Another study [32] also solves MQ-BAP for bulk ports and proposes a heuristic-based rolling horizon strategy to find an optimal solution. Finally, the authors of the current work have also addressed the MQ-BAP with the objective of total service cost minimization in our preliminary study [18], as discussed in Section 1.
The motivation of this study is to develop a Multi-Quay BAP model and solution that can be applied in real ports, such as the Port of Limassol, Cyprus. As such, we consider additional practical constraints of the port, including the preferred and alternative berthing quays of each arriving ship, a safety time interval between consecutive vessels entering the port, as well as a safety time and distance between vessels berthed at a particular quay. First, the MQ-BAP is modeled as a mixed-integer linear model and then solved by CSA. The reasons for choosing CSA are ease of implementation, fewer parameters to tune, balanced mixing of solutions, and avoidance of local optima using random walk by levy flights. Furthermore, we also implement the exact method using MILP and other popular methods, GA, PSO, and FCFS, as a baseline for comparison purposes. We conduct experiments using both random and real data from one month of operations at the Port of Limassol and the results confirm the effectiveness of our proposed method.

3. Problem Definition and Formulations

In this section, we first introduce the MQ-BAP along with some assumptions, and then formulate the problem as an MILP.

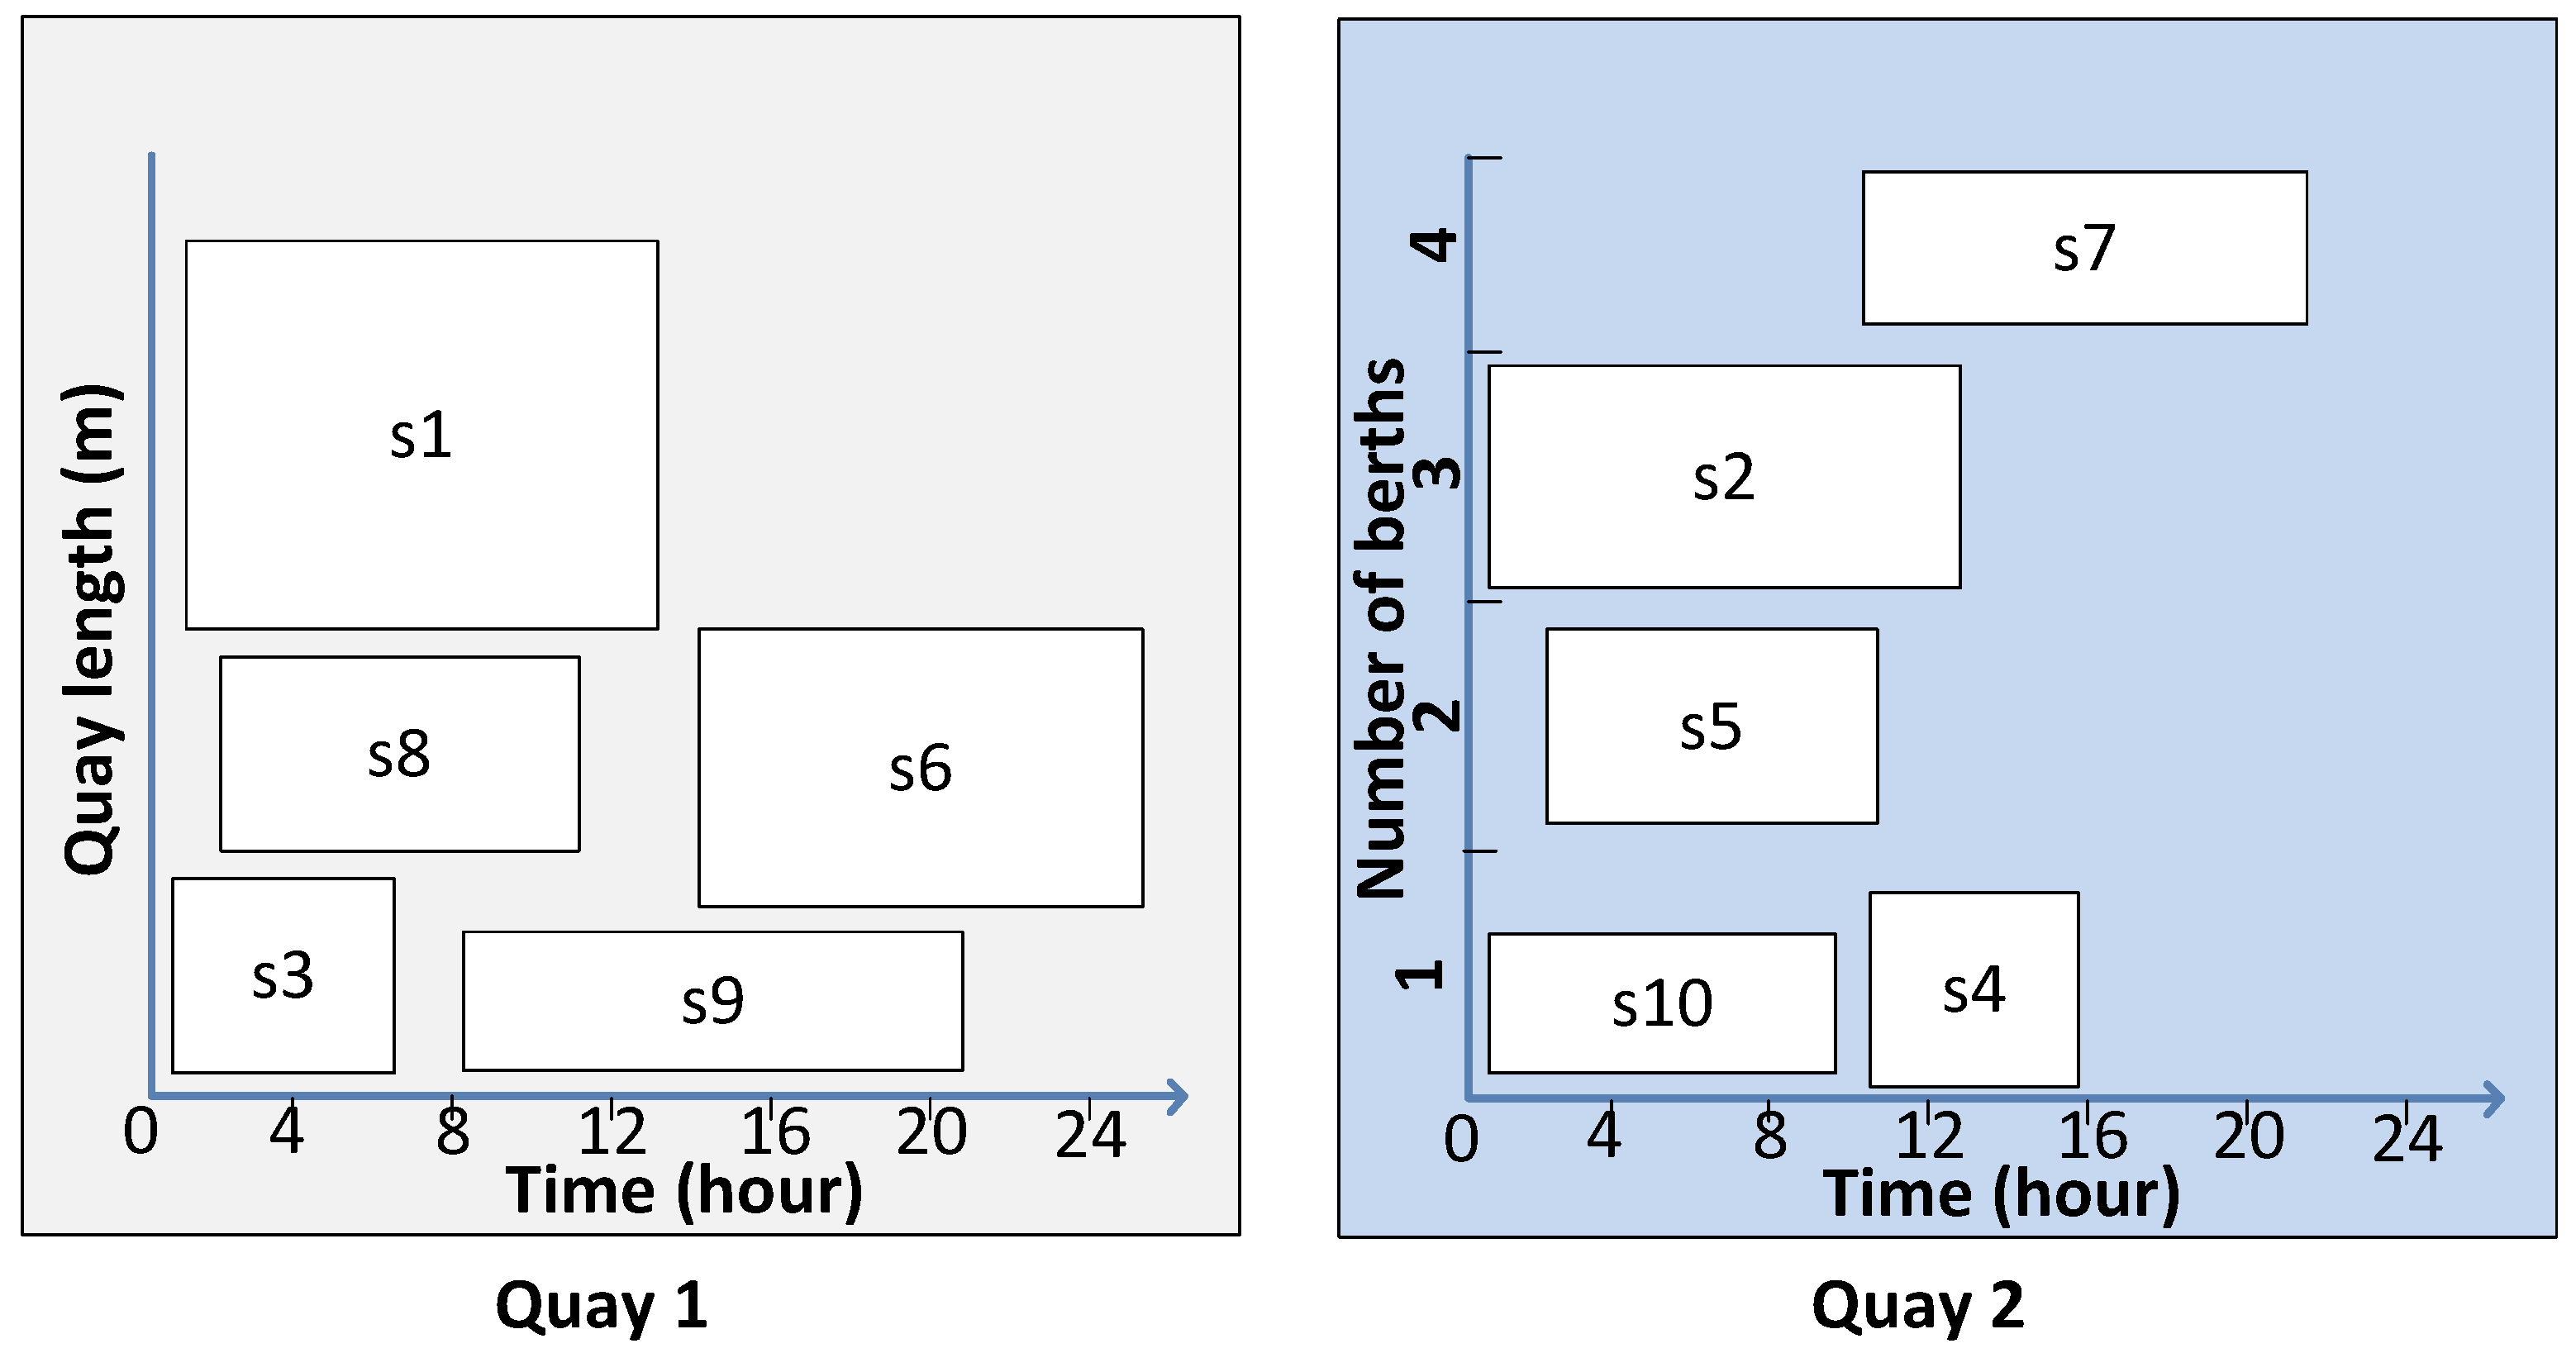
3.1. Problem Explanation

In contrast to existing studies, and to make the problem more practical, this work considers MCT with multiple quays (having both continuous and discrete berthing layouts) to berth arriving vessels. A continuous quay consists of a section of the berth line and arriving ships can be moored at any berthing position along the berth line. The length of the continuous berth line is known in advance. A discrete quay considers a section of the berth divided into berth segments. In the discrete berthing layout, only one ship can be moored at a single berth segment in a single time interval. Note that time is discretized in a set of time intervals (e.g., 30 or 60 min intervals) for planning. Finally, there is a set of arriving ships, with each ship having multiple known characteristics, such as length of ship (LoS), expected time of arrival (ETA), expected time of departure (ETD), handling time (HT), preferred berthing position (PBP), and preferred berthing quay (PBQ). A preferred berthing quay and position are typically requested for container ships based on the dedicated storage area for a particular ship in order to reduce onshore transportation costs. If a ship is moored near to its dedicated storage area, the cost and time of transporting containers to the storage area can be reduced [33,34].
This study considers dynamic ship arrivals, for which ships are not assumed to be present at the MCT during the planning horizon but the ETA and ETD for each ship are provided to the MCT for the sake of better berth planning.
The objective of this study is to determine the berthing time, berthing quay, and berthing position or segment (depending on whether it is a continuous or discrete quay, respectively), for arriving ships in order to reduce the total cost associated with the berthing process. The cost against a ship includes handling cost, waiting cost, and penalty costs due to late departures, allocation of a non-optimal berthing (NOB) position, and non-optimal berthing quay. The handling cost includes the cost of loading and unloading containers and depends on the handling time of the ship. The waiting cost is calculated based on the waiting time, which is the difference between ETA and the berthing time, while the late departure penalty cost depends on the late departure time that is defined as the difference between the task finishing time and the ETD of each ship. The penalty cost due to non-optimal berth allocation is incurred when the ship is moored at a location other than its PBP, since more resources are needed to move containers over a longer distance. Another penalty cost is added if the ship is moored to a quay other than the preferred one. All the variables used in mathematical presented in Table 1.

3.2. Assumptions of This Study

The problem under consideration and the solution are based on the following assumptions.
  • The number of incoming ships in the planning period is known;
  • When a vessel starts operations at any quay, it cannot be interrupted until loading/unloading is completed;
  • Berths from any quay become available immediately after a ship completes its tasks;
  • The length of a continuous quay and the number of berths available at a discrete quay are known;
  • The ETA and ETD for each vessel are known;
  • The estimated turnaround time for each vessel is known;
  • Each vessel has a PBQ, a PBP, and ABQs that are known in advance;
  • All berths are assumed to be free at the beginning of the time horizon (t = 0);
  • The processing speed is the same for all QCs and it is known;
  • Handling and waiting costs per hour for all vessels are known;
  • Penalty costs for late departure, non-optimal berth allocation, and non-optimal quay allocation are known and assumed to be the same for all arriving vessels;
  • This study ignores any meteorological or other uncertainty conditions.

3.3. Mathematical Formulation

The total processing cost of a ship s that is scheduled for berthing at position B P s of particular quay Q s at time T s b includes a waiting cost, a handling cost, and a penalty for late departure, expressed by the following function:
Cost ( s , Q s , B P s , T s b ) = T s w · C s w + T s h · [ C s h + f ( s , Q s , B P s ) ] + T s d · C s d
The first term in Equation (1), T s w · C s w , shows the waiting cost when a ship s has to wait for mooring. The waiting time T s w of ship s is calculated as the difference between the ETA T s e a and berthing time T s b of ship s, illustrated in Figure 3:
T s w = T s b T s e a , s S
The second term in Equation (1), T s h · [ C s h + f ( s , Q s , B P s ) ] presents the total processing cost of ship s that was incurred by unloading and loading containers from/to ship s. Similar to previous studies (e.g., [29]), this work considers the handling time of each ship to be an input to the problem. However, calculating handling time of each ship s is fairly straightforward and reported in other studies, such as [35]. In particular, the handling time T s h depends on the total volume (TEUs) L o a d s to be loaded/unloaded on the ship and the number of assigned cranes N s q c along with the average handling productivity of cranes H P s q c assigned to that particular ship.
T s h = L o a d s N s q c · H P s q c , s S
Without loss of generality, this work also introduces the penalty function f ( s , Q s , B P s ) , which will penalize the handling cost based on non-optimal berth allocation of ship s. Unlike our previous study, and to make the model more realistic, this work calculates penalty based on the absolute difference between the assigned berthing position B P s and the preferred berthing position P B P s (if assigned to its PBQ), as well as takes into account A B Q s . The penalty function used is:
f ( s , Q s , B P s ) = | P B P s B P s | · C s n o b , if Q s = P B Q s C s n o q , if Q s A B Q s , otherwise
According to Equation (4), if the vessel is berthed at its preferred quay (first case), the penalty is calculated on the basis of the absolute difference between the preferred berth position and the assigned berth position. In the second case, if the selected berthing quay is one of the alternate berthing quays, a fixed penalty amount C s n o q is added to the total cost. Otherwise, an infinite penalty is added to the total cost to ensure that no ship is berthed at an undesired berth (that probably is not able to serve the ship).
The final term T s d · C s d in Equation ((1)) calculates the late departure penalty cost against ship s when it departs after the ETD. The delayed departure time T s d of ship s (if any) is computed as the difference between the actual departure time T s a d and the expected time of departure T s e d , as depicted in Figure 3.
T s d = m a x { T s a d T s e d , 0 } , s S
where T s a d can be calculated as:
T s a d = T s b + T s h , s S
The primary objective of the multi-quay berth allocation problem is to allocate optimal quays and berthing positions along with berthing times to arriving ships such that the total processing cost (that includes waiting cost, handling cost, and various penalties) can be minimized, as presented by the following objective function
minimize s S q Q b B q t T Cost ( s , q , b , t ) · x s q b t
subject to several constraints that are presented in Table 2.
Table 2. Constraints related to continuous and discrete MQ-BAP.
General constraints
x s q b t { 0 , 1 } , s S , q Q , b B q , t T
The variable x s q b t is 1 if the ship s is scheduled at position b of quay q at time t, and 0 otherwise.
q Q b B q t T x s q b t = 1 , s S
This constraint ensures that each ship may moor only once during the time t at the mooring position b of the quay q.
T s b T s e a , s S .
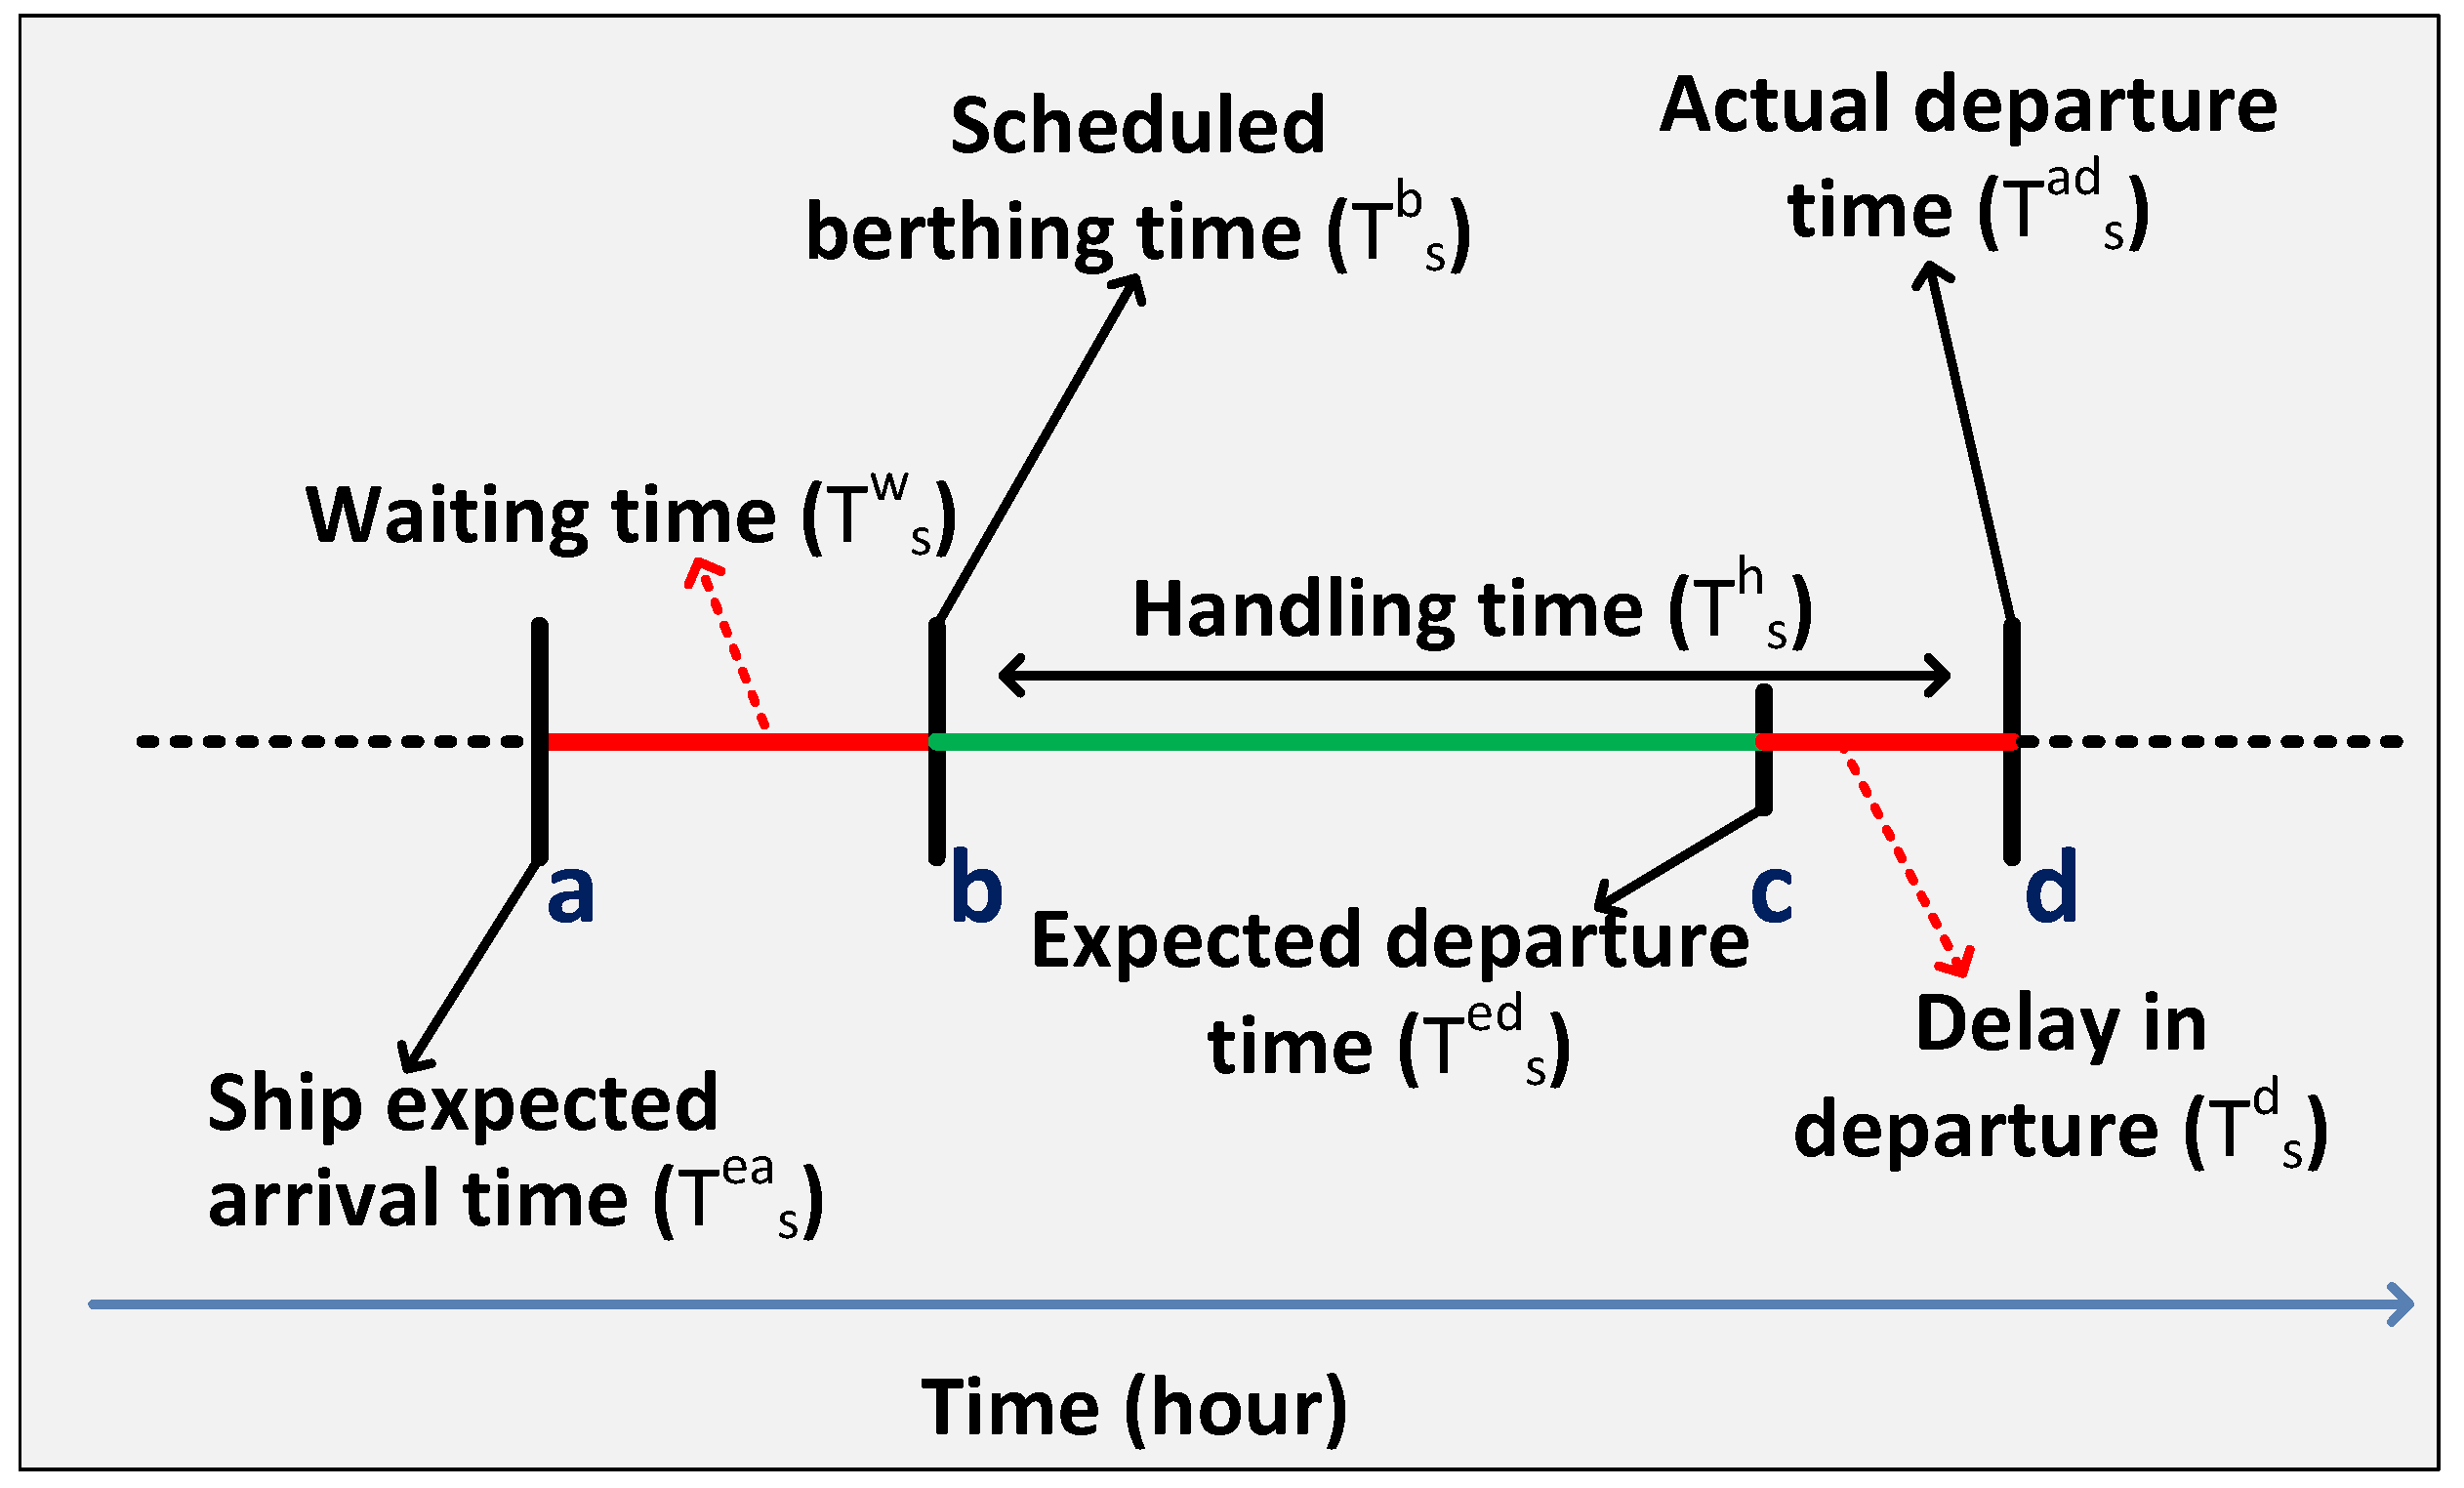
The constraint specifies that the proposed berthing time T s b for a given ship s must always be equal to or later than its expected time of arrival  T s e a .
T s b T j b S E s j S
This condition guarantees a minimum safety entrance time S E between any two consecutive berthing operations.
Constraints for continuous berthing layout
j s S b = B P s L j S D + 1 B P s + L s + S D t = T s b T j h S T + 1 T s b + T s h + S T x j q b t = 0 , s , j S , q = Q s
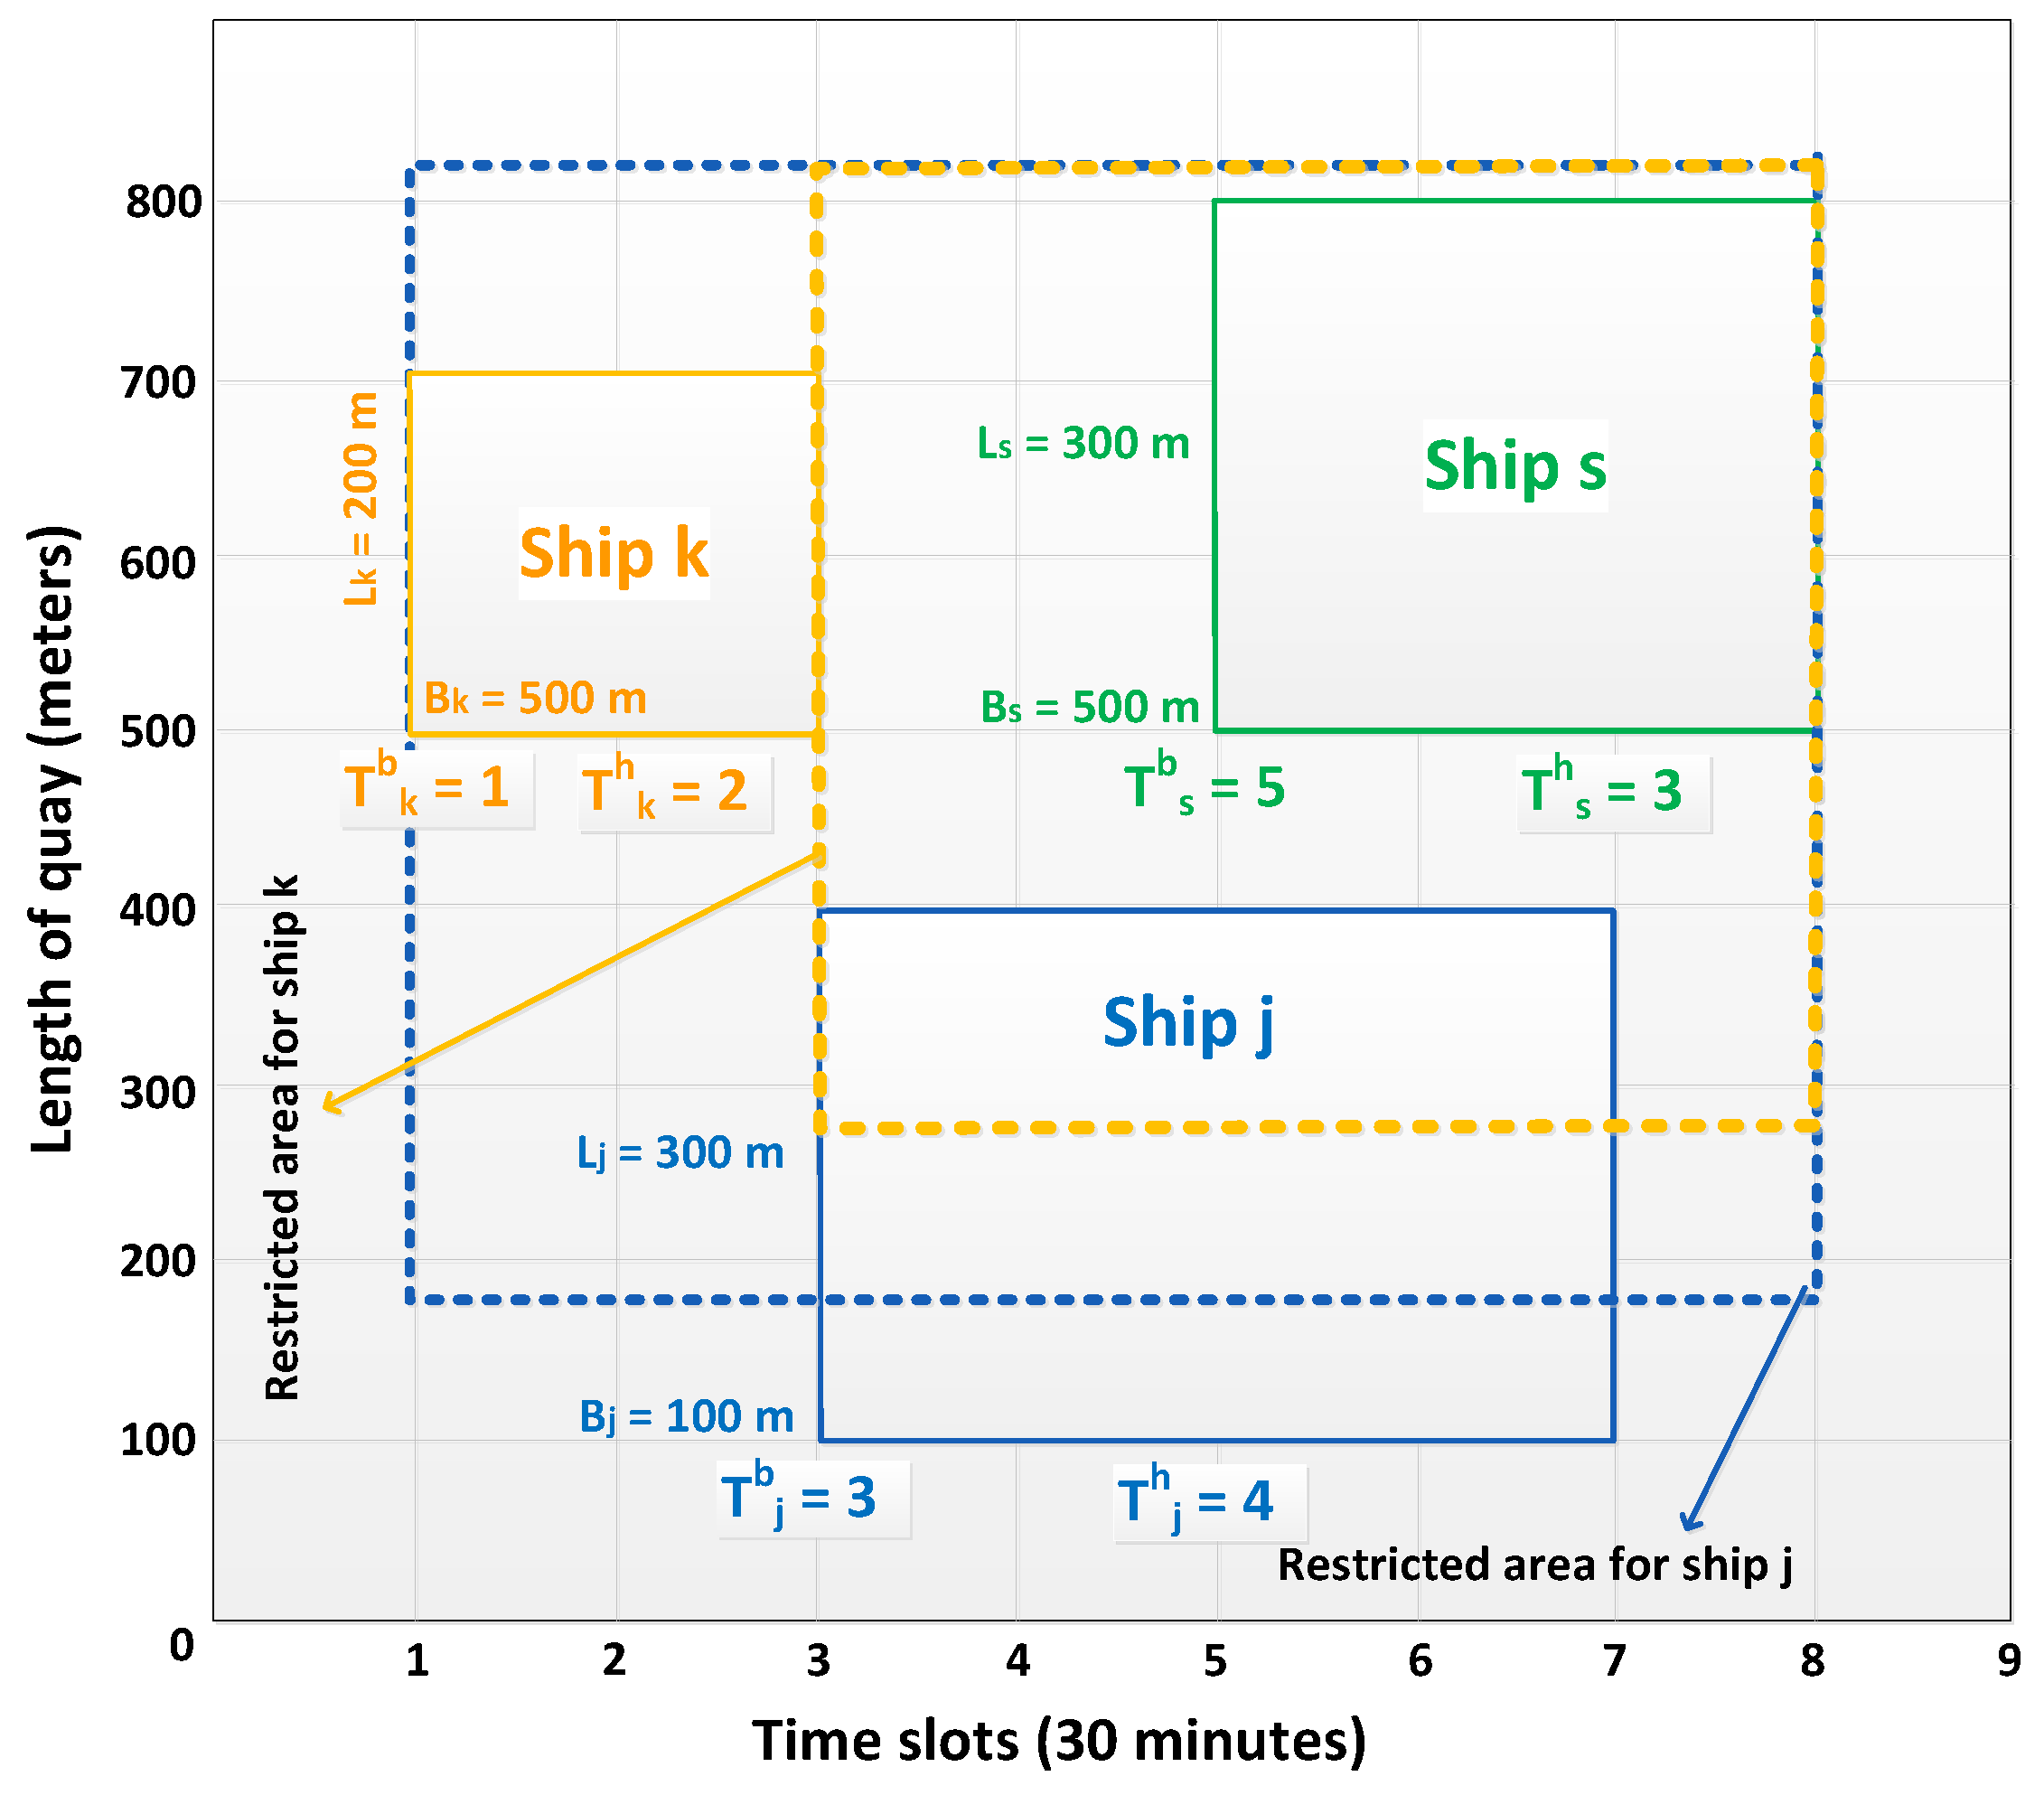
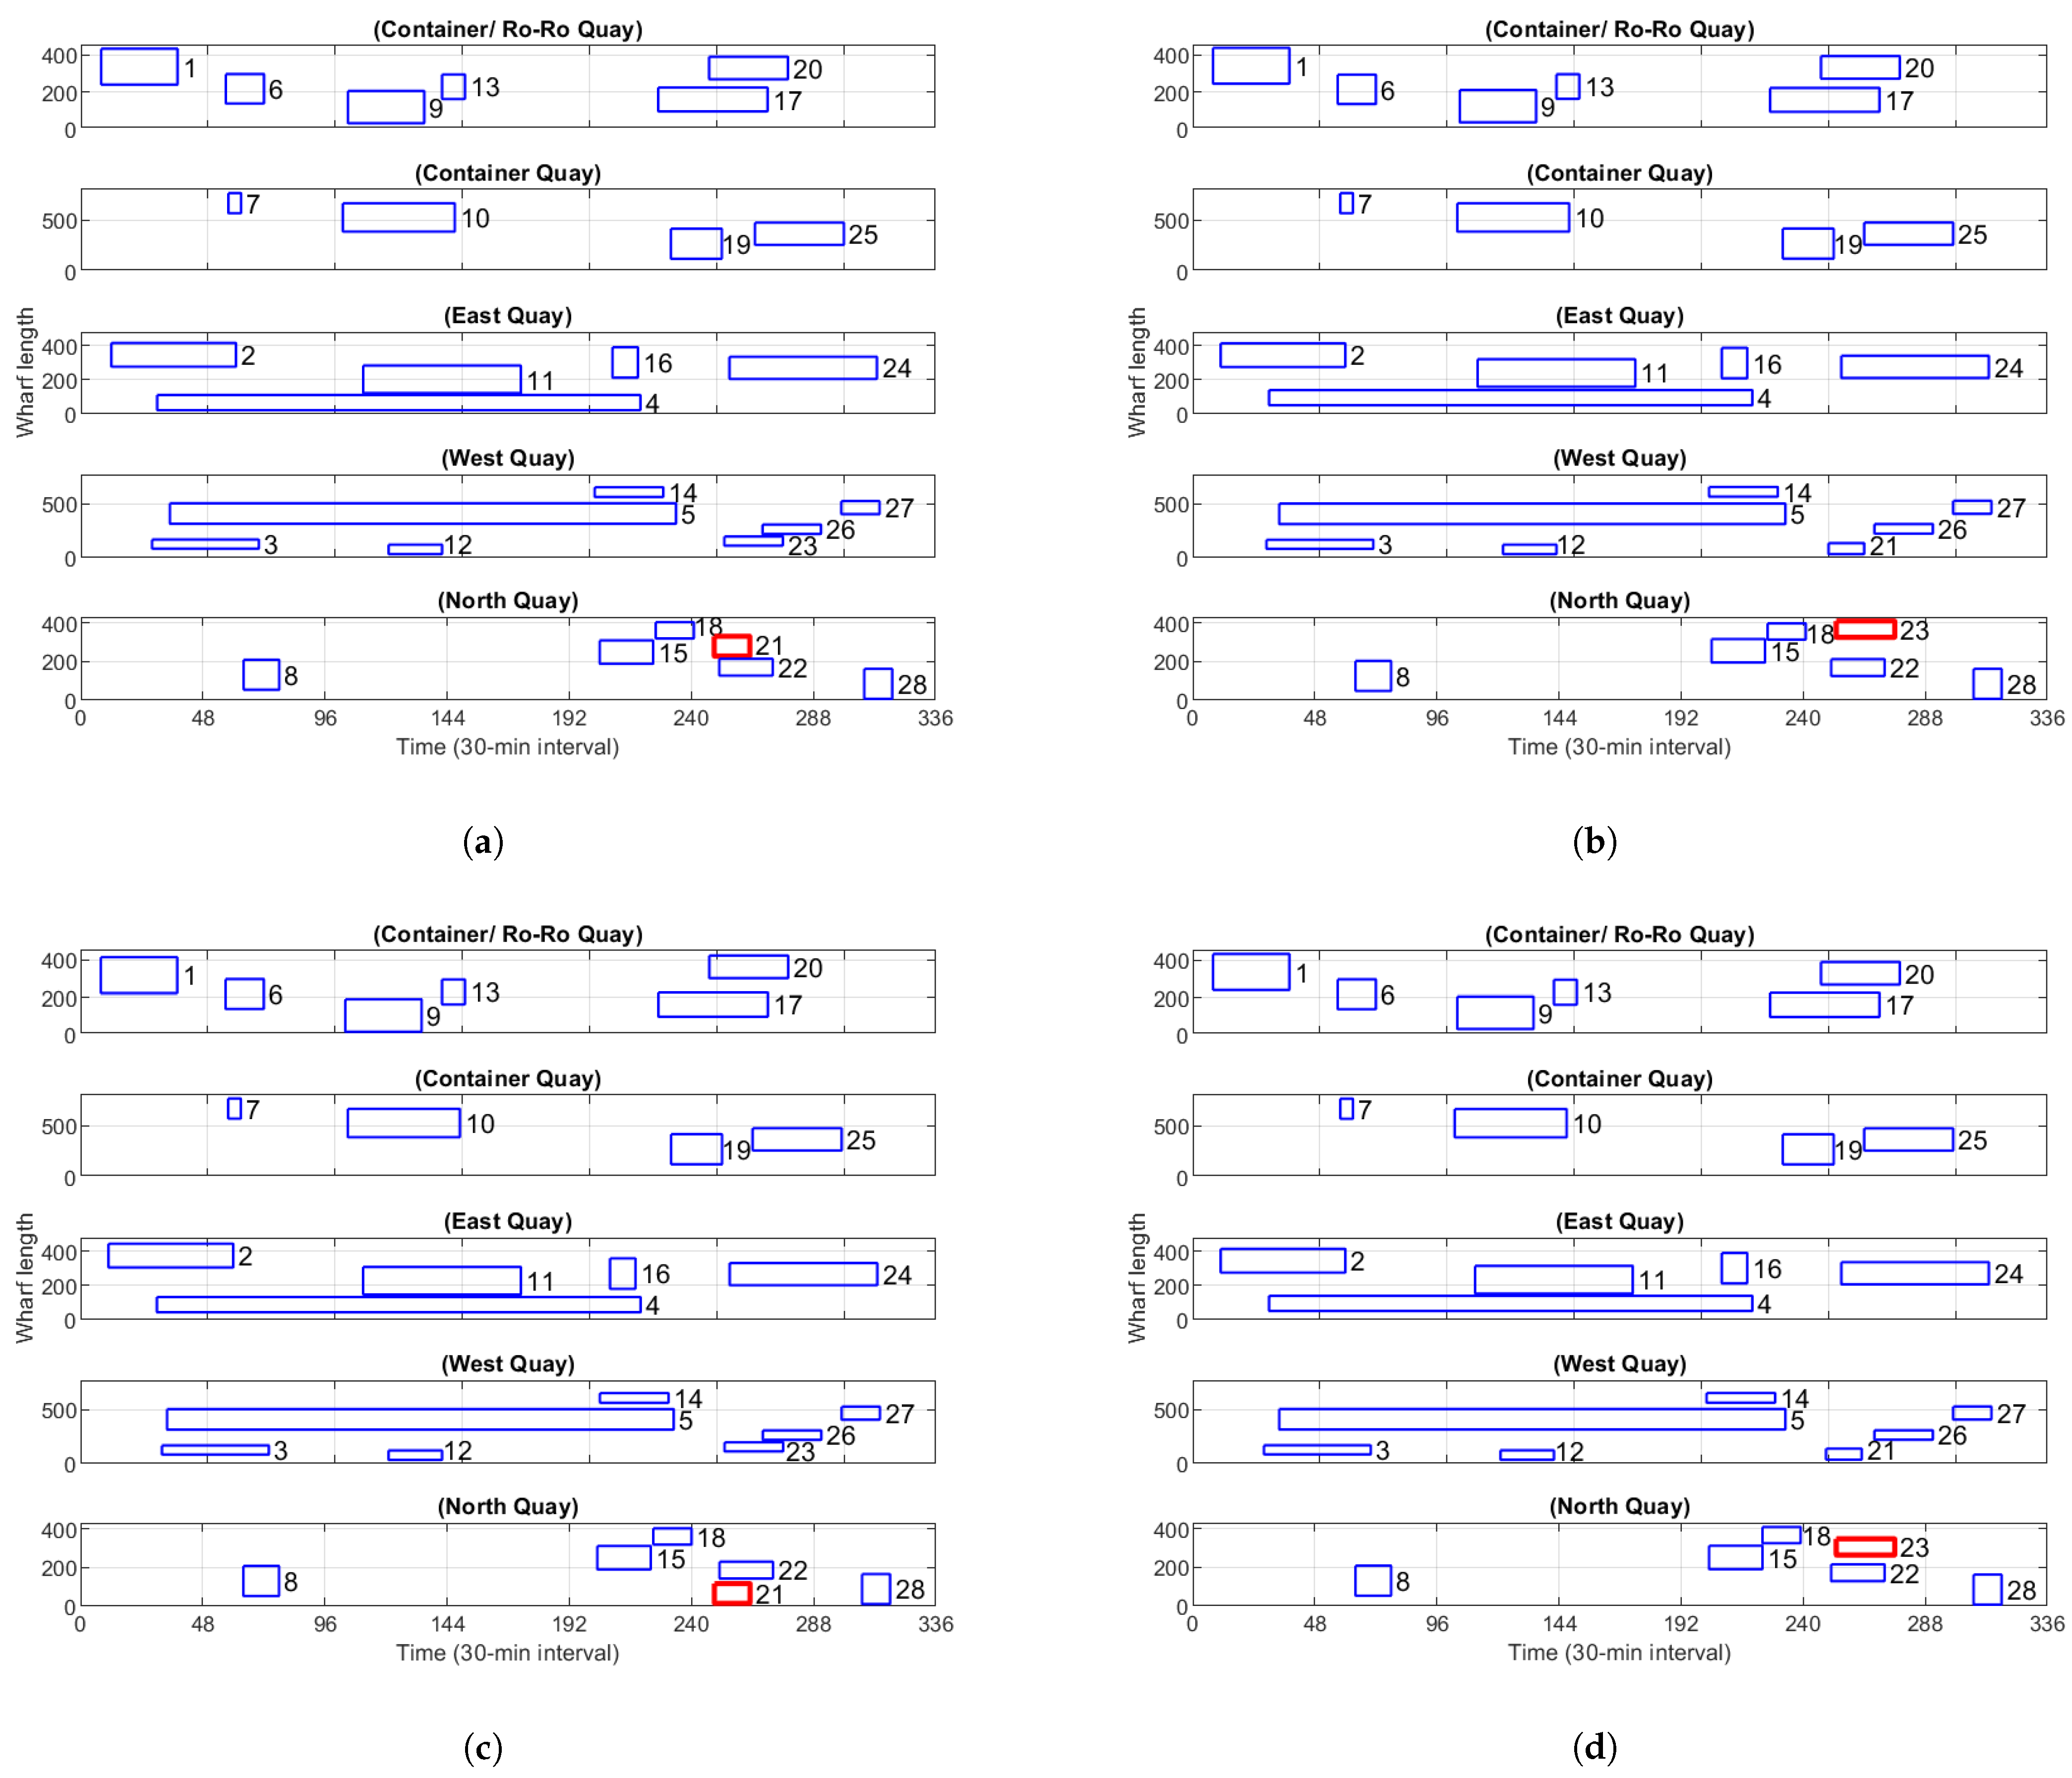
This is an overlap avoidance constraint that does not allow two vessels to share (part of) the same berth positions during their handling times. Visually, this constraint ensures that two rectangles (denoting the time intervals and the berths assigned to the ships) shown in Figure 4 can never overlap. In addition, this constraint is also responsible for maintaining the safety distance S D and safety time S T between two ships to avoid any danger during berthing.
B P s + L s L q , s S ,
This constraint ensures that the length L s of any ship s plus its berthing position B P s must be less than or equal to the length L q of the quay q, where s is planned to be berthed.
Constraints for discrete berthing layout
  
j s S t = T s b T j h S T + 1 T s b + T s h + S T x j q b t = 0 , s , j S , q = Q s , b = B P s
This is a restriction to avoid overlap in the case of a discrete berthing layout that does not allow two vessels to use the same berth at the same time. Furthermore, this constraint is responsible to ensure safety time S T between any two ships s and j.
L s L b , s S , b = B P s
This constraint ensures that a berth b assigned to any vessel s must be at least as long as the vessel itself.

4. Developed Methodologies

In this section, we present the implementation of our proposed CSA method (developed in this study for the first time for MQ-BAP), FCFS, and state-of-the-art popular metaheuristic approaches, namely, GA and PSO.

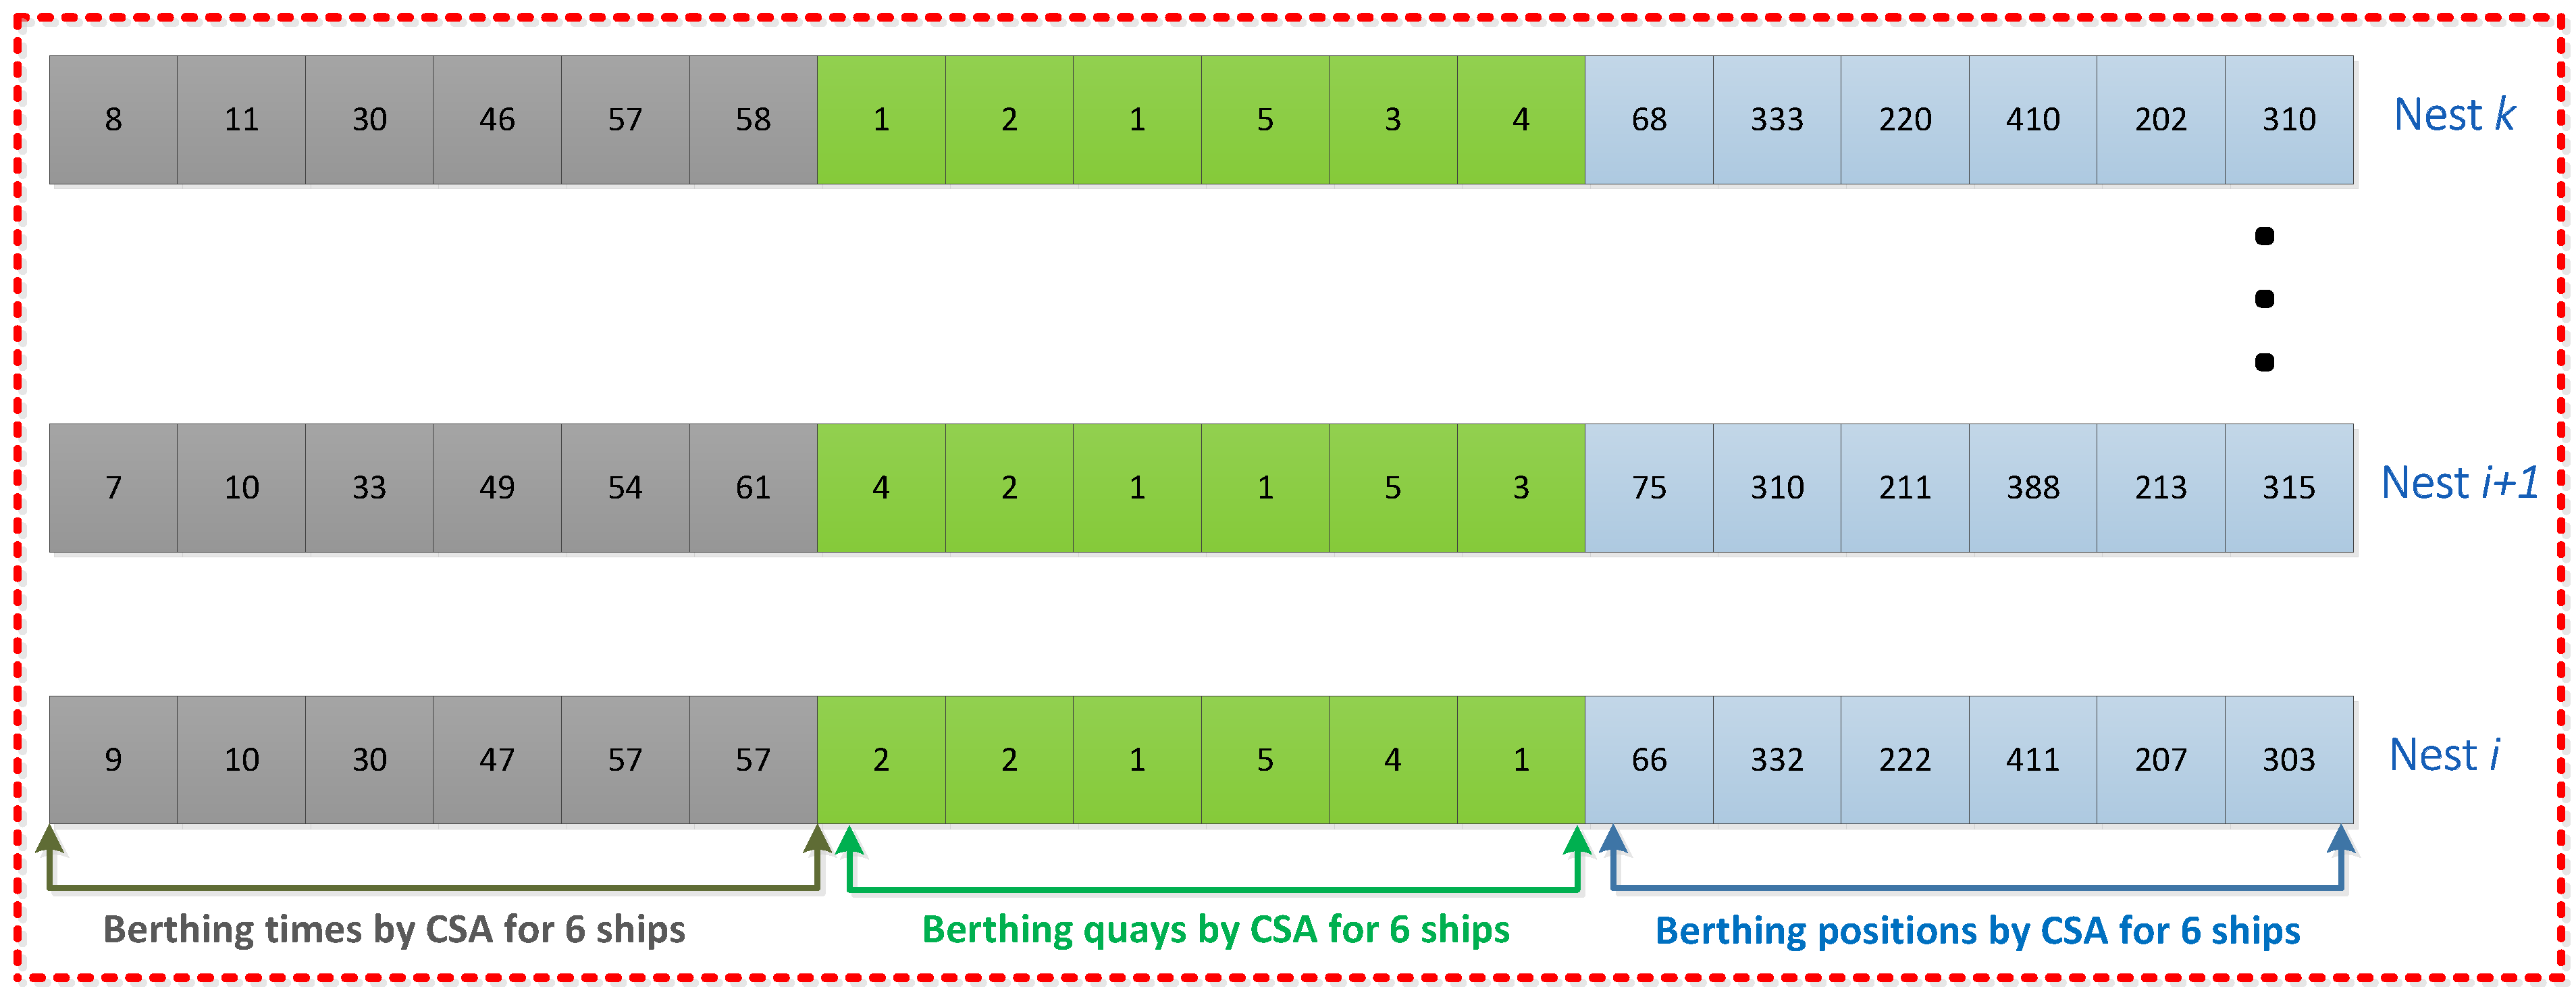
4.1. Cuckoo Search Algorithm

CSA is a metaheuristic optimization algorithm developed by [36]. The CSA is inspired by the breeding mechanism of some cuckoo species, which are fascinating because of their beautiful sounds and aggressive reproduction mechanism. Some cuckoos lay their eggs in communal nests of other species, where they try to remove the eggs of other birds in order to improve the hatching probability of their own eggs. Then, other birds, probably from other species, known as host birds take care of cuckoo eggs. However, if the host birds realize that some eggs do not belong to them, then the cuckoo eggs are disposed or current nests are destroyed and built elsewhere. In particular, some cuckoo species (e.g., new world brood-parasitic Tapera) specialize in the mimicry of the pattern or color of eggs and they lay their eggs in nests of relevant species in order to reduce the probability of theirs eggs being thrown or destroyed [37]. Overall, the CSA works based on the behavior of cuckoos for laying eggs and adopts three idealized rules [36]:
  • Each cuckoo bird dumps only one egg at a time in a random nest;
  • The best nests having high-quality eggs are kept and used for the next generation;
  • The number of host nests is fixed and the egg laid by a cuckoo is detected by a host bird with probability p α ( 0 , 1 ) .
The mapping of CSA to MQ-BAP is as follows. A single nest shows a set of possible solutions containing the berthing times, quays, and positions of all arriving ships, as shown in Figure 5. An egg in a nest denotes either a berthing time or a berthing quay or a berthing position in that quay for an arriving ship, whereas a cuckoo egg shows a novel (or better) solution (i.e., a berthing time or quay or position). Hence, each nest includes 3 N eggs, where N is the number of ships arriving at the port. This is because we need three solutions for each ship (i.e., its berthing time, quay, and position).
Algorithm 1 presents the pseudocode of CSA for MQ-BAP. The total search space of the problem at each iteration is reflected by the total number of host nests, which is fixed (100 host nests are considered in this study). In each iteration, new solutions are generated using levy flights [36] and the best local solution (i.e., with lowest cost) is chosen for the next generation (lines 4–9). Next, the probability of detecting a cuckoo egg p a is used to decide when to completely destroy a nest and generate a new, better solution (lines 10–16), which helps to avoid local optima and explore other areas of the search space. Furthermore, we tested our algorithm with different p a and chose the value 0.45 where the CSA performs well. The overall goal of the algorithm is to use cuckoo eggs (better solutions) to replace the not-so-good eggs in the various nests. Note that a generated solution at any point of the algorithm may not be feasible (i.e., it may violate some constraints), in which case a large cost per constraint violation is added to the solution’s total cost. Consequently, it is possible that the best solution in some iteration may not be feasible; however, it is a comparatively best solution (a nest) out of the 100 solutions (nests). With an increasing number of iterations (typically a few hundreds), the algorithm converges first toward feasible solutions and eventually towards a near-optimal solution.
Algorithm 1 CSA for MQ-BAP
1: X [ 1 . . k ] = Generate initial population of host nests
2: (each nest contains 3N possible solutions)
3: for t = 1 to max number of iterations do
4:  for i = 1 to k do
5:    x n e w = X [ i ] + α L e v y ( λ )
6:   if (cost( x n e w ) < cost( X [ i ] )) then
7:     X [ i ] = x n e w
8:  for i = 1 to k do
9:   if ( r a n d ( 0 , 1 ) < p a ) then
10:     X [ i ] = Destroy old nest
11:     X [ i ] = Generate new host nest with
12:       new possible solutions
13:   x b e s t = Find nest with lowest fitness value in X

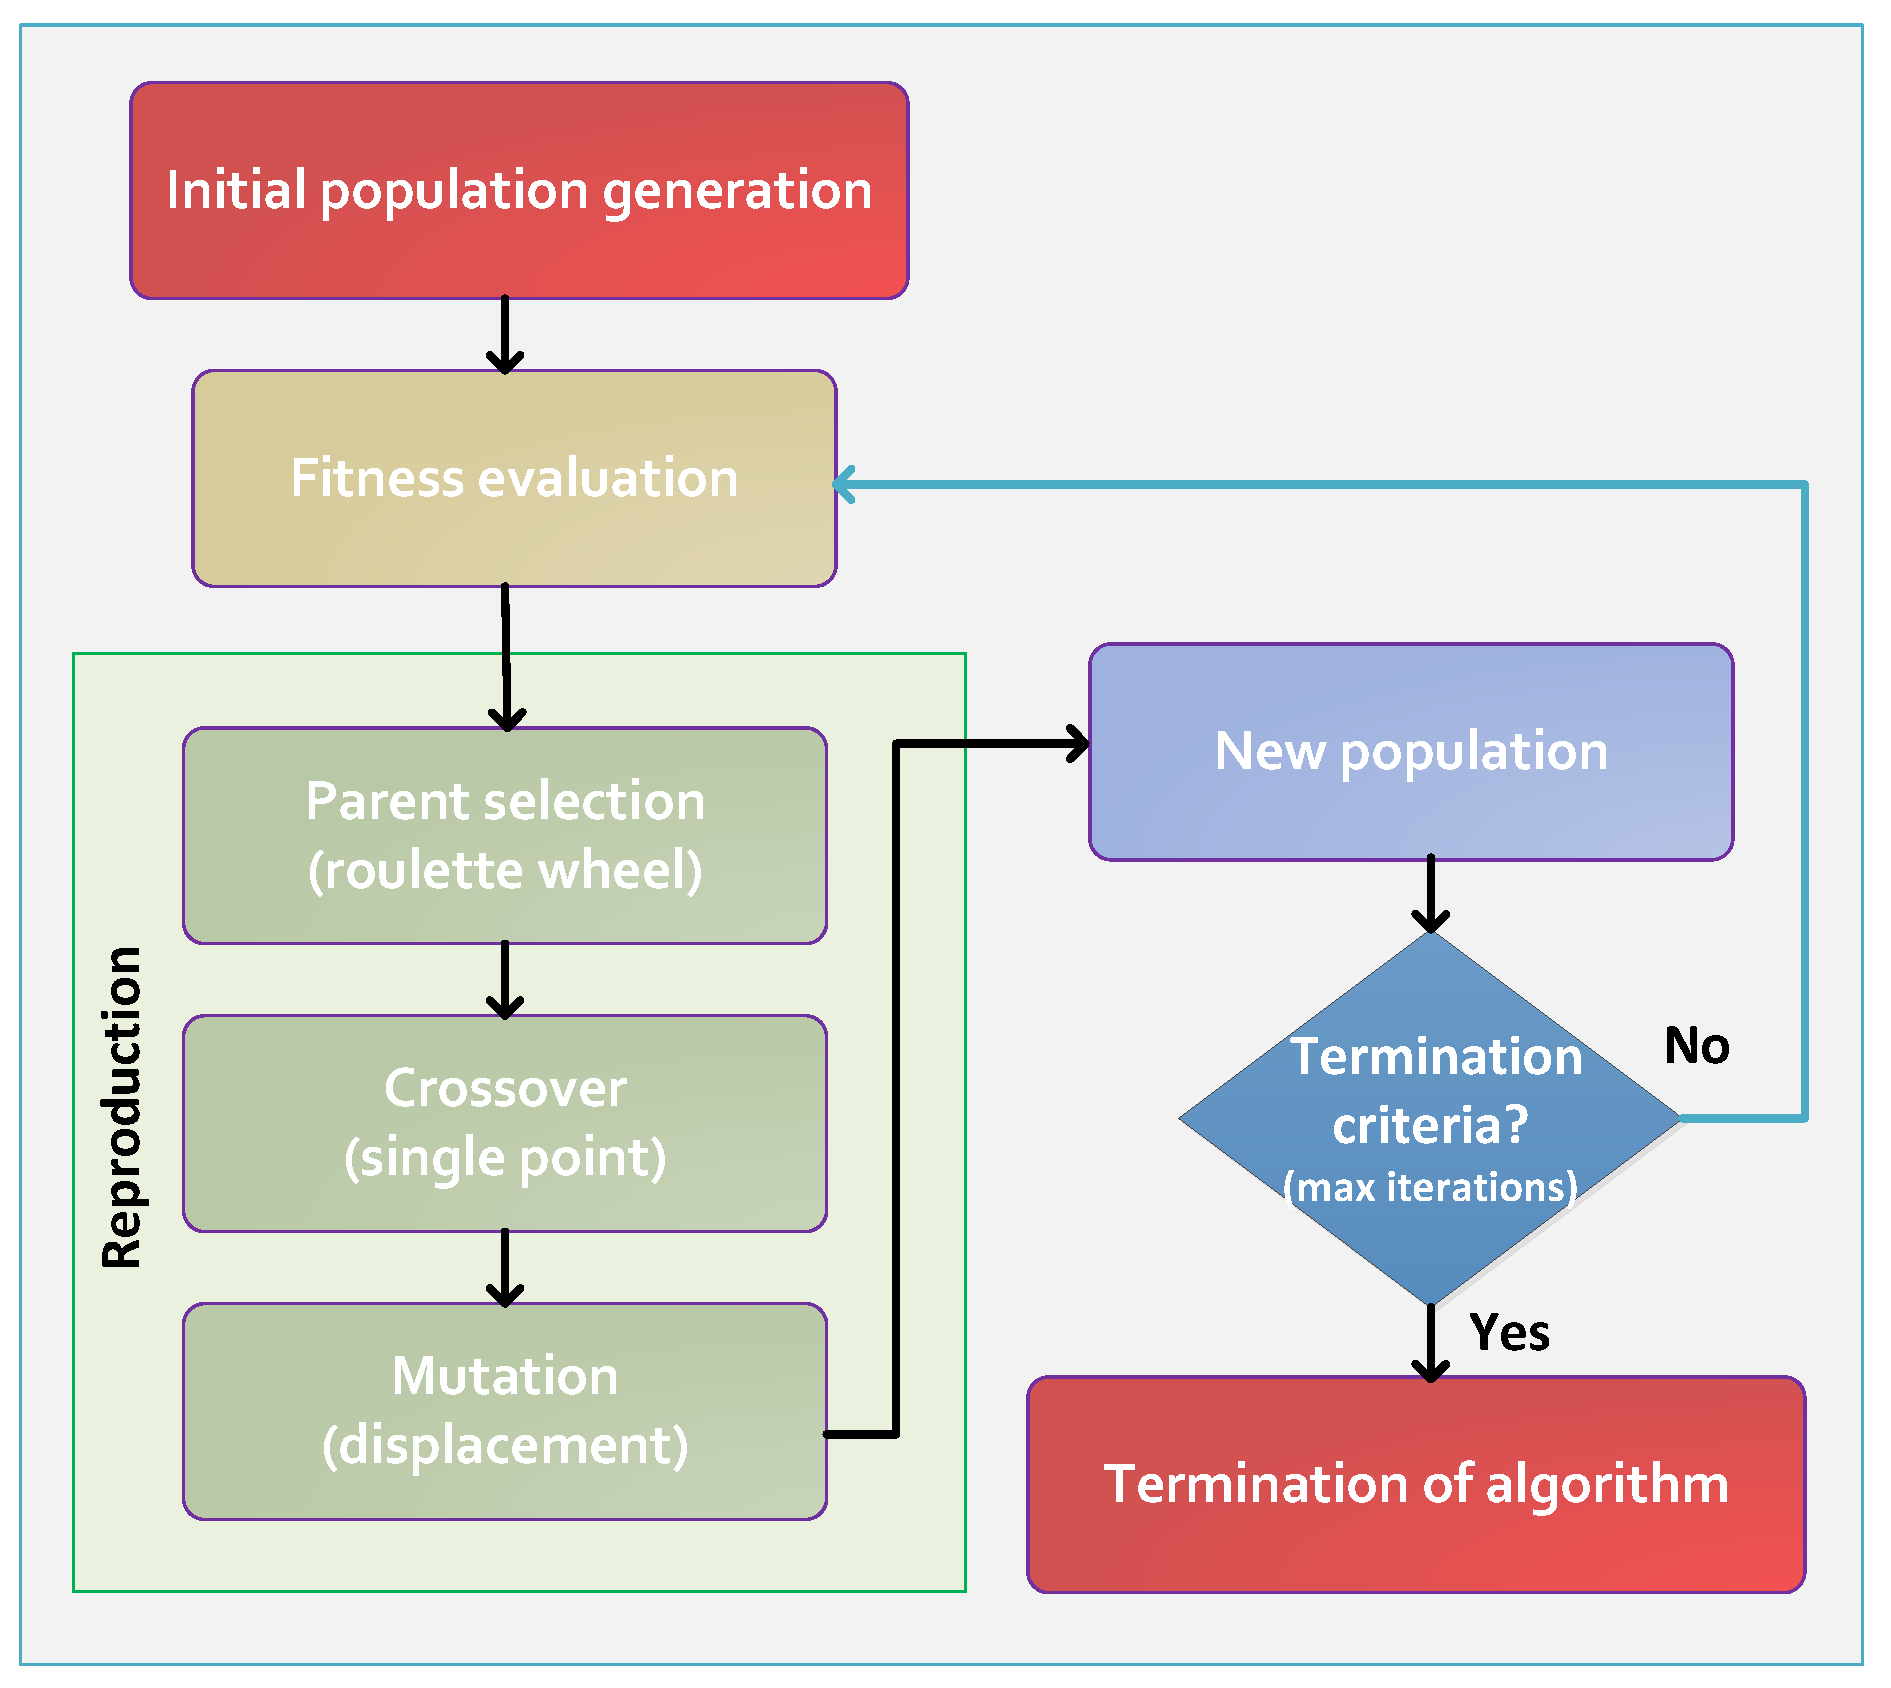
4.2. Genetic Algorithm

The Genetic Algorithm (GA) is a well-known population-based metaheuristic algorithm (also known as a global search algorithm). It is inspired by the theory of biological evolution developed by [38]. GA is famous in the family of metaheuristics due to its high convergence rate, and, therefore, it can solve various types of optimization problems. Since there is a high probability to survive in fitter organisms, GA follows the concept of the survival of the fittest [39]. To find an optimal solution, GA generates a random population and updates it using iterative genetic operators, i.e., chromosome representation, selection, crossover, and mutation.
The complete working mechanism of GA is described next and visualized in Figure 6. First, a random population of n chromosomes (possible solutions) is initialized, where each chromosome is generated. A single solution is called a gene, a solution set is called a chromosome, and all solution sets form a population. Next, the fitness of all chromosomes (solutions) is calculated using the objective function of this study. The crossover c r is performed on two parents using crossover probability c r p to produce an offspring o. Parents selection is performed by roulette wheel and a single point crossover is employed. Then, displacement mutation m is applied with the probability of m p to offspring o to produce a new offspring o . The new offspring o is included in the entire population to avoid the algorithm becoming stuck in local optima and ensure diversity in new solutions. Interested readers can find further details of parameter settings and methodologies from these studies [38,39]. The fitness values of the new population are calculated and the same steps (selection, crossover, and mutation) will be repeated until the termination conditions are met.

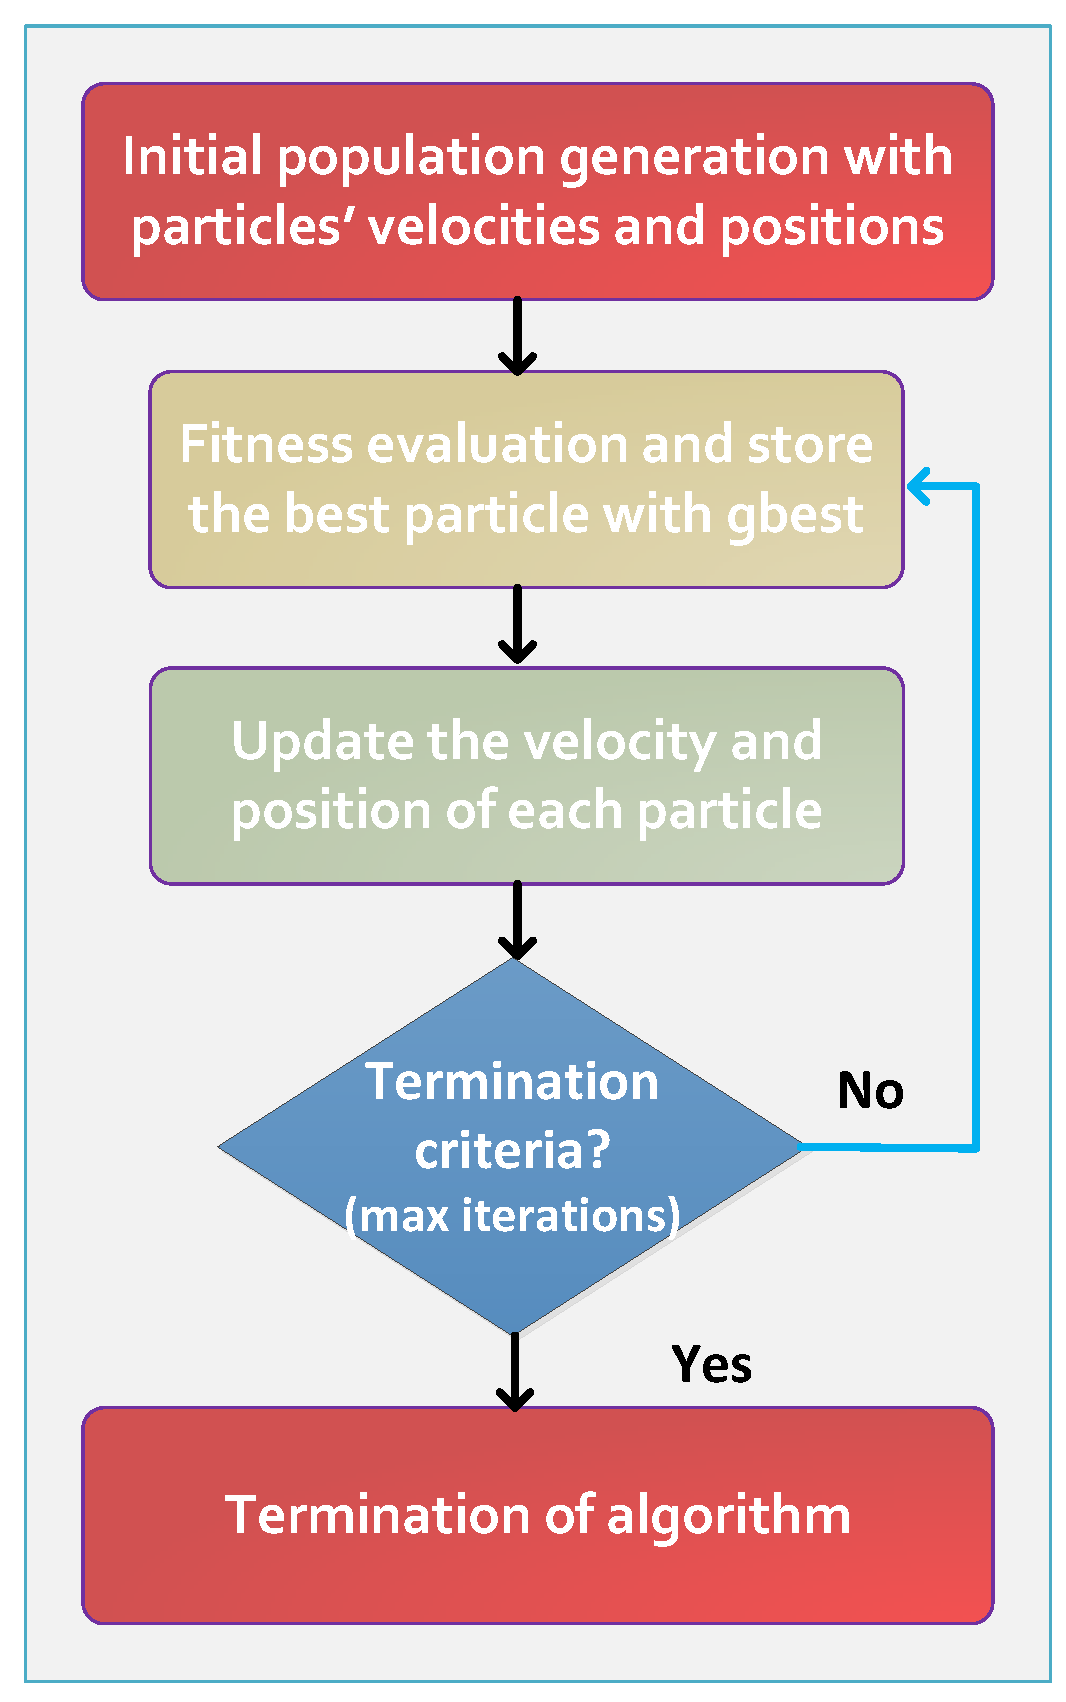
4.3. Particle Swarm Optimization

The Particle Swarm Optimization (PSO) algorithm also belongs in the metaheuristic family, it is proposed by [40], and it works on the basis of behaviours of social animals. The PSO algorithm employs a swarm of particles that traverse a multi-dimensional search space to find optima. Each particle is a possible solution and altered by experiences of its own and neighbors. Furthermore, each particle is associated with a position vector and a velocity vector and updates its position based on the velocity vector, as well as its previous experiences.
The main steps in standard PSO [40] are given next and visualized in Figure 7. A random population of particles (solutions), based on the problem dimension, is initialized, where a random position vector and a random velocity vector are assigned to each particle (solution). A random population of possible solutions (particles) is generated and random velocity and position vectors are assigned to each particle. The population size depends on the problem dimension. The fitness of all particles is computed following the objective of the study and the best particle with the fittest objective value is selected. Then, the position and velocity of all particles are revised based on previous values along with some model parameters. The fitness evaluation and vector updates repeat until the termination criterion is met, which is a max number of iterations (1000).

4.4. First Come First Serve (FCFS)

In this study, we have also implemented a first come first serve (FCFS) policy for solving the MQ-BAP, as developed in [41]. The FCFS solves the MQ-BAP based entirely on the priority of arrival times [42]. That is, the first vessel to arrive will be allocated to its preferred berthing quay and preferred berthing position. In the event that no berthing slot is available at the time of arrival, the vessel needs to wait until the berthing slot becomes available. All constraints are respected like in the other approaches.

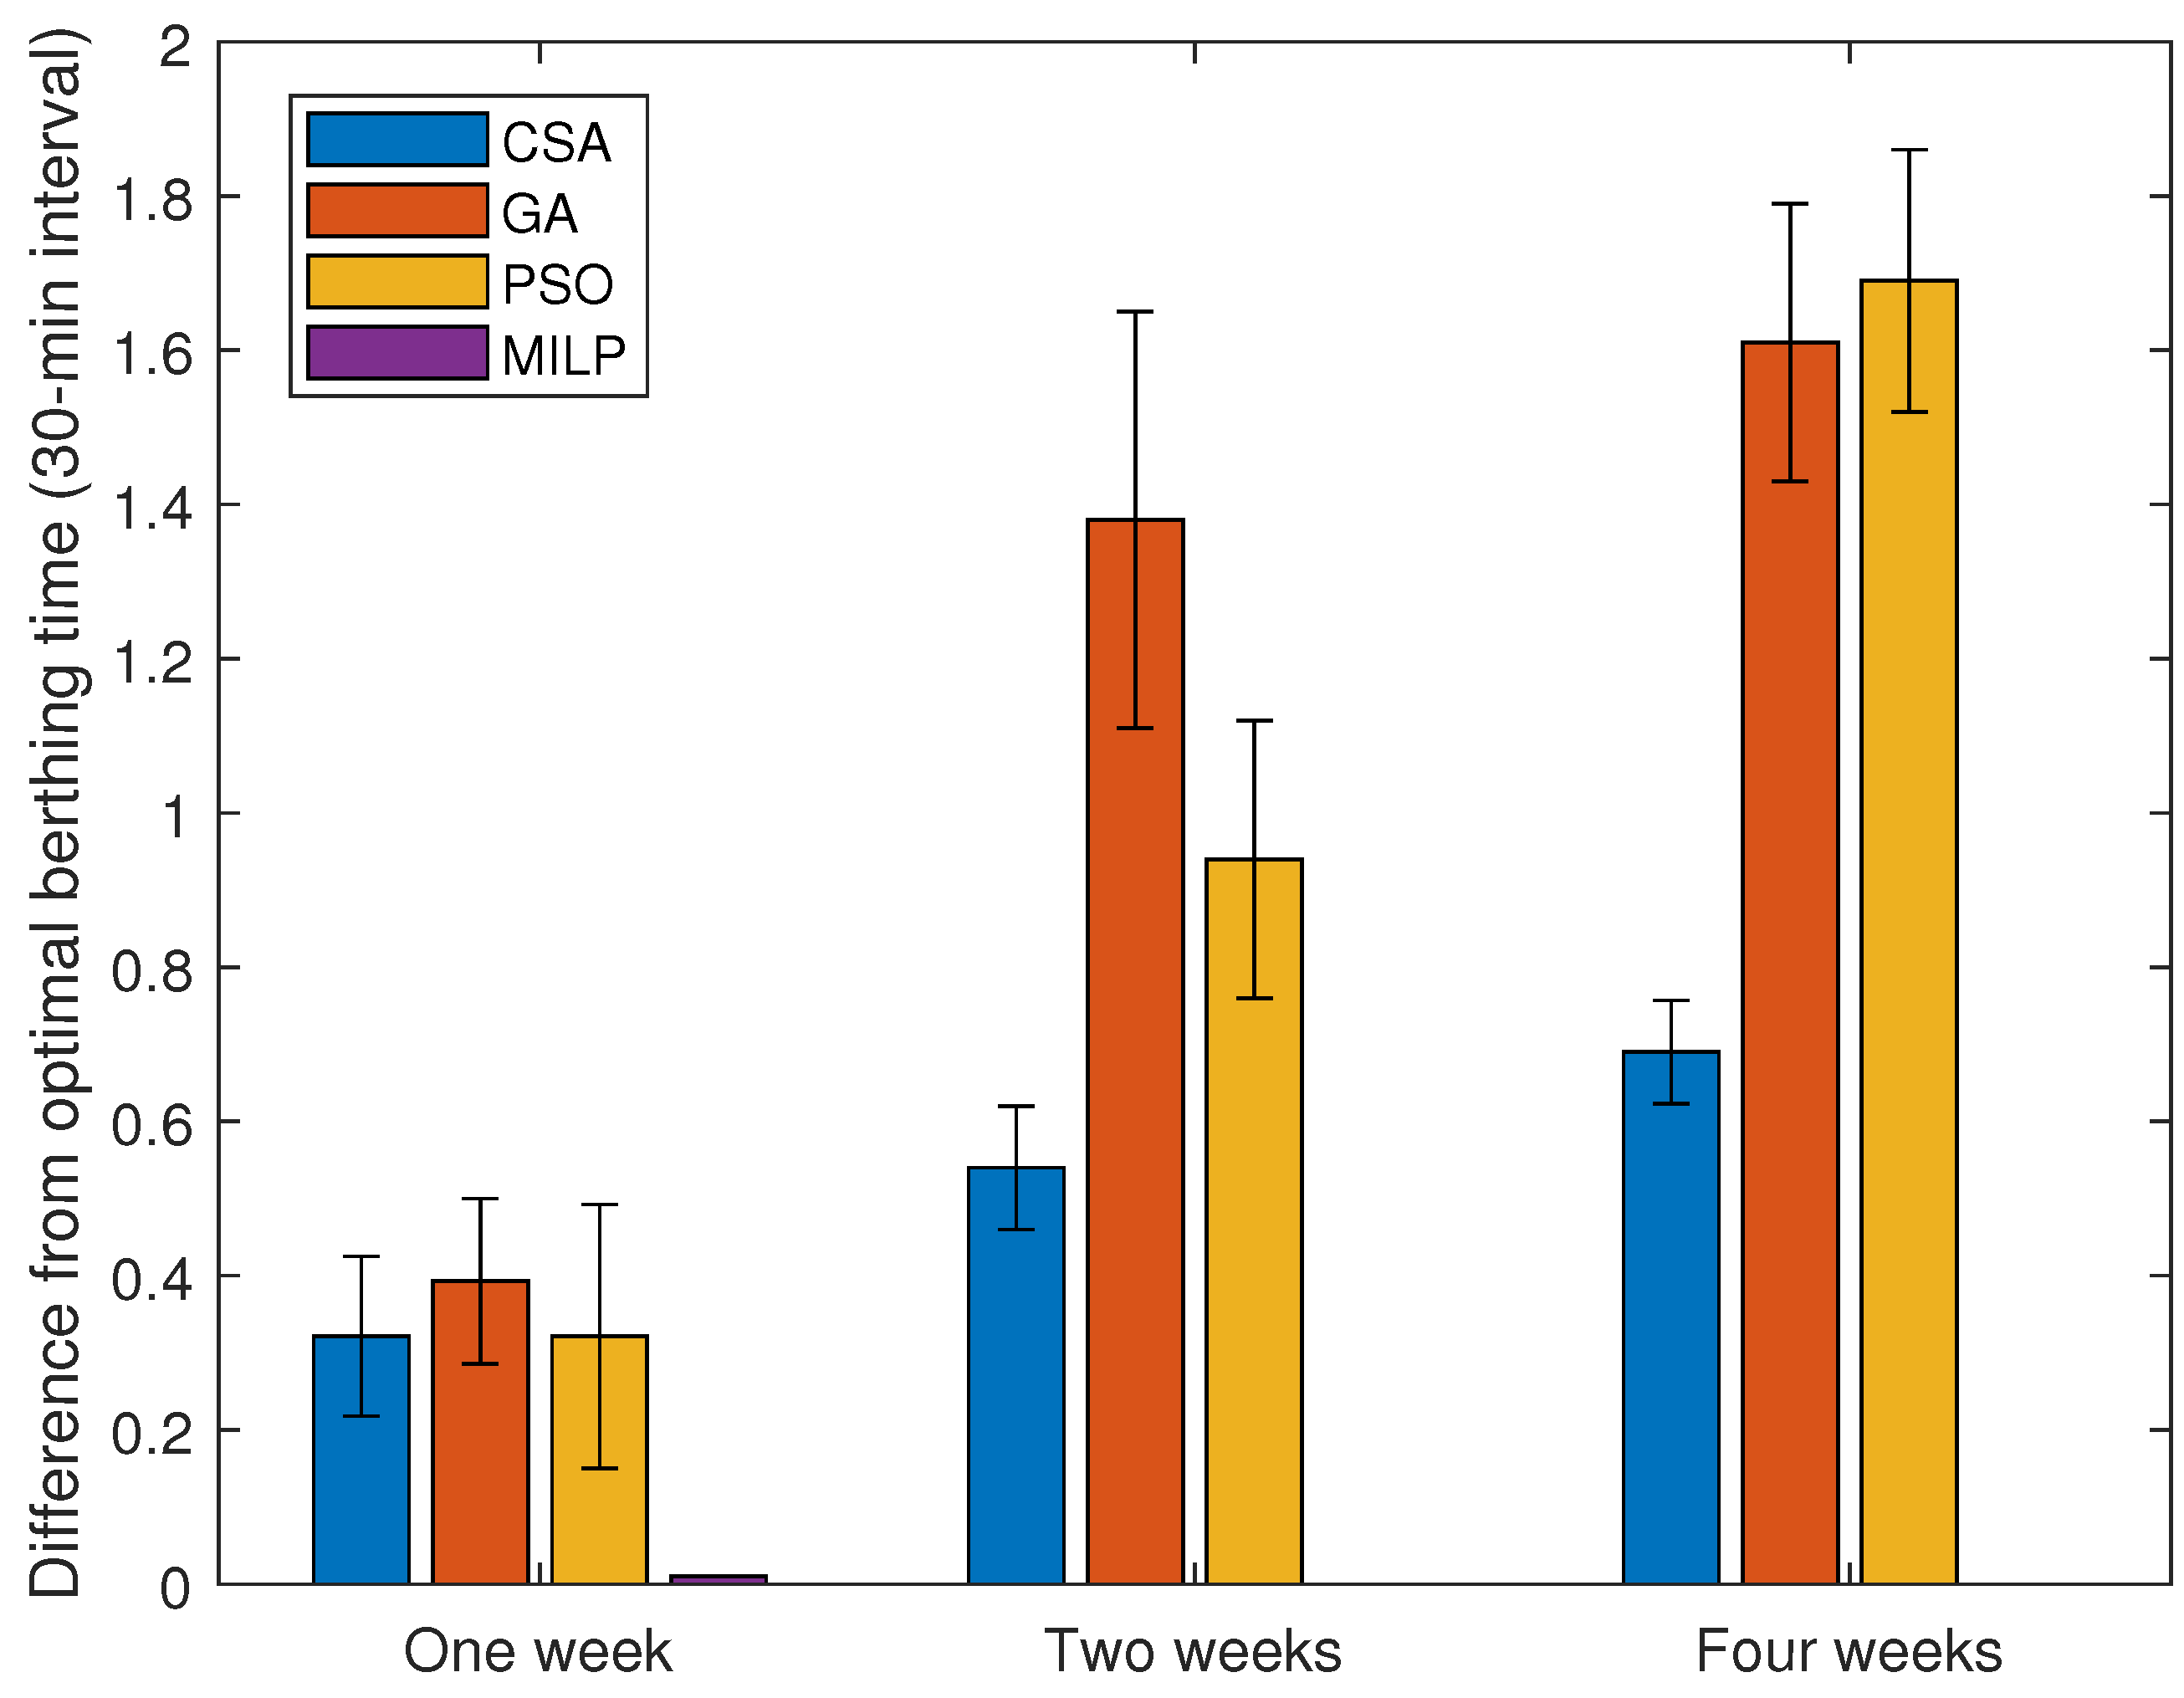
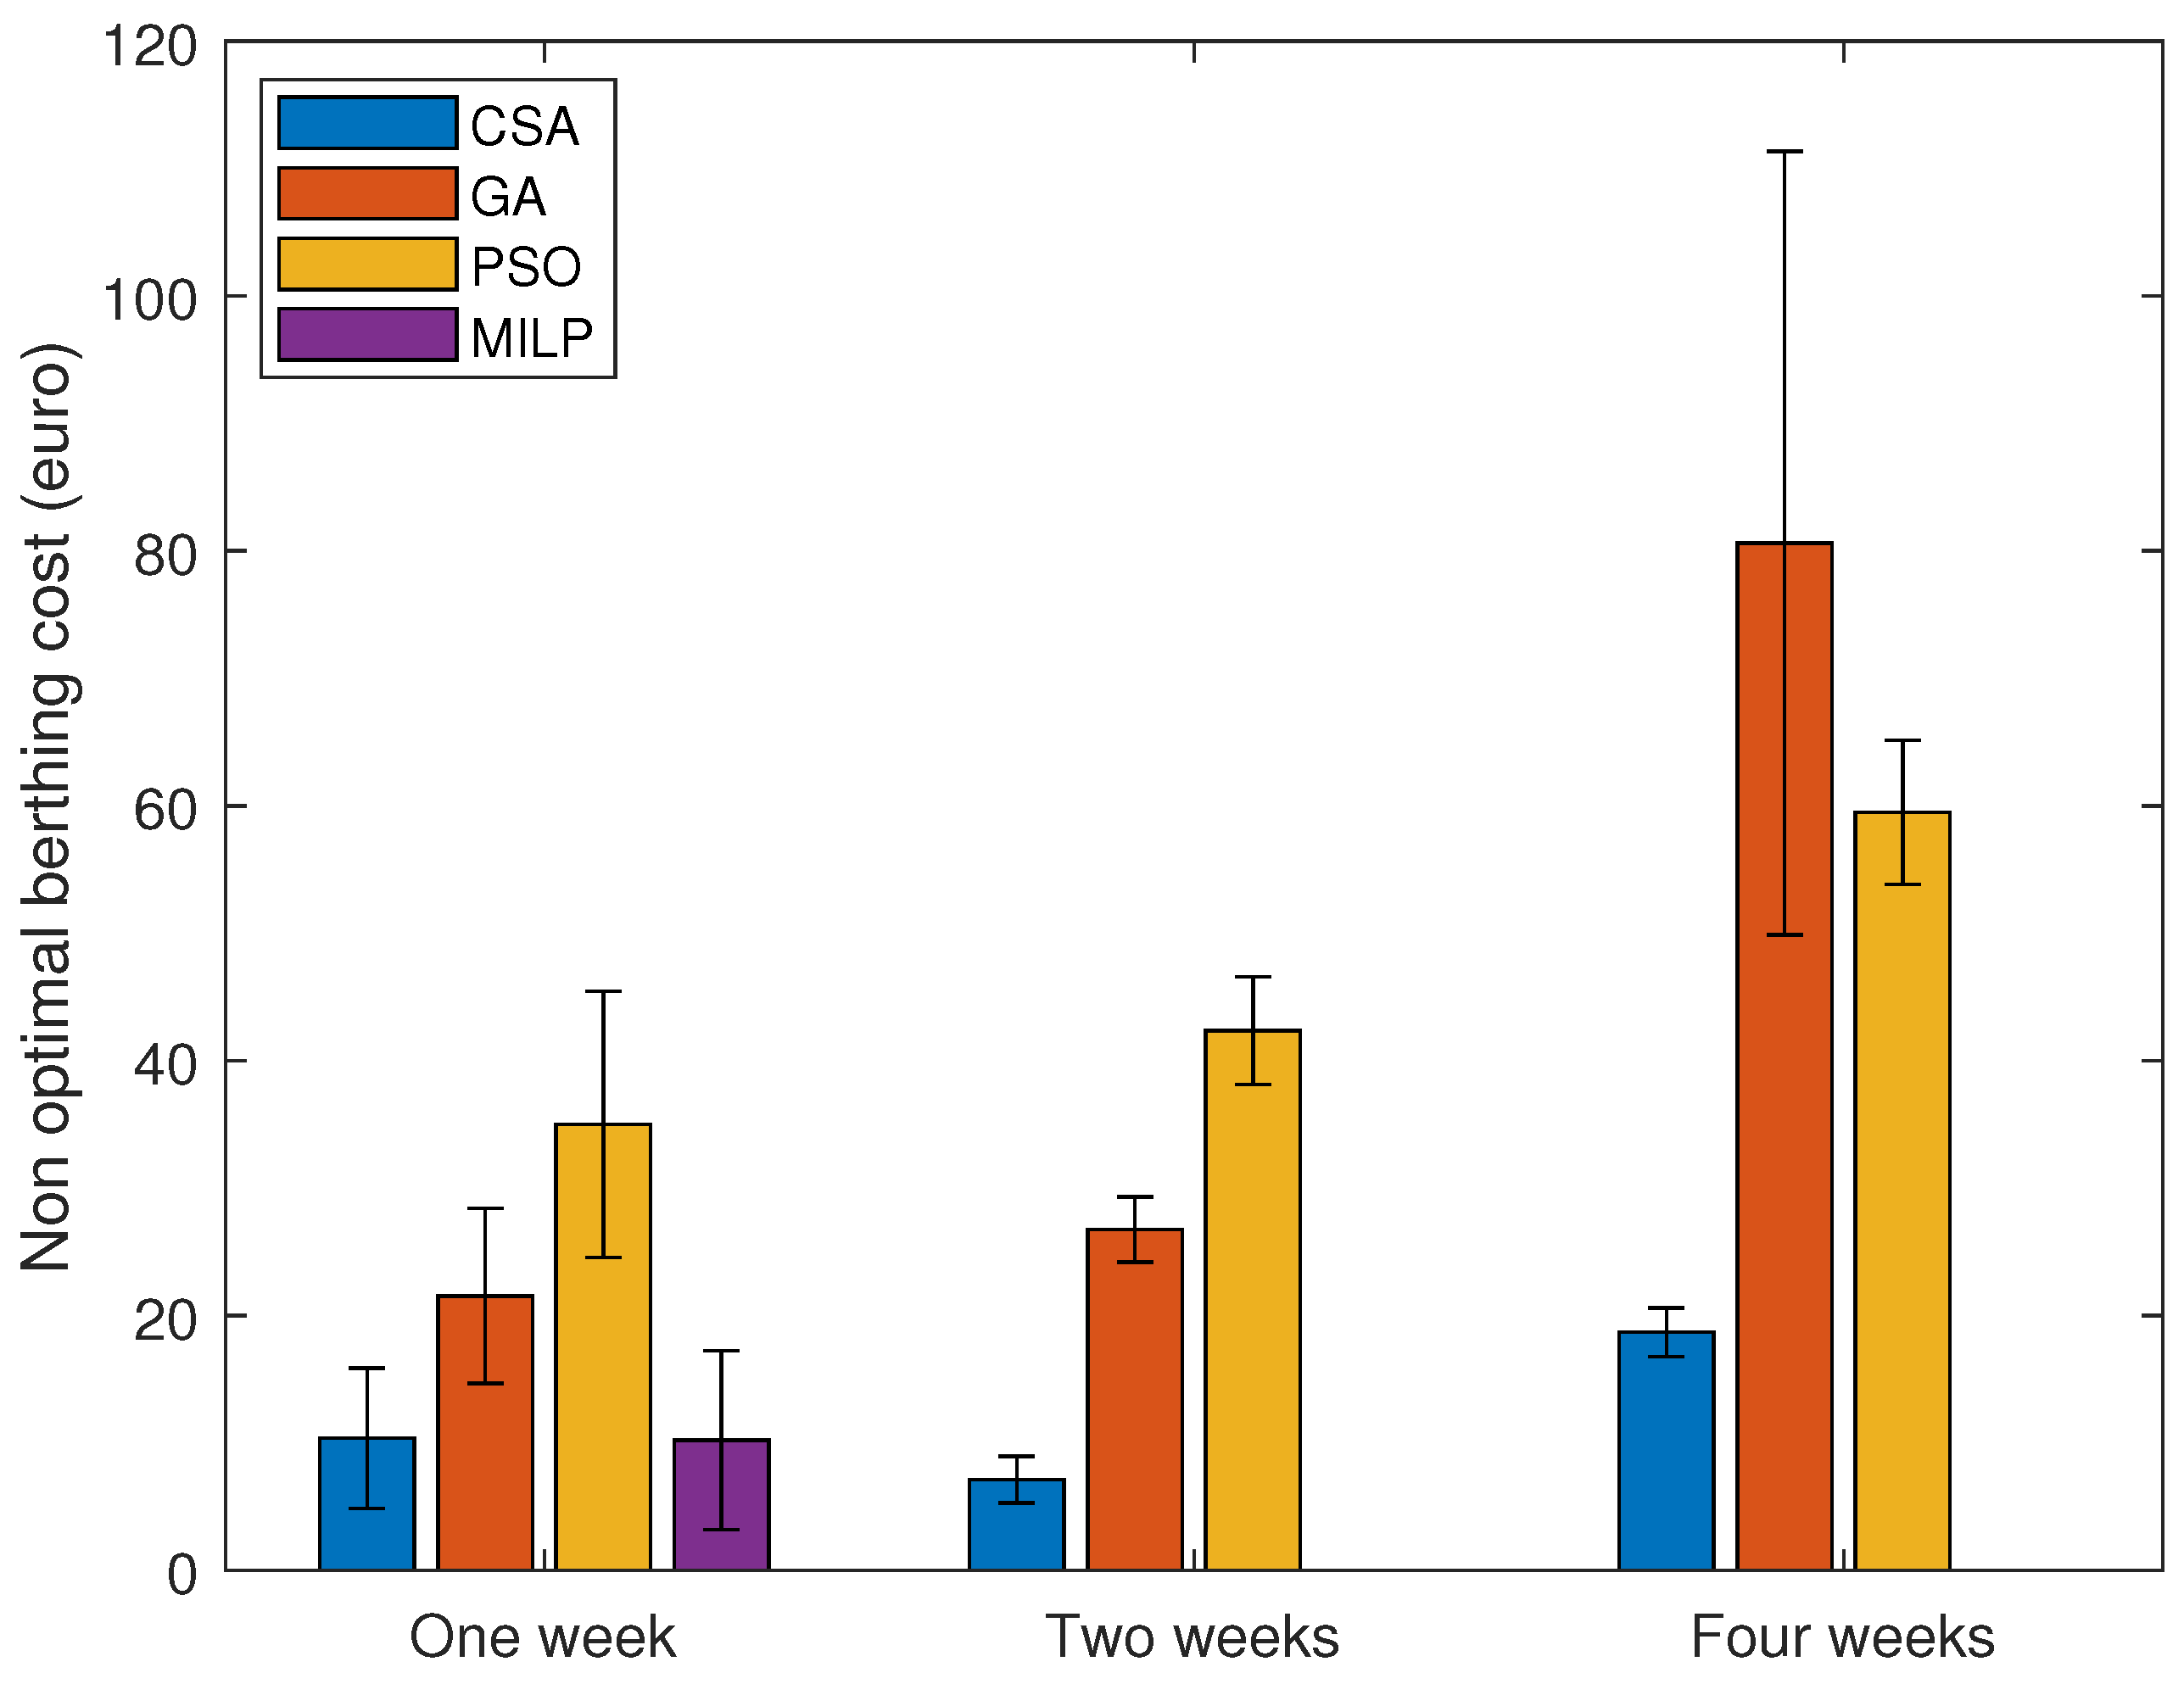
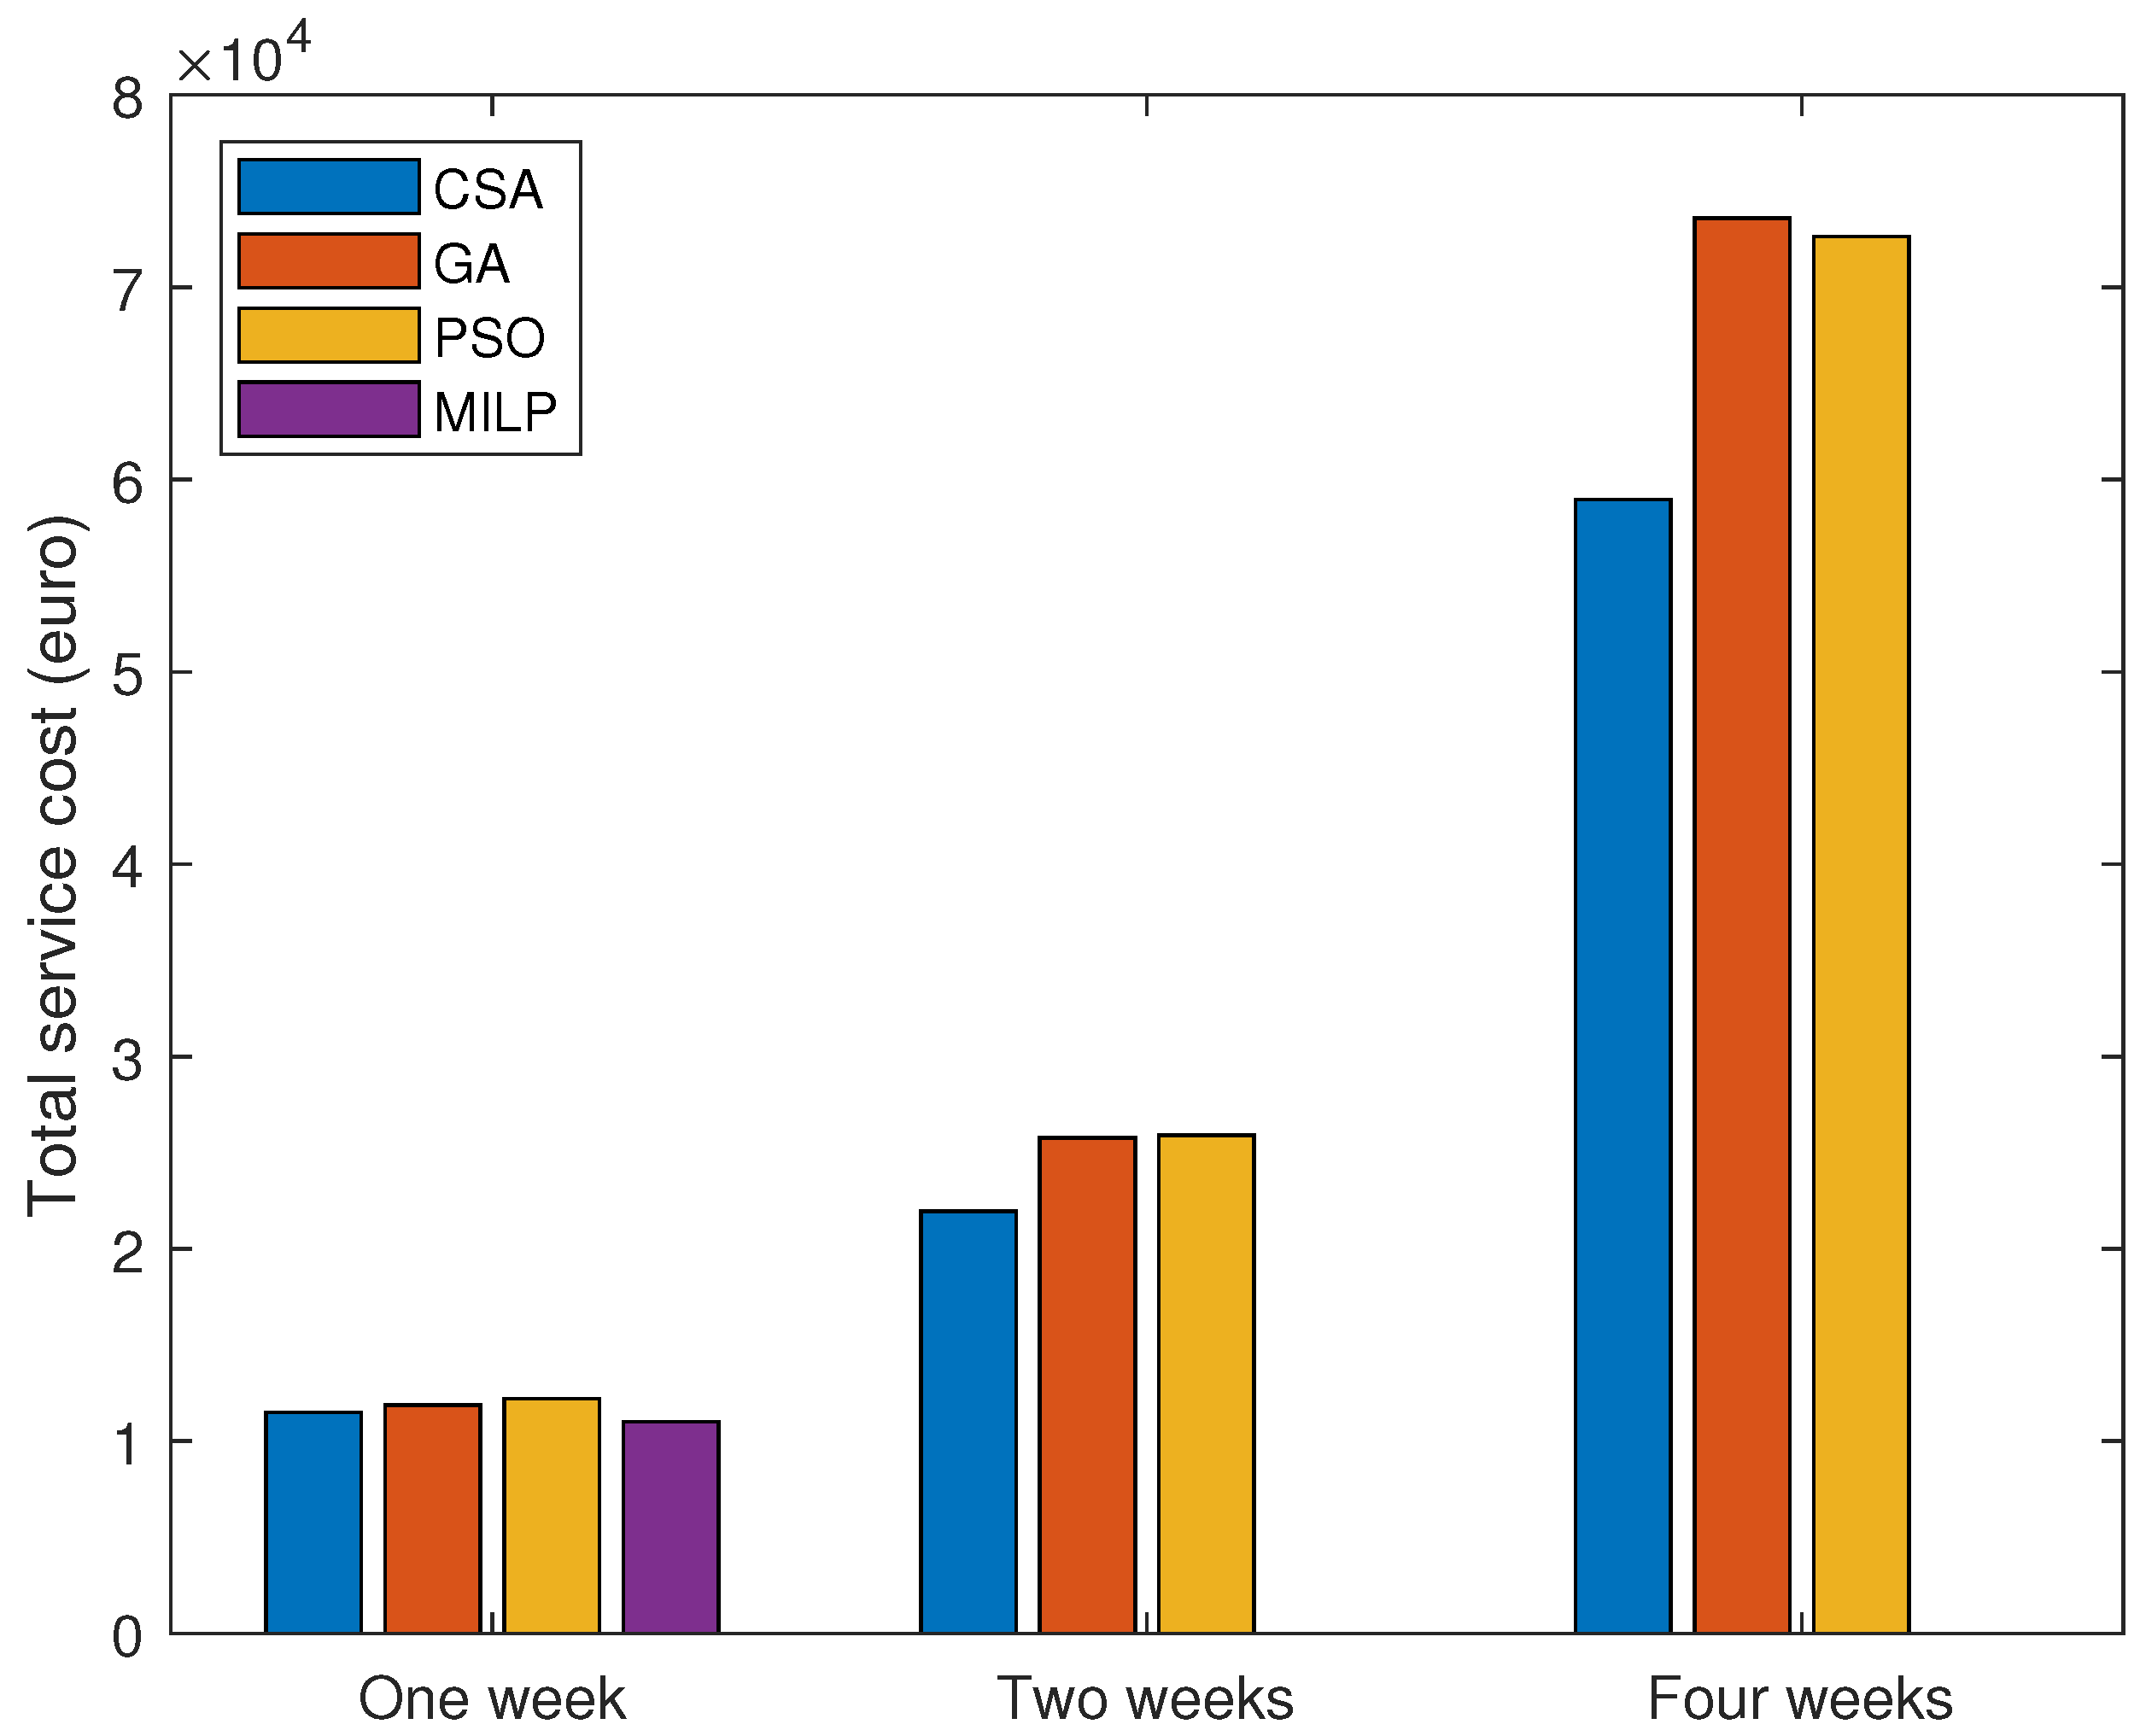
5. Computational Experiments

To verify the efficiency and effectiveness of the proposed approach, this section discusses the results obtained from several experiments using both random and real data from the Port of Limassol, Cyprus. For the real data, we consider different planning horizons of one week, two weeks, and four weeks during March 2019, with 28 ships arriving for loading and unloading in the first week, 68 ships in the first two weeks, and 138 ships in four weeks, respectively.
CSA, GA, PSO, FCFS, and MILP have all been implemented to perform a comparative analysis. Grid search was used to tune the parameters for each metaheuristic approach. For the CSA implementation, we set the number of host nests to 100, and the discovery rate to 0.45. The GA implementation is based on [14]; however, the parameters of GA are not presented in that study. Hence, we set the population size as 100, the crossover rate as 0.90, and the mutation rate as 0.10 based on other GA-based studies [23,24]. Regarding PSO, inertia weight, local learning coefficient, global learning coefficient, and population size are set to 1, 1.5, 2.0, and 100, respectively. For all heuristic algorithms, i.e., CSA, GA, and PSO, the maximum number of iterations, i.e., the termination criterion, is set as 1000.
Furthermore, following the objective function (Equation (7)), the performance metrics of our experiments are total service cost (that includes handling cost, waiting cost, and several penalties) along with computational time. All experiments are conducted on an Intel Core i7 2.4 GHz computer system with 16 GB RAM. All compared algorithms are developed in MATLAB on the same computer system and tested on the same datasets.

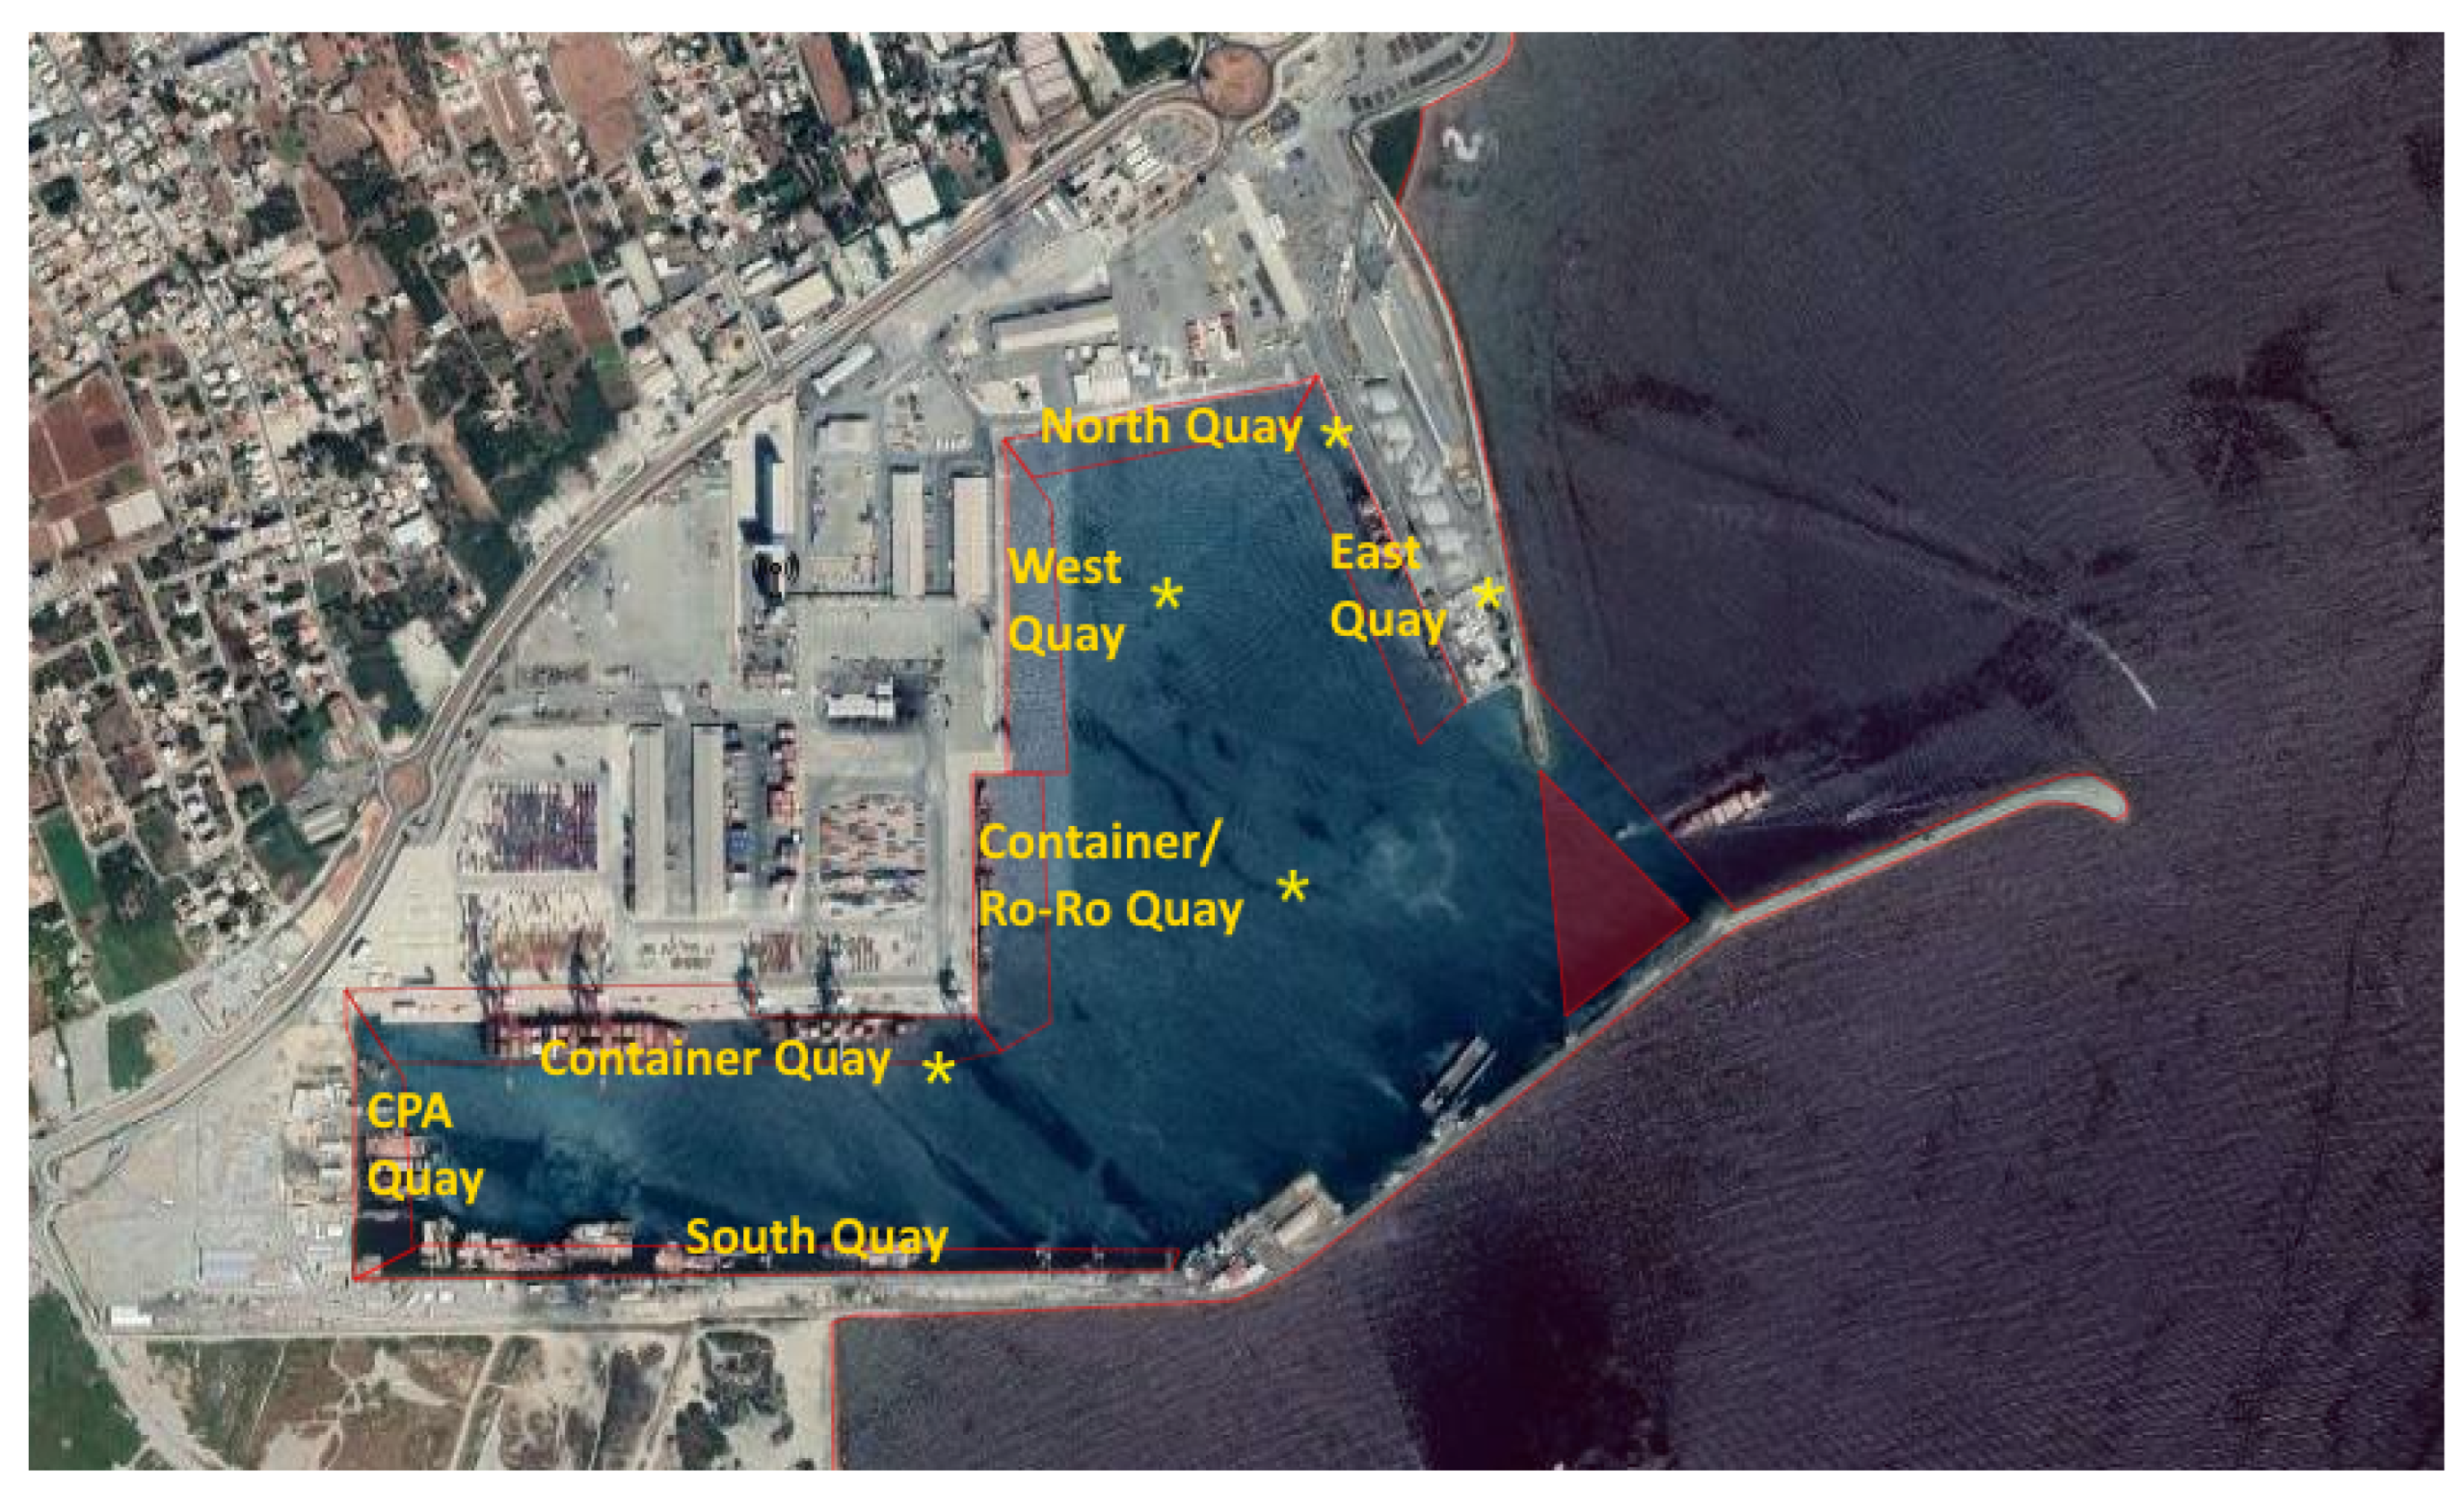
5.1. Real Data Instances from Port of Limassol

As for the multi-quay data instances, this study uses real data collected from the Port of Limassol, Cyprus. The Limassol port has five commercial continuous quays with different lengths, Container/Ro-Ro Quay: 450 m; Container Quay: 800 m; East Quay: 480 m; West Quay: 770 m; and North Quay: 430 m. For each ship, the ETA, HT, ETD, PBQ, ABQ, PBP, and LoS are known. It is important to note that the real data do not include PBPs and ABQs for arriving vessels. Hence, we added PBPs randomly, as shown in the seventh column of Table 3. We also assign up to one ABQ for each vessel based on the port characteristics (e.g., availability of cranes, passenger boarding bridges) and ship type (e.g., container ship, passenger ship). In particular, the Container/Ro-Ro Quay is ABQ for ships having Container Quay as PBQ and vice versa and the West Quay is ABQ for ships with North Quay as PBQ and vice versa. There is no ABQ for ships with PBQ East Quay as this is the only quay that can handle passenger vessels. The real world data are collected through an online system developed for the STEAM Project [5].
Figure 8 shows the solutions for berth allocation developed by the four implemented algorithms, i.e., CSA, GA, PSO, and MILP. In this figure, each rectangle represents a ship, with the x-axis indicating the berthing time and the y-axis indicating the berthing position for a given ship. The blue colored rectangles show the ships moored at their preferred berth. The red rectangles, on the other hand, show the ships that moored at their ABQs instead. Based on the cost models, the implemented methods move a ship to an ABQ if the waiting time before the optimal berth is long, resulting in a delayed departure for the ships. A particular vessel may also be moored at an ABQ if its PBP is unavailable for a long time and a NOB position causes high costs or delays in delivering containers to the designated storage area. From this figure, it can also be seen that there is a safety distance and a safety time between any two vessels during berthing, which are subject to the following constraints. The safety time is set to one time slot (30 min) and the safety distance between two vessels is set to 10 m. By respecting the overlapping constraint (presented in Table 2 and visualized in Figure 4), none of the solutions allow for any scheduling overlapping between any two ships. For instance, in order to avoid overlapping, ship 21 (highlighted with red color in Figure 8) is moored at its ABQ (North Quay) instead of its PBQ (West Quay) using CSA and PSO methods. However, GA and MILP shift ship 23 to its ABQ instead to avoid overlapping.
Figure 9 shows the mean difference (and standard error) between the proposed berthing times by the various algorithms and the optimal berthing times for the three scenarios (i.e., one week, two weeks, and three weeks). From this figure, it can be seen that there is no difference in case of MILP, i.e., it assigns ships always at optimal berthing times, for the one-week scenario. However, it is important to note that MILP can only solve the problem for one week planning horizon and it runs out of memory for the other two scenarios (i.e., two weeks and four weeks). On the other hand, when we compare CSA with the other heuristic methods, we observe that CSA provides a near-optimal solution (lowest mean difference) in all tested scenarios. The mean difference between proposed and optimal berthing times using CSA method are 0.32, 0.54, and 0.69 interval for one week, two weeks, and four weeks, respectively. On the contrary, PSO performs better than GA in the cases of one week and two weeks, but worse in the four-weeks case. The highest mean difference are 0.39 (using GA), 1.38 (using GA), and 1.69 (using PSO) intervals in one-week, two-weeks, and four-weeks scenarios, respectively.
Figure 10 shows the mean and standard error for non-optimal berthing costs (in Euro) for all arriving vessels. This figure presents the results for all four algorithms and the three considered scenarios, i.e., one week, two weeks, and four weeks. It can be noted from the figure that the minimum NOB cost is achieved using MILP, closely followed by CSA; however, MILP can only solve the problem for one week planning horizon. Furthermore, when we compare the CSA-based solution with other heuristic methods, it can be noticed that CSA has the lowest NOB mean cost and standard error, in all tested scenarios. On the other hand, GA performs better compared to PSO in one-week and two-weeks scenarios but worst in the four-weeks scenario. Finally, as the planning period grows from one week to four weeks, the performance of GA and PSO worsens at a much higher rate that CSA, showcasing the robustness of the CSA approach to handle longer planning periods.
Figure 11 shows the total service cost incurred for all arriving ships in the planning horizon of one week, two weeks, and one month (four weeks). From this figure, it can be seen that the total service cost (in Euro) for the planning horizon of one week is minimal when MILP is used (i.e., 11,005). In contrast, CSA has the lowest cost (11,095) compared to the other two heuristic methods (i.e., GA and PSO). The highest service cost for a planning horizon of one week is 11,795 when PSO is used. As the planning horizon increases to two and four weeks, the CSA approach is able to achieve the lowest service cost, while the difference between the CSA and the other two metaheuristic approaches increases.
For a more in-depth comparative analysis, Table 4 shows the different costs (i.e., waiting cost, non-optimal berth allocation cost, late departure cost, normal handling cost, and total service cost) along with the computation times for different planning horizons using all five implemented algorithms. We conducted experiments with different data instances to validate the productivity of the proposed CSA-based method. From this table, we can see that the MILP method has the highest computation time of 775.77 s (~13 min) for the planning horizon of one week. The MILP method provides an optimal solution with the lowest total service cost (and lowest individual costs). However, if we increase the planning horizon, and therefore the number of arriving vessels, from one week to two weeks or four weeks, MILP cannot solve the problem and runs out of memory. The NOB cost includes penalty costs when a vessel s is moored at a location other than its PBP or at a quay other than its PBQ. As shown in Equation (4), the penalty is calculated based on the absolute difference between the proposed and preferred berthing positions, i.e., | P B P s B P s | · C s n o b , where C s n o b is equal to EUR 5 per meter. If a vessel berths at its ABQ instead of its PBQ, an additional fixed penalty of EUR 50 is charged; however, berthing a vessel at a location other than ABQ and PBQ incurs an infinite penalty (and thus is not possible). From Table 4, it can be seen that the penalty for NOB is lowest when MILP is used (EUR 235), closely followed by FCFS and CSA with EUR 255 and 280, respectively. PSO has the highest penalty cost of EUR 980 and for GA it is EUR 560. As for waiting time and late departure costs, it can be observed from Table 4, FCFS has the highest cost of EUR 700 and 1000, respectively. In the case of a one-week scheduling period, FCFS takes the least computation time of 12.33 s, closely followed by GA and CSA with 18.95 and 21.91 s, respectively, while PSO takes 73.59 s. Furthermore, if we run experiments for two-weeks and four-weeks scenarios, it can be seen from Table 4 that CSA always provides an optimal solution (minimum total service cost) within the least computation time, even less than GA and PSO. FCFS also takes minimum computation time (74.32 s for two-week and 110.24 for four-week scenarios), however, the proposed cost is too high, especially in a four-week scenario (that is EUR 140275). In two-weeks and four-weeks scenarios, CSA again provides minimum total service costs of EUR 21,955 and 58,950, respectively. In the case of two weeks and four weeks, the CSA takes 70.60 and 133.27 s, respectively. In contrast, GA and PSO take 332.96 and 223.33 s for two weeks and 768.81 and 642.95 s for four weeks, respectively. Table 4 also presents the percentage of deviation by comparing all methods and considering the proposed CSA method as a base value. It can be observed from the % of deviation that there only MILP provided better results in terms of total service cost in the one-week case scenario. In all other cases, the compared methods leads to a higher total service cost compared to our proposed method. From the above analysis, we can conclude that the newly developed CSA-based solution for MQ-BAP is more efficient and always provides a near-optimal solution.

5.2. Randomly Generated Data Instances

Finally, to verify the performance and scalability of the proposed CSA-based method, we conduct extensive experiments with randomly (uniformly) generated data instances, in a similar way as it was performed in [14,19,23,43]. We generated 40 data instances considering 10–150 arriving ships, 1–30 days of planning, and 1–5 berthing quays (see Table 5). We retested all developed methods (i.e., CSA, GA, PSO, and MILP) with all data instances and found that MILP was only able to solve the problem when considering up to 30 ships with 5 quays (see Table 5). With more ships, the computation ran out of memory. When we compare our proposed CSA method with the two heuristics, i.e., PSO and GA, it can be seen that our method performs well in most cases in terms of minimum total cost and computation time. However, in some of the smaller-instance cases, it is observed that GA performs well. For example, if we consider 10 ships, GA performs well in terms of service cost and provides very close to the optimal solution (MILP solution). However, when we increase the number of vessels and the number of quays, it can be seen that our method performs better than GA and PSO in most cases. Finally, if we compare the total service cost of all scenarios, we notice that the CSA has minimum average cost of EUR 789,890, compared to GA with EUR 998,158 and PSO with EUR 877,200.
In terms of computational time, MILP requires high computational time and takes up to 918.95 s (15.3 min) to solve 30 ships, while it cannot solve the problem with more than 30 ships. In contrast, CSA takes only 39.6 s to solve the same problem. Moreover, GA seems to be more efficient when small data instances are considered; however, it takes too much time when we apply it to larger data instances. For example, it takes 2632 s to solve the problem with 120 ships. In contrast, our proposed CSA is always consistent and takes affordable time to solve the problem. CSA solves the problem with 120 ships in only 191.28 s. When we compare CSA with PSO, we find that PSO requires less computation time compared to CSA; however, PSO often provides solutions that are far from the optimal solution. Based on experiments with real and random data, we can conclude that CSA always performs well and provides a near-optimal solution with affordable computation time.

6. Discussion

Although this study solves MQ-BAP at the operational level with the goal of reducing the total service cost along with reducing computation time, it can also provide several insights to terminal managers and policymakers. For instance, our proposed solution helps managers in decision-making, especially in a complex environment. When a ship arrives later than the expected arrival time or some additional ships arrive without notice, the newly developed method helps managers readjust their berth allocation plan to accommodate these changes. Since terminal congestion is one of the most important problems for managers, the newly developed method can deal with the congestion by mooring some ships at the nearest berthing quay (known as an alternative berthing quay).
Moreover, the methodology based on computational intelligence helps the management to assign the nearest berthing position (this term is introduced as PBP) to the arriving vessels in relation to the assigned storage area in the marshalling yard. In this way, the cost and time of transfer can be minimized. Finally, with our proposed method, maximum productivity of container terminals can be achieved.
Furthermore, the proposed approach can be utilized for making resource planning and capacity expansion decisions by creating and evaluating hypothetical scenarios based on anticipated ship traffic. For instance, by repeatedly solving the MQ-BAP with increasing number of arriving ships, an administrator can investigate how the berth waiting times are affected and determine what is the maximum number of ships the current port can sustain without surpassing some threshold on average waiting time. In another scenario, the benefit (or not) of adding a new quay can also be determined by increasing the number of available quays while keeping the number of vessels fixed. As can be observed by our results in Table 5, when the number of arriving ships is small (10–20), using two quays rather than one leads to a lower service cost (and lower waiting times/delays in departures). However, adding more quays does not significantly change the service cost as two quays are enough to handle this traffic. When the number of ships is much larger (e.g., 120 ships), on the other hand, having up to four quays can significantly lower the service cost.

7. Conclusions

In this study, we deal with a special variant of the continuous BAP, namely the multi-quay BAP, where more than one quay is available for mooring the arriving ships. The MQ-BAP is formulated as a mixed-integer linear problem and then solved using exact and metaheuristic methods, with the main objective of minimizing the total service cost while reducing the waiting time before berthing and the delayed departures of the ships. We considered the case of the Port of Limassol and used real data collected from the same port. Moreover, this study also considers several practical constraints of the port and introduces the new concept of alternative berthing quay (ABQ). The purpose of ABQ is to reduce long waiting times of vessels. For example, if a vessel’s preferred position is occupied for a long time, the vessel can be moored at the nearest mooring quay instead.
We have conducted several experiments using both random and real data from the Port of Limassol to corroborate our model and verify the effectiveness of our proposed CSA-based method. We have also implemented for comparison purposes the exact method (i.e., MILP) and state-of-the-art popular methods, i.e., GA, PSO, and FCFS. Results reveal that the exact method can only solve the problem for a one-week planning horizon with high computation time. In contrast, the CSA-based method is able to solve all tested scenarios and outperforms the other compared methods (GA, PSO, and FCFS) in terms of both minimum service cost and computation time.

Author Contributions

Conceptualization, H.H. and M.P.M.; methodology, S.A.; software, S.A.; validation, S.A.; formal analysis, S.A. and H.H.; data curation, S.A.; writing—original draft preparation, S.A.; writing—review and editing, S.A., H.H. and M.P.M.; visualization, S.A.; supervision, H.H. and M.P.M.; funding acquisition, H.H. and M.P.M. All authors have read and agreed to the published version of the manuscript.

Funding

This research was funded by the European Union’s Horizon Europe program for Research and Innovation through the aerOS project under Grant No. 101069732.

Institutional Review Board Statement

Not applicable.

Informed Consent Statement

Not applicable.

Data Availability Statement

The code, data, and results are available at https://github.com/cut-dicl/cibap (accessed on 10 May 2023).

Conflicts of Interest

The authors declare no conflict of interest.

Abbreviations

The following abbreviations are used in this manuscript:
ABQAlternative berthing quay
BAPBerth allocation problem
CSACuckoo search algorithm
ETAExpected time of arrival
ETDExpected time of departure
GAGenetic algorithm
HTHandling time
LoSLength of ship
MCTMaritime container terminal
MQ-BAPMulti-quay BAP
NOBNon-optimal berthing
PBPPreferred berthing position
PBQPreferred berthing quay
PSOParticle swarm optimization
QCsQuay cranes

References

  1. Aslam, S.; Michaelides, M.P.; Herodotou, H. Internet of Ships: A Survey on Architectures, Emerging Applications, and Challenges. IEEE Internet Things J. 2020, 7, 9714–9727. [Google Scholar] [CrossRef]
  2. Review of Maritime Transport 2021. United Nations Conference on Trade and Development, New York. 2021. Available online: https://unctad.org/system/files/official-document/rmt2021_en_0.pdf (accessed on 19 March 2023).
  3. Lind, M.; Michaelides, M.P.; Robert, W.; Richard, W.T. Maritime Informatics; Springer: Cham, Switzerland, 2020. [Google Scholar]
  4. Lind, M.; Michaelides, M.P.; Robert, W.; Richard, W.T. Maritime Informatics: Additional Perspectives and Applications; Springer: Cham, Switzerland, 2021. [Google Scholar]
  5. STEAM: Sea Traffic Management in the Eastern Mediterranean. 2022. Available online: https://steam.cut.ac.cy (accessed on 19 March 2022).
  6. STM: Sea Traffic Management Validation. 2022. Available online: http://stmvalidation.eu/ (accessed on 20 March 2022).
  7. Michaelides, M.P.; Herodotou, H.; Lind, M.; Watson, R.T. Port-2-port communication enhancing short sea shipping performance: The case study of Cyprus and the Eastern Mediterranean. Sustainability 2019, 11, 1912. [Google Scholar] [CrossRef] [Green Version]
  8. Lind, M.; Michaelides, M.; Ward, R.; Herodotou, H.; Watson, R. Boosting Data-Sharing to Improve Short Sea Shipping Performance: Evidence from Limassol Port Calls Analysis. Technical Report 35, UNCTAD Transport and Trade Facilitation Newsletter No. 82—Second Quarter. 2019. Available online: chrome-extension://efaidnbmnnnibpcajpcglclefindmkaj/https://www.cut.ac.cy/digitalAssets/122/122275_1002019-UNCTAD-Data_sharing_SSS.pdf (accessed on 10 June 2022).
  9. De, A.; Pratap, S.; Kumar, A.; Tiwari, M. A hybrid dynamic berth allocation planning problem with fuel costs considerations for container terminal port using chemical reaction optimization approach. Ann. Oper. Res. 2020, 290, 783–811. [Google Scholar] [CrossRef] [Green Version]
  10. Iris, Ç.; Lalla-Ruiz, E.; Lam, J.S.L.; Voß, S. Mathematical programming formulations for the strategic berth template problem. Comput. Ind. Eng. 2018, 124, 167–179. [Google Scholar] [CrossRef]
  11. Xiang, X.; Liu, C. An expanded robust optimisation approach for the berth allocation problem considering uncertain operation time. Omega 2021, 103, 102444. [Google Scholar] [CrossRef]
  12. Dulebenets, M.A. An Adaptive Island Evolutionary Algorithm for the berth scheduling problem. Memetic Comput. 2020, 12, 51–72. [Google Scholar] [CrossRef]
  13. Bacalhau, E.T.; Casacio, L.; de Azevedo, A.T. New hybrid genetic algorithms to solve dynamic berth allocation problem. Expert Syst. Appl. 2021, 167, 114198. [Google Scholar] [CrossRef]
  14. Frojan, P.; Correcher, J.F.; Alvarez-Valdes, R.; Koulouris, G.; Tamarit, J.M. The continuous Berth Allocation Problem in a container terminal with multiple quays. Expert Syst. Appl. 2015, 42, 7356–7366. [Google Scholar] [CrossRef]
  15. Map of the Port of Limassol, Cyprus by Ship Tracking Intelligence Platform. 2022. Available online: https://ais.cut.ac.cy (accessed on 10 May 2023).
  16. Krimi, I.; Todosijević, R.; Benmansour, R.; Ratli, M.; El Cadi, A.A.; Aloullal, A. Modelling and solving the multi-quays berth allocation and crane assignment problem with availability constraints. J. Glob. Optim. 2020, 78, 349–373. [Google Scholar] [CrossRef]
  17. Gutierrez, F.; Lujan, E.; Asmat, R.; Vergara, E. Fully fuzzy linear programming model for the berth allocation problem with two quays. In Uncertainty Management with Fuzzy and Rough Sets; Springer: Cham, Switzerland, 2019; pp. 87–113. [Google Scholar]
  18. Aslam, S.; Michaelides, M.P.; Herodotou, H. Optimizing Multi-Quay Berth Allocation using the Cuckoo Search Algorithm. In Proceedings of the 8th International Conference on Vehicle Technology and Intelligent Transport Systems (VEHITS), Online, 27–29 April 2022; pp. 124–133. [Google Scholar]
  19. Ernst, A.T.; Oğuz, C.; Singh, G.; Taherkhani, G. Mathematical models for the berth allocation problem in dry bulk terminals. J. Sched. 2017, 20, 459–473. [Google Scholar] [CrossRef]
  20. Lee, D.H.; Chen, J.H.; Cao, J.X. The continuous berth allocation problem: A greedy randomized adaptive search solution. Transp. Res. Part E Logist. Transp. Rev. 2010, 46, 1017–1029. [Google Scholar] [CrossRef]
  21. Seyedalizadeh Ganji, S.; Babazadeh, A.; Arabshahi, N. Analysis of the continuous berth allocation problem in container ports using a genetic algorithm. J. Mar. Sci. Technol. 2010, 15, 408–416. [Google Scholar] [CrossRef]
  22. Chen, L.; Huang, Y. A dynamic continuous berth allocation method based on genetic algorithm. In Proceedings of the 2017 3rd IEEE International Conference on Control Science and Systems Engineering (ICCSSE), Beijing, China, 17–19 August 2017; pp. 770–773. [Google Scholar]
  23. Alsoufi, G.; Yang, X.; Salhi, A. Robust berth allocation using a hybrid approach combining branch-and-cut and the genetic algorithm. In Proceedings of the International Workshop on Hybrid Metaheuristics, Plymouth, UK, 8–10 June 2016; pp. 187–201. [Google Scholar]
  24. Ting, C.J.; Wu, K.C.; Chou, H. Particle swarm optimization algorithm for the berth allocation problem. Expert Syst. Appl. 2014, 41, 1543–1550. [Google Scholar] [CrossRef]
  25. Guo, L.; Wang, J.; Zheng, J. Berth allocation problem with uncertain vessel handling times considering weather conditions. Comput. Ind. Eng. 2021, 158, 107417. [Google Scholar] [CrossRef]
  26. De Oliveira, R.M.; Mauri, G.R.; Lorena, L.A.N. Clustering search for the berth allocation problem. Expert Syst. Appl. 2012, 39, 5499–5505. [Google Scholar] [CrossRef]
  27. Mohammadi, M.; Forghani, K. Solving a stochastic berth allocation problem using a hybrid sequence pair-based simulated annealing algorithm. Eng. Optim. 2018, 51, 1810–1828. [Google Scholar] [CrossRef]
  28. Iris, Ç.; Pacino, D.; Ropke, S.; Larsen, A. Integrated berth allocation and quay crane assignment problem: Set partitioning models and computational results. Transp. Res. Part E Logist. Transp. Rev. 2015, 81, 75–97. [Google Scholar] [CrossRef] [Green Version]
  29. Aslam, S.; Michaelides, M.P.; Herodotou, H. Dynamic and Continuous Berth Allocation using Cuckoo Search Optimization. In Proceedings of the 7th International Conference on Vehicle Technology and Intelligent Transport Systems (VEHITS), Online, 28–30 April 2021; pp. 72–81. [Google Scholar]
  30. Aslam, S.; Michaelides, M.P.; Herodotou, H. Enhanced Berth Allocation Using the Cuckoo Search Algorithm. SN Comput. Sci. 2022, 3, 1–15. [Google Scholar] [CrossRef]
  31. Cheimanoff, N.; Fontane, F.; Kitri, M.N.; Tchernev, N. Exact and heuristic methods for the berth allocation problem with multiple continuous quays in tidal bulk terminals. Expert Syst. Appl. 2022, 201, 117141. [Google Scholar] [CrossRef]
  32. Krimi, I.; Benmansour, R.; El Cadi, A.A.; Deshayes, L.; Duvivier, D.; Elhachemi, N. A rolling horizon approach for the integrated multi-quays berth allocation and crane assignment problem for bulk ports. Int. J. Ind. Eng. Comput. 2019, 10, 577–591. [Google Scholar] [CrossRef]
  33. Raa, B.; Dullaert, W.; Van Schaeren, R. An enriched model for the integrated berth allocation and quay crane assignment problem. Expert Syst. Appl. 2011, 38, 14136–14147. [Google Scholar] [CrossRef]
  34. Hu, Q.M.; Hu, Z.H.; Du, Y. Berth and quay-crane allocation problem considering fuel consumption and emissions from vessels. Comput. Ind. Eng. 2014, 70, 1–10. [Google Scholar] [CrossRef]
  35. Theofanis, S.; Boile, M.; Golias, M. An optimization based genetic algorithm heuristic for the berth allocation problem. In Proceedings of the 2007 IEEE Congress on Evolutionary Computation, Singapore, 25–28 September 2007; pp. 4439–4445. [Google Scholar]
  36. Yang, X.S.; Deb, S. Cuckoo Search via Lévy Flights. In Proceedings of the World Congress on Nature & Biologically Inspired Computing (NaBIC), Coimbatore, India, 9–11 December 2009; pp. 210–214. [Google Scholar]
  37. Gandomi, A.H.; Yang, X.S.; Alavi, A.H. Cuckoo search algorithm: A metaheuristic approach to solve structural optimization problems. Eng. Comput. 2013, 29, 17–35. [Google Scholar] [CrossRef]
  38. Holland, J.H. Adaptation in Natural and Artificial Systems: An Introductory Analysis with Applications to Biology, Control, and Artificial Intelligence; MIT Press: Cambridge, MA, USA, 1992. [Google Scholar]
  39. Katoch, S.; Chauhan, S.S.; Kumar, V. A review on genetic algorithm: Past, present, and future. Multimed. Tools Appl. 2021, 80, 8091–8126. [Google Scholar] [CrossRef]
  40. Kennedy, J.; Eberhart, R. Particle swarm optimization. In Proceedings of the International Conference on Neural Networks (ICNN’95), Perth, WA, Australia, 27 November–1 December 1995; Volume 4, pp. 1942–1948. [Google Scholar]
  41. Hsu, H.P.; Chiang, T.L. An improved shuffled frog-leaping algorithm for solving the dynamic and continuous berth allocation problem (DCBAP). Appl. Sci. 2019, 9, 4682. [Google Scholar] [CrossRef] [Green Version]
  42. Lee, Y.; Chen, C.Y. An optimization heuristic for the berth scheduling problem. Eur. J. Oper. Res. 2009, 196, 500–508. [Google Scholar] [CrossRef]
  43. Xiang, X.; Liu, C.; Miao, L. A bi-objective robust model for berth allocation scheduling under uncertainty. Transp. Res. Part E Logist. Transp. Rev. 2017, 106, 294–319. [Google Scholar] [CrossRef]
Figure 1. A satellite view of the Port of Limassol, Cyprus, illustrating its seven berthing quays (taken from [15]). Note: Only the quays marked with a ∗ are used for commercial purposes.
Jmse 11 01280 g001
Figure 2. BAP solution with two berthing quays (Quay 1: continuous and Quay 2: discrete) and 10 arriving ships. Each rectangle denotes a ship, whose height (y-dimension) shows the ship’s length and whose width (x-dimension) represents the handling time (in hours) of the ship.
Jmse 11 01280 g002
Figure 3. An illustration of the berthing timeline (showing waiting, handling, and late departure times).
Jmse 11 01280 g003
Figure 4. An illustration of overlapping constraint (12) with three arriving ships (ship s, j, and k) with different berthing times, berthing positions, and lengths. This figure shows the restricted areas for ships j and k (using dotted boxed) to avoid overlap with ship s, the already scheduled ship.
Jmse 11 01280 g004
Figure 5. Solution representation by CSA considering six arriving vessels.
Jmse 11 01280 g005
Figure 6. Flow chart of GA.
Jmse 11 01280 g006
Figure 7. Flow chart of PSO.
Jmse 11 01280 g007
Figure 8. Berth allocation solutions by the four compared approaches for ships arriving over one week planning horizon. (a) solution by CSA; (b) solution by GA; (c) solution by PSO; and (d) solution by MILP.
Jmse 11 01280 g008
Figure 9. Mean difference between optimal and proposed berthing time for all vessels per method. MILP obtains zero difference for one week and is not able to run for two weeks and four weeks.
Jmse 11 01280 g009
Figure 10. Non-optimal berthing (NOB) cost for all vessels per method. MILP is not able to run for two weeks and four weeks.
Jmse 11 01280 g010
Figure 11. Total service cost for arriving vessels in one, two, and four weeks, for each approach. MILP is not able to run for two weeks and four weeks.
Jmse 11 01280 g011
Table 1. Notations.
Table 1. Notations.
NotationExplanation
Cost-related variables
C s d Penalty cost for late departure (per hour) of ship s
C s h Handling cost per time unit (hour) of ship s
C s n o b Penalty cost for NOB position per m of ship s
C s n o q Penalty cost for NOB quay of ship s
C s w Waiting cost per time unit (hour) of ship s
Time-related variables
S E Safety entrance time between two ships
S T Safety time between two ships during berthing
T s a d Actual departure time of ship s
T s d Late departure time of ship s
T s e a Expected arrival time of ship s
T s e d Expected departure time of ship s
T s h Handling time of ship s
T s w Waiting time of ship s
Other variables
H P s q c Handling productivity of QCs assigned to ship s
L o a d s Total load (in TEUs) on ships s
L b Length of a berth segment b (in a discrete quay)
L q Length of a (continuous) quay q
L s Length of ship s
N s q c Number of quay cranes assigned to ship s
S D Safety distance (in meters) between two ships
Decision variables
Q s Berthing quay of ship s
B P s Berthing position of ship s on Q s
T s b Berthing time of ship s
x s q b t 1 if ship s is scheduled at position b of quay q at time t; 0 otherwise
Indices
s S A ship s from a set of arriving ships S
q Q A quay q from a set of continuous and discrete quays Q
b B q A berth position or segment b from a set of available berth positions/segments B q in a continuous or discrete quay q, respectively
t T A time interval t from a set of time intervals T
Table 3. Example data for 28 ships that arrived during the first week of March 2018 at the Port of Limassol, Cyprus.
Ship #ETA
(Date\Time)
HT
(min.)
ETD
(Date\Time)
PBQABQPBPLoS
(m)
11\04:009191\22:30Container/Ro-Ro QuayContainer Quay240194
21\05:3014902\06:50East Quay-276139
31\14:0012852\12:50West QuayNorth Quay8484
41\15:0057005\14:03East Quay-5189
51\17:0059705\21:00West QuayNorth Quay314190
62\04:304702\13:50Container/Ro-Ro QuayContainer Quay138159
72\05:001682\09:30Container QuayContainer/Ro-Ro Quay571196
82\08:004402\15:55North QuayWest Quay53155
93\04:009053\20:50Container/Ro-Ro QuayContainer Quay31175
103\03:3013314\06:15Container QuayContainer/Ro-Ro Quay389277
113\07:3018704\14:55East Quay-358162
123\12:306403\22:40West QuayNorth Quay3488
133\23:002954\05:00Container/Ro-Ro QuayContainer Quay162133
145\05:008255\19:00West QuayNorth Quay20890
155\05:306355\16:30North QuayWest Quay190121
165\08:303155\13:15East Quay-267178
175\17:3012906\20:50Container/Ro-Ro QuayContainer Quay96129
185\16:004556\00:25North QuayWest Quay11284
195\20:006146\09:35Container QuayContainer/Ro-Ro Quay125294
206\03:309376\21:25Container/Ro-Ro QuayContainer Quay269122
216\04:304256\12:00West QuayNorth Quay35102
226\05:306356\16:30North QuayWest Quay12887
236\06:307056\18:05West QuayNorth Quay11384
246\07:3017507\12:50East Quay-207130
256\12:0010707\10:15Container QuayContainer/Ro-Ro Quay260217
266\14:007057\02:05West QuayNorth Quay21988
277\05:304557\13:05West QuayNorth Quay364121
287\09:303357\15:25North QuayWest Quay7155
Table 4. Comparative analysis of all methods when using data for 1–4 weeks (March 2018). Note that all costs are in Euros. % Deviation used the total service cost of the CSA approach as baseline.
Scenarios:One Week (28 Ships)Two Weeks (68 Ships)Four Weeks (168 Ships)
Algorithms:CSAGAPSOFCFSMILPCSAGAPSOFCFSMILPCSAGAPSOFCFSMILP
Waiting cost45055045070001850470032006700-480011,10011,65045,900-
NOB cost28056098025523548514502880200-258011,12582102205-
Late departure cost00010000002003600-400200160041,000-
Normal handling cost10,77010,77010,77010,77010,77019,62019,62019,62019,620-51,17051,17051,17051,170-
Total service cost11,50011,88012,20012,72511,00521,95525,77025,90030,120-58,95073,59572,630140,275-
% Deviation 3.306.0810.65−4.30 17.3717.9637.18- 24.8423.20137.95-
Computation time (s)21.9118.9573.596.68775.7770.60332.96223.3374.32-133.27768.81642.95110.24-
Table 5. Comparative analysis of all methods using uniform random data (10–150 vessels, 1–30 days, and 1–5 quays).
No. of ShipsDaysNo. of QuaysService Cost (Euro)Computation Time (s)
CSAGAPSOMILPCSAGAPSOMILP
1011298627944884279015.0318.3714.2326.43
21542149412,384149423.5213.5210.6914.07
3199417822478178021.5910.3812.4911.92
4173415762620157014.199.9011.7311.92
5151013642312134216.759.0411.9712.27
Avg195318024936179518.2212.2412.2215.32
1511616013,95615,046450819.3065.6665.79146.8
2315238705244262229.5325.2517.6281.35
33360293814,836292219.7469.5129.44103.46
4312825006144249418.1516.9320.00111.71
5375425004382233224.0616.1523.7117.05
Avg391151539130297622.1638.7031.3192.07
2021750474867338473831.6972.9575.21520.84
2313623965874217825.6530.7034.70292.22
3430837825468378223.5117.3735.65106.07
43588341815,644317021.0320.1838.1293.03
5338627165290262830.4113.0539.7698.56
Avg438439607923329926.4630.8544.69222.14
3021831210,64013,784732839.63125.51189.62918.95
2915683286378602236.0825.6016.46486.59
3937073086304610837.9729.7818.32354.32
4793473685656548632.2127.3516.78364.67
5915067125214507841.6629.8215.40586.76
Avg878480717467600437.5147.6151.32542.26
607130,01618,67237,674-107.49741.9143.54-
221,20814,74411,890-75.24117.4733.92-
327,57617,65832,574-69.3997.7932.88-
419,14224,36612,620-89.85348.5633.76-
515,34221,72610,686-41.83236.9432.17-
Avg22,65719,43321,089-76.76308.5335.25-
9015140,52028,23644,860-121.591350.6392.00-
224,14823,12229,348-251.66641.4845.72-
323,58432,31219,026-187.22644.3340.86-
428,72820,87229,732-129.65264.3149.49-
524,29040,33226,570-185.92240.2967.04-
Avg28,25428,97529,907-175.21628.2159.02-
12015152,09426,46451,358-191.282632.9666.33-
240,91036,15253,424-174.12968.6263.42-
340,79457,69063,590-265.191137.96103.85-
433,49872,37227,586-278.94956.9258.65-
532,664120,84449,656-239.85580.5957.73-
Avg39,99262,70449,123-229.881255.4170.00-
15030153,20240,14056,168-349.231921.07104.58-
245,82840,41245,148-377.761569.21101.52-
342,31299,87447,600-277.661633.4195.71-
445,33659,14235,012-361.271639.6590.30-
545,534108,10045,398-265.911426.03109.54-
Avg46,44269,53445,865-326.371637.87100.33-
Total789,890998,158877,200-4562.7519,797.152020.70-
Disclaimer/Publisher’s Note: The statements, opinions and data contained in all publications are solely those of the individual author(s) and contributor(s) and not of MDPI and/or the editor(s). MDPI and/or the editor(s) disclaim responsibility for any injury to people or property resulting from any ideas, methods, instructions or products referred to in the content.

