Article

Design of a Highly Compatible Underwater Wireless Power Transfer Station for Seafloor Observation Equipment

1
State Key Laboratory of Marine Geology, School of Ocean and Earth Science, Tongji University, Shanghai 200092, China
2
Center for Marine Science and Technology, Tongji University, Shanghai 201804, China
*
Author to whom correspondence should be addressed.
J. Mar. Sci. Eng. 2023, 11(6), 1205; https://doi.org/10.3390/jmse11061205
Submission received: 25 May 2023 / Revised: 3 June 2023 / Accepted: 8 June 2023 / Published: 9 June 2023
(This article belongs to the Section Ocean Engineering)

Abstract

:
Conventional cabled seafloor observatories (CSOs) power in-situ instruments via wet-mated or dry-mated direct electrical contact (DEC) connectors to achieve long-term and real-time observation. However, the DEC connectors have high risks of water leakage and short circuits in power feeding, especially under high water pressure. This paper proposes a highly compatible underwater station based on inductive wireless power transfer (IPT) technology to address the above reliability issue. A novel energy transmitter with runway-structure coils is applied to the proposed underwater station to cover a sufficient power feeding area so that various in-situ equipment can be powered with desirable misalignment tolerance. The magnetic field distribution is analyzed by both derivation and finite element analysis (FEA) methods, and the principal parameters of the transmitter are further optimized and compared with both the mixed-integer sequential quadratic programming (MISQP) algorithm and the evolutionary algorithm (EA) for better performance. The same results show a reliable optimization process. The WPT circuit characteristics are also investigated to power different loads and improve the power transmission efficiency. The output power decreases, and the transmission efficiency rises and then decreases as the load increases. In addition, receivers with higher mutual inductance have better transmission performance. A prototype of the underwater station has been tested both in air and in water, and the experimental results have proven it can power multiple seafloor observation instruments stably and achieve compatibility requirements. The maximum output power of the station prototype for testing is 100 W, and the maximum overall transmission efficiency is 61%.

1. Introduction

Cabled seafloor observatories (CSOs) have become revolutionary scientific facilities for oceanography research [1,2]. However, most seafloor observation equipment is powered by dry-mated or wet-mated connectors with direct electrical contact (DEC) methods, which have risks of water leakage and short circuit, limited life cycles, and low reliability [3]. Moreover, it is hard to handle the wet-mated DEC connectors underwater, requiring accurate alignment and high plug force. The wireless power transfer (WPT) technology can transfer energy from the underwater stations of CSOs to terminal observation instruments within electromagnetic near field range, enabling electrical isolation for a safer and easier power supply [4]. Inductive wireless power transfer (IPT) and capacitive wireless power transfer (CPT) are two major WPT methods that transfer energy via magnetic and electric fields, respectively. The IPT is more suitable in underwater WPT applications considering the seawater power loss caused by the high conductivity, and the frequency is often set below 200 kHz to further reduce the eddy current loss effectively in an acceptable range because the eddy current loss is considered to be proportional to the square of the operating frequency [5,6].
In recent years, various underwater IPT systems have been proposed for autonomous underwater vehicle (AUV) wireless charging and in-situ instrument wireless powering [7,8,9,10,11]. Bradley et al. developed a 200 W WPT system in the Autonomous Ocean Sampling Network (ASON) for the Odyssey IIb AUV with an efficiency of 79% [12,13]. Kawasaki et al. investigated a WPT station for powering the Marine Bird AUV and expected to use it in CSOs [14]. Hobson et al. designed a 416 W cone-type docking station powered by the Monterey Accelerated Research System (MARS). The station can guide and charge the torpedo-shaped Bluefin-21 AUV with an overall efficiency of 48% [15,16]. McGinnis et al. detailed an IPT system for vertical mooring cabled McLane Mooring Profiler (MMP) vehicles deployed in the ALOHA-MARS Mooring (AMM) system [17]. Huang et al. proposed a WPT system installed on a buoy [18,19]. Zhou et al. built a 300 W IPT system for ocean observation. An IP camera and an underwater lamp were powered with an efficiency of 85% [20]. However, the mentioned wireless charging stations are often designed for a particular type of equipment, and the electromagnetic couplers of the stations have poor misalignment tolerance, resulting in a reduction of the power transfer efficiency or a failure of the charging process [21]. As a result, the couplers must be strictly aligned with mechanical structures for proper operation, or the WPT’s performance will be reduced rapidly, limiting the flexible and practical benefits of WPT.
Few studies have been conducted on underwater WPT stations with high compatibility between different loads. The critical approach is to regulate the magnetic field distribution over a wide area. He et al. proposed a three-dimensional, omnidirectional WPT system by orthogonally arranging three sets of circular coils [22]. The topology enhances the freedom and compatibility of the system, but the output power is relatively low for powering subsea equipment. Yang et al. developed a 67 W planar-type charging system for the HOME-I AUV [23]. The positioning misalignment issues have been improved by setting nine square coils at different heights [24]. Nevertheless, the superimposed magnetic field in opposite directions results in a lower utilization rate for the same copper loss. The power transfer characteristics of the circuits with different loads should be further investigated for better performance.
This paper introduces the design of an underwater WPT station, and a novel runway-structure transmitter layout topology is proposed to cover an efficient power feeding area with compatibility and misalignment tolerance. The design parameters related to the magnetic field distribution are analyzed by theoretical derivation and the finite element method (FEM), then the mixed-integer sequential quadratic programming (MISQP) algorithm and the evolutionary algorithm (EA) are adopted and compared to achieve the optimal design parameter set. The desired magnetic field can be achieved with the LCC-S compensation network, and the circuits can output a stable voltage for arbitrary loads on the station. The circuit analysis with various loads is also investigated to improve the power transfer efficiency. The critical parameters of the proposed station are compared to some of the above-mentioned research in Table 1, indicating a relatively better performance.
The remainder of the paper is organized as follows. Section 2 illustrates the overall design and the transmitter layout of the proposed underwater WPT station. Furthermore, the magnetic field generated by the transmitter is analyzed by theoretical derivation and finite-element simulation. In Section 3, the principal parameters are optimized for better WPT performance. The circuit configuration and the load characteristics are provided in Section 4. Afterwards, the station prototype is designed and verified in various experiments, and the results are discussed in Section 5. Finally, the conclusions are summarized in Section 6.

2. Design and Analysis of the Station and the Transmitter

2.1. Overall Design of the Underwater WPT Station

The principle of the proposed underwater WPT station is described in Figure 1a. The external direct current (DC) power supplies of CSOs or ocean energy harvesters provide power to the proposed station [25,26]. DC power is converted to alternating current (AC) power via the circuits in the primary circuit cavity. The currents in the runway-structure transmitters generate alternating electromagnetic fields for IPT in seawater. According to Faraday’s law, an AC voltage can be induced in the receivers by acquiring alternating magnetic flux. The induced AC power is further rectified and filtered into DC power by the circuits in the secondary circuit cavity. Hence, various loads, e.g., scientific instruments, underwater cameras, lights, and AUVs, can be powered wirelessly.
Figure 1b shows the overall structure diagram of the proposed station. The main supporting frame is made of aluminum alloy, while the transmitters’ container is made of bakelite to eliminate the influence of the frame. Ferrite material with high permeability and low conductivity is utilized to shield the magnetic flux leakage, and thus the efficiency is improved. Numerous square ferrite boards and the arranged runway-structure transmitters are placed in the container sequentially. Afterwards, the container is filled with epoxy glue for waterproofing. Permanent magnets can be added to the receiving cavity, without affecting AC magnetic fields, for fixing on the ferrite boards. The misalignment tolerance by seawater flow is achieved, and the removal of the receiver containers is easier for redeployment. The coil terminals of the transmitters and receivers are connected to the corresponding cavities in Figure 1a with watertight cables. The circuits are packed in the secondary circuit cavity for experimental simplification in this paper. The circuits can be integrated with the loads as required in practice.

2.2. Magnetic Field Distribution Analysis for the Transmitters

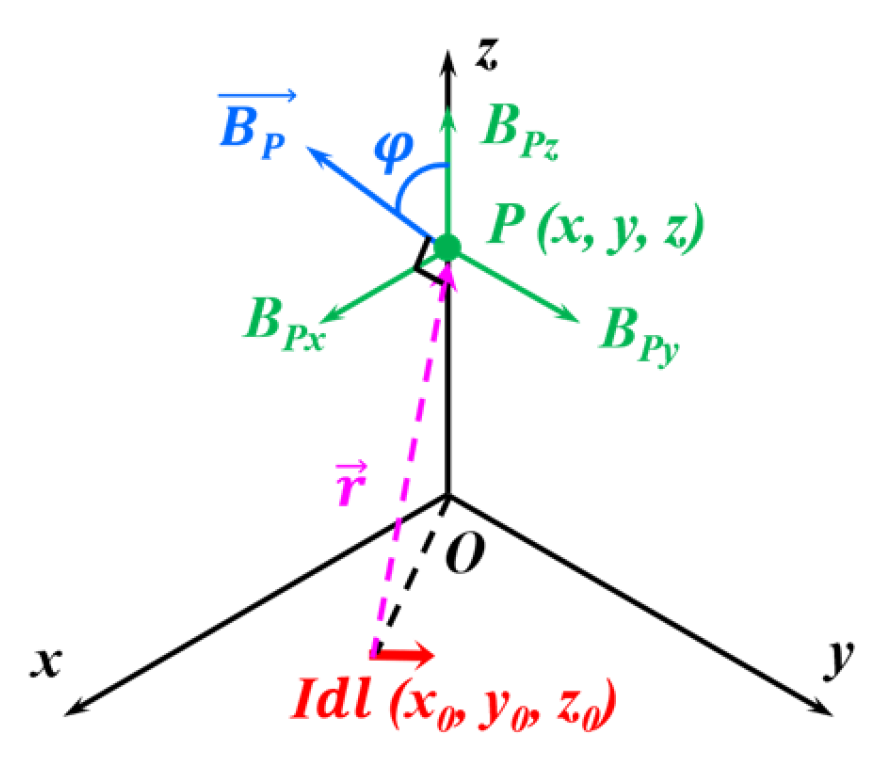
In this design, the transmitters, the power transmission surface, and the receivers are placed in parallel. Therefore, only the magnetic field component perpendicular to the power transmission surface contributes to IPT. The relationship between the excitation current and the magnetic flux density is detailed in Figure 2. The operating frequency of the underwater IPT system is commonly low, so the quasi-static approximation principle can be applied in the near-field range. Hence, the Biot-Savart law and the z-component of the magnetic flux density are expressed as
B P   = μ 0 I d l × e r 4 π r 2
B P z   = μ 0 I d l × r 4 π r 3 cos φ
where μ0 is the permeability in the vacuum. The overall magnetic field generated by an entire coil can be regarded as a superposition of many current elements, regardless of the original shape of the coil. By calculating the magnetic field of each current element using Equation (2), the sum of the magnetic flux densities generated by n elements can be expressed as:
B P z   = n B P z n = μ 0 I 4 π n d l n × r n r n 3 cos φ n
Then, the output voltage U of the receivers can be determined by Faraday’s law:
U = j w N Φ = j w N S   B d S
where N denotes the number of turns of the receivers; w is the operating frequency of the IPT system; Φ means the magnetic flux in the enclosed area S. Equation (4) reflects the importance of the magnetic field on the output characteristics. However, the equation is often too complicated for practical calculation. The numerical results can be directly obtained via the equation only when the elements form extremely regular shapes, such as straight lines or circles. As a result, FEM is utilized to address the calculation challenges. First, the overall structure can be divided into finite elements within an acceptable error. Afterwards, the contribution of each element to each small region on the energy transmission surface is calculated. Finally, the approximate magnetic field distribution is obtained by superposition. The precision of the distribution depends on the fineness of the meshing.
Intensity and uniformity are commonly considered to evaluate the magnetic field distribution [27]. The intensity determines the voltage and power level of the receivers, and the uniformity indicates the misalignment tolerance on the transmission surface. There are many indicators for quantification in statistics. For instance, the maximum, minimum, and average values can be characterized as intensity. Similarly, the variance, standard deviation, and range reflect uniformity. This study employs the mean value BZ-Mean and the standard deviation value BZ-Std for simplification. The ideal magnetic field distribution requires BZ-Mean to be large, while BZ-Std should be small. Assuming there are n evaluation points on the energy transmission surface, then the equations are:
B Z - M e a n   = n B P z n n
B Z - S t d   = 1 n n B P z n B Z - M e a n  

2.3. Transmitter Layout Structure

The transmitter layout is critical to the magnetic field distribution for IPT. According to the Biot-Savart law in Equation (1), the magnetic field density BP decreases as the distance r from the current I gets farther, which indicates a limited range for a single coil. As a result, coil arrays are commonly adopted for IPT systems with large power transmission areas or in misalignment tolerance circumstances [28]. However, based on the differential form of the Ampere circuital theorem:
· B P = 0
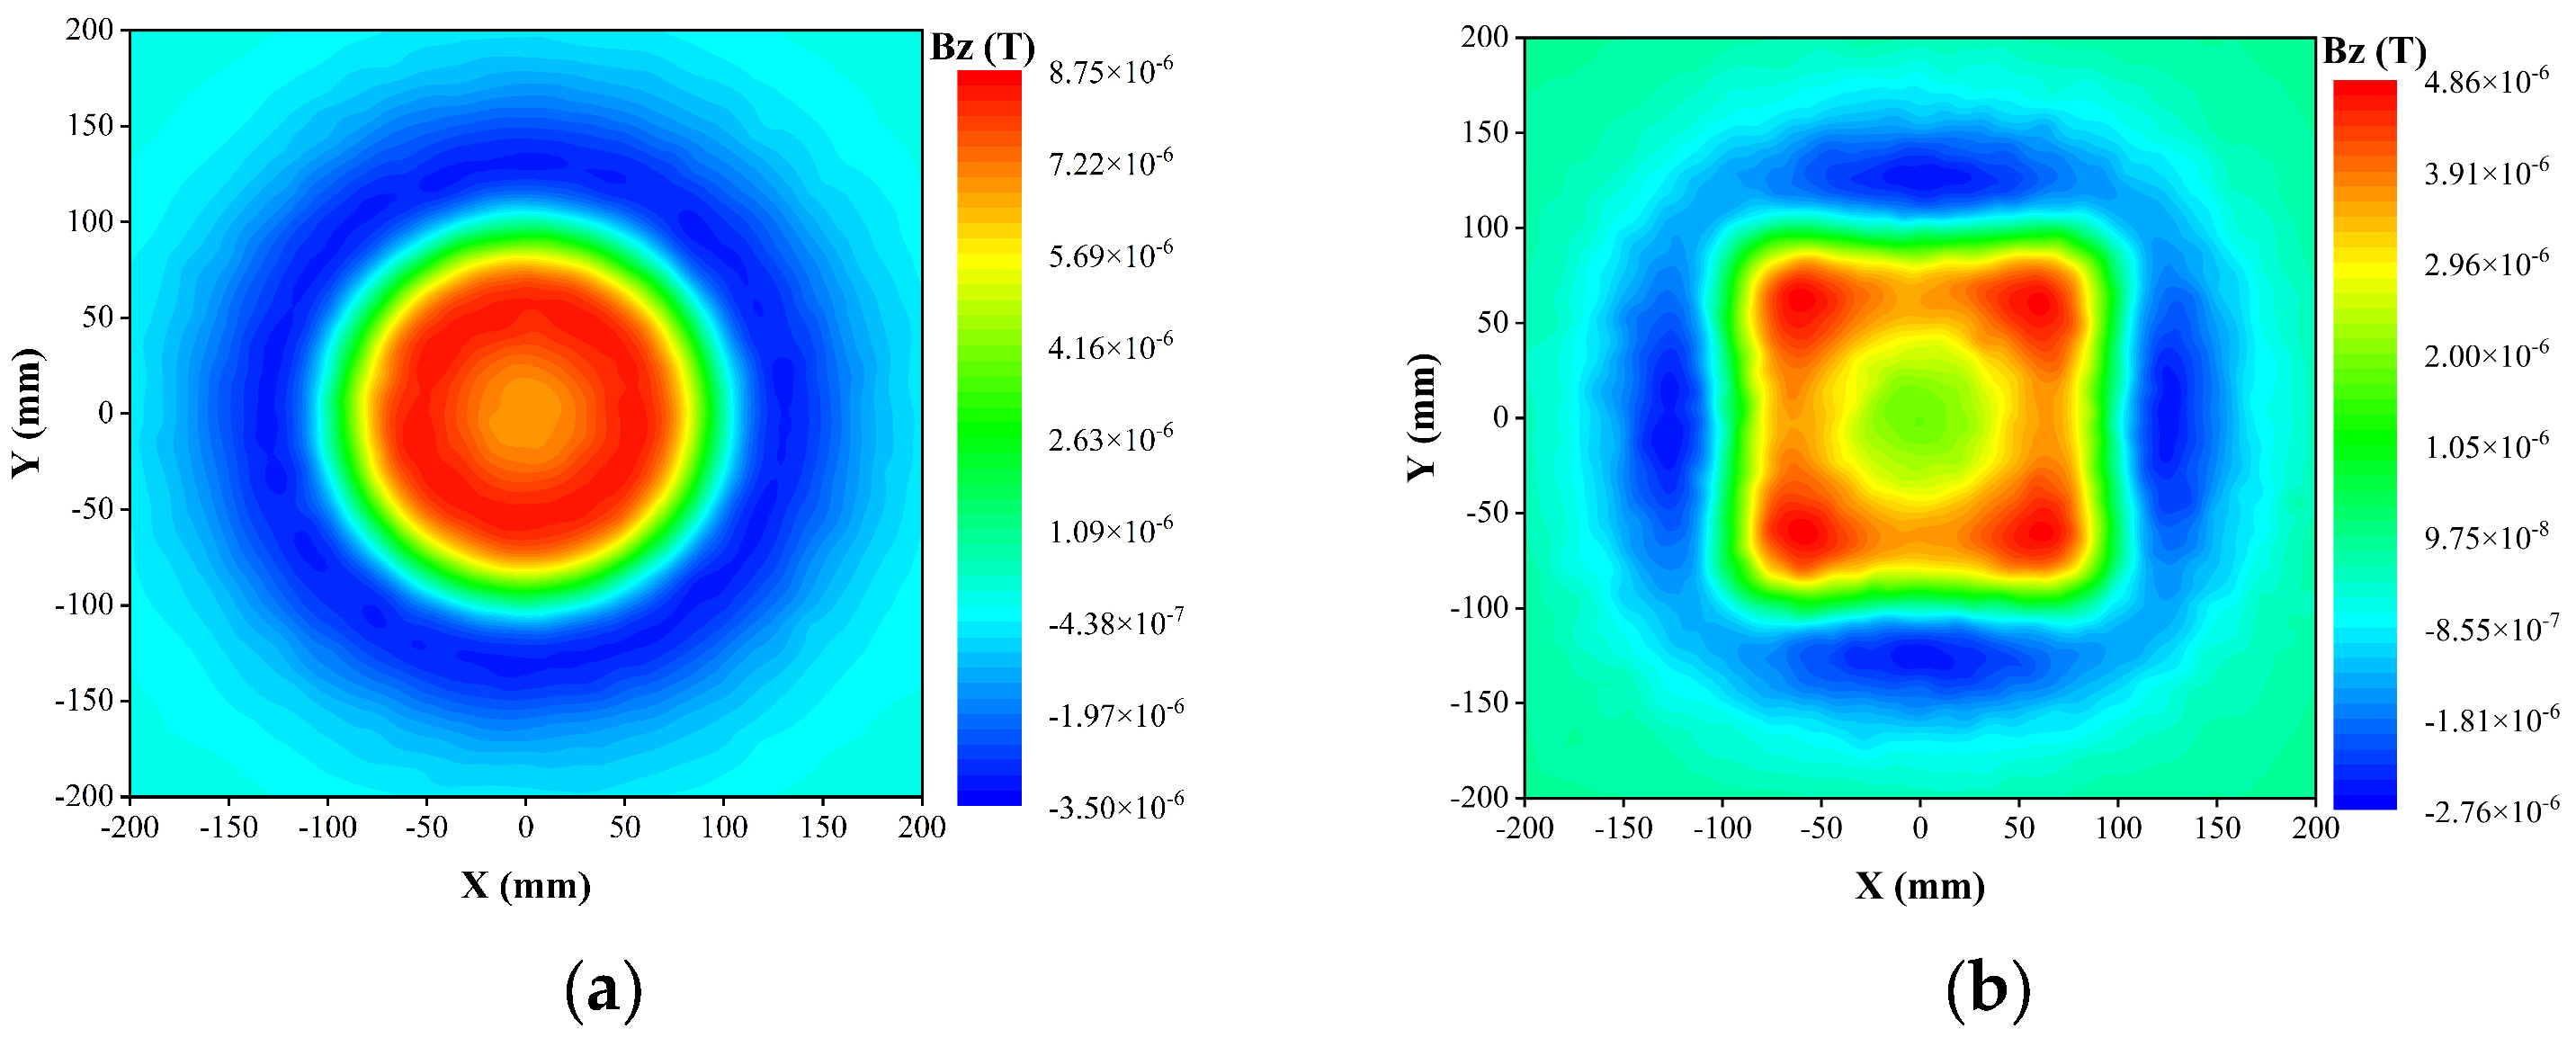
The magnetic field direction inside and outside a coil is opposite. Thus, coil arrays must be placed at different heights to generate a uniform magnetic field [29]. However, too many coils increase the copper loss and reduce the system efficiency, so the shape and size of the transmitter coils should be reasonably designed. The geometry of the coils in IPT systems is basically circular or square. The magnetic fields are compared in Figure 3 using FEM by MAXWELL, which demonstrates that the overall average value of the magnetic field is higher for the circular coil. In addition, the direction of the magnetic field is immediately reversed outside the coils. For circular-type coils, the magnetic field is more intense and uniform inside the coils. However, it covers a smaller area than square-type coils, resulting in large reversed field areas when forming arrays. As for square-type coils, the coverage area is larger and is more suitable for forming arrays by adjusting the relative heights. However, the field is more intense at corners, resulting in a non-uniform distribution.
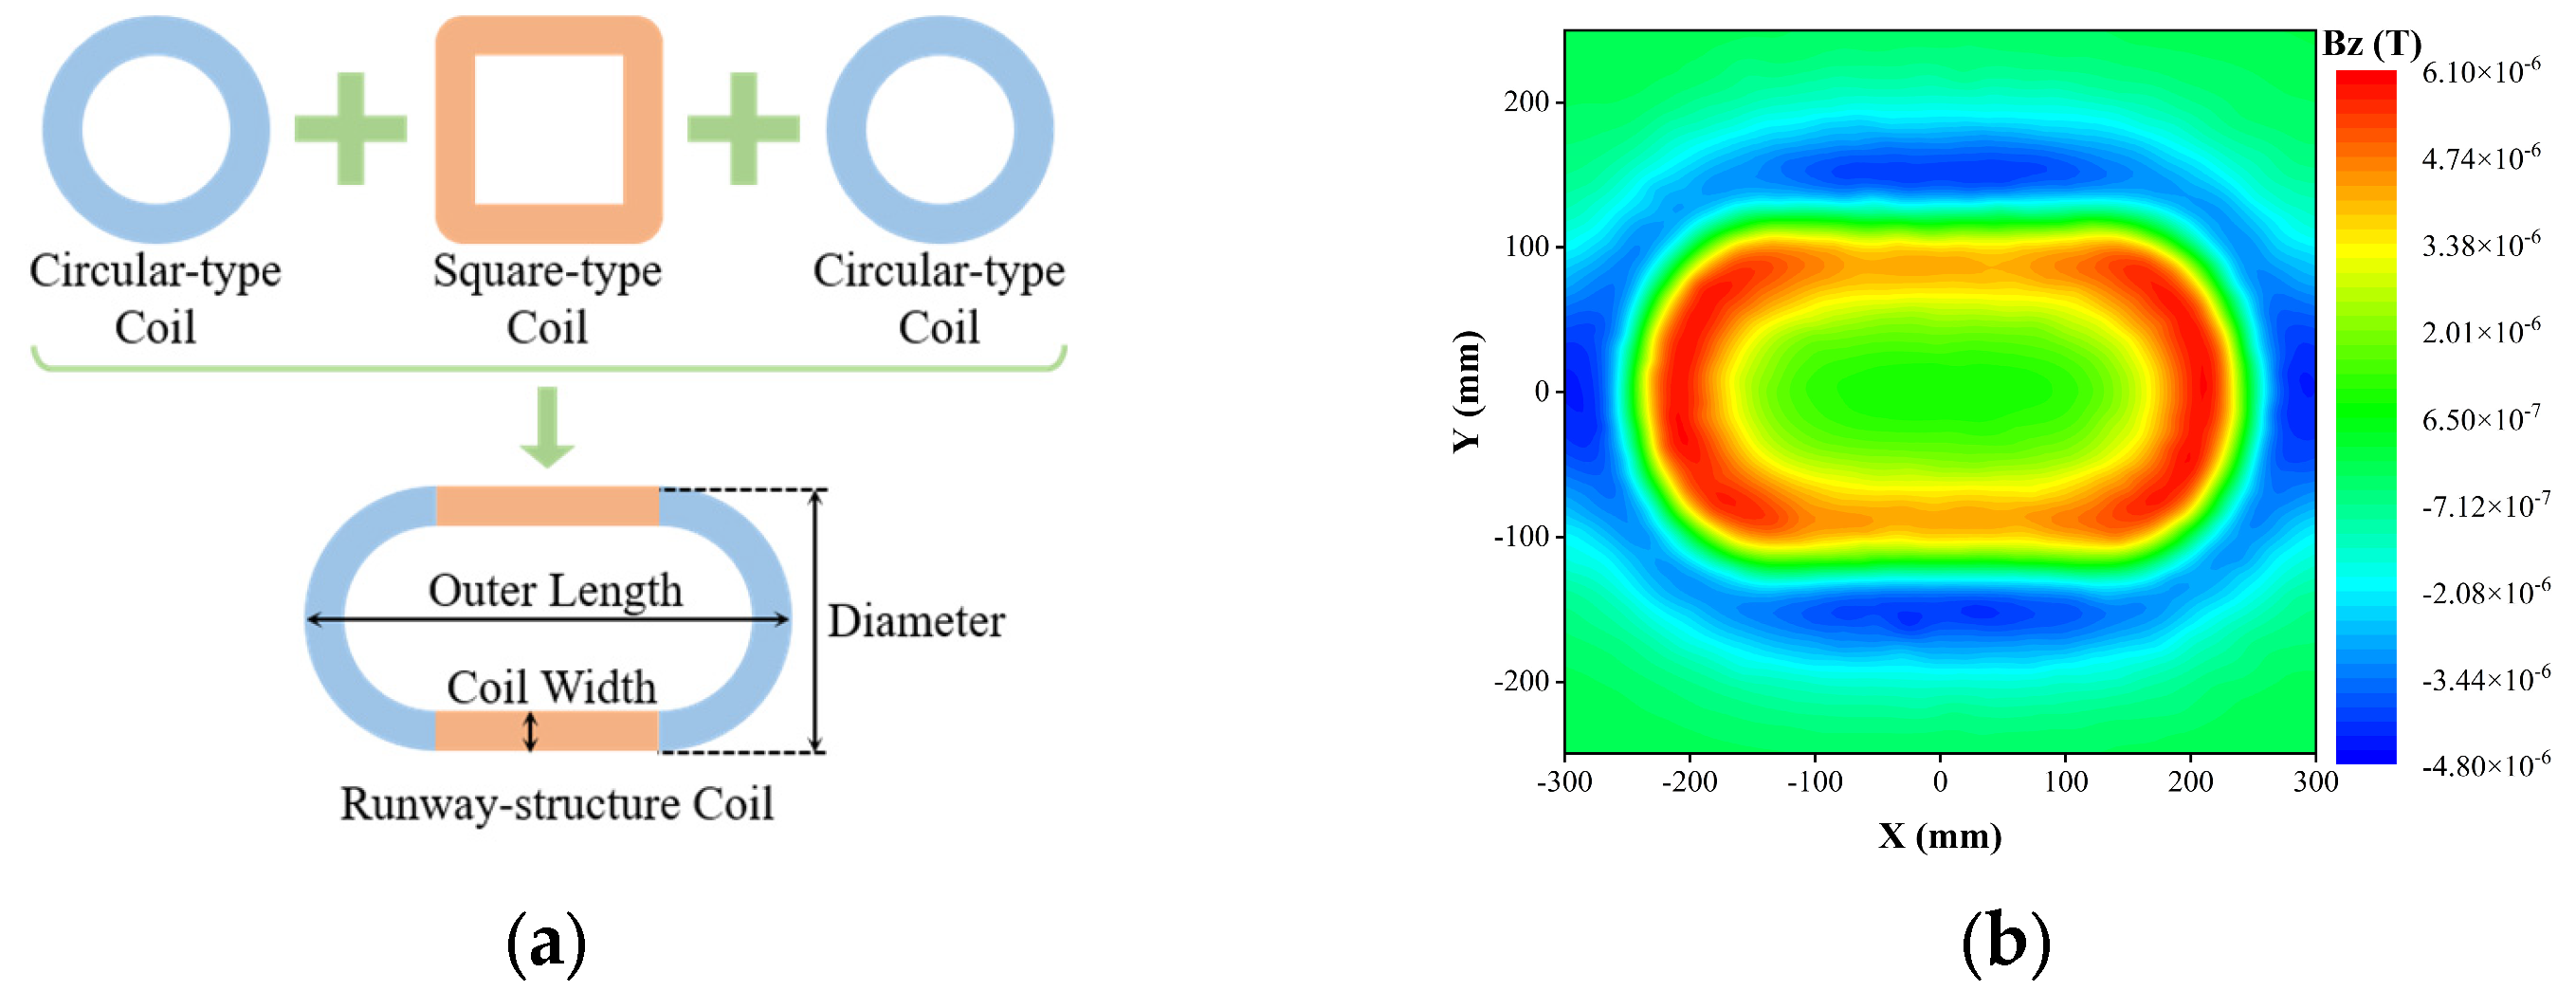
In this design, the advantages of circular-type coils and square-type coils are summarized and combined to form a novel runway-structure coil. As Figure 4a depicts, the coil splices two semicircles on each side of a square. The magnetic field generated by the proposed coil is simulated and displayed in Figure 4b. The magnetic field generated by the proposed coil covers a large area while eliminating the issue of excessive values at the corners. However, the magnetic field is more intense in the region closer to the coil than in the central region, thus not favorable for IPT. Stacking with 2–3 large coils makes the power transmission area broader and the field distribution more desirable. For instance, two overlapping layers of square planar coils are utilized to generate a magnetic field distribution with high rotation tolerance [30]. Moreover, multi-resonator arrays are utilized and optimized to obtain positioning freedom with better performance [31]. In addition, the bipolar, DD, and DDQ transmitter topologies are often utilized in large power feeding area scenes [32]. Bipolar and DD layouts are more suitable for smaller or vertically placed receivers, which may pose failure risks due to the magnetic flux cancellation and are inappropriate for employment in this design. In the DDQ transmitter layout, the quad coil is commonly placed under two parallel DD coils; the topology induces a uniform magnetic field and has a better misalignment tolerance [33]. Thus, three runway-structure coils constitute the transmitter according to the DDQ layout. The power transmission area, the copper loss, and the control complexity can be satisfied at the same time.
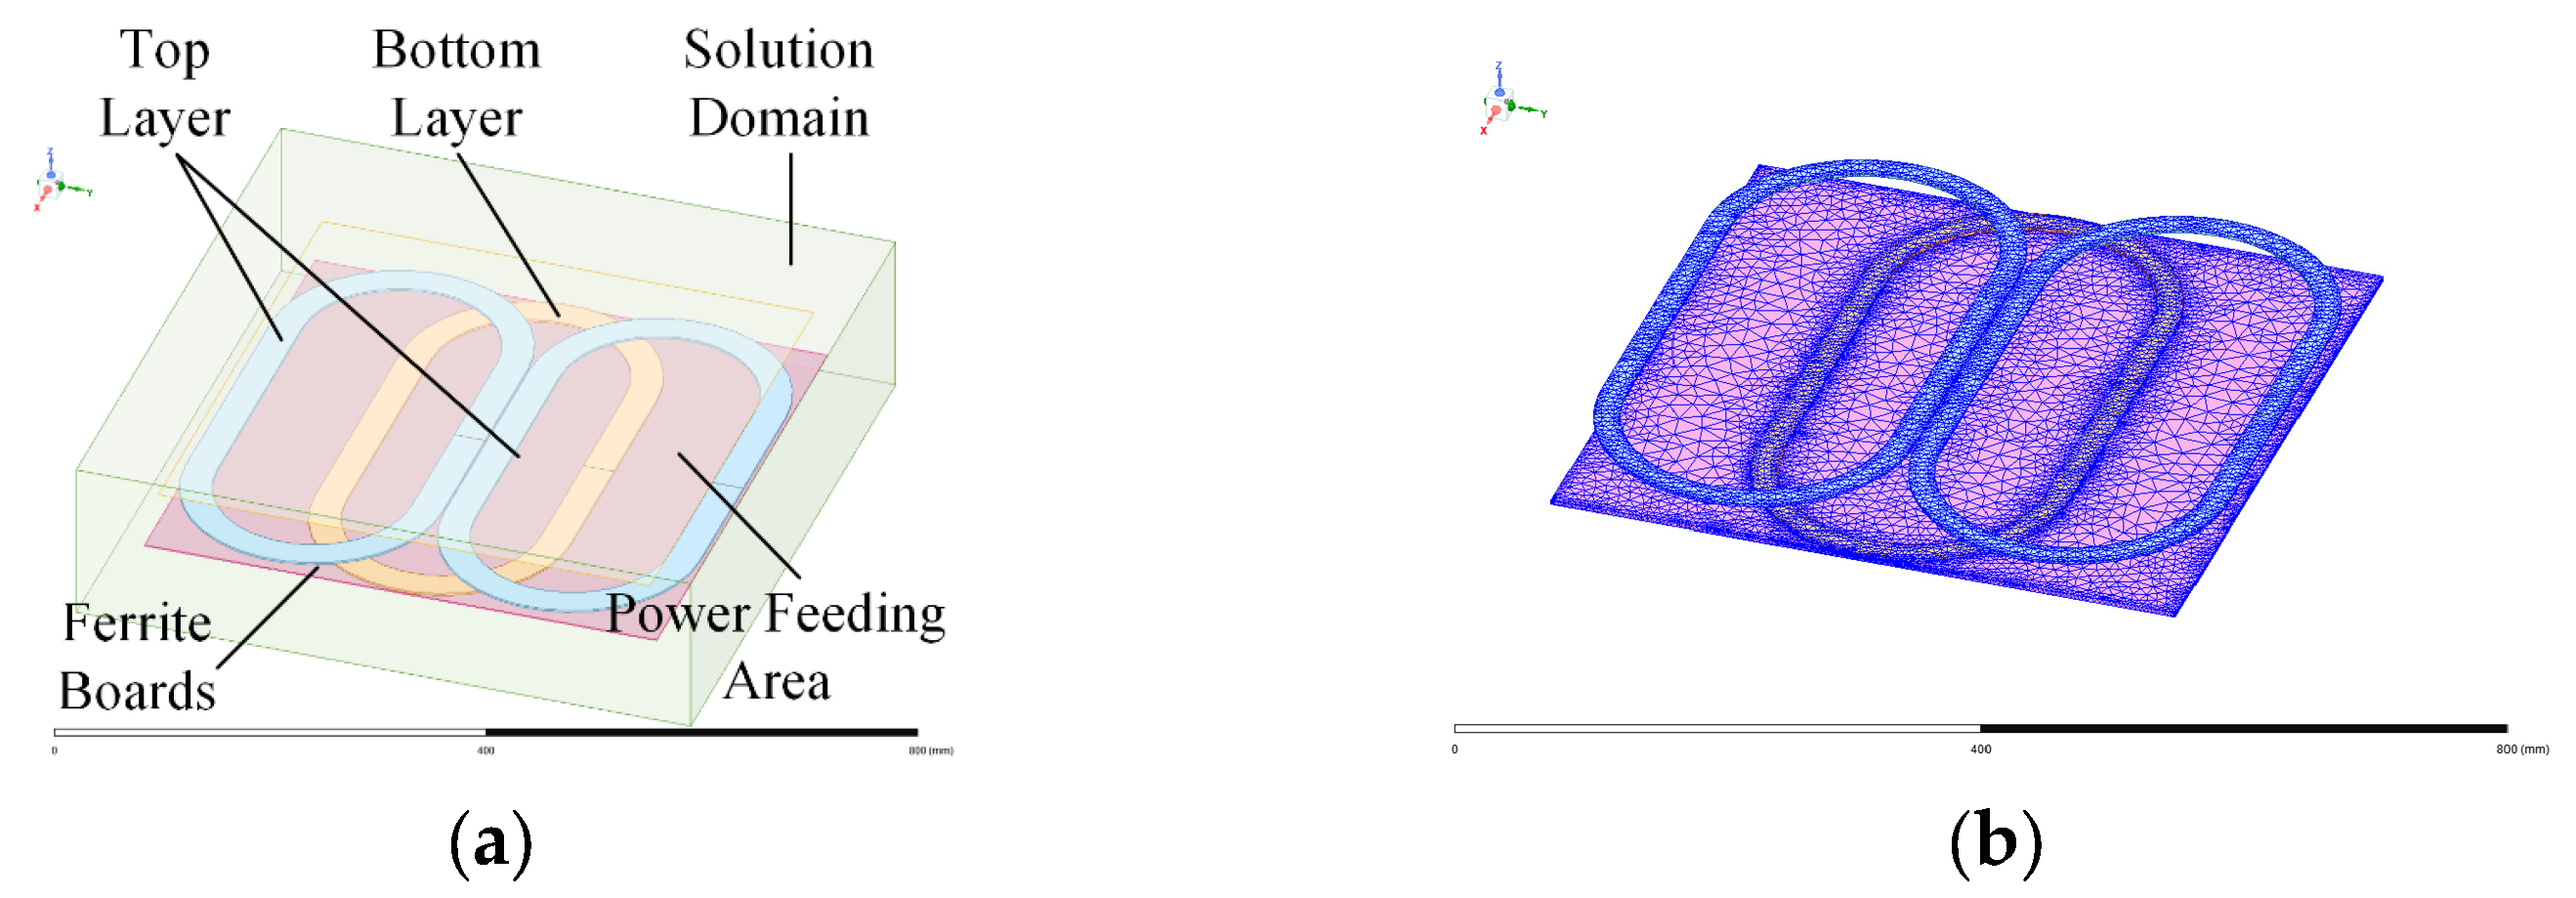
Figure 5 describes the arrangement of the proposed runway-structure transmitter, and the parameters are described in Table 2. The origin point O of the coordinate system is set at the geometric center of the bottom of the container, i.e., the xOy plane at the height where hRX is zero. The ferrite boards are placed at the lowest layer and occupy the height of hF to shield the bottom leakage flux, then the runway-structure coils are stacked at different heights to generate a uniform magnetic field distribution at hRX. The hT and hB refer to the relative height between the coil and the next layer. The ferrite boards and the transmitter enclose a square area of 500 mm × 500 mm, and the cavity is slightly larger to accommodate the abovementioned objects. Furthermore, 1.5 A current excitations are applied to the coils on the top layer to ensure a sufficient magnetic field intensity, and IB is applied to adjust and optimize the magnetic field distribution; the specific value needs to be determined according to the subsequent analysis and optimization.
Based on the theoretical derivation and the experience of previous designs, the number of turns N, the relative heights of the layers hT, hB, and hF, together with the receiver height hRX, and the excitation current IB impact the magnetic field distribution. Therefore, the parameters will be further studied and optimized in the following sections.

3. Transmitter Parameter Optimization

3.1. Parameter Optimization Principles

An objective function or a figure of merit (FoM) can represent both the intensity and uniformity properties [34,35]. The fundamental form of an FoM can be expressed as:
F = O 1 w 1 × × O n w n
where wn denotes the weights of the objective functions On. Furthermore, an FoM should be concise to reduce the complexity of operations. As analyzed in the previous section, BZ-Mean and BZ-Std are used and considered to have the same importance in this study. The optimization algorithm requires the objective function to obtain its minimum, so the weights of BZ-Mean and BZ-Std are taken as −1 and 1. Therefore, the FoM is determined as:
F M = B Z - Mean 1 × B Z - Std 1 = B Z - Std B Z - Mean
An optimization algorithm searches for the optimal design parameters satisfying the objective function within a set of constraints. Algorithms like the genetic algorithm (GA) and sequential quadratic programming (SQP) are commonly applied in underwater IPT optimization issues, for they have the advantages of fast searching speed and accurate results [27]. Furthermore, improved algorithms based on conventional ones are also widely applied [36]. The MISQP optimization algorithm is based on the improved SQP algorithm by the gradient method, which can be used in both response surface optimization and direct optimization problems. It has the advantages of being rapid and accurate, and it is selected to solve nonlinear mathematical planning problems with constraints. The key to the algorithm is to simplify the objective function into a quadratic programming problem, and the iteration terminates when reaching the setting difference delta value. The basic expression of MISQP is:
min   F v s . t .   C i v = 0 ;   i = 1 ,   2 ,     m C j v 0 ;   j = 1 ,   2 ,   n v u v v l
The variables v to be optimized should be between the upper bound vu and the lower bound vl, then satisfy the equation constraints Ci(v) and the inequality constraint Cj(v) requirements, and finally make the objective function F(v) reach its minimum. The maximum iteration is set to 50, and the maximum convergence parentage and initial finite difference delta values are set to 0.0001 and 0.001 to ensure sufficient precision.
EA is another generic optimization algorithm based on the population. The evolution process inspires the operation and consists of reproduction, mutation, selection, etc. It can solve most optimization problems but may increase computational complexity due to the fitness evaluation. The basic steps of the EA are as follows. The first generation is created by initializing the population size randomly. Afterwards, the fitness of the individuals in the population is evaluated with related methods and constraints. Finally, the individuals who satisfy the fitness requirements are selected as parents for reproduction. New individuals are generated through crossover and mutation operations by the parents and then replace the inferior individuals in the population. The above processes will loop until they reach termination criteria. In the settings of EA, the start population size, the population size, and the maximum number of generations are set to 20, 12, and 41, respectively. Six parents are set for selection to be evaluated by the weighted sum method and rank order constraint handling. In the recombination and mutation processes, the crossover probability and the mutation rate are set to 50% and 16%, respectively, to ensure effectiveness and rationality.
The above processes are accomplished by setting the relevant parameters in Ansys optisLang 2022R1. Eventually, the objective function with inequality constraints gives:
min   F v = B Z - Std B Z - Mean s . t .   0     h B     20 0     h F     5 40     h RX     70 0     h T     20 10     N     15 0     I B     1.5
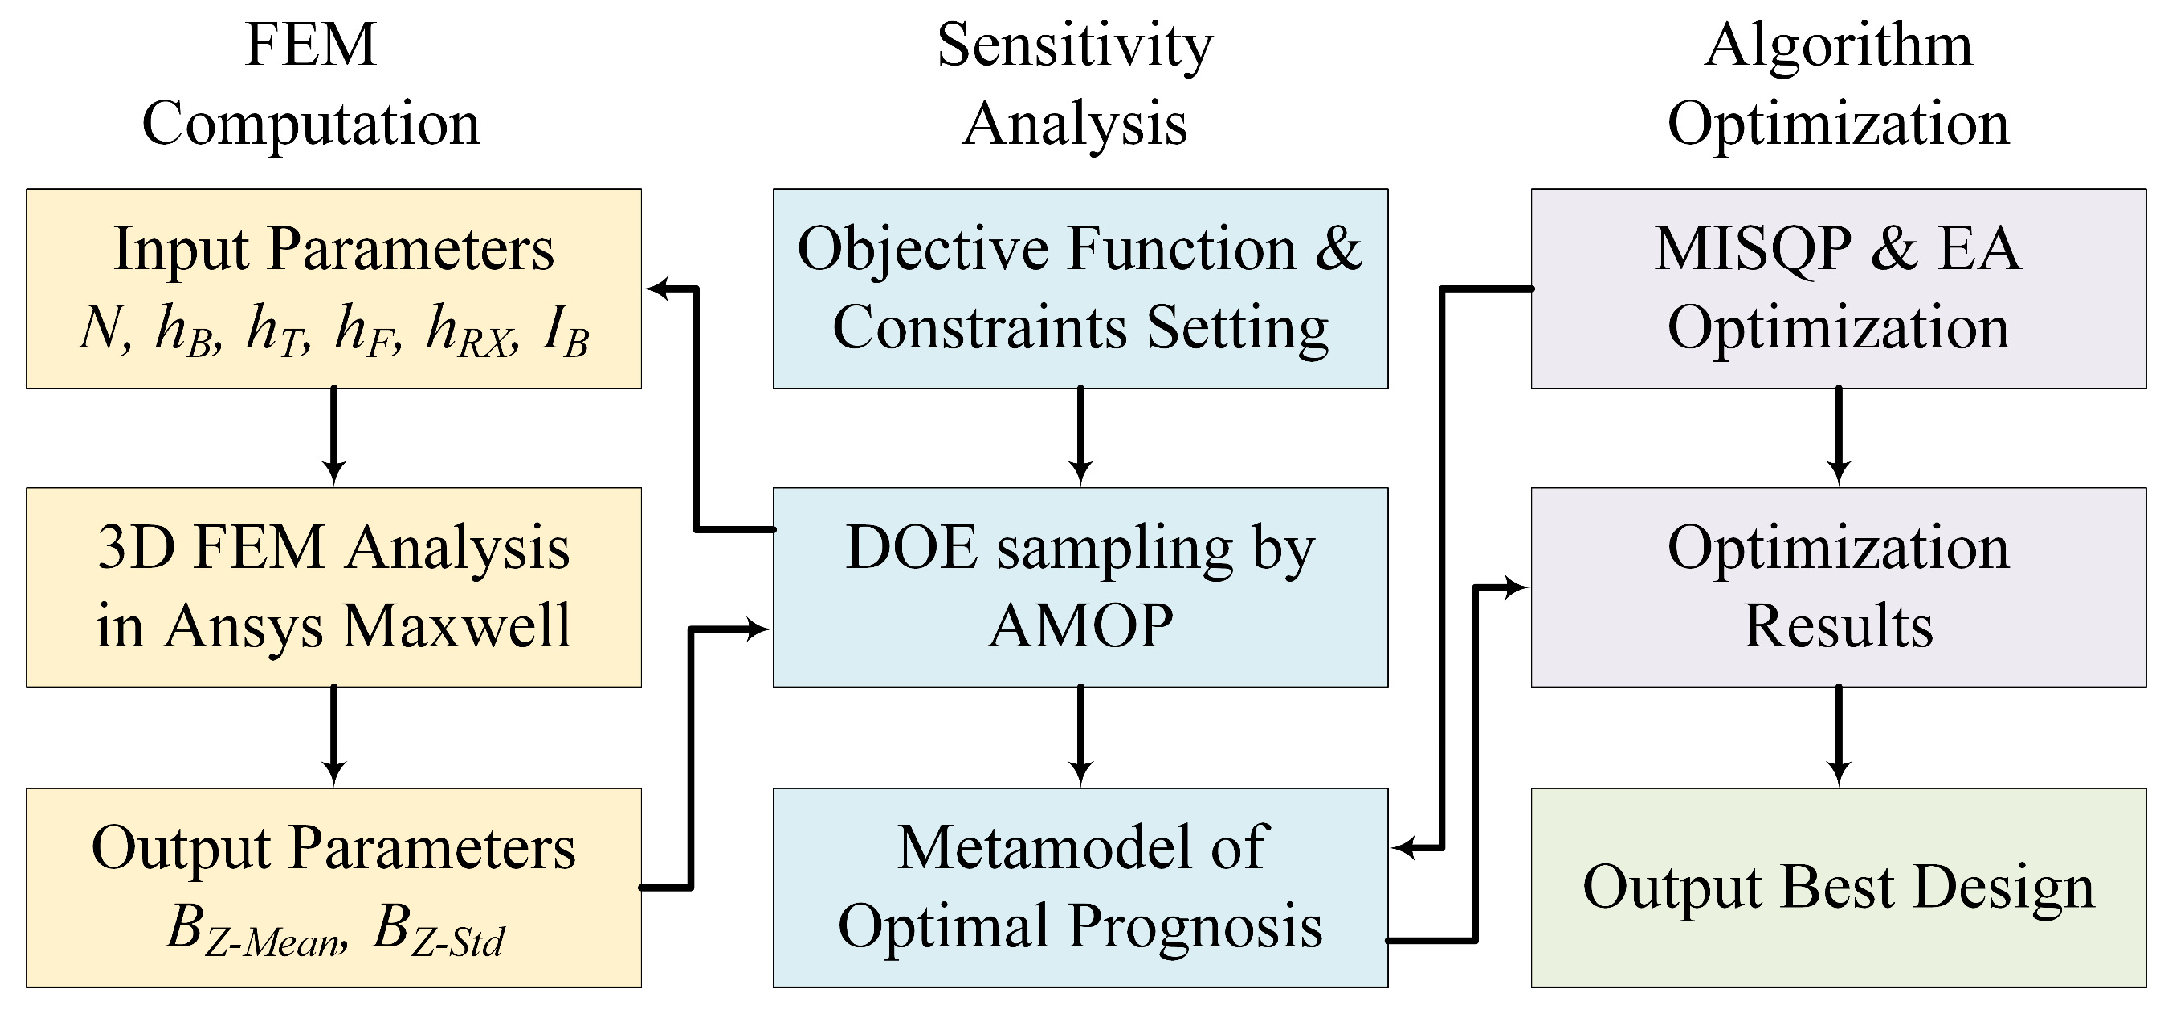
Figure 6 shows the flowchart of the optimization process. First, the FEM computation is a fundamental step in the entire process. A parametric model needs to be built and changed depending on the input parameters (v). The output parameters, including BZ-Mean and BZ-Std, and other necessary information indicating the success of the calculation are obtained in each parametric model by performing FEM calculations in Ansys Maxwell. The default 3D model of the transmitter and the mesh segmentation are depicted in Figure 7. Second, sensitivity analysis is adopted to generate a metamodel of optimal prognosis (MOP) for pre-preprocessing. Compared to direct optimization, the proposed method generates 200 sampling points using the adaptive optimal prognosis metamodel (AMOP) according to the specifics of the objective function and constraints to enhance efficiency. The design points are input into the previous step for calculation, and then a MOP containing the input-output response relationship is output. The coefficient of prognosis (CoP) can be used to evaluate the accuracy of the model. The CoP of BZ-Mean and the CoP of BZ-Std reach 99.1% and 97.4%, respectively, indicating the credibility of this model. Finally, MISQP and EA optimization are performed based on the generated MOPs. The best design is output after comparing it with the FEM calculation for verification.

3.2. Optimization Result Analysis

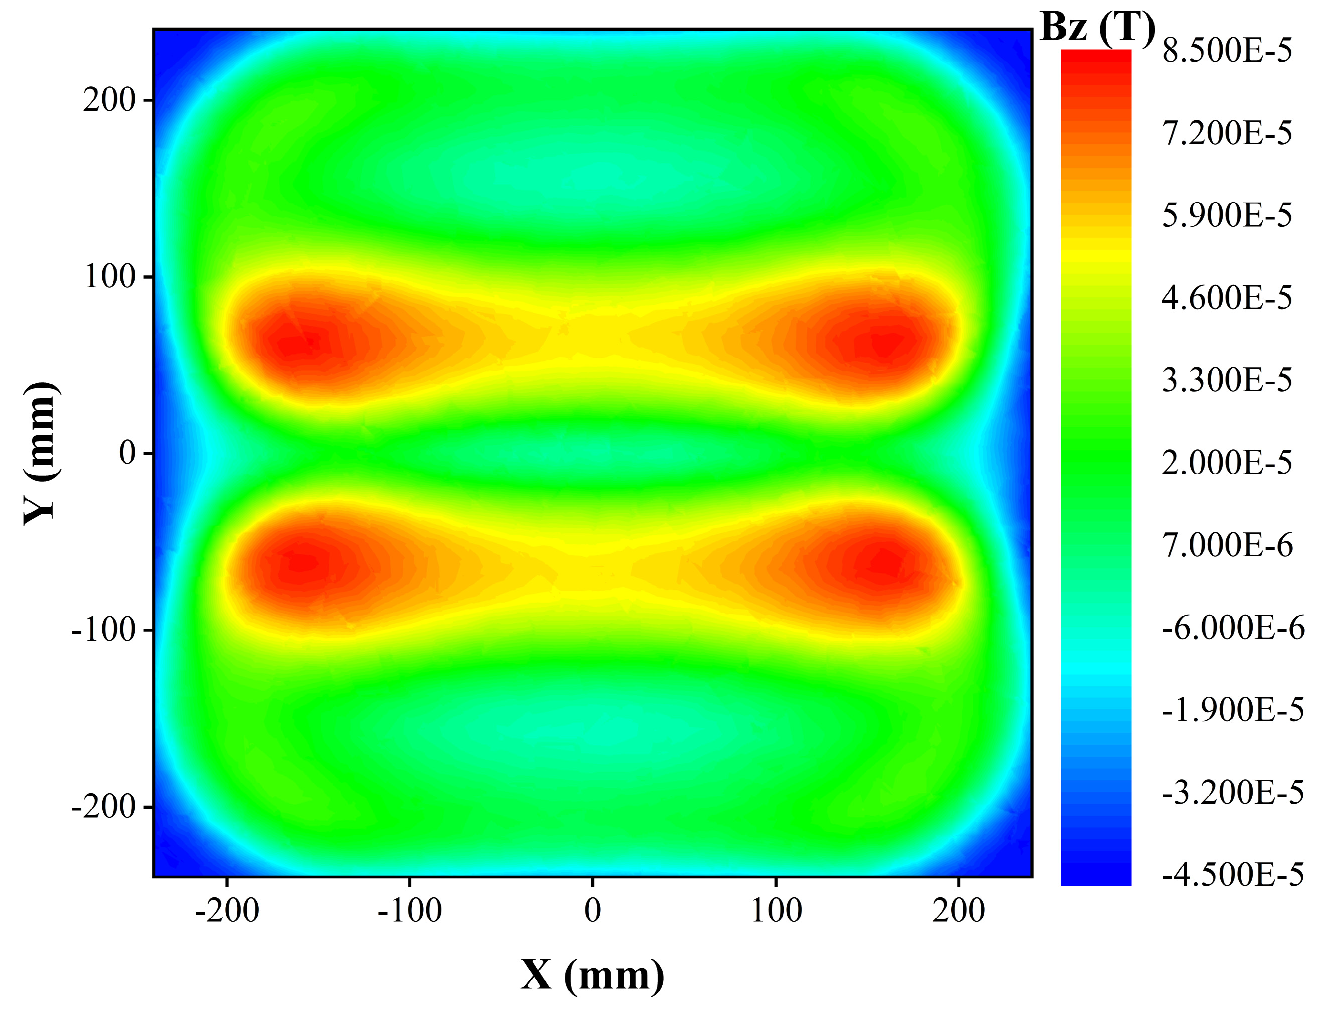
The optimization history of the MISQP and EA is shown in Figure 8, respectively. Both objective functions reach the minimum value of 1.13, and the MISQP algorithm searches fewer design points and is faster. The initial and optimized parameters are listed in Table 3. The optimal parameters obtained by the two algorithms are the same, indicating the reliability and effectiveness of the optimization. Although some parameters reach the boundaries of the range, the practical situation makes it impossible to continue expanding the range, so it remains reasonable to accept the values. The optimized magnetic field distribution is shown in Figure 9. It shows that a strong magnetic field covers a major part of the power feeding area, and receivers can get relatively sufficient and stable power. The low-value regions are all found on the boundaries or corners of the power feeding area, which slightly impacts the receivers’ size in practical situations.
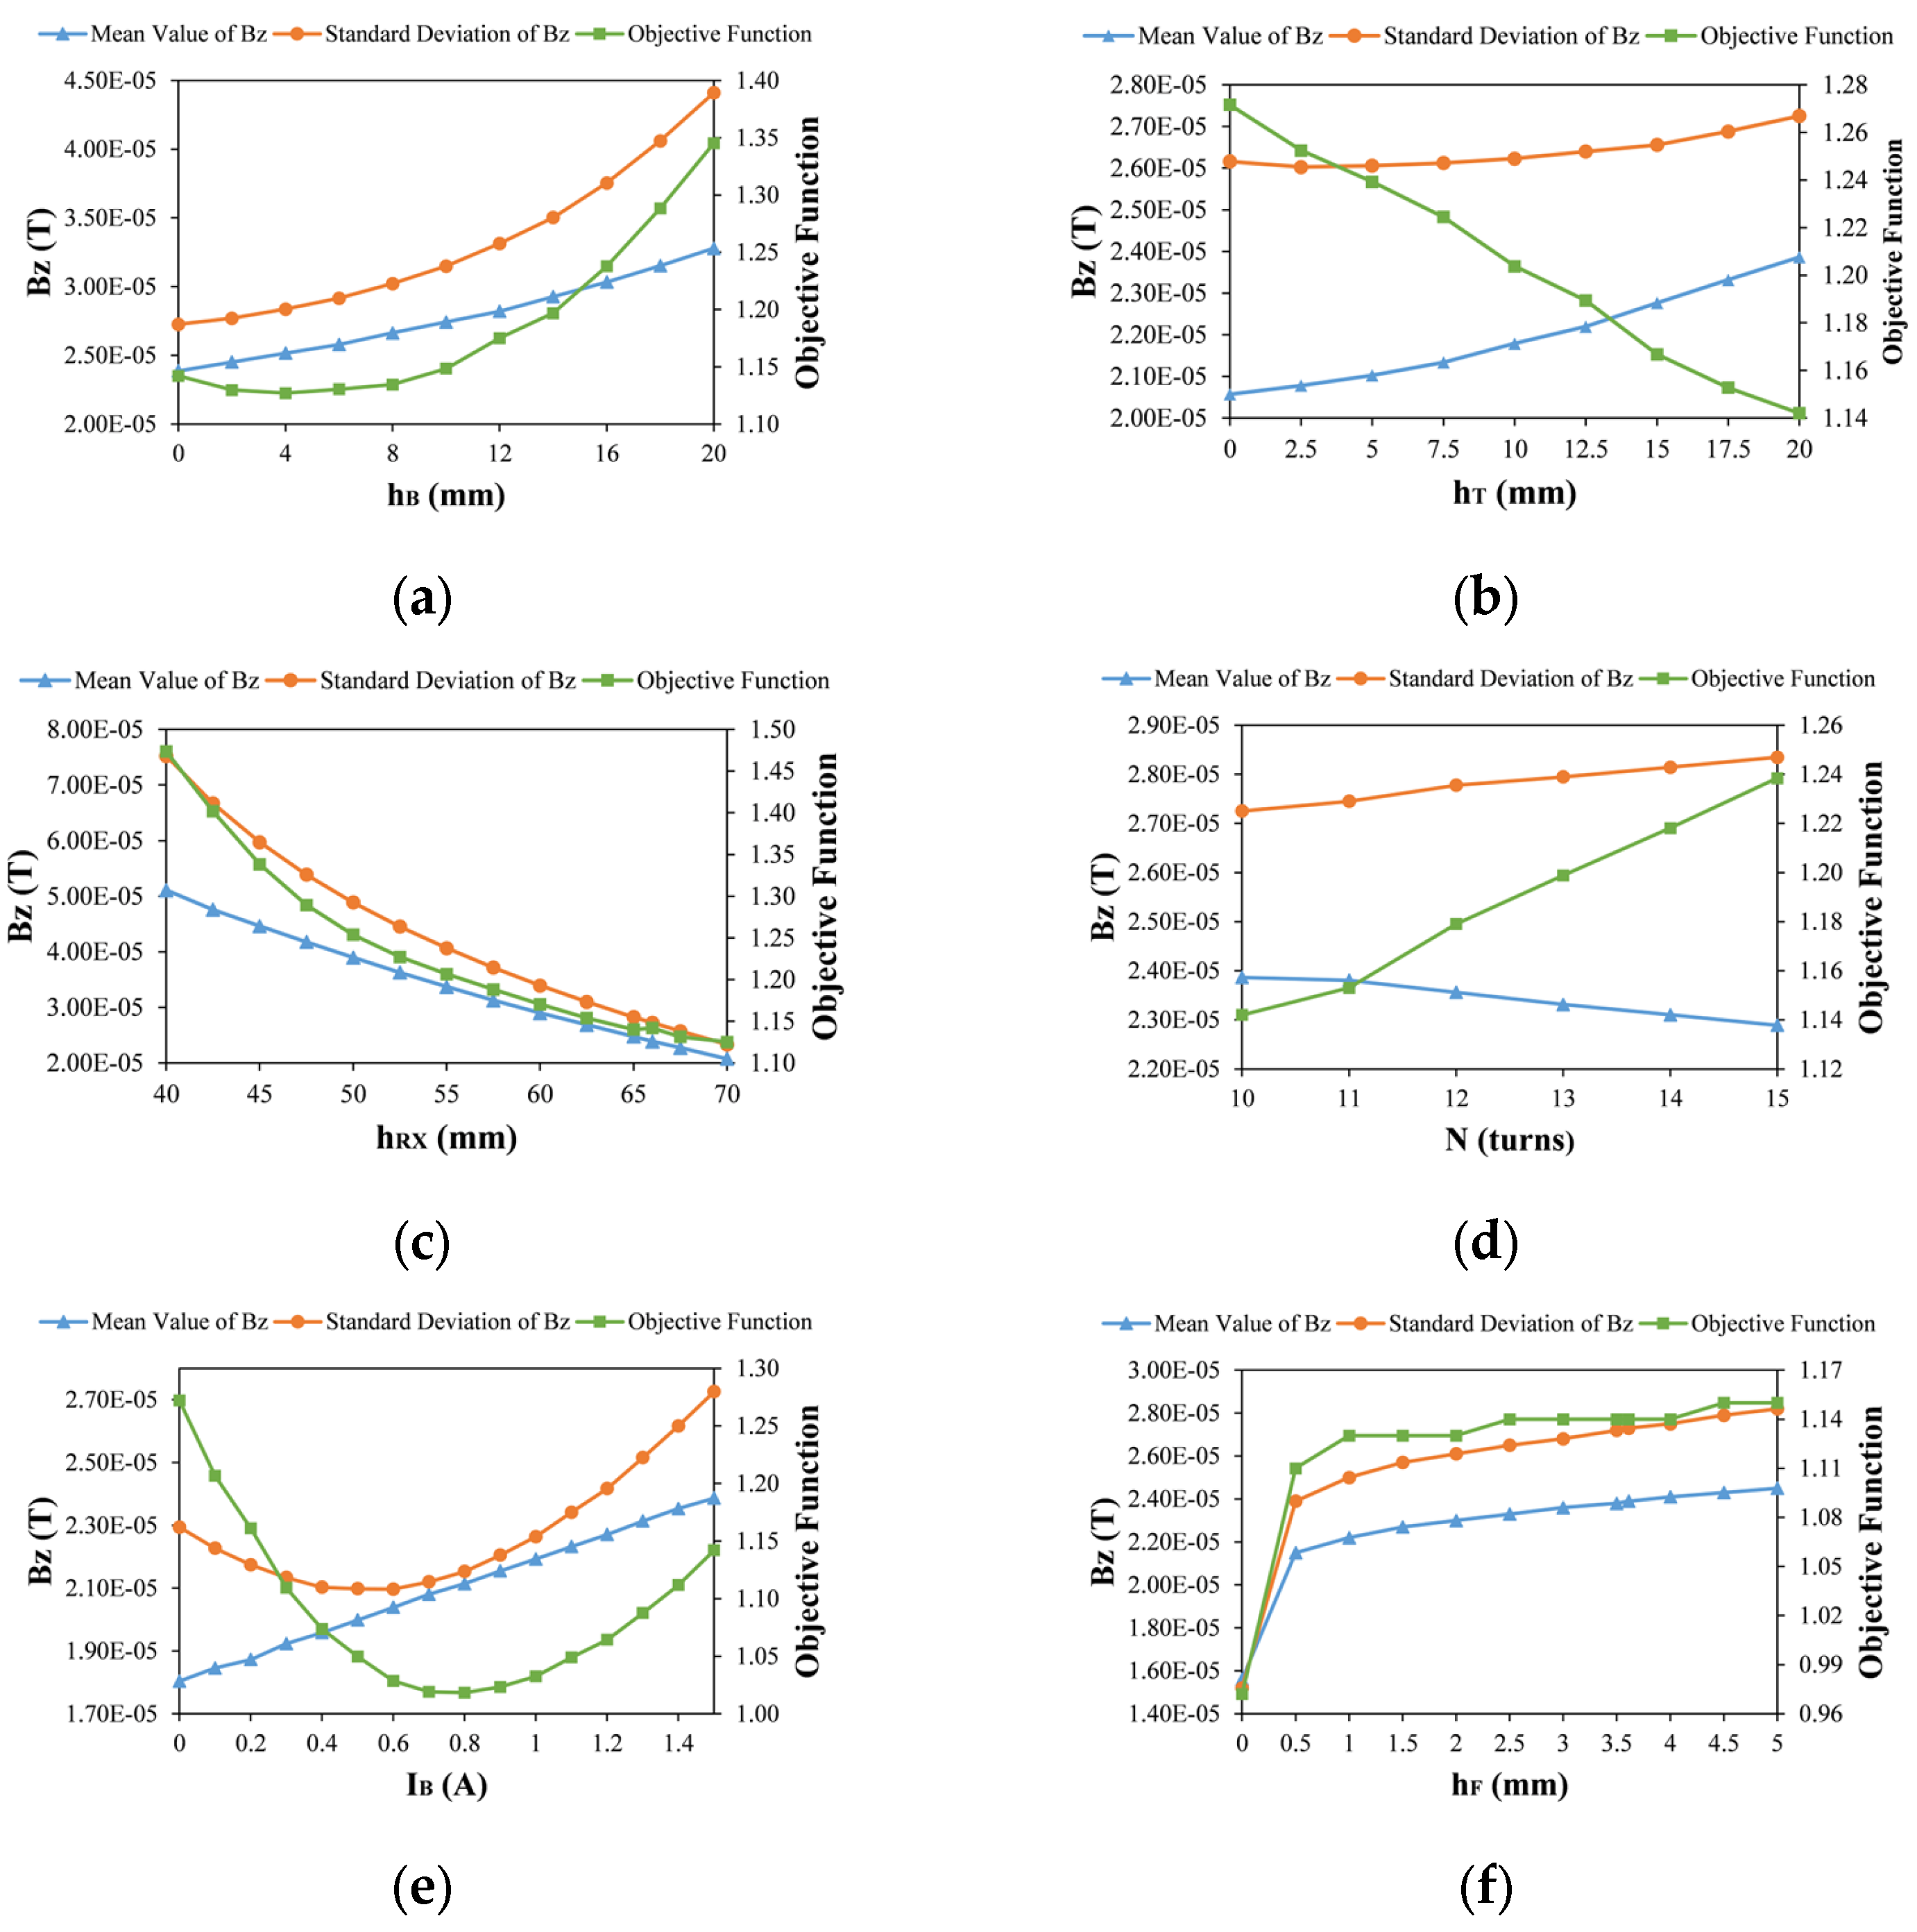
The influence of the objective function is further studied by sweeping the critical parameters into their ranges. Figure 10 clarifies the specific curves. It indicates that under the influence of some parameters, BZ-Mean and BZ-Std have a coupling relationship. The two objectives cannot reach the ideal state at the same time, and trade-offs must be made to obtain the optimal solution. Figure 10a suggests the height of the bottom coil is positively correlated with the objective function. However, the difference in the objective function values before 10 mm is not overwhelming, because the rising trend of the standard deviation at this point is more stable than the latter. Similarly, as Figure 10b shows, the height of the top coil is consistent with the above analysis. However, the difference is that it is negatively correlated with the objective function. Figure 10c implies that a higher power transmission surface produces a more desirable distribution. Nevertheless, the height should be chosen carefully to ensure adequate power levels. The number of turns and the current are the key factors in the excitation of the magnetic field. Figure 10d,e shows that the number of turns is positively related to the objective function, while an extreme point exists during the current variation. However, the number of turns and current are generally considered ampere-turns to determine the influence relationship further. Thus, 10 turns and 1.5 A are used in the optimization, respectively. From Figure 10f, the addition of ferrite increases the flux density considerably and extensively, but the standard deviation also becomes more prominent simultaneously. In addition, the difference is significant between boards with and without ferrite, but the curves tend to be smooth regardless of the increase in ferrite thickness.
The influence of the ferrites is further investigated. Figure 11 compares the impact without and with 3.6 mm ferrite boards. The other parameters are the optimization results mentioned above. The BZ of the yOz profile shows that the magnetic field below the ferrite is shielded while the magnetic field above is strengthened.

4. Circuit Configuration and Characteristic Analysis

4.1. Circuit Configuration

The circuits are designed to realize the magnetic field distribution according to the optimized parameters, and the specific configuration is depicted in Figure 12. On the primary side, the DC power source and the full bridge inverter circuit transfer DC voltage to AC voltage and power the system. The three transmitting coils and the corresponding LCC compensation network are connected to the output terminal of the inverter in parallel to form three branches. The currents in the transmitting coils generate a desirable magnetic field distribution for power transmission via electromagnetic couplers. The receiving coil is connected to the S-compensation network on the secondary side after generating inductive voltage through mutual inductance. Afterwards, the load is powered with DC through the rectifier, filter, and DC-DC circuit. The above circuits are equivalent to resistors for simplification during the characteristic analysis. Furthermore, MPiPi′ and MPiS represent the mutual inductances between the ith and i’th branches, or the ith branch and the secondary side, respectively.
Compensation networks are added to make the circuit and the coil resonant, enhancing the transmission power and efficiency. The LCC compensation network achieves a constant AC amplitude in the transmitter coil when the load varies by fixing the compensating inductor [37]. The S-compensated network has a constant voltage output characteristic and is one of the most commonly used first-order compensation networks [38,39]. Thus, the LCC-S compensation networks are utilized based on practical needs. Assuming the voltage amplitude of the branches is UAC, the current in the ith coil branch is:
I Pi = jU AC ω L Ci ω = 2 π f
where LCi denotes the compensating inductance in the ith LCC network. The f and ω are the frequency and angular frequency, respectively. The relationship among the compensating elements is:
ω 2 L Ci C Ci 1 = 1 ω 2 L Pi L Ci + M Pi C Ci 2 = 1
where ∑MPi is the sum of the mutual inductances related to the ith branch, including MPiPi′ and MPiS. As for the S compensation, the compensating capacitance CS can be expressed as:
ω 2 L S C S = 1

4.2. Circuit Characteristics Analysis

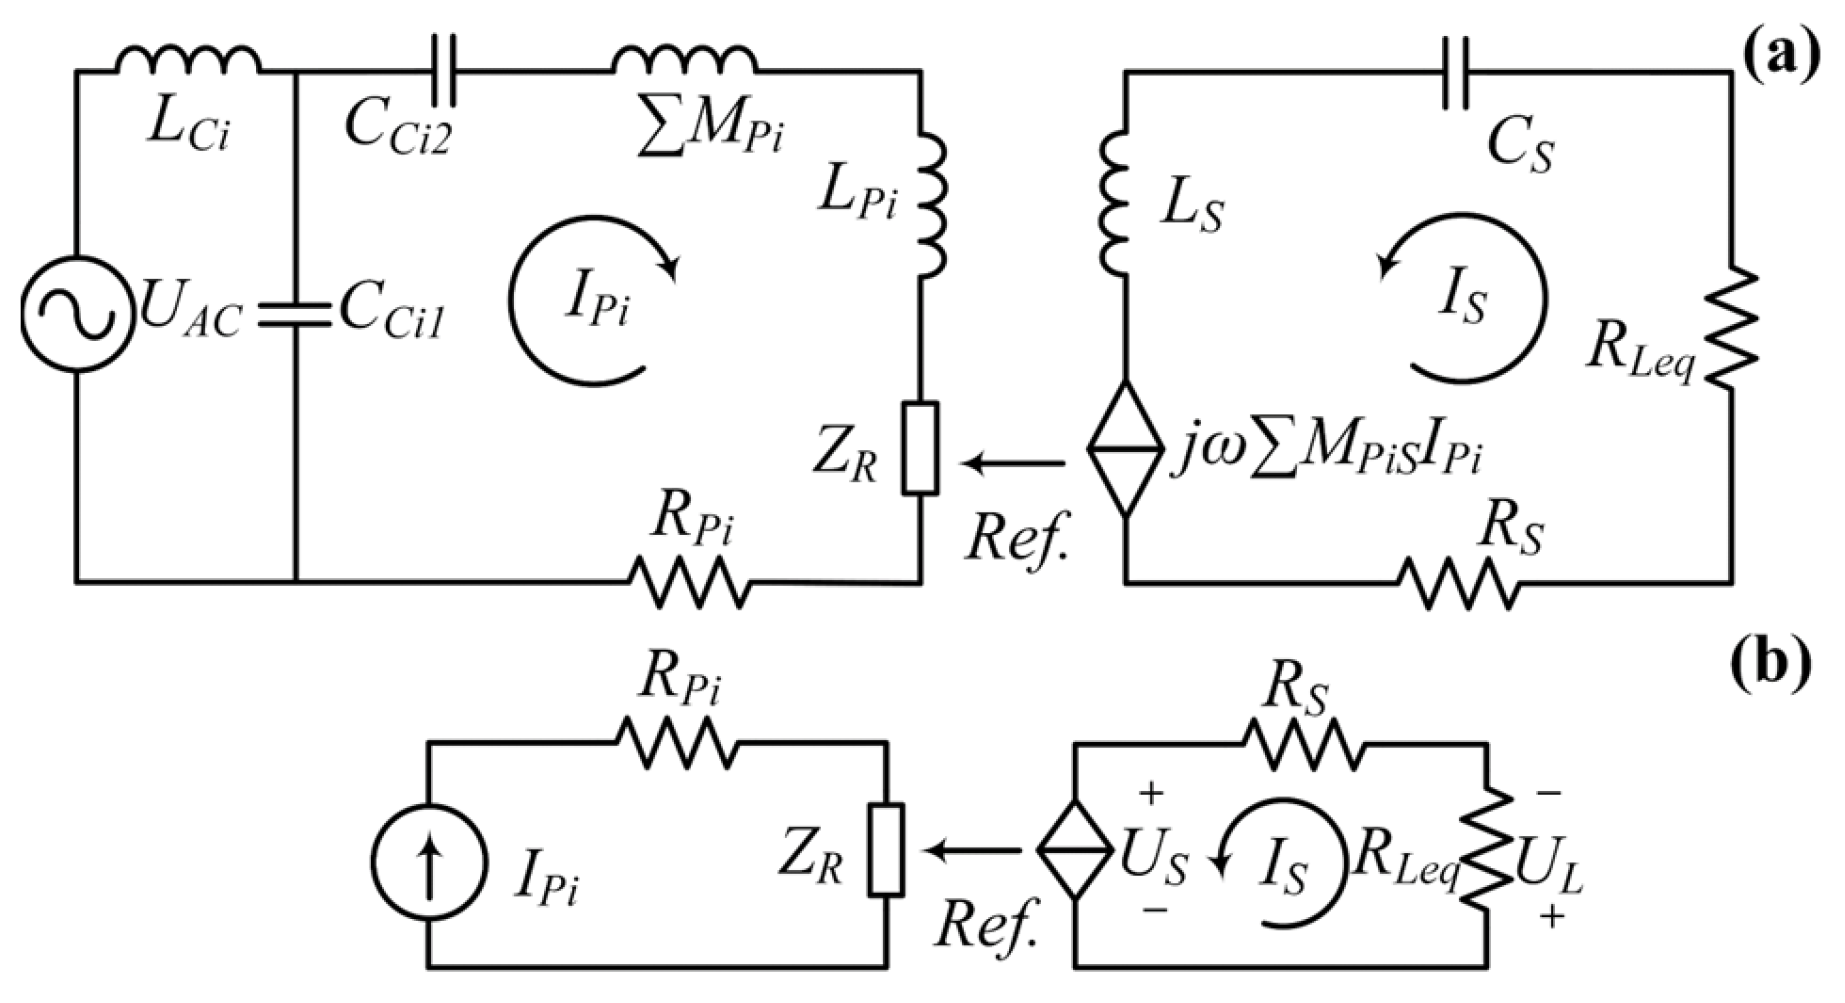
In order to analyze the transmission characteristics of the loads, the circuit illustrated above can be simplified to an equivalent version in Figure 13. Each branch contributes an induced voltage to the secondary side by mutual inductances, and the sum of the voltages can be obtained by applying the superposition theorem.
U S = j ω i M PiS I Pi     ( i = 1 ,   2 ,   3 ) .
Then, the output characteristics of the receivers can be calculated as follows:
I S = U S R S + R Leq = j ω i M PiS I Pi R S + R Leq U L = I S · R Leq = j ω i M PiS I Pi 1 + R S R Leq P out = I S 2 R Leq = ω i M PiS I Pi R S + R Leq 2 · R Leq = ω i M PiS I Pi 2 R Leq + 2 R S + R S 2 R Leq .
The equations show that the mutual inductances and the currents in the primary branches affect the output characteristics most. They are determined by the magnetic field distribution, indicating the importance of the optimization process described in the previous section. Furthermore, the copper loss caused by the coil resistance leads to decreased output voltage and power. Therefore, low-resistance Litz wires should be selected, and unnecessary lengths should be shortened to reduce the extra power loss. However, the coil resistance is relatively low compared to the load resistance, and the heavy loads lead to a high output voltage and a low output power level. The input power and the transmission efficiency can be obtained from the reflected impedance of the secondary circuits.
Z R = i ω 2 M PiS 2 R S + R Leq ,
P in = i I Pi 2 · R Pi + Z R η a i r = P out P in = ω i M PiS I Pi R S + R Leq 2 · R Leq I Pi 2 · R Pi + i ω 2 M PiS 2 R S + R Leq = 1 1 + R S R L + R Pi ω 2 i M PiS 2 R L + R S 2 R L + 2 R S .
Higher mutual inductances lead to better transmission efficiency. In general, the resistance of the coils can be negligible compared to the loads, so the efficiency decreases as the load gets heavier. However, when the coil resistance is relatively high due to, for instance, the length of the connection cables, the effect of resistance cannot be ignored. Since the polynomial with the last term of the denominator has a minimum point, a maximum transmission efficiency point should exist within lower load ranges. However, the exact point needs to be determined by the actual size of the two resistors.
However, in practice, additional power losses are generated by inverters and rectifier circuits, which can be reduced by selecting semiconductor components with lower losses. The eddy current loss caused by seawater is another consumption that can be calculated by comparing the input power in air and water environments. Therefore, the overall efficiency is further reduced and can be calculated as follows:
η water = P out P in - water = P out P in + P eddy + P cir
where Pin-water denotes the input power of the system in seawater; Peddy and Pcir represent the eddy current loss and circuit loss, respectively.

5. Underwater WPT Station Assembly and Experiments

5.1. Station Prototype Assembly

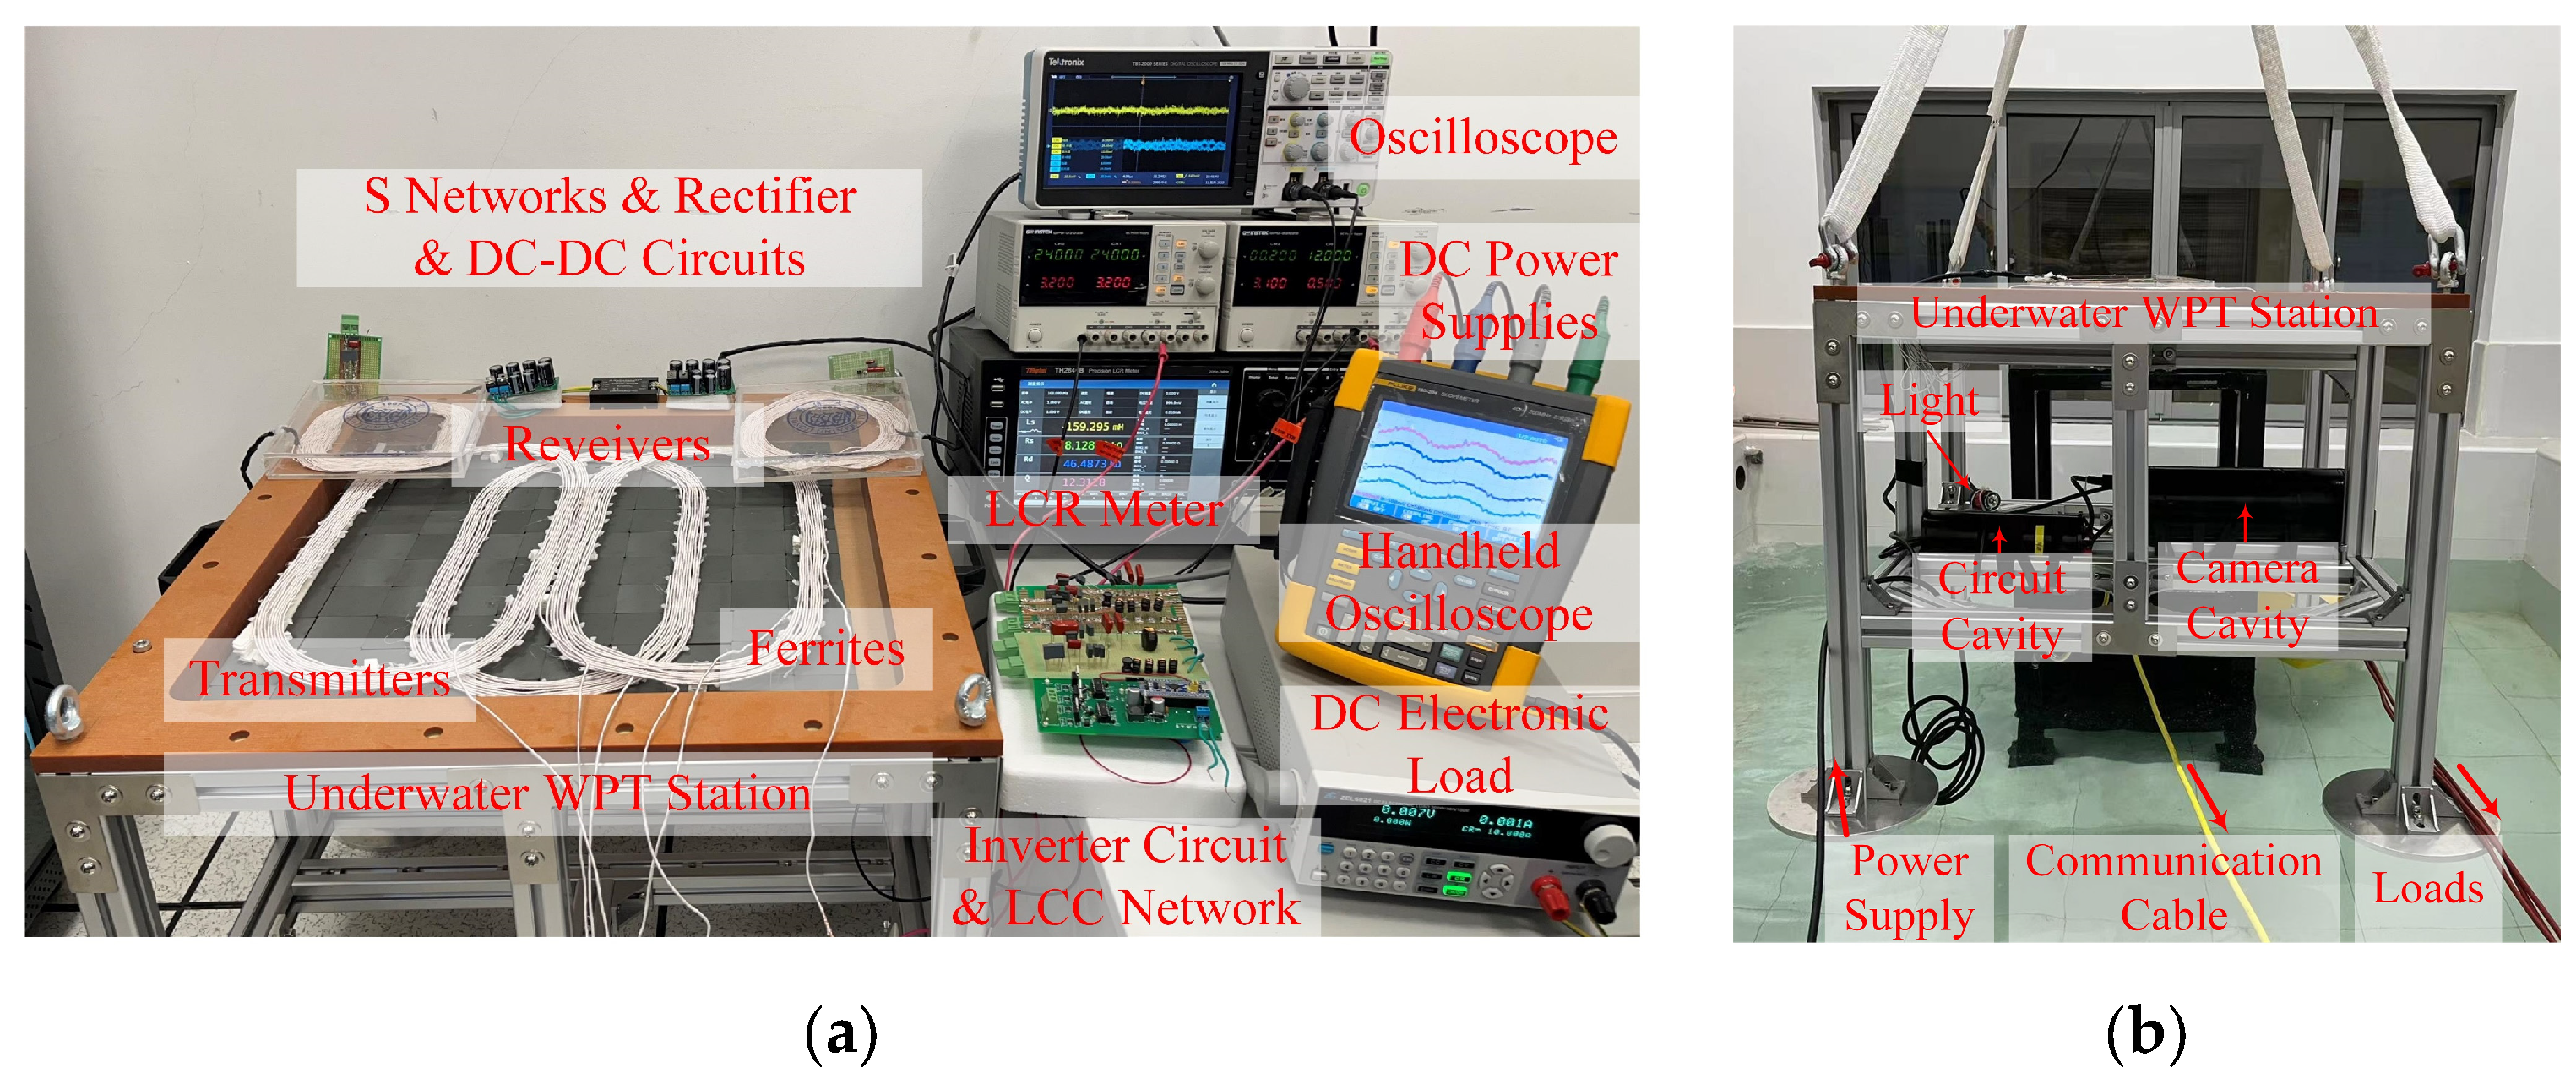
A prototype of the underwater WPT station has been constructed according to the above parameters, and the laboratory test environment is shown in Figure 14a. A square-type coil and a circular-type coil are used as receivers to verify the compatibility of the station and the theoretical derivations. Both coils were wound to form 175 mm outer diameters with 20 turns for the required voltage and power level. Other sizes can also be applied according to practical needs. The full bridge inverter circuit consists of four IFR540N MOSFETs, which are selected considering the voltage level and the switching speed. The switching states of the MOSFETs are controlled by the STM32F103C8T6 microcontroller unit (MCU), and the pulse-width modulation (PWM) control signals are amplified to drive the MOSFETs by two IR2110PBF chips. Each H-bridge rectifier circuit consists of four MBR10100 Schottky diodes for high-frequency rectification. The 470 uF and 47 uF high-voltage electrolytic capacitors comprise the filter circuit, and the RMF100-4824W DC-DC converter is connected to output a stable 24 V voltage for the loads. The transmitters were powered by GWINSTEK GPD-3303S DC power supplies, and ZEL6021 DC electronic loads were used as adjustable loads. A Tektronix 2024B oscilloscope and FLUKE 190-204 scope meter were utilized to observe the key waveforms. The coil parameters were measured by a Tonghui TH2804B Precision LCR meter. The specific values and compensation components are listed in Table 4.
The proposed underwater WPT station was assembled and watertight-treated after completing the bench-top tests. Afterwards, the station prototype with loads was transferred into a water tank. Figure 14b shows that the onshore DC power was connected to the circuit cavity through the cable. The receiver was feeding power to the underwater camera and lights through the circuits in the camera cavity. In addition, the onshore DC electronic load was connected to the cavities via cables to simulate various observation equipment. A sampling circuit measured the load’s consumption. The relevant data and videos were transmitted by the communication cable and displayed in the onshore system for obtaining the output power and transmission efficiency.

5.2. Experiment Results

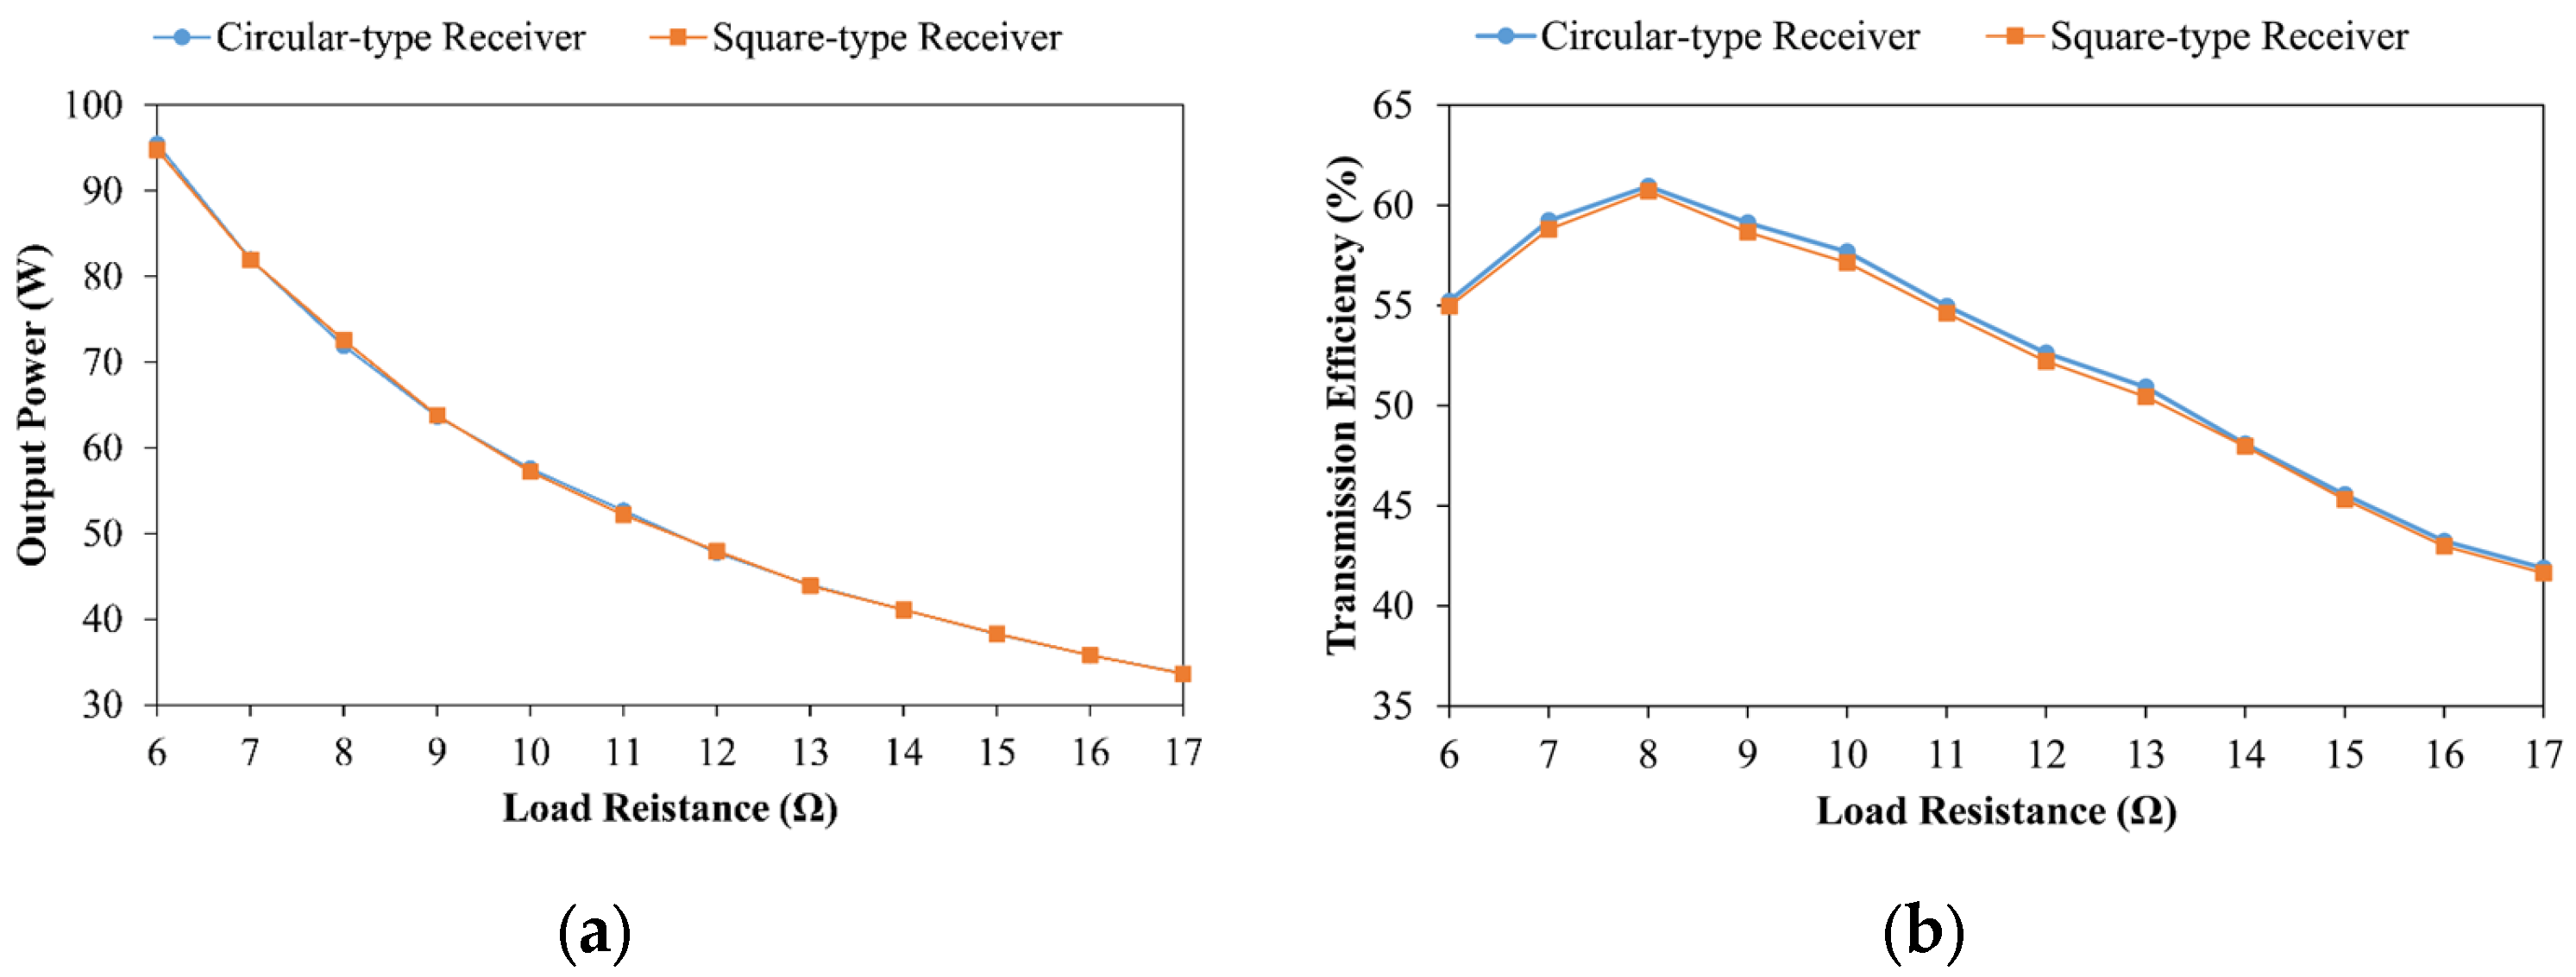
Circular-type and square-type receivers were utilized to verify the performance and compatibility. Resistors from 6–17 Ω were used for equivalent loads. The output power and transmission efficiency curves are shown in Figure 15. The output power continues to decrease as the resistance increases, while there is a maximum transmission efficiency point. When the load resistance is 6 Ω, the station outputs up to 96 W of power, and the efficiency is about 55%. When the load resistance is 8 Ω, the maximum transmission efficiency is 61%. The curves follow the same trends and are consistent with the theoretical analysis. However, the efficiency of the square-type receiver is slightly lower because of the mutual inductance. Therefore, receivers with greater mutual inductance should be selected to improve efficiency in practical applications.
The relationship between the output power and the overall transmission efficiency was measured by adjusting the load resistances. As shown in Figure 16, the overall efficiency reaches approximately 61%. The efficiency in water is lower than in air because of the eddy current loss. The loss is obtained by comparing the difference with the same settings, and the value is around 10 W due to the conductivity of the artificial seawater that filled the tank.
In order to verify the power transmission stability, an underwater camera, two underwater lights, and a 10 Ω resistor were used as loads near the maximum transmission efficiency point. Continuous test data for about 10 min is shown in Figure 17a. The values and curves of the output voltage, current, and power are displayed in the monitoring interface. The output voltage and power curves fluctuate within a small range, around 23.3 V and 76 W, indicating a stable wireless charging process. Figure 17b shows the picture captured by the underwater camera.

6. Conclusions

In this paper, a highly compatible underwater WPT station has been designed for powering seafloor observation equipment. The transmitter of the station consists of three runway-structure coils for a sufficient power feeding area, and the magnetic field distribution was analyzed by derivation and FEM simulation to achieve compatibility. The design parameters were further optimized and compared by MISQP and EA algorithms for better transmission performance. The circuit characteristics were analyzed to clarify the output power and transmission efficiency trends with various loads. An underwater WPT station prototype was developed and tested in underwater environments. The station prototype can power various loads and output a maximum power of 100 W, with a maximum overall transmission efficiency of 61%. Future work will focus on the long-term deployment of the WPT station by connecting it to CSOs.

Author Contributions

Conceptualization, F.L.; methodology, F.L., T.C. and F.H.; software, T.C.; validation, F.L.; formal analysis, T.C. and F.H.; investigation, T.C. and F.L.; resources, F.L.; data curation, T.C., T.W. and F.H.; writing—original draft preparation, T.C. and F.L.; writing—review and editing, T.C. and F.L.; visualization, T.C. and T.W.; supervision, F.L.; project administration, F.L.; funding acquisition, F.L. All authors have read and agreed to the published version of the manuscript.

Funding

This research was funded by the Shanghai Science and Technology Innovation Initiative under grant no. 22ZR1464500, the National Natural Science Foundation of China under grant no. 61936014, and the Interdisciplinary Key Project of Tongji University under grant no. ZD-22-202103.

Institutional Review Board Statement

Not applicable

Informed Consent Statement

Not applicable

Data Availability Statement

The data that support the findings of this study are available from the corresponding authors upon reasonable request.

Conflicts of Interest

The authors declare no conflict of interest.

References

  1. Favali, P.; Beranzoli, L. Seafloor Observatory Science: A Review. Ann. Geophys. 2006, 49, 515–567. [Google Scholar] [CrossRef]
  2. Lu, F.; Zhou, H.; Peng, X.; Yue, J.; Wang, P. Technical preparation and prototype development for long-term cabled seafloor observatories in Chinese marginal seas. In Seafloor Observatories: A New Vision of the Earth from the Abyss; Favali, P., Beranzoli, L., De Santis, A., Eds.; Springer: Berlin/Heidelberg, Germany, 2015; pp. 503–529. [Google Scholar]
  3. Painter, H.; Flynn, J. Current and Future Wet-Mate Connector Technology Developments for Scientific Seabed Observatory Applications. In Proceedings of the OCEANS 2006, Singapore, 18–21 September 2006; pp. 1–6. [Google Scholar]
  4. Teeneti, C.R.; Truscott, T.T.; Beal, D.N.; Pantic, Z. Review of Wireless Charging Systems for Autonomous Underwater Vehicles. IEEE J. Ocean. Eng. 2021, 46, 68–87. [Google Scholar] [CrossRef]
  5. Zhang, B.; Xu, W.; Lu, C.; Lu, Y.; Wang, X. Review of low-loss wireless power transfer methods for autonomous underwater vehicles. IET Power Electron. 2022, 15, 775–788. [Google Scholar] [CrossRef]
  6. Cheng, Z.; Lei, Y.; Song, K.; Zhu, C. Design and Loss Analysis of Loosely Coupled Transformer for an Underwater High-Power Inductive Power Transfer System. IEEE Trans. Magn. 2015, 51, 1–10. [Google Scholar] [CrossRef]
  7. Kan, T.; Mai, R.; Mercier, P.P.; Mi, C.C. Design and Analysis of a Three-Phase Wireless Charging System for Lightweight Autonomous Underwater Vehicles. IEEE Trans. Power Electron. 2018, 33, 6622–6632. [Google Scholar] [CrossRef]
  8. Cai, C.; Zhang, Y.; Wu, S.; Liu, J.; Zhang, Z.; Jiang, L. A Circumferential Coupled Dipole-Coil Magnetic Coupler for Autonomous Underwater Vehicles Wireless Charging Applications. IEEE Access 2020, 8, 65432–65442. [Google Scholar] [CrossRef]
  9. Cai, C.; Wu, S.; Zhang, Z.; Jiang, L.; Yang, S. Development of a Fit-to-Surface and Lightweight Magnetic Coupler for Autonomous Underwater Vehicle Wireless Charging Systems. IEEE Trans. Power Electron. 2021, 36, 9927–9940. [Google Scholar] [CrossRef]
  10. Wu, S.; Cai, C.; Chai, W.; Li, J.; Cui, Q.; Yang, S. Uniform Power IPT System With Quadruple-Coil Transmitter and Crossed Dipole Receiver for Autonomous Underwater Vehicles. IEEE Trans. Ind. Appl. 2022, 58, 1289–1297. [Google Scholar] [CrossRef]
  11. Yan, Z.; Zhang, Y.; Song, B.; Zhang, K.; Kan, T.; Mi, C. An LCC-P Compensated Wireless Power Transfer System with a Constant Current Output and Reduced Receiver Size. Energies 2019, 12, 172. [Google Scholar] [CrossRef] [Green Version]
  12. Feezor, M.D.; Sorrell, F.Y.; Blankinship, P.R. An interface system for autonomous undersea vehicles. IEEE J. Ocean. Eng. 2001, 26, 522–525. [Google Scholar] [CrossRef]
  13. Bradley, A.M.; Feezor, M.D.; Singh, H.; Sorrell, F.Y. Power systems for autonomous underwater vehicles. IEEE J. Ocean. Eng. 2001, 26, 526–538. [Google Scholar] [CrossRef]
  14. Kawasaki, T.; Noguchi, T.; Fukasawa, T.; Hayashi, S.; Shibata, Y.; Limori, T.; Okaya, N.; Fukui, K.; Kinoshita, M. “Marine Bird”, a new experimental AUVresults of docking and electric power supply tests in sea trials. In Proceedings of the Oceans ‘04 MTS/IEEE Techno-Ocean ‘04 (IEEE Cat. No.04CH37600), Kobe, Japan, 9–12 November 2004; pp. 1738–1744. [Google Scholar]
  15. Hobson, B.W.; McEwen, R.S.; Erickson, J.; Hoover, T.; McBride, L.; Shane, F.; Bellingham, J.G. The Development and Ocean Testing of an AUV Docking Station for a 21” AUV. In Proceedings of the OCEANS 2007, Vancouver, BC, Canada, 29 September–4 October 2007; pp. 1–6. [Google Scholar]
  16. McEwen, R.S.; Hobson, B.W.; McBride, L.; Bellingham, J.G. Docking Control System for a 54-cm-Diameter (21-in) AUV. IEEE J. Ocean. Eng. 2008, 33, 550–562. [Google Scholar] [CrossRef]
  17. McGinnis, T.; Henze, C.P.; Conroy, K. Inductive Power System for Autonomous Underwater Vehicles. In Proceedings of the OCEANS 2007, Vancouver, BC, Canada, 29 September–4 October 2007; pp. 1–5. [Google Scholar]
  18. Huang, Y.; Fang, C.; Li, X. Contactless power and data transmission for underwater sensor nodes. EURASIP J. Wirel. Commun. Netw. 2013, 2013, 81. [Google Scholar] [CrossRef] [Green Version]
  19. Xu, J.; Li, X.; Li, H.; Xie, Z.; Ma, Q. Maximum Efficiency Tracking for Multitransmitter Multireceiver Wireless Power Transfer System on the Submerged Buoy. IEEE Trans. Ind. Electron. 2022, 69, 1909–1919. [Google Scholar] [CrossRef]
  20. Zhou, J.; Li, D.-J.; Chen, Y. Frequency selection of an inductive contactless power transmission system for ocean observing. Ocean Eng. 2013, 60, 175–185. [Google Scholar] [CrossRef]
  21. Sato, Y.; Maki, T.; Masuda, K.; Matsuda, T.; Sakamaki, T. Autonomous docking of hovering type AUV to seafloor charging station based on acoustic and visual sensing. In Proceedings of the 2017 IEEE Underwater Technology (UT), Busan, Republic of Korea, 21–24 February 2017; pp. 1–6. [Google Scholar]
  22. He, Z.; Wang, Y.; Ding, L.; Nie, X. Research on three-dimensional omnidirectional wireless power transfer system for subsea operation. In Proceedings of the OCEANS 2017, Aberdeen, UK, 19–22 June 2017; pp. 1–5. [Google Scholar]
  23. Wang, T.; Zhao, Q.; Yang, C. Visual navigation and docking for a planar type AUV docking and charging system. Ocean Eng. 2021, 224, 108744. [Google Scholar] [CrossRef]
  24. Yang, C.; Wang, T.; Chen, Y. Design and analysis of an omnidirectional and positioning tolerant AUV charging platform. IET Power Electron. 2019, 12, 2108–2117. [Google Scholar] [CrossRef]
  25. Huang, L.; Lyu, F. Compact Low-Velocity Ocean Current Energy Harvester Using Magnetic Couplings for Long-Term Scientific Seafloor Observation. J. Mar. Sci. Eng. 2020, 8, 410. [Google Scholar] [CrossRef]
  26. Lyu, F.; Cai, T.; Huang, L. Harvesting Weak Ocean Current Energy for Resident Unmanned Underwater Vehicles. In Proceedings of the OCEANS 2021: San Diego—Porto, San Diego, CA, USA, 20–23 September 2021; pp. 1–6. [Google Scholar]
  27. Wang, T.; Yang, C. Magnetic field optimization for high-positioning-tolerant wireless charging platforms. J. Power Electron. 2020, 20, 22–33. [Google Scholar] [CrossRef]
  28. Zhong, W.X.; Liu, X.; Hui, S.Y.R. A Novel Single-Layer Winding Array and Receiver Coil Structure for Contactless Battery Charging Systems With Free-Positioning and Localized Charging Features. IEEE Trans. Ind. Electron. 2011, 58, 4136–4144. [Google Scholar] [CrossRef] [Green Version]
  29. Sato, N.; Kifune, H.; Komeda, S. A coil layout of wireless power transfer systems based on multicoil arrangement for underwater vehicles. Electr. Eng. Jpn. 2019, 207, 38–48. [Google Scholar] [CrossRef]
  30. Pahlavan, S.; Shooshtari, M.; Jafarabadi Ashtiani, S. Star-Shaped Coils in the Transmitter Array for Receiver Rotation Tolerance in Free-Moving Wireless Power Transfer Applications. Energies 2022, 15, 8643. [Google Scholar] [CrossRef]
  31. Mirbozorgi, S.A.; Maghsoudloo, E.; Bahrami, H.; Sawan, M.; Gosselin, B. Multi-resonator arrays for smart wireless power distribution: Comparison with experimental assessment. IET Power Electron. 2020, 13, 4183–4193. [Google Scholar] [CrossRef]
  32. Zhou, J.; Guo, K.; Chen, Z.; Sun, H.; Hu, S. Design considerations for contact-less underwater power delivery: A systematic review and critical analysis. Wirel. Power Transf. 2020, 7, 76–85. [Google Scholar] [CrossRef]
  33. Budhia, M.; Boys, J.T.; Covic, G.A.; Huang, C.Y. Development of a Single-Sided Flux Magnetic Coupler for Electric Vehicle IPT Charging Systems. IEEE Trans. Ind. Electron. 2013, 60, 318–328. [Google Scholar] [CrossRef]
  34. Sampath, J.P.K.; Alphones, A.; Vilathgamuwa, D.M. Figure of Merit for the Optimization of Wireless Power Transfer System Against Misalignment Tolerance. IEEE Trans. Power Electron. 2017, 32, 4359–4369. [Google Scholar] [CrossRef]
  35. Kiani, M.; Ghovanloo, M. A Figure-of-Merit for Designing High-Performance Inductive Power Transmission Links. IEEE Trans. Ind. Electron. 2013, 60, 5292–5305. [Google Scholar] [CrossRef] [Green Version]
  36. Liang, B.; Mao, Z.; Zhang, K.; Liu, P. Analysis and Optimal Design of a WPT Coupler for Underwater Vehicles Using Non-Dominated Sorting Genetic Algorithm. Appl. Sci. 2022, 12, 2015. [Google Scholar] [CrossRef]
  37. Zhu, Q.; Wang, L.; Guo, Y.; Liao, C.; Li, F. Applying LCC Compensation Network to Dynamic Wireless EV Charging System. IEEE Trans. Ind. Electron. 2016, 63, 6557–6567. [Google Scholar] [CrossRef]
  38. Sohn, Y.H.; Choi, B.H.; Lee, E.S.; Lim, G.C.; Cho, G.H.; Rim, C.T. General Unified Analyses of Two-Capacitor Inductive Power Transfer Systems: Equivalence of Current-Source SS and SP Compensations. IEEE Trans. Power Electron. 2015, 30, 6030–6045. [Google Scholar] [CrossRef]
  39. Wen, H.; Zhang, K.; Yan, Z.; Song, B. A novel electromagnetic actuator in an inductive power transmission system for autonomous underwater vehicle. Adv. Mech. Eng. 2018, 10, 1687814018797421. [Google Scholar] [CrossRef]
Figure 1. The principle schematic diagram (a) and the overall structure design (b) of the proposed WPT station.
Jmse 11 01205 g001
Figure 2. The illustration of the magnetic flux density BP generated by a current element Idl at point P. The coils are parallel to the xOy plane. The overall BP can be decomposed into three orthogonal magnetic flux density components: BPx, BPy, and BPz. Since the receiving coils are also parallel to the xOy plane, only the BPz is useful for power transmission. The distance r between Idl and P can be expressed by their coordinates. However, due to the perpendicular relationship between BP and r, the angle φ between BP and BPz can also be obtained with the coordinates and trigonometric functions.
Jmse 11 01205 g002
Figure 3. Comparison of the magnetic field generated by (a) a circular-type coil and (b) a square-type coil with rounded corners at 50mm height. Each coil is set in the geometric center and is powered with 1 A of current. The outer diameter, or side length, of the coils is set to 200 mm, and the inner diameter is set to 180 mm to represent 5-turn coils. The rounded corner radius of the square-type coil is set to 20 mm.
Jmse 11 01205 g003
Figure 4. (a) Geometry conception of the runway-structure coil. The coil can be regarded as a combination of a square and two semi-circles; (b) the magnetic field generated by a runway-structure coil on the 50 mm height. The outer length and the coil diameter are 500 mm and 250 mm, respectively. The 5-turn coil occupies 10 mm in width and is powered with 1 A of current.
Jmse 11 01205 g004
Figure 5. The arrangement and the geometry parameters of the runway-structure transmitter.
Jmse 11 01205 g005
Figure 6. Flowchart of the entire process for MISQP and EA optimization. The FEM computation steps are simulated in Ansys Maxwell 2022R1. The sensitivity analysis and the algorithm optimization steps are operated in Ansys optisLang 2022R1.
Jmse 11 01205 g006
Figure 7. (a) The three-dimensional transmitter model for FEM simulation; (b) Mesh segmentation of the transmitter in Ansys Maxwell 2022R1. The maximum number of passes in the setup percent error of the adaptive setup is set to 30 and 1%, respectively, and the nonlinear residual is set to 0.001 for accuracy and convergence.
Jmse 11 01205 g007
Figure 8. The optimization history of the MISQP algorithm (a) and EA (b).
Jmse 11 01205 g008
Figure 9. The optimized magnetic field distribution.
Jmse 11 01205 g009
Figure 10. The magnetic flux density and the objective function relationship with different parameters. (a) The relative height of the bottom coil layer hB varies from 0–20 mm. (b) The relative height of the top coil layer varies from 0–20 mm. (c) The height of the power feeding area ranges from 40–70 mm. (d) The number of turns of the runway-structure coils varies from 10–15. (e) The current in the bottom layer coil varies from 0–1.5 A. (f) The height of the ferrite board layer varies from 0–5 mm.
Jmse 11 01205 g010
Figure 11. The Bz distribution of the yOz profile with 3.6 mm ferrite boards (a) and without ferrite boards (b).
Jmse 11 01205 g011
Figure 12. Circuit configuration of the proposed WPT station.
Jmse 11 01205 g012
Figure 13. Equivalent circuit configurations. (a) The DC power source and the inverter circuit are equal to an AC power source and are connected to the ith branch. The rectifier, filter, and DC-DC circuit are simplified as an equivalent resistance RLeq. ZR denotes the reflected impedance of the secondary circuits by the mutual inductance MPiS. (b) The power source and the LCC compensation network are further equivalent to an AC source in a branch, and only resistors are maintained due to the active power consumption.
Jmse 11 01205 g013
Figure 14. (a) The experimental prototype of the proposed underwater WPT station and the test instruments in the laboratory environment. (b) The assembled WPT station was lifted above the water tank.
Jmse 11 01205 g014
Figure 15. Output power (a) and transmission efficiency (b) of the receivers with different loads.
Jmse 11 01205 g015
Figure 16. Relationship between the output power and transmission efficiency.
Jmse 11 01205 g016
Figure 17. (a) The load monitoring system of the proposed underwater WPT station. (b) The test icon in the tank captured by the underwater camera.
Jmse 11 01205 g017
Table 1. Comparison of WPT station performance in previous studies.
ReferenceOutput
Power
Operating
Frequency
Overall
Efficiency
CompatibilityLoads
[13]200 W——79%LowAUV
[16]416 W——47%LowAUV
[17]250 W50–125 kHz70%LowMooring profiler
[20]300 W147 kHz85%LowCamera and light
[22]20 mW100 kHz63%High——
[23]~67 W~88.5 kHz50%HighAUV
This paper100 W100 kHz61%HighCSO equipment
Table 2. Parameters of the runway-structure transmitter.
ParametersDefinitionsValues or Ranges
DinInner diameter of the runway-structure coils190–210 mm
DoutOuter diameter of the runway-structure coils250 mm
LSLength of the side of the runway-structure coils250 mm
NNumber of turns of the runway-structure coils10–15
hTRelative height of the top coil layer0–20 mm
hBRelative height of the bottom coil layer0–20 mm
hFHeight of the ferrite board layer0–5 mm
LFLength of the ferrite board layer500 mm
hRXHeight to the power feeding area40–70 mm
ITCurrents in the top layer coil1.5 A
IBCurrent in the bottom layer coil0–1.5 A
Table 3. Comparison of the initial and optimized parameters.
ParametersInitial ValuesOptimized Values
N1510
hT (mm)020
hB (mm)00
hF (mm)03.6
hRX (mm)4066
IB (A)1.51.5
BZ-Mean (T)2.06 × 10−52.39 × 10−5
BZ-Std (T)2.62 × 10−52.72 × 10−5
F(v)1.271.13
Table 4. Parameters of the coils and the compensation networks. The markers Square and Circular indicate the parameters of the square-type and circular-type receiver coils, respectively.
ParametersValuesParametersValues
LP1134 uHMP1P26 uH
LP2112 uHMP2P315 uH
LP3106 uHMP1P315 uH
LC1, LC2, LC348 uHLSquare74 uH
CC11, CC21, CC3153 nFCSquare34 nF
CC1220 nFRSquare0.25 Ω
CC2225 nFLCircular82 uH
CC3224 nFCCircular31 nF
RP10.43 ΩRCircular0.29 Ω
RP20.42 Ωf100 kHz
RP30.41 ΩUDC48 V
Disclaimer/Publisher’s Note: The statements, opinions and data contained in all publications are solely those of the individual author(s) and contributor(s) and not of MDPI and/or the editor(s). MDPI and/or the editor(s) disclaim responsibility for any injury to people or property resulting from any ideas, methods, instructions or products referred to in the content.