1. Introduction
Wind energy is one of the clean energies. Vigorously developed wind resources can effectively solve the problem of resource shortage faced on Earth. Wind turbines, as a kind of large machine for wind energy conversion, are welcomed by countries all over the world. As a kind of flexible structure, the stability of the wind turbine structure determines the safety of power generation. Wind turbines are affected by many factors under real operating conditions. The interaction between the flow field and the wind turbine occurs in real time. Considering the coupling effect of fluids and solids, this study can be better carried out.
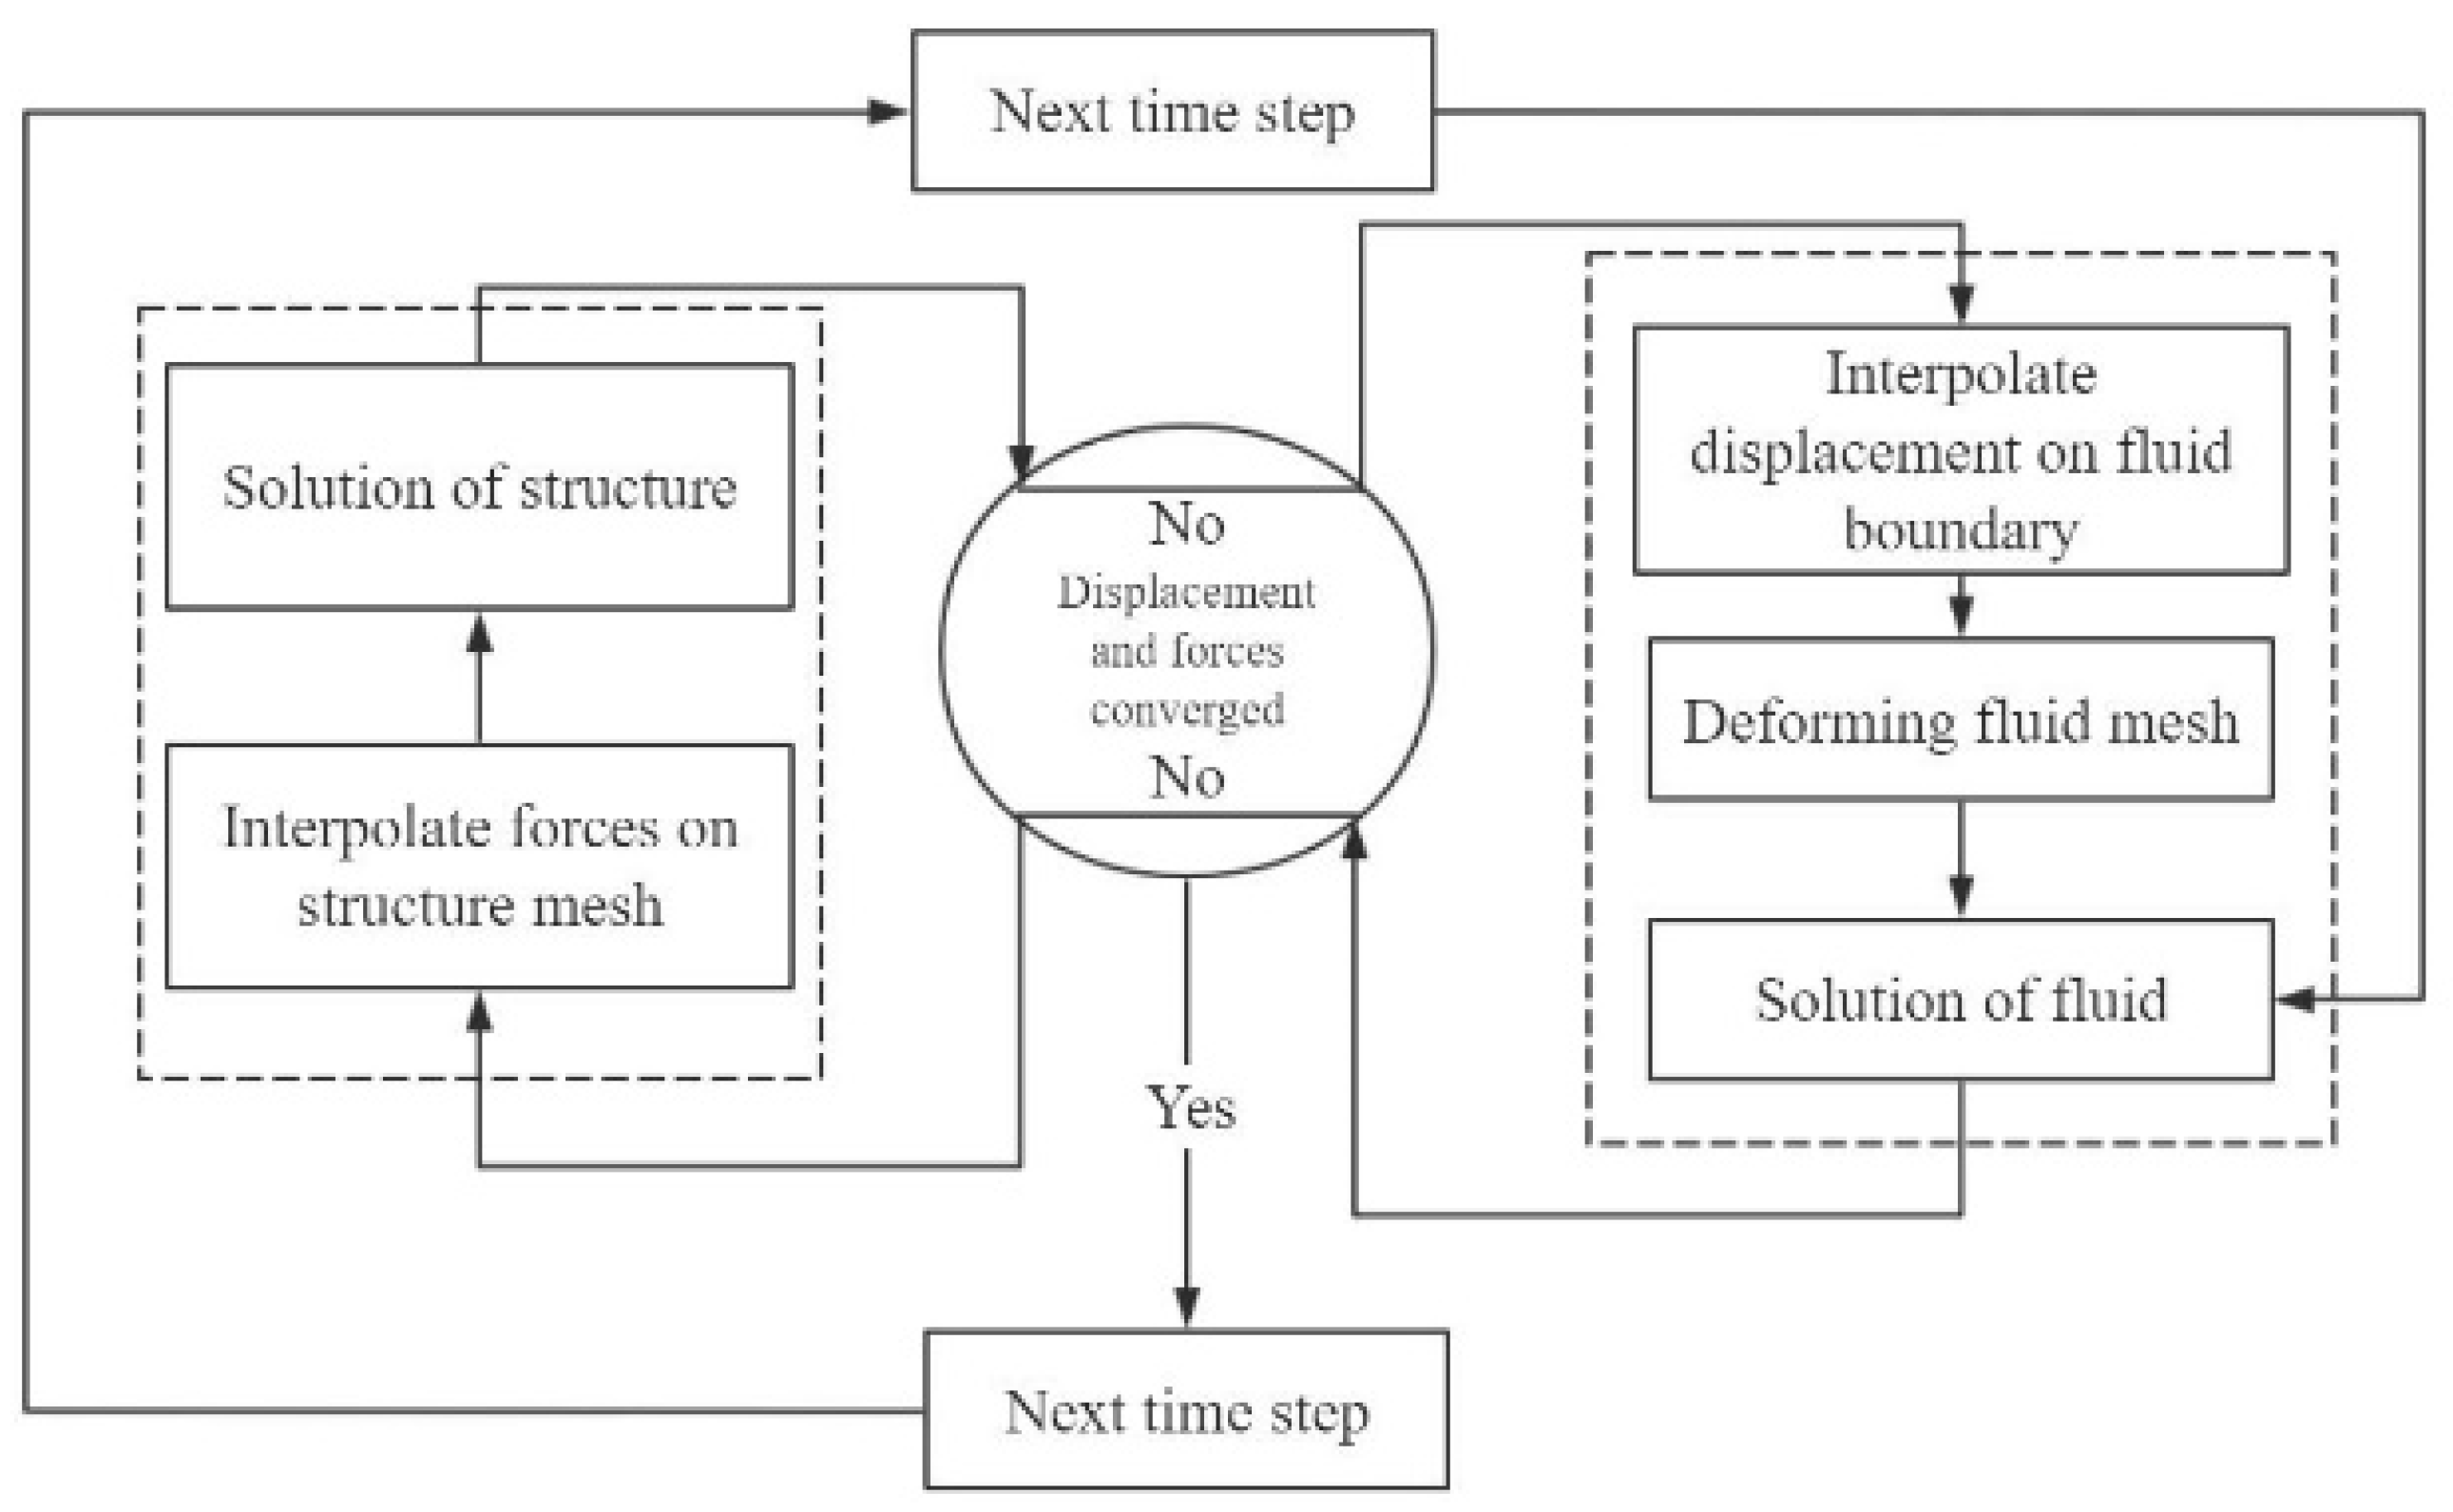
The research method of fluid–structure interaction adopts the theory of computational fluid dynamics (CFD) to solve for the fluid and the theory of computational structural dynamics (CSD) to solve for the structure. This cyclic solution method can accurately obtain the state of the wind turbine in the entire period. Due to the use of the CFD method and the CSD method, the characterization of the fluid and structural details can also be very specific, and researchers can intuitively observe the flow field and structural response. With the increasing size of wind turbine blades, the structural safety requirements are more stringent than before. Research on the fluid–structure interaction of large-scale flexible blade wind turbines is a necessary.
The aerodynamic performance of a wind turbine directly affects the power generation efficiency, and the research and method innovation for aerodynamic performance has also been a research hotspot. Alkhabbaz et al. (2021) [
1] adopted a unique linearization method to linearize the chord and twist distributions, optimizing the nonlinear blade profile to improve aerodynamic performance and to reduce manufacturing complexity. Li et al. (2021) [
2] used the method of large eddy simulations to study the similarity of wind turbine wakes with different yaw angles and tip speed ratios under different turbulent inflows. Li et al. (2021) [
3] improved the engineering model of the Morison-type drag potential flow theory by modifying second-order difference–frequency quadratic transfer functions (QTFs) and frequency-dependent additional mass and damping. Conde et al. (2019) [
4] used commercial CFD software to simulate a low-speed and low-power three-blade horizontal-axis wind turbine. Wang et al. (2018) [
5] applied a combination of CFD and taguchi methods to optimize the aerodynamic performance of a typical three-blade VAWT at a low TSR of 2. Jeong et al. (2018) [
6] investigated the effect of a flat-back airfoil on the medial region using CFD software simulations. Lee et al. (2017) [
7] performed their analysis using computational fluid dynamic (CFD) simulations and compared the results with original NREL blade CFD and experimental data using ANSYS CFX. Kecskemety et al. (2016) [
8] comprehensively validated the NREL FAST code, which has been enhanced to include free vortex wake models.
Wind turbine blades are deformed by wind loads, and large deformations need to be closely monitored for structural safety. In recent years, the size of wind turbine blades has become larger and larger, and blade deformation is also increasing. Wind turbine aeroelasticity problems also become more important. Howison et al. (2018) [
9] presented a wind turbine blade aeroelastic model and a mode shape-based structural dynamics model derived from the unsteady Navier–Stokes equations. Tang et al. (2017) [
10] developed an aeroelastic approach to wind turbines, emphasizing the effects of aeroelasticity on aerodynamics and structural performance. The system governing equations for aeroelastic effects is derived from combining the multi-body method with the free vortex wake (FVW) method. Horcas et al. (2017) [
11] proposed an innovative approach to study the dynamic aeroelasticity of horizontal-axis wind turbines, which is an extension of the nonlinear harmonics (NLH) method, an efficient computational method for analyzing unsteady periodic flows. Heinz et al. (2016) [
12] investigated the aeroelastic response of a DTU 10-MW RWT blade under deep stall conditions with an angle of attack close to 90 degrees. M. Carrión et al. (2014) [
13] used the University of Liverpool’s Compressible Flow Helicopter Multiblock (HMB2) solver in combination with computational structural dynamics methods to analyze the aeroelasticity of wind turbines. Ghasemi et al. (2014) [
14] studied the aeroelastic stability of composite blades for wind turbines. Velazquez et al. (2013) [
15] explored the characterization of wind turbine loads and response envelopes for critical failure modes of wind turbine blade structures. A framework is presented to develop analytical estimates of the loading environment, including loading effects, based on blade dynamic behavior. Skjoldan et al. (2012) [
16] studied the relationship between shear wind and modal damping.
The research method of fluid–structure interaction has been widely used in the field of wind turbines in recent years. This advanced research method is widely sought after for its accuracy and reliability. Popularization and wind turbine fluid–structure interaction research has achieved many eye-catching results this year. Todorov et al. (2009) [
17] used commercial software as a tool to perform an accurate fluid–structure interaction simulation of Phase VI wind turbine blades. Lee (2012) [
18] input the aerodynamic load obtained by the CFD solution to the surface of the finite element model through continuous multiple loading and then carried out a numerical simulation in the finite element analysis software to obtain an aeroelastic response. Yu et al. (2014) [
19] studied the effects of wind rotor elevation angle and tower shadow effect on the aerodynamic performance and aeroelastic stability of wind turbines. Bazilevs (2015) [
20] et al. developed a new grid technique to simulate wind turbine rotation for the study of fluid–structure coupling of wind turbine blades and used two different wind turbines for verification. The results show that the new grid method is highly applicable. Korobenko et al. (2016) [
21] used the method of dividing multiple computational domains to improve computational efficiency and conducted fluid–structure interaction simulations with two 5 MW wind turbines arranged in front of each other. Wang (2016) [
22] et al. studied the aeroelasticity and stability of a 1.5 MW real-scale wind turbine under different wind conditions by using the one-way fluid–structure coupling technology of ANSYS. Dose et al. (2016) [
23] designed a new simulation method considering the coupling of aerodynamics and aeroelasticity to numerically simulate the aeroelastic response of a single blade under high wind speed conditions. Yao et al. (2023) [
24] simulated the aeroelasticity of 5 MW wind turbine blades under low-speed wind conditions with different turbulence intensities by using the two-way fluid–structure coupling method and found that turbulence intensity had an impact on the vibration form of the blades. Yu et al. (2019) [
25,
26] studied the aeroelastic energy of a 5 MW wind turbine by using the elastic actuator line modeling and found that the effect of the elastic deformation of the blades on the generating efficiency of the blade was limited. ElMouhsine et al. (2018) [
27] used the commercial software FLUENT to design a solution model of fluid–structure interactions for large wind turbines. Pichitkul et al. (2022) [
28] studied a new form of wind turbine blades by using a two-way fluid–structure coupling method and compared it with a NREL 5 MW wind turbine, where they found that the aerodynamic performance of the two designs was similar. Chow et al. (2019) [
29] explored the fluid–structure interaction characteristics of offshore wind turbine platforms using a combination of experiments and numerical simulations. Li et al. (2020) [
30], taking the NREL 5 WM flexible wind turbine blade as an example, investigated the aerodynamic and aeroelastic characteristics under periodic unsteady inflows.
In summary, the aerodynamic performance of wind turbines has been fully studied at home and abroad. In recent years, a large number of scholars have adopted the fluid–structure coupling method in the study of the aeroelasticity of wind turbines, but more attention is paid to the aerodynamic performance of wind turbines. For the modeling of wind turbine blades, most scholars directly adopt the solid or shell structure and obtain many good simulation effects, but the difference between the two models has not been accepted. However, the beam model and the shell model have great differences in computational efficiency. This paper will establish three different models, analyze the stress characteristics of the different models from the perspective of structure, and select the most reasonable model by comparison.
3. Wind Turbine Modeling and Numerical Validation
The CFD numerical simulation results are compared with the NREL laboratory data in terms of thrust and torque, and the output power of the wind turbine simulated by CFD is calculated according to the power meter formula used in practical engineering applications. The power curves obtained by the method are compared to verify the accuracy of the model.
3.1. Model and Numerical Simulation Setup
The coordinates of the airfoil at each station of the blade are converted according to its chord length and torsion angle to obtain the required coordinates. The specific method is to first input the original coordinate data of the airfoil in Excel, taking the aerodynamic center of the airfoil as the origin, according to each chord length of the station that is enlarged, and the rotation is performed according to the airfoil torsion angle of each station, and finally, the required airfoil coordinates of each station are obtained.
Then, the coordinate data of each station are imported into SolidWorks to obtain the airfoil curve of each station. The lofting command is used to stake out a full-scale model of the NREL 5 MW wind turbine blade. It is exported as an IGES file, which can be read by ANSYS, then the rotation domain and outer domain are added in the ANSYS preprocessing software Spaceclaim, and finally, the calculation model required for the CFD simulation is obtained.
The specific calculation domain establishment and size control in the ANSYS preprocessing software Spaceclaim are described in detail as follows: the diameter of the rotating plane of the wind turbine is D, the center of the wind turbine hub is the origin, the blade span is the radial direction, and the solid wind turbine is the center. The build shell command is used to build a cylindrical rotation domain outward, the radius of the rotation domain is 1.5D, the width is 30 m, and the rotation domain is symmetrical with respect to the wind turbine. In addition, based on the previous origin and radius direction, the Build Shell command is used to create an external static domain outside the rotating domain, with the rotating domain as the center. The radius of the external domain is 3D, which is asymmetric with respect to the upstream and downstream of the rotating domain. The plane of the upstream inflow direction of the external domain is far from the rotation plane of the wind turbine, which is 1D. The downstream plane of the outer domain is 5D away from the rotation plane of the wind turbine.
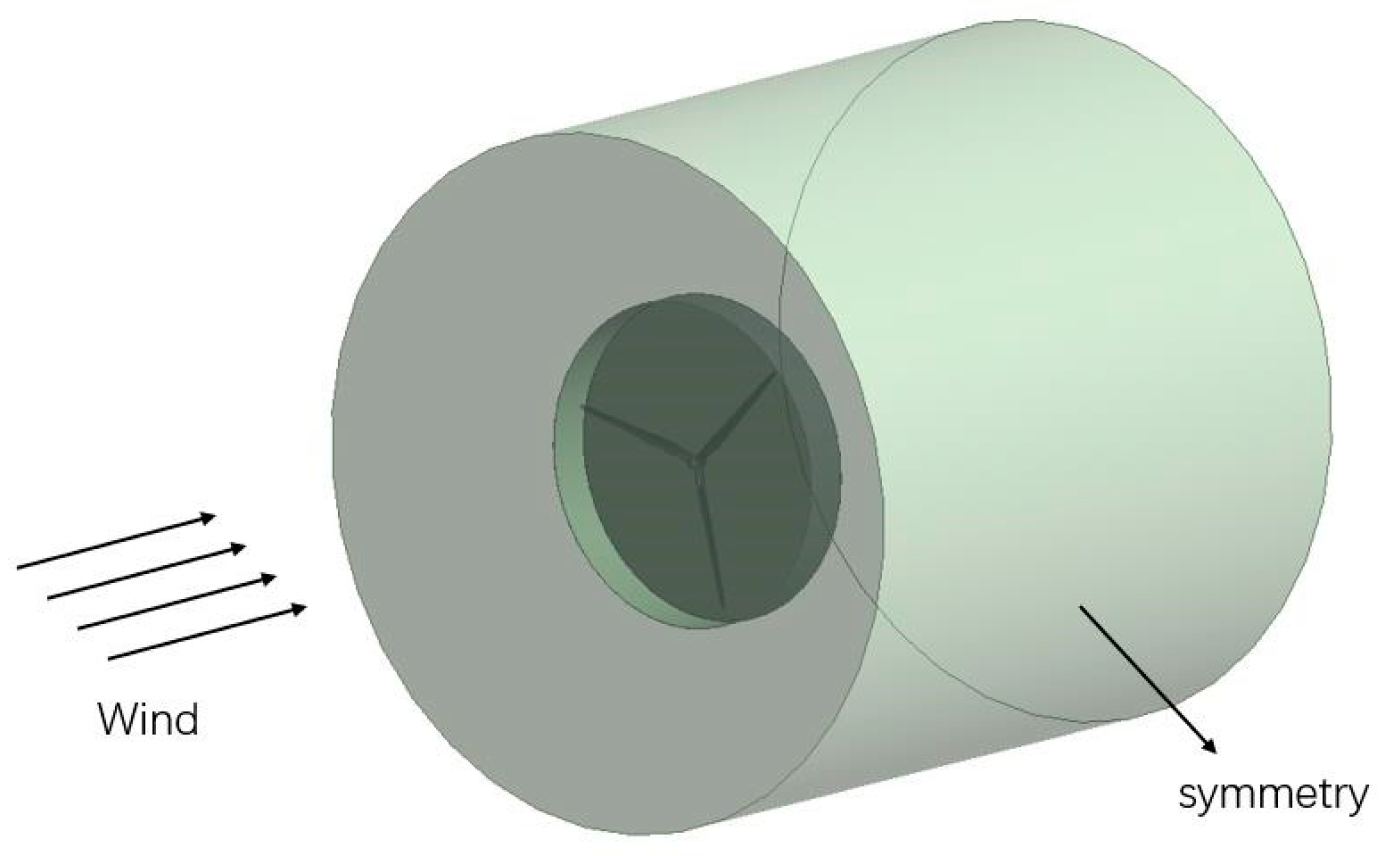
Figure 4 shows a schematic diagram of the fluid domain. The upstream boundary condition of the computational domain is selected as the velocity inlet, and the downstream boundary condition is selected as the pressure outlet. In order to reduce the influence of the wall effect of the external static domain on the solution results, the cylindrical surface of the external static domain is defined as a symmetrical boundary, and the surface of the wind turbine entity is selected for a non-slip wall. The corresponding pair of interfaces between the rotating domain and the external static domain is defined as the data interface. The data interface needs to be set in pairs, and the rotating domain and the external domain can guarantee a one-to-one correspondence, which meets the establishment conditions of the data interface, using the SIMPLEC algorithm, and standard atmospheric pressure is 101,325 Pa.
The direct simulation (DNS) and large eddy simulation (LES) methods require too many computer resources. Considering the computational efficiency and cost, this section selects the Reynolds time-averaged method (RANS) and the RNG k-ε turbulence model for the turbulence model.
3.2. CFD Validation
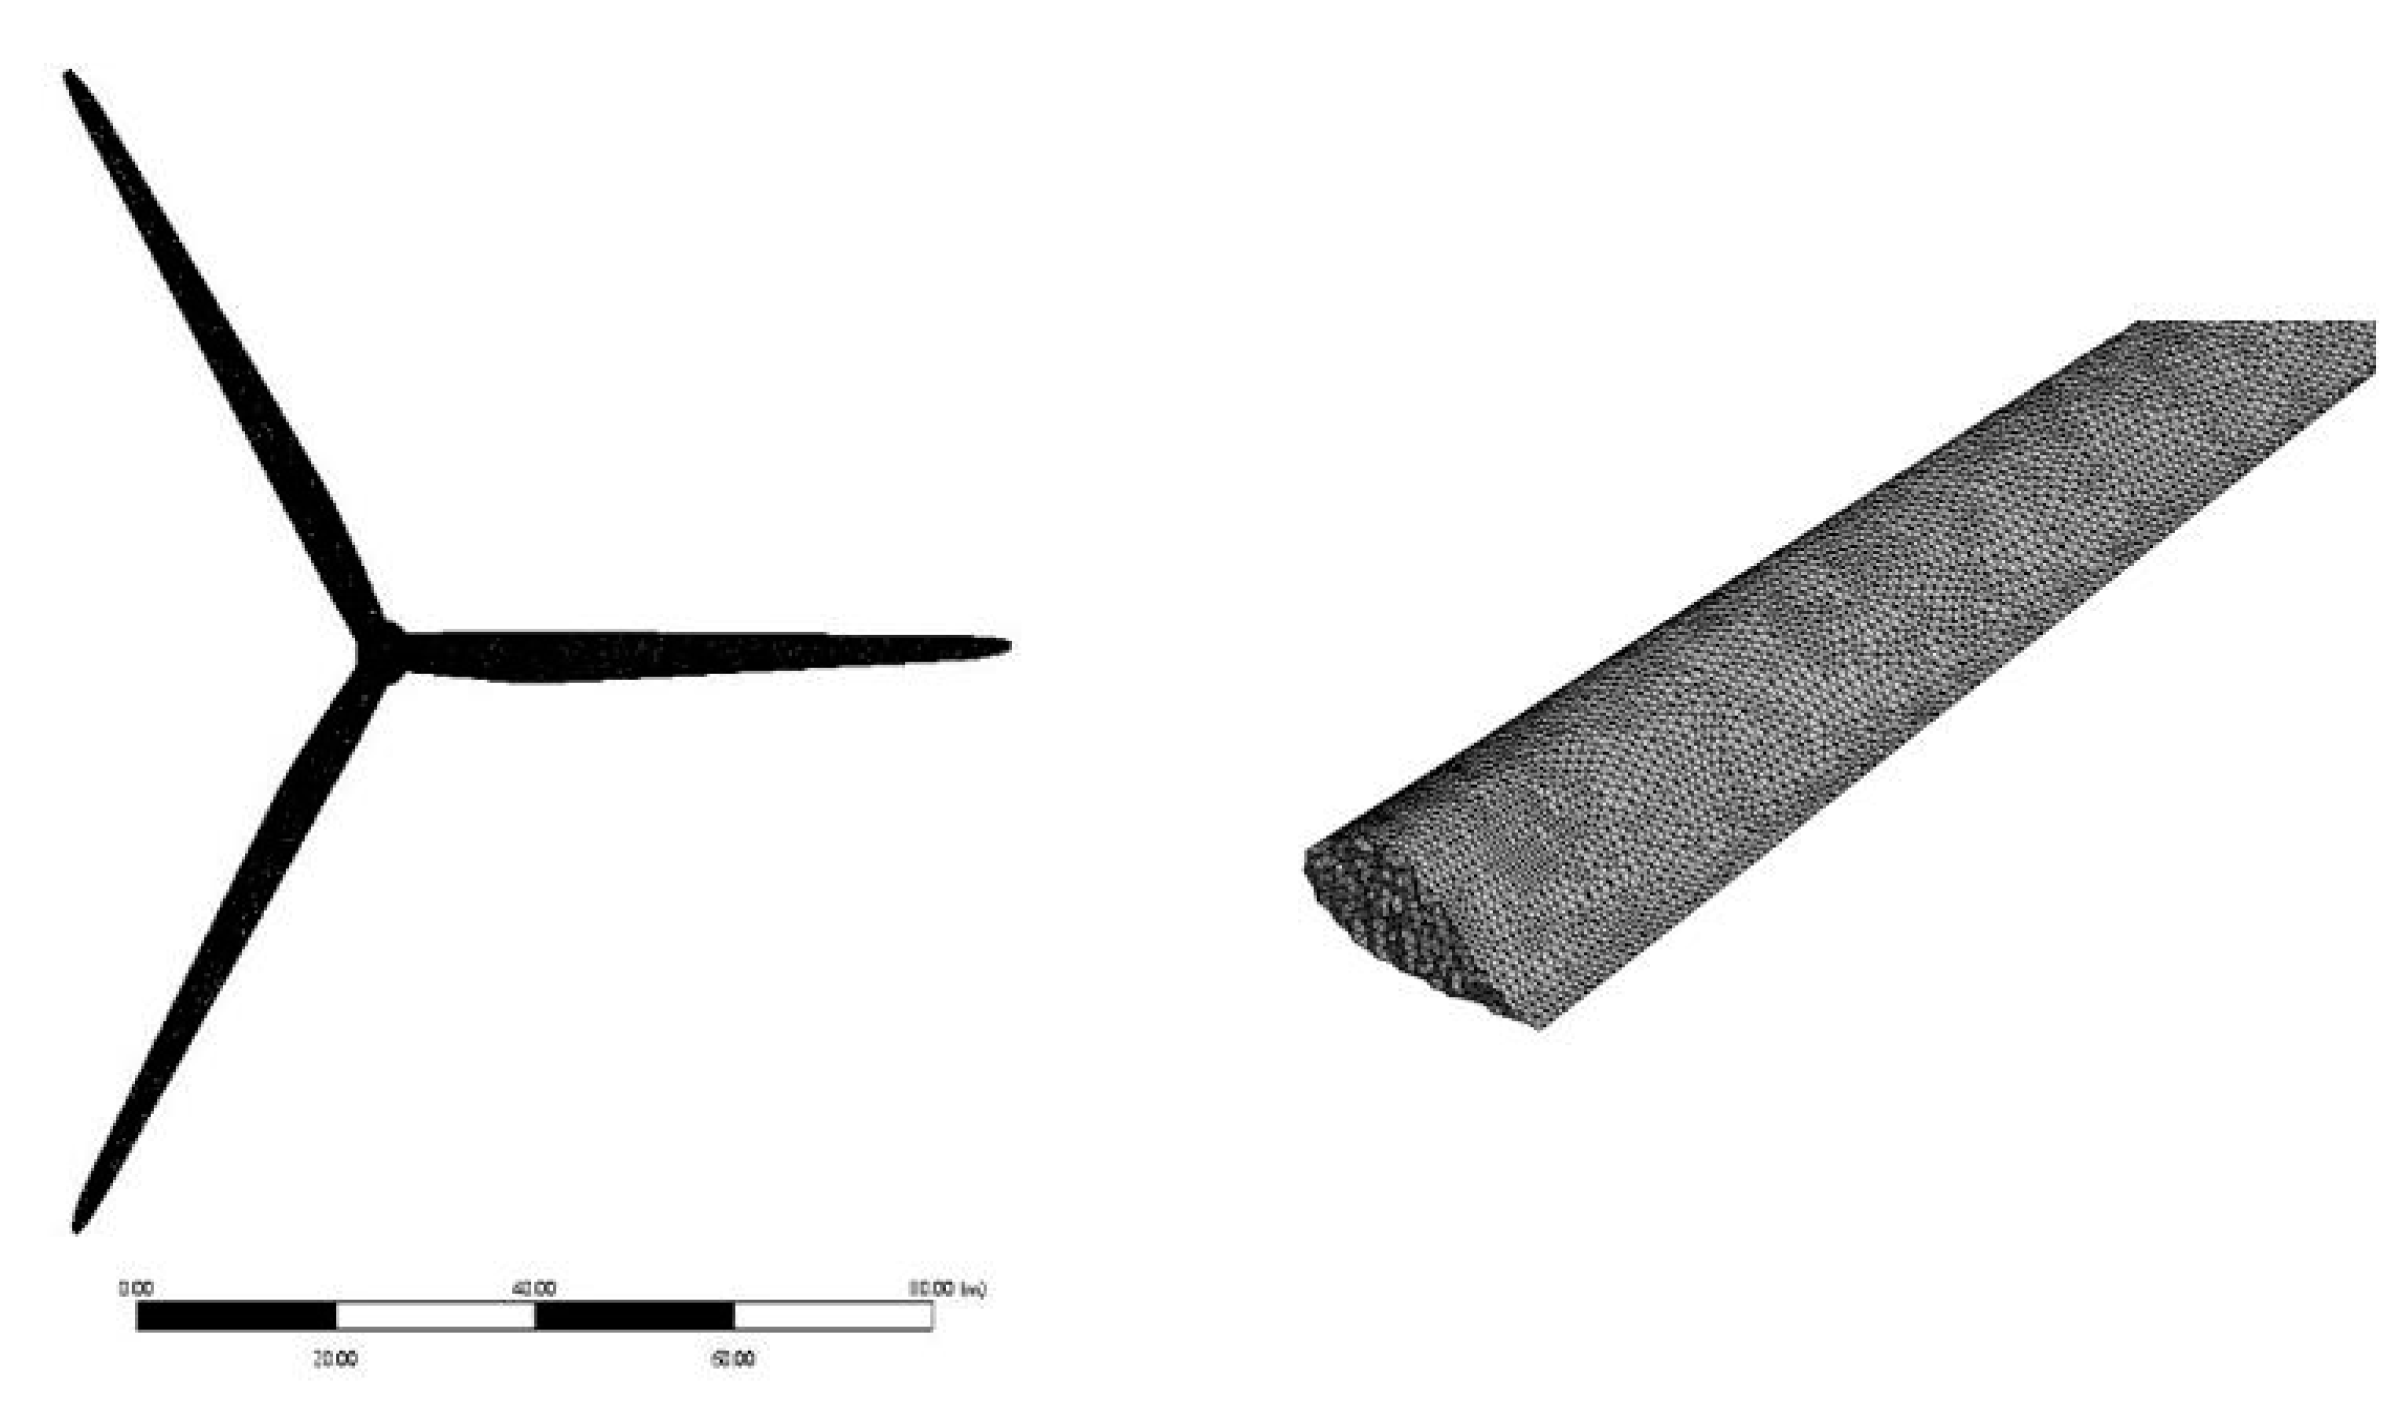
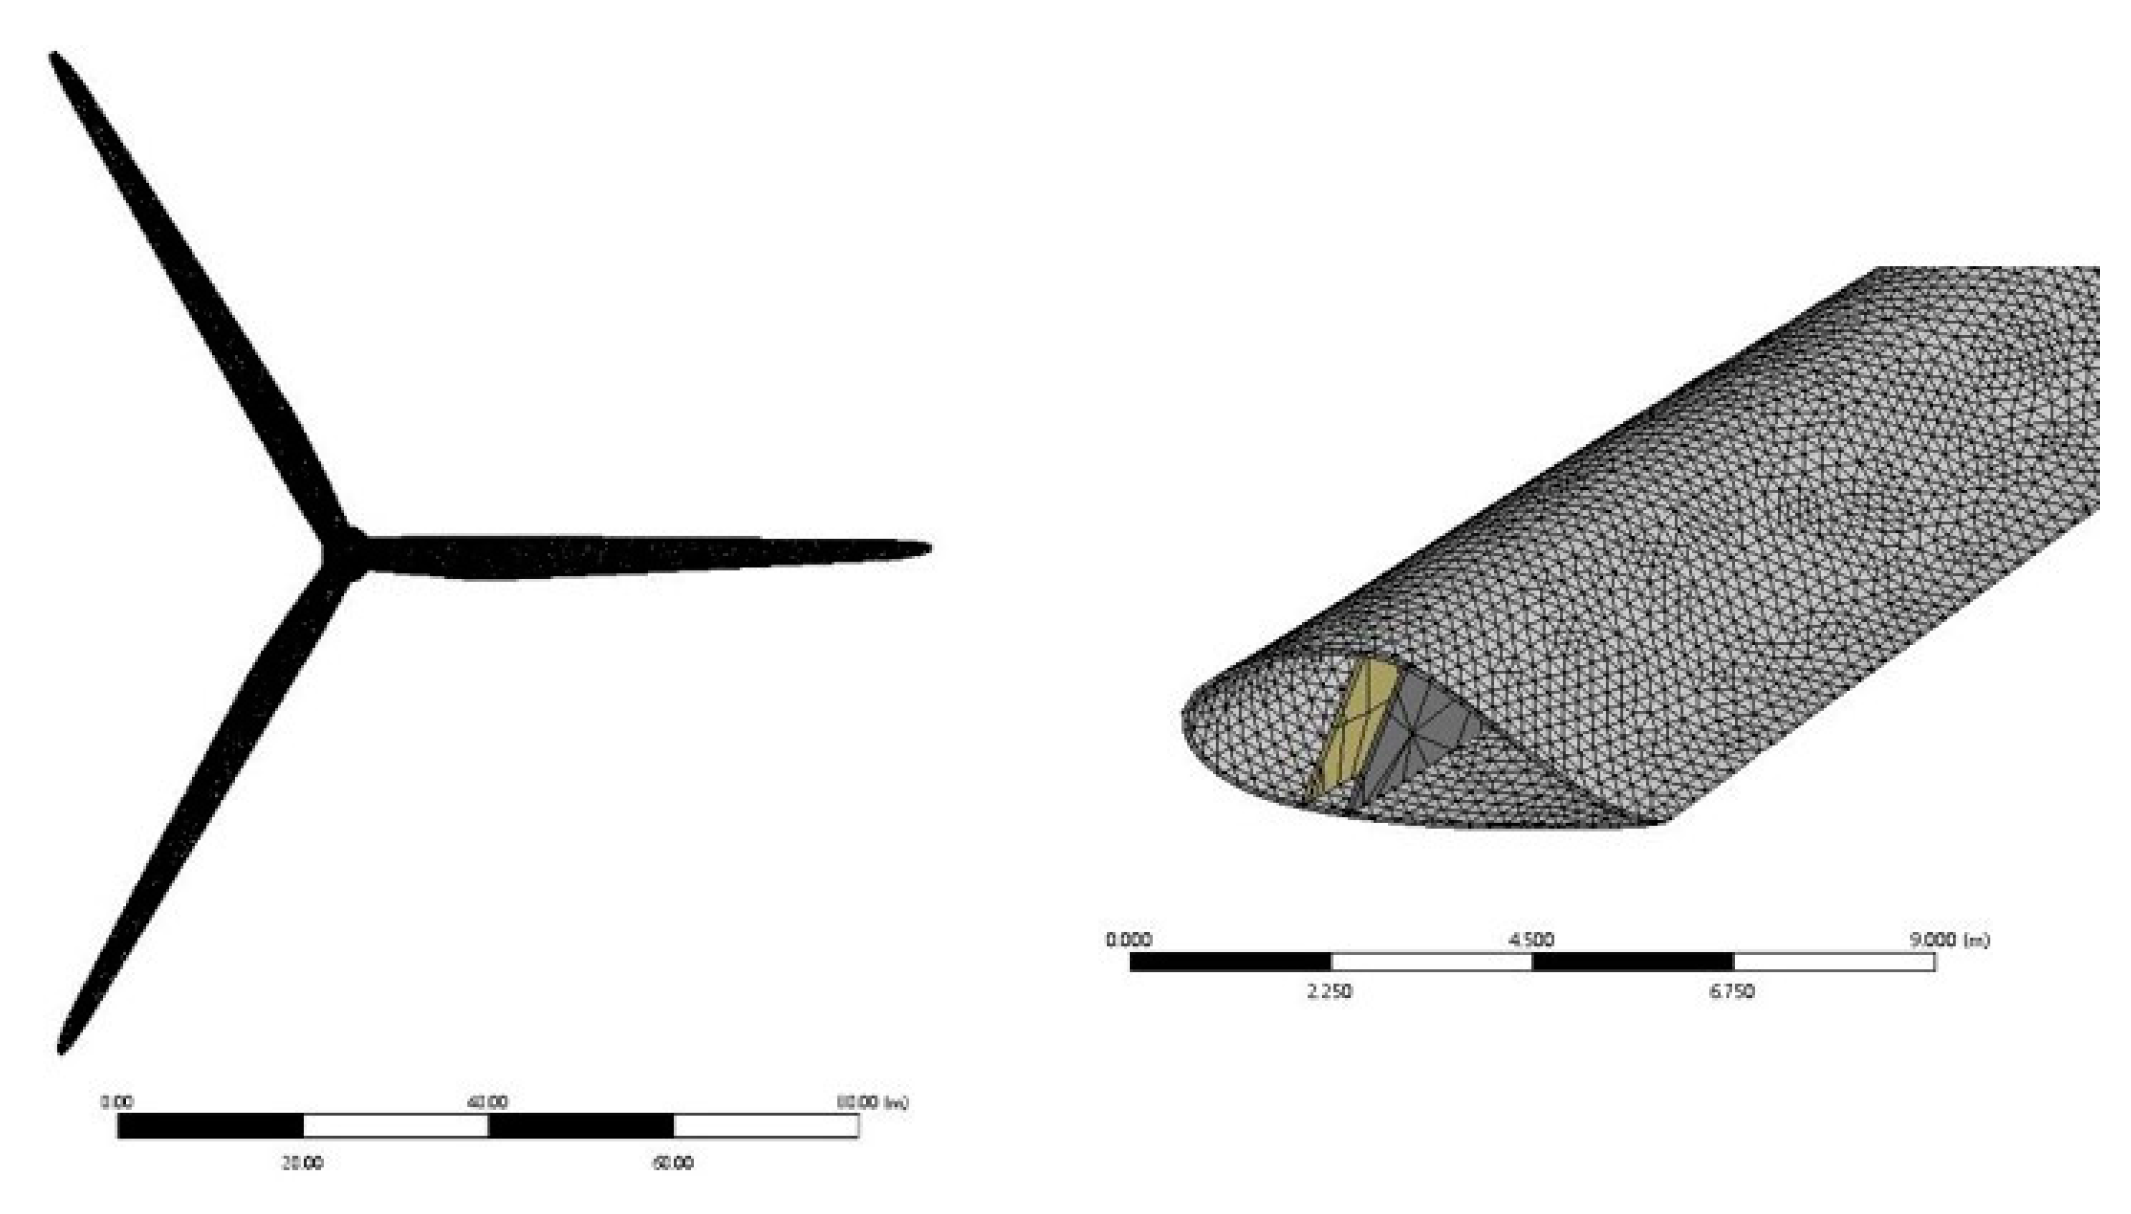
Considering the irregular shape of the wind turbine blade surface, the unstructured mesh can well adapt to the creation of an irregular surface mesh, and the mesh shape fits the solid surface; thus, the unstructured tetrahedral mesh is used to divide the shunt field grid. The basic size of the grid in the static domain is 4 m, the basic size of the grid in the rotating domain is 2 m, the maximum mesh size on the blade surface is 0.2 m, the minimum mesh size is 0.04 m, the thickness of the first boundary layer is 0.01 mm, there are 15 layers in total, and the total mesh size is 6.23 million. The grid division diagram is shown in
Figure 5.
In the CFD numerical simulation, grid convergence verification is a necessary step. Too many or too few grids cannot meet the requirements; thus, it is necessary to find a grid division scheme that meets the requirements of computational accuracy and saves computing resources at the same time. This paper also needs to consider the verification of grid convergence.
As shown in
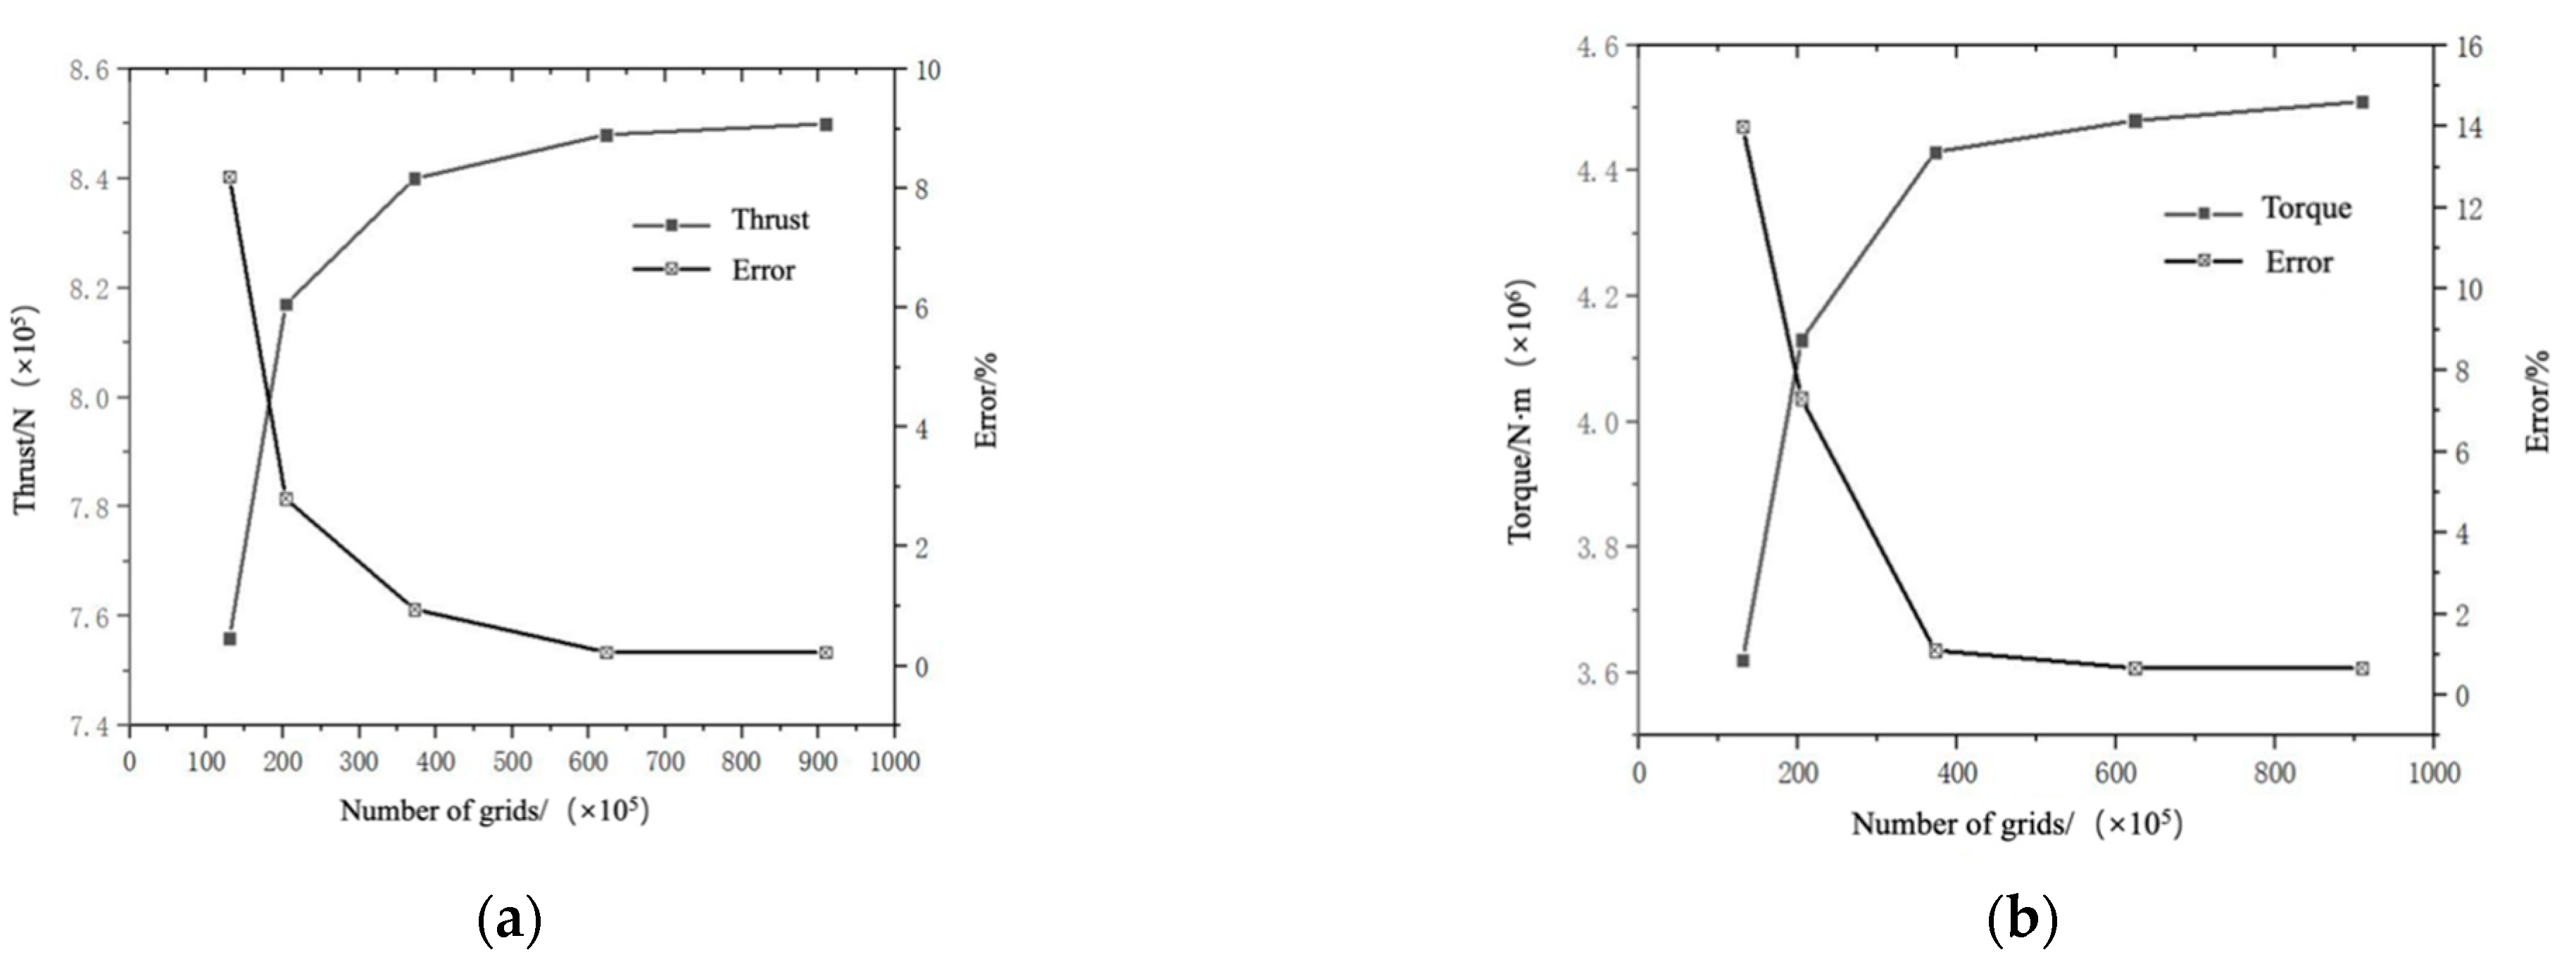
Table 1, the convergence of the model grid was verified, the fluid domain topology remained unchanged, and the mesh size of the wind turbine blade surface was gradually reduced to achieve mesh encryption. The number of grid cells reached 1.3 million, 2.04 million, 3.72 million, 6.23 million and 9.09 million, respectively. The thrust value and output torque value of the wind turbine in the calculation examples of different grid division schemes under rated working conditions (11.4 m/s) were recorded.
Figure 6 shows the results of grid convergence verification. It can be seen from the chart that the thrust and torque of the wind turbine gradually increase with the increase in the number of grid units. When the number of grid units reaches 3.72 million, further refinement of the grid to improve the number of units will not significantly affect the final result. It can be considered that the grid with the number of grid cells of 3.72 million meets the requirements and can be used for subsequent numerical simulation.
The simulation results of the rated working condition (11.4 m/s) were selected, and the thrust and torque values of the wind turbine obtained by the simulation were compared with the values reported by the NREL laboratory. The results are shown in
Table 2. It can be seen that under the rated working conditions, the difference between the CFD simulation value and the design value is small, and the errors are all within 6%, indicating that the NREL 5 MW wind turbine model used in the CFD simulation meets the calculation accuracy requirements.
Assuming that wind speed v is the air density radius of the wind turbine rotor, the air mass hitting the wind rotor in time is:
The energy obtained by the wind wheel is:
Let the wind turbine generating efficiency be the same, and the wind turbine generating power is:
In practical engineering, the empirical formula is often used to calculate the power of wind turbines: power = torque × angular velocity.
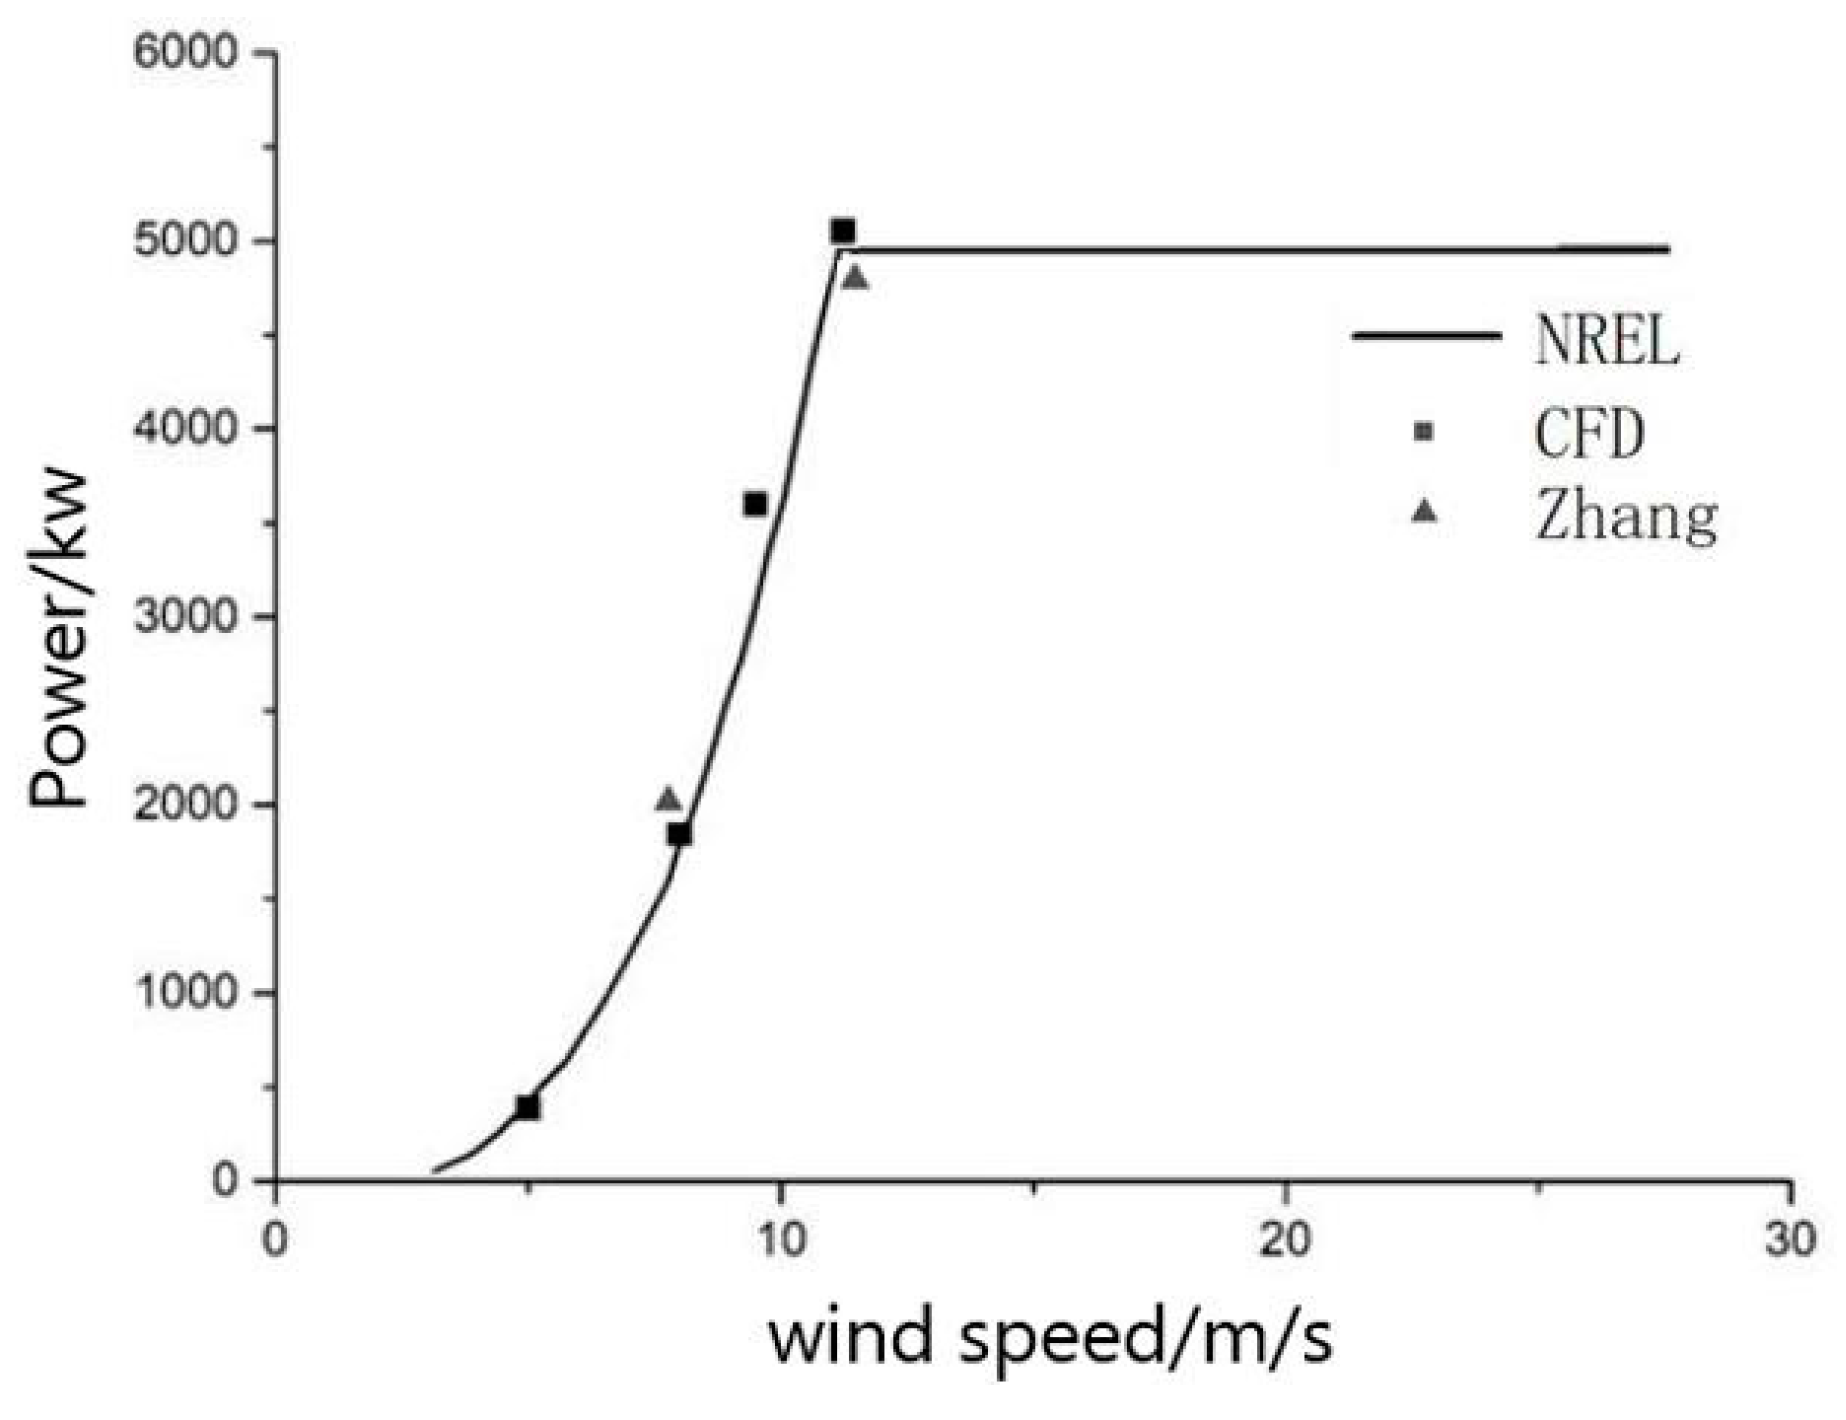
Figure 7 shows the comparison between the CFD simulation value in this paper, the NREL design value and the power value obtained by Yang (2020) [
33] using the numerical simulation method under different working conditions. It can be seen from
Figure 3 that a good degree of agreement is maintained. Once again, the correctness of the model used in the simulation is verified.
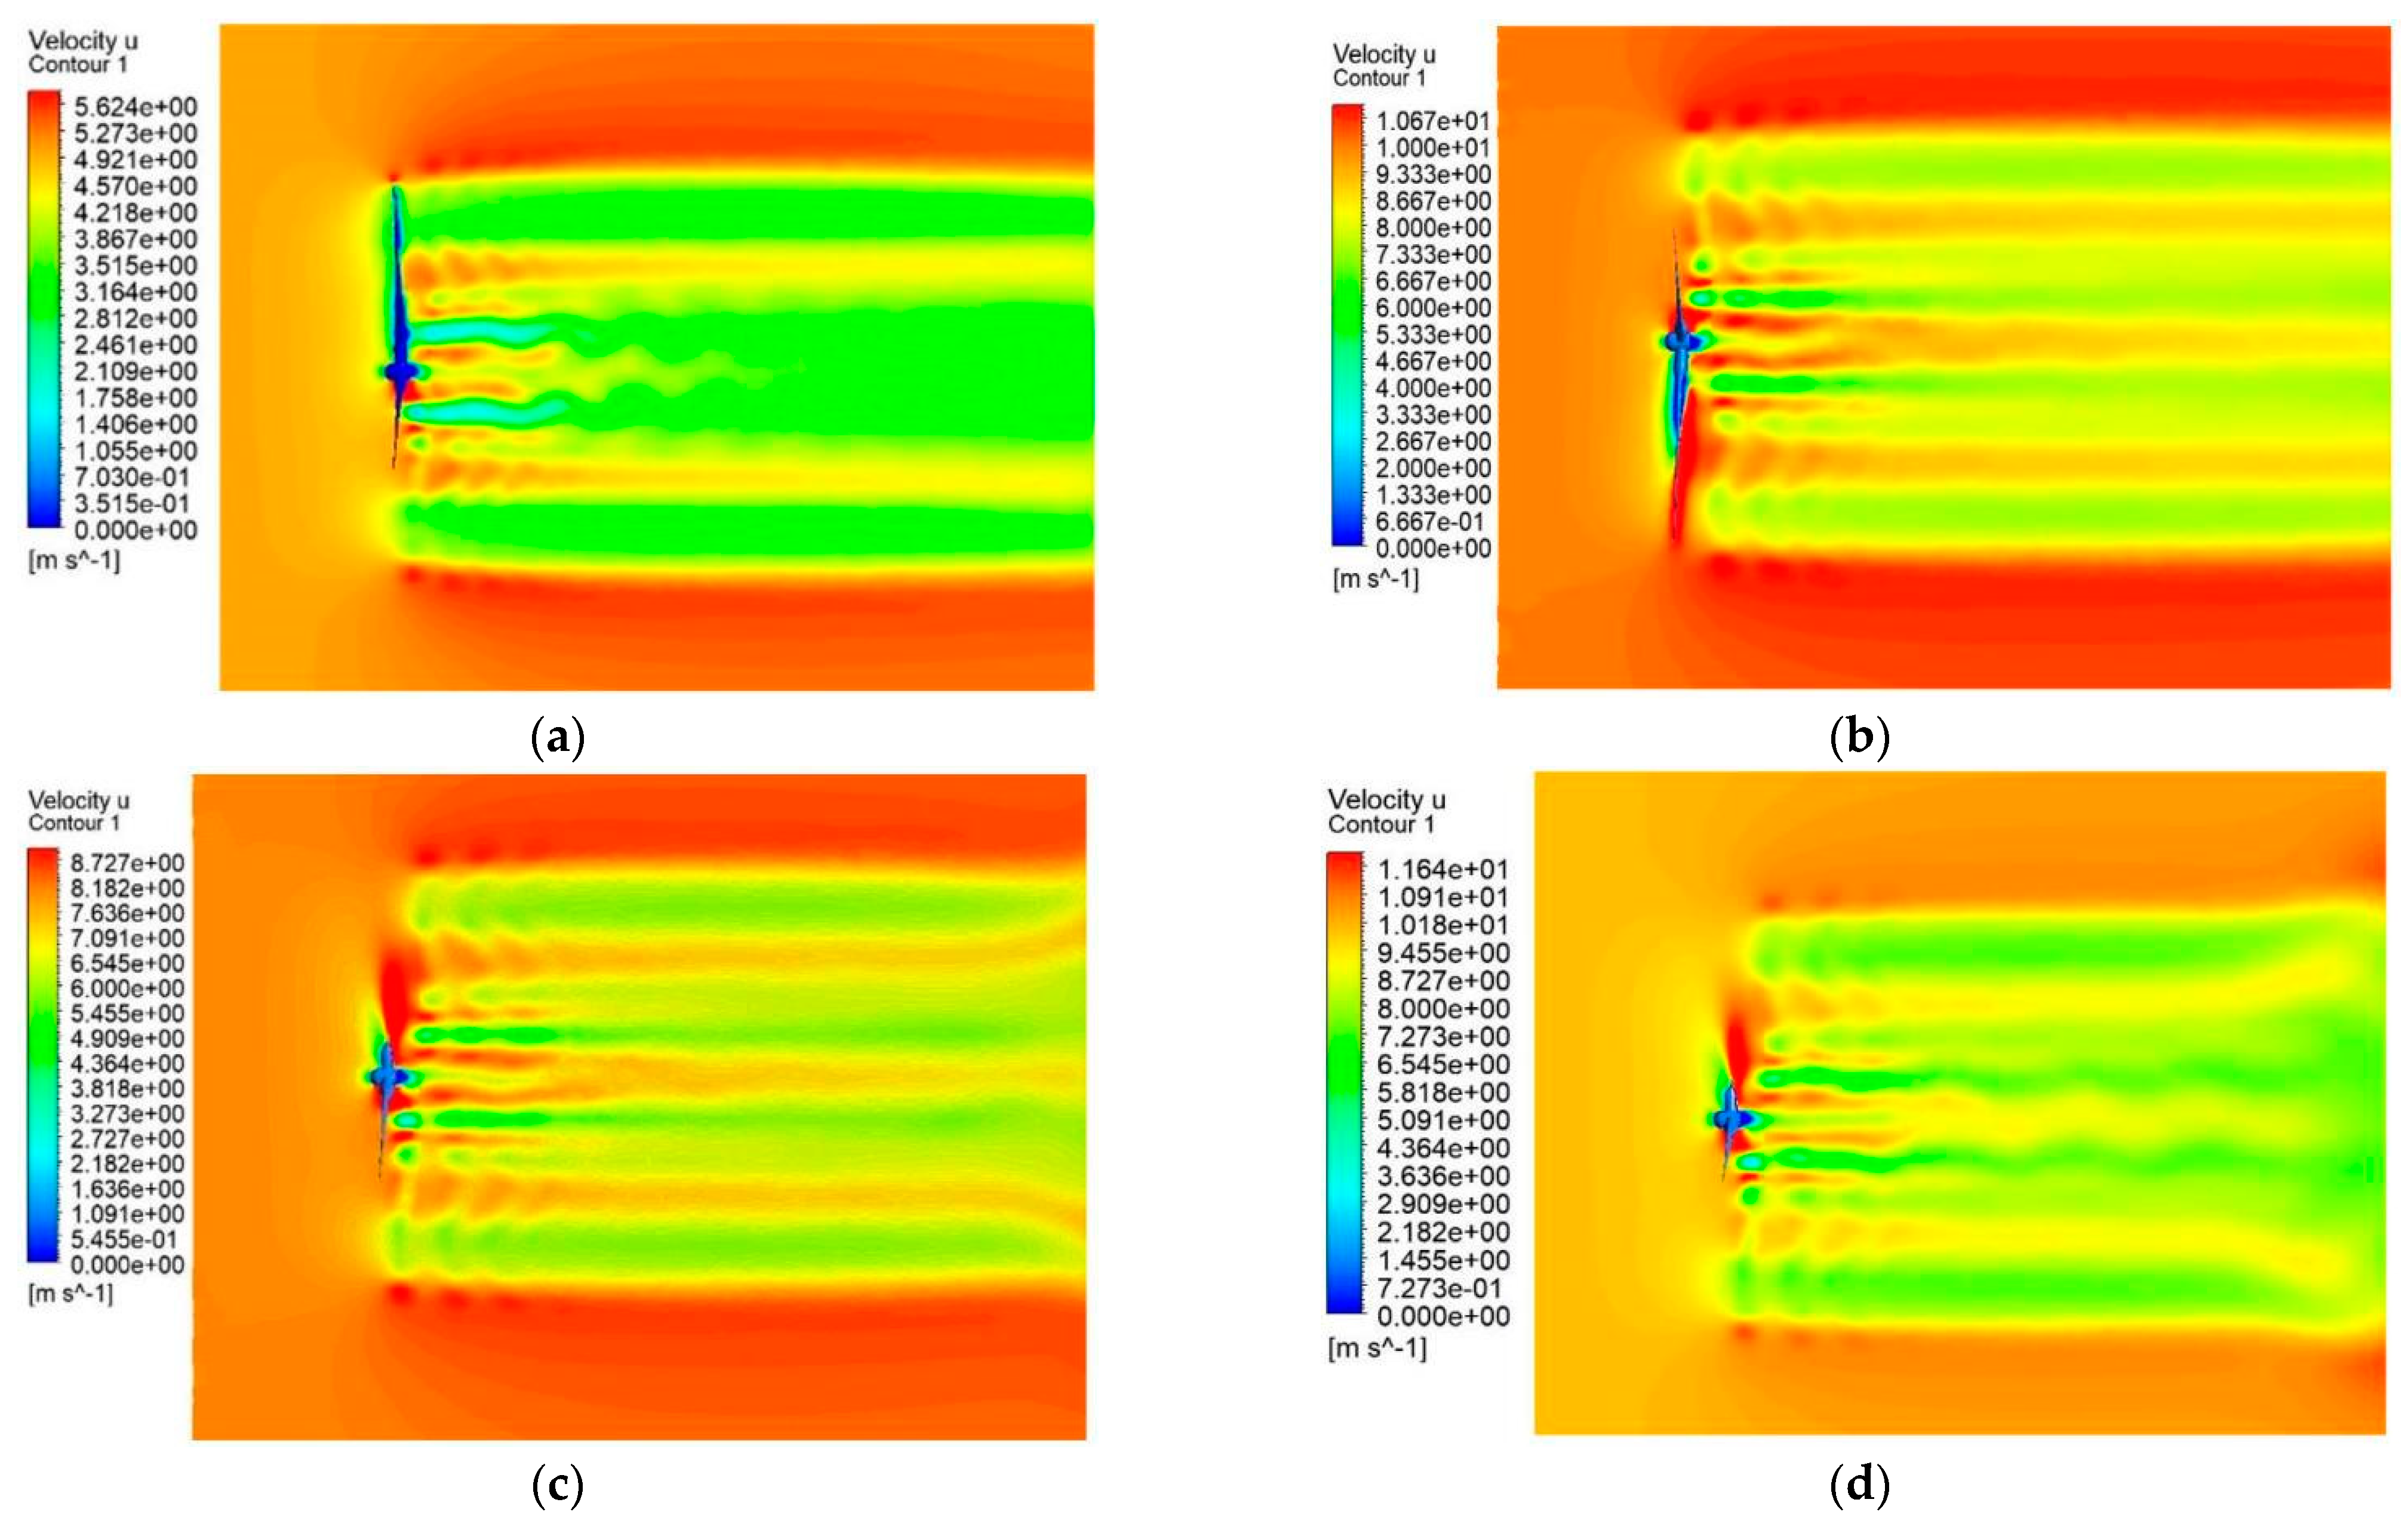
Figure 8 shows the flow field velocity distribution of the NREL 5 MW wind turbine under the four working conditions of 5, 8, 10 and 11.4 m/s. As can be seen from the figure, after the incoming flow contacts the rotating wind wheel, the velocity of the flow field decreases greatly. Due to the rotation of the wind wheel, the flow field will have a large velocity near the blade tip. After contact with the wind turbine, the incoming stream pulls out a long wake area behind the wind turbine. In this region, the flow field velocity presents an irregular distribution, and the flow field velocity decreases most obviously at the tip of the blade, while the decrease is limited at the hub and at the middle of the blade. The velocity of the flow field is reduced because the kinetic energy stored in the wind field is absorbed by the wind turbine and is finally converted into usable electrical energy.
The tip of the wind turbine blade has the largest aerodynamic moment arm and the highest energy absorption efficiency; thus, the wind speed drops most obviously here. With the increase in incoming flow speed, the aerodynamic load on the wind turbine gradually increases, and the wind energy conversion also gradually increases. At 5 m/s, the speed difference between the front and back of the wind turbine is the minimum, and at the rated working condition of 11.4 m/s, the speed difference between the front and back of the wind turbine reaches the maximum, and wind energy utilization is the most significant. At this time, the power of the wind turbine also reaches the rated power of 5 MW.
4. Aeroelastic Analysis of Wind Turbine Structure
4.1. Model Settings and Verification
In order to ensure that the aerodynamic performance of the wind turbine is not affected, the external shape of the wind turbine blade cannot be easily changed. To control the deformation of the wind turbine blade and to ensure safety, we can only focus on changing the internal structure of the wind turbine. In this paper, three wind turbine blades with different internal structures are established, namely beam model, shell model and shell model with a web.
- (1)
Beam model
The CFD simulation section is set up in much the same way as the previous sections and will not be repeated here. In the CSD simulation part, a new beam model wind turbine blade is used, and the equivalent stiffness of the blade is processed. The FRP material parameters of the equivalent treatment are shown in
Table 3.
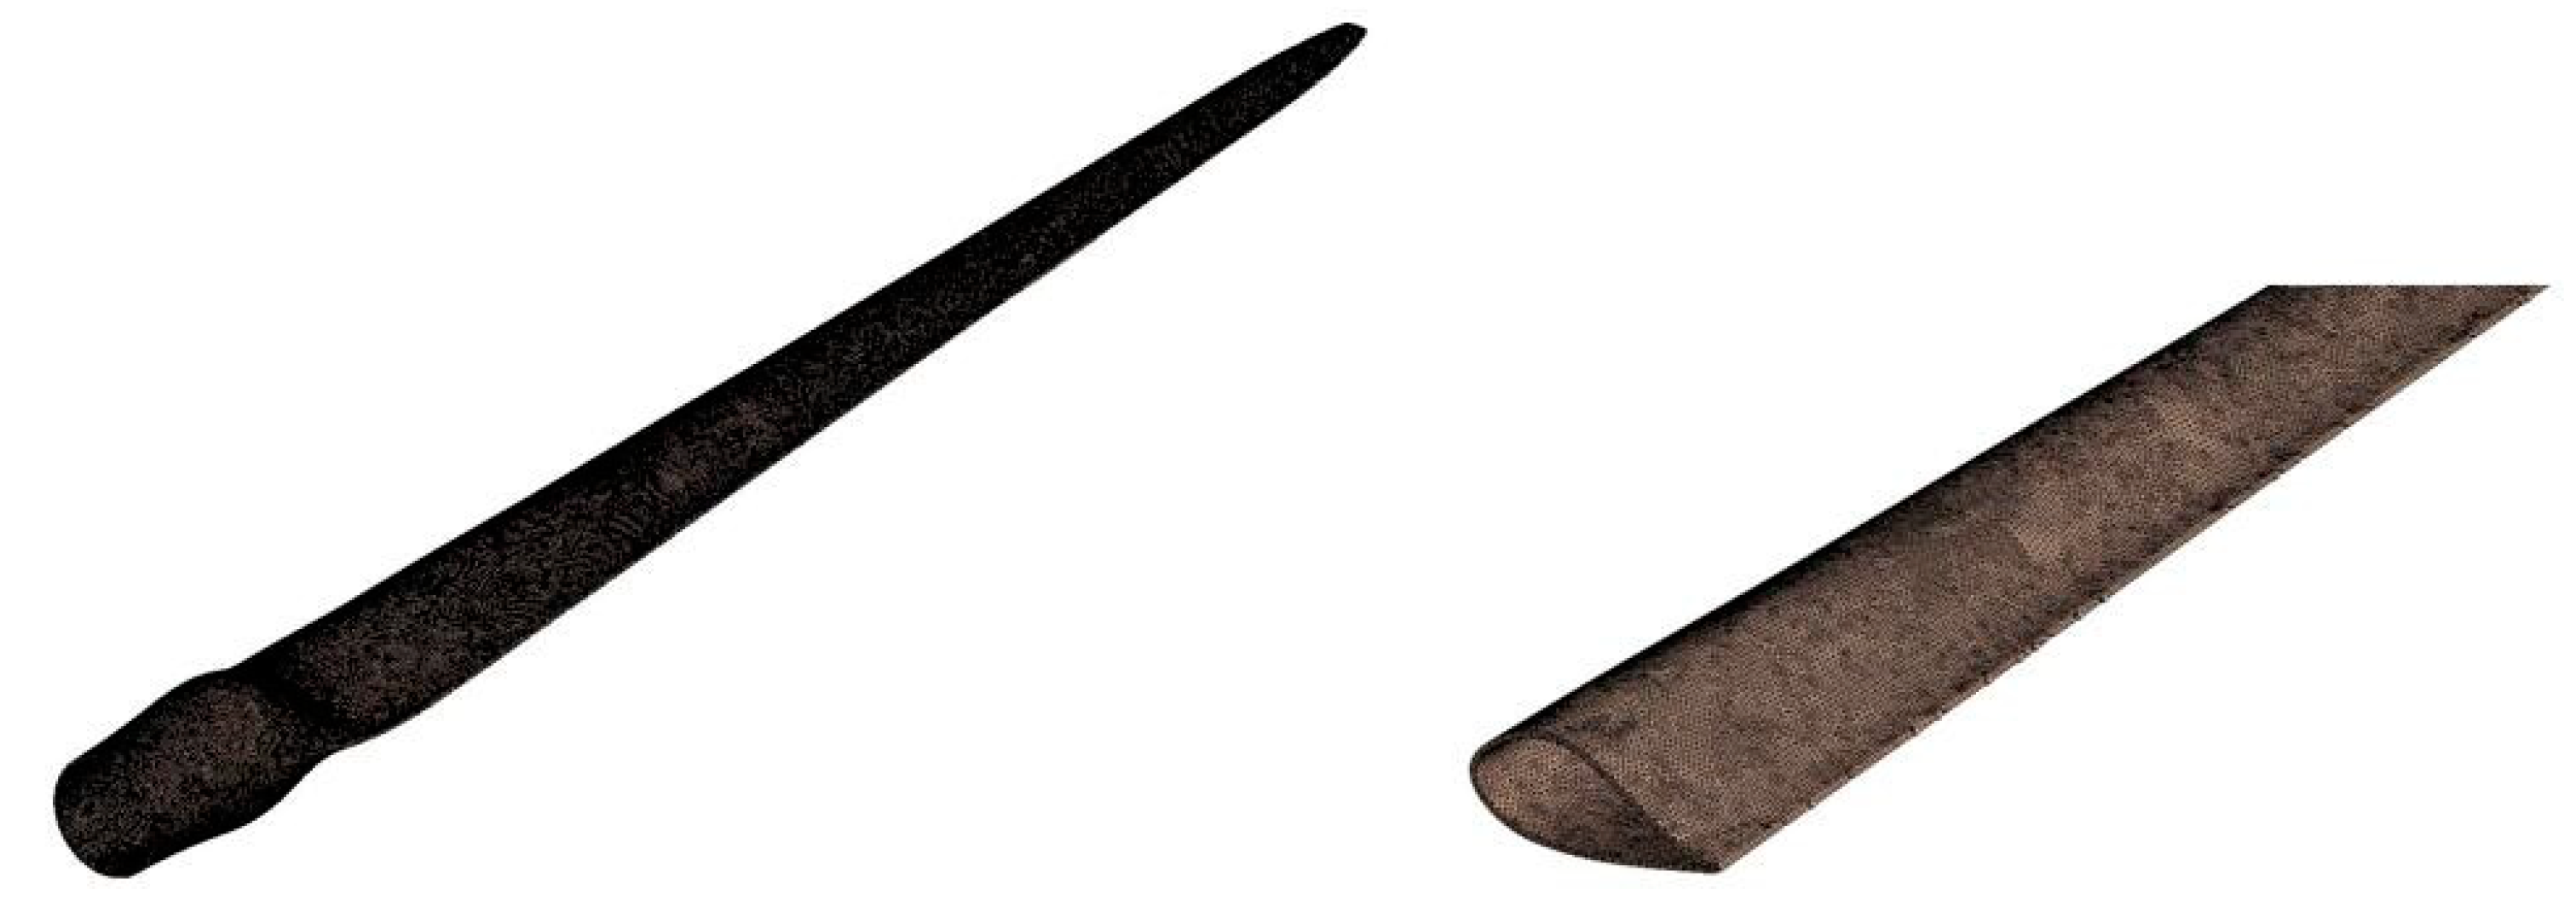
The wind turbine blades are divided into tetrahedral grids, and the grids are refined at the trailing edge and tips of the blades, as shown in
Figure 9. The element type is Solid45. The final mesh number is 872,410, and the number of nodes is 432,436. The blade hub is fixed and constrained, with the hub center as the origin, given a fixed rated operating condition corresponding to a rotational speed of 1.267 rad/s, and the wind turbine surface is set as the fluid–solid interface, that is, the fluid–solid coupling surface. The solver type is selected to solve directly, and the large deformation switch is turned on.
In order to verify the reliability of the model, a single blade of the beam model was subjected to modal analysis, and the first three-order natural frequencies and mode shapes of the single blade were obtained. The results were compared with the data reported by the NREL laboratory and the simulation data of other scholars.
Table 4 lists the natural frequency comparison results. It can be seen from the data in the table that the difference between the first two natural frequencies of the model used in this section and the data of the NREL laboratory is small, and the difference between the first two natural frequencies is 2.9% and 4%, respectively, which are all within the allowable range of engineering errors. It can be considered that the equivalently processed blade model meets the computational requirements and can be used for subsequent numerical simulations.
- (2)
Shell model
An independent coordinate system is established for each blade. The origin of the blade tip, the y-axis points to the direction of the blade root, and the thickness of the shell structure are defined as a custom function H = 0.02 + 0.06/62 × y. The layering of the shell model leaves is performed through the layering command in the Mechanical software. Using the symmetrical 45° layup method (±45/0/902/03), the layup material parameters are adjusted so that the final blade has equivalent stiffness.
The meshing uses triangular meshes, which are refined at the trailing edge and at tip of the blade. The element type is Shell63. The final mesh number is 323,119, and the number of nodes is 167,588. The meshing result is shown in
Figure 10.
In order to verify the reliability of the finite element model, modal analysis was carried out on the single-blade model of the wind turbine under the condition of no pre-stress, and the first three-order natural frequencies of the single blade were obtained. The results were compared with the reported data provided by NREL and the data of other scholars. It can be seen from the data in
Table 5 that the difference between the first two natural frequencies of the model used in this section and the data of the NREL laboratory is small, and the difference between the first two natural frequencies of the blade is 1.5% and 1.8%, respectively, which are all within the allowable range of engineering errors. From the data in
Table 6, it can be considered that the wind turbine blade model equivalently processed in this section meets the calculation requirements and can be used for subsequent numerical simulations.
- (3)
Shell model with a web
The NREL 5 MW wind turbine model with a web was built using Bladed, a professional blade modeling software. The internal web thickness is generally 1% of the airfoil chord length, which is appropriately simplified in this section to meet the calculation requirements. The thickness of the two webs is given the same fixed value of 0.04 m. In order to compare the difference between the wind turbine and the shell structure blade, the same FRP material as the shell structure of the previous section is used to treat the blade surface with equivalent rigidity, and the web is made of structural steel material. Material properties are shown in
Table 7.
A tetrahedral mesh is used to partition the wind turbine blades, and the mesh is refined at the trailing edge and at the tips of the blades, as shown in
Figure 11. Since the web of the blades does not participate in the fluid–structure coupling data interaction, the mesh size can be increased appropriately, and the final mesh number is 350633. The blade hub is fixed and constrained, with the center of the hub as the origin, the speed corresponding to the rated working condition is 1.267 rad/s, and the surface of the wind turbine is set as the fluid–structure coupling surface. The solver type is selected to solve directly, and the large deformation switch is turned on.
In order to verify the credibility of the established model, the modal analysis was carried out on a single blade of the shell model with a web, and the first three natural frequencies and mode shapes of the single blade were obtained. The results were compared with the data provided by the NREL laboratory report and simulated by other scholars. The table below lists the natural frequency comparison results. From the data in
Table 8, it can be seen that the natural frequency of the wind turbine model of the shell structure blade with a web is not much different from the simulation results from the NREL laboratory and Zhu. It can be considered that the blade model with equivalent processing meets the calculation requirements and can be used for subsequent numerical simulation.
4.2. Numerical Verification
Table 9 and
Table 10, respectively, show the comparison of the tip coupling deformation of the beam model’s and the shell model’s blade wind turbines used in this paper with other scholars. It was found that the error is small, which verifies the reliability of the simulation results in this paper.
4.3. Simulation Results
- (1)
Beam model
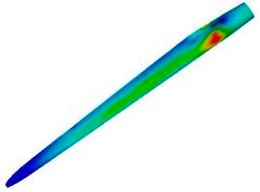
The equivalent stress distribution of the whole wind turbine under the rated working condition (11.4 m/s) is shown in
Figure 12.
In order to better study the equivalent stress distribution law of wind turbine blades, the equivalent stress distribution of a single blade was intercepted, as shown in the
Figure 13.
It can be seen that the equivalent stress distribution of the wind turbine blade of the beam model on both the windward and the leeward sides is roughly the same. The difference is that the equivalent stress on the windward side is significantly larger than that on the leeward side. From the overall point of view of the blade, the equivalent stress in the middle of the blade near the leading edge is significantly larger than that in other areas. In the middle of the blade, there are three areas with high equivalent stress. There is also a region of high equivalent stress near the blade root (1/6 of the length of the blade).
The different inflow velocities were set to 5, 8, and 11.4 m/s. It was found that the equivalent stress distribution of the wind turbine blades is roughly the same under different inflow velocities. As the equivalent stress gradually increases and the speed becomes faster, the more obvious the effect of wind load on the wind turbine blade and the greater the possibility of structural damage.
- (2)
Shell model
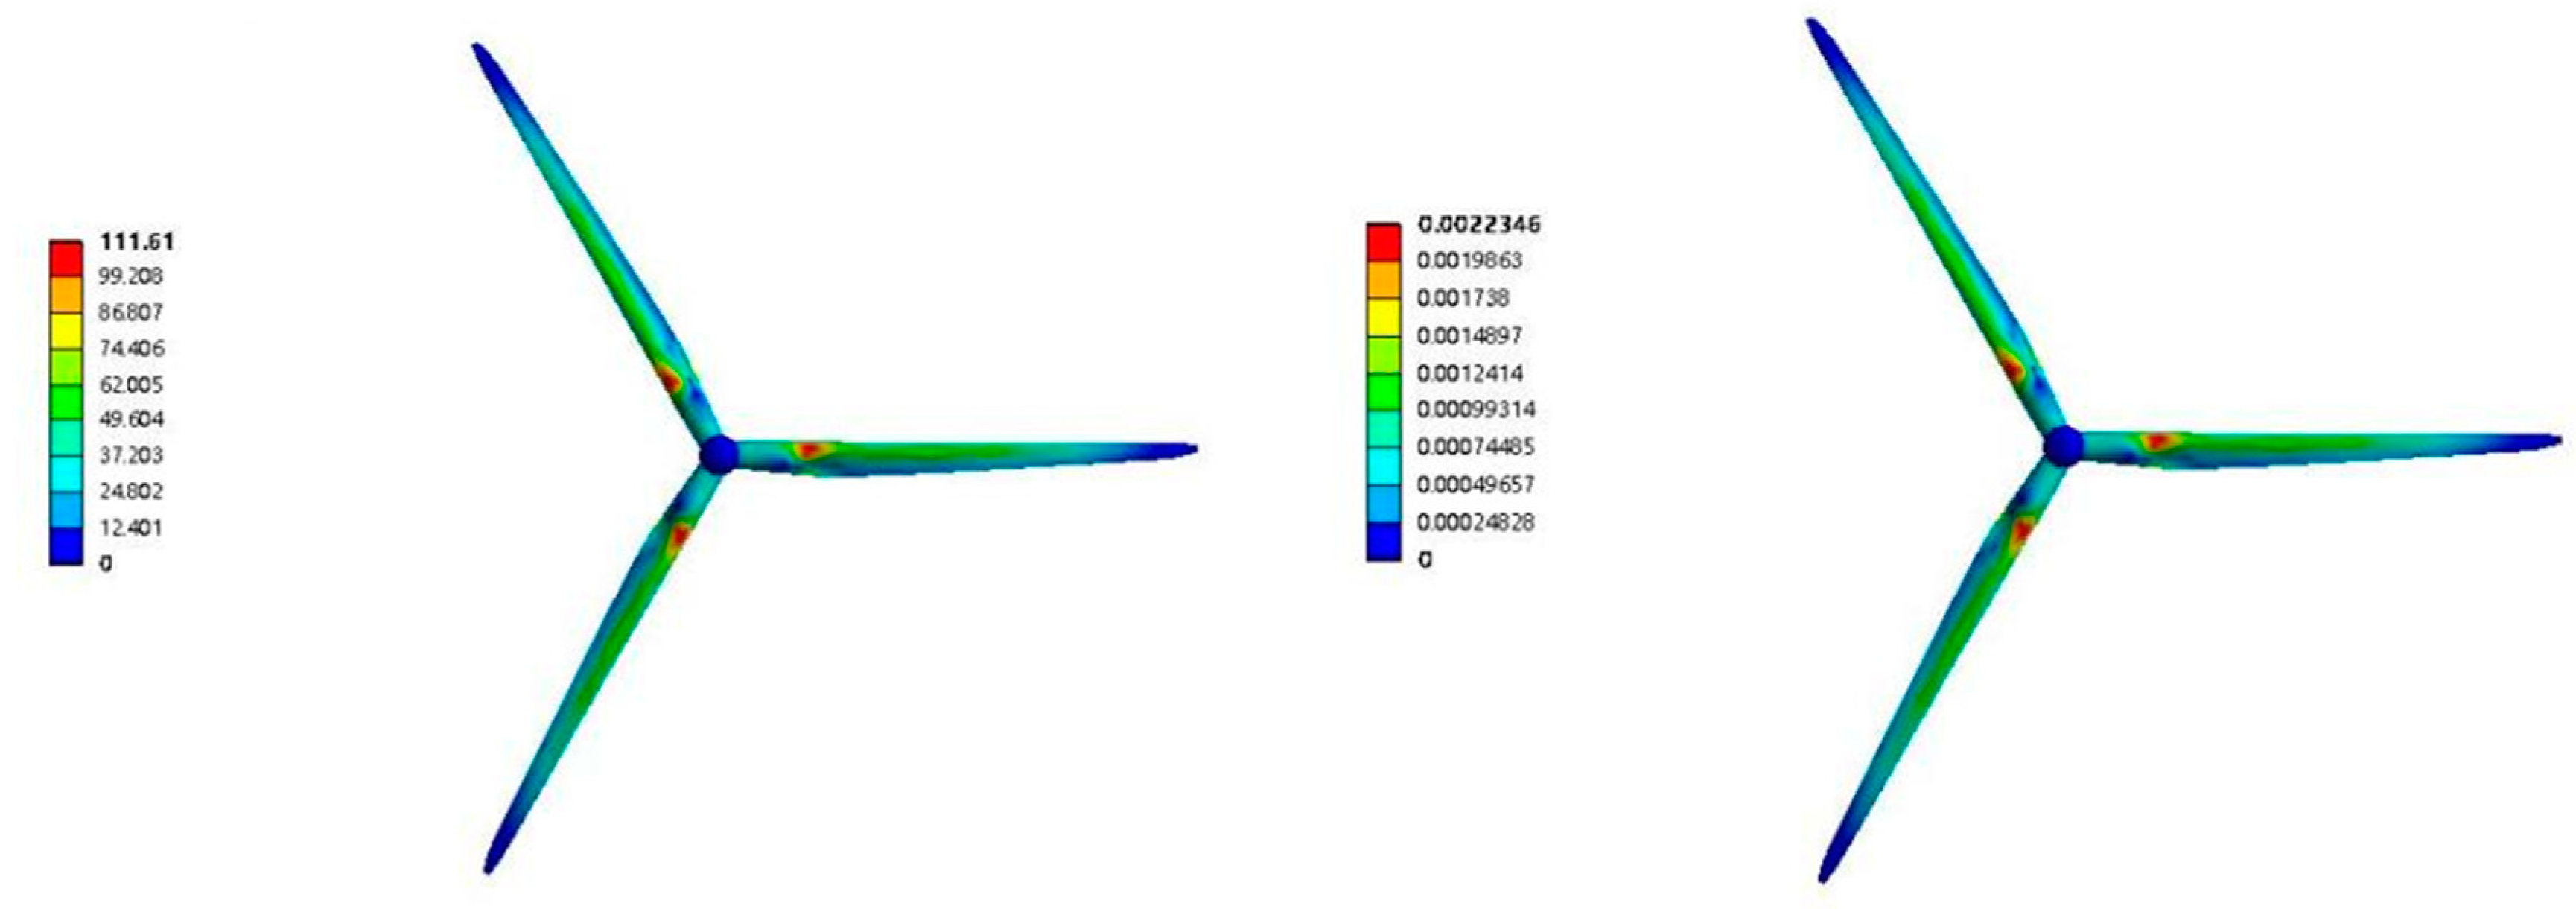
The equivalent stress and strain distribution of the entire wind turbine under the rated operating condition (11.4 m/s) is shown in the
Figure 14.
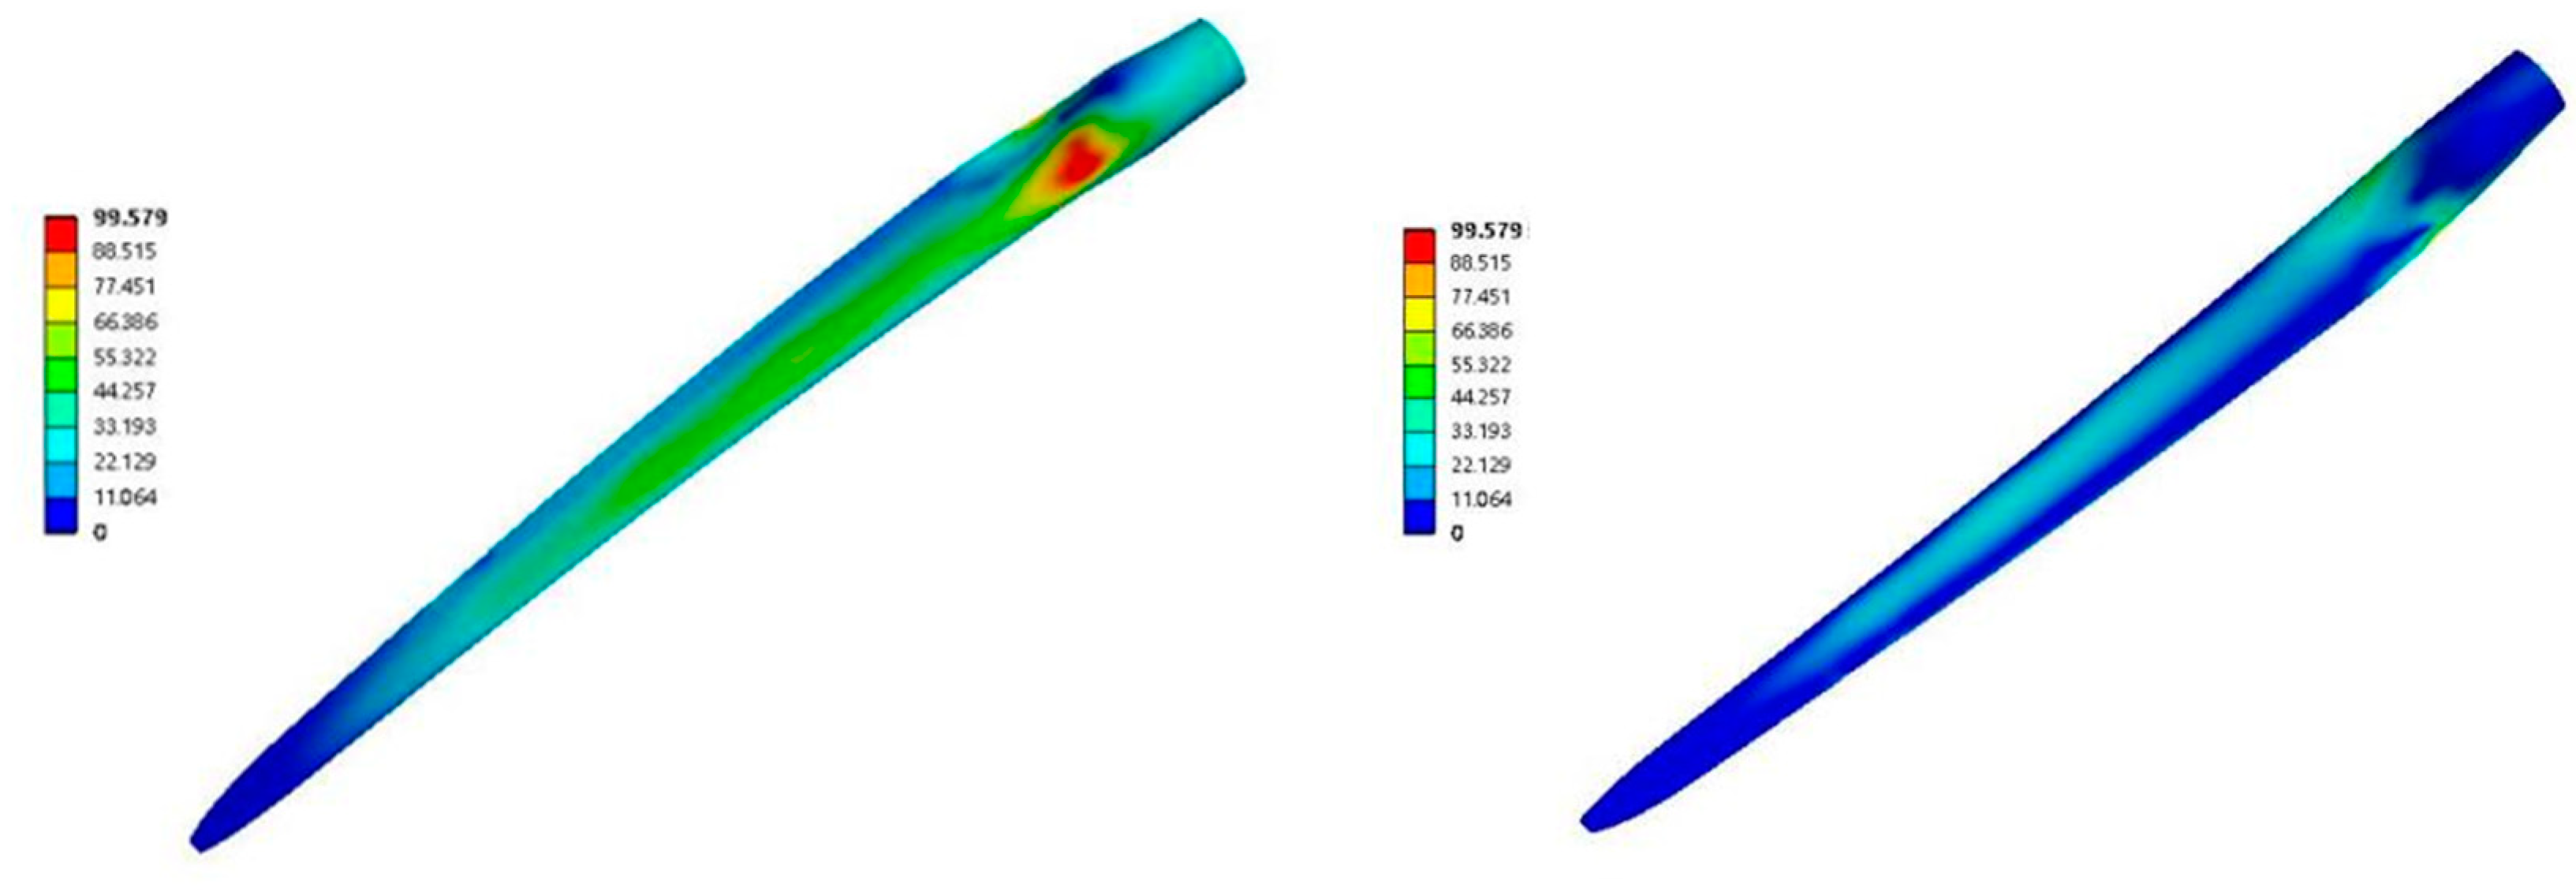
In order to better study the stress distribution law of wind turbine blades, the equivalent stress distribution of a single blade was intercepted, as shown in
Figure 15.
Under the rated operating condition (11.4 m/s), the distribution of the equivalent stress on the windward and leeward sides of the wind turbine blade is similar in the direction of elongation and chord, but the equivalent stress and strain distribution on the windward side is significantly larger than that on the leeward side. From a numerical point of view, the maximum equivalent stress on the windward side is 99.579 MPa, while the maximum equivalent stress on the leeward side is 47.356 MPa, and the maximum equivalent stress on the windward side is roughly twice the value on the leeward side.
From the overall point of view of the blade, the equivalent stress in the middle region of the blade and the region near the leading edge is significantly larger than other regions, and the maximum equivalent stress occurs at 1/6the the span of the windward surface near the leading edge of the airfoil, and here, the equivalent stress increases rapidly, forming an obvious region of large value. At the same time, there is a large stress area near the leading edge of the airfoil at 1/2th the span, but the equivalent stress in this area increases slowly. These areas can be considered to be dangerous and prone to damage.
- (3)
Shell model with web
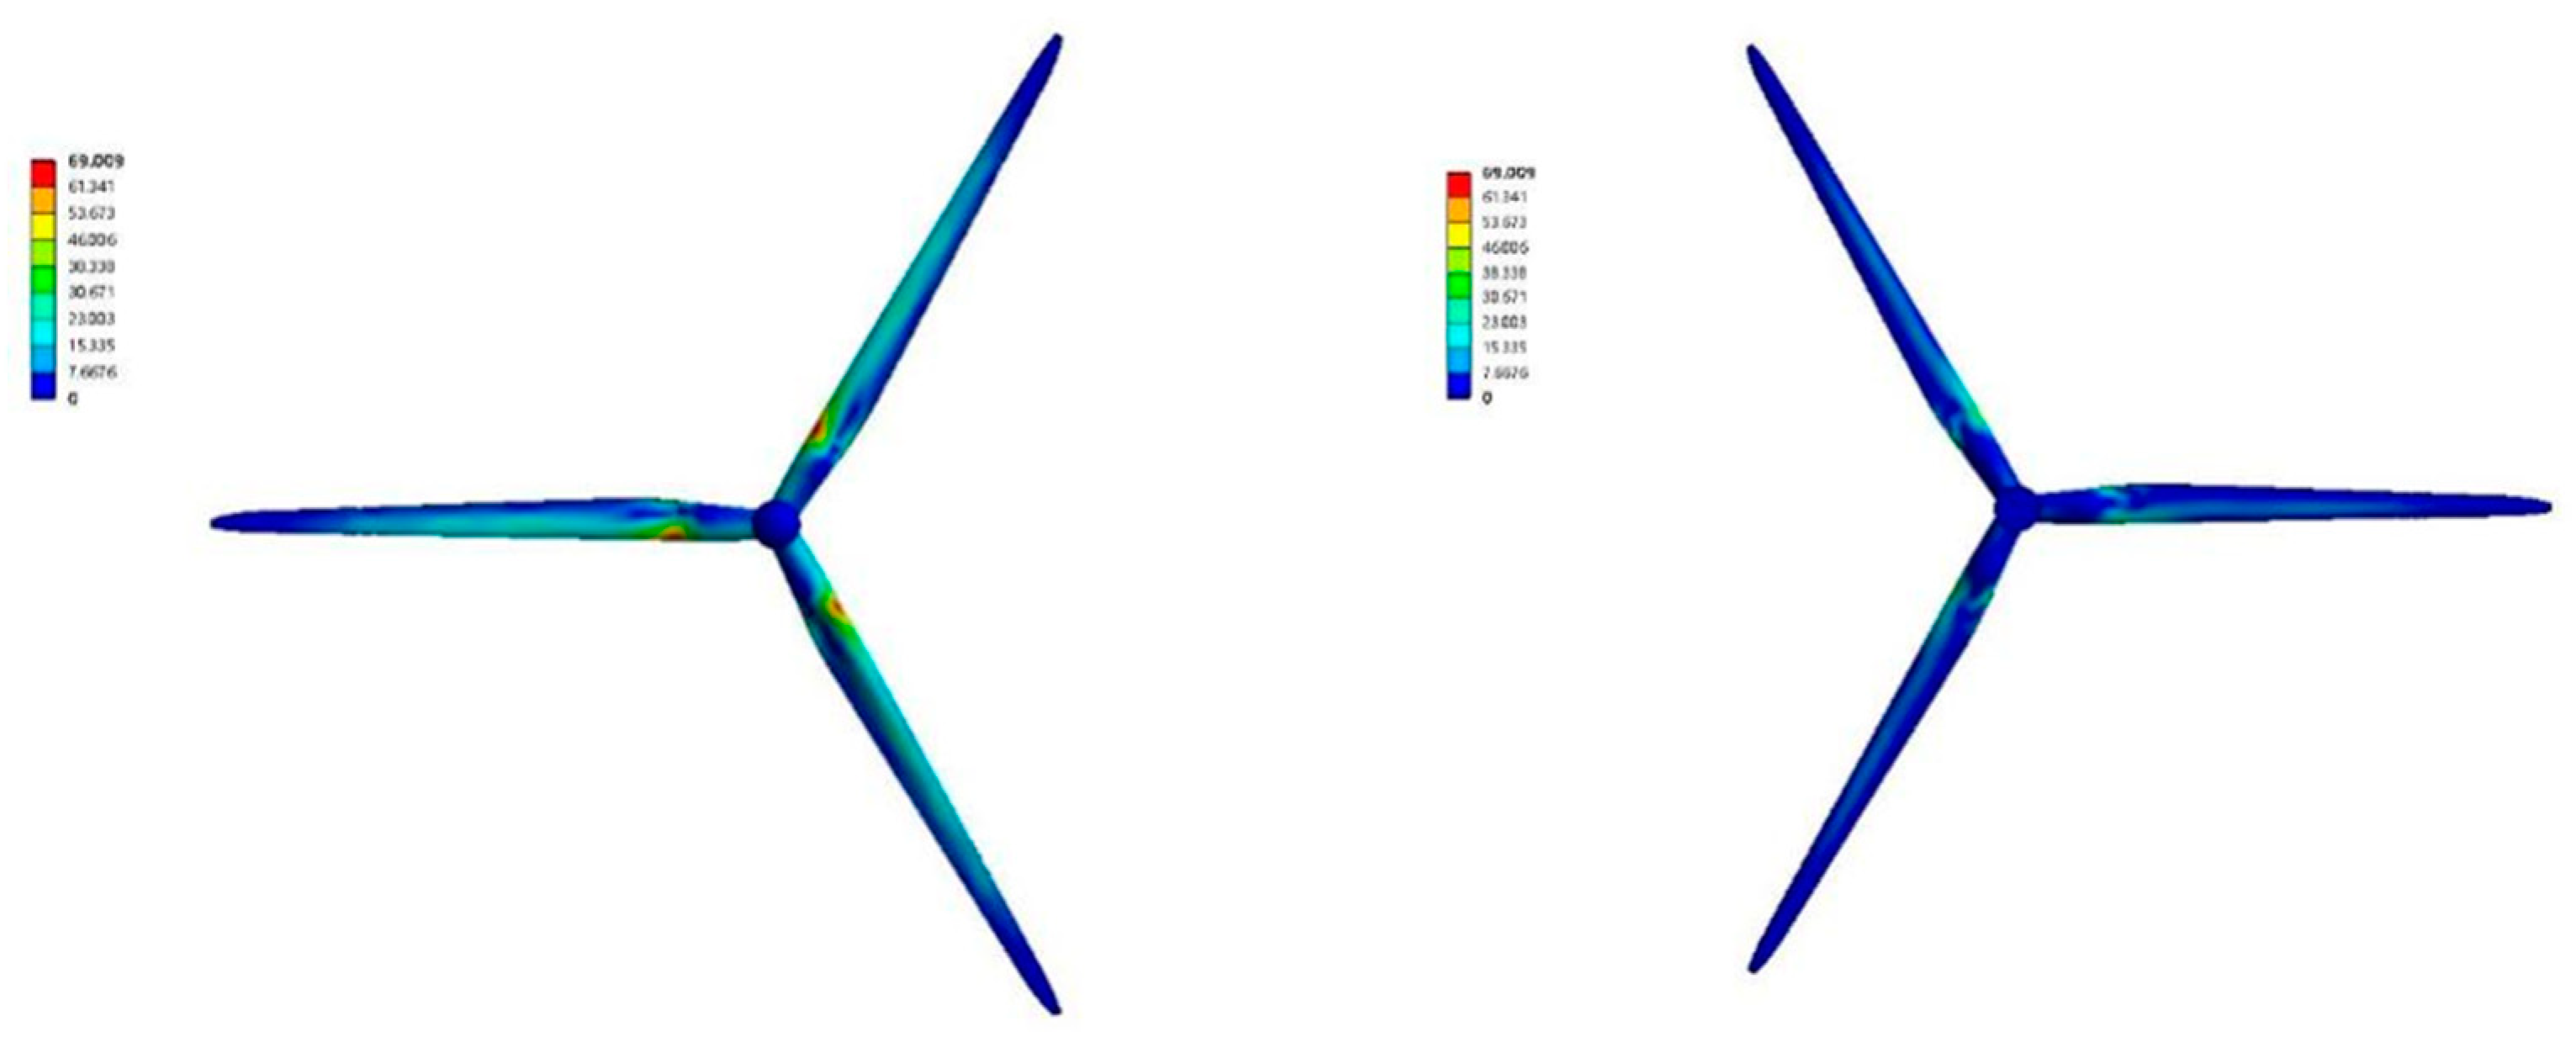
The equivalent stress and strain distribution of the entire wind turbine under the rated operating condition (11.4 m/s) is shown in
Figure 16.
In order to better study the equivalent stress distribution law of wind turbine blades, the equivalent stress distribution of a single blade was intercepted, as shown in the
Figure 17.
It can be seen from the equivalent stress distribution diagram that the wind turbine blade of the shell model with a web is the same as the previous two models, and the equivalent stress distribution on both sides of the windward and leeward sides is roughly the same; the difference is in the numerical value. The equivalent stress on the windward side is significantly larger than that on the leeward side. From the perspective of the blade as a whole, compared with the shell structure blade model without a web, the larger equivalent stress distribution is roughly the same. There is a large area of equivalent stress and strain near the leading edge of the blade root (1/6th the length of the blade). Compared with the case without the web, the area of the maximum equivalent stress area of the blade of the shell model with the web is obviously much smaller, and it can be seen from the numerical value that the maximum equivalent stress is 69 MPa, which is significantly reduced compared to the 100 MPa for the shell structure. This shows that the existence of the web on the wind turbine blade can effectively reduce the size of the dangerous area on the blade surface, and the equivalent stress is significantly reduced in value. Compared with the hollow-shell blade, it is more stable and safer.
Different working conditions were set (5, 8, 11.4 m/s). It was found that the equivalent stress distribution of the wind turbine blade is basically the same under different inflow speeds. With the increase in inflow speed, the equivalent stress on the blade surface gradually increases, the speed becomes faster, and the effect of wind load on the wind turbine blade is more obvious. The structure is more prone to localized damage.
In order to compare the differences in the equivalent stress distributions of the three different blade models, the equivalent stress distributions of the three wind turbine blades under the rated operating conditions (11.4 m/s) are placed in a chart for comparison and are summarized, as shown in
Table 11. Th shell-structure blades with webs were found to be optimal.
Table 12 shows the comparison of the coupling deformation of the wind turbine blades. It can be seen that the coupling deformation of the wind turbine blades with webs is significantly smaller than that without webs, and the existence of a web significantly improves the ability of a blade to resist flapping deformation. Flapping deformation is the main deformation mode, which shows that the web structure of the wind turbine blades is very important and necessary to improve the deformation resistance of the blades and to ensure safety.
Figure 18 shows the equivalent stress distribution of the inner web of the blade under rated operating conditions (11.4 m/s). It can be seen that the maximum equivalent stress of the web is 208 MPa, which is much larger than the maximum equivalent effect of the blade surface skin. From the overall point of view of the web, the largest equivalent stress occurs in the central area of the web near the suction surface, and the middle of the web will most likely be damaged.
Combined with the previous conclusions, if the web structure is damaged, the web does not provide support, and the blade surface skin structure will be subjected to a sudden huge stress load, which is a very serious accident for the safe operation of the wind turbine. Therefore, safety of the web structure must be ensured, as safety is very important to the safe operation of the whole machine.
5. Conclusions
In this paper, the aerodynamic load of the NREL 5 MW wind turbine was calculated first, and the accuracy of the model was verified by comparison. Then, the two-way fluid–structure interaction simulation of wind turbine blades with different structures (beam model, shell model, and shell model with a web) was carried out to compare and to study the internal influence of the structure on the aeroelastic stability of wind turbine blades. The specific conclusions are as follows.
The equivalent stress and strain distributions of the wind turbine blades on the windward and leeward sides of the beam model were roughly the same. From the perspective of the blade as a whole, the equivalent stress and strain distribution in the middle of the blade near the leading edge was significantly greater than other areas, and there was also a larger equivalent stress and strain area near the blade root. According to the equivalent stress and strain distributions of the shell model wind turbine blades, the equivalent stress and strain distributions of the wind turbine blades on the windward and leeward sides were similar, but the windward side was obviously larger than the leeward side. The equivalent stress and strain distribution in the middle area of the blade and the area near the leading edge was significantly larger than other areas. The maximum equivalent stress and strain distribution appeared at 1/6th the length of the windward side near the leading edge of the airfoil, and it increased rapidly here, forming an obvious dangerous area. It is necessary to pay attention to the state here, regardless of the design or actual operation of wind turbines.
The maximum equivalent stress and strain distributions of the shell model blades with webs were roughly the same as those of the shell model blades, but the values were smaller, and the area with greater stress was smaller. This shows that the existence of a web improves the safety of the skin structure. The coupling deformation of the wind turbine blade with a web was obviously less than that without a web. The equivalent stress and strain of the web were greater than that of the skin, and the largest area was at the connection between the central part of the web and the skin. If the web was damaged, the skin structure would be subjected to a sudden huge load, and the web is very important for the safety of the whole machine.
Among the three models adopted in this paper, the shell model structure with a web was closest to the real blade structure in terms of structural form and mechanical characteristics. This structure uses shell elements, has the lowest mesh number and the lwest calculation time, and has the most accurate stress–strain form on the blade surface. Therefore, this model is the most reasonable choice for the study of fluid–structure coupling of wind turbine blades on a real scale.
