Article

Marine Plastic Drift from the Mekong River to Southeast Asia

1
Norwegian Meteorological Institute, 5007 Bergen, Norway
2
Geophysical Institute, University of Bergen, 5007 Bergen, Norway
3
National Center for Hydro-Meteorological Forecasting, 8 Phao Dai Lang, Hanoi 117225, Vietnam
*
Author to whom correspondence should be addressed.
J. Mar. Sci. Eng. 2023, 11(5), 925; https://doi.org/10.3390/jmse11050925
Submission received: 31 March 2023 / Revised: 23 April 2023 / Accepted: 23 April 2023 / Published: 26 April 2023
(This article belongs to the Section Marine Environmental Science)

Abstract

:
Southeast Asia is the world’s most polluted area in terms of marine plastics. The Mekong River is one of the largest rivers in the area, and ranked as somewhere between the 8th- and 11th-biggest contributor to plastics in the world’s oceans. Here, we investigate how microplastics drift from the Mekong river to Southeast Asia, and which coastlines are most exposed. We identify potential factors (wind drift, rivers, vertical mixing and sinking rates) that affect plastic drift in the region using the OpenDrift model with realistic wind and ocean currents for simulations between three months (summer and winter) and 15 months. We find that the seasonal drift is influenced by the monsoon systems and that most of the plastics strand in the Philippines and Indonesia. In addition, the role of wind drift is significant in strong winds. Vertical mixing and sinking rates are unknowns that affect the relative importance of wind drift (near the surface) and ocean currents. Simulations with different terminal velocities show that, unsurprisingly, the higher the terminal velocities are, the closer they deposit to the source. In light of the large uncertainties in sinking rates, we find that the plastic distribution has large uncertainties, but is clearly seasonal and influenced by wind, vertical mixing, river discharge and sinking rates. The Philippines and Indonesia are found to have the coastlines that are most exposed to plastic pollution from the Mekong river. This study shows that simulations of marine plastic drift are very variable, depending on many factors and assumptions. However, it provides more detailed information on marine plastic pollution in Southeast Asia, and hopefully helps authorities take more practical actions.

1. Introduction

Plastic waste has been identified as a major worldwide environmental issue [1,2]. Among several negative effects on the environment, plastics leach toxic and endocrine disrupting chemicals [3]. It is estimated that between 4.8 and 12.7 million tons of plastic waste enter the ocean every year [4]. A major share of this originates in the countries of South East Asia (SEA) [2,5]. In addition, countries bordering the South China Sea (SCS) contribute 2.56–7.08 million tons of plastic waste to the oceans yearly [4]. Six (China, Indonesia, Philippines, Vietnam, Thailand and Malaysia) of the countries bordering the SCS are among the ten biggest contributors to marine plastics worldwide [4].
Numerous studies using various methods for the quantification of microplastics (MPs) have been carried out in the SCS, including river deltas, seawater, sediments, islands, beaches, coral reefs, mangroves in China, Hongkong, Taiwan, the Philippines, Malaysia, Thailand and Singapore, and also in the middle of the sea (Paracel and Spratly Islands) [5]. However, it is difficult to compare the amounts of plastic discharge in one area to another of the sea due to the very different methods used for its quantification. For example, the studies cited above show a very wide spectrum of the amount of plastics, ranging from 0.1 to 258,408 pieces of MPs per m 2 , m 3 , kg, km 2 , or grams of plastics/m 2 .
According to estimates by Jambeck et al. [4], Asian rivers may contribute as much as 86% of the marine plastics globally. Mekong, the largest river in the SCS, surrounded by three (China, Thailand and Vietnam) out of the 10 biggest plastic contributors [4], is ranked between the 8th- and the 11th-biggest plastic contributor to the oceans [6]. Haberstroh et al. [6] found that plastic waste from Phnom Penh (Cambodia) transported by the Mekong river is a significant contribution to Southeast Asian marine plastic waste. Although the Mekong river carries a significant amount of plastic waste to SEA oceanic regions, there have been no studies to date on how marine plastics spread from the Mekong river to the SEA.
There are many factors controlling plastic drift from the Mekong river to SEA. Firstly, the circulation in the upper layers of the South China Sea are mainly influenced by the monsoon system. The northeasterly winds in the winter results in a cyclonic circulation while the southwesterly winds in the summer create an anti-cyclonic circulation at the surface layer [7]. With average wind speeds of 4–5 m/s in the summer and 8–10 m/s in the winter (Figure A1 and Figure A2), the currents and circulations in the winter are significantly stronger than in the summer (Figure A3 and Figure A4).
In addition to background currents (i.e., geostrophic, tidal and baroclinic currents), the wind also plays a role in plastic drift, specifically the wind drift current [8]. Usually, the wind drift is parameterized and amounts to between 1 and 6% of the wind speed, depending on the object. For surface particles, a wind drift of 2–3% of the wind speed is commonly used [8,9,10,11,12]. In the SCS, the southwesterly monsoon prevails in the summer with an average speed of 4–5 m/s, and in the winter the stronger northeasterly monsoon dominates with an average speed of 8–10 m/s. This suggests that wind drift will be more important in the winter than in the summer.
Rivers obviously play a role in the drift of marine plastics, but it is unclear how far away from the river mouth their influence will be felt directly. Rivers carry fresh water to the sea and thus affect the baroclinicity around the estuary and possibly beyond. These changes may affect plastic drift. Examining the effect of rivers on plastic drift is motivated by model experiments carried out by Hole [13] on the effect of the Mississippi river runoff on the Deepwater Horizon oil spill.
Next, vertical mixing can be important in the vertical distribution of buoyant particles [14,15,16]. Mixing distributes particles over the water column, and consequently their lateral drift may vary greatly. Vertical mixing is caused by several factors including radiative cooling, breaking (and non-breaking) waves, winds and tides. In practice, it can be simplified using a vertical eddy diffusivity, and this parameter can be estimated from the wind speed.
The last factor is the sinking of marine plastics. Although almost 90% of polymers show initial positive buoyancy in seawater, a majority of litter at the seafloor of the North Sea and Baltic Sea are plastics [17]. This is because polymer density is not a main driving factor of vertical plastic litter transport [17]. It is estimated that there are 14 million tonnes of plastics in the sediments on the ocean floors [18]. Additionally, the amount of plastics deposited on the seafloor increases in proportion to the increase in the amount of floating marine plastics on the sea surface [18]. There are many factors that affect the sinking of plastics, including the density of MPs and biofouling at all levels: molecular, micro- and macro-fouling [19]. MP particles may also be eaten by marine animals and sink with their fecal pellets [20,21]. The sinking of MPs can be parameterized using a sinking rate or a terminal velocity. Our understanding of the sinking rate is limited and different approaches give very different numbers. One method is to calculate sinking according to Stokes’ Law [22]. Kaiser et al. [23] calculated the terminal velocities of spherical polystyrene particles with sizes from 0.02 mm to 0.1 mm under various conditions. The results indicate that the terminal velocities range from 0.62 to 18.87 m per day (m/d). In addition, experiments conducted with different plastic particles in different salinity show that particle sizes ranging from 0.3 and 3.6 mm sink with velocities between 6 and 91 mm/s (or 518 and 7864 m/d, respectively, see Kowalski et al. [24]).
It is the purpose of this study to examine how plastics drift from the Mekong river to the SCS and its surrounding waters. We address the following research questions. Which countries are most vulnerable to plastic pollution from the Mekong River? How different are the seasonal drift patterns? How do wind drift, rivers, vertical mixing and sinking rates affect the plastic drift?

2. Materials and Methods

2.1. Met-Ocean Forcing

Ocean currents in this study were derived from two sources: ROMS (Section 2.2) and CMEMS [25]. The resolution of the ROMS model is between 1 and 7 km. This resolution is optimized for Vietnam’s coastal waters, in which the coastal area of Vietnam has a resolution of 1–3 km and the area far from the coast of Vietnam (the Philippines and Malaysia) has a resolution of 5–7 km. The coverage of the ROMS model is the South China Sea, and outside the South China Sea, CMEMS currents were used. The study area is shown in Figure A5.
The CMEMS ocean currents are a product of The Copernicus Marine Service. This product is a reanalysis from 2019 to present as well as 10-day forecasts with a spatial resolution of 1 / 12 in longitude and latitude over the global ocean. Vertically, there are 50 vertical levels ranging from 0 to 5500 m. This product also delivers a special dataset for surface currents, which also includes wave and tidal drift, called Surface Merged Ocean Current (SMOC) [25]. Detailed information on the validation of CMEMS products is provided by Le Traon et al. [26]. For this study, daily velocity data were used.
The wind forcing is from the European Centre for Medium-Range Weather Forecasts (ECMWF, see ECMWF [27]) interpolated to a spatial resolution of 0 . 125 in longitude and latitude, with a temporal resolution of three hours. Further details on the ECMWF forecast system and verification are given by Ehard et al. [28], Haiden et al. [29].
A summary of metocean forcing is found in Table 1.

2.2. The ROMS Model

The Regional Ocean Model System (ROMS) is an open source model widely used for a wide range of applications over various spatial regions and time periods. In this study, we used Vietnam ROMS 3D customized by MET Norway and VNMHA specifically for Vietnam’s waters. An earlier version, Vietnam ROMS 2D, also customized by MET Norway and VNMHA, was used to study the monsoon-induced surge at the Southeast coast of Vietnam by Thuy et al. [30]. There are many improvements in this newly updated version of ROMS 3D, including the use of the initial and boundary conditions from CMEMS, the upgrading of tidal constituents from the OSU TPXO Tide model [31] from TPXO 7.2 to TPXO 8.1, the use of river discharge rates from the Mike 11 model [32] and the European Flood Awareness System [33], and increased the vertical resolution to 20 levels. The ROMS inputs are listed in Table 2. Model validation of this 3D version is also seen in Figure 1 and Figure 2. Here, we use these modeled ocean currents as forcing for the OpenDrift model (see Section 2.3).
There are many stations in the South China Sea, and Vung Tau station (Figure A5) is the closest (around 50 km) to the Mekong river. Therefore, this station is selected for validation of ROMS. Figure 1 shows a comparison between the observed water level and the ROMS model at Vung Tau in June 2020. Figure 2 shows a comparison between the observed salinity and the ROMS model at Vung Tau from May to December 2020. Overall, the comparisons show that there is a good match between the ROMS model and observations.

2.3. The OpenDrift Model Framework

OpenDrift is an open source framework for ocean trajectory modeling, based on the offline Lagrangian particle tracking method, developed by the Norwegian Meteorological Institute (MET) [34,35]. This model has been evaluated in studies on drifters and oil spills in the North Sea [11,16,18,36] and in the Gulf of Mexico [13]. It has also been used to assess potential oil spill pollution [12] in Cuba and the drift of microplastics in the French Mediterranean Sea [37].
Two physical processes important for the horizontal drift of plastics were considered: ocean currents and wind drift. Ocean currents were taken from the ROMS model inside the SCS and from CMEMS outside the SCS. The wind drift is commonly parameterized, and amounts to between 1 and 6% of the wind speed. This parameter is adjusted depending on the object in question. For surface particles, a wind drift of 2–3% of the wind is commonly used [8,9,10,11,12]. Studies using the OpenDrift model indicate that a wind drift factor of 2% is optimal when comparing predicted positions with observations [11,16,18,36].
The vertical processes that act on particles considered in this study were vertical current velocity, vertical turbulence and terminal velocity (buoyancy) of the particles. The vertical velocity was either taken directly from the the ROMS model or set to zero when using CMEMS currents (there is no vertical velocity in the CMEMS current product). The turbulence was parameterized using a turbulent eddy diffusivity, and this parameter was calculated from the wind speed. Vertical particle displacement due to turbulent mixing was calculated using a random walk scheme according to Visser [12,34,38]. Buoyancy was expressed as terminal velocity, and is usually a function of particle density, diameter, and shape [34]. For buoyant particles, we used a terminal velocity of 0.01 m/s due to positive buoyant behavior. For sinking particles, we used terminal velocities of −2 and −5 m/d due to negative buoyancy.

2.4. Experimental Design

River discharge rates from the Mike 11 model provided by VNMHA, Figure A6, show that the water discharge rates start to increase from May, peak in October, and then decrease to a minimum in April. The waste cycle is closely related to the flood cycle in the Mekong River. In the dry season, garbage accumulates in landfills. In the flood season, the garbage follows the runoff and the flood to the rivers and then to the sea, most clearly in the summer. In addition, Haberstroh et al. [6] show that plastic waste in Mekong river mostly floats on the surface and drifts to the sea during the summer and flood season.
OpenDrift was run with a time step of 1 h and 100,000 marine plastic particles were released in every simulation. We did simulations of different lengths to investigate short and long term effects of the particle discharge. Three-month simulations were done for both summer and winter conditions and a 15-month simulation was also performed. With the three-month simulations, we released the particles evenly every day starting from 1 June 2020 and 1 December 2020 for summer and winter scenarios, respectively. With the 15-month simulation, we released the particles evenly every day in 5 months starting from 1 June 2020, corresponding to the time when most of the waste drifted into the sea [6], and these particles continued to drift for the next 10 months. In the 15-month simulation, if a particle hit the coast/island, it stranded and was deactivated. The flow chart of the simulation in OpenDrift is shown in Figure 3.

3. Results

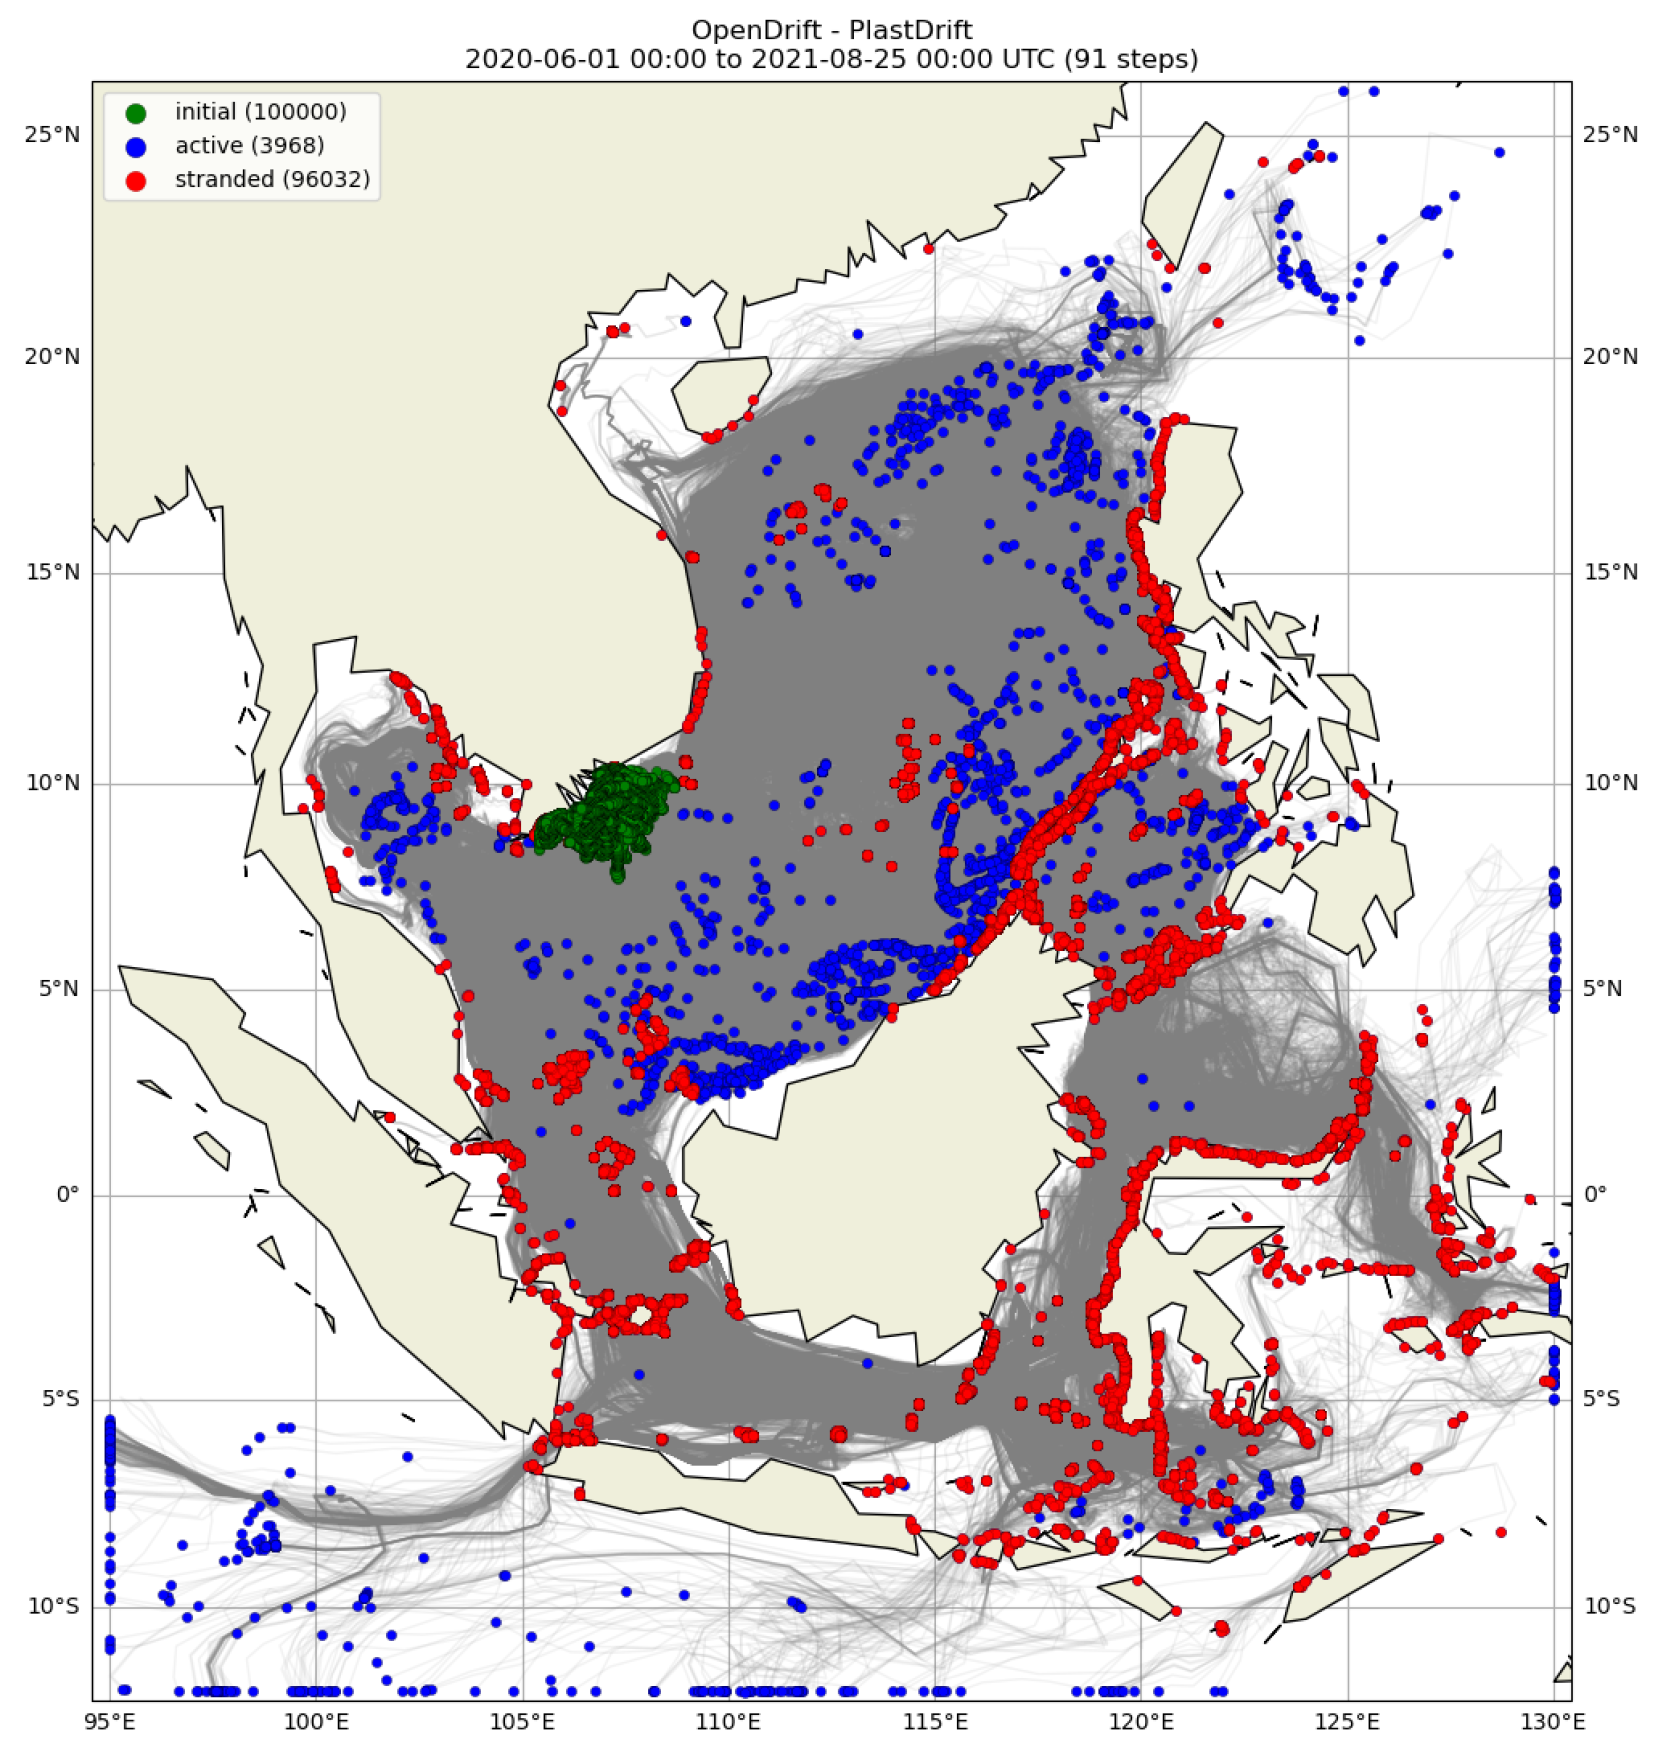
3.1. Trajectory of Marine Plastic Drift

To examine how plastics drift in the long term and assess which countries are most exposed to plastic discharge from the Mekong, we released particles over five months from June to October 2020, and allowed them to drift for 10 months. A particle would be deactivated (stranded) if it hit the coast.
Figure 4 shows that after 15 months, around 96% of the particles are stranded, and the remaining 4% are still in the SCS, the Sulu sea (the Philippines) and the two nearby oceans. The plastics are stranded mainly along coastlines at the east and south of the South China Sea, such as the Philippines, Indonesia.
Figure 5 shows the amount of stranded particles in percentage (%) in the countries most exposed to plastic discharge from the Mekong river. It can be seen that the Philippines accumulates the most plastics with 47%, and this is followed by Indonesia, Vietnam and Malaysia with 24%, 14% and 8%, respectively.
Most particles are stranded a few months after release, and the average traveling time of the stranded particles is approximately 4 months, see Figure A7 and Figure A8.

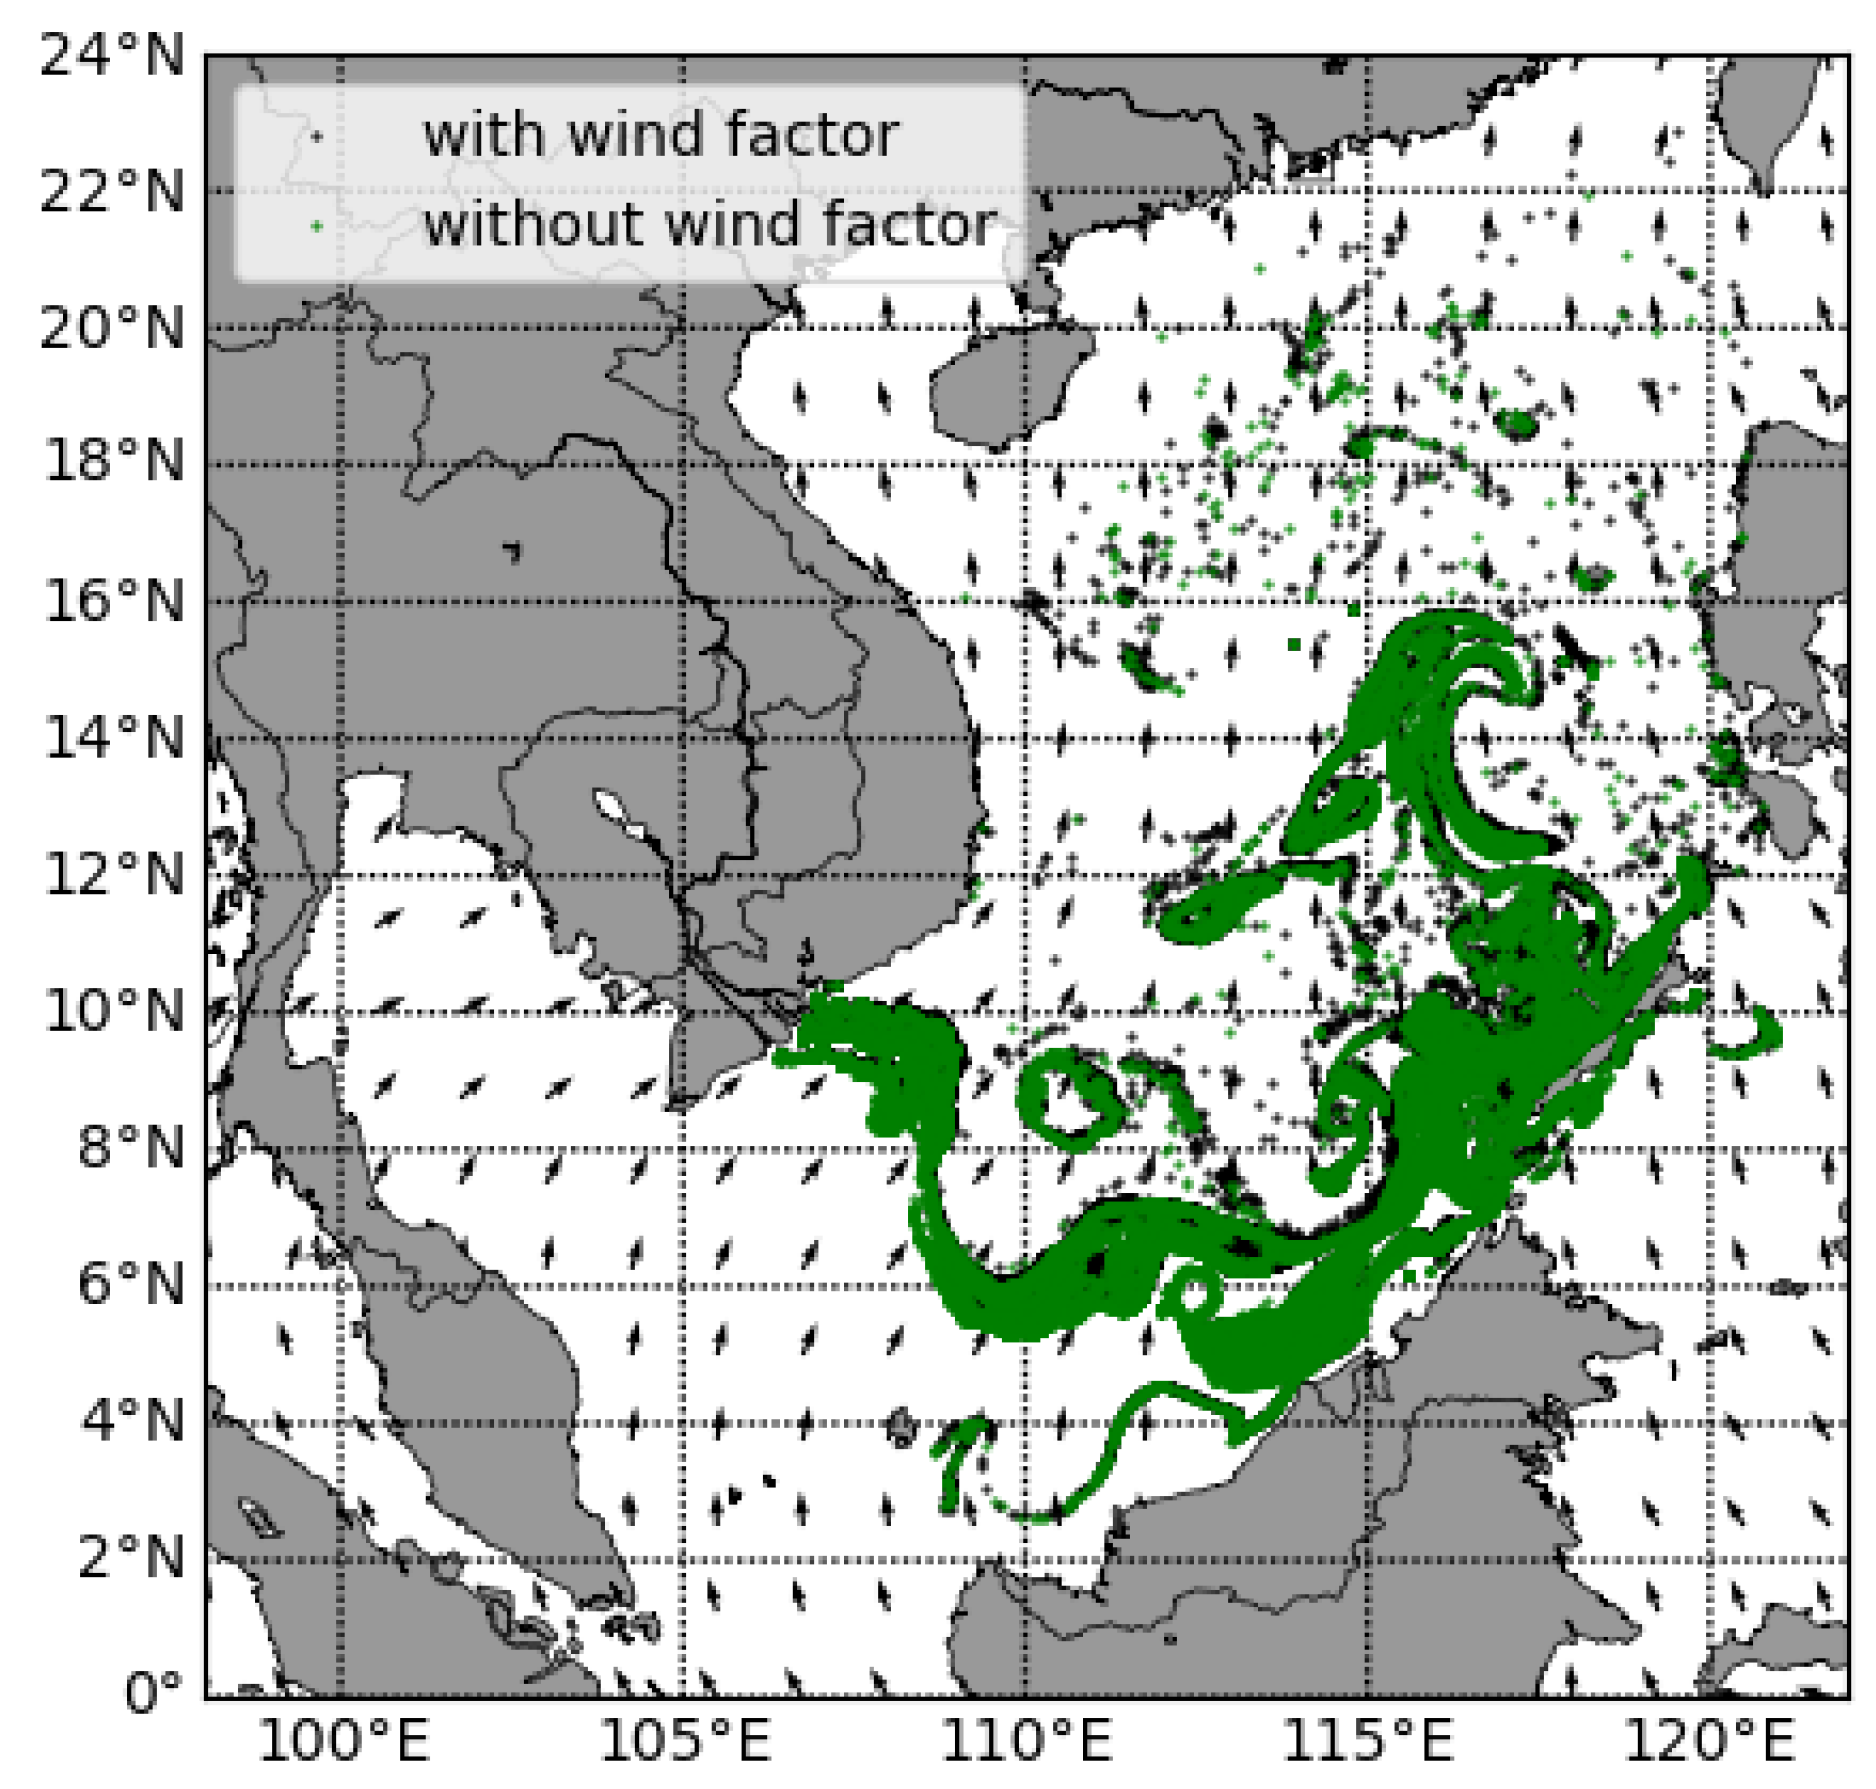
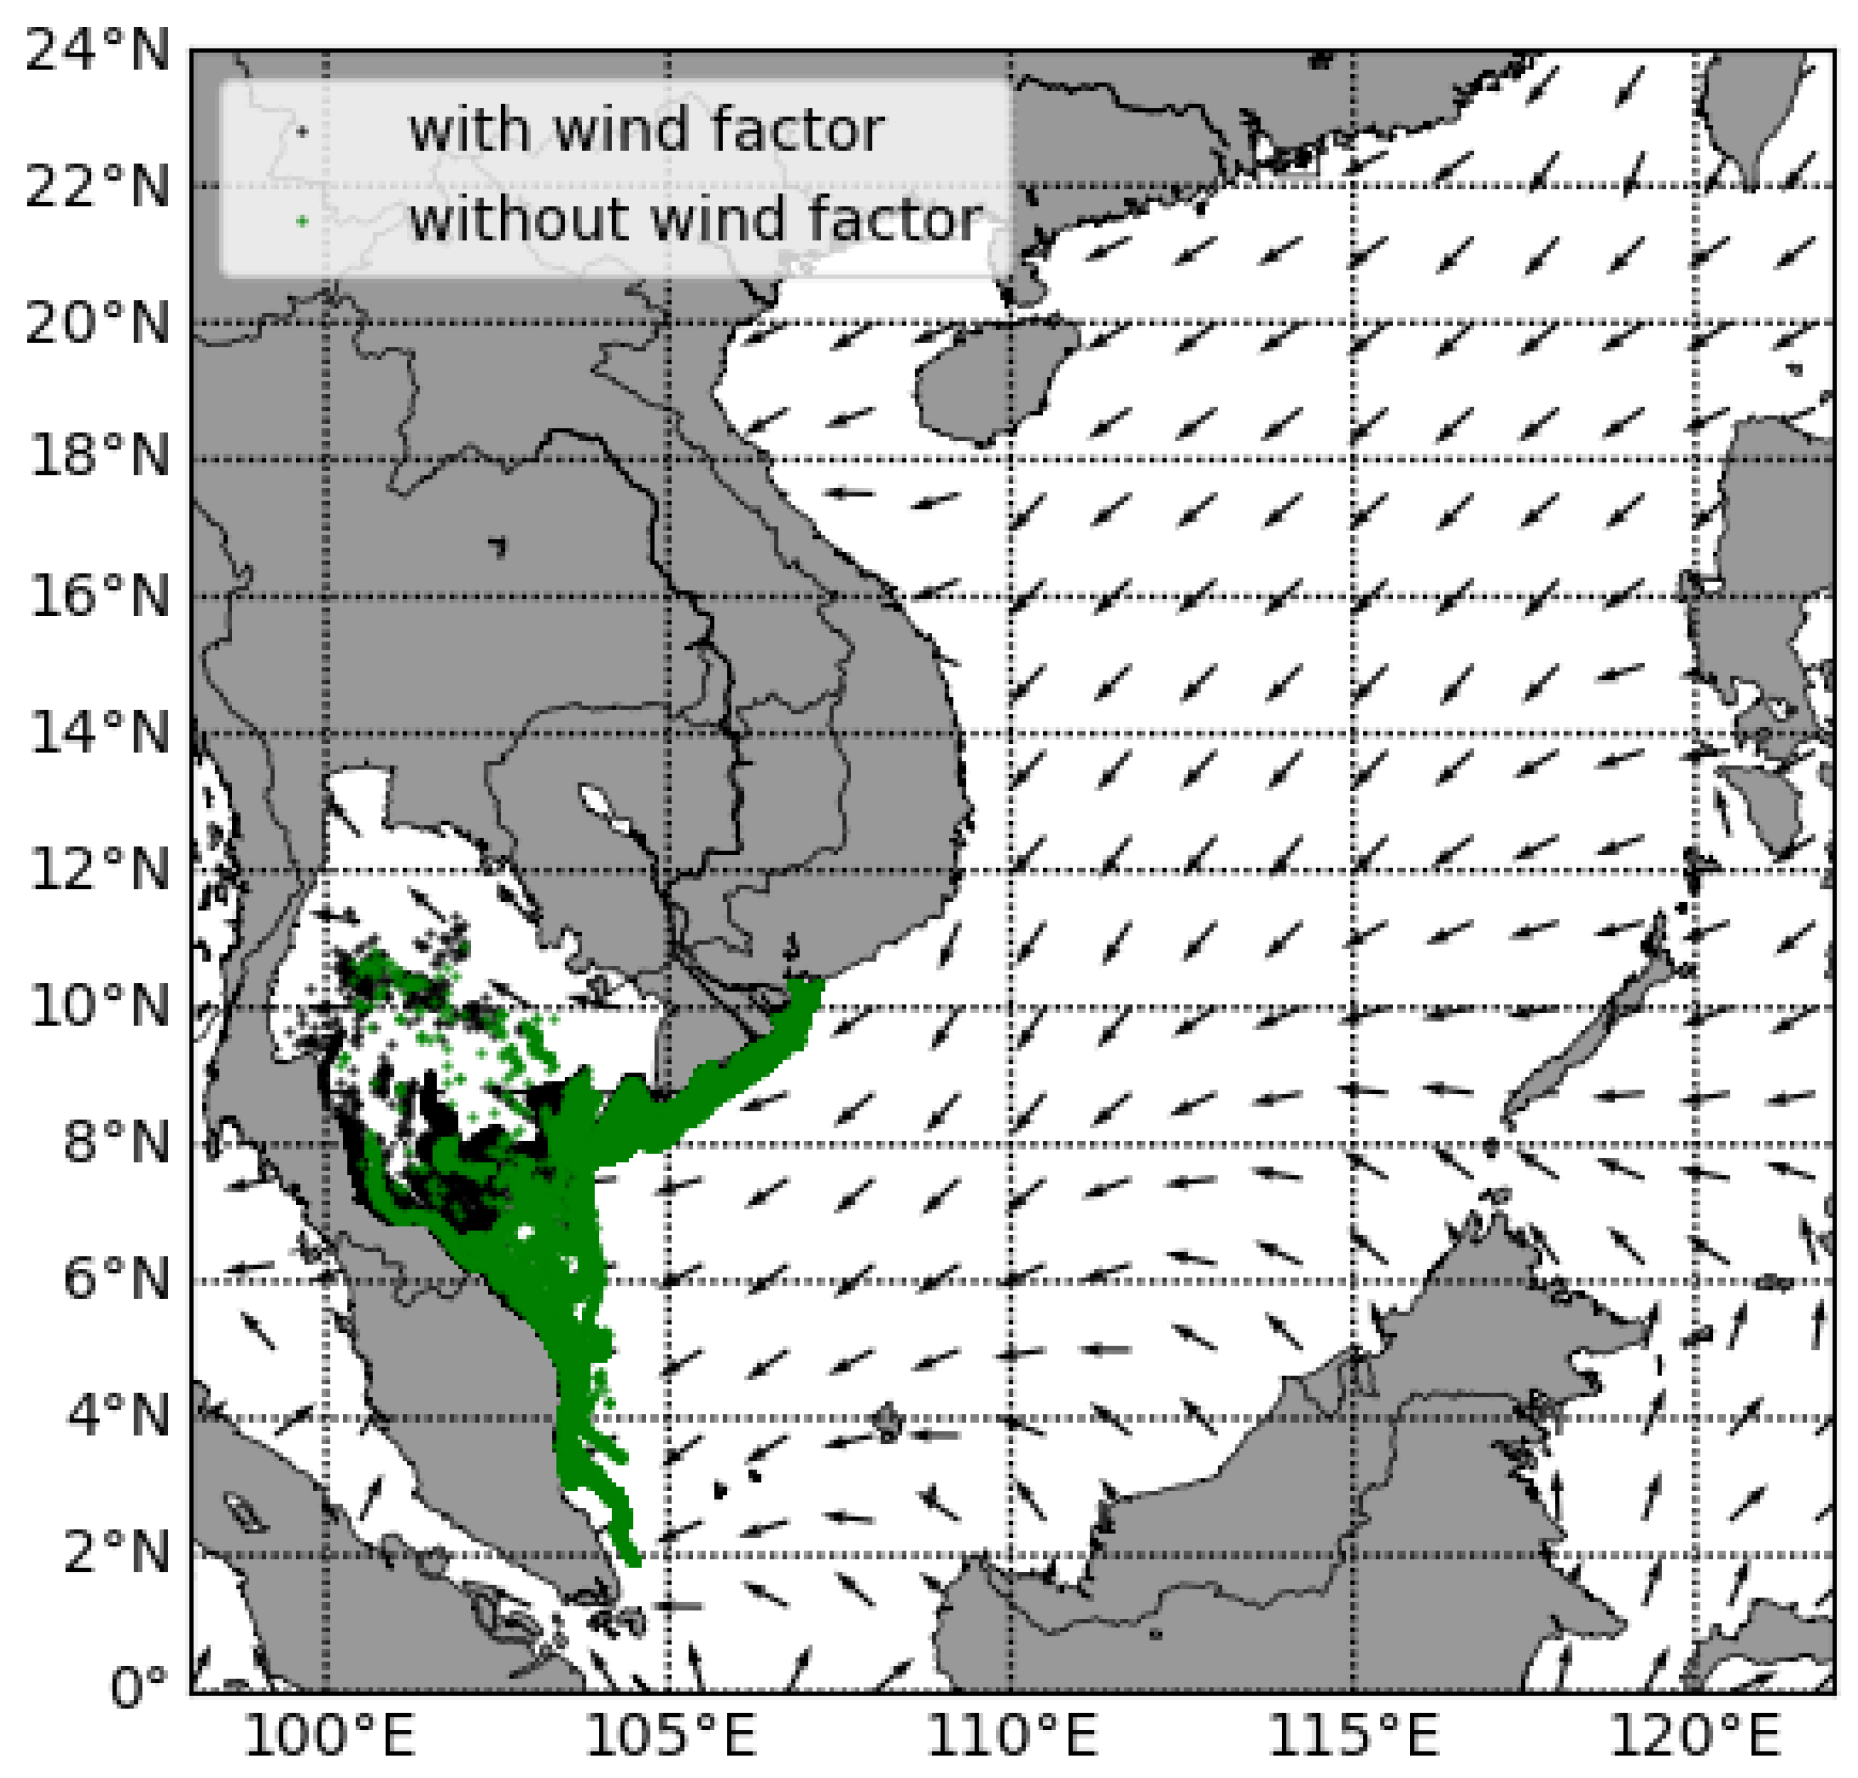
3.2. The Seasonal Drift Pattern and the Influence of Wind Drift

To examine the seasonal drift and the role of wind drift in the trajectory of marine plastics, the particles were released gradually in three months in the summer and winter with wind drift turned on and off.
The seasonal drift and the influence of wind drift in the summer and winter with wind direction are shown in Figure 6 and Figure 7. The general pattern in the summer is that the plastics drift to the east and the northeast with a large number of particles ending up on the western coast of East Malaysia and the Philippines. In the winter, particles drift mainly in the southwest direction with a large number of the particles ending up on the coast of Thailand and West Malaysia.
We can clearly see that the influence of wind drift in the winter is more distinct than that in the summer. Specifically, the black dots and green dots in the summer are almost identical, while in the winter more black dots are located toward the west and more green dots are located toward the south. In other words, the effect of wind drift in the summer scenario is negligible, whereas the wind drift in the winter transports the particles farther to the west.

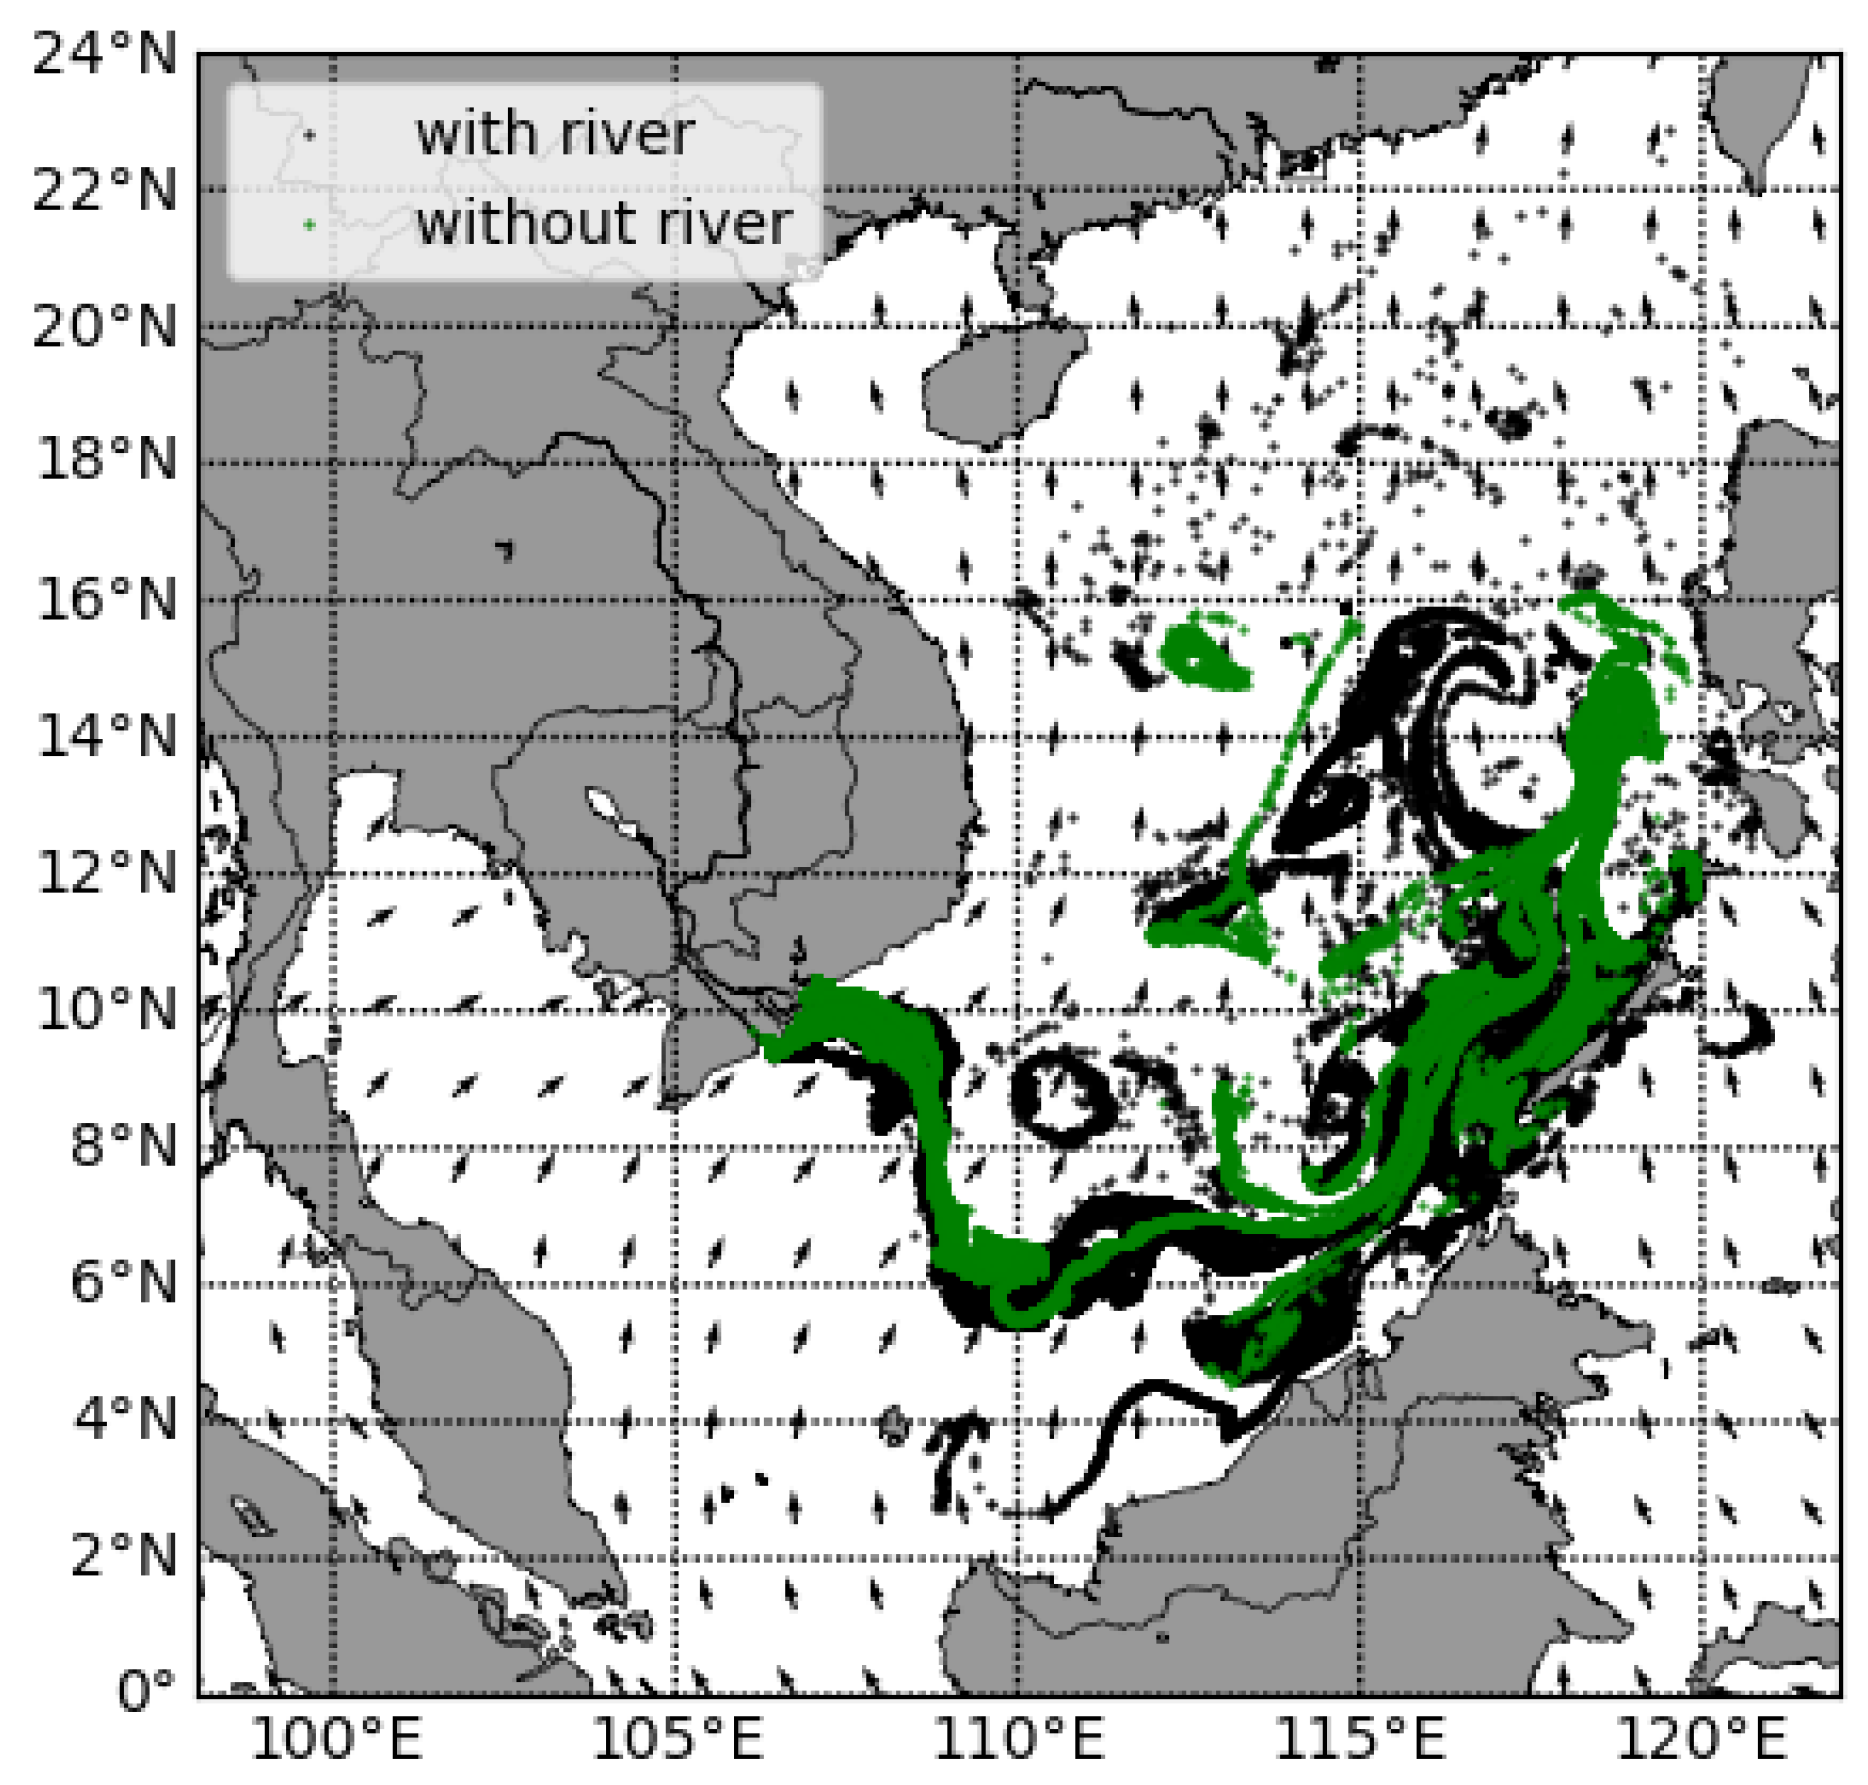
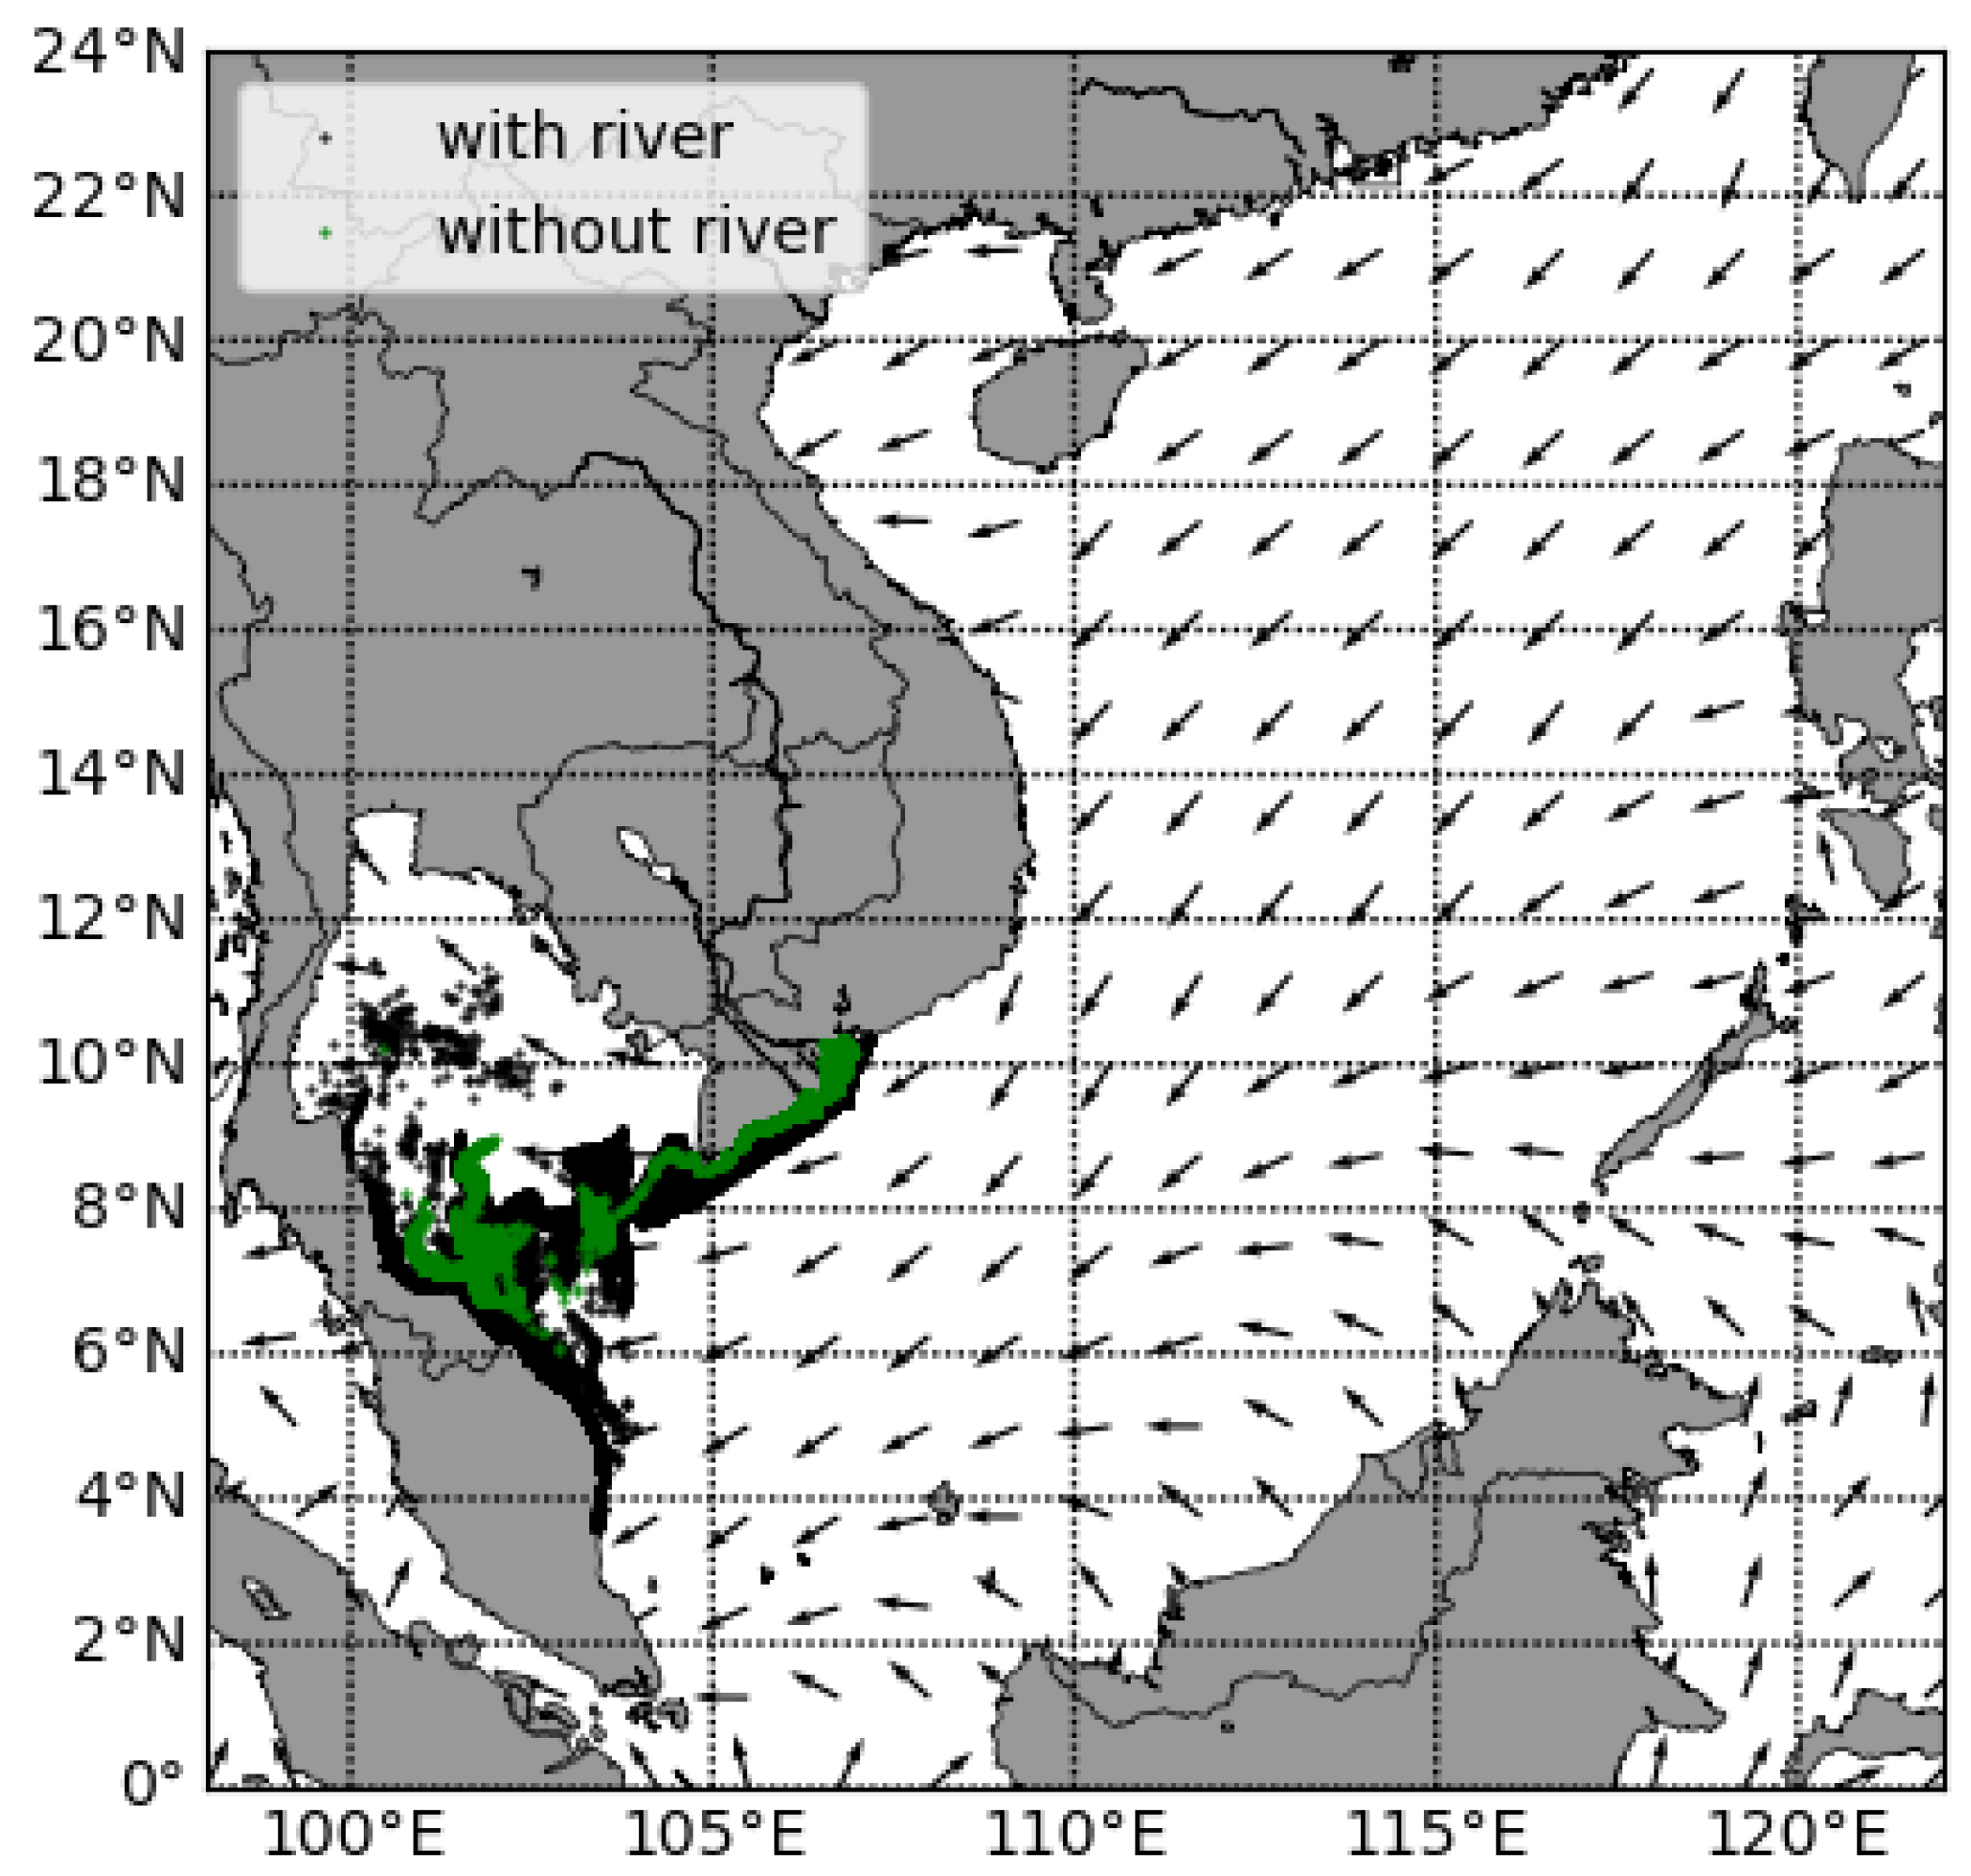
3.3. The Influence of the Mekong River

To examine how strongly the Mekong river can affect the trajectory of plastic drift, we experiment with turning the Mekong river runoff on and off in the ROMS model. This is motivated by model experiments carried out by Hole et al. [13] to study the effect of the Mississippi river on the Deepwater Horizon oil spill.
Figure 8 and Figure 9 show that the black particles spread in a wider area than the green particles in both the summer and the winter. It means that the Mekong river plays a role in dispersing marine plastics, or the Mekong river disperses plastic particles more efficiently.

3.4. Vertical Mixing

The purpose of this section is to examine how vertical mixing (vertical eddy diffusivity) can affect the trajectory of marine plastics by turning on and off vertical mixing in the OpenDrift model.
Figure 10 shows how strongly the vertical mixing can affect the plastic drift. We can clearly see that the influence of vertical mixing is very significant, with many green particles drifting far to the north, while black particles are concentrated in the middle of the sea. Specifically, the average latitudes of the black and green particles are 8 . 5 N and 11 . 8 N, respectively. In other words, without vertical mixing, the particles would drift 360 km further to the north.
Figure 11 shows the vertical distribution of particles in the two scenarios. In the scenario with vertical mixing, the concentration of plastics decreases exponentially with depth, and most particles are found at a depth between 0 and 5 m. In contrast, without vertical mixing, all the particles remain at the surface.

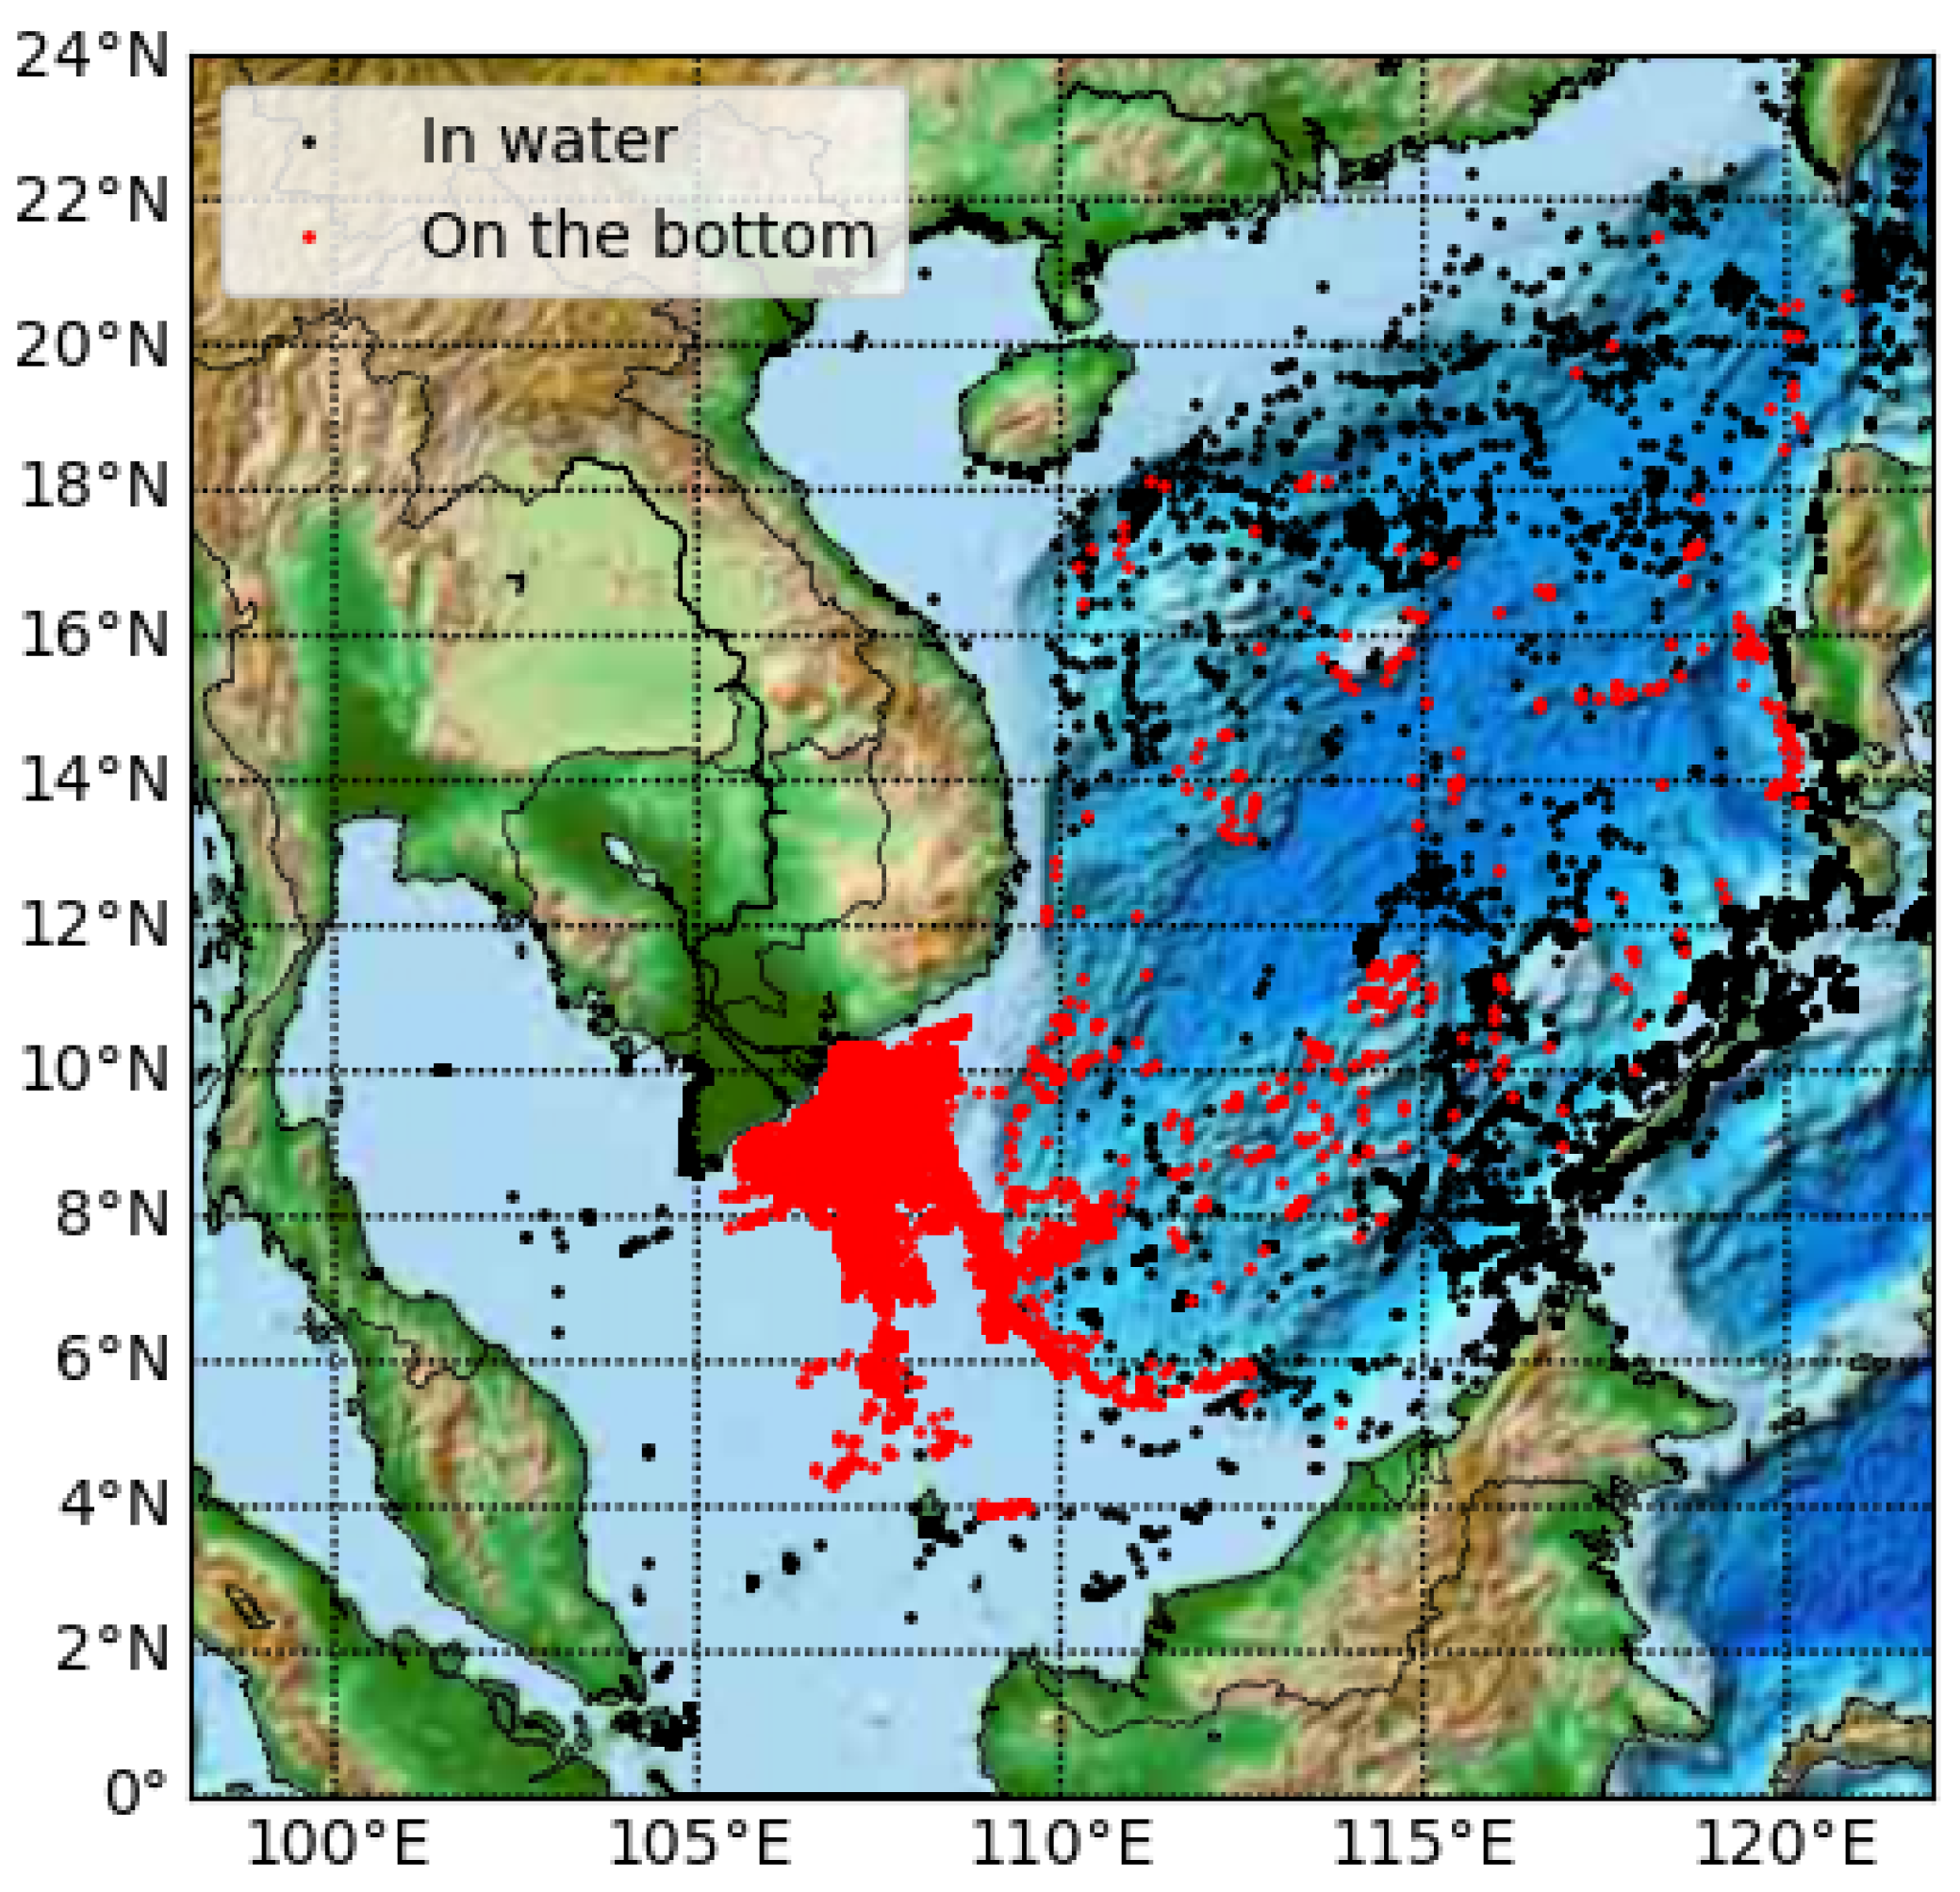
3.5. The Influence of Sinking Rates

To examine how sinking rates can affect plastic drift, terminal velocities of 2 and 5 m/d were used in the OpenDrift model. The particles were released evenly from June to October 2020, and continued drifting for the next 10 months. If a particle hit the seafloor, it would be deactivated (deposited).
Figure 12 and Figure 13 show the influence of terminal velocities on marine plastic drift. There are some obvious results to be noticed. The particles on the bottom are generally those in shallow areas, typically the southern continental shelf of the sea. The suspended particles are mostly in deep water areas. With a terminal velocity of 2 m/d, the particles are dispersed over most of the sea. Additionally, in the areas with large variations in depth such as the Paracel Islands (the Northwest of the sea) and Spratly Islands (the East of the sea), both red and black dots are seen. In comparison, with a terminal velocity of 5 m/d, most particles are deposited near the Mekong river. The animations of these simulations can be found on YouTube (https://youtube.com/shorts/Jdb8PaFL4iE: Plastics drift with terminal velocity of 2 m/d, accessed on 23 April 2023, https://youtu.be/3HMkh5RGUzE: Vertical distribution with terminal velocity of 2 m/d, accessed on 23 April 2023, https://youtube.com/shorts/Yew3WEBeME4: Plastics drift with terminal velocity of 5 m/d, accessed on 23 April 2023, and https://youtu.be/DhUd_5QyWms: Vertical distribution with terminal velocity of 5 m/d, accessed on 23 April 2023).

4. Discussion

Figure 5 shows that the Philippines is the country most exposed to plastic pollution from the Mekong river. The important factor here is probably the time of the release of plastic particles. The plastics were released from June to October, corresponding to the time plastics follow the flood and drift to the sea [6]. The SCS is semi-enclosed and the circulation in the upper layers is influenced by the monsoon system [7]. In the summer and the early fall, a southwesterly monsoon prevails in the SCS. Therefore, the southwesterly winds drive the particles from the Mekong River to the west of the Philippines according to Ekman theory [39]. This result is also similar to observations on surface currents caused by wind, which shows a wide variety of deflection angles between currents and winds, ranging anywhere between 0 and 90 [8].
Indonesia is also a major destination for marine plastics from the Mekong River. Firstly, the plastics drift mainly to the north and the east of the SCS (the Philippines and East Malaysia), following the direction of the wind and current. However, in winter, the wind changes from southwesterly to northeasterly, and the remaining plastics start drifting to the south. On the way, some of them are stranded in Vietnam, Thailand and Cambodia, and a large fraction goes to Indonesia through the Straits.
In the simulation shown in Figure 4, we assumed that if a plastic particle hit the coast, it would be stranded indefinitely and hence deactivated. In practice, the stranding of plastic particles is more complicated. For example, there are types of plastics that are easily stranded when going ashore, and some plastics may return to sea under favorable conditions. These depend on both the particles and the features of the coast. In particular, the shape, size and buoyancy of the particles, and the features of the coast including vegetation, sediments, rocks and steepness could influence where and which particles are stranded [20]. These characteristics also greatly influence the return to the sea of the particles under favorable conditions. However, these processes have not been included in the OpenDrift model. Probably, the stranding of plastics is one of the reasons why the estimates of the amount of plastics dumped into the seas and oceans are so much larger than the estimates of the amount of plastics actually found in the oceans [20].
The seasonal plastic drift pattern suggests that the destination of marine plastics originating in the Mekong River depends on the time the plastics are released to the sea. In the summer, the plastics drift to the Philippines and East Malaysia. In the winter, they go to West Malaysia and Thailand. This is because the circulation at the upper layers of the South China Sea are mainly influenced by the monsoon system [7]. The characteristics of winds and currents in the summer and winter can be seen in Figure A1Figure A4. It should be noted that since plastics are mostly released into the sea during the flood and the summer, the winter scenario is less realistic. However, it shows that the plastic drift from the Mekong river is highly seasonal with drift to the northeast and to the southwest.
The comparison of simulations between wind drift turned on (2%) and off (0%) indicates that the influence of wind drift on the trajectory of plastics is insignificant in the summer, and more distinct in the winter than in the summer. Firstly, most of the particles are below the sea surface, between 0 and 5 m depth, Figure 11. As a result, the impact of a wind drift of several tens of cm/s limited to the upper half meter has little effect on the particles since they are shielded from it. This means that the ocean currents play a decisive role in the plastic drift. Secondly, the winds in winter are typically stronger with speeds of 8–10 m/s, while winds in the summer are weaker with typical speeds of 4–5 m/s. The wind drift is fixed at 2% of the wind, meaning that the wind drift in the winter is twice as strong as that in the summer. Consequently, the influence of wind drift on plastic drift is more distinct in the winter than in the summer. In a recent study, Ref. [40] found that over time, after 15 months, the influence of the wind drift decreases significantly.
It is clear that the Mekong River disperses the plastic particles efficiently. Rivers create disturbances and eddies, and change the dynamics [41] around the estuary and possibly beyond depending on the volume of fresh water. Similar model experiments carried out by Hole et al. [13] on the effect of the Mississippi river on the Deepwater Horizon oil spill also show that rivers play an important role in dispersing oil particles. A recent study by Nguyen Manh [40] showed that the influence of rivers decreases over time. It is worth mentioning that the Mississippi and Mekong are some of the largest rivers by volume in the world. Therefore, smaller rivers can be expected to have much smaller impacts on plastic drift.
Figure 10 indicates that vertical mixing plays a particularly important role in the plastic drift. Particles in the scenario without vertical mixing float on the surface, are more exposed and are pushed by the wind drift further to the north. By comparison, vertical mixing brings plastic particles up and down, mostly between 0 and 5 m depth, see Figure 11. Therefore, they are less likely to be influenced by wind drift, which acts down to a few tens of centimeters below the sea surface. This vertical distribution is similar to a study by Kooi et al. [15] on the distribution of buoyant microplastics with depth in the North Atlantic subtropical gyre. The microplastic particles in that study ranged in size from 0.5 to 5.0 mm, and had the shape of “fragments” and “lines”. That study also took into account the sea state. The results indicate that concentrations of microplastics decrease exponentially with depth, with both sea state and particle properties and mostly in the range from 0 to 5 m depth.
The role of sinking rates in Figure 12 and Figure 13 show that with terminal velocity of 2 m/d, the particles sink slower and spread out in a wider area in the SCS. In contrast, in the scenario of 5 m/d, due to the strong sinking rate and shallow water near the Mekong river where the plastics were released, the particles are deposited almost right after leaving the Mekong, and very few particles travel far. In areas of great variation in depth, such as the Paracel and Spratly Islands, with a terminal velocity of 2 m/d, there is a relatively balanced presence of both red and black particles. This is probably because of the relative balance between shallow and deep waters.
In these simulations, it is assumed that all particles have the same constant terminal velocity. In fact, the sinking rate is usually not constant and they sink faster near the surface and then slow down due to lower temperatures in deeper waters [42].
It is also assumed that if a particle hits the seafloor, it will be indefinitely deposited. This is probably not always realistic. When a plastic particle reaches the seafloor, it can be trapped or transported further. They usually do not deposit in places with gentle slopes. Plastics tend to be deposited in places with steep slopes or in the deep seas [18]. Harris et al. [5] reviewed studies on plastics and found that in submerged canyons, coral reefs and mangroves, there is a large amount of MPs accumulated. This is contrary to our results that the plastic particles tend to deposit in shallow and flat waters, or the southern continental shelf of the South China Sea.

5. Conclusions

In this study, the marine plastic drift from the Mekong river to the South China Sea was simulated using the OpenDrift model with input data as wind and ocean currents. The wind forcing is taken from ECMWF, and the ocean currents from a ROMS 3D model and CMEMS. The geographical distribution of plastic pollution, seasonal drift patterns and the influences of wind drift, river flow, vertical mixing and sinking rates were investigated. The simulations were run for periods of three months in the summer and winter and 15 months. The results of the study can be summarized as follows:
  • The plastic drift is highly seasonal. During the summer, the plastic particles from the Mekong river drift to the east and the northeast, and in the winter they drift to the southwest. This is because the South China Sea is influenced by the strong monsoon system, in which the southwesterly wind prevails in summer, and the northeasterly wind dominates in the winter.
  • The river flow plays a role in dispersing plastic waste. Specifically, the Mekong river disperses plastics efficiently in both summer and winter.
  • The effect of wind drift on plastic drift depends on the wind speed and direction. This influence is significant in winter because of strong wind. Additionally, wind drift and vertical mixing can have combined effects on the trajectory of marine plastics. More specifically, when the wind drift is enabled and vertical mixing is disabled, the plastic particles stay on the surface and are more exposed and driven by wind drift.
  • Sinking rates have a great influence on where plastics end up. With a terminal velocity of 2 m/d, plastics drift to most parts of theSCS and beyond, and many remain suspended in deep waters. With a terminal velocity of 5 m/d, most plastic particles deposit right at the Mekong river.
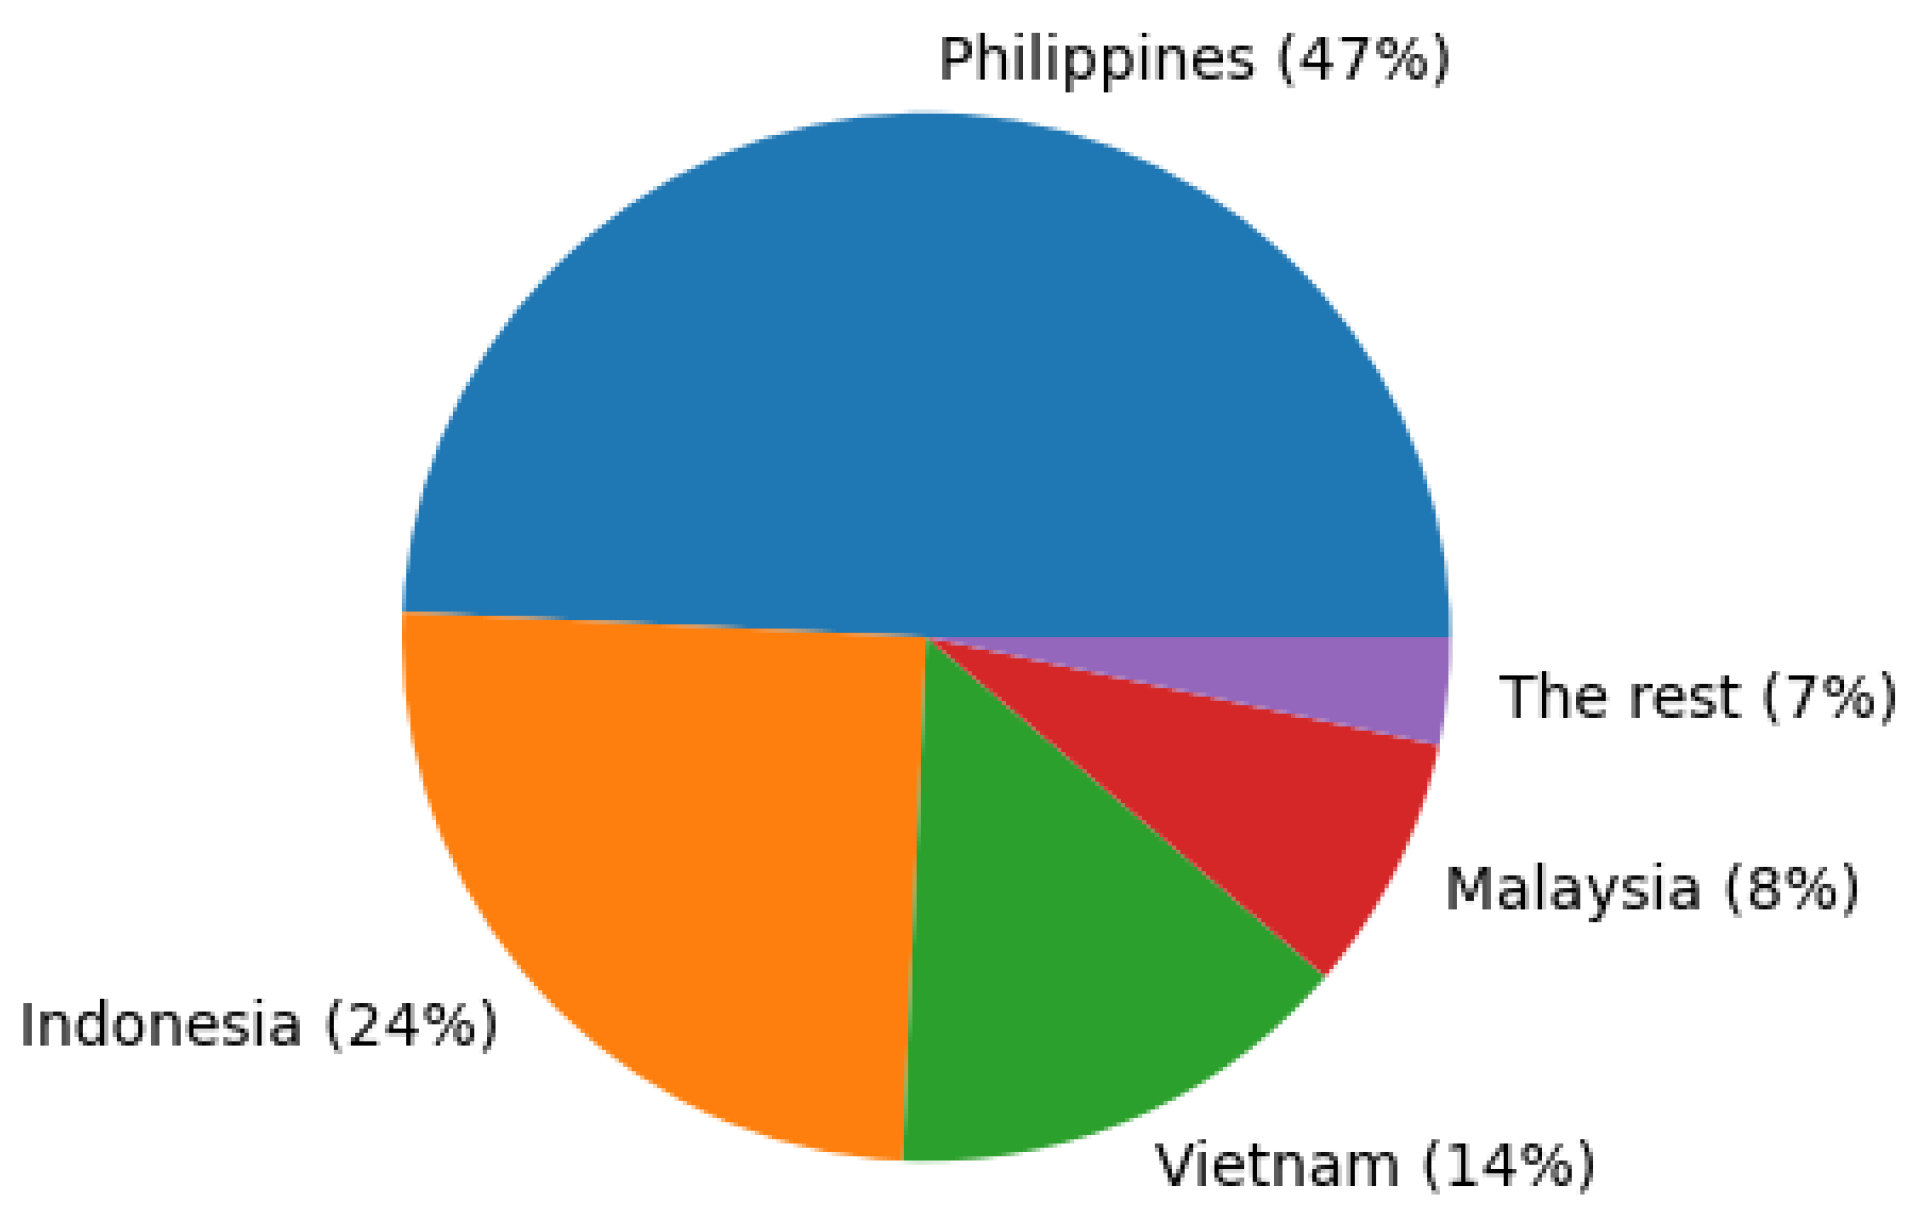
  • The Philippines is most vulnerable to marine plastic pollution from the Mekong river because plastic waste mainly drifts to the sea in the summer following the flood season and the southwesterly monsoon will then transport the plastics toward the Philippines. Indonesia is also a major destination of marine plastics from the Mekong river, because of its very large size with many seas and straits.
Simulation results of marine plastic drift is very variable, depending on many factors and assumptions such as the time plastics are released into the sea, the duration of plastic drift, wind speed and direction, river water, vertical mixing (vertical eddy diffusivity), terminal velocity (buoyancy: density, shape, size) and sinking rate (terminal velocity + vertical velocity + vertical mixing). In addition to the above results, other factors such as seawater temperature, salinity, sunlight, and microorganisms also affect biofouling, which increases the density of plastic particles over time and deposits plastics on the seafloor. Additionally, beach and sea floor characteristics such as coral reef, mangrove, rocks, seafloor roughness and steepness, and characteristics of plastic waste such as plastic bottles or plastic bags and microplastics also affect the stranding and the return back to the sea under favorable conditions. Therefore, further studies are needed in the future to gain more knowledge of plastic drift.
It is crucial to study marine plastic pollution modeling in South East Asia, particularly plastic from the Mekong River, because this river system is a significant contributor to the plastic waste problem in the region. It is estimated that approximately 1.3 billion people rely on the Mekong River for their livelihoods, making it a vital source of food and income for many communities.
By studying marine plastic pollution modeling in South East Asia, particularly plastic from the Mekong River, researchers can better understand the sources and pathways of plastic pollution in the region. This information can be used to develop effective strategies to reduce plastic waste and mitigate its impacts on the environment and human health.
Moreover, the study of plastic pollution in the Mekong River can have broader implications for global efforts to address plastic pollution. As a major contributor to ocean plastic pollution globally, the Mekong River is a critical area for study to understand and combat this global issue.
In summary, studying marine plastic pollution modeling in South East Asia, particularly plastic from the Mekong River, is essential for understanding and mitigating the impact of plastic waste on the environment, economy, and public health of the region and has broader implications for addressing the global plastic waste problem.

Author Contributions

Individual contributions: Conceptualization: D.M.N., L.R.H. and Ø.B.; methodology: D.M.N. and L.R.H.; software: D.M.N. and N.K.P.; validation: D.M.N.; formal analysis: D.M.N. and L.R.H.; investigation: D.M.N.; resources: D.M.N. and L.R.H.; data curation: D.M.N. and L.R.H.; writing—original draft preparation: D.M.N. and L.R.H.; writing—review and editing: L.R.H., Ø.B. and T.B.N.; visualization: D.M.N.; supervision: L.R.H. and Ø.B.; project administration: L.R.H. and Ø.B. All authors have read and agreed to the published version of the manuscript.

Funding

This research was funded by NORAD (Norwegian agency for development cooperation), and Vietnam Ministry of Natural Resources and Environment (project code TNMT.2022.06.04).

Data Availability Statement

All data in this research are available at https://thredds.met.no/thredds/catalog/metusers/manhdn/catalog.html, (accessed on 23 April 2023).

Acknowledgments

We would like to express our sincere thanks to our colleagues from the Norwegian Meteorological Institute, in particular Knut-Frode Dagestad for the technical support on OpenDrift and the scientific discussions, and Georgios Magklaras for technical support. We would also would like to thank Prithvinath Madduri from the Geophysical Institute for technical support on OpenDrift and the scientific discussions. In addition, my sincere thanks to my former colleagues from the Vietnam Meteorological and Hydro-logical Administration, especially Nguyen Manh Linh for technical support on setting up models.

Conflicts of Interest

The authors declare no conflict of interest. The funders had no role in the design of the study; in the collection, analyses, or interpretation of data; in the writing of the manuscript; or in the decision to publish the results.

Abbreviations

The following abbreviations are used in this manuscript:
CMEMSThe Copernicus Marine Environment Monitoring Service
(the Coper-nicus Marine Service)
ECMWFThe European Centre for Medium-Range Weather Forecasts
METNorwegian Meteorological Institute
MP(s)Micro-plastic(s)
SCSSouth China Sea
SEASoutheast Asia
VNMHAThe Vietnam Meteorological and Hydro-logical Administration

Appendix A

Figure A1. Average wind speed and direction in the summer (July 2020).
Jmse 11 00925 g0a1
Figure A2. Average wind speed and direction in the winter (January 2021).
Jmse 11 00925 g0a2
Figure A3. Average currents in the summer (July 2020).
Jmse 11 00925 g0a3
Figure A4. Average currents in the winter (January 2021).
Jmse 11 00925 g0a4
Figure A5. Study area.
Jmse 11 00925 g0a5
Figure A6. The Mekong mouths’ discharge rates.
Jmse 11 00925 g0a6
Figure A7. Density of stranded particles after six months.
Jmse 11 00925 g0a7
Figure A8. Density of stranded particles after 15 months.
Jmse 11 00925 g0a8

References

  1. Zhang, P.; Wei, S.S.; Zhang, J.B.; Ou, Z.; Yang, Y.Q.; Wang, M.Y. Occurrence, composition, and relationships in marine plastic debris on the first long beach adjacent to the land-based source, south China sea. J. Mar. Sci. Eng. 2020, 8, 666. [Google Scholar] [CrossRef]
  2. Sun, J.; Fang, C.; Chen, Z.; Chen, G. Regional cooperation in marine plastic waste cleanup in the south china sea region. Sustainability 2021, 13, 9221. [Google Scholar] [CrossRef]
  3. Chen, Q.; Allgeier, A.; Yin, D.; Hollert, H. Leaching of endocrine disrupting chemicals from marine microplastics and mesoplastics under common life stress conditions. Environ. Int. 2019, 130, 104938. [Google Scholar] [CrossRef] [PubMed]
  4. Jambeck, J.R.; Geyer, R.; Wilcox, C.; Siegler, T.R.; Perryman, M.; Andrady, A.; Narayan, R.; Law, K.L. Plastic waste inputs from land into the ocean. Science 2015, 347, 768–771. [Google Scholar] [CrossRef] [PubMed]
  5. Harris, P.T.; Tamelander, J.; Lyons, Y.; Neo, M.L.; Maes, T. Taking a mass-balance approach to assess marine plastics in the South China Sea. Mar. Pollut. Bull. 2021, 171, 112708. [Google Scholar] [CrossRef]
  6. Haberstroh, C.J.; Arias, M.E.; Yin, Z.; Sok, T.; Wang, M.C. Plastic transport in a complex confluence of the Mekong River in Cambodia. Environ. Res. Lett. 2021, 16, 095009. [Google Scholar] [CrossRef]
  7. Huang, Q.-z.; Wang, W.-z.; Li, Y.S.; Li, C.W. Current characteristics of the South China Sea. In Oceanology of China Seas; Springer: Berlin/Heidelberg, Germany, 1994; pp. 39–47. [Google Scholar]
  8. van der Mheen, M.; Pattiaratchi, C.; Cosoli, S.; Wandres, M. Depth-Dependent Correction for Wind-Driven Drift Current in Particle Tracking Applications. Front. Mar. Sci. 2020, 7, 305. [Google Scholar] [CrossRef]
  9. Erftemeijer, P.L.; Van Beek, J.K.; Ochieng, C.A.; Jager, Z.; Los, H.J. Eelgrass seed dispersal via floating generative shoots in the Dutch Wadden Sea: A model approach. Mar. Ecol. Prog. Ser. 2008, 358, 115–124. [Google Scholar] [CrossRef]
  10. Le Hénaff, M.; Kourafalou, V.H.; Paris, C.B.; Helgers, J.; Aman, Z.M.; Hogan, P.J.; Srinivasan, A. Surface evolution of the deepwater horizon oil spill patch: Combined effects of circulation and wind-induced drift. Environ. Sci. Technol. 2012, 46, 7267–7273. [Google Scholar] [CrossRef]
  11. Dagestad, K.F.; Röhrs, J. Prediction of ocean surface trajectories using satellite derived vs. modeled ocean currents. Remote Sens. Environ. 2019, 223, 130–142. [Google Scholar] [CrossRef]
  12. Hole, L.R.; de Aguiar, V.; Dagestad, K.F.; Kourafalou, V.H.; Androulidakis, Y.; Kang, H.; Le Hénaff, M.; Calzada, A. Long term simulations of potential oil spills around Cuba. Mar. Pollut. Bull. 2021, 167, 112285. [Google Scholar] [CrossRef] [PubMed]
  13. Hole, L.R.; Dagestad, K.F.; Röhrs, J.; Wettre, C.; Kourafalou, V.H.; Androulidakis, Y.; Kang, H.; Hénaff, M.L.; Garcia-Pineda, O. The Deepwater horizon oil slick: Simulations of river front effects and oil droplet size distribution. J. Mar. Sci. Eng. 2019, 7, 329. [Google Scholar] [CrossRef]
  14. Kukulka, T.; Proskurowski, G.; Morét-Ferguson, S.; Meyer, D.W.; Law, K.L. The effect of wind mixing on the vertical distribution of buoyant plastic debris. Geophys. Res. Lett. 2012, 39, 1–6. [Google Scholar] [CrossRef]
  15. Kooi, M.; Reisser, J.; Slat, B.; Ferrari, F.F.; Schmid, M.S.; Cunsolo, S.; Brambini, R.; Noble, K.; Sirks, L.A.; Linders, T.E.; et al. The effect of particle properties on the depth profile of buoyant plastics in the ocean. Sci. Rep. 2016, 6, 33882. [Google Scholar] [CrossRef] [PubMed]
  16. Röhrs, J.; Dagestad, K.F.; Asbjørnsen, H.; Nordam, T.; Skancke, J.; Jones, C.E.; Brekke, C. The effect of vertical mixing on the horizontal drift of oil spills. Ocean Sci. 2018, 14, 1581–1601. [Google Scholar] [CrossRef]
  17. Int-Veen, I.; Nogueira, P.; Isigkeit, J.; Hanel, R.; Kammann, U. Positively buoyant but sinking: Polymer identification and composition of marine litter at the seafloor of the North Sea and Baltic Sea. Mar. Pollut. Bull. 2021, 172, 112876. [Google Scholar] [CrossRef]
  18. Barrett, J.; Chase, Z.; Zhang, J.; Holl, M.M.; Willis, K.; Williams, A.; Hardesty, B.D.; Wilcox, C. Microplastic Pollution in Deep-Sea Sediments From the Great Australian Bight. Front. Mar. Sci. 2020, 7, 808. [Google Scholar] [CrossRef]
  19. Fazey, F.M.; Ryan, P.G. Biofouling on buoyant marine plastics: An experimental study into the effect of size on surface longevity. Environ. Pollut. 2016, 210, 354–360. [Google Scholar] [CrossRef]
  20. Van Sebille, E.; Aliani, S.; Law, K.L.; Maximenko, N.; Alsina, J.M.; Bagaev, A.; Bergmann, M.; Chapron, B.; Chubarenko, I.; Cózar, A.; et al. The physical oceanography of the transport of floating marine debris. Environ. Res. Lett. 2020, 15, 023003. [Google Scholar] [CrossRef]
  21. Zhu, C.; Li, D.; Sun, Y.; Zheng, X.; Peng, X.; Zheng, K.; Hu, B.; Luo, X.; Mai, B. Plastic debris in marine birds from an island located in the South China Sea. Mar. Pollut. Bull. 2019, 149, 110566. [Google Scholar] [CrossRef]
  22. Stokes, G.G. On the theory of oscillatory waves. Trans. Camb. Philos. Soc. 1847, 8, 441–455. [Google Scholar]
  23. Kaiser, D.; Estelmann, A.; Kowalski, N.; Glockzin, M.; Waniek, J.J. Sinking velocity of sub-millimeter microplastic. Mar. Pollut. Bull. 2019, 139, 214–220. [Google Scholar] [CrossRef]
  24. Kowalski, N.; Reichardt, A.M.; Waniek, J.J. Sinking rates of microplastics and potential implications of their alteration by physical, biological, and chemical factors. Mar. Pollut. Bull. 2016, 109, 310–319. [Google Scholar] [CrossRef]
  25. E.U. Copernicus Marine Service Information, Global Ocean 1/12° Physics Analysis and Forecast Updated. 2014. Available online: https://data.marine.copernicus.eu/product/GLOBAL_ANALYSISFORECAST_PHY_001_024/description (accessed on 23 April 2023). [CrossRef]
  26. Le Traon, P.Y.; Reppucci, A.; Fanjul, E.A.; Aouf, L.; Behrens, A.; Belmonte, M.; Bentamy, A.; Bertino, L.; Brando, V.E.; Kreiner, M.B.; et al. From observation to information and users: The Copernicus Marine Service Perspective. Front. Mar. Sci. 2019, 6, 234. [Google Scholar] [CrossRef]
  27. ECMWF. The European Centre for Medium-Range Weather Forecasts. 2022. Available online: https://www.ecmwf.int/en/forecasts/accessing-forecasts/ (accessed on 21 December 2022).
  28. Ehard, B.; Malardel, S.; Dörnbrack, A.; Kaifler, B.; Kaifler, N.; Wedi, N. Comparing ECMWF high-resolution analyses with lidar temperature measurements in the middle atmosphere. Q. J. R. Meteorol. Soc. 2018, 144, 633–640. [Google Scholar] [CrossRef]
  29. Haiden, T.; Janousek, M.; Vitart, F.; Ben Bouallegue, Z.; Ferranti, L.; Prates, F.; Richardson, D. Evaluation of ECMWF Forecasts, Including the 2020 Upgrade; ECMWF Technical Memorandum; European Centre for Medium Range Weather Forecasts: Reading, UK, 2021; Volume 880, pp. 1–54. [Google Scholar]
  30. Thuy, N.; Tien, T.; Wettre, C.; Hole, L. Monsoon-Induced Surge during High Tides at the Southeast Coast of Vietnam: A Numerical Modeling Study. Geosciences 2019, 9, 72. [Google Scholar] [CrossRef]
  31. Egbert, G.D.; Erofeeva, S.Y. Efficient Inverse Modeling of Barotropic Ocean Tides. J. Atmos. Ocean. Technol. 2002, 19, 183–204. [Google Scholar] [CrossRef]
  32. Doan, Q.T. Application MIKE 11 model on simulation and calculation for saltwater intrusion in Southern region. Sci. Tech. Hydrometeorol. J. 2016, 1, 39–46. [Google Scholar]
  33. EFAS. The European Flood Awareness System. 2022. Available online: https://www.efas.eu/en/data-access (accessed on 21 December 2022).
  34. OpenDrift. OpenDrift—Open Source Framework for Ocean Trajectory Modelling. 2020. Available online: https://opendrift.github.io/ (accessed on 21 December 2022).
  35. Dagestad, K.F.; Röhrs, J.; Breivik, O.; Ådlandsvik, B. OpenDrift v1.0: A generic framework for trajectory modelling. Geosci. Model Dev. 2018, 11, 1405–1420. [Google Scholar] [CrossRef]
  36. Jones, C.E.; Dagestad, K.F.; Breivik, Ø.; Holt, B.; Röhrs, J.; Christensen, K.H.; Espeseth, M.; Brekke, C.; Skrunes, S. Measurement and modeling of oil slick transport. J. Geophys. Res. Oceans 2016, 121, 7759–7775. [Google Scholar] [CrossRef]
  37. Gérigny, O.; Pedrotti, M.L.; El Rakwe, M.; Brun, M.; Pavec, M.; Henry, M.; Mazeas, F.; Maury, J.; Garreau, P.; Galgani, F. Characterization of floating microplastic contamination in the bay of Marseille (French Mediterranean Sea) and its impact on zooplankton and mussels. Mar. Pollut. Bull. 2022, 175, 113353. [Google Scholar] [CrossRef] [PubMed]
  38. Visser, A.W. Using random walk models to simulate the vertical distribution of particles in a turbulent water column. Mar. Ecol. Prog. Ser. 1997, 158, 275–281. [Google Scholar] [CrossRef]
  39. Ekman, V.W. On the Influence of the Earth’s Rotation on Ocean-Currents; Almqvist & Wiksells boktryckeri, A.-B.: Uppsala, Sweden, 1905. [Google Scholar]
  40. Nguyen Manh, D. Marine Plastic Drift from the Mekong River to Southeast Asia. Master’s Thesis, The University of Bergen, Bergen, Norway, 2022. [Google Scholar]
  41. Cushman-Roisin, B. Introduction to Geophysical Fluid Dynamics: Physical and Numerical Aspects, 2nd ed.; International Geophysics Series; Academic: Amsterdam, The Netherlands, 2011; Volume 101. [Google Scholar]
  42. Kaiser, D.; Kowalski, N.; Waniek, J.J. Effects of biofouling on the sinking behavior of microplastics. Environ. Res. Lett. 2017, 12, 124003. [Google Scholar] [CrossRef]
Figure 1. Compare ROMS (water level) with observations at Vung Tau station.
Jmse 11 00925 g001
Figure 2. Comparison of modeled salinity (ROMS) with observations at the Vung Tau station.
Jmse 11 00925 g002
Figure 3. Flow chart in the OpenDrift simulation.
Jmse 11 00925 g003
Figure 4. Trajectory of plastic drift in 15 months.
Jmse 11 00925 g004
Figure 5. Stranded plastics in countries.
Jmse 11 00925 g005
Figure 6. The influence of wind drift in the summer.
Jmse 11 00925 g006
Figure 7. The influence of wind drift in the winter.
Jmse 11 00925 g007
Figure 8. The influence of river flow on plastic drift in the summer.
Jmse 11 00925 g008
Figure 9. The influence of river flow on plastic drift in the winter.
Jmse 11 00925 g009
Figure 10. Drift with and without vertical mixing (summer).
Jmse 11 00925 g010
Figure 11. Vertical distribution.
Jmse 11 00925 g011
Figure 12. Terminal velocity of 2 m/d.
Jmse 11 00925 g012
Figure 13. Terminal velocity of 5 m/d.
Jmse 11 00925 g013
Table 1. Summary of metocean forcing.
ModelsParametersResolutionVerticalTemporal
ECMWFWind velocity1/8 10 m3 h
ROMSOcean current (inside SCS)1–7 km20 layersHourly
CMEMSOcean current (outside SCS)1/12°−0.47 mDaily
Table 2. Summary of ROMS inputs.
ModelsParametersResolutionVerticalTemporal
ECMWFWind velocity1/8°10 m3 h
Sea level pressure---
Cloud cover---
Precipitation---
Air temperature-2 m-
Dew-point temperature-2 m-
CMEMS3D current 1 / 12 (−)5000 -> (−)0.5 mDaily
3D temperature---
3D salinity---
Sea surface height- -
Mike 11discharge rate Daily
(Mekong mouths)
EFASdischarge rate Daily
(other mouths)
OSU TPXO 8.1Harmonic tides13 constituents
Disclaimer/Publisher’s Note: The statements, opinions and data contained in all publications are solely those of the individual author(s) and contributor(s) and not of MDPI and/or the editor(s). MDPI and/or the editor(s) disclaim responsibility for any injury to people or property resulting from any ideas, methods, instructions or products referred to in the content.

