Article

No Observed Effects of Subsea Renewable Energy Infrastructure on Benthic Environments

1
Queen’s University Belfast Marine Laboratory, Queen’s University Belfast, 12-13 The Strand, Portaferry BT22 1PF, UK
2
School of Natural and Built Environment, Queen’s University Belfast, 12-13 The Strand, Portaferry BT22 1PF, UK
3
Nelson Research Centre, The New Zealand Institute for Plant and Food Research Limited, 293 Akersten St., Nelson 7010, New Zealand
*
Author to whom correspondence should be addressed.
J. Mar. Sci. Eng. 2023, 11(5), 1061; https://doi.org/10.3390/jmse11051061
Submission received: 22 March 2023 / Revised: 5 May 2023 / Accepted: 11 May 2023 / Published: 16 May 2023
(This article belongs to the Special Issue Interface between Offshore Renewable Energy and the Environment)

Abstract

:
For the tidal energy industry to move forward to commercialisation, understanding the interaction between the environment and tidal energy converters (TEC) is essential. The benthic environment may be particularly vulnerable to development by changing the existing physical and ecological characteristics. To assess measurable changes of the infrastructural and operation activity of the Deep Green subsea TEC known as the kite, developed by Minesto, benthic surveys were carried out in the Narrows, Strangford Lough, Northern Ireland. At the Minesto site and two other locations, scientific divers carried out circular cardinal-direction benthic camera surveys prior to and after five years of operation. A diverse assemblage of sessile, vagile and mobile species associated with substrate types were identified. No significant changes at any of the sites were recorded in the abundance of species, substrate type or species diversity over the five-year period. The results show that no impact on benthic communities was detected as a result of the operation and deployment of the infrastructure associated with the technology.

1. Introduction

The necessity to produce marine renewable energy (MRE) in an environmentally benign as well as socially and economically viable way is more critical now than ever before. The historical and current use of fossil fuels is predominantly driving the changing climate and having detrimental impacts globally [1]. Marine and terrestrial habitats are not only undergoing temperature-rise-influenced changes but are also experiencing a growing amount of anthropogenically induced stressors. Ecosystem-altering instigators such as eutrophication [2] and noise [3,4] can be extremely detrimental to biologically sensitive habitats such as those found in subtidal marine environments. It is therefore particularly important that the development of the MRE industry includes consideration of its ecological interactions with the associated environment.
A fundamental consideration for approval of the development of MRE technology by regulators and stakeholders is the effect during the different stages of construction, operation and decommissioning on existing benthic ecosystems [5,6]. The introduction of infrastructure into a relatively pristine fast-flow marine environment [7] has the potential to change surrounding ecological characteristics [8,9,10]. Subsea introductions, in particular, have the capacity to act as ‘artificial reefs’, which may alter local hydrodynamics, sediment transport patterns and indigenous flora and fauna [11,12]. A sudden change to a primary environmental component such as substratum type within a marine biotope will generally introduce a disruptive phase to existing habitual and trophic niches, until an ecological equilibrium is reached [13]. This period of change offers adaptable species, particularly invasive species, an opportunity to colonise a site that would previously have been hostile, as the established indigenous biodiversity matrix would have been resilient enough to ward off potential invasion [14]. These disruptive impacts can be significant, with the most harmful species being belligerent enough to displace native species and thereby alter fundamental ecological processes, such as nutrient cycling and sedimentation [15]. Nevertheless, whether native or invasive, the introduction of hard substrata to an otherwise rocky, sandy or muddy biotope will instantly provide a new substratum type, which will in turn be colonised by flora and fauna best suited to the new habitual niche [16]. This can lead to an alteration in predator–prey roles within the trophic chain, as community dynamics change to accommodate arrivals and reductions of hard- and soft-substrate-associated species [17].
The potential of any change (positive and/or negative) through habitat disruption on the seafloor in Strangford Lough, Northern Ireland, was of particular relevance for the Deep Green subsea tidal turbine kite developed by Minesto, referred to herein as the ‘kite’ (see [18] for full details on this device). The kite consists of a wing (~3 m span) that is attached to the seabed by a tether (27 m length). Strangford Lough is a recognised European Marine Protected Zone and accommodates several unique marine biotopes that support globally important populations of threatened birds and numerous endemic marine species [19,20]. The proposed location of the kite was therefore subject to strict subsea construction and environmental legislation under sections 14 and 17 of The Conservation of Habitats and Species Regulations for Northern Ireland [21]. It was therefore necessary for Minesto to undertake an environmental assessment in 2012 to obtain the necessary consenting license to enable them to test in the Narrows, Strangford Lough.
A prerequisite benthic ecological survey was therefore essential, as Strangford Lough, at the time, was one of only three designated Marine Nature Reserves in the UK. It was intended that the survey would serve two purposes: (i) as a site selection habitat suitability measure and (ii) as a baseline environmental assessment survey that could be used to complement future long-term impact monitoring. It is important to highlight how crucial the monitoring of environmentally sensitive habitat types is over an extended period of years, as it may take time for detrimental ecological changes to manifest within the flora, fauna and biological functionality of the ecosystem [22].
The Minesto operation, with associated seabed moorings and infrastructure, began shortly after the first benthic survey in 2012. The seabed foundation was approximately 50 m away from the barge, which had the tether attached to it to fly the 3-m wing device and a cable that ran from the foundation (4 × 4 × 1 m high reinforced concrete base) to the barge. To assess any measurable changes that had taken place in the benthic environment during the testing of the kite, a survey was undertaken five years later (2017). Owing to seasonal changes in benthic community structure and species population dynamics [23], it was considered best practice to replicate the survey during the same seasonal months as in 2012. The initial survey was carried out in July–August 2012 and the sites were subsequently revisited in July–August 2017. Knowledge related to long-term changes in benthic communities is lacking for tidal and wave energy converters [24]. Therefore, information on the interaction of infrastructure of this technology was crucial to inform regulators and their advisors when approving prototype devices to assess if any changes had taken place to the benthic environment during the five operational development years of the kite.

2. Materials and Methods

2.1. Site Selection

The developer had selected several sites near the Strangford Narrows, Strangford Lough, Northern Ireland, UK, based on preliminary diving inspections of substrate type and current speed from deployed acoustic Doppler current profiler (ADCP) data. Three sites were identified as suitable locations (Figure 1, A: E 357713.925 N 351555.601; B: E 357831.024 N 351465.772; and D: E 358289.203 N 351162.365), which were all between 15 and 20 m deep at low tide (Figure 1). These were typified by a stable mixed cobble/shell substrate with a current speed of approximately 1.5 m/s in spring tides. The main substrate components at all sites met the criteria used by the UK Government Joint Nature Conservation Committee (JNCC) for the biotope code SS.SMx.CMx (sublittoral mixed sediment, circalittoral mixed sediments).
The initial control/baseline benthic surveys for sites A, B and D were undertaken during the months of July and August 2012. The full survey methods and analysis were repeated during the same months in 2017.
After the 2012 assessment, it was agreed between the Department of Agriculture, Environment and Rural Affairs (DAERA) and Minesto that site allocation would be A and B as downstream ecological monitoring stations, and D as the location of the kite. In 2017, at site D, the transects were <10 m from the foundation and cables.

2.2. Survey Techniques

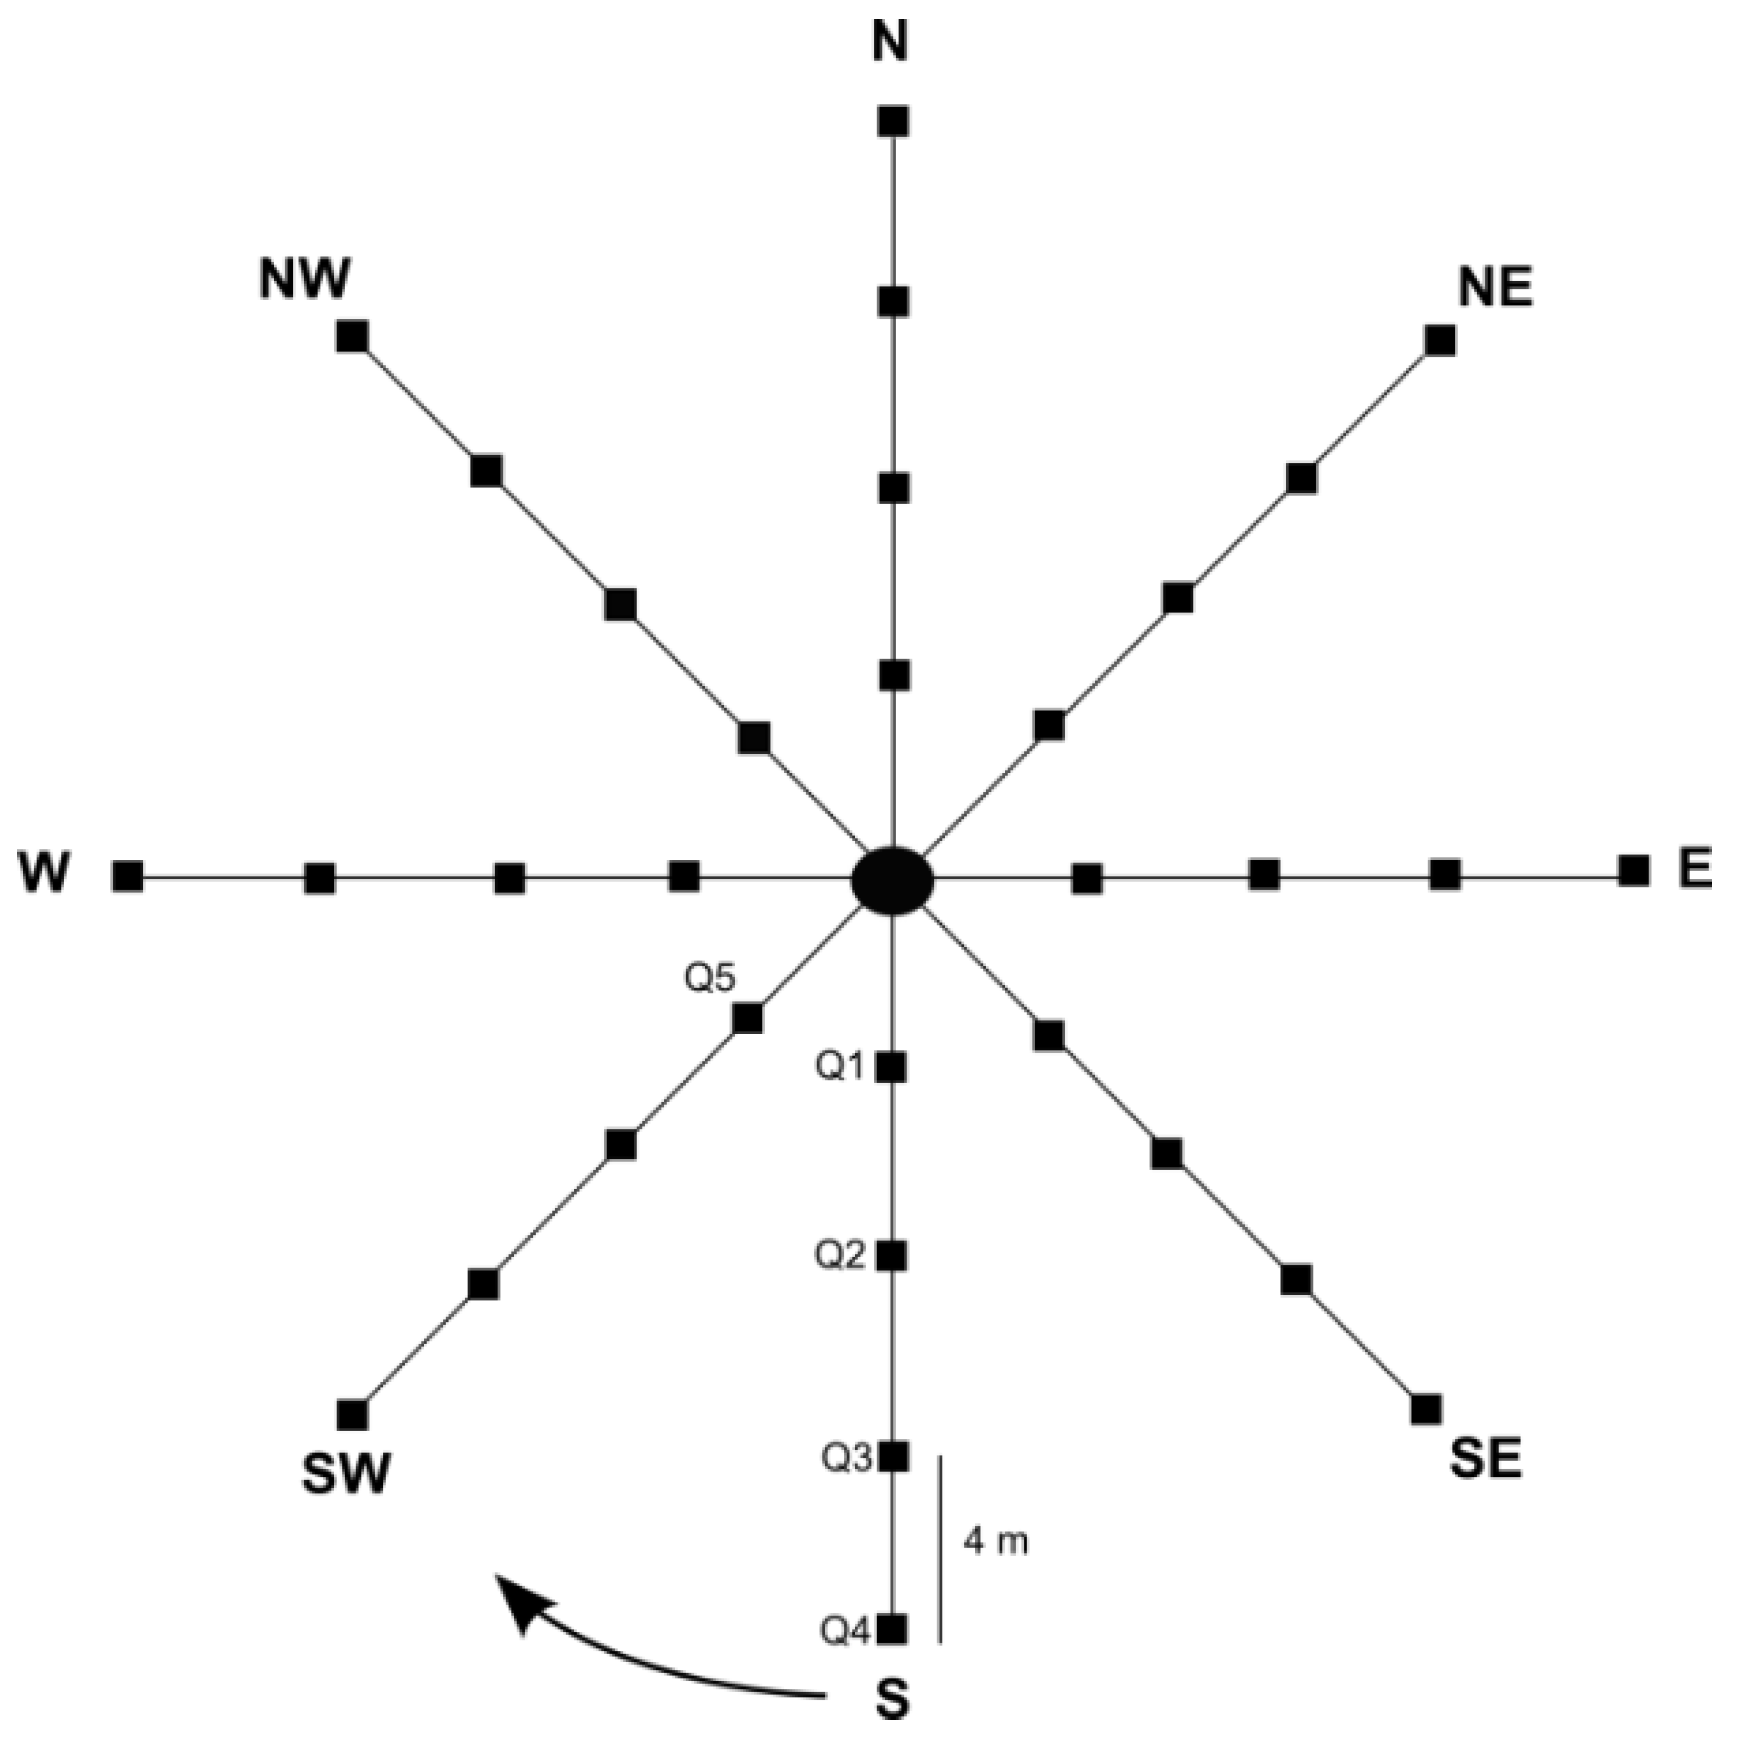
A circular cardinal-direction compass survey was employed at all sites (Figure 2). To complete the surveys, two dives were required due to the limited bottom time because of a short slack tide period. It was concluded that the survey would be conducted by HSE part IV scientific divers rather than a dropdown camera or ROV, the rationale being that experienced divers could make a more comprehensive in situ assessment.
Once the survey vessel was on site at each predetermined location (Figure 1) during slack spring tide (approximately 25 min), a shot line was deployed using coordinates fixed using the survey vessel’s SIMRAD NSS16 evo 3S plotter. Two divers descended the shot line and positioned the shot, which remained in situ during the survey days to ensure the same location at each site was surveyed.
Once at the centre of the shot, one diver carefully swam a 16 m bearing following cardinal directions (S, SW, W, NW, N, NE, E, SE) while laying a transect line and assessing the substrate type (Figure 2). The second diver followed the laid transect, recording video and digital stills using a Canon PowerShot G15 in a Fantasea housing with a dual Sealife Dragon 2500 video light set at COB LED colour render index 90 to mimic natural sunlight. The camera settings were at a resolution of 1920 × 1080 at 24 f/s, and white balance was calibrated automatically. Travel along each transect was approximately 10 min, including a 30 s pause for each 0.5 × 0.5 m quadrat placed at 4 m intervals (n = 4 along each transect).
Imagery of (n = 32) quadrats was recorded at each site and analysed using still image captures. The images were subjected to Coral Point Count software to determine organism coverage using random point count with a Microsoft Excel extension (CPCe). All images were calibrated in CPCe to the known distance at which the photos were taken (1 m). CPCe was used to randomly overlay a total of 100 points onto each image to provide non-biased observation markers from which quantitative data on benthic disturbance could be assessed, as per [25]. All image processing was carried out by the same benthic ecologist. A total of 19,200 habitat and species identifications were assigned for analysis of substrate type, epifauna, epiflora and vagile species based on criteria published by the Joint Nature Conservation Committee (JNCC) as per the protocols of [26,27]. The software quantified species richness and diversity indices to species level. The data were collated and processed for each replicate by survey site and corresponding year. This methodology for image data assessment was adopted from [28] because of its high analytical soundness.

2.3. Data Analysis

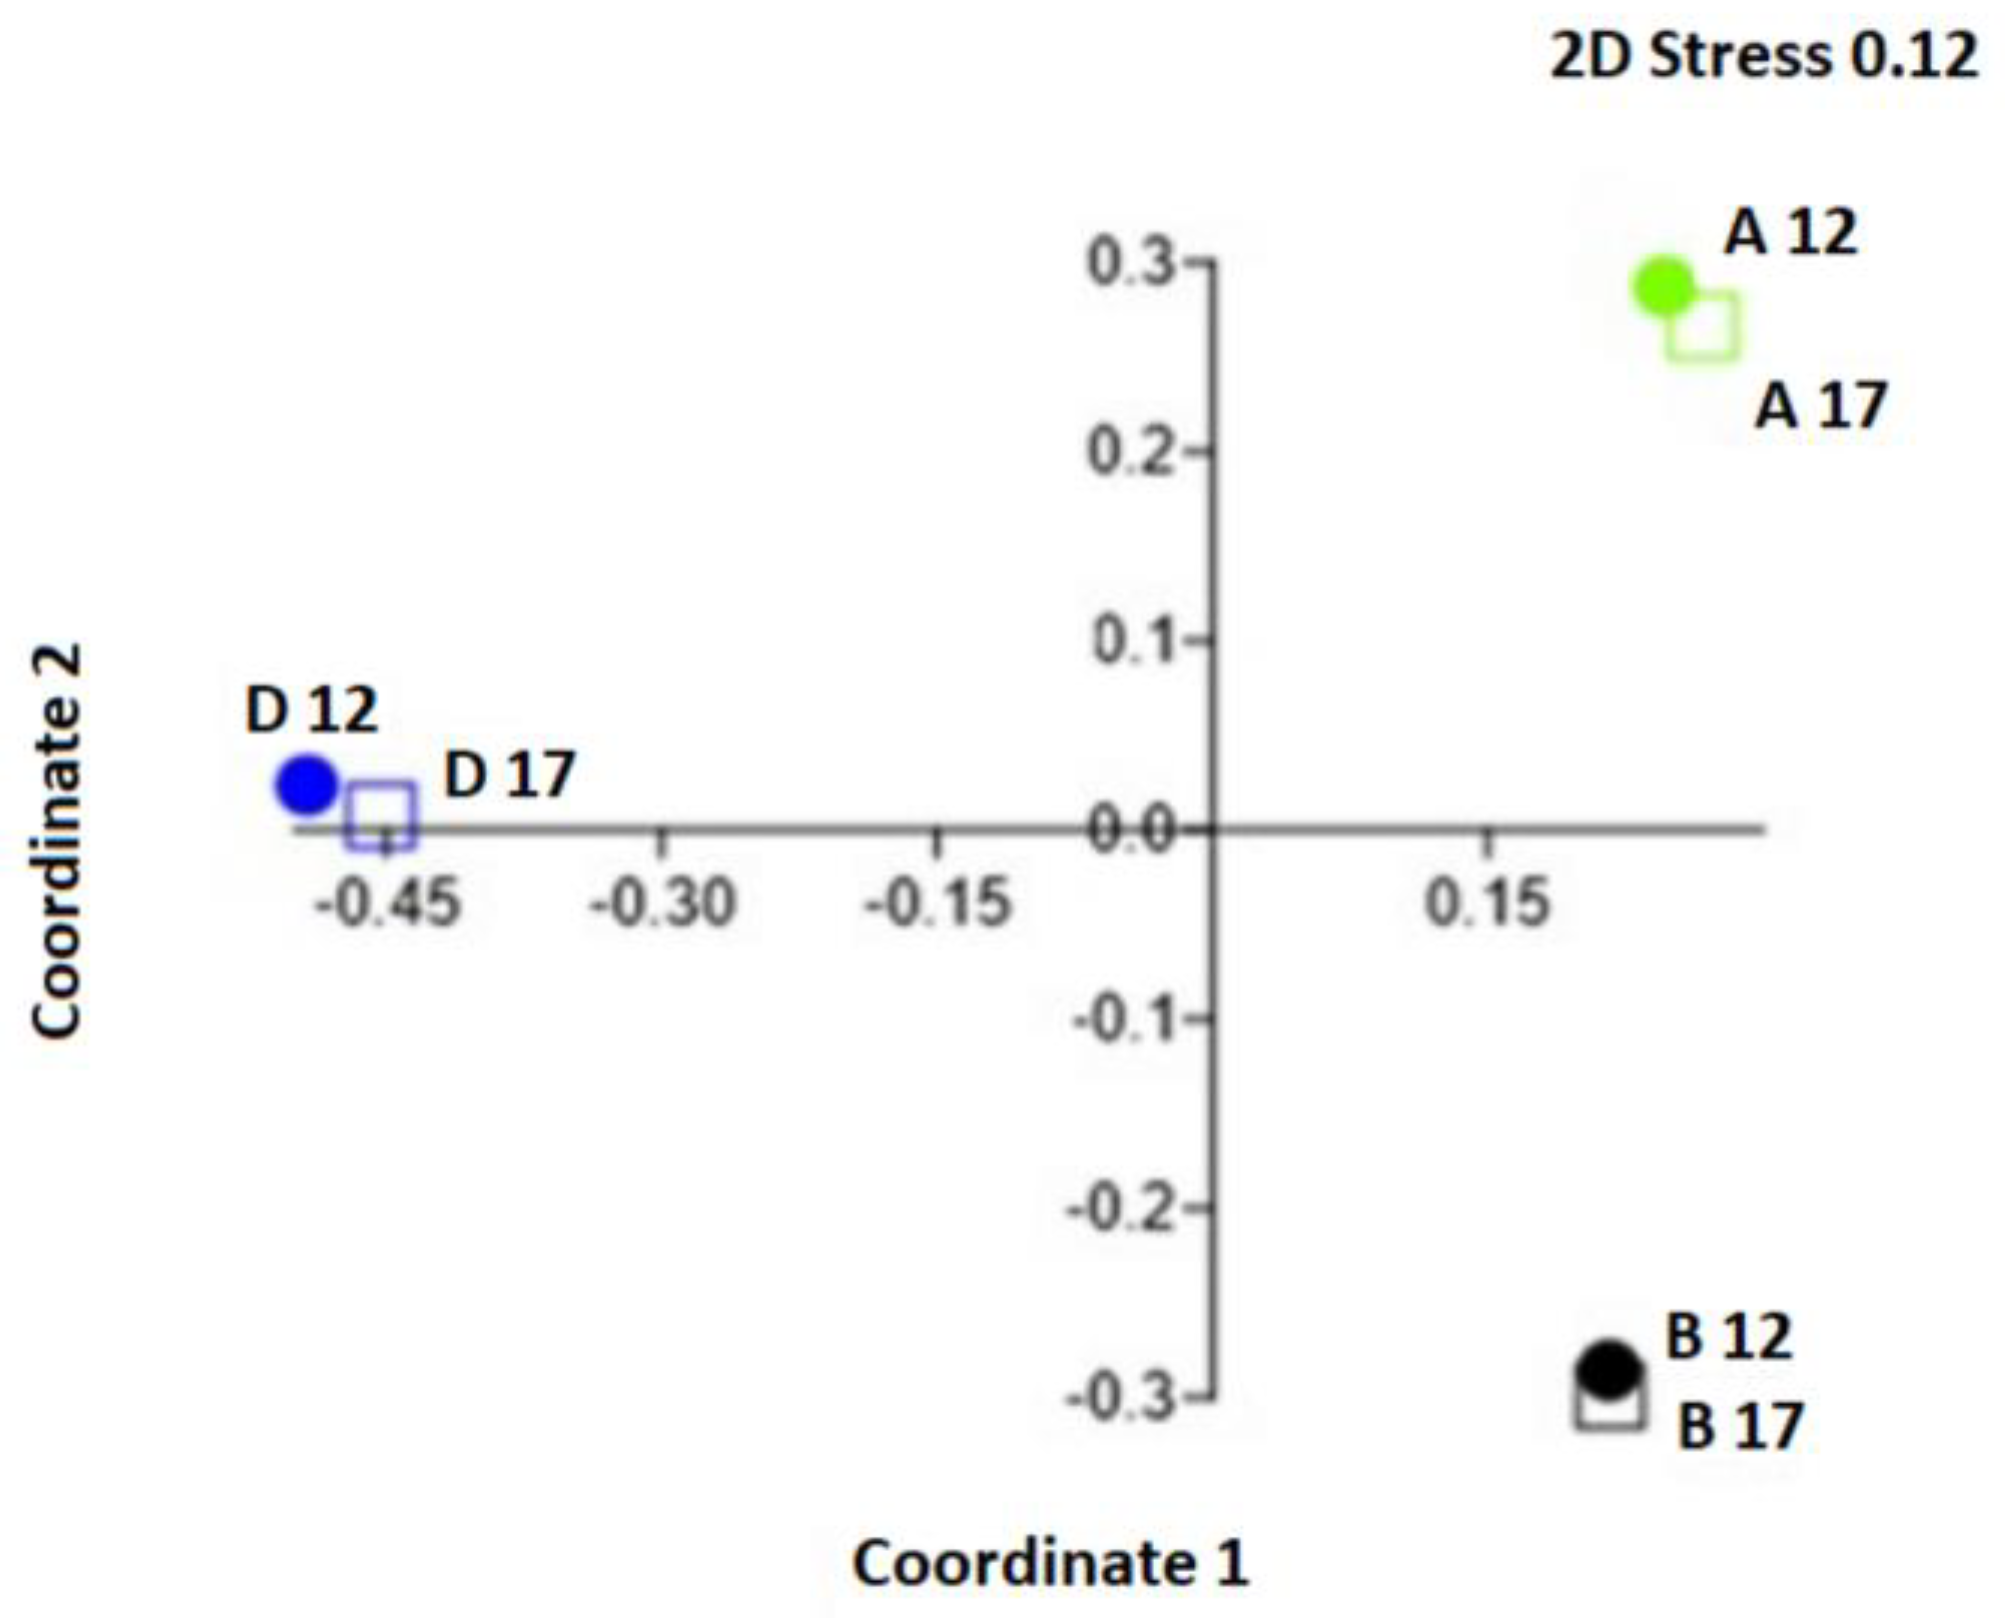
A list of species and individual numbers per site for 2012 and 2017 was converted to the JNCC SACFOR abundance scale (Table 1). This conversion allowed for an industry-recognised interpretation of density of individuals per species per site. The SACFOR data were converted to a Bray-Curtis similarity coefficient (to measure the dissimilarity between the survey sites) using Past v. 3.24 [29] to construct a similarity matrix from the fourth-root transformed densities of species numbers for site and year. This matrix was then subjected to non-metric multidimensional scaling (nMDS) ordination of site and survey year to produce a plot showing all relationships. A ‘stress’ (confidence) value for the plot was produced. When the value is <0.05 it is considered an excellent expression, 0.1 is regarded as a good representation, and values between 0.1 and 0.2 are considered useful [30]. Similarity percentage (SIMPER) analysis was then employed to determine specific phylum densities responsible for differences within the average Bray–Curtis coefficients between sites. Essentially, this procedure computes the average dissimilarity between all pairs within the intergroup locations, and then breaks down the average into separate contributions from each phylum related to survey site and year [30].
Changes in species diversity within each community structure during the five-year period were analysed using CPCe software, which calculated the Shannon Diversity Index (SDI) for each quadrat, transect and site.
PERMANOVA analysis using Past v.3.24 was employed to test the variables with multiple permutations to avoid possible biases between grouped data and identify if any significant changes were present in the total number of individual species per phylum, site and survey year. This could determine if the visual differences portrayed by the CPCe were statistically significant indicators of benthic community change between site and year.

3. Results

A typical assemblage of sessile (adhered to substrate), vagile (moving within quadrat/crawling) and mobile (free-swimming) species associated with substrate type was identified at the three survey locations, with a total of 33 taxa recorded, of which none were invasive (Table 2). Site A recorded the highest number of species among the 3 sites, with 27 identified in 2017. This represented an increase of 11; however, 8 of these were mobile and 1 was an algal frond that had likely broken off from a holdfast located in the higher circalittoral zone. Site B showed no overall change, with a total of 19 species identified in both survey years. A slight increase in abundance of Balanus crenatus from frequent to abundant, and of Alcyonium digitatum from rare to occasional, was noted in 2017 (Table 2). Site D was the location selected for the kite subsea infrastructure due to the low ecological diversity observed in 2012, with a recorded increase of five species in 2017. However, two of the species, Spirobranchus lamarcki and Gibbula cineria, are vagile and a further two, Pholis gunnellus and Cancer pagurus, are mobile. The fifth species was the sessile Dahlia anemone Urticina felina, which was recorded as rare.
No significant changes were recorded in abundance of sessile species or substrate type at any of the sites over the five-year period. Changes in abundance of sessile species were noted at site A, although they were not significant, and Alcyonium digitatum continued to be the characterising species; therefore, the biotope remained as SS.SMx.CMx.Adig. The most abundant, common or frequent characterising sessile species at site B included Spirobrancus triqueter, Flustra foliacea and Lithothamnion sp. Therefore, the biotope code (SS.SMx.CMx.SpiB) remained unchanged. Likewise, no changes were detected at site D with no dominant sessile species recorded, and the code remained substrate-descriptive only: SS.SMx.CMx.
The n-MDS plot of survey site, year and actual number within phyla produced a plot score of 0.12, which is regarded as a useful representation of the 2-dimensional ordination of the data (Figure 3). The separation between the less species-diverse site D and sites A and B is apparent. The closeness between site markers for the survey years reflects the lack of variation in the number of recorded phyla.
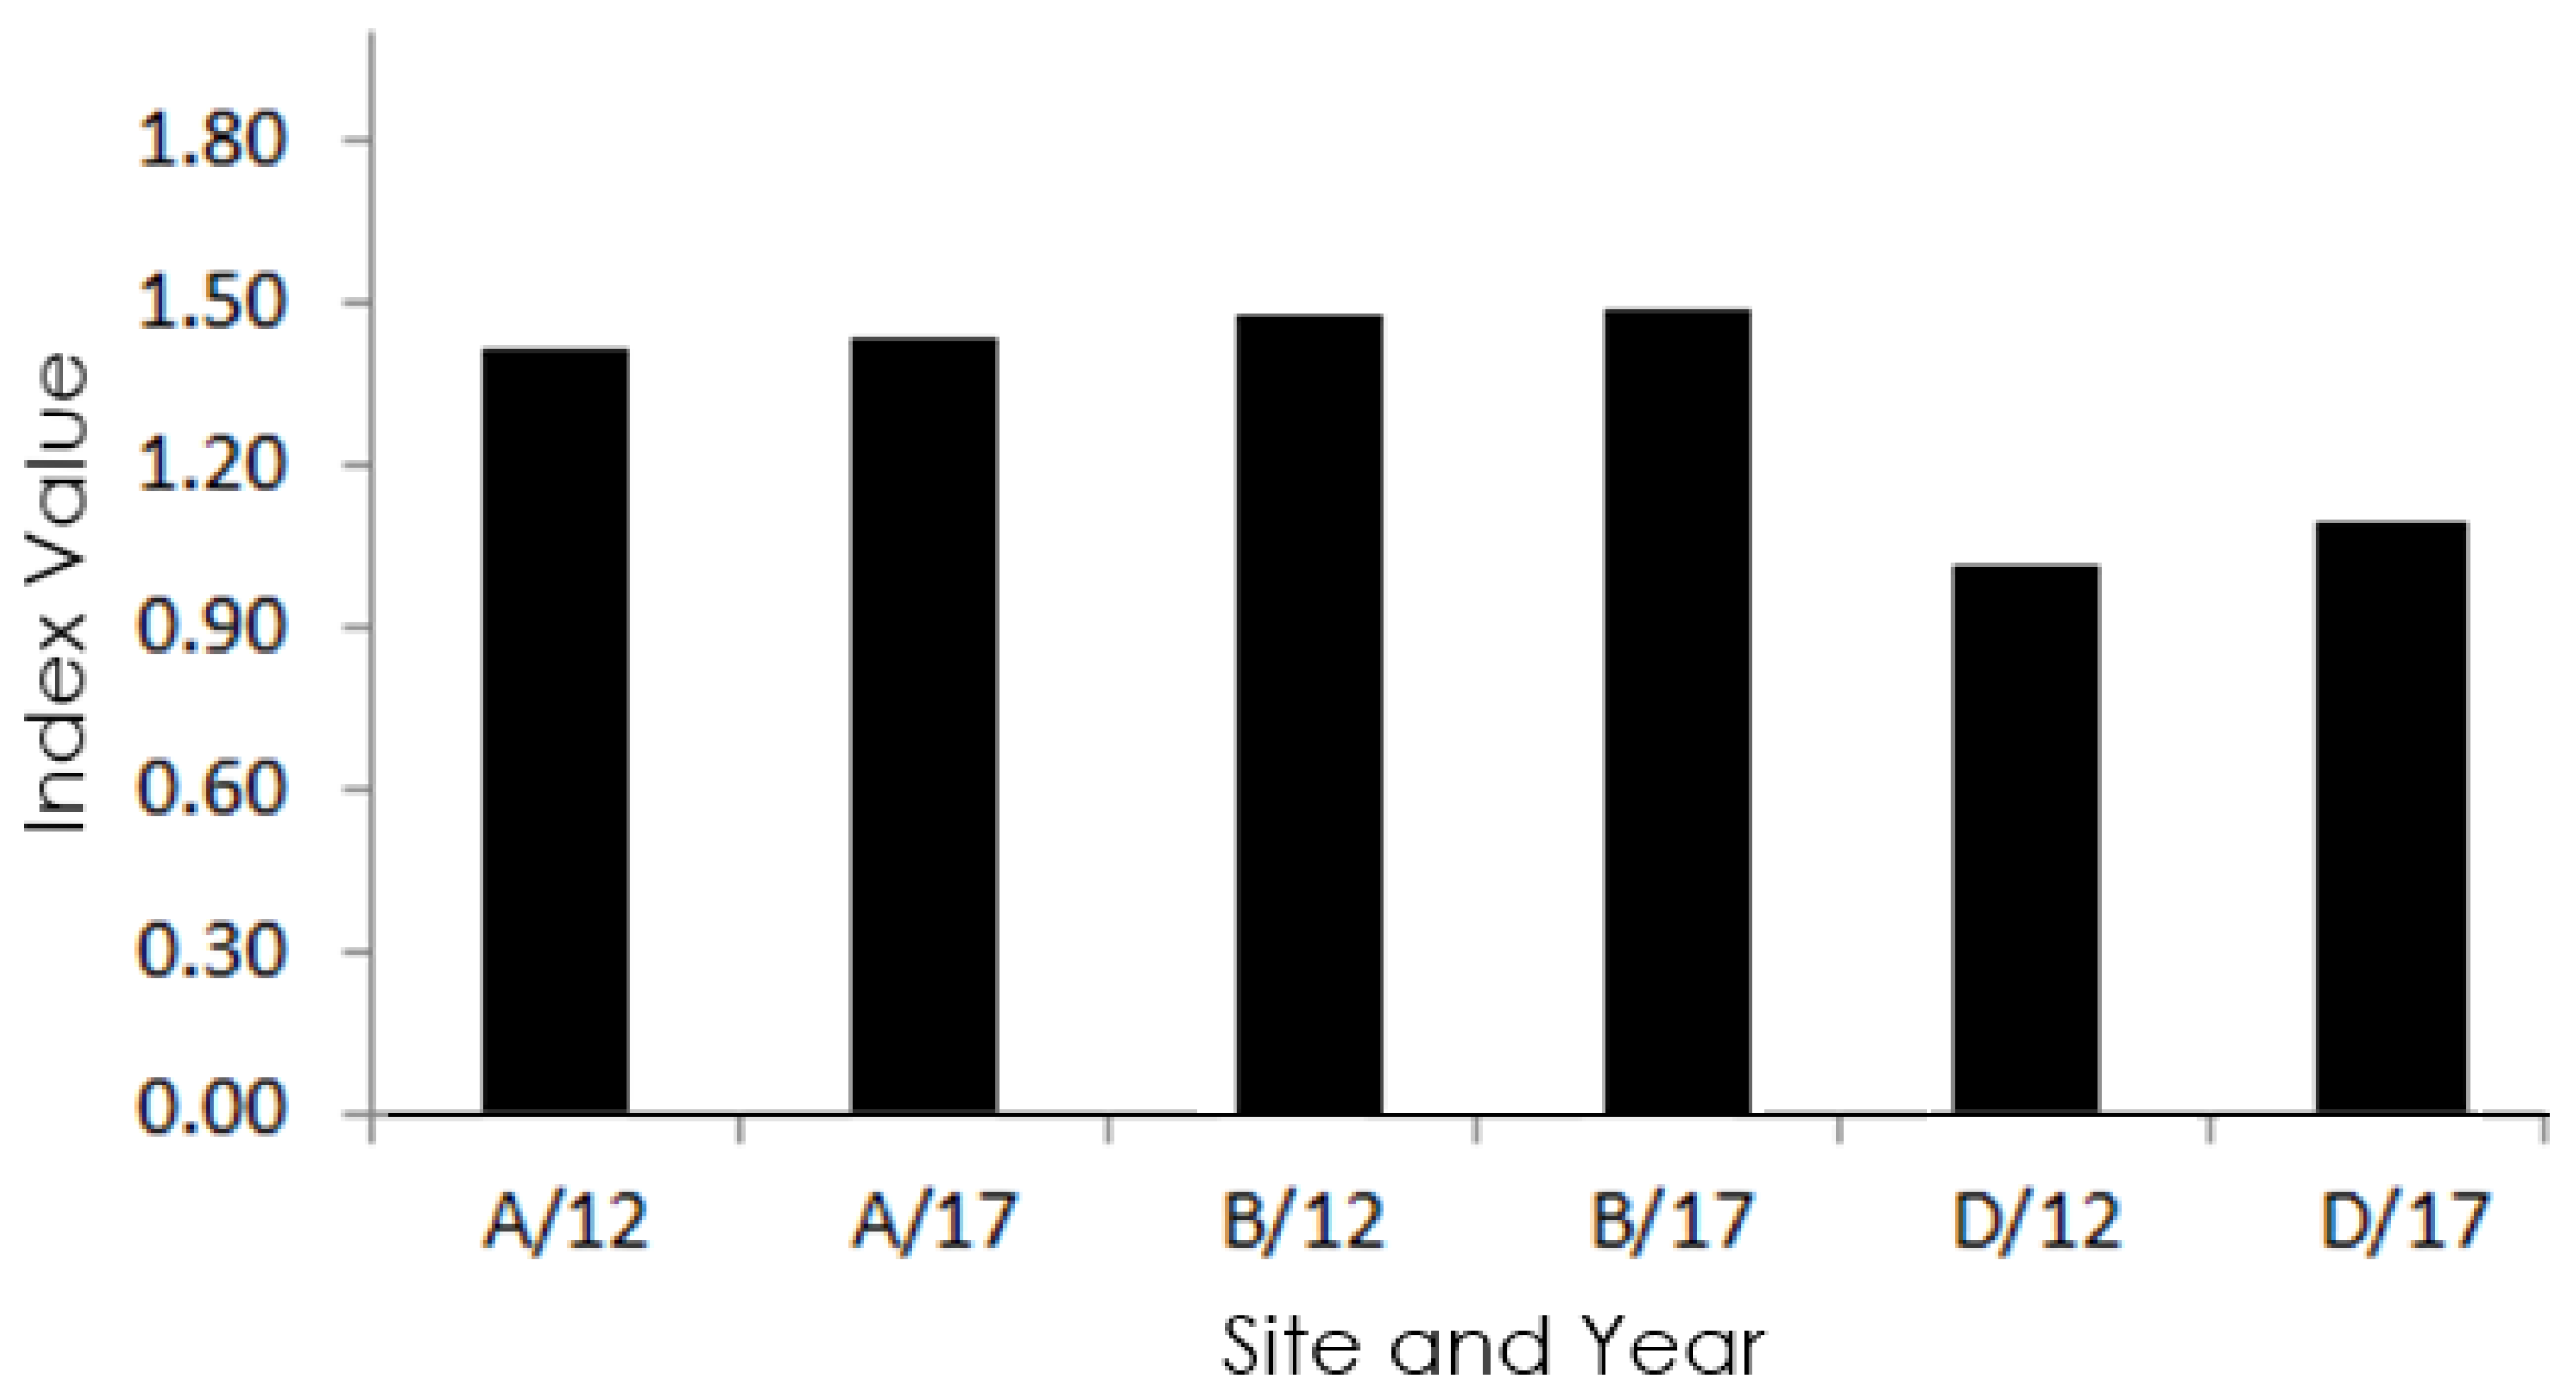
To compare site-specific differences between key species and benthic community, CPCe was used to calculate the Simpson Diversity Index (SDI) for each site and year, which is a combination of a direct estimate of species richness (the total number of species in the community, S) with a measure of species dominance; the lower the index, the less species-diverse the representative community. The resulting SDI at all sites over the five-year period could be considered low, as no individual index was recorded above 1.50 (Figure 4). Sites A and B revealed virtually no change in species diversity over the five years. The kite installation site D, however, revealed a slight increase in species diversity (Figure 4).
PERMANOVA analysis was undertaken, whereby the total number per phylum represented the variation between the fixed factors of site and year. No significant differences were detected for either site, F0.2,7 = 27.91, p = 0.06 or year, F0.2,7 = 0.16, p = 0.7.
SIMPER analysis revealed that the highest cumulative percentage differences between phylum site and year were Algae at 28.74%, which represented the most dissimilar phyla between sites during the survey period, followed by Bryozoa at 24.93% and Porifera at 15.64% (Table 3).

4. Discussion

There are still relatively few peer-reviewed, published articles that can be used to assess the environmental impact of operational tide or wave energy converters in the marine environment. This is primarily because to date there have been few ‘full-scale’ grid-connected operational turbines, such as SeaGen, for the period of time required to detect a change [24,31]. It can be argued that the kite technology has only been tested intermittently in Strangford Lough, and therefore impact would be minimal. However, the site has been subjected to continuous infrastructure and operational activity over a five-year period, similar to that which would be required for a ‘full’ scale device. In effect, the site has been operational since 2012 with the testing of a 3-m wing device, which showed no quantifiable changes in the benthic communities.
Any subsea hard-substrate construction, such as cables and device foundations, has the potential to change the surrounding ecological characteristics significantly [32,33]. The results from the image analysis undertaken over a five-year time span within a sensitive marine environment such as Strangford Lough should offer a degree of reassurance that environmental change can be considered minimal in regard to devices such as the kite. In fact, no barren faunal or flora peripheries or boundaries were recorded that would indicate a dead zone. Ref. [31] concurred with the current findings, showing that benthic community structure in close proximity to the even more environmentally intrusive Sea Gen device appeared resilient to any of its operational actions. Indeed, it has been suggested that the high-energy environments suitable for subsea renewables would require significant changes in hydrodynamic conditions or sedimentation to negatively affect established epifaunal communities within these dynamic habitual niches [31,34,35]. Ref. [31] proposes that in high-energy-flow benthic sites that contain single devices, large-scale impacts are unlikely to occur.
The benign impact of the kite installation was revealed in inter-site image analysis comparisons between 2012 and 2017 detecting no significant differences in species diversity. The study also showed no specific species dominance, which is a good indicator of a stable benthic community and suggests that no detrimental impacts occurred. In fact, the analysis would suggest that the installation has actually augmented the biodiversity at site D over the five years since it has been in situ. It is possible that this observation may be a consequence of differences in substrate and surface feature rugosity. The additional three-dimensional structure created by the kite anchorage platform and cabling contributes to greater habitat complexity, thereby increasing the habitual niches available for a wider range of species at site D [11,32]. The influence of rugosity and additional topographical features on species richness indices has been described previously in relation to biogenic reef complexities. Ref. [36], examining coral reef topography, showed that the more complex a reef surface, the greater the associated species richness. Similar scenarios have been reported for a number of these inadvertent artificial reef structures where it has been shown that their introduction into the benthos has had a positive effect [32], suggesting that these anthropogenically introduced habitats can provide valuable environments for the recruitment and reproduction of species [37].
The importance of long-term environmental monitoring of these assemblies, however, cannot be underestimated. Research from Sweden’s Lysekil wave energy site highlights the importance of capturing successional changes [32]. Long-term monitoring of the site revealed newly established high concentrations of predators and settled suspension-feeding bivalves around its foundations where previously none had existed. As this reported change is a relatively recent occurrence, it is still unclear what effect this will have on the benthic biological functionality of the site, and ultimately whether this artificial reef scenario at Lysekil is beneficial to existing flora and fauna or not [38]. It is therefore recommended that the environmental survey of the kite site is continued for a further 10 years. This information would be extremely beneficial to any similar projects in the future, as a 15-year successional colonisation dataset could be used as a phased monitoring baseline of predicted environmental impacts for other potential marine renewable sites.

5. Conclusions

In conclusion, no impact on benthic communities has been detected owing to the operation and deployment of the infrastructure associated with the kite at the Minesto site. There were also no changes detected at the two control sites. If anything, a trend towards an increase in biodiversity was noted.

Author Contributions

Conceptualisation, D.S. and L.K.; methodology, D.S. and L.K.; formal analysis, D.S.; writing—original draft preparation, review and editing, D.S. and L.K.; funding acquisition, L.K. All authors have read and agreed to the published version of the manuscript.

Funding

This research was funded by European Union’s Horizon 2020, grant number 654438.

Institutional Review Board Statement

Not applicable.

Data Availability Statement

Data available upon request.

Acknowledgments

The authors would like to thank Emma Healey and Cuan Marine Services for their assistance in the field.

Conflicts of Interest

The authors declare no conflict of interest.

References

  1. IPCC. 2018: Global Warming of 1.5 °C. An IPCC Special Report on the Impacts of Global Warming of 1.5 °C Above Pre-Industrial Levels and Related Global Greenhouse Gas Emission Pathways, in the Context of Strengthening the Global Response to the Threat of Climate Change, Sustainable Development, and Efforts to Eradicate Poverty; Masson-Delmotte, V., Zhai, P., Pörtner, H.-O., Roberts, D., Skea, J., Shukla, P.R., Pirani, A., Moufouma-Okia, W., Péan, C., Pidcock, R., et al., Eds.; Cambridge University Press: Cambridge, UK; New York, NY, USA, 2018; 616p. [Google Scholar] [CrossRef]
  2. Rosenberg, R. Eutrophication—The future marine coastal nuisance? Mar. Pollut. Bull. 1985, 16, 227–231. [Google Scholar] [CrossRef]
  3. Williams, R.; Wright, A.; Ashe, E.; Blight, L.; Bruintjes, R.; Canessa, R.; Clark, C.; Cullis-Suzuki, S.; Dakin, D.; Erbe, C.; et al. Impacts of anthropogenic noise on marine life: Publication patterns, new discoveries, and future directions in research and management. Ocean Coast. Manag. 2015, 115, 17–24. [Google Scholar] [CrossRef]
  4. Pine, M.K.; Schmitt, P.; Culloch, R.M.; Lieber, L.; Kregting, L.T. Providing ecological context to anthropogenic subsea noise: Assessing listening space reductions of marine mammals from tidal energy devices. Renew. Sustain. Energy Rev. 2018, 103, 49–57. [Google Scholar] [CrossRef]
  5. Gill, A.B. Offshore renewable energy: Ecological implications of generating electricity in the coastal zone. J. Appl. Ecol. 2005, 42, 605–615. [Google Scholar] [CrossRef]
  6. Segura, E.; Morales, R.; Somolinos, J. A strategic analysis of tidal current energy conversion systems in the European Union. Appl. Energy 2018, 212, 527–551. [Google Scholar] [CrossRef]
  7. Kregting, L.; Elsaesser, B.; Kennedy, R.; Smyth, D.; O’carroll, J.; Savidge, G. Do Changes in Current Flow as a Result of Arrays of Tidal Turbines Have an Effect on Benthic Communities? PLoS ONE 2016, 11, e0161279. [Google Scholar] [CrossRef]
  8. Connell, S.; Glasby, T. Do urban structures influence local abundance and diversity of subtidal epibiota? A case study from Sydney Harbour, Australia. Mar. Environ. Res. 1999, 47, 373–387. [Google Scholar] [CrossRef]
  9. Causon, P.D.; Gill, A.B. Linking ecosystem services with epibenthic biodiversity change following installation of offshore wind farms. Environ. Sci. Policy 2018, 89, 340–347. [Google Scholar] [CrossRef]
  10. Raoux, A.; Robin, I.; Pezy, J.-P.; Bennis, A.-C.; Dauvin, J.-C. Multi-Disciplinary and Multi-Scale Assessment of Marine Renewable Energy Structure in a Tidal System. J. Energy Power Technol. 2021, 3, 16. [Google Scholar] [CrossRef]
  11. Langhamer, O. Artificial Reef Effect in relation to Offshore Renewable Energy Conversion: State of the Art. Sci. World J. 2012, 2012, 386713. [Google Scholar] [CrossRef]
  12. Koschier, D.; Bender, J.; Solenthaler, B.; Teschner, M. Smoothed particle hydrodynamics techniques for the physics based simulation of fluids and solids. arXiv 2020, arXiv:2009.06944. [Google Scholar] [CrossRef]
  13. Ashley, M.; Mangi, S.; Rodwell, L. The potential of offshore windfarms to act as marine protected areas—A systematic review of current evidence. Mar. Policy 2014, 45, 301–309. [Google Scholar] [CrossRef]
  14. Molnar, J.L.; Gamboa, R.L.; Revenga, C.; Spalding, M.D. Assessing the global threat of invasive species to marine biodiversity. Front. Ecol. Environ. 2008, 6, 485–492. [Google Scholar] [CrossRef]
  15. Sorte, C.J.B.; Williams, S.L.; Zerebecki, R.A. Ocean warming increases threat of invasive species in a marine fouling community. Ecology 2010, 91, 2198–2204. [Google Scholar] [CrossRef]
  16. Bulleri, F.; Airoldi, L. Artificial marine structures facilitate the spread of a non-indigenous green alga, Codium fragile ssp. tomentosoides, in the north Adriatic Sea. J. Appl. Ecol. 2005, 42, 1063–1072. [Google Scholar] [CrossRef]
  17. Glasby, T.M.; Connell, S.; Holloway, M.G.; Hewitt, C. Nonindigenous biota on artificial structures: Could habitat creation facilitate biological invasions? Mar. Biol. 2006, 151, 887–895. [Google Scholar] [CrossRef]
  18. Zambrano, C. Lessons learned from subsea tidal kite quarter scale ocean trials. In WTE16—Second Workshop on Wave and Tidal Energy; Valdivia, Chile, 2016. [Google Scholar]
  19. Guy, C.; Smyth, D.; Roberts, D. The importance of population density and inter-individual distance in conserving the European oyster Ostrea edulis. J. Mar. Biol. Assoc. UK 2018, 99, 587–593. [Google Scholar] [CrossRef]
  20. Smyth, D.; Mahon, A.M.; Roberts, D.; Kregting, L. Settlement of Ostrea edulis is determined by the availability of hard substrata rather than by its nature: Implications for stock recovery and restoration of the European oyster. Aquat. Conserv. Mar. Freshw. Ecosyst. 2018, 28, 662–671. [Google Scholar] [CrossRef]
  21. Smyth, D. The Conservation of Habitats and Species Regulations 2010 Legislation; Government UK: London, UK, 2010; pp. 35–39. [Google Scholar]
  22. Pikesley, S.K.; Solandt, J.-L.; Trundle, C.; Witt, M.J. Benefits beyond ‘features’: Cooperative monitoring highlights MPA value for enhanced seabed integrity. Mar. Policy 2021, 134, 104801. [Google Scholar] [CrossRef]
  23. Keenan, R.J.; Kimmins, J.P. The ecological effects of clear-cutting. Environ. Rev. 1993, 1, 121–144. [Google Scholar] [CrossRef]
  24. Hemery, L.G. Changes in Benthic and Pelagic Habitats Caused by Marine Renewable Energy Devices. In 2020 State of the Science Report; Pacific Northwest National Lab.: Richland, WA, USA, 2020. [Google Scholar] [CrossRef]
  25. Carleton, J.H.; Done, T.J. Quantitative video sampling of coral reef benthos: Large-scale application. Coral Reefs 1995, 14, 35–46. [Google Scholar] [CrossRef]
  26. Kohler, K.E.; Gill, S.M. Coral Point Count with Excel extensions (CPCe): A Visual Basic program for the determination of coral and substrate coverage using random point count methodology. Comput. Geosci. 2006, 32, 1259–1269. [Google Scholar] [CrossRef]
  27. Frederiksen, M.; Mavor, R.; Wanless, S. Seabirds as environmental indicators: The advantages of combining data sets. Mar. Ecol. Prog. Ser. 2007, 352, 205–211. [Google Scholar] [CrossRef]
  28. Bento, N.L.; Ferraz, G.A.E.S.; Barata, R.A.P.; Santana, L.S.; Barbosa, B.D.S.; Conti, L.; Becciolini, V.; Rossi, G. Overlap influence in images obtained by an unmanned aerial vehicle on a digital terrain model of altimetric precision. Eur. J. Remote Sens. 2022, 55, 263–276. [Google Scholar] [CrossRef]
  29. Hammer, Ø.; Harper, D.A.T.; Ryan, P.D. Paleontological Statistics, version 1; Palaeontologia Electronica: online, 2009; p. 92. [Google Scholar]
  30. Clarke, K.R.; Warwick, R.M. Change in Marine Communities. An Approach to Statistical Analysis and Interpretation; Primer-E Ltd.: Plymouth, UK, 2001; Volume 2, pp. 1–68. [Google Scholar]
  31. O’carroll, J.; Kennedy, R.; Savidge, G. Identifying relevant scales of variability for monitoring epifaunal reef communities at a tidal energy extraction site. Ecol. Indic. 2017, 73, 388–397. [Google Scholar] [CrossRef]
  32. Bender, A.; Langhamer, O.; Sundberg, J. Colonisation of wave power foundations by mobile mega- and macrofauna—A 12 year study. Mar. Environ. Res. 2020, 161, 105053. [Google Scholar] [CrossRef] [PubMed]
  33. Taormina, B.; Percheron, A.; Marzloff, M.P.; Caisey, X.; Quillien, N.; Lejart, M.; Desroy, N.; Dugornay, O.; Tancray, A.; Carlier, A. Succession in epibenthic communities on artificial reefs associated with marine renewable energy facilities within a tide-swept environment. ICES J. Mar. Sci. 2020, 77, 2656–2668. [Google Scholar] [CrossRef]
  34. Shields, M.A.; Woolf, D.K.; Grist, E.P.; Kerr, S.A.; Jackson, A.; Harris, R.E.; Bell, M.C.; Beharie, R.; Want, A.; Osalusi, E.; et al. Marine renewable energy: The ecological implications of altering the hydrodynamics of the marine environment. Ocean Coast. Manag. 2011, 54, 2–9. [Google Scholar] [CrossRef]
  35. Miller, R.G.; Hutchison, Z.L.; Macleod, A.K.; Burrows, M.T.; Cook, E.J.; Last, K.S.; Wilson, B. Marine renewable energy development: Assessing the Benthic Footprint at multiple scales. Front. Ecol. Environ. 2013, 11, 433–440. [Google Scholar] [CrossRef]
  36. Newman, S.P.; Meesters, E.H.; Dryden, C.S.; Williams, S.M.; Sanchez, C.; Mumby, P.J.; Polunin, N.V.C. Reef flattening effects on total richness and species responses in the Caribbean. J. Anim. Ecol. 2015, 84, 1678–1689. [Google Scholar] [CrossRef]
  37. Bernstein, B.B. Decision framework for platform decommissioning in California. Integr. Environ. Assess. Manag. 2015, 11, 542–553. [Google Scholar] [CrossRef] [PubMed]
  38. Leijon, M.; Boström, C.; Danielsson, O.; Gustafsson, S.; Haikonen, K.; Langhamer, O.; Strömstedt, E.; Stålberg, M.; Sundberg, J.; Svensson, O.; et al. Wave Energy from the North Sea: Experiences from the Lysekil Research Site. Surv. Geophys. 2008, 29, 221–240. [Google Scholar] [CrossRef]
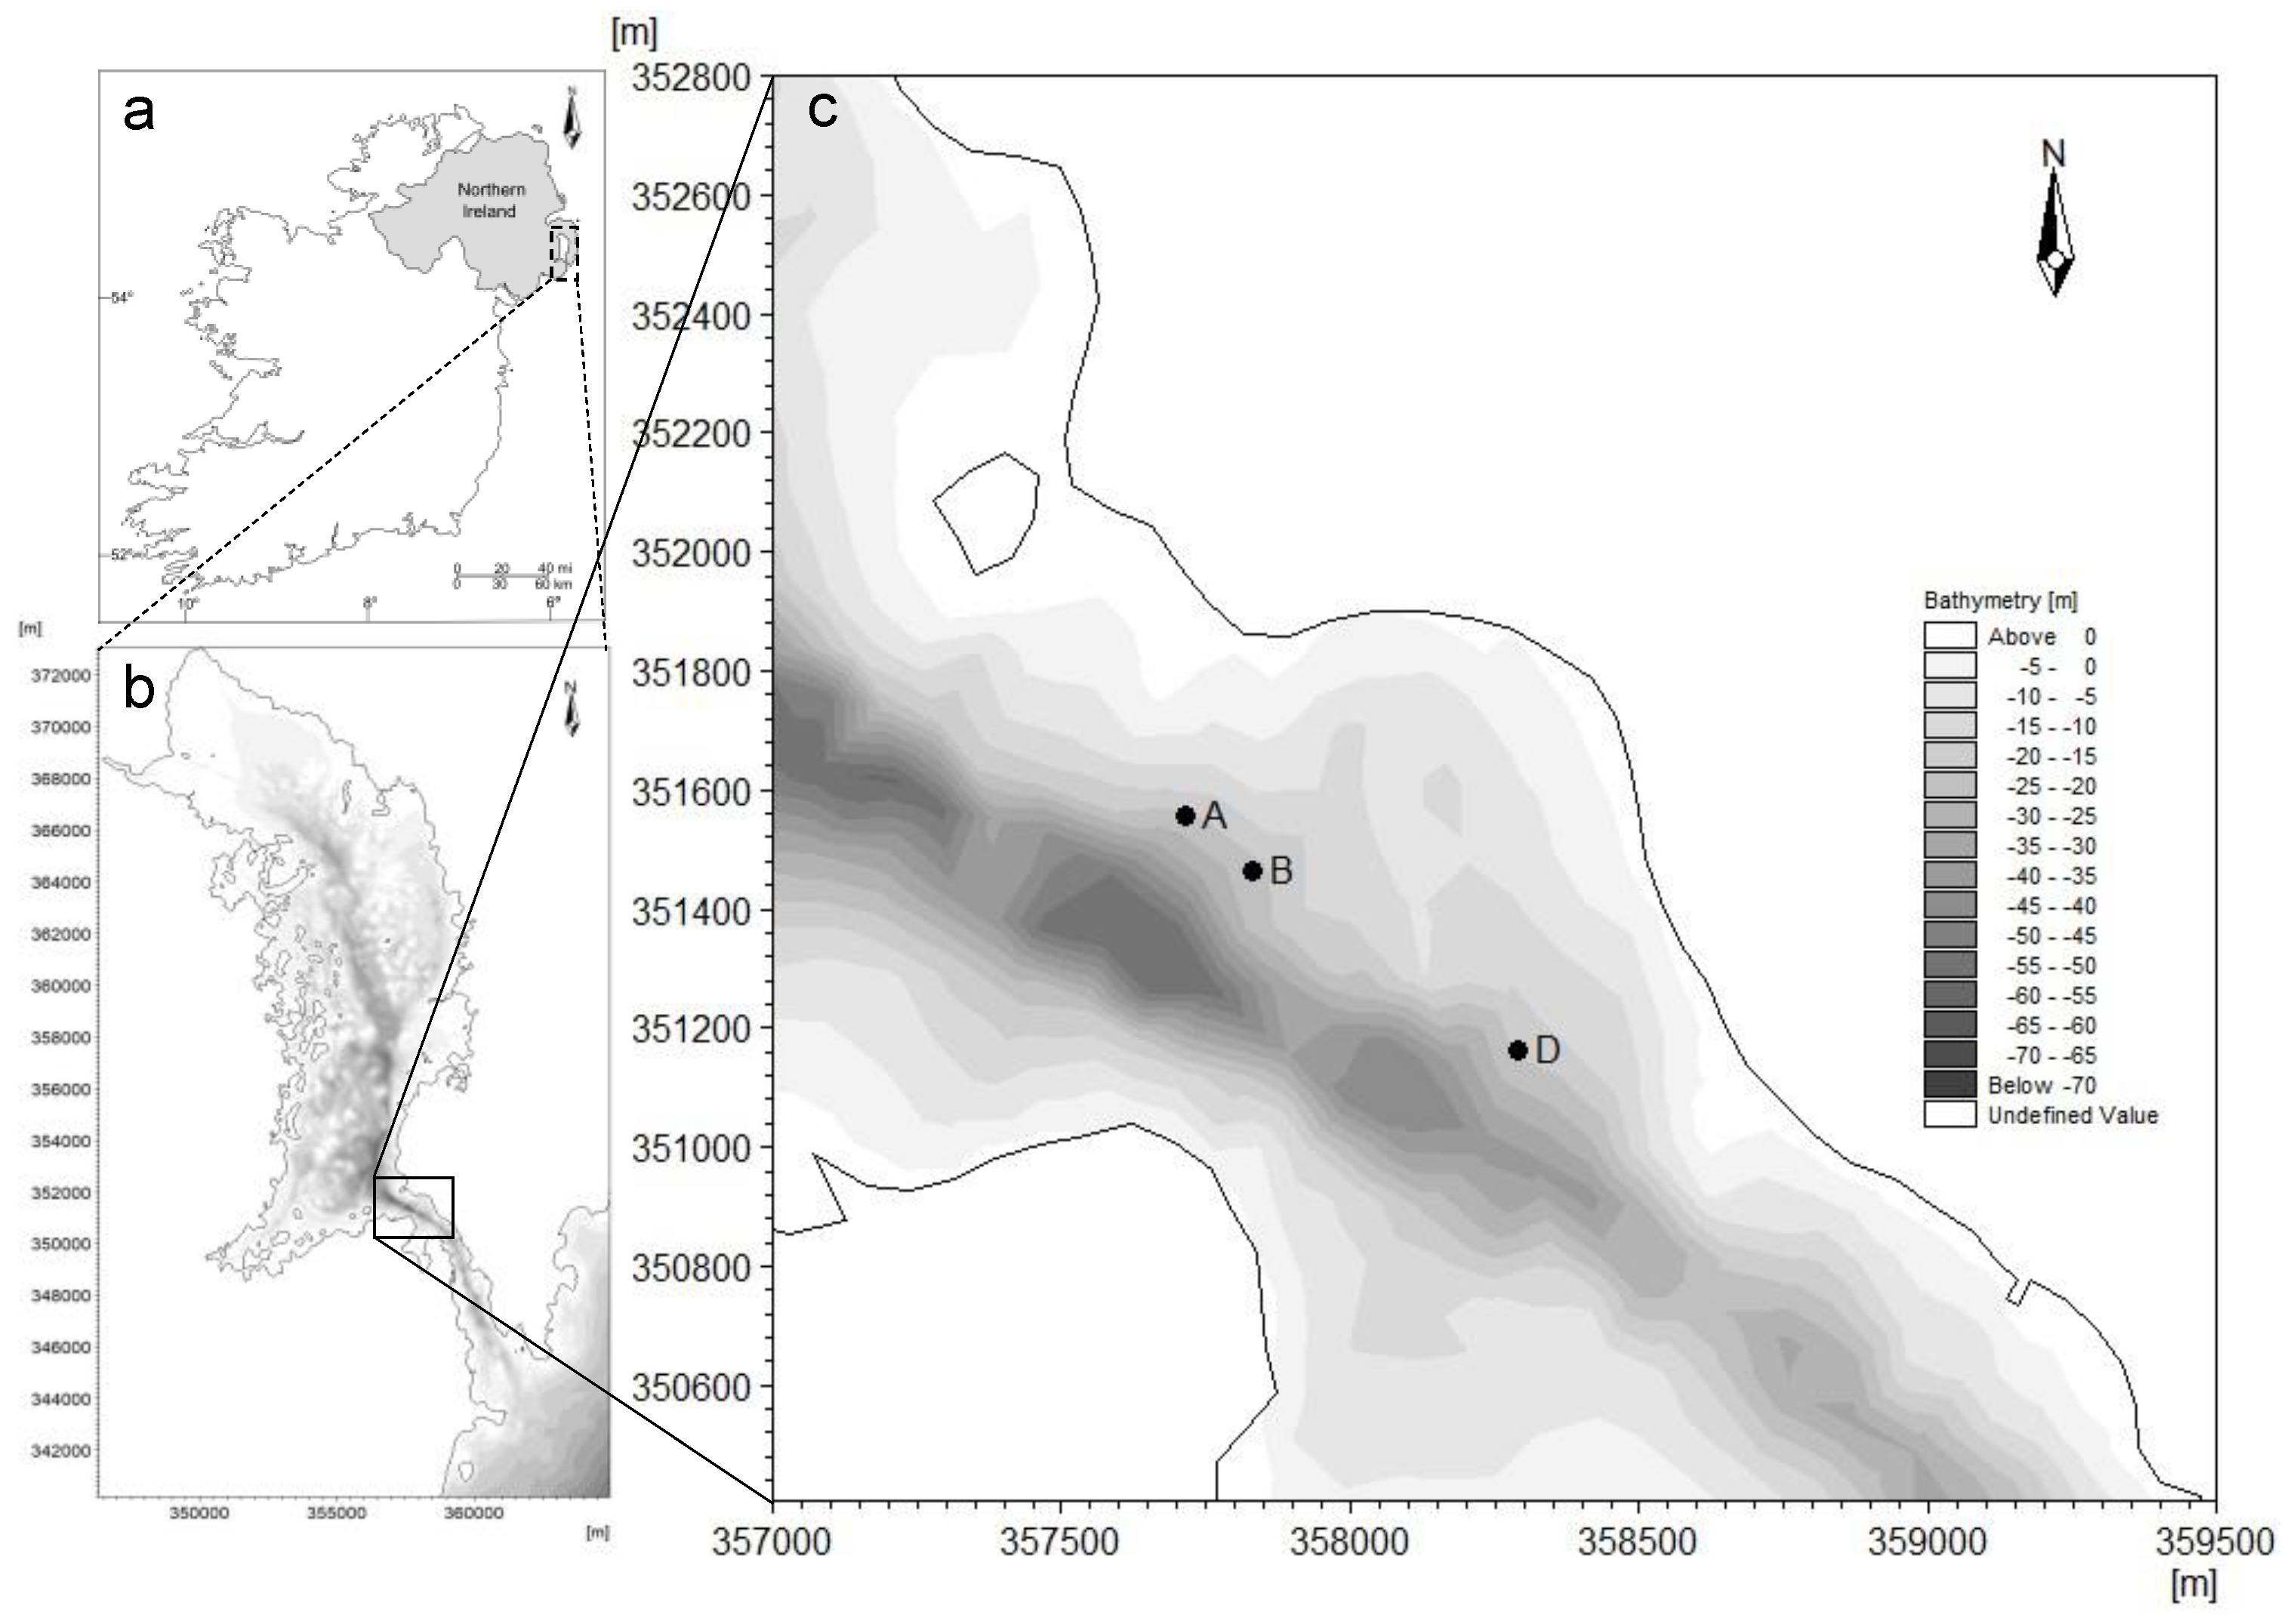
Figure 1. Location of survey sites: (a) Northern Ireland on the Island of Ireland, (b) Strangford Lough, and (c) survey location sites A, B and D within the Narrows. Location D is near the Minesto subsea operation.
Jmse 11 01061 g001
Figure 2. Cardinal compass survey rose showing where each quadrat was placed in relation to the direction of travel at sites A, B and D.
Jmse 11 01061 g002
Figure 3. Non-metric Multi-Dimensional Scaled (nMDS) plot of species abundance portrayed in a Bray-Curtis coefficient ordination for site (A, B and D) and year (2012 and 2017).
Jmse 11 01061 g003
Figure 4. Shannon Diversity Index comparison between all three survey sites in 2012 (A/12, B/12 and D/12) and 2017 (A/17, B/17 and D17), before and after kite deployment. (Sites A and B are the control sites and site D is the kite installation site).
Jmse 11 01061 g004
Table 1. Percentage cover and density categories used when allocating the marine benthic flora and fauna species to the JNCC SACFOR abundance scale for the biological surveys.
% CoverDensitySACFOR Scale
>80%>10,000/m2S = Superabundant
40–79%1000–9999/m2A = Abundant
20–39%100–999/m2C = Common
10–19%10–99/m2F = Frequent
5–9%1–9/m2O = Occasional
1–5%1–9/10 m2R = Rare
Table 2. Species list and abundance presented using the JNCC’s SACFOR abundance scale for pooled data of (n = 32) quadrats for each site (A, B and D) and year (2012 and 2017).
Site A 2012Site A 2017Site B 2012Site B 2017Site D 2012Site D 2017
Phylum
ANNELIDA
Spirobis spirobisRRRR--
Spirobranchus lamarcki-R-R-R
Spirobranchus triqueterROAARR
ARTHROPODA
Balanus crenatus-FFA--
Cancer pagurusR-R--O
Liocarcinus puber-R----
BRYOZOA
Alcyonidium diaphanumRROR--
Alcyonium digitatumCAROFF
Flustra foliacea-CFF--
CHORDATA
Ctenolabrus rupestris-RR---
Dendrodoa grossularia---R--
Pholis gunnellus-R---R
CNIDARIA
Actinothoe sphyrodeta-R----
Corynactis viridisRR----
Sagartia elegansRCFRRR
Tubularia indivisaRORRRO
Urticina felinaRO---R
ECHINODERMATA
Asterias rubensO-OR--
Echinus esculentus-RRRRO
Henricia oculata--RR--
Marthasterias glacialis-R-R--
Solaster popposus-RRORF
MOLLUSCA
Calliostoma zizyphinum-R----
Gibbula cineraria-----R
Nucella lapillus-R----
OCHROPHYTA
Laminaria hyperborea-R----
PORIFERA
Cliona celata--RR--
Esperiopsis fucorumRRR---
Halichondria paniceaOFOOOO
Myxilla incrustansRR----
Myxilla fimbriataRRR---
Pachymatisma johnstoniaRR-R--
RHODOPHYTA
Lithothamnion sp. OOAAOR
S = Superabundant, A = Abundant, C = Common, F = Frequent, O = Occasional, R = Rare.
Table 3. SIMPER analysis of taxa that contributed most to variations in species diversity between sites (A, B and D) and survey year (2012 and 2017).
TaxonAgilityAv. Dissim.Contrib. %Cumul. %
MacroalgaeSessile28.5930.528.74
BryozoaSessile24.826.5824.93
PoriferaSessile15.5617.3715.64
AnnelidaVagile5.816.945.84
CnidariaSessile/Mobile4.895.844.91
ArthropodaMobile6.555.436.57
HydrozoaSessile4.584.984.6
EchinoidVagile3.892.163.9
FishMobile1.020.11.02
MolluscaVagile1.40.051.4
AscidianVagile2.490.042.44
Disclaimer/Publisher’s Note: The statements, opinions and data contained in all publications are solely those of the individual author(s) and contributor(s) and not of MDPI and/or the editor(s). MDPI and/or the editor(s) disclaim responsibility for any injury to people or property resulting from any ideas, methods, instructions or products referred to in the content.