Article

Water Structure in the Utrish Nature Reserve (Black Sea) during 2020–2021 According to Thermistor Chain Data

1
Shirshov Institute of Oceanology RAS, Moscow 117997, Russia
2
Faculty of Geography, Oceanology Department, Lomonosov Moscow State University, Moscow 119991, Russia
3
Hydrometeorological Research Centre, Russian Federation, Moscow 123376, Russia
4
Marine Hydrophysical Institute RAS, Sevastopol 299011, Russia
5
Utrish Nature Reserve, Anapa 353445, Russia
*
Author to whom correspondence should be addressed.
J. Mar. Sci. Eng. 2023, 11(4), 887; https://doi.org/10.3390/jmse11040887
Submission received: 13 February 2023 / Revised: 21 March 2023 / Accepted: 18 April 2023 / Published: 21 April 2023
(This article belongs to the Special Issue Upwelling Systems in a Changing Ocean)

Abstract

:
This paper reports the water temperature structure and associated coastal processes in the NE part of the Black Sea. In situ temperature was measured in the water area of the Utrish Nature Reserve. The thermistor chain was moored in 2020 and included 6–10 temperature sensors with an accuracy of ±0.025 °C and time step of one minute. The seasonal variations in the water temperature, upwelling events, internal waves and diurnal cycle were analyzed. The maximum value of SST (28.6 °C) was registered in the subsurface layer in August 2021; the minimum (7.7 °C) was registered in March 2022. Estimates of the diurnal temperature cycle were obtained according to spectral analysis. Summer months show the diurnal cycle more than 60% of the time, and the cold period shows it less than 10% of the time. Internal waves appeared in thermocline with periods from 5 min to 20 h. The strongest Ekman upwelling was registered in September 2021. The water temperature dropped from 26 °C to 16 °C in 10 h. Additionally, quality assessments of two hydrodynamic models were made. The models showed a good correlation (0.9) with water temperature measurements, but RMSE could reach 1–1.8 °C for subsurface layers. Temperature variability and its characteristics are an important basis for future coastal ecosystem studies in the Utrish.

1. Introduction

Marine ecosystem transformation in the era of climate change and anthropogenic impact is a global problem, especially acute in shelf and inland seas. The Black Sea, with a vast drainage basin, high-intensity coastal use, active shipping and a significant number of acclimatized invasive species, is, nowadays, a vulnerable region. It is especially important to have a set of reference coastal areas located in such regions in order to assess the changes and identify their causes. The only such area on the northeastern coast of the Krasnodar Territory is the Utrish Reserve.
The State Nature Reserve (NR) of Utrish was founded in 2010 in the Krasnodar region of the Russian Federation and covers a significant part of the Abrau peninsula (NR Utrish [1]). NR Utrish includes lands of the forest fund—9911 hectares (87%)—and a section of the Black Sea, with a total area of 1428 hectares (13%), see Figure 1. This NR is one of a few Russian reserves that contains the marine territory of the Black Sea and the only one on the Caucasian coast [2].
The marine part of the NR attracts hundreds of thousands of birds during winter. One of the main migration routes for birds runs along the Utrish coast. The marine part of NR Utrish and its adjacent areas are recognized as an important bird area. Over 350,000 birds, represented by more than 80 species, are found near the coast of the reserve in some years. The biodiversity of phytoplankton and macroalgae is represented by 100 species. The diversity of invertebrates and vertebrates includes about 200 species: 84 fish species (56% of the total ichthyofauna species in the Black Sea); 23 species of decapod crustaceans (more than 65% of total species for the NE Black Sea). All three species of Black Sea cetaceans are found in this area: the Black Sea bottlenose dolphin (Tursiops truncatus ponticus), the common dolphin (Delphinus delphis ponticus) and the harbor porpoise or azovka dolphin (Phocoena phocoena relicta). The average number of cetaceans in the NR aquatoria and adjacent areas of the sea varies from 100 to 1000 individuals [3]. Fish are the main food source for these marine mammals. Over the past three decades, the occurrence of these species in the Black Sea has decreased several times [3,4].
The marine ecosystems of the Utrish NR belong to the coastal marine ecosystems of the North-Eastern Shelf of the Black Sea, characterized by a high mosaic of landscapes due to the bottom sediments, the shape of the relief and the range of depths. These factors determine the wave influence on the bottom, illumination and, as a result, the distribution of dominant macrophyto and macrozoo benthos [5]. There are four main belt communities of loose soils and a rock belt community on the North-Eastern Black Sea coast [4]: “venus sand”, Pitar rudis-Gouldia minima at the muddy sand with shells belt, Parvicardium simile belt and deep water “phaseolina silt”. Only two of three Black Sea well-known belt macrozoobenthic biocenoses were observed in the North-Eastern Black Sea coast: the shallow water “venus sand” and deep water “phaseolina silt” [2]. The boundaries between Pitar-Gouldia and Parvicardium simile biocenoses lie along the seasonal thermocline [6]. A thermocline shift could also lead to a boundary shift between communities.
Although ecosystem research in the NR Utrish has been conducted, little attention has been paid to the continuous study of water characteristics. Water characteristics, including temperature, salinity and nutrient concentration, are the main factors for the phytoplankton, benthic and all coastal ecosystems in general [5,7]. Water temperature is one of the main factors determining the biogeographic distribution and vertical structure of benthos. The temperature regime determines not only the structure of communities but also the metabolism intensity of organisms, that is, the functioning of ecosystems [8]. Temperature regime is one of the factors that regulates the biodiversity and population restoration of rare, protected and commercial species. Changing the temperature regime could lead to the naturalization or elimination of invasive species, number of their populations and, as a result, to a change in the intensity of their impact on local ecosystems, including protected water areas.
Among the processes that have a direct impact on the ecosystem, there are currents, eddies, upwelling, diurnal cycle, etc. Further, we consider the recent studies of these processes in the Black Sea.
The distribution of water characteristics and their seasonal features were studied using satellite [9] and ARGO buoys data [10]. The hydrology in the north-eastern part of the Black Sea has been studied [11,12]. An increase in temperature and salinity in the North-Eastern Black Sea from 2010 to 2020 was shown [12].
The general dynamics patterns in and Rim current of the Black Sea are well known [13,14,15,16]. Mesoscale and sub-mesoscale eddies are often present in the coastal dynamics of the Black Sea [17,18,19]. Climate change in terms of water temperature is also recorded in the Black Sea [20]. The spatial average of the SST warming rate over the entire basin was about 0.65 ± 0.07 °C/decade according to Mohamed et al., 2022 [21]. Other researchers [22] found that SST in the Black Sea changed at +0.052 °C per year from 1982 to 2020.
Upwelling in the Black Sea coastal zones is a fairly common event [23,24,25]. It is generally related to wind forcing. However, most studies are based on satellite data [24,25,26,27], which have low temporal resolution, and only the top layer is visible. In situ measurements of upwelling in the Black Sea were reported [28,29]. In the Black Sea, the coastal current could be driven by mesoscale or submesoscale anticyclonic eddies, which are not directly related to wind forcing [18,19]. Upwelling modelling in the Black Sea is presented in Divinskiy et al., 2017 [30].
Some interesting results were obtained at the hydrophysical polygon “Gelendzhik” Shirshov Institute of oceanology RAS [31]. Complex sonde Aqualog and thermistor chains were used for in situ measurements [32,33]. Thermistor chains were installed at different depths and provided data about seasonal temperature variations [33,34]. Much more complete information about the spatiotemporal variability in the water temperature was obtained by using a cluster of three thermistor chains [34]. Other environmental monitoring methods were also used at the “Gelendzhik” polygon [35,36,37,38]. Thermistor chain data in the Black Sea are quite rare. For example, Tolstosheev [39] used a thermistor chain, which was installed on the Katsiveli platform (depth ~ 30 m). The thermistor chain worked episodically from 2012 to 2019. Based on these data, the estimates of a seasonal cycle, synoptic variability and upwelling were represented. The thermistor chains are also effectively used in the Black Sea for internal waves studies [40,41].
Mathematical modeling data are often used for hydrophysical studies in the Black Sea [42,43,44]. There are various models, including diagnostic and operational [45,46,47,48,49]. The Marine Copernicus provides regular and systematic information about the physical state of the Black Sea [50,51]. This information, however, is mainly satellite and simulation data, which do not work well in the absence of real data assimilation, especially in the coastal zone.
The long-term tendencies of the Black Sea water parameters based on numerical modeling with a spatial resolution 3–8 km are presented here [51,52]. There are several model implementations with a high resolution 1–2 km [53,54,55]. However, the model results should be further validated with all available observations. Accuracy depends on many factors, such as selected regions and depths, source of observations, validation metrics, co-location method, etc. [56,57].
Our study focuses on the water thermal structure and coastal processes in the NR Utrish. Based on the water temperature data from 2020–2021, we reveal the seasonal and diurnal variability in the coastal waters. After the general analysis of these data, the upwelling events are highlighted and discussed. Lastly, we compared the in situ measured data, and the hydrodynamic models of the Black Sea were made. We held continuous measurements of the water temperature in NR Utrish for the first time. Such information could be a basis for all future biological investigations.

2. Materials and Methods

The current study includes a description of the water thermal structure according to continuous measurements. In situ measurements allow for analysis of coastal processes. There is also a comparison of the temperature with several hydrodynamic models of the Black Sea to determine the limitations of their use in Utrish marine ecosystem studies.

2.1. In Situ Thermistor Chain Data

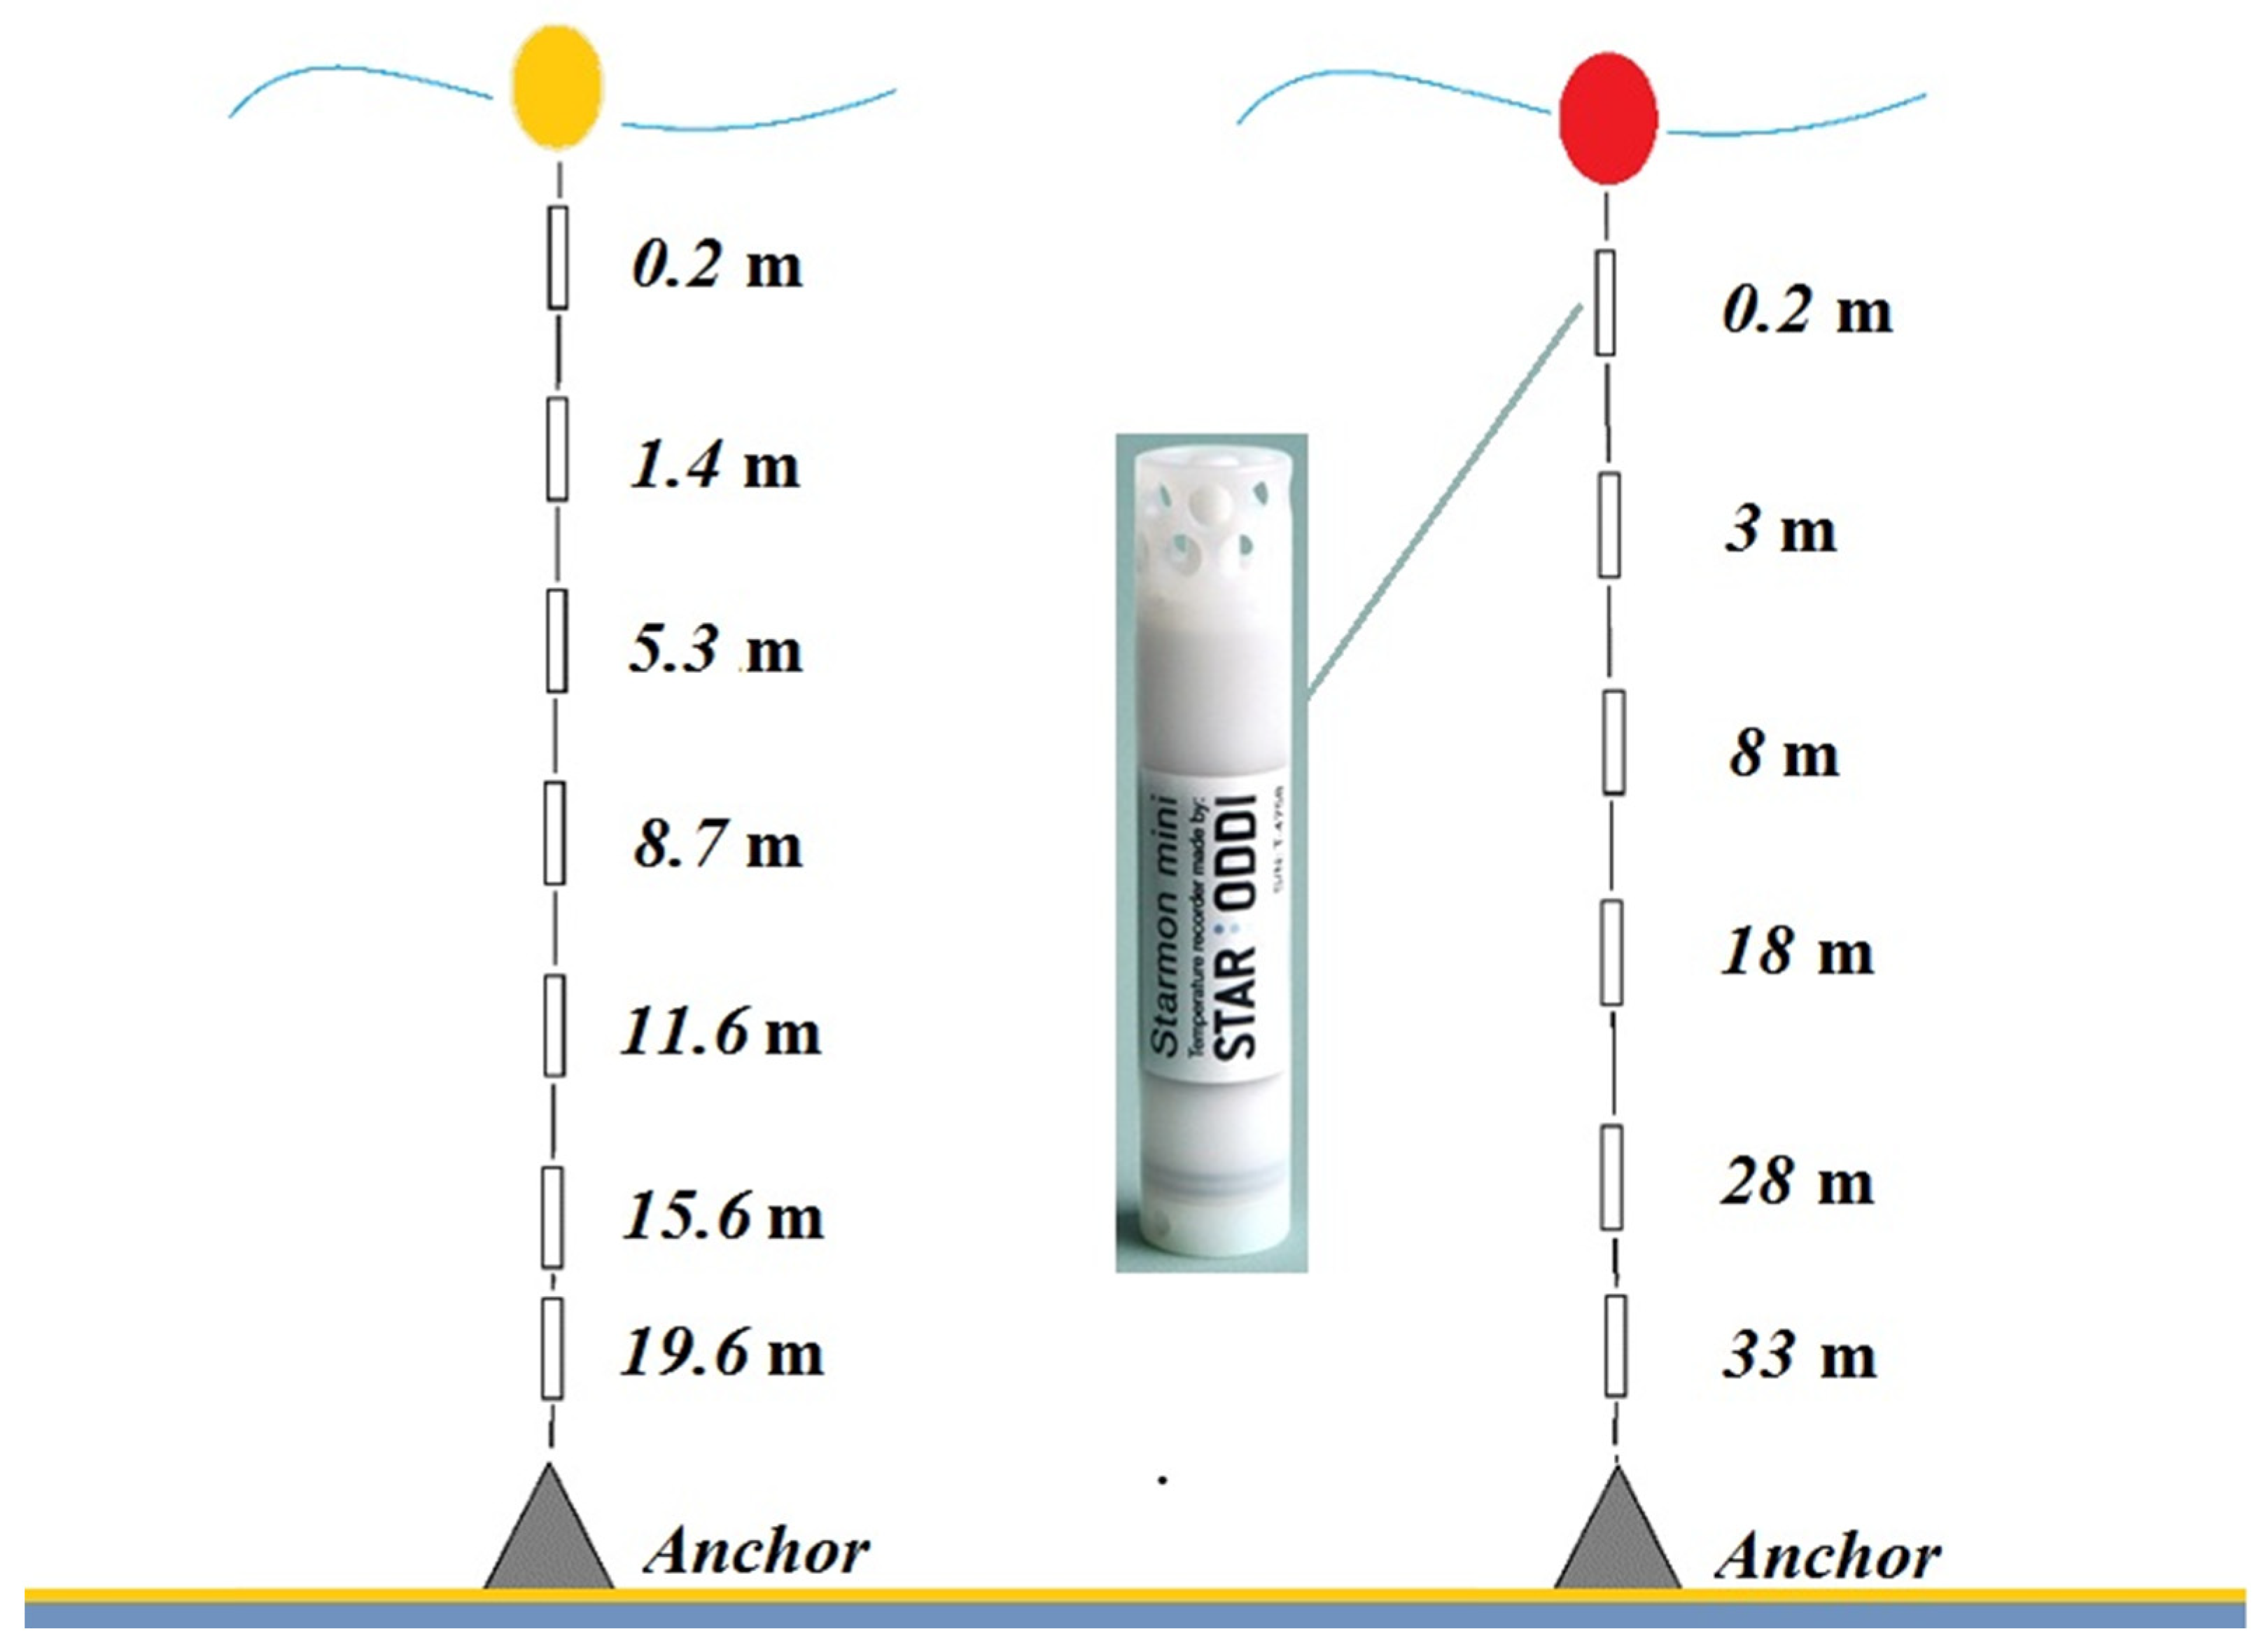
Continuous measurements of water temperature are quite rare in the area of the NR Utrish, especially on a vertical line. The chain of thermistors was moored three times in the marine part of the NR Utrish. It consisted of 6–10 thermistors Starmon StarOddi, Iceland (see Figure 2 and Figure 3), accuracy of the thermistors was ±0.025 °C and time step was 1 min. A series of water temperature measurements was held from 31 January 2020 to 21 April 2020 (mooring depth 16 m), from 16 July 2020 to 14 March 2021 (mooring depth 20 m) and from 15 March 2021 to 19 May 2022 (mooring depth 34 m). Vertical thermal structure data are available until 25 October 2021, because severe fall storms and biofouling sank the thermochain. All data after 25 October 2021 referred to the bottom horizon. The same type of thermistor was also successfully used in Baltic Sea studies from 2019 to 2021 [58,59].

2.2. Methods

Water temperature was analyzed in different ways. First, a general description was provided: variability in the temperature, its maximum and minimum and other statistical characteristics during the measurement periods.
After this general part, short-term processes associated with the temperature variations, such as upwelling, diurnal cycle and internal waves, were analyzed.
Upwelling is considered to be a sharp decrease in water temperature due to a rise in colder waters. In the present study, we define a decrease in temperature equal to 5 °C as a sharp decrease. Such choice is set due to the short-term diurnal cycle and internal wave temperature changes. The water temperature variations common for the NR Utrish in the measurement points were 0.5–2 °C during the March–September period. For extracting Ekman upwelling from other processes (as horizontal advection of currents or eddies), the upwelling criterion Ru (based on wind data) was used:
Ru = τyt/wHRd,
where τy is the alongshore component of the wind stress, t is the time of the quasi-stationary action of the upwelling wind, f is the Coriolis parameter, ρw is the density of the seawater, H is the thickness of the mixed layer depth and Rd is the local baroclinic radius of Rossby deformation.
The criterion was previously described in [28] and showed good applicability as an additional method of the hydrophysical analysis in the Black Sea. For the upwelling criterion calculation, we take wind data from NCEP CFSR reanalysis [60] in the nearest grid point with a time step of 3 h. Other parameters (mixed layer depth, salinity, density) were taken as climatological means.
Additionally, we used the air temperature from Anapa weather station №37001 [61] (which is located ~10 km from the mooring location). Air temperature variations and sea temperature were shown to be expressed in the diurnal cycle.
To assess the presence of diurnal variation, a spectral analysis was conducted. Spectral analysis is often used for SST analysis [62,63]. The autocorrelation function method was used with 4 degrees of freedom. The length of the series was set as 5 days. Sliding spectral analysis was calculated with a time step of one day.

2.3. Model Description

The simulation results used in this study for the comparison analysis were obtained using version 3.6 of NEMO (Nucleus for the European Modeling of the Ocean) [64]. The regional configuration for the cascade of Azov, Black and Marmara seas was developed at the Marine Hydrophysical Institute of the Russian Academy of Sciences [65]. This product can be considered the preliminary version of the physical retrospective analysis for 2008–2021. The computational domain of the configuration is a regular geographical grid covering the above marked basins. The bottom topography for the configuration was prepared on the basis of the EMODNet digital elevation model data [66]. The vertical discretization of the configuration was performed with the partial step z-coordinate. There were 35 unevenly distributed model levels with finer resolution in the upper layer. The reanalysis obtained using surface boundary conditions (SBCs) was prepared from ECMWF ERA5 product and CORE bulk formula [67]. The resulted SBCs have a spatial resolution of 1/4° and a temporal resolution of 1 h, which can be very important for reproducing short-term processes (for example, the diurnal cycle). The climatic runoff of 13 rivers into the Black Sea and the observed volume discharge values of the Don and Kuban rivers were taken into account to reproduce the water balance of the Azov Sea. This version of the reanalysis is based on the level 4 reprocessed temperature and salinity measurements, provided by Copernicus Marine Environment Monitoring System (CMEMS) ARMOR3D operational product [68].
Other ocean products used for the intercomparison were provided by CMEMS. These were: Black Sea Physical Analysis and Forecast (Copernicus Marine Service BS-Currents, EAS5 system) (Version 1) and BLKSEA_MULTIYEAR_PHY_007_004. The modeling core for both products is based on NEMO (version 4). The data assimilation procedure for the products is a 3D variational scheme implemented with the OceanVar framework [69,70].
The Black Sea reanalysis product (BLKSEA_MULTIYEAR_PHY_007_004 [52]) of CMEMS was used for the period 1 January 2020–31 May 2020. The spatial resolution is 1/27° × 1/36° and, in this reanalysis, has 31 vertical horizons. The ERA5 product is used for prescribing surface boundary conditions during the reanalysis procedure. The reanalysis system assimilates satellite sea-level anomalies and available in situ temperature and salinity profiles from SeaDataNet and CMEMS datasets.
The Black Sea Analysis product (BLKSEA_ANALYSISFORECAST_PHY_007_001 [71]) is used for the period from 1 January to 31 October 2021. Its spatial resolution is 1/40° × 1/40° (which is ~2.5 km), and this product has 121 unevenly distributed vertical levels. The analysis and forecasts are produced with the operational data from the ECMWF system with a spatial resolution of 1/8°. The operational CMEMS Black Sea system assimilates daily temperature and salinity profiles from ARGO floats, satellite altimetry sea-level anomalies and sea surface temperature from satellites.
Thus, there are 3 models for the comparison with in situ observations in this study. They are: MHI reanalysis, CMEMS1 (BLKSEA_MULTIYEAR_PHY_007_004) and CMEMS2 (BLKSEA_ANALYSISFORECAST_PHY_007_001). The CMEMS models are some of the most commonly used. It was interesting to compare the quality of several models with different time periods and spatial resolutions. Could these models be used for coastal ecosystem monitoring?

3. Results and Discussion

3.1. General Description

Data analysis was carried out sequentially from long time scales of temperature variability (seasonal and synoptic) to shorter ones (diurnal, inertial).
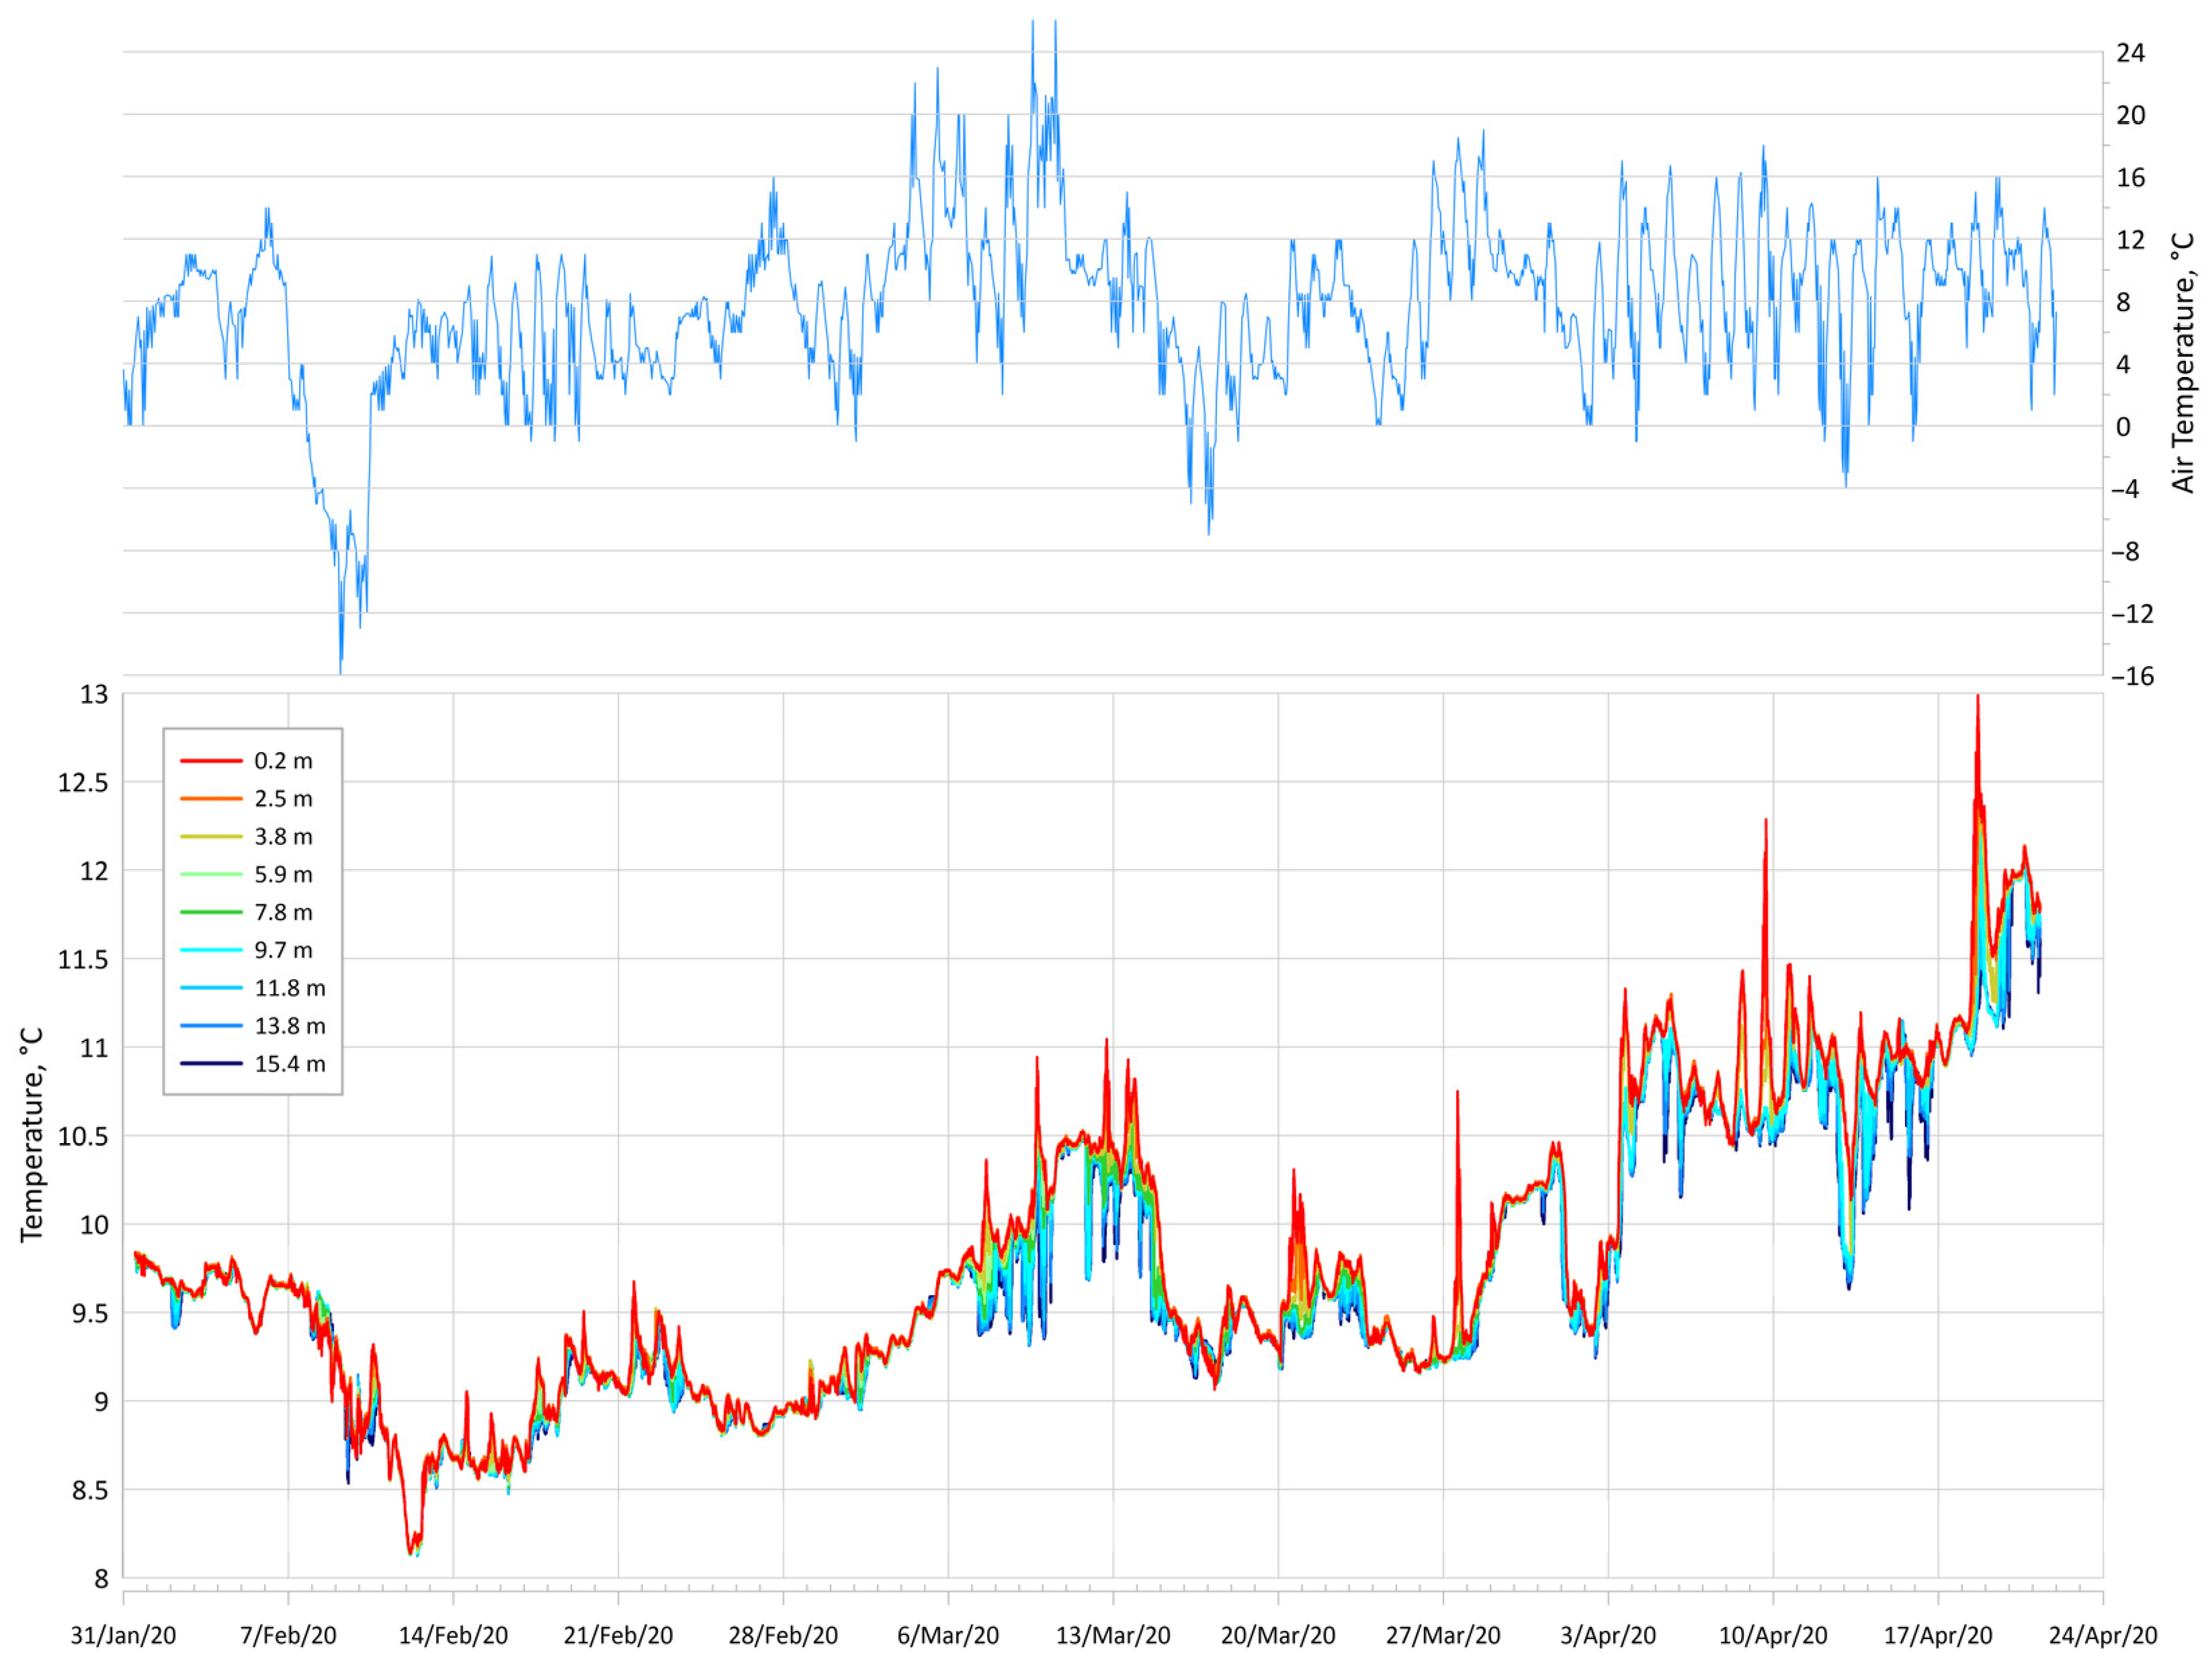
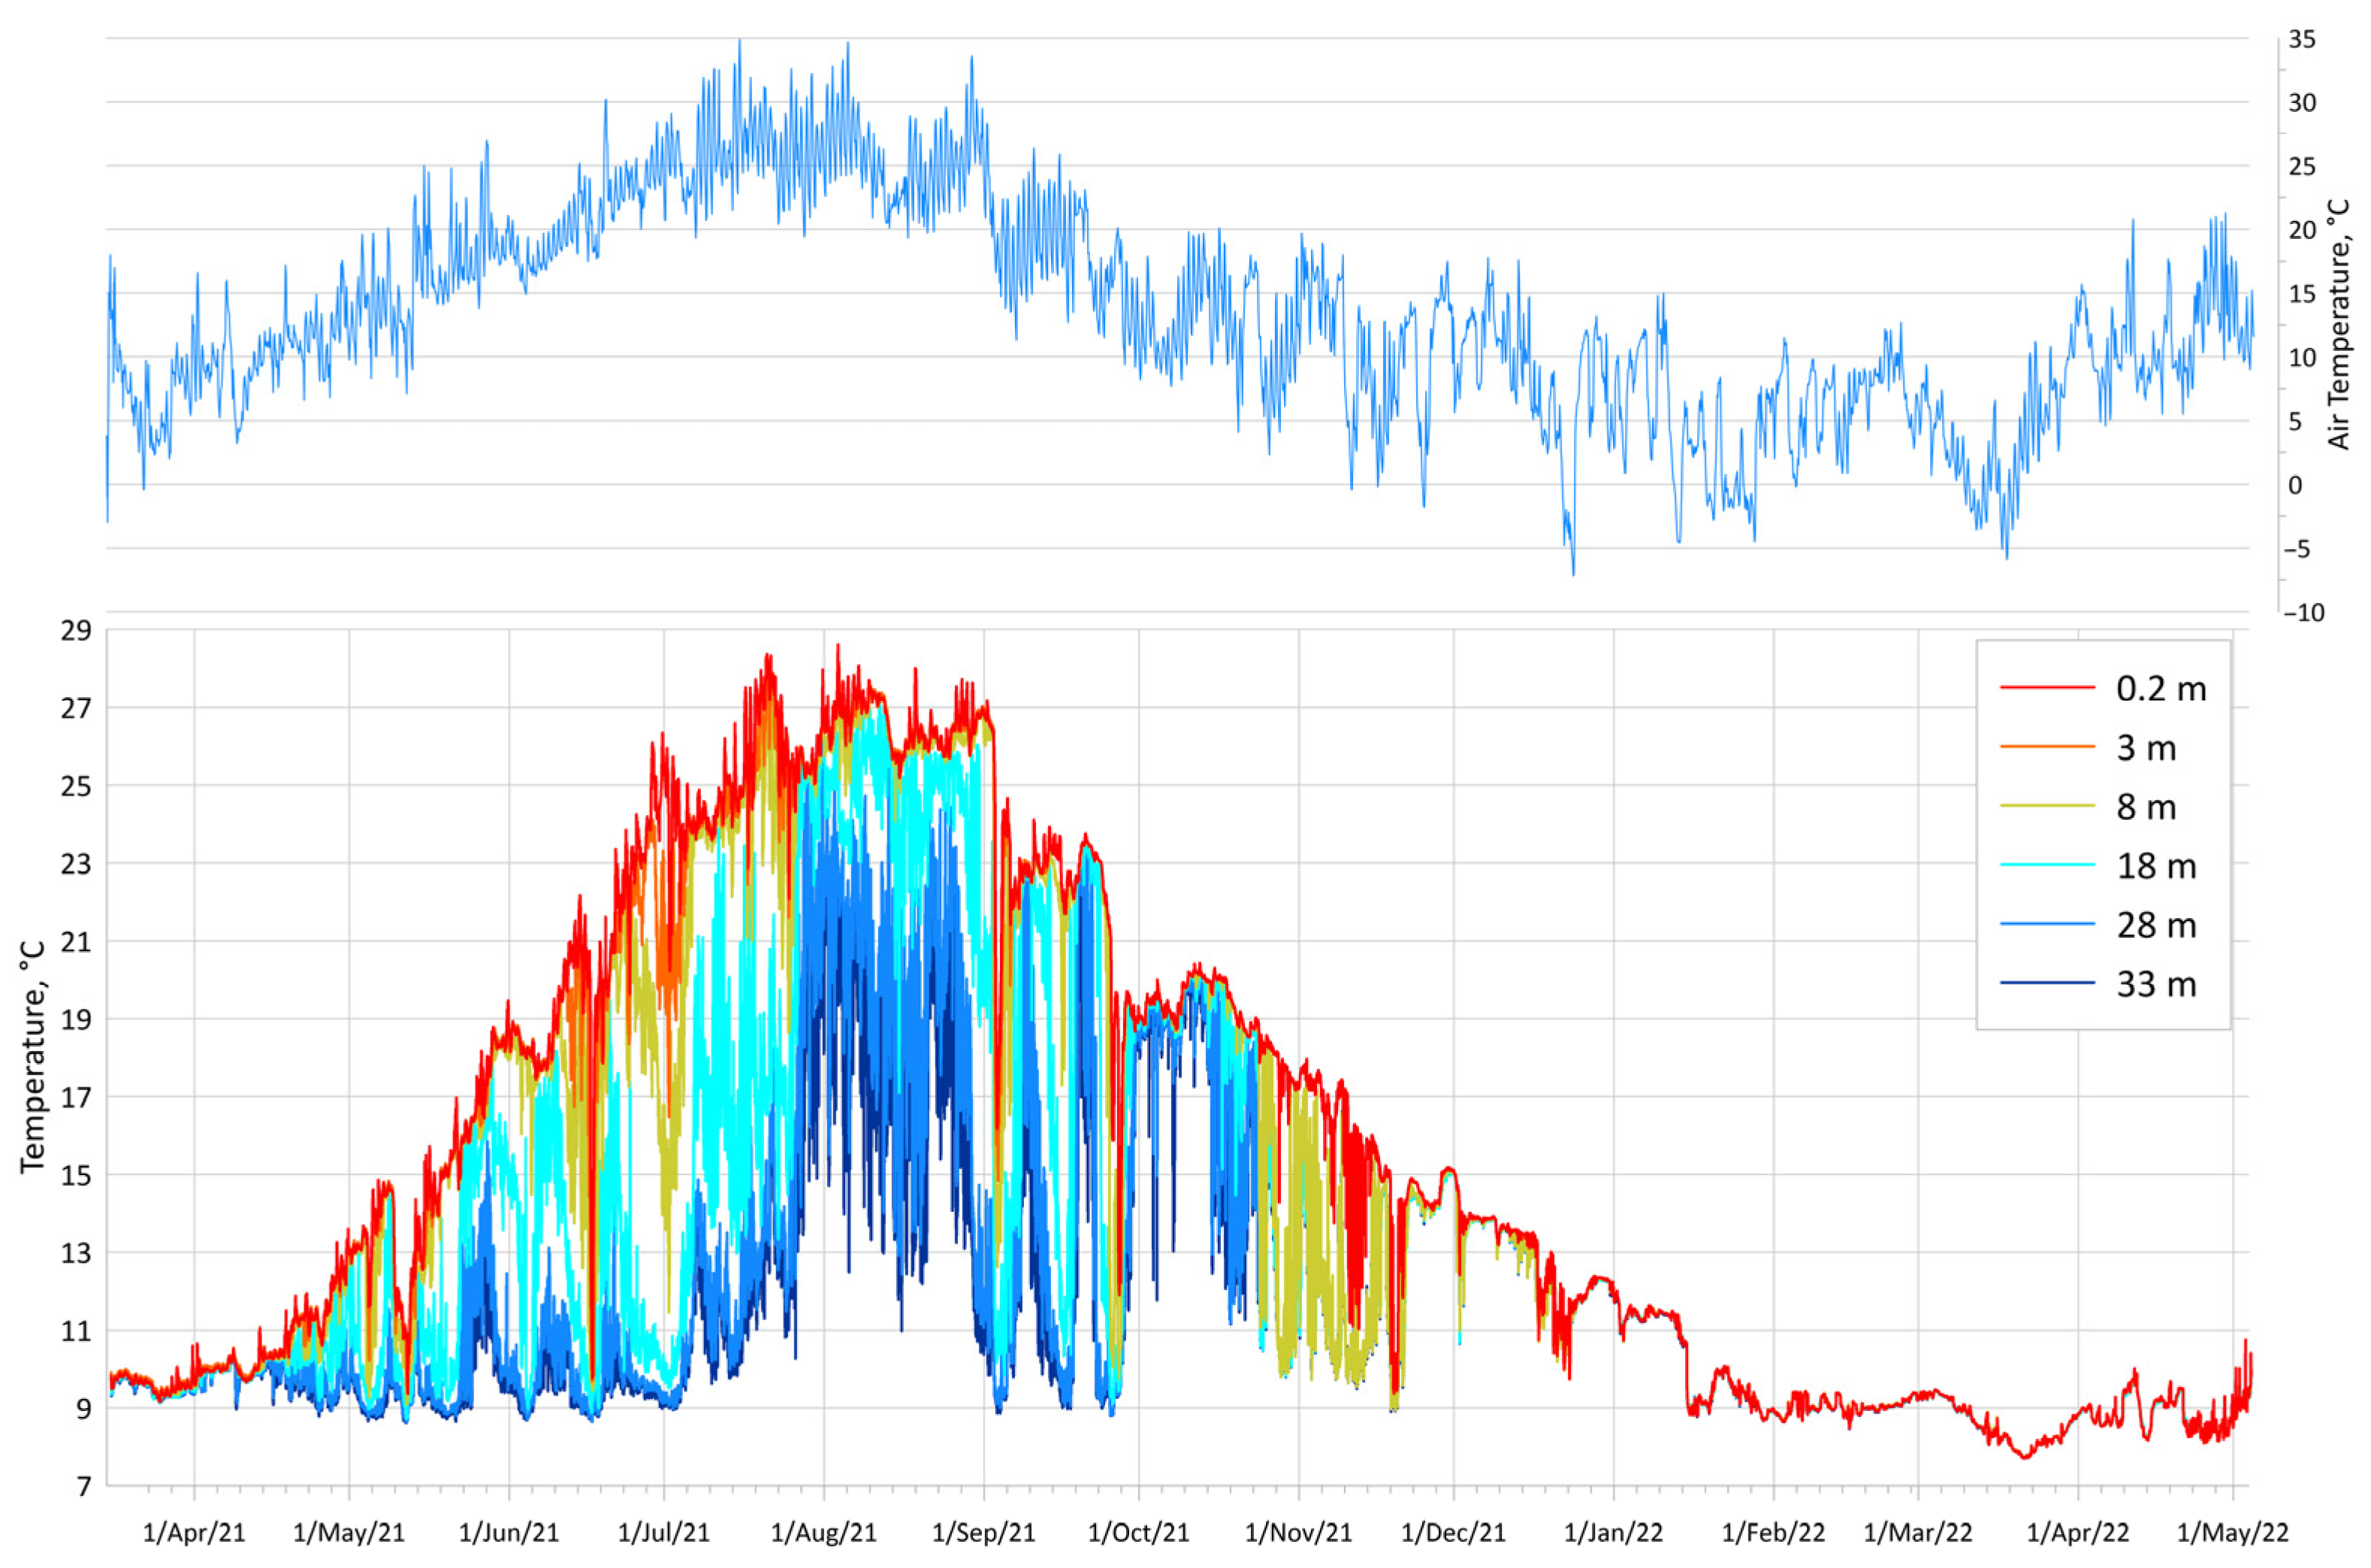
Figure 4, Figure 5 and Figure 6 show the water temperature at different depths and air temperature during the first, second and third measurement periods of the thermochain. The maximum temperature (28.6 °C) during all measurements was registered by a surface sensor (0.2 m) on 3 August 2021. The minimum temperature was registered at the bottom (33 m) on 21 March 2022 and was equal to 7.7 °C.
In the first measurement period, coastal waters were totally mixed during February 2020 (Figure 4). The temperature difference between horizons was less than 0.5 °C. Stratification began from 7 March 2020, when an upper layer started warming (temperature differs from the bottom to 0.5–1 °C). The water temperature increased from 8.1 °C on 12 February to 13 °C on 20 April. On 12 February 2020, there was a minimum temperature of 8.13 °C at the bottom (15.4 m). The air temperature greatly decreased to −16 °C on 9 February.
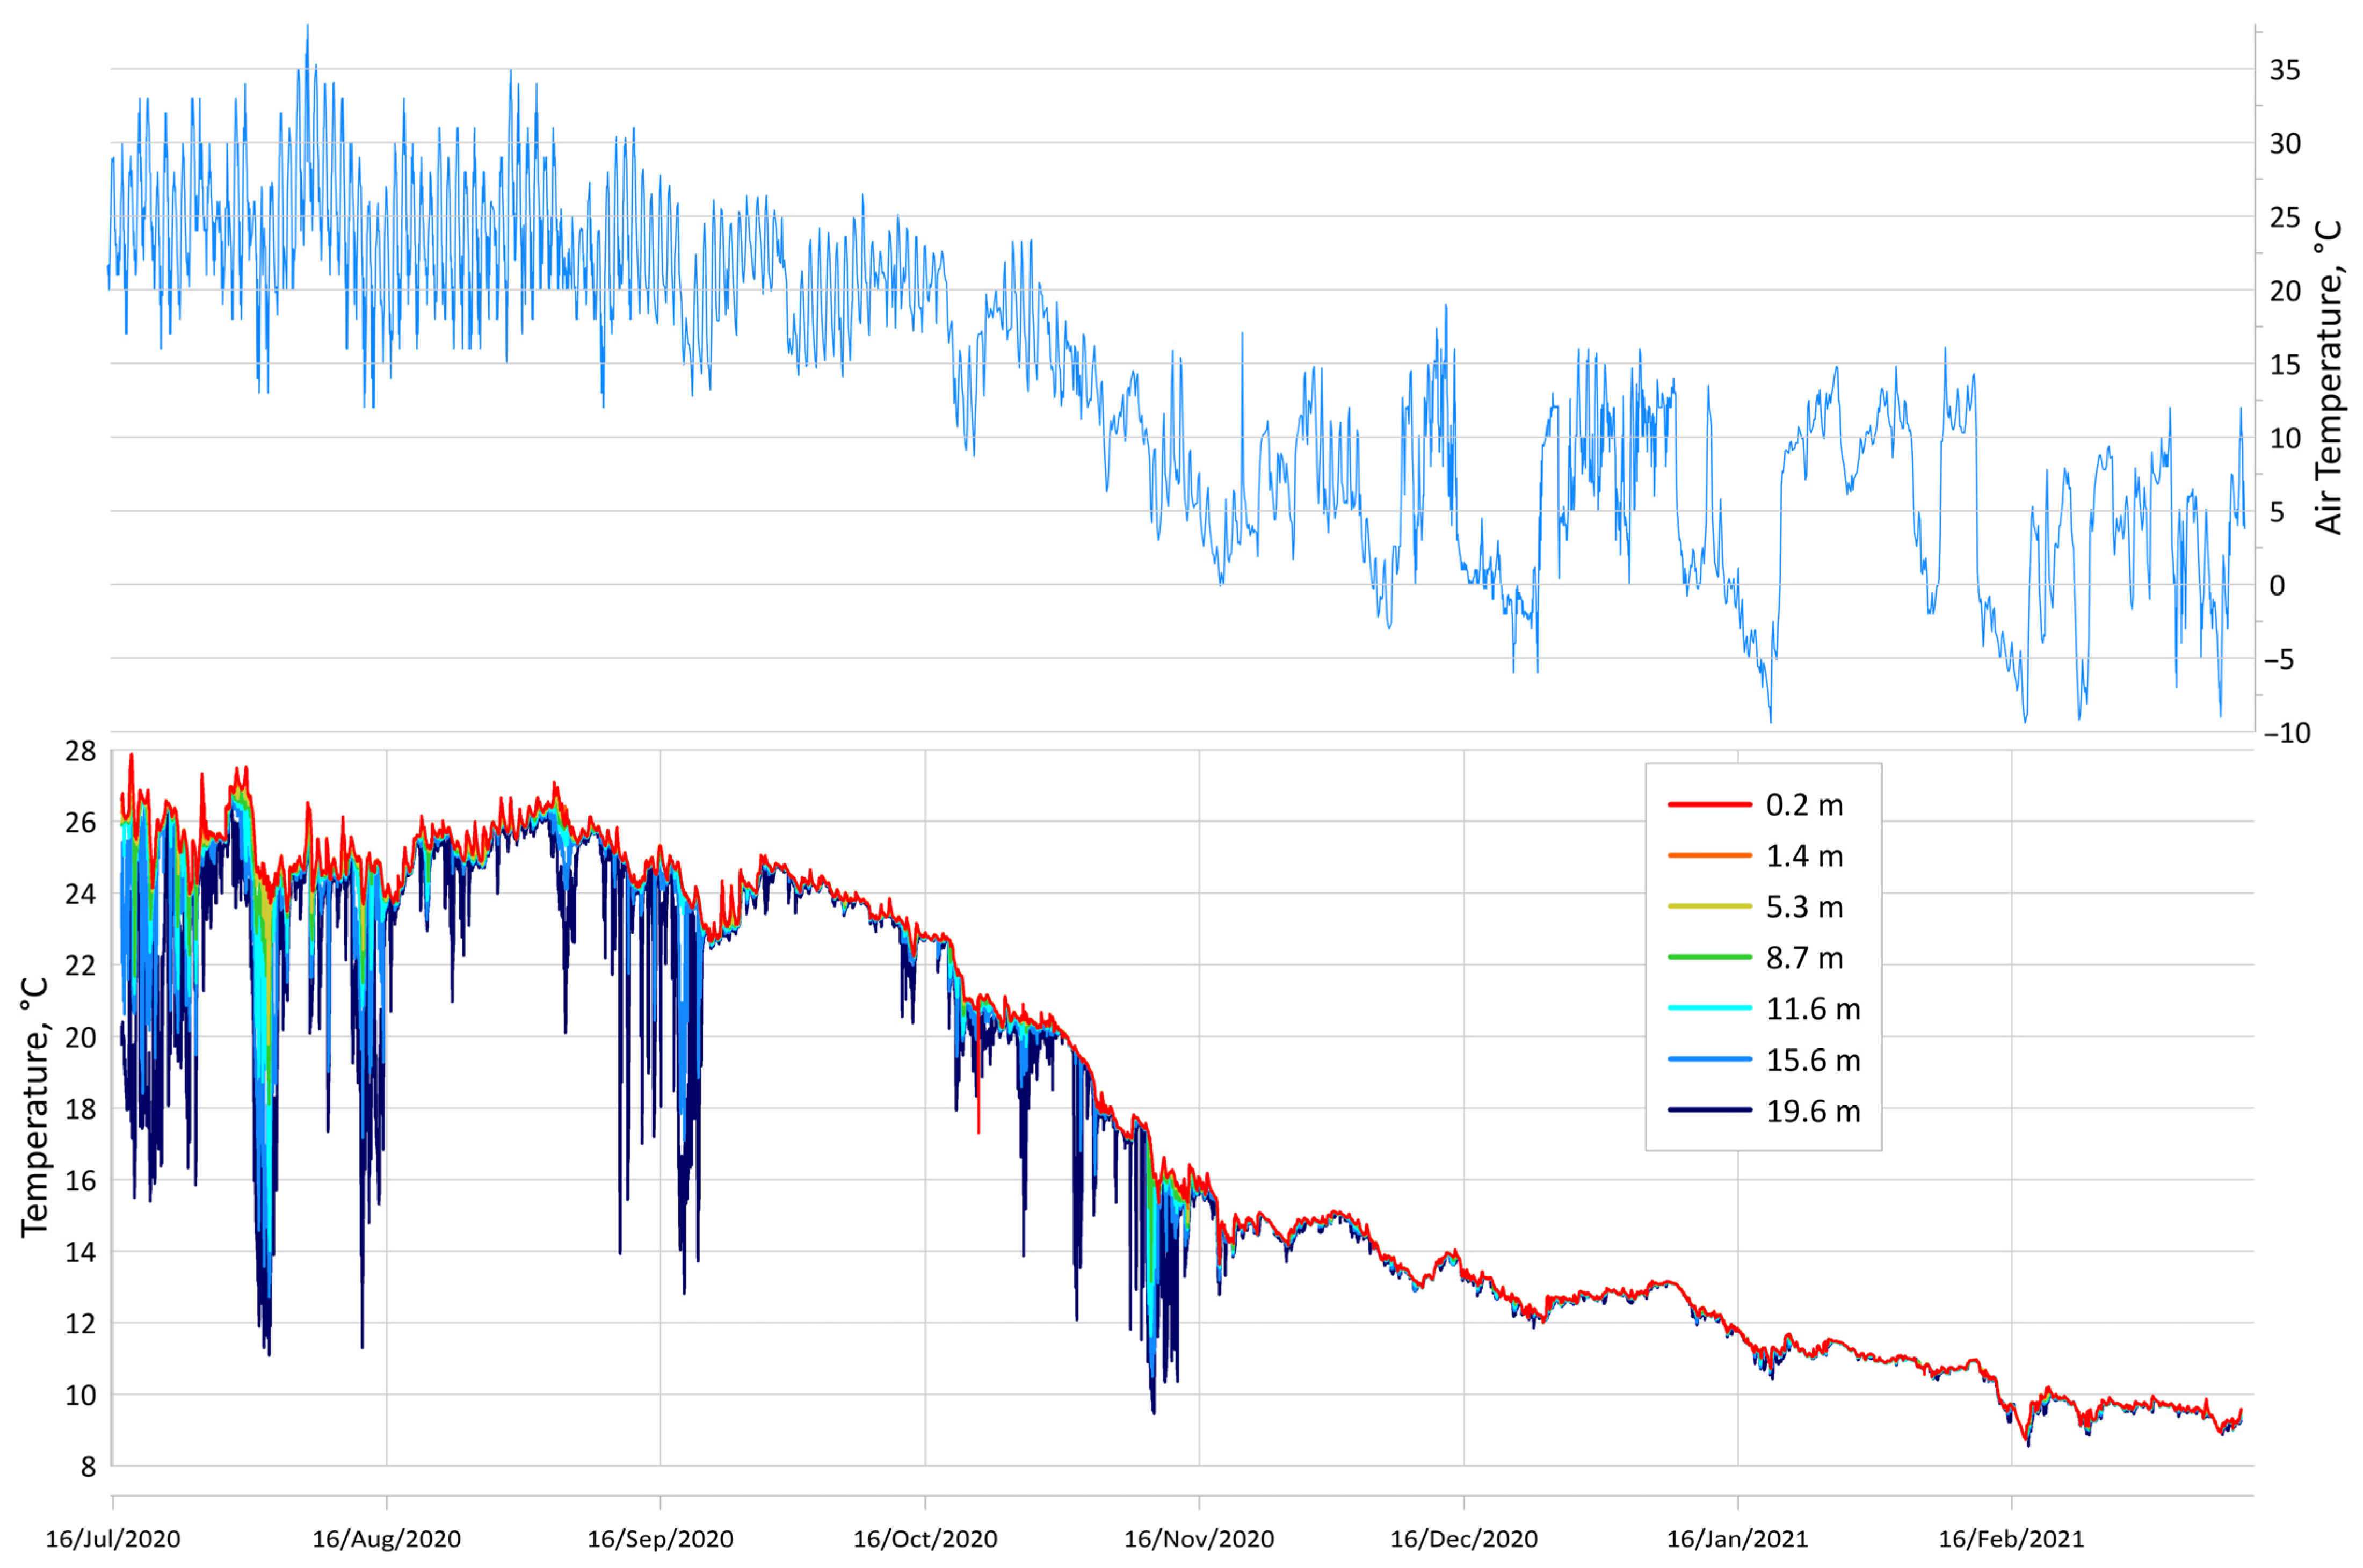
In the second period (see Figure 5), stratification was observed in July–September 2020. The summer maximum surface water temperature was 27.88 °C on 18 July 2020. The bottom 19.6 m sensor registered a temperature of 26.83 °C on 30 July 2020. October and November were characterized by autumn–winter cooling and convection. A completely mixed layer from the surface to the bottom was observed from 16 November to the end of the measurement period.
In the second period, the minimal temperature was observed on 18 February 2021 and reached 8.54 °C at the bottom (19.6 m) when the air temperature was around −10 °C.
Sharp temperature fluctuations are clearly visible at horizons from 11.6 m and deeper, which are associated with internal waves and upwellings. Several observed upwellings were incomplete, when the temperature at the bottom horizons dropped, but there were no big fluctuations at the surface.
The third measurement period is a good illustration of the annual water temperature variability (Figure 6). It begins with a completely mixed layer in March 2021, with a temperature of 9.6–9.8 °C. The heating of the upper layer begins in April.
The surface water temperature reached maximal values (>27 °C) in July–August. A temperature of 28.6 °C was registered on 3 August 2021. Strong upwelling was observed on 2 September, followed by autumn–winter cooling and convective mixing. The temperature minimum was observed on 20 March 2022. The temperature dropped to 7.7 °C. The observed minimal values are relatively low in the Black Sea in this region and reflect the renewal of the cold intermediate layer. The cold intermediate layer is characterized by water temperatures of 7–8.3 °C [72,73].
Fluctuations in water temperature with various periods were observed during the strong stratification in April–October. Internal waves and upwellings with a significant decrease in water temperature were registered. Short-term processes are discussed below in the next sections.
A simple statistical analysis for each period and for each horizon was carried out. The statistical parameters are shown in Table 1, Table 2 and Table 3.

3.2. Upwelling Events during Measurement Periods

In this section, we present all events of the strong temperature decrease (in subsurface layer) in a short period. As we can see from Figure 4, Figure 5 and Figure 6 and the corresponding tables, there were no such events during the first measurement period. In the second period (from 16 July 2020), there was a 3.5 °C decrease in the surface temperature on 1 August 2020, and there were six cases of sharp temperature decreases in 2021 (9–12 May, 15–17 June, 1–2 July, 21–25 July, 1–3 September, 24–26 September). We exclude the period of November and after from the analysis as we assume that the thermochain had already sunk to the bottom. According to the Ekman upwelling criterion calculation, four cases of the Ekman upwelling could be registered in the first measurement period (but the temperature was too low for the identification), three cases in the second measurement period (Figure 7) and five cases in the third measurement period. The Ekman criterion was calculated for the April–November period. Thus, five of the above listed cases in 2021 were Ekman upwellings. The SST decreases on 15–17 June and 1–2 July happened after the wind changed from downwelling favorable and the current weakened. This combined weakening of the wind and current could lead to the compensation movement; since we could not analyze whole interactions, advection and other processes were also possible.
A difference between the number of Ekman upwelling events in 2020 and in 2021 could be caused by different wind activity. High interannual variability in the Ekman upwelling events (0–8/per year) is common for the north-eastern part of the Black Sea [74]. Additionally, the different location of the station and period of the measurements influenced the number of decreasing temperature events. The distance between moored stations was ~600 m, and the depth of mooring was also different (16–20 m in 2020 and 34 m in 2021). Nevertheless, it is evident that significant water temperature changes were registered in the NR Utrish during the warm season. Such events have an impact on ecosystem development during spring and summer.
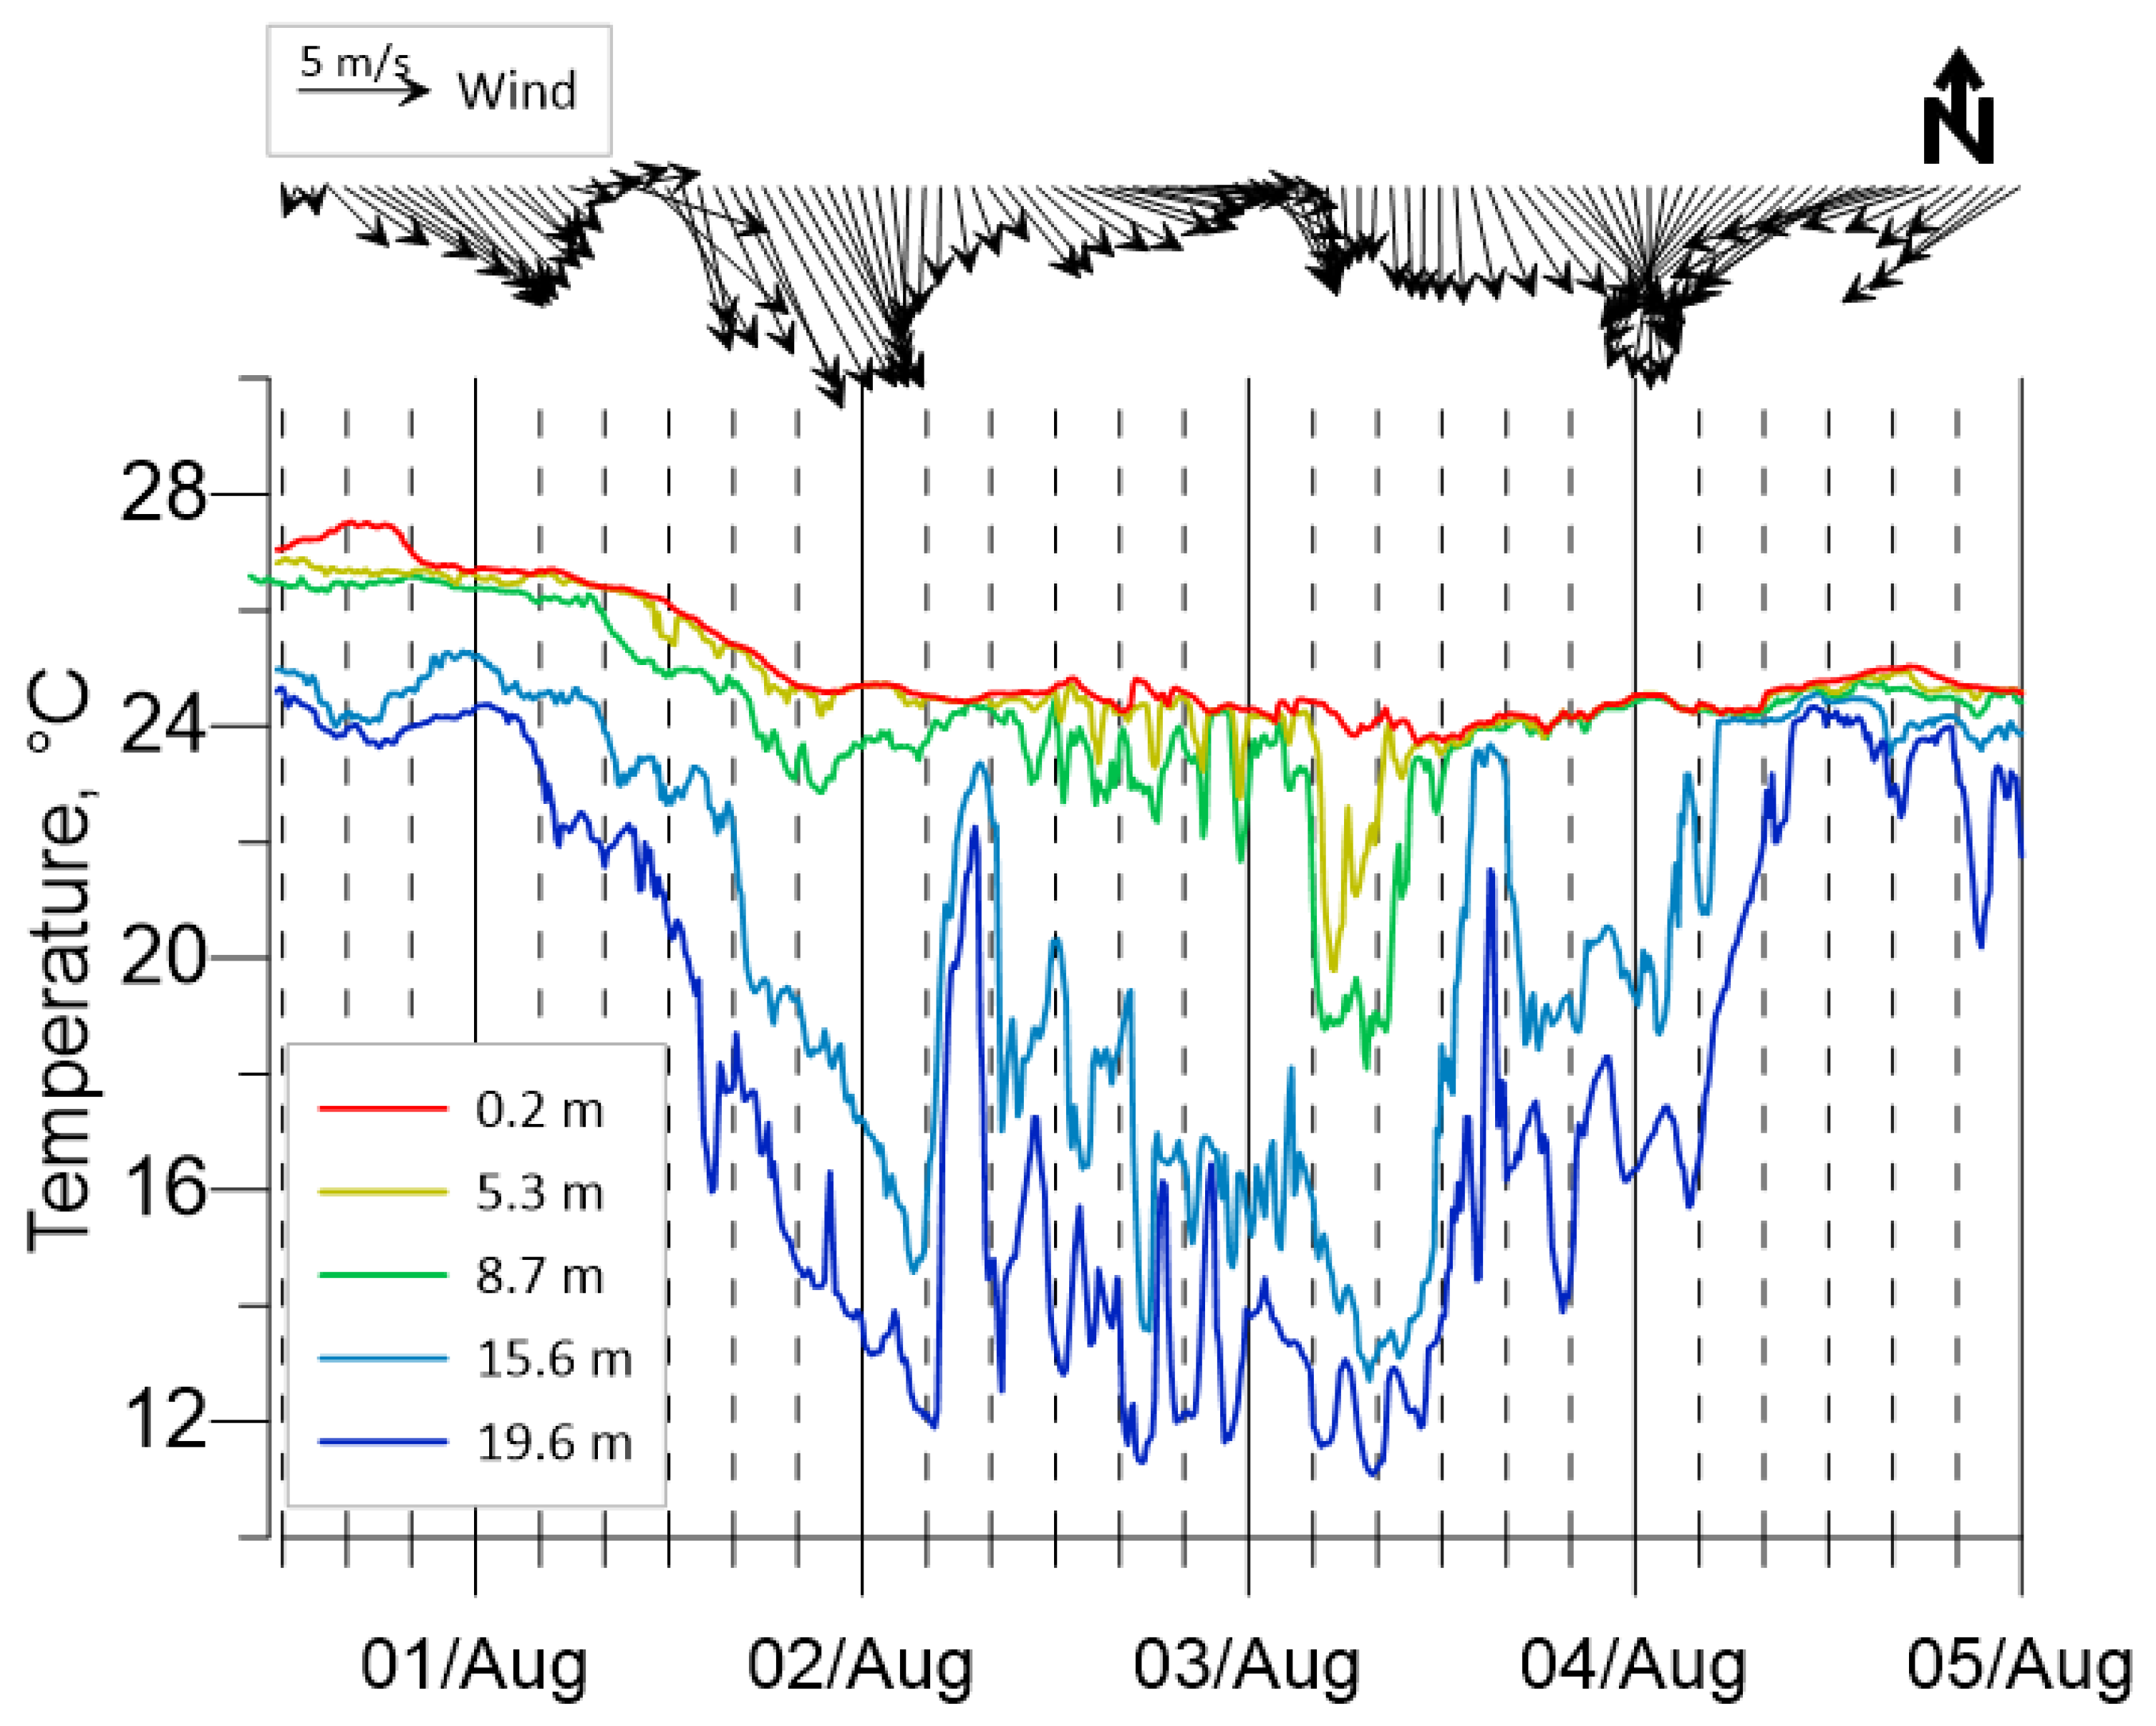
Upwelling in the first few days of August 2020 was incomplete (Figure 8), but the temperature in the bottom layer dropped to 11.8 °C. The amplitude was significantly less at the 8 m horizon, with the temperature changing from 24 °C to 18 °C in 5 h. The criterion of the upwelling was less than −1, indicating the Ekman nature of the event. Another similar case was registered on 13–14 August 2020. With strong upwelling winds, the temperature dropped again on the bottom layer to 11 °C. SST oscillations were comparable with the diurnal cycle and equal to ~1.5 °C.
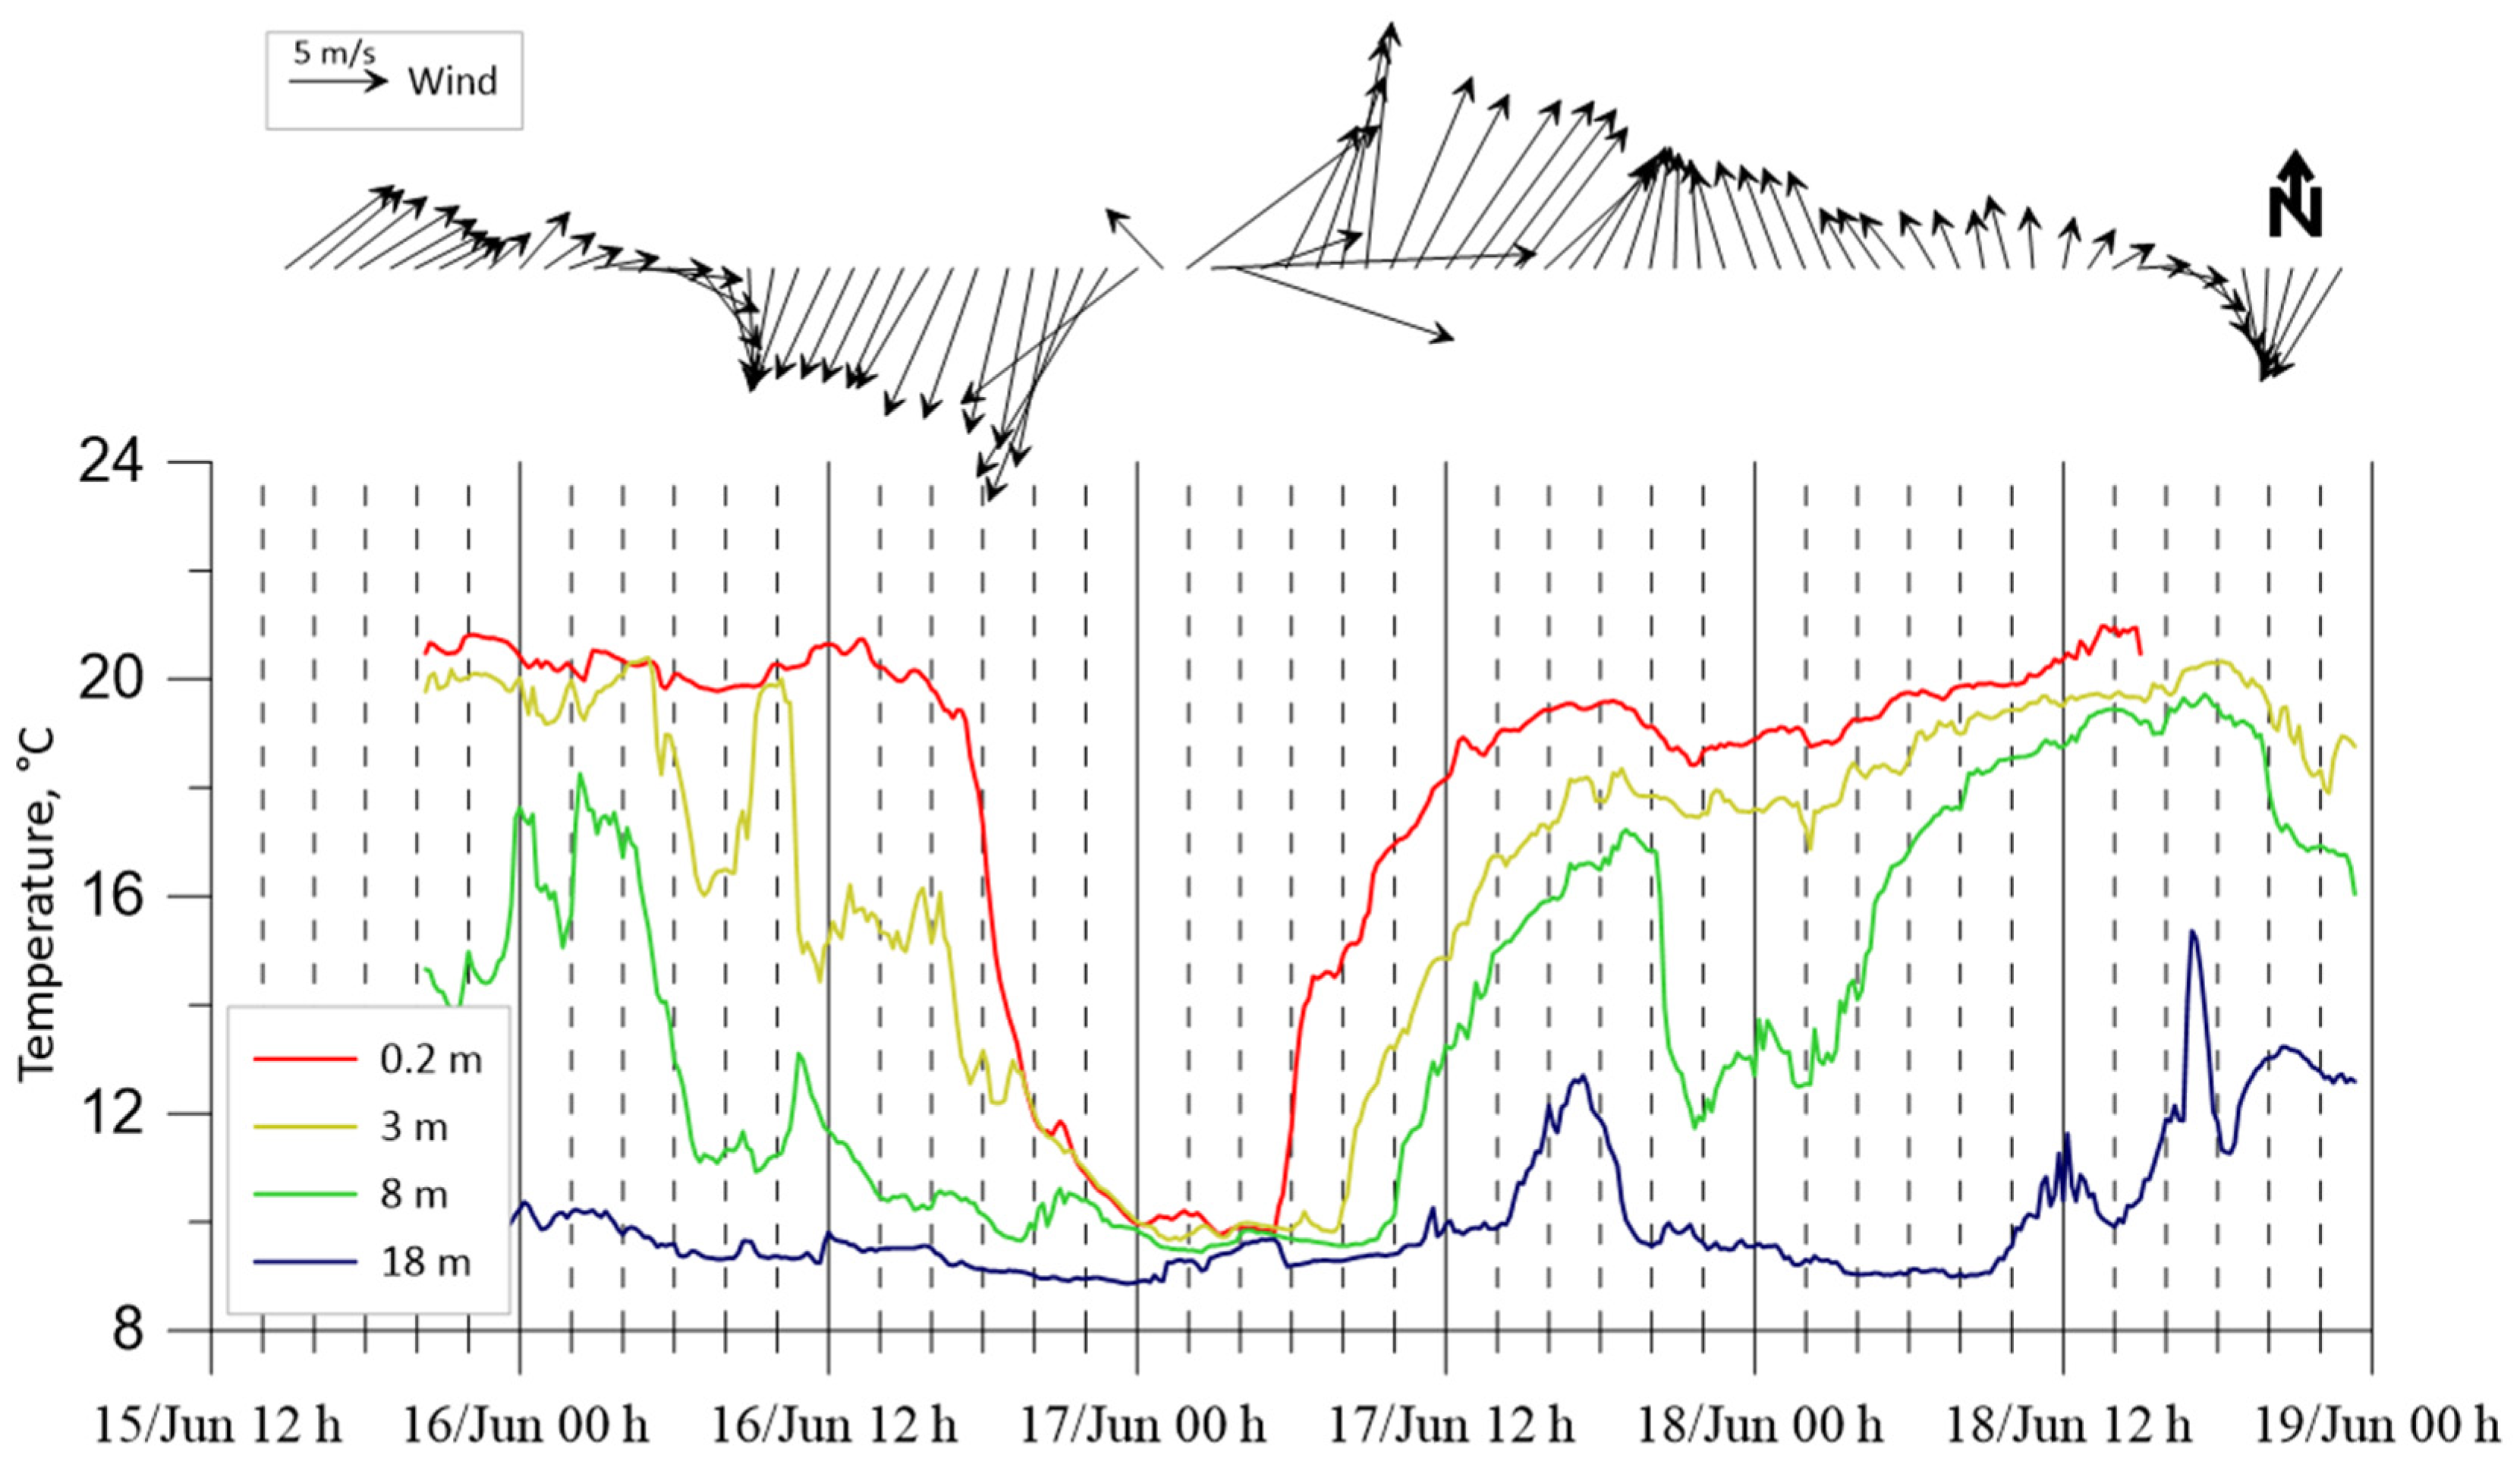
The maximum amplitude of the temperature decrease was more than 11 °C and was recorded on 15–17 of June 2021. Figure 9 displays this upwelling event. The SST dropped from 21 °C to 10 °C in 5 h. Such extremely fast variation occurred when previously dominant onshore winds changed to offshore, and the alongshore current weakened. Large positive values of the upwelling criterion on 15 June were calculated. Such values correspond to the significant downwelling wind forces. In previous studies [74], there have been cases when prolonged winds after the direction change led to a water structure disturbance, faster relaxation of upwelling or downwelling.
It seems that changes in the vertical distribution of water temperature under the wind action and corresponding water dynamics are like a swing—with strong atmospheric impact and certain conditions, the state of equilibrium is achieved only after a compensatory movement opposed to the acting force. In our case, long downwelling winds (more than 7 days) changed to offshore wind with high speeds (more than 10 m/s), and the alongshore current weakened (from the MHI model data). All these factors led to downwelling relaxation and to the reverse process—upwelling.
A sharp decrease on 2–3 September 2021 (Figure 6) during the upwelling was ~10 °C. Data on the vertical distribution of water temperature allow us to consider, in detail, the processes occurring in the coastal zone. It took less than 10 h for the temperature to drop from 26.3 °C to 16.2 °C in the surface layer. The water temperature on the bottom decreased to 9 °C.
September was very interesting. From upwelling and sharp downwelling at the start to the final upwelling, oscillations in the bottom layer were maximal from the start of the measurement period.
Such a sequence of events is of great interest to all researchers as it leads to short-term, but very sharp, changes in the conditions of the coastal zone. Similar phenomena were recorded near Gelendzhik in September 2013 [75].
Currents from the MHI model were additionally analyzed for this phenomenon. It was noted that the water dynamics also had some periodicity of 10–14 days in this region, which was apparently related to the synoptic processes. This variability in the currents will be a task for future research. The main direction of the currents was north-western, which corresponds to the Main Rim Current direction. Such a flow prevents upwelling and increases the possibility of downwelling, especially when the jet closes the shore. The north-western current intensified during July and August. That intensification led to growth in the bottom temperature. However, when there was strong wind influence and the current was weakening, we observed a sharp bottom temperature decrease. The interaction of the atmosphere and currents is a key factor in water temperature changes.

3.3. Diurnal Cycle

The diurnal cycle of water temperature is hard to analyze with a large amount of data. A spectral analysis was conducted to assess the presence of a diurnal cycle in a subsurface layer. The autocorrelation method with 4 degrees of freedom was used. The length of the series was 5 days, and a sliding spectral analysis with a step of 1 day was calculated. If a spectrum had a local maximum of spectral energy at an oscillation period of 24–30 h and the amplitude of this maximum was more than 1 °C2/Hz, we assumed that the spectrum had a diurnal cycle.
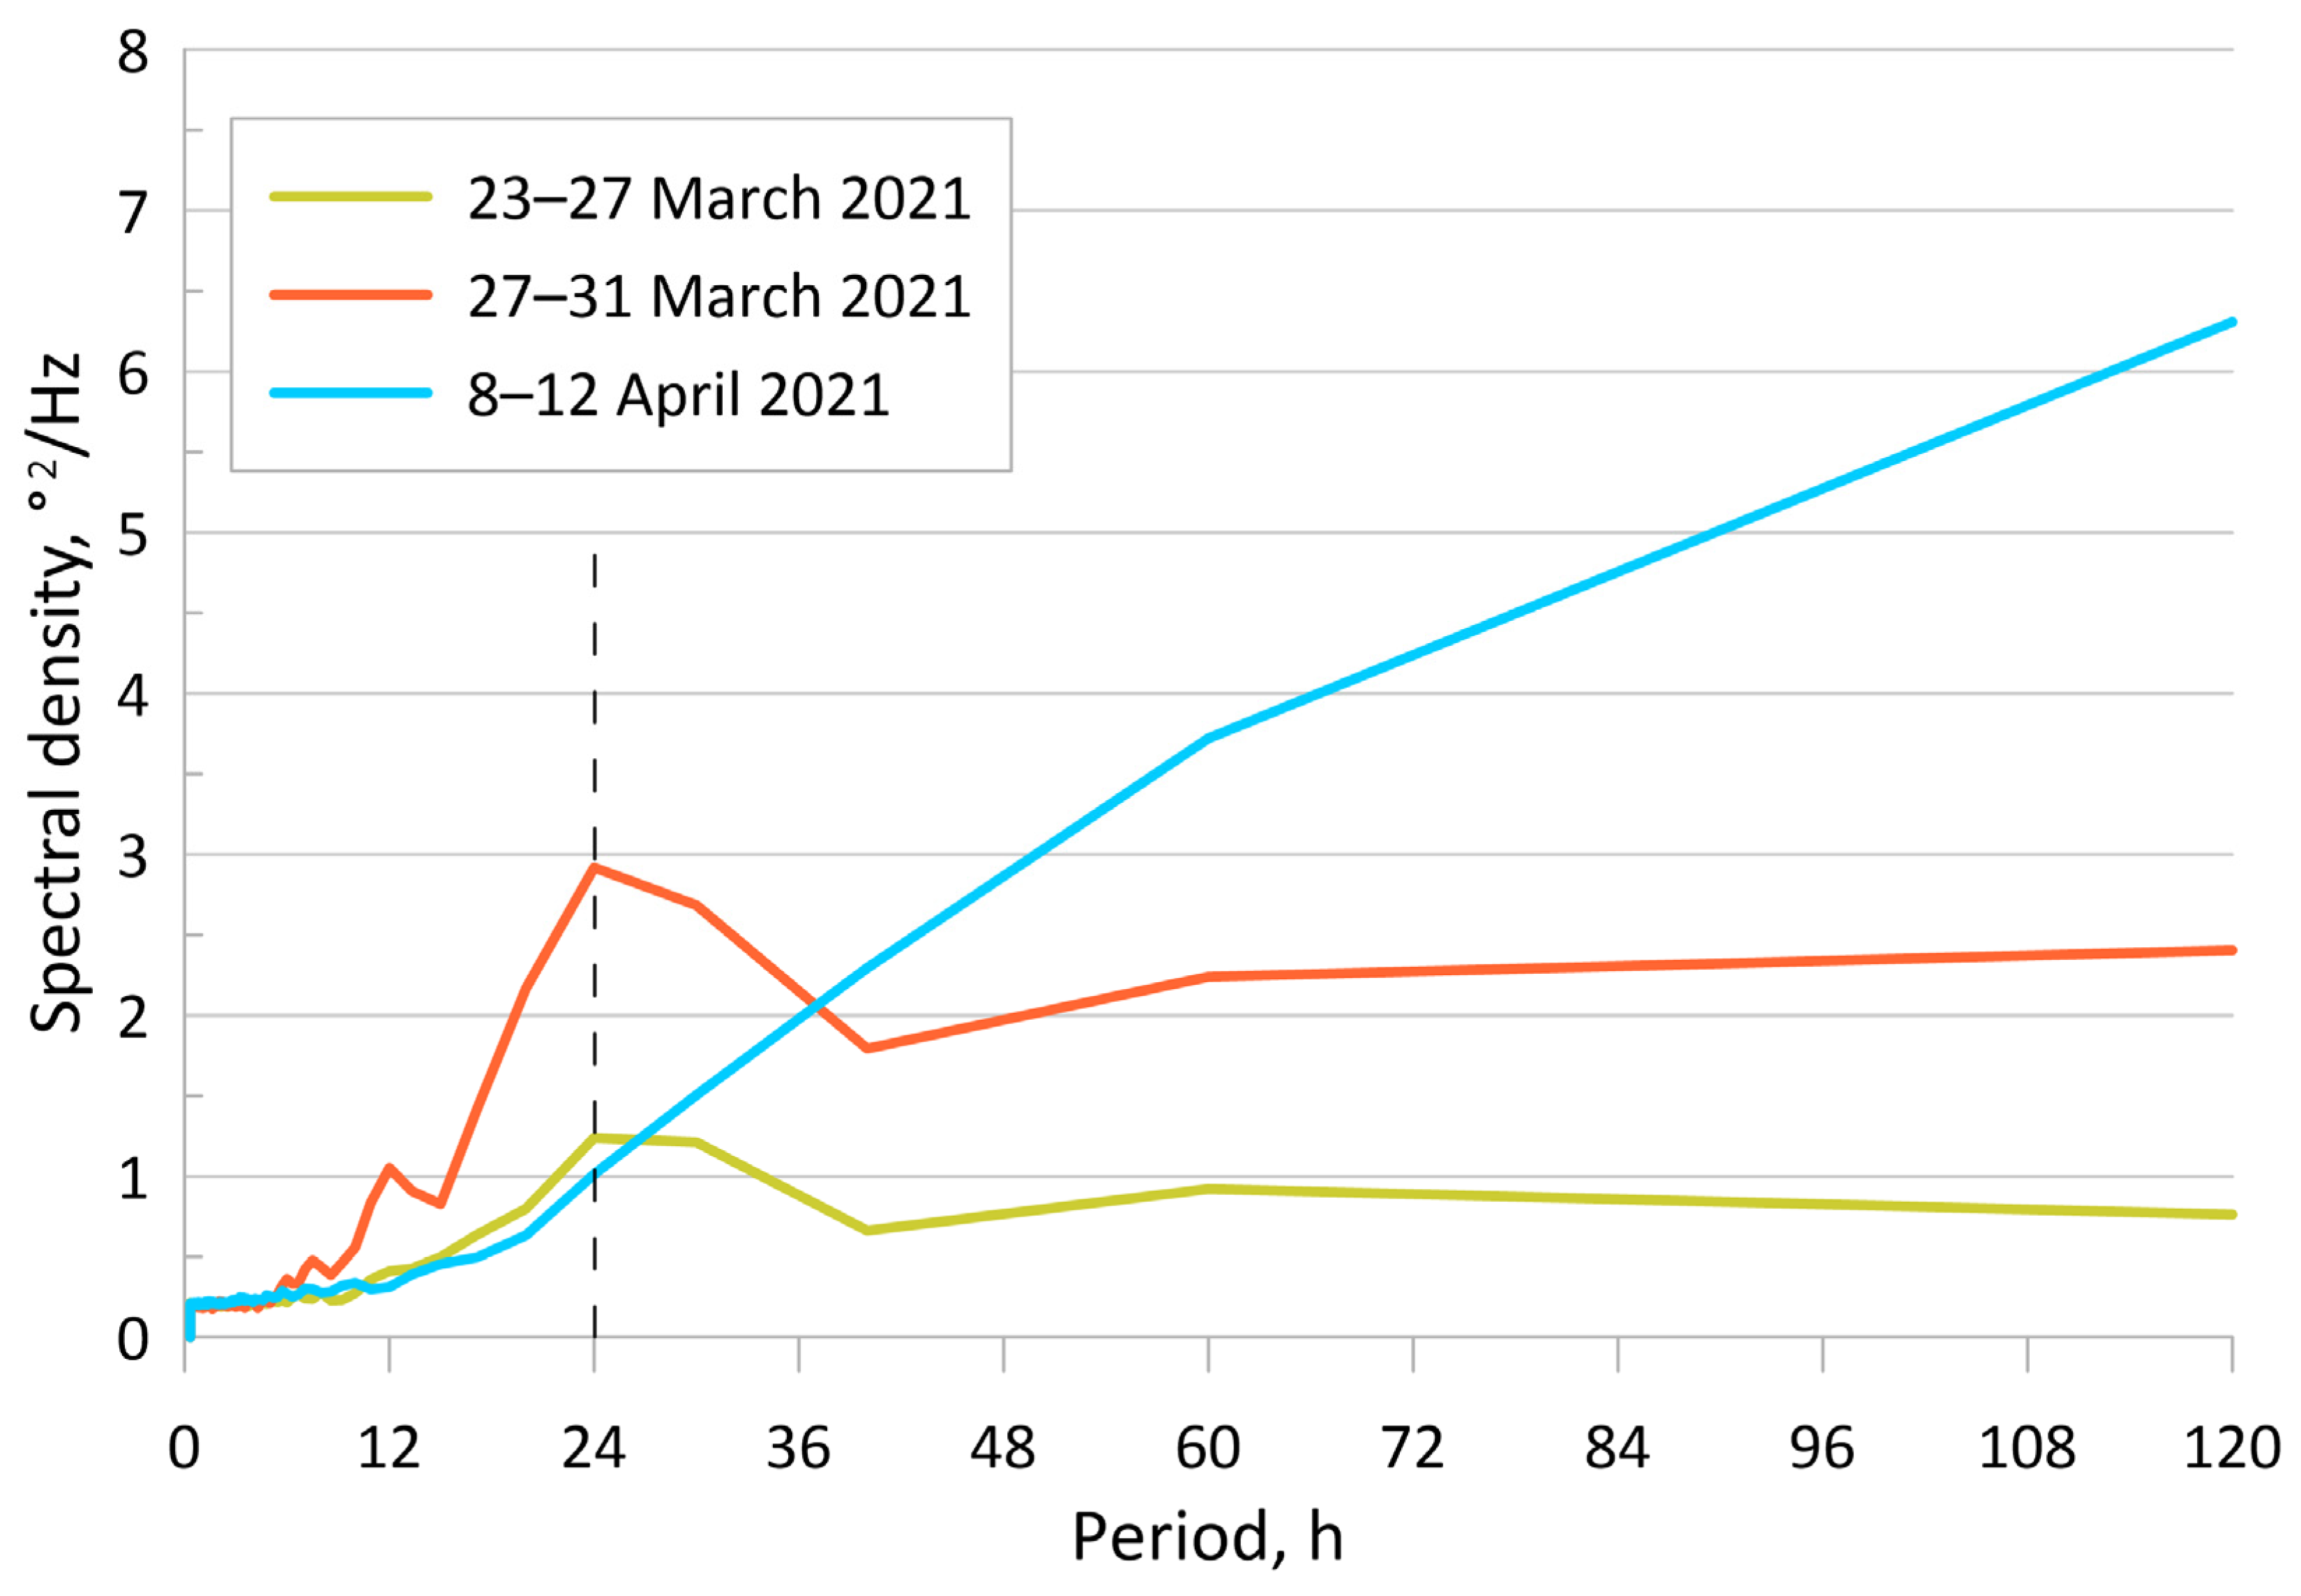
Usually, this criterion corresponds to the situation when 3–4 days out of 5 days had a daily cycle with a temperature amplitude of more than 0.3 °C. An example of such spectra for various days is shown in Figure 10. A peak for a period of 24 h is clearly visible for March 27. A peak is visible, but the amplitude of the spectral density oscillation was less than 1 °C 2/Hz for March 23. On 8 April, a peak for a period of 24 h was absent.
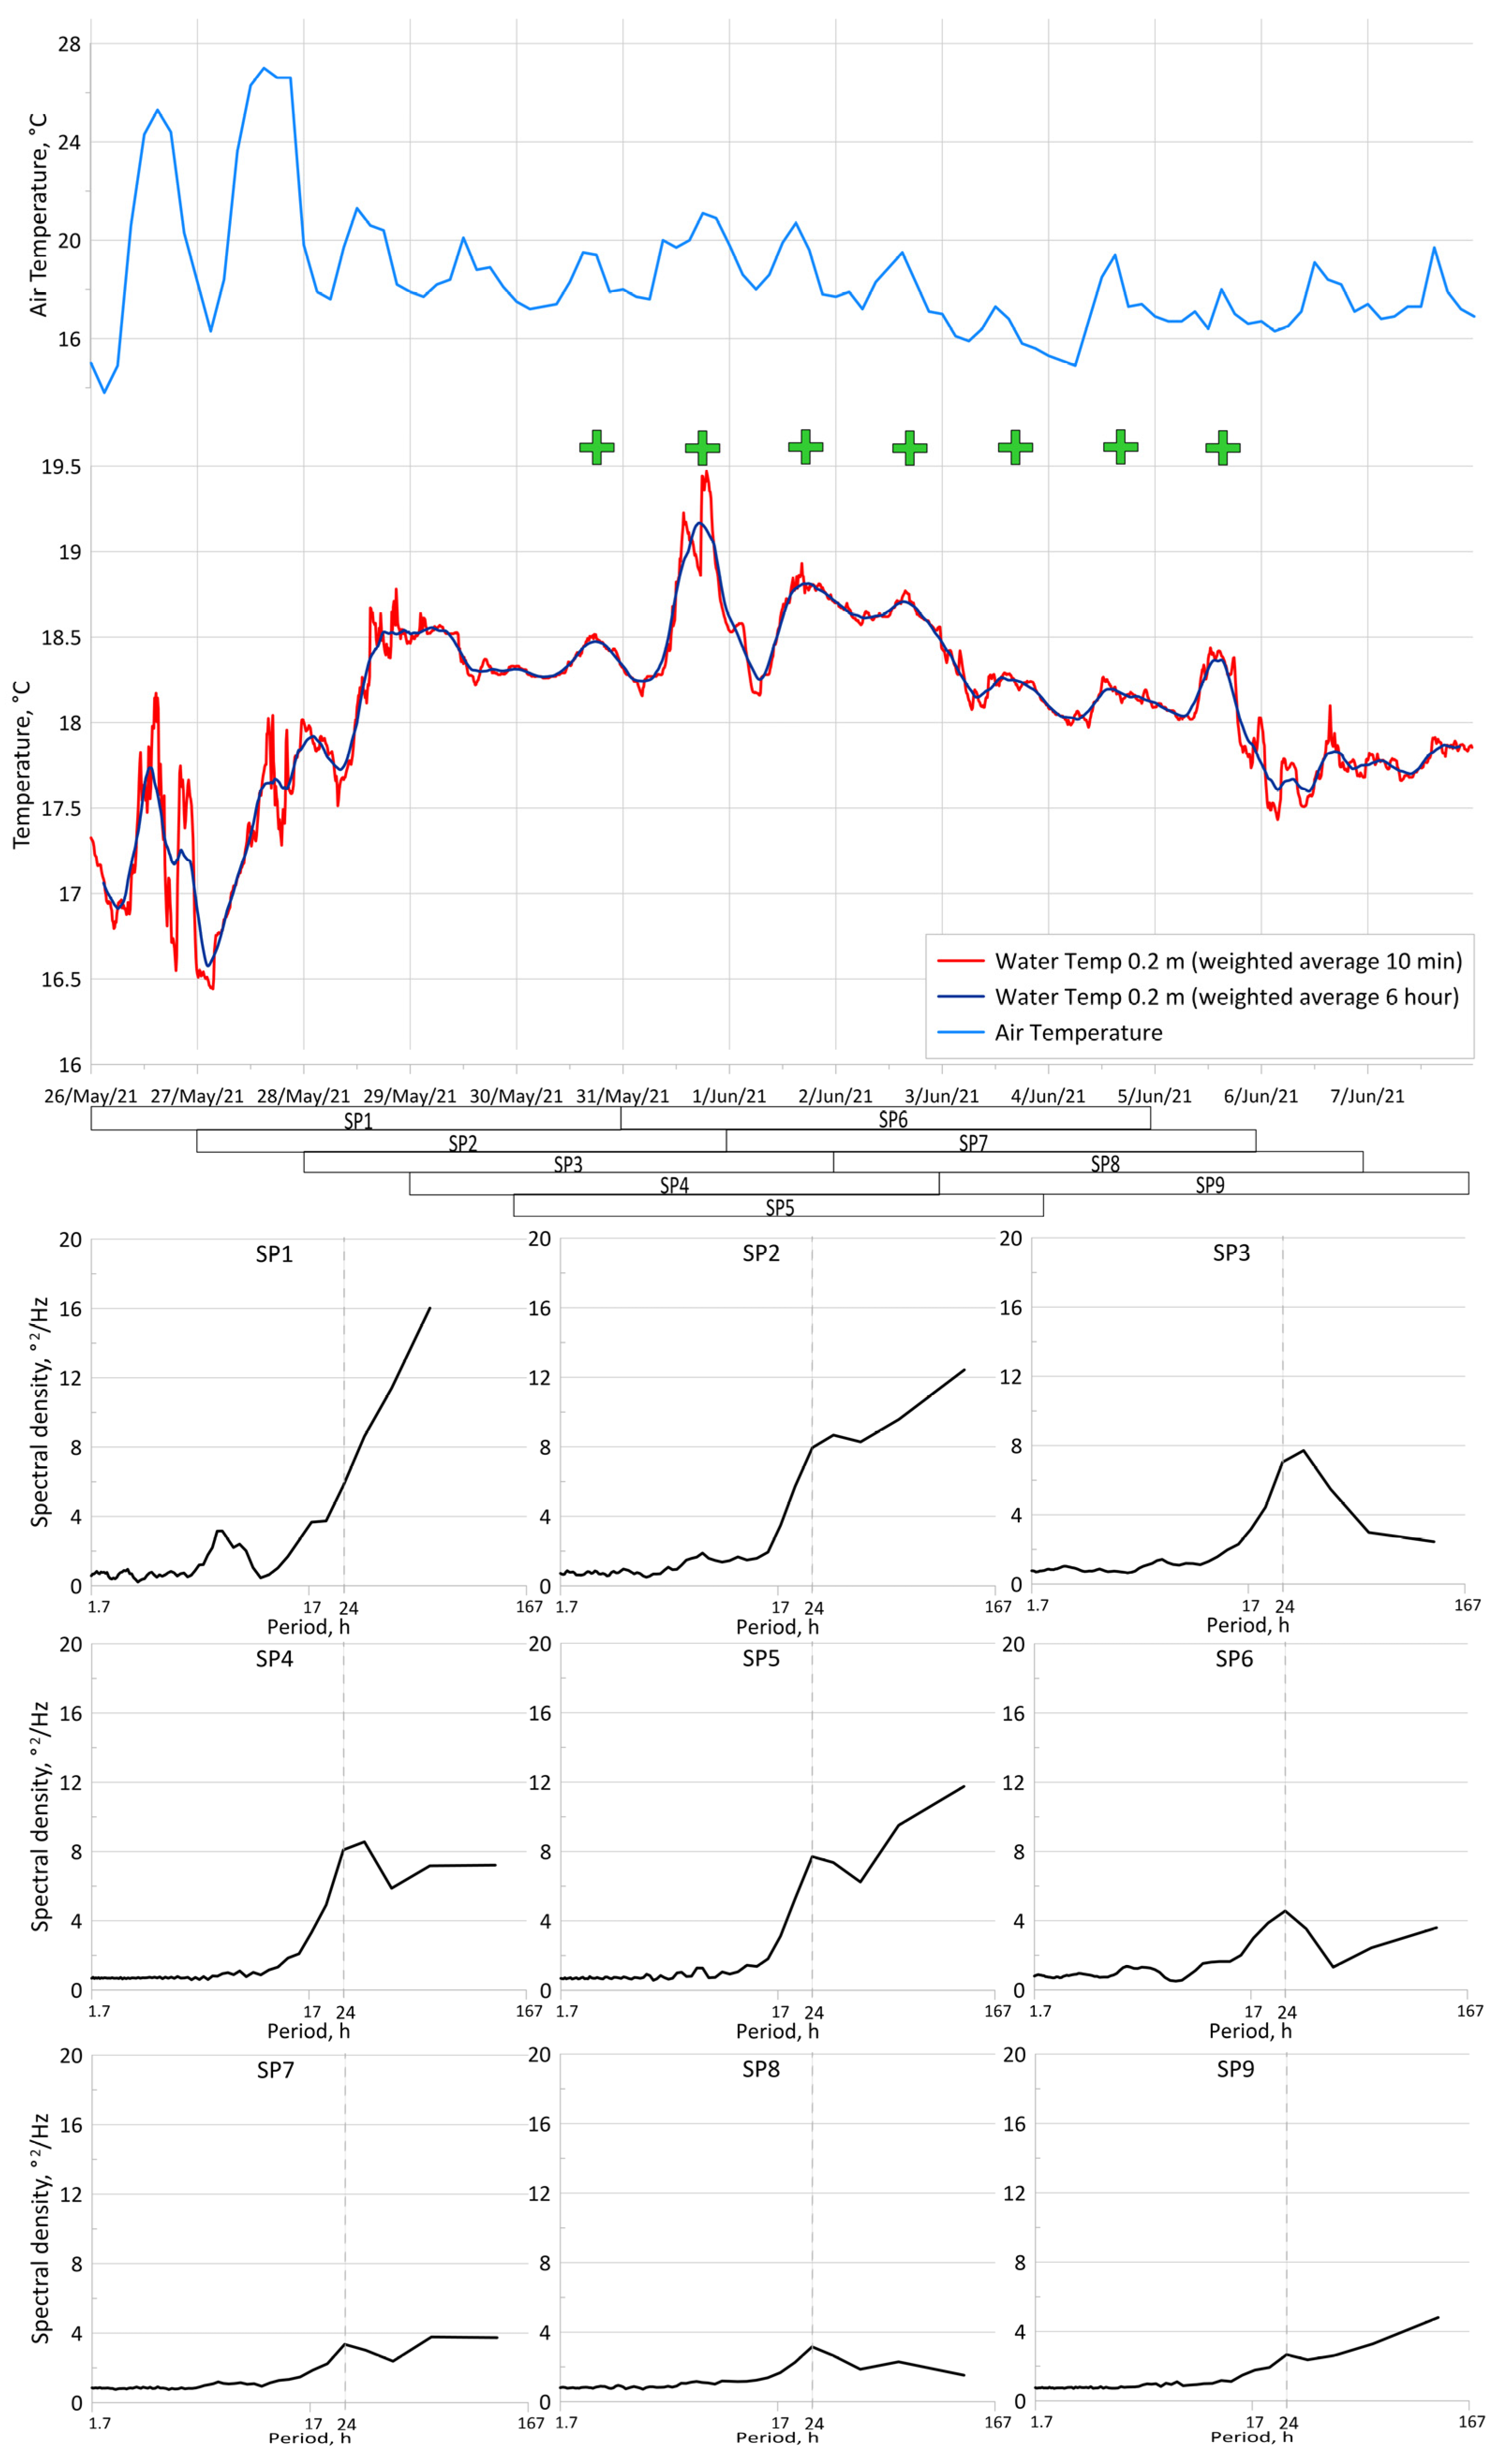
Let us consider, in detail, the quality of this method using the example of temperature analysis from 26 May to 7 June 2021 (Figure 11). During this period, daily variation in the air temperature was observed according to the weather station data. An amplitude of this variation was ~8 °C on 26–28 May and ~2–3 °C from 29 May to 7 June. To analyze the water temperature, we averaged the near-surface temperature (0.2 m) over 10 min and over 6 h. It is clearly seen that strong fluctuations are observed on 26–28 May with a period of about 12 h. There were no fluctuations on 29–30 May. From 31 May to 5 June, the diurnal cycle was well observed, and we highlighted these days with green crosses. The spectra for all periods are presented in the bottom panel of Figure 11. SP1 and SP2 do not correspond to the previously introduced criteria 1°C2/Hz. For the SP3 spectrum, the diurnal variation is confirmed. There are 3 days with a diurnal cycle and 2 days without it in the temperature graph for the SP3 period from 28 May to 22 June. If we analyze the entire period, then the diurnal cycle peaks were observed for the SP3–SP8 spectra—this is 6 days. There were 7 days with a diurnal cycle according to the visual analysis (green crosses in Figure 11). Thus, such a method could contain some errors but they are minor as we could apply this to a long data series. It is also important to note that the diurnal cycle was observed in NR Utrish during the synoptic period of 7–10 days in a row. Therefore, errors could be either at the beginning or the end of the period and estimated as 3–5% per month.
The spectral analysis was applied for all measurement periods. The first dates with the diurnal cycle were on 13–14 February 2020 (Figure 4); however, there is almost no peak on the spectra from 15 February. Further, the peak appears from 18 February to 22 February. Then, we observe a diurnal cycle on 1–10 March and then from 3 April to 12 April with the most pronounced peak and energy in the spectrum. Thus, a diurnal cycle is observed for 34% of the time (26/76 spectra) during the first measurement period from 01 February to 21 April 2020. However, according to the air temperature (Figure 4), the diurnal cycle in a range from 0 to +14 °C is present during this period. Analysis of the second measurement period showed that the diurnal cycle was observed in the following periods: from 20 to 24 July, from 1 to 8 August, 21–30 August, from 5 to 9 September, 17–22 September and several times in November 2020.
The third measurement period had peaks in all seasons except winter. The diurnal cycle was observed from 23 March to 4 April, 14–24 April, 26 April–2 May, 12 May–14 June, 18–26 June, 30 June–5 July, July 10–9 August, 14–31 August, 6–13 September, 7–12 October.
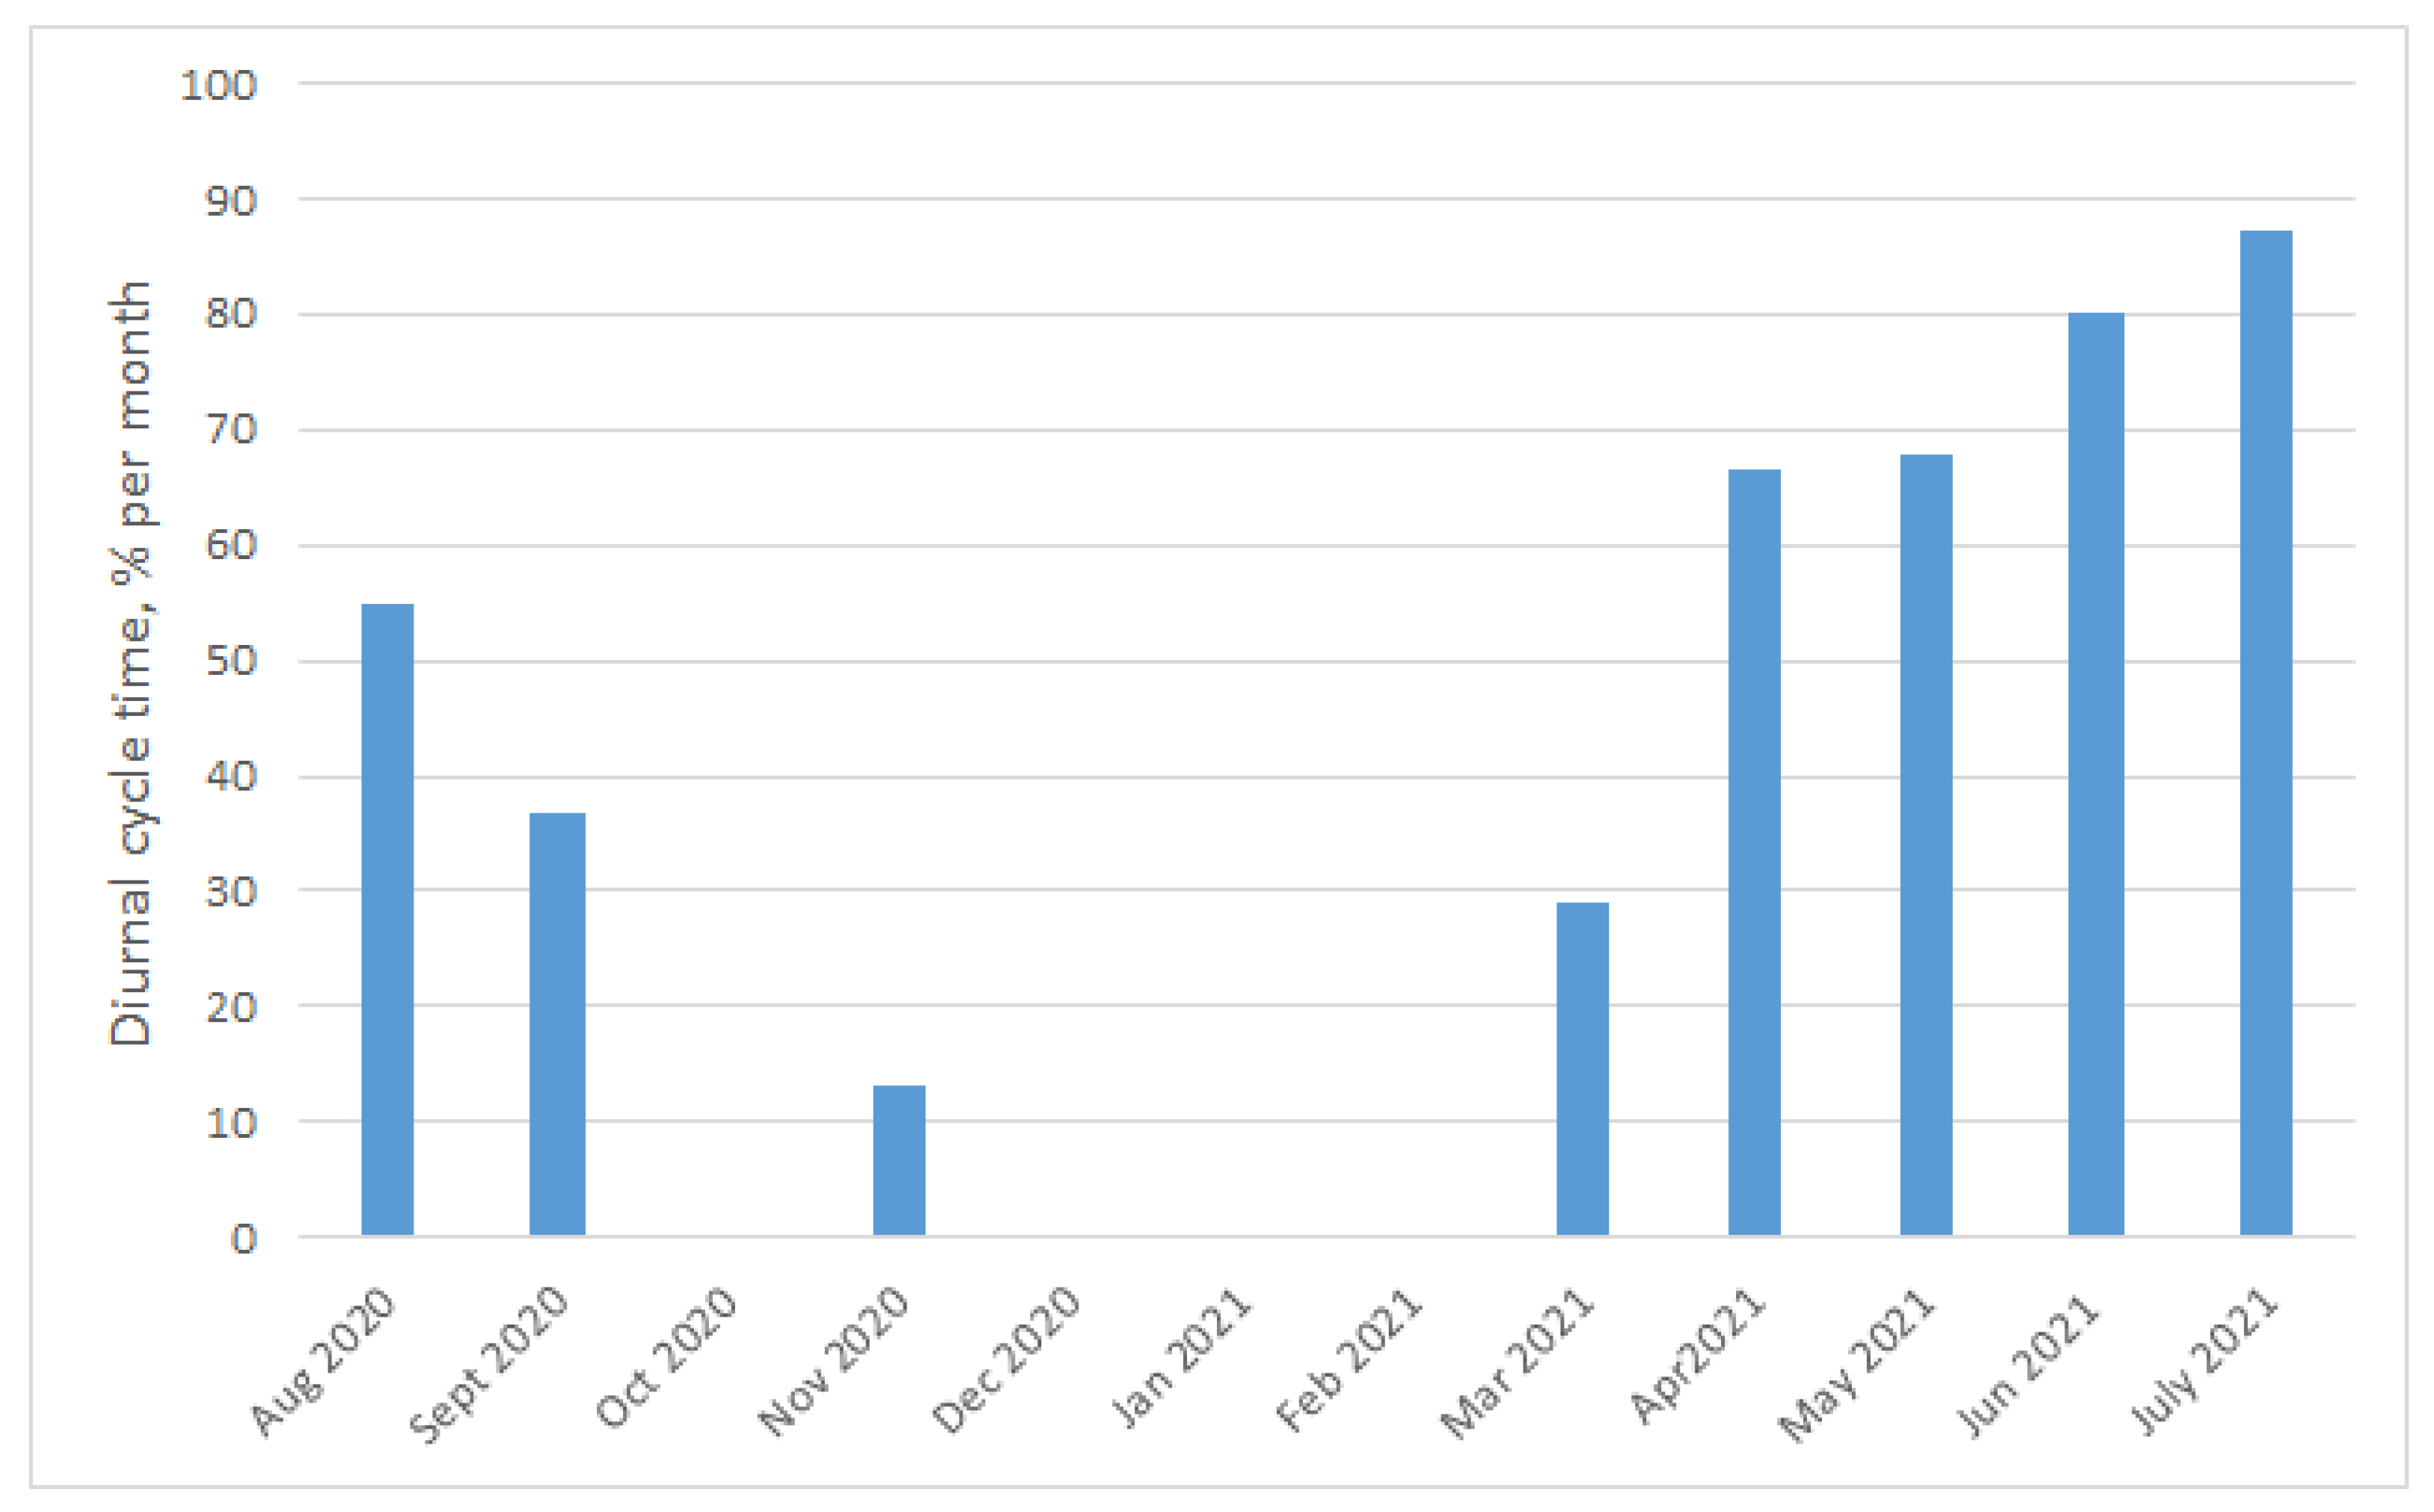
For the period from august 2020 to July 2021, we calculated the repeatability of days with an observed diurnal cycle for the different months (Figure 12). We obtained the maximum of the diurnal cycle in July 2021 (88%) and its absence from October to February.
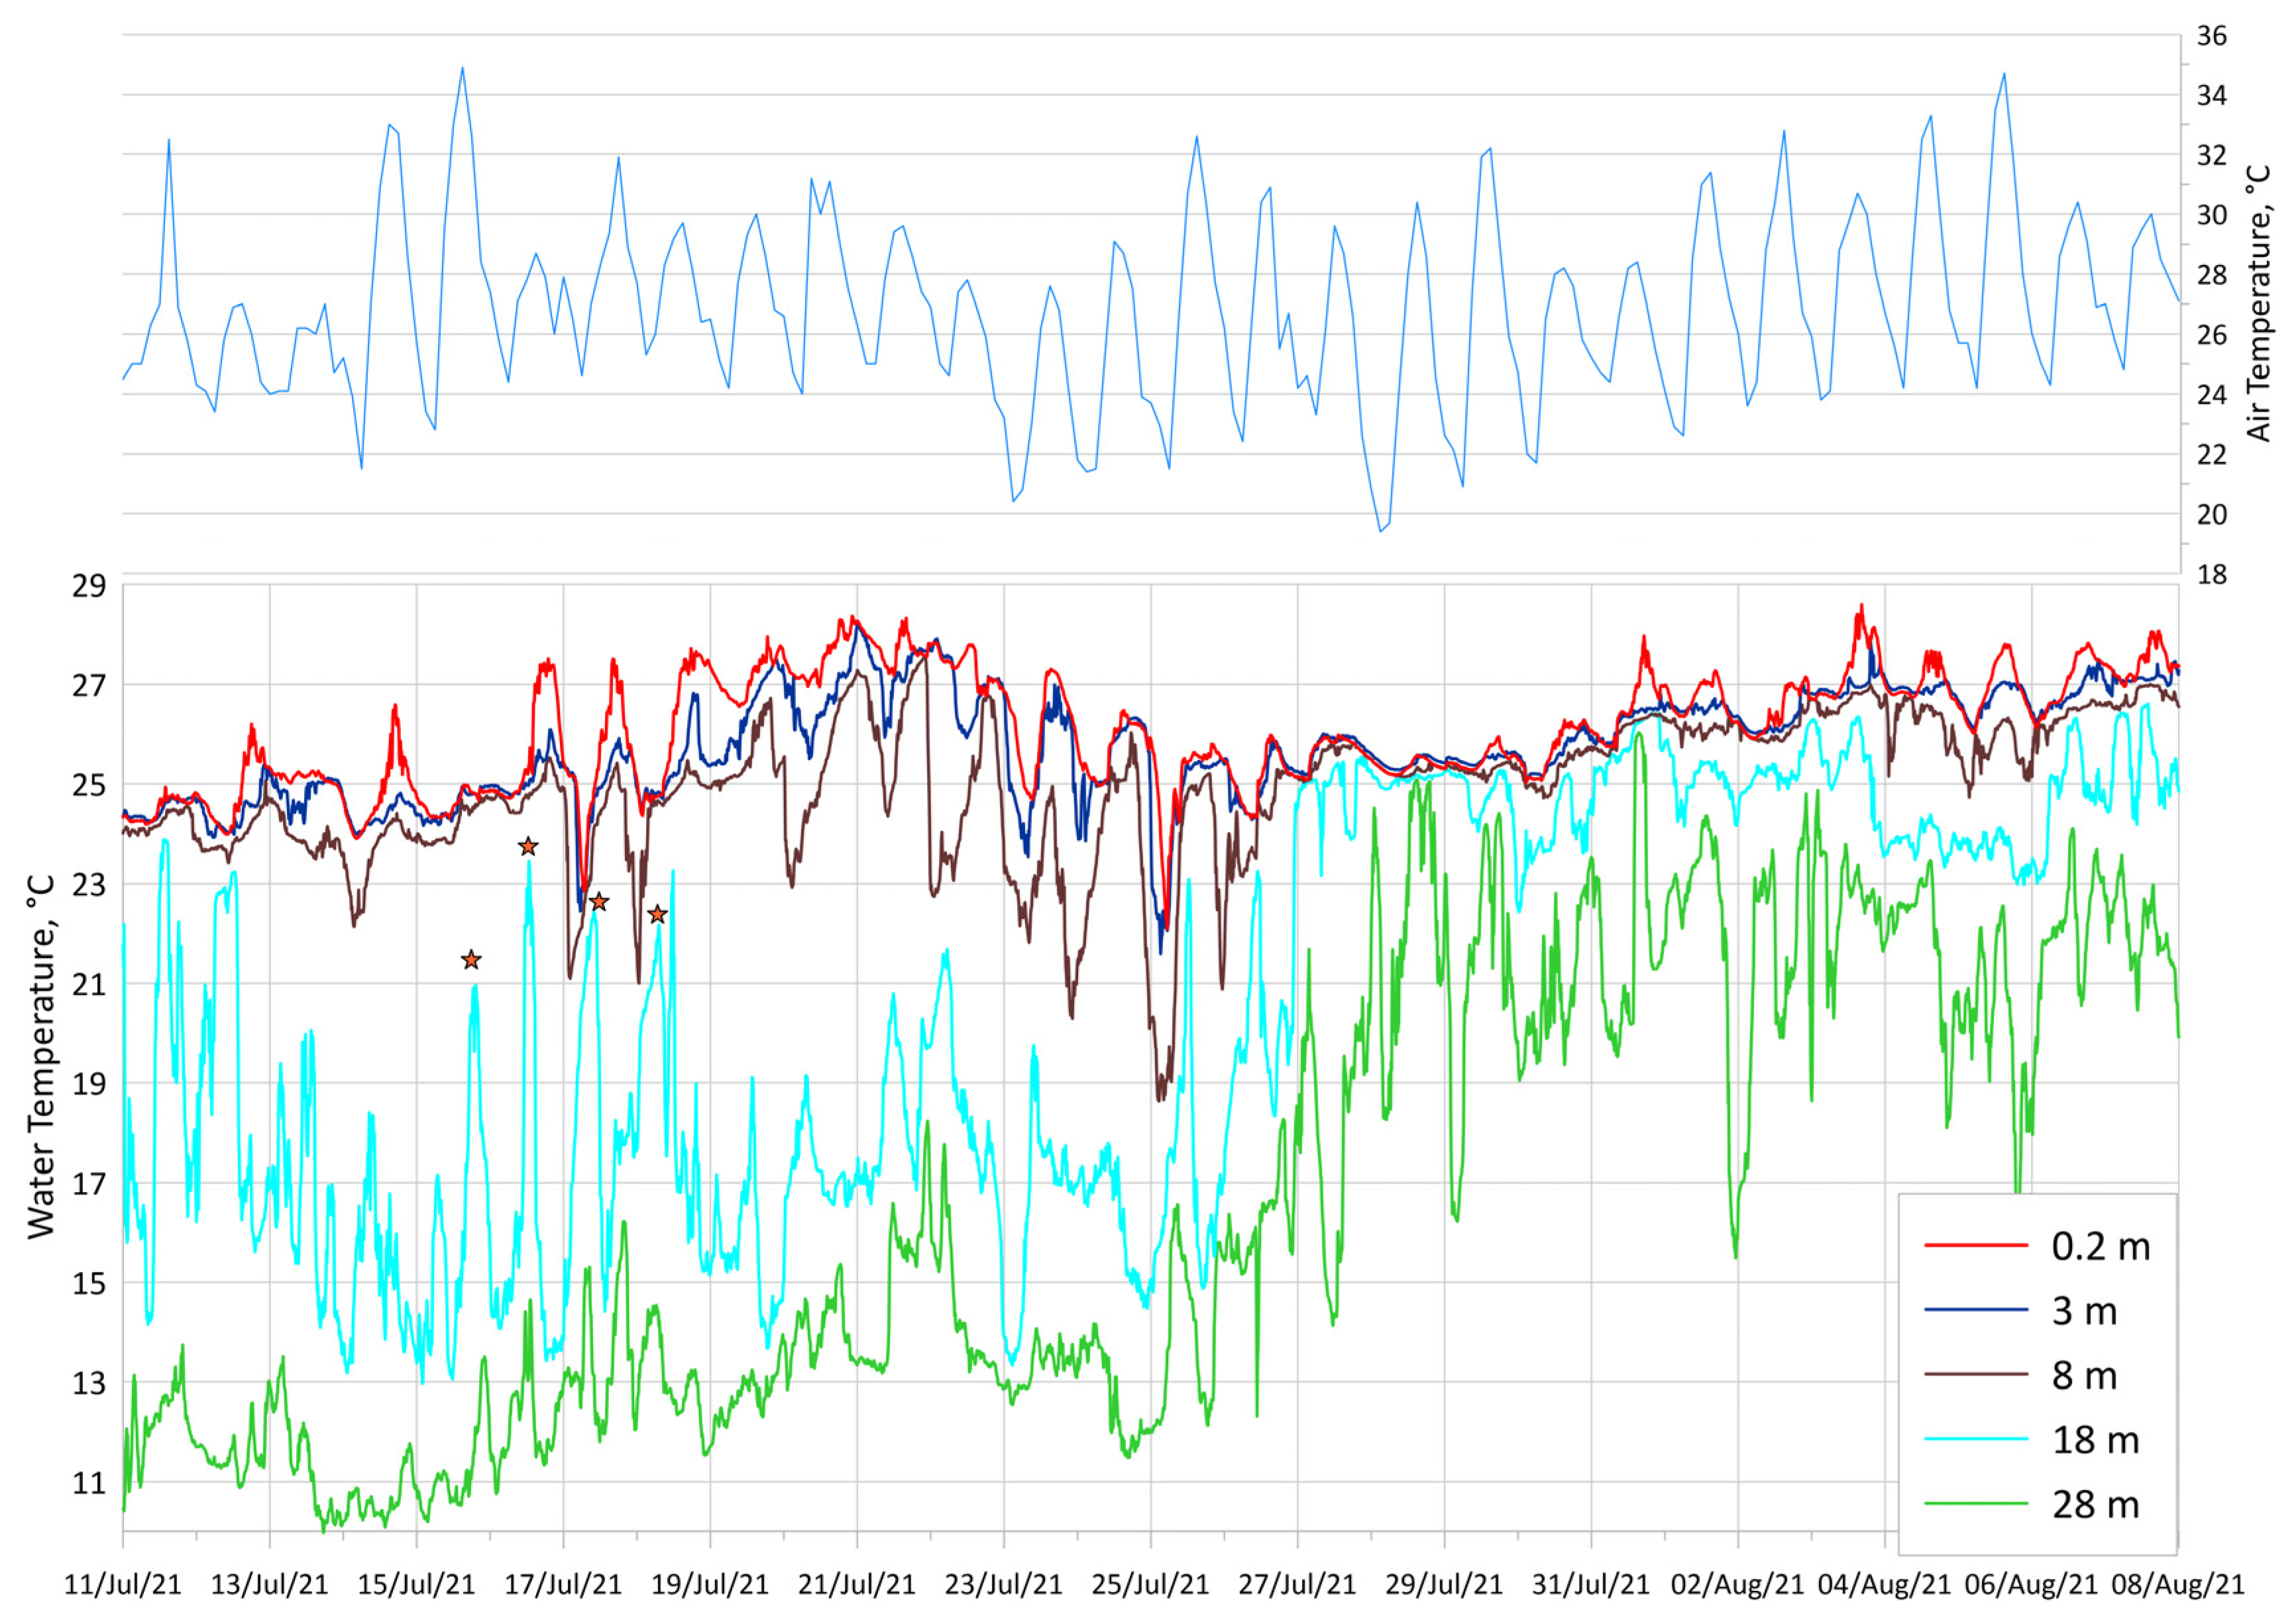
We did not consider the amplitude of the daily temperature variations in detail. However, general estimates of the average amplitude/magnitude are listed below. The average amplitude of the diurnal cycle is about 0.4–0.7 °C. The high amplitude in 2020 was 1.1–1.3 °C in July–August. Anomalous daily temperature fluctuations were observed in the upper layer in July–August 2021 (Figure 13). The amplitude was 2.4 °C on 14–15 July and 1.8 °C on 5–6 August. Air temperature daily fluctuations were in a range of 24–32 °C and were not anomalous in this season. Abnormal fluctuations with an amplitude of up to 4 °C were observed on 17–18 July, but it should be noted that night cooling occurred earlier at lower horizons, which could indicate the advective nature of these oscillations. The superposition of the diurnal cycle and the internal wave with an inertial period (~17 h) could be assumed, but this fact requires additional measurements and data. Our results are in good agreement with earlier research. The maximum diurnal cycle amplitude of 5.1 °C was observed at an open part of the Black Sea by the thermoprofiler buoy [76].

3.4. Internal Waves

The thermochain data were obtained with a high temporal resolution of 1 min, which makes it possible to track high-frequency temperature variability. Internal waves are high-frequency processes in the Black Sea, and their manifestations are described in [77,78].
Internal waves were analyzed as individual events. Several cases were visually selected from data, and the conditions of their existence were described.
Internal waves were registered several times according to our measurements (see Figure 14). They were observed in the presence of temperature stratification, at horizons from 5 m to the bottom. Several cases of internal waves with different frequencies are presented below.
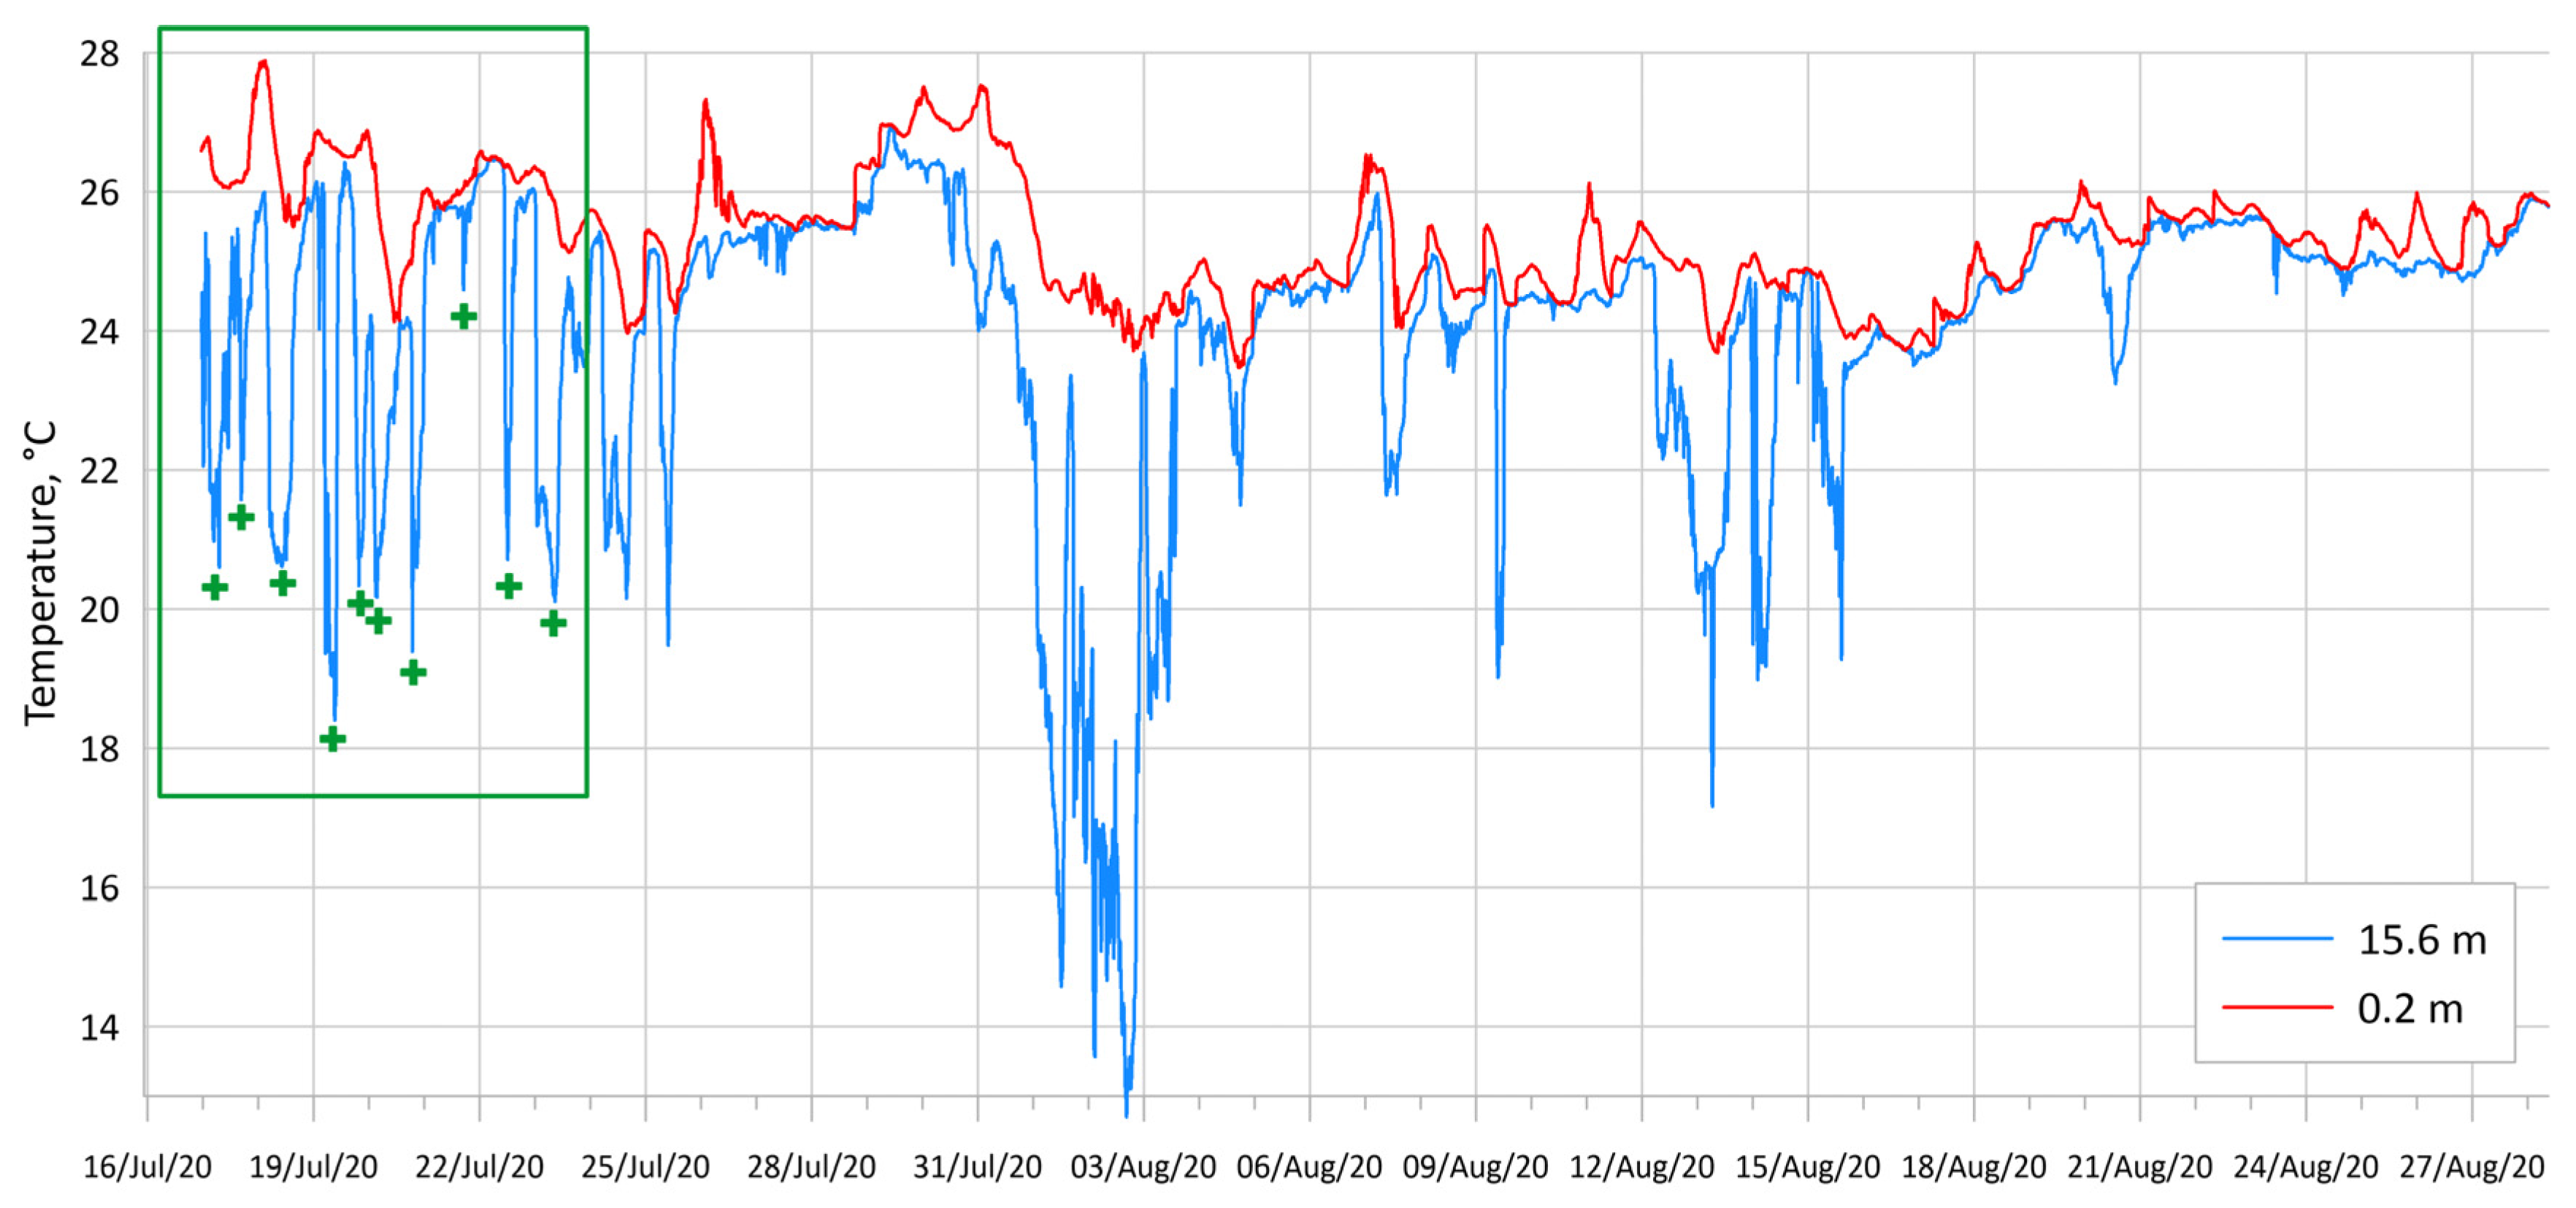
Figure 14 illustrates temperatures at two horizons for the period from 16 July to 29 August 2020. The oscillations were found at a depth of 15.6 m at the beginning of this period. It was found that the period of these oscillations varied from 10 to 20 h, and the inertial frequency of the Black Sea is 17.4 h. Five out of twelve oscillations had a period of 17–18 h, approximately corresponding to the inertial period for this area. These oscillations were irregular, so we can only observe that the temperature in the thermocline changed with such periods. Such oscillations are considered to be inertial internal waves with a period 10–20 h but, without additional information, the genesis of these is unclear. Previously, inertial waves with a period of about 17 h were observed and described in [79,80].
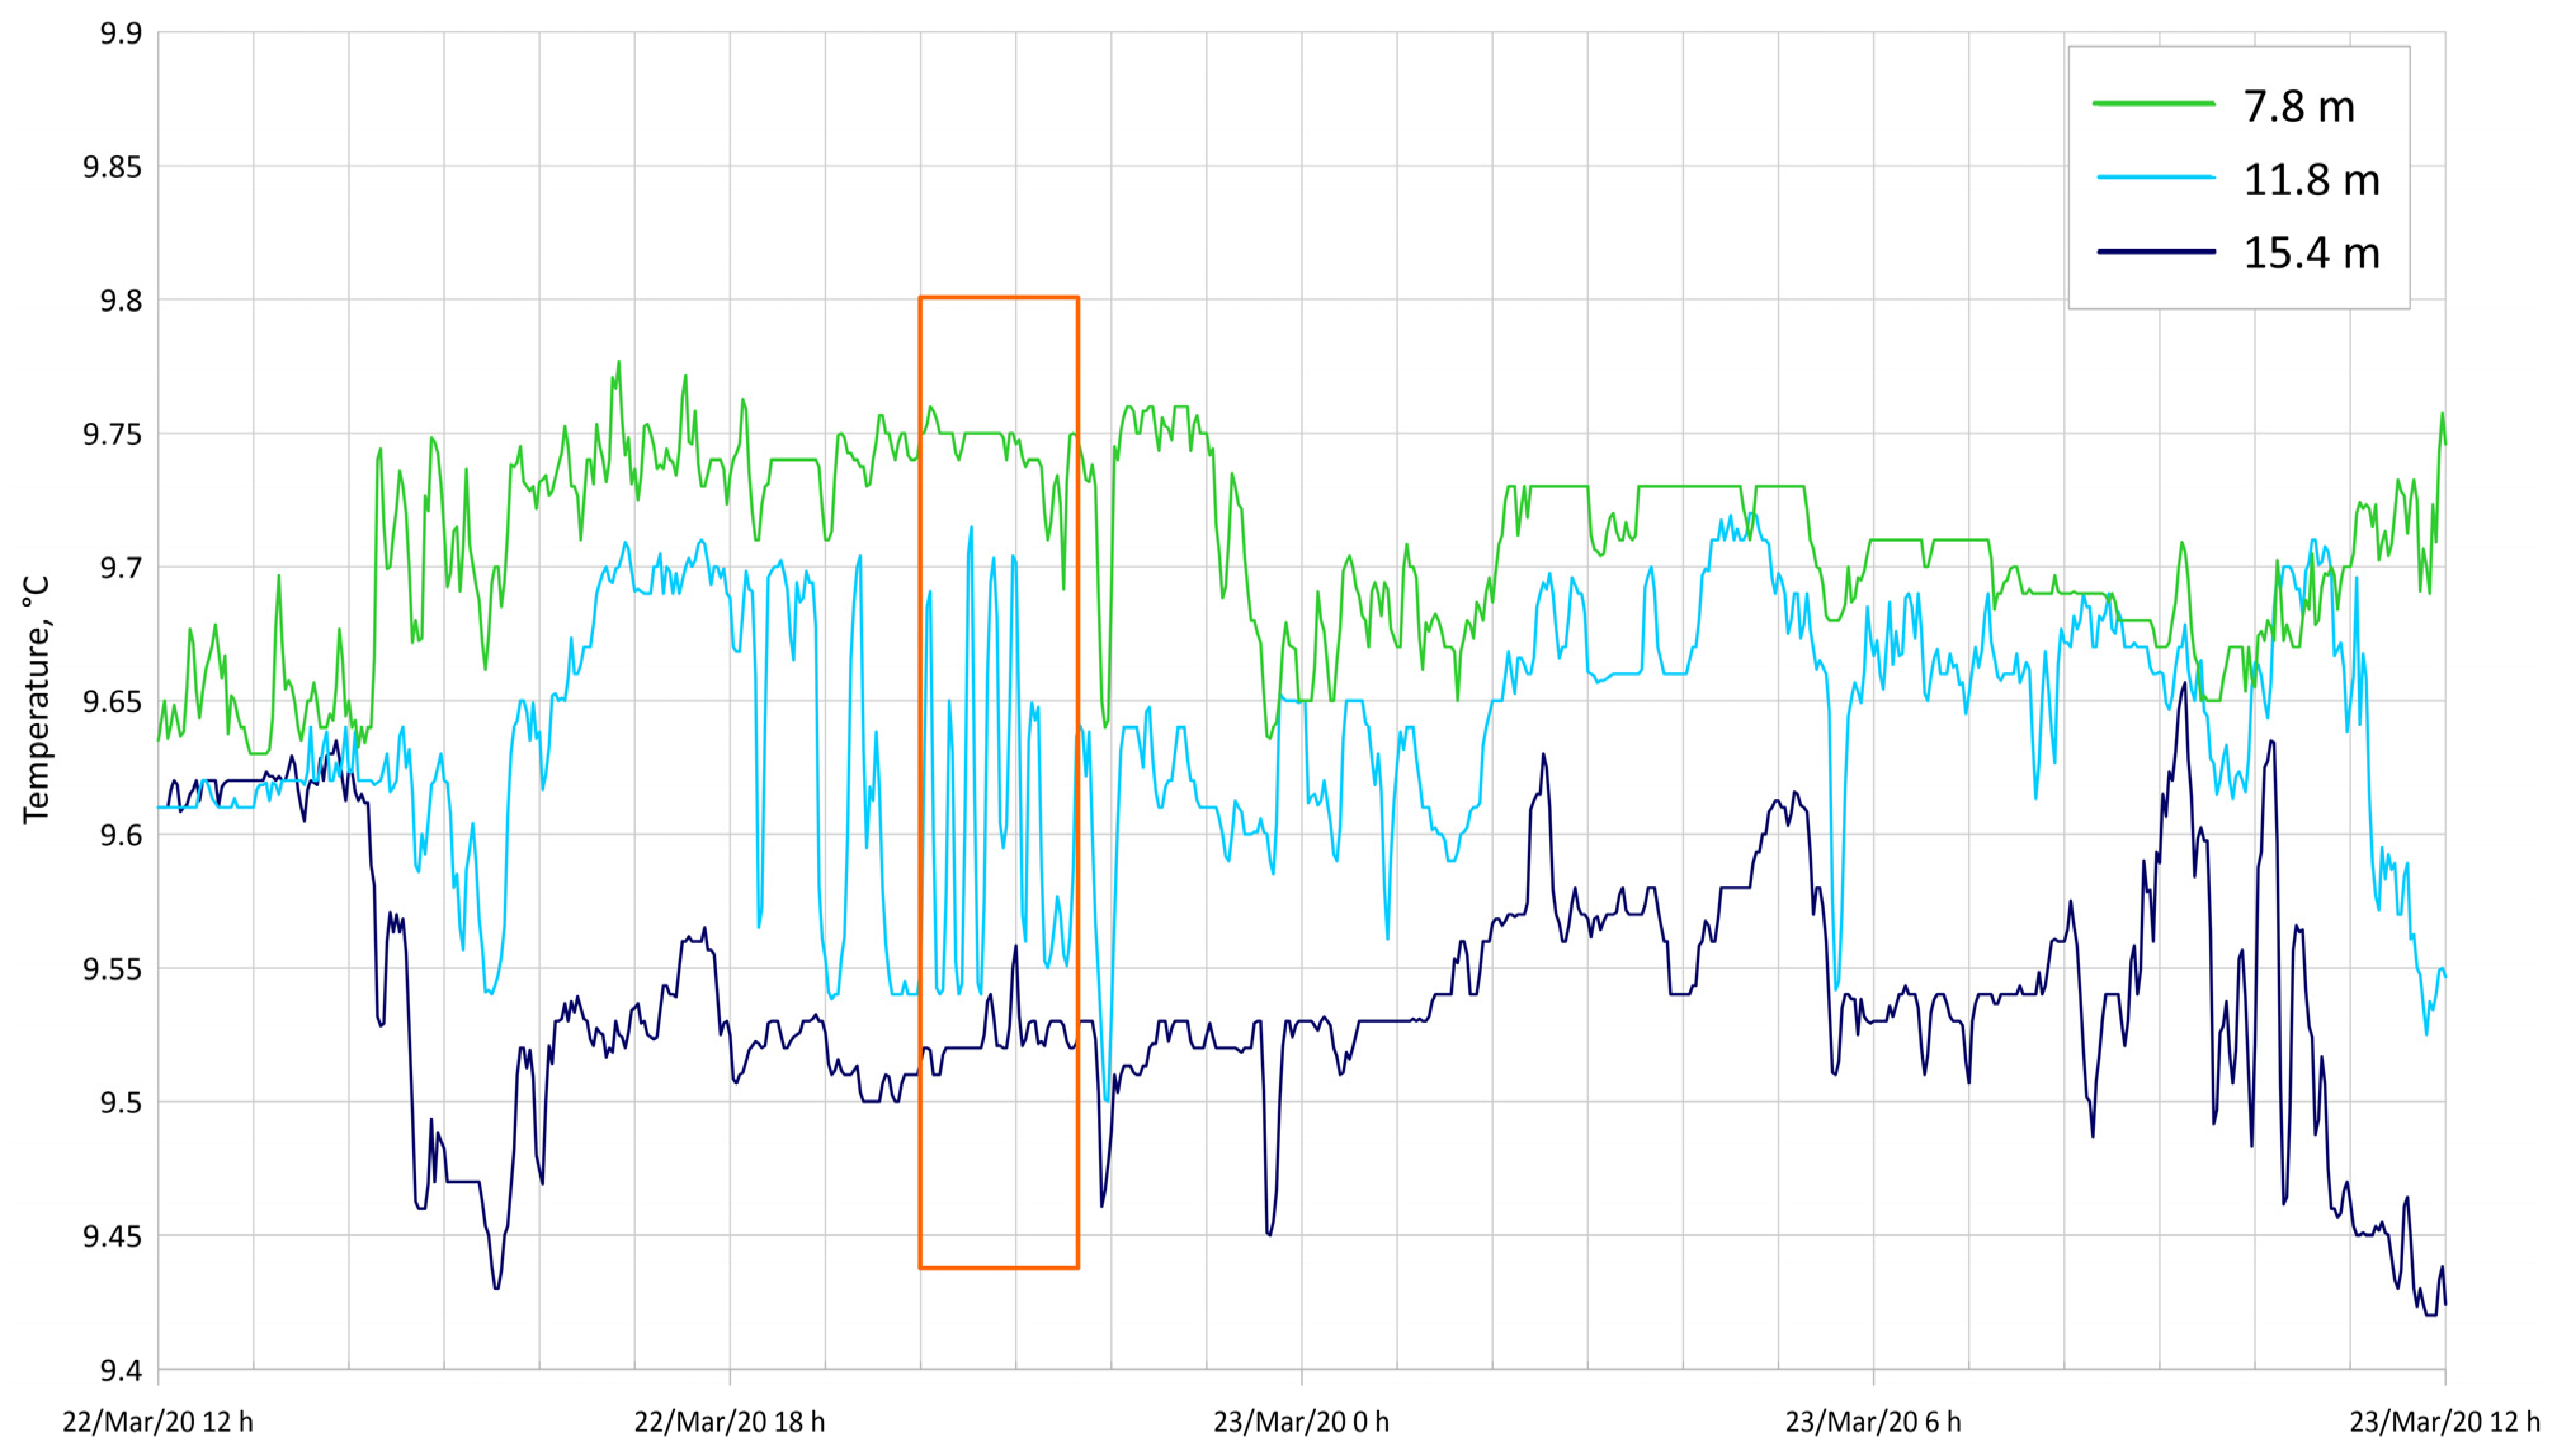
Figure 15 shows an example of internal waves with a period of ~13 min, which were well manifested for 2 h at a horizon of 11.8 m. The amplitude of temperature fluctuations was up to 0.17 °C. It can be assumed that the vertical range of fluctuations could reach 6–7 m, as the temperature fluctuations almost reached the values at the horizons of 7.8 and 15.4 m.
As a result of the analysis from the graphs, we found many manifestations of short-period internal waves at frequencies from 5 to 30 min and longer at periods of about 17 h. These results are generally consistent with the results from [77,79].

3.5. Model Quality Assessment

Hydrodynamic model data are often used as a basis for marine ecosystem research. In this work, we are able to compare model and real water temperature data. Estimates of the CMEMS models were based either only on satellite data or with 1–2 points of long-term measurements [57], so an additional point with long-term measurements is very important.
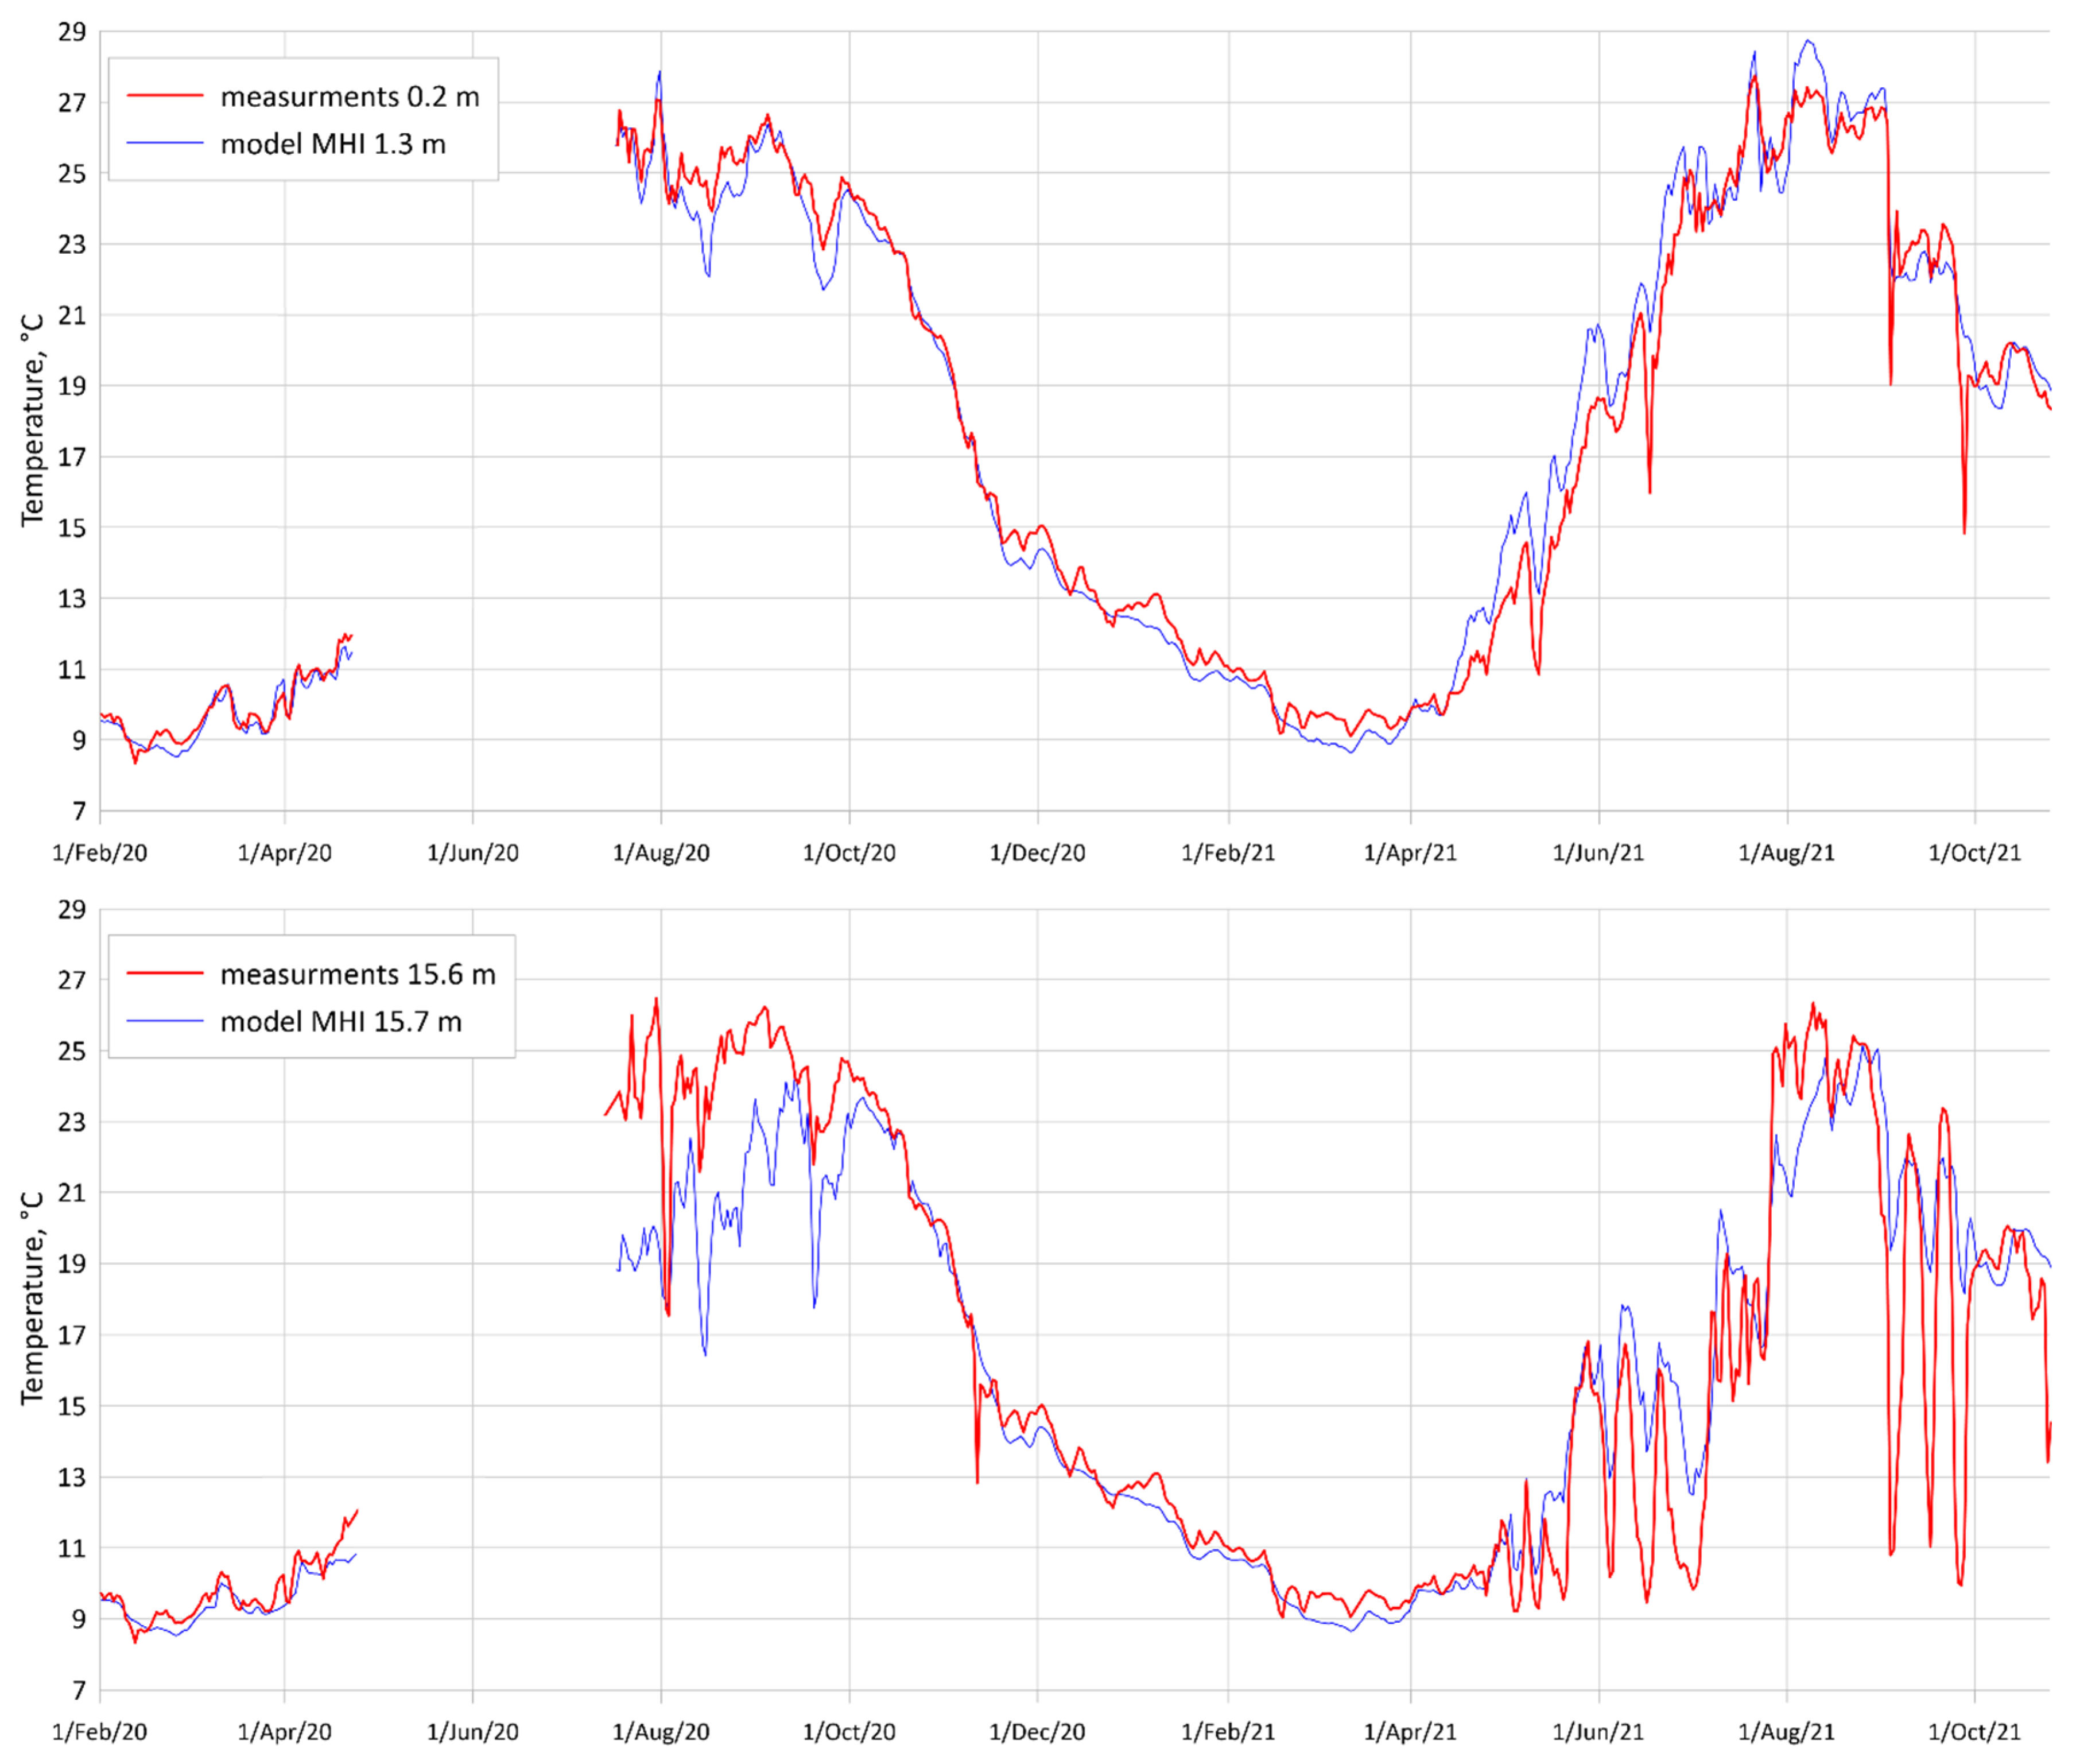
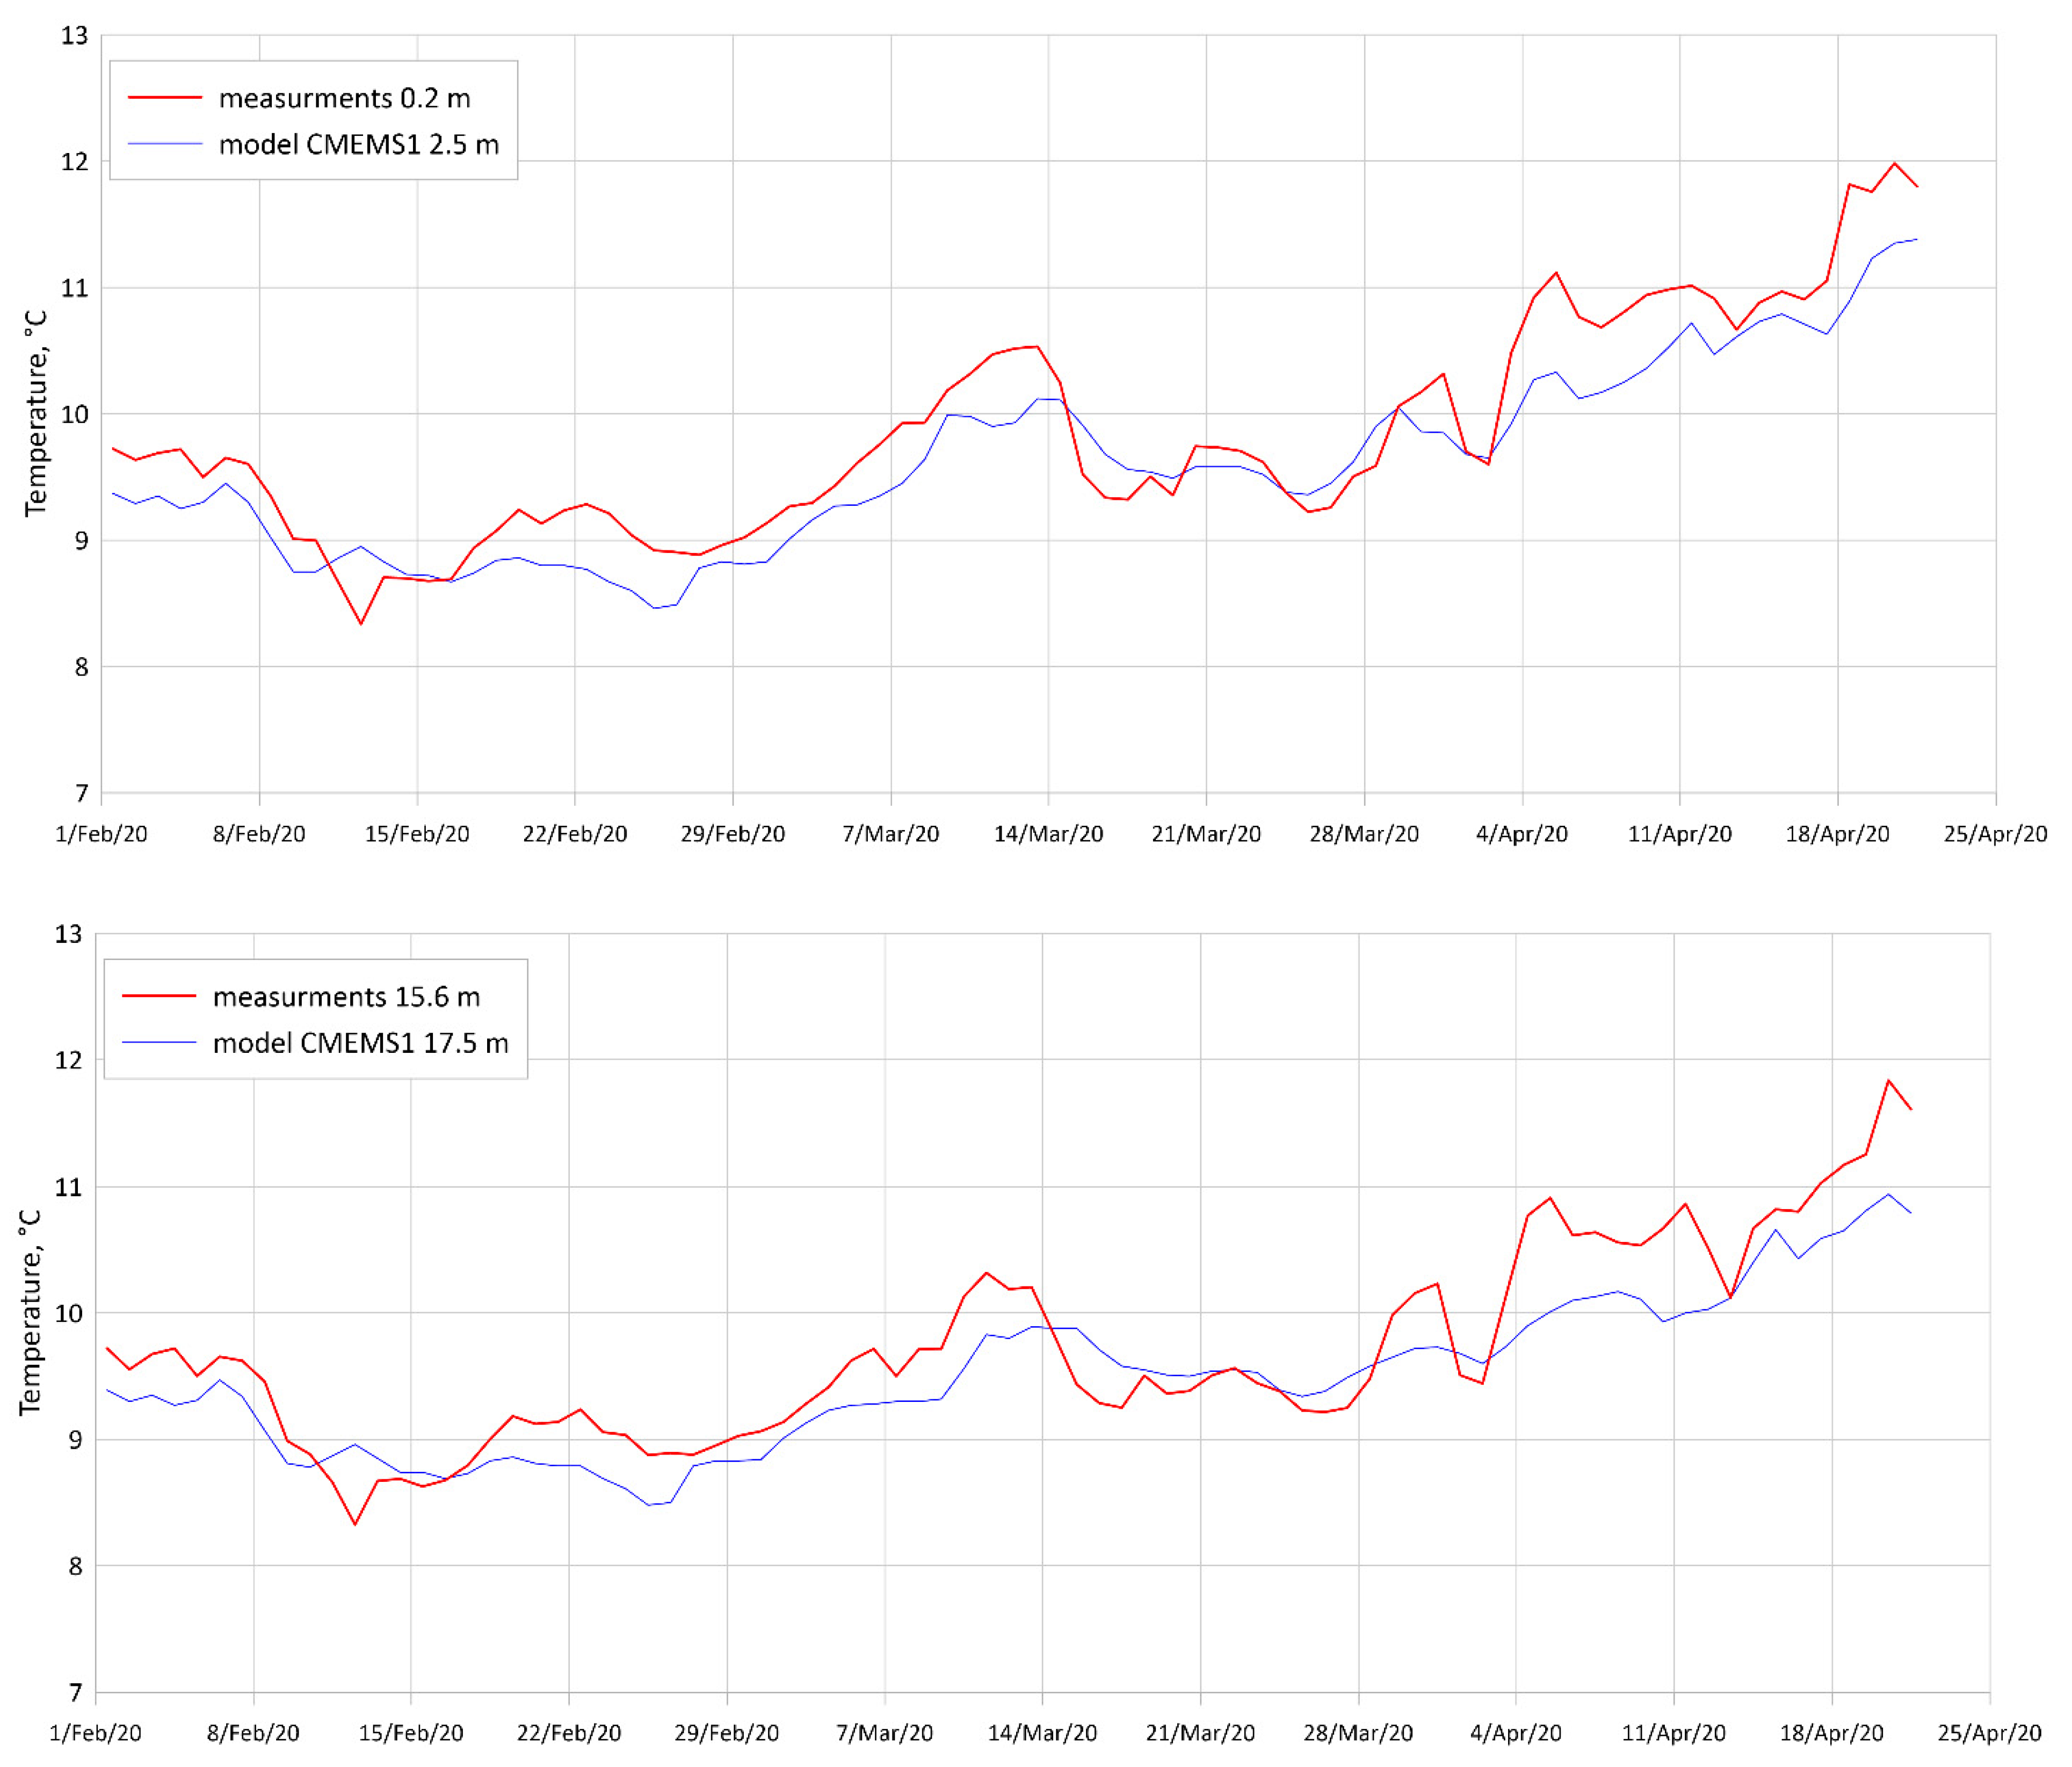
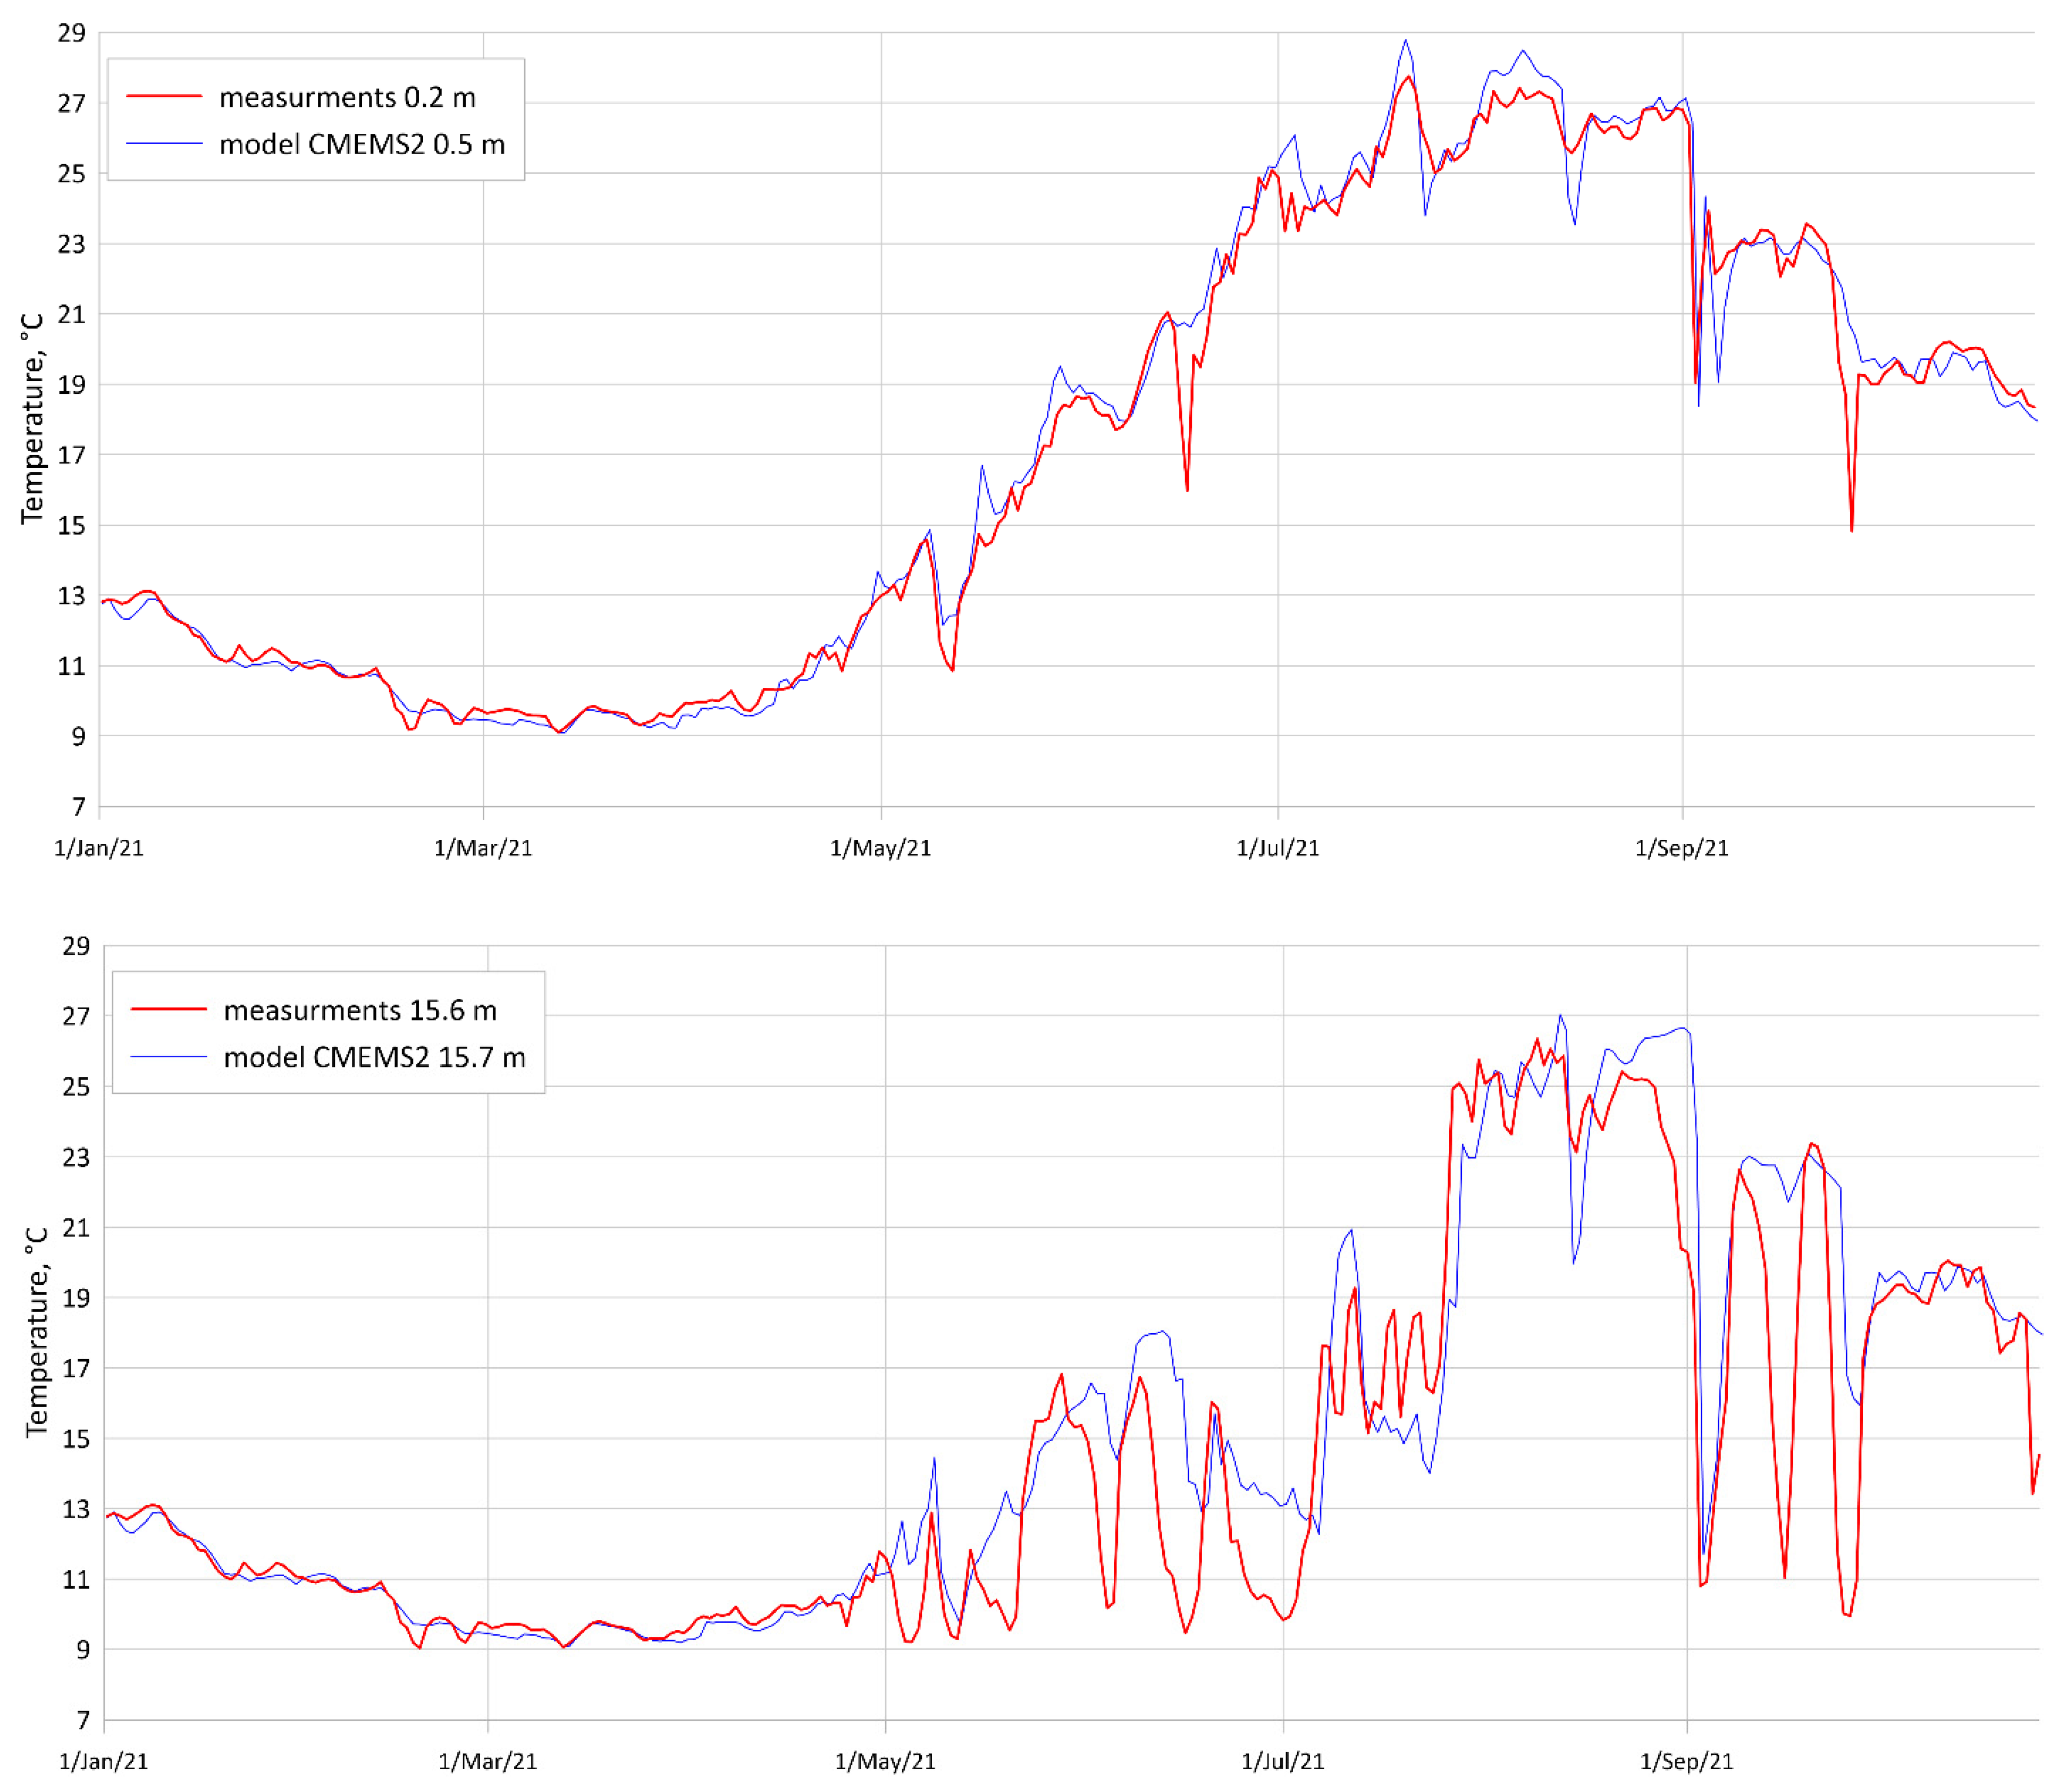
A comparison with the data from three hydrodynamic models was based on the thermistor-chain-measured data. The main goal of the assessment was to determine how and on what timescales models reproduce water temperature and its variability. The daily average surface horizon and the near-bottom horizon were compared. Temperature graphs are shown in Figure 16, Figure 17 and Figure 18.
The MHI model overestimated the surface temperature during the spring warming in April–May 2021 and underestimated it in August–October 2020 and 2021. The correlation is high at the surface and at depths. There was a noticeable underestimation for a horizon of 15.7 m in August–September 2020. Most likely, the upper mixed layer thickness and turbulent mixing reproduced in the MHI model are inaccurate. From May to October 2021, six events of sharp temperature decrease were registered, four of them observed in daily averaged data. The model partially reproduced three out of four events in May, June and September 2021.
The temperature at 15.6 m dropped from 21 to 10 °C in September 2021 according to the measurements. The MHI model reproduced these oscillations well in phase, but their amplitude was only 1–2 °C. Therefore, the model reproduces some dynamic processes, leading to the vertical displacement of the thermocline, but there could be an error in the location of the thermocline.
Figure 17 and Figure 18 illustrate the comparison between the CMEMS1 and the CMEMS2 models and measurements from February to April 2020. In general, these models accurately reproduce temperature. CMEMS2 for SST reproduced the full-temperature drop in September 2021 and half of the decreased amplitude in May 2021. For 15.6 m, CMEMS2 also reproduced the temperature decrease to 10 °C and half of the decreased amplitude in October 2021. Such differences in the results are probably caused by different parameterizations and resolutions.
Table 4 presents the results of the comparison and quality assessment according to the in situ data. The comparison was made for the nearest horizons; the difference between the model and measurements was less than 2.5 m in depth. This analysis shows that the model has a very good correlation near the surface (0.99) and good correlation (0.92) at 15 m depth. This is apparently due to the assimilation of satellite data for SST, and in the lower layers, only the modelled dynamic processes work. It should also be noted that the RMSE on the surface does not exceed 1 °C, and at depth, the error is more than 2 °C (except the CMEMS1 model, but in the period February–April 2020, there was a completely mixed layer).
The accuracy characteristics obtained in this work based on the temperature data are consistent with the results of validation performed on Argo buoys (and also SST) from quality information documents (QUID) [57,71]—see Table 5. Other validation was made for the MHI model (measurements from Argo buoys and the CORA v5.2 database), see Table 6.
The higher RMSE values in the top layer are likely the result of the model considering the average in the layer. In the case of reanalysis (both CMEMS1 and MHI), the satellite SST is not assimilated. In the fields of diagnosis (CMEMS2), the satellite SST is assimilated, and the error there seems to be lower according to Table 3. However, the choice of the sea layers 0–10 m and 10–100 m “swallowed” all the errors in temperature associated with the upper mixed layer formation, the position of the seasonal thermocline, cold intermediate layer, etc. Therefore, such processes could greatly increase the error in the 5–30 m (10–20 m) layer. In reanalysis with CMEMS1, this error turned out to be high according to Argo’s data.
However, the in situ data from the thermochains showed that the CMEMS2 has the same errors as in the MHI reanalysis, despite the higher horizontal and vertical resolution.

4. Summary and Conclusions

The moored thermistor chain was installed in NR Utrish with a high time resolution (1 min) in 2020. Based on temperature data, we conducted a primary analysis of various processes, such as seasonal variability, upwellings, diurnal cycle of temperature and internal waves, for the 2020–2021 period. Such measurements are unique and especially important for the reserve, as they allow biologists to rely on certain physical parameters and their variability.
The main results of the work are presented below.
  • A unique series of long-term water temperature data for Utrish was obtained and processed for the first time. Seasonal fluctuations in the water temperature could have a range from 8 °C in February to 28 °C in August. The characteristics of the temperature variability during the year in the NR Utrish water area are a valuable result for further ecosystem studies.
  • The diurnal cycle of water temperature was observed mainly in the spring–autumn period. According to the analysis, daytime heating usually does not exceed 2 °C. Internal waves could also affect the temperature structure, but their influence is momentary.
  • Short-period fluctuations in the temperature associated with an upwelling were greater than 10 °C. The water temperature decreased from 28 °C to 17 °C in a very short time—6–12 h. Evidence of such strong variations is essential for benthic communities’ studies. Upwelling in the Black Sea could lead to the vertical oscillation of the hypoxic layer, significantly affecting benthic communities [82].
  • High-resolution simulation data were compared with in situ data. SST is more precise than subsurface temperature, and the RMSE for all model SSTs was less than 1 °C. Thus, modern hydrodynamic models could be used for climatological and seasonal research in the studied area, but extreme short-term events were reproduced badly.
  • In situ measurements of the temperature verified the temperature structure in the coastal area of the Black Sea and provided support for all further ecosystem studies in the NR Utrish.
However, with a deeper study of each process, we were faced with significant limitations in the data, all of them connected with 1-point measurements. Diurnal temperature variation at a distance of 2–3 km from this point could be different. This is important for the analysis and verification of hydrodynamic models, since model results are always presented for some area. We could not separate the horizontal advection of cold waters from upwelling, and we do not know the direction or speed of the observed internal waves. A cluster of a few thermochains, presented by Ocherednik in [34], seems to be more complete. Additionally, any processes on the shelf are closely related to the dynamics of waters. Therefore, next to the thermochain, it is necessary to install an acoustic current profiler with a wave measurement function. This combination of the instruments could provide full analysis of the process on the shelf.

Author Contributions

K.S. and S.M.: Conceptualization, Methodology, Formal analysis, Investigation, Writing—Original draft preparation, Writing—Review and editing; A.M. and O.P.: Writing—editing, Data curation: O.B. Investigation, Writing—editing, Resources. All authors have read and agreed to the published version of the manuscript.

Funding

This study was funded by the Ministry of Science and Higher Education of Russia (State Assignment of the Institute of Oceanology, Russian Academy of Sciences, no. FMWE-2021-0002). The Black Sea physical reanalysis was funded by the State Assignment of the Marine Hydrophysical Institute, no. FNNN-2021-0007 “Interdisciplinary numerical modeling and high performance computations”. The analysis of the Ekman upwellings was supported by the President of the Russian Federation (grant no MK-709.2021.1.5). The work in NR was a part of the Chronicle of Nature (Zapovednik Utrish. Letopis prirody. Anapa: Russia) and research work “Tracking the course of natural processes in the reference ecosystems of the Utrish Reserve”.

Institutional Review Board Statement

Not applicable.

Informed Consent Statement

Not applicable.

Acknowledgments

The authors are grateful to the NR Utrish team and especially to K.M. Ayrapetyan and D.A. Onokhov for their assistance in field works.

Conflicts of Interest

The authors declare no conflict of interest.

References

  1. NR Utrish. Available online: https://utrishgpz.ru/about (accessed on 21 March 2023).
  2. Kolyuchkina, G.A.; Syomin, V.; Simakova, U.; Mokievsky, V.O. Presentability of the Utrish Nature Reserve’s benthic communities for the North Caucasian Black Sea Coast. Nat. Conserv. Res. 2018, 3, 1–16. [Google Scholar] [CrossRef]
  3. Glazov, D.M.; Bykhalova, O.N.; Udovik, D.A.; Yu, G.; Pilipenko, K.K.; Tarasiyan, V.V. Rozhnov Seasonal occurrence and distribution of whales in the Utrish reserve and adjacent sea waters. In Terrestrial and Marine Ecosystems of the Abrau Peninsula: History, Condition, Protection, Place of Publication Anapa; Bykhalova, O.N., Ed.; 2021; Volume 5, pp. 249–262. (In Russian) [Google Scholar]
  4. Ecological Atlas. Black and Azov Seas/Rosneft Oil Company PJSC, Arctic Science Center LLC, Research Foundation; NIR Foundation: Moscow, Russia, 2019; 464p. (In Russian) [Google Scholar]
  5. Pearson, T.H.; Rosenberg, R. Feast and famine: Structuring factors in marine benthic communities. In Organization of Communities: Past and Present; Gee, J.H.R., Giller, P.S., Eds.; Blackwell Science: Oxford, UK, 1987; pp. 373–395. [Google Scholar]
  6. Kolyuchkina, G.A.; Syomin, V.L.; Grigorenko, K.S.; Basin, A.B.; Lyubimov, I.V. The Role of Abiotic Environmental Factors in the Vertical Distribution of Macrozoobenthos at the Northeastern Black Sea Coast. Biol. Bull. 2020, 47, 1126–1141. [Google Scholar] [CrossRef]
  7. Vershinin, A.O.; Moruchkov, A.A.; Sukhanova, I.N.; Kamnev, A.N.; Morton, S.L.; Ramsdell, J.S.; Pan’kov, S.L. Seasonal changes in phytoplankton in the area of Cape Bolshoi Utrish off the Northern Caucasian coast in the Black Sea, 2001–2002. Oceanology 2004, 44, 372–378. [Google Scholar]
  8. Alimov, A.F. Intensity of metabolism in aquatic poikilothermic animals. In General Principles for the Study of Aquatic Ecosystems; Nauka: Leningrad, Russia, 1979; pp. 1–20. (In Russian) [Google Scholar]
  9. Kubryakov, A.; Bagaev, A.; Stanichny, S.; Belokopytov, V. Thermohaline structure, transport and evolution of the Black Sea eddies from hydrological and satellite data. Prog. Oceanogr. 2018, 167, 44–63. [Google Scholar] [CrossRef]
  10. Akpinar, A.; Fach, B.A.; Oguz, T. Observing the subsurface thermal signature of the Black Sea Cold Intermediate Layer with Argo profiling floats. Deep. Sea Res. Part I Oceanogr. Res. Pap. 2017, 124, 140–142. [Google Scholar] [CrossRef]
  11. Tuzhilkin, V.S.; Arkhipkin, V.S.; Myslenkov, S.A.; Sam-borsky, T.V. Synoptic variability of thermohalineconditions in the Russian part of the Black Sea coastal zone. Vestnik Moskovskogo Universiteta, Ser. 5. Geography 2012, 6, 46–53. [Google Scholar]
  12. Podymov, O.I.; Zatsepin, A.G.; Ocherednik, V.V. Increase of Temperature and Salinity in the Active Layer of the North-Eastern Black Sea from 2010 to 2020. Phys. Oceanogr. 2021, 28, 257–265. [Google Scholar] [CrossRef]
  13. Ivanov, V.A.; Belokopytov, V.N. Oceanography of the Black Sea; Marine Hydrophysical Inst., National Academy of Sciences of Ukraine: Sevastopol, Russia, 2011. (In Russian)
  14. Shapiro, G. Black Sea Circulation. In Encyclopedia of Ocean Sciences; Academic Press: Cambridge, MA, USA, 2010; pp. 401–414. [Google Scholar] [CrossRef]
  15. Staneva, J.V.; Dietrich, D.E.; Stanev, E.V.; Bowman, M.J. Rim Current and coastal eddy mechanisms in aneddy-resolving Black Sea general circulation model. J. Mar. Syst. 2001, 31, 137–157. [Google Scholar] [CrossRef]
  16. Kubryakov, A.A.; Stanichny, S.V.; Zatsepin, A.G.; Kremenetskiy, V.V. Long-term variations of the Black Sea dynamics and their impact on the marine ecosystem. J. Mar. Syst. 2016, 163, 80–94. [Google Scholar] [CrossRef]
  17. Kubryakov, A.A.; Stanichny, S.V. Mesoscale eddies in the Black Sea from satellite altimetry data. Oceanology 2015, 55, 56–67. [Google Scholar] [CrossRef]
  18. Zatsepin, A.G.; Ginzburg, A.I.; Kostianoy, A.G.; Kremenetskiy, V.; Krivosheya, V.G.; Stanichny, S.; Poulain, P.-M. Observations of Black Sea mesoscale eddies and associated horizontal mixing. J. Geophys. Res. 2003, 108, 3246. [Google Scholar] [CrossRef]
  19. Zatsepin, A.G.; Baranov, V.I.; Kondrashov, A.A.; Korzh, A.O.; Kremenetskiy, V.V.; Ostrovskii, A.G.; Soloviev, D.M. Submesoscale eddies at the caucasus Black Sea shelf and the mechanisms of their generation. Oceanology 2011, 51, 554. [Google Scholar] [CrossRef]
  20. Miladinova, S.; Stips, A.; Garcia-Gorriz, E.; Moy, D.M. Black Sea thermohaline properties: Long-term trends and variations. J. Geophys. Res. Oceans 2017, 122, 5624–5644. [Google Scholar] [CrossRef] [PubMed]
  21. Mohamed, B.; Ibrahim, O.; Nagy, H. Sea Surface Temperature Variability and Marine Heatwaves in the Black Sea. Remote Sens. 2022, 14, 2383. [Google Scholar] [CrossRef]
  22. Ginzburg, A.I.; Kostianoy, A.G.; Serykh, I.V.; Lebedev, S.A. Climate Change in the Hydrometeorological Parameters of the Black and Azov Seas (1980–2020). Oceanology 2021, 61, 745–756. [Google Scholar] [CrossRef]
  23. Ivanov, V.A.; Mikhailova, É.N. Upwelling in the Black Sea; ÉKOSI-Gidrofizika: Sevastopol, Russia, 2008. (In Russian) [Google Scholar]
  24. Stanichnaya, R.R.; Sergey, S. Black Sea upwellings. Sovrem. Probl. Distantsionnogo Zondirovaniya Zemli Iz Kosm. 2021, 18, 195–207. [Google Scholar] [CrossRef]
  25. Polonskii, A.; Muzyleva, M.A. Modern spatial-temporal variability of upwelling in the North-Western Black Sea and off the Crimea Coast. Izv. Ross. Akad. Nauk. Seriya Geogr. 2016, 4, 96–108. [Google Scholar] [CrossRef]
  26. Gawarkiewicz, G.; Korotaev, G.; Stanichny, S.; Repetin, L.; Soloviev, D. Synoptic upwelling and cross-shelf transport processes along the Crimean coast of the Black Sea. Cont. Shelf Res. 1999, 19, 977–1005. [Google Scholar] [CrossRef]
  27. Lomakin, P.D. Upwelling in the Kerch Strait and the adjacent waters of the Black Sea basedon the contact and satellite data. Morskoy Gidrofiz. Zhurnal 2018, 34, 123–133. [Google Scholar] [CrossRef]
  28. Silvestrova, K.P.; Zatsepin, A.G.; Myslenkov, S.A. Coastal upwelling in the Gelendzhik area of the Black Sea: Effect of wind and dynamics. Oceanology 2017, 57, 469–477. [Google Scholar] [CrossRef]
  29. Novikov, A.A.; Tuzhilkin, V.S. Seasonal and regionalvariations of water temperature synoptic anomalies in thenortheastern coastal zone of the Black Sea. Phys. Oceanogr. 2015, 1, 39–48. [Google Scholar]
  30. Divinsky, B.V.; Kuklev, S.B.; Zatsepin, A.G. Numerical simulation of an intensive upwelling event in the northeastern part of the Black Sea at the IO RAS hydrophysical testing site. Oceanology 2017, 57, 615–620. (In Russian) [Google Scholar] [CrossRef]
  31. Zatsepin, A.G.; Ostrovskii, A.G.; Kremenetskiy, V.V.; Nizov, S.S.; Piotoukh, V.B.; Soloviev, V.A.; Shvoev, D.A.; Tsibul’sky, A.L.; Kuklev, S.B.; Moskalenko, L.V.; et al. Subsatellite Polygon for Studying Hydrophysical Processes in the Black Sea Shelf–Slope Zone. Izv. Atmos. Ocean. Phys. 2014, 50, 16–29. [Google Scholar] [CrossRef]
  32. Ostrovskii, A.G.; Zatsepin, A.G.; Soloviev, V.A.; Tsibulsky, A.L.; Shvoev, D.A. Autonomous System for Vertical Profiling of the Marine Environment at a Moored Station. Oceanology 2013, 53, 233–242. [Google Scholar] [CrossRef]
  33. Ocherednik, V.V.; Baranov, V.I.; Zatsepin, A.G.; Kyklev, S.B. Thermochains of the Southern Branch, Shirshov Institute of Oceanology, Russian Academy of Sciences: Design, Methods, and Results of Metrological Investigations of Sensors. Oceanology 2018, 58, 661–671. [Google Scholar] [CrossRef]
  34. Ocherednik, V.V.; Zatsepin, A.G.; Kuklev, S.B.; Baranov, V.I.; Mashura, V.V. Examples of Approaches to Studying the Temperature Variability of Black Sea Shelf Waters with a Cluster of Temperature Sensor Chains. Oceanology 2020, 60, 149–160. [Google Scholar] [CrossRef]
  35. Ostrovskii, A.G.; Emelianov, M.V.; Kochetov, O.Y.; Kremenetskiy, V.V.; Shvoev, D.A.; Volkov, S.V.; Zatsepin, A.G.; Korovchinsky, N.M.; Olshanskiy, V.M.; Olchev, A.V. Automated Tethered Profiler for Hydrophysical and Bio-Optical Measurements in the Black Sea Carbon Observational Site. J. Mar. Sci. Eng. 2022, 10, 322. [Google Scholar] [CrossRef]
  36. Zatsepin, A.G.; Podymov, O.I. Thermohaline Anomalies and Fronts in the Black Sea and Their Relationship with the Vertical Fine Structure. Oceanology 2021, 61, 757–768. [Google Scholar] [CrossRef]
  37. Baranov, V.I.; Ocherednik, V.V.; Zatsepin, A.G.; Kuklev, S.B.; Mashura, V.V. First Results of Using an Automatic Stationary Station for Vertical Profiling of Aquatic Media at the Gelendzhik Research Site: A Promising Tool for Real-Time Coastal Oceanography. Oceanology 2020, 60, 120–126. [Google Scholar] [CrossRef]
  38. Kuklev, S.B.; Zatsepin, A.G.; Paka, V.T.; Baranov, V.I.; Kukleva, O.N.; Podymov, O.I.; Podufalov, A.P.; Korg, A.O.; Kondrashov, A.A.; Soloviev, D.M. Experience of Simultaneous Measurements of Parameters of Currents and Hydrological Structure of Water from a Moving Vessel. Oceanology 2021, 61, 132–138. [Google Scholar] [CrossRef]
  39. Tolstosheev, A.P.; Motyzhev, S.V.; Lunev, E.G. Results of Long-Term Monitoring of the Shelf Water Vertical Thermal Struture at the Black Sea Hydrophysical Polygon of RAS. Phys. Oceanogr. 2020, 27, 69–80. [Google Scholar] [CrossRef]
  40. Serebryany, A.N.; Khimchenko, E.E. Internal Waves of Mode 2 in the Black Sea. Dokl. Earth Sci. 2019, 488, 1227–1230. [Google Scholar] [CrossRef]
  41. Serebryany, A.; Khimchenko, E.; Zamshin, V.; Popov, O. Features of the Field of Internal Waves on the Abkhazian Shelf of the Black Sea according to Remote Sensing Data and In Situ Measurements. J. Mar. Sci. Eng. 2022, 10, 1342. [Google Scholar] [CrossRef]
  42. Korshenko, E.A.; Diansky, N.A.; Fomin, V.V. Reconstruction of the Black Sea Deep-Water Circulation Using INMOM and Comparison of the Results with the ARGO Buoys Data. Morskoy Gidrofiz. Zhurnal 2019, 35, 220–232. (In Russian) [Google Scholar] [CrossRef]
  43. Arkhipkin, V.S.; Kosarev, A.N.; Gippius, F.N.; Migali, D.I. Seasonal variability of the climatic fields of temperature, salinity and circulation of the Black and Caspian seas. Mosc. Univ. Bull. Ser. 5 Geogr. 2013, 5, 33–44. (In Russian) [Google Scholar]
  44. Stanev, E. Understanding Black Sea Dynamics: Overview of Recent Numerical Modeling. Oceanography 2005, 18, 56–75. [Google Scholar] [CrossRef]
  45. Demyshev, S.G.; Dymova, O.A.; Markova, N.V.; Korshenko, E.A.; Senderov, M.V.; Turko, N.A.; Ushakov, K.V. Undercurrents in the Northeastern Black Sea Detected on the Basis of Multi-Model Experiments and Observations. J. Mar. Sci. Eng. 2021, 9, 933. [Google Scholar] [CrossRef]
  46. Diansky, N.A.; Fomin, V.V.; Grigoriev, A.V.; Chaplygin, A.V.; Zatsepin, A.G. Spatial-temporal variability of inertial currents in the eastern part of the Black Sea in a storm period. Phys. Oceanogr. 2019, 26, 135–146. [Google Scholar] [CrossRef]
  47. Gusev, A.V.; Zalesny, V.B.; Fomin, V.V. Technique for Simulation of Black Sea Circulation with Increased Resolution in the Area of the IO RAS Polygon. Oceanology 2017, 57, 880–891. [Google Scholar] [CrossRef]
  48. Korotaev, G.K.; Shutyaev, V.P. Numerical Simulation of Ocean Circulation with Ultrahigh Spatial Resolution. Izv. Atmos. Ocean. Phys. 2020, 56, 289–299. [Google Scholar] [CrossRef]
  49. Palazov, A.; Ciliberti, S.; Peneva, E.; Gregoire, M.; Staneva, J.; Lemieux-Dudon, B.; Masina, S.; Pinardi, N.; Vandenbulcke, L.; Behrens, A.; et al. Black Sea Observing System. Front. Mar. Sci. 2019, 6, 315. [Google Scholar] [CrossRef]
  50. Ciliberti, S.A.; Grégoire, M.; Staneva, J.; Palazov, A.; Coppini, G.; Lecci, R.; Peneva, E.; Matreata, M.; Marinova, V.; Masina, S.; et al. Monitoring and Forecasting the Ocean State and Biogeochemical Processes in the Black Sea: Recent Developments in the Copernicus Marine Service. J. Mar. Sci. Eng. 2021, 9, 1146. [Google Scholar] [CrossRef]
  51. Korotaev, G.K.; Knysh, V.V.; Kubryakov, A.I. Study of formation process of cold intermediate layer based on reanalysis of Black Sea hydrophysical fields for 1971–1993. Izv. Atmos. Ocean. Phys. 2014, 50, 35–48. [Google Scholar] [CrossRef]
  52. Lima, L.; Aydoğdu, A.; Escudier, R.; Masina, S.; Ciliberti, S.A.; Azevedo, D.; Peneva, E.L.; Causio, S.; Cipollone, A.; Clementi, E.; et al. Black Sea Physical Reanalysis (CMEMS BS-Currents) (Version 1) [Data Set]; Copernicus Monitoring Environment Marine Service (CMEMS): Ramonville-Saint-Agne, France, 2020; Available online: https://resources.marine.copernicus.eu/product-detail/BLKSEA_MULTIYEAR_PHY_007_004/INFORMATION (accessed on 15 August 2021). [CrossRef]
  53. Gunduz, M.; Özsoy, E.; Hordoir, R. A model of Black Sea circulation with strait exchange (2008–2018). Geosci. Model Dev. 2020, 13, 121–138. [Google Scholar] [CrossRef]
  54. Demyshev, S.G.; Dymova, O.A. Numerical analysis of the Black Sea currents and mesoscale eddies in 2006 and 2011. Ocean. Dyn. 2018, 68, 1335–1352. [Google Scholar] [CrossRef]
  55. Mizyuk, A.I.; Korotaev, G.K. Black Sea intrapycnocline lenses according to the results of a numerical simulation of basin circulation. Izv. Atmos. Ocean. Phys. 2020, 56, 92–100. [Google Scholar] [CrossRef]
  56. Kholod, A.L.; Ratner, Y.B.; Ivanchik, M.V.; Martinov, M.V. Estimation of the numerical modeling accuracy of the Black Sea thermohaline fields based on using ARGO profiling floats. J. Phys.: Conf. Ser. 2018, 1128, 012150. [Google Scholar] [CrossRef]
  57. Lima, L.; Ciliberti, S.; Aydogdu, A.; Escudier, R.; Masina, S.; Azevedo, D.; Peneva, E.; Causio, S.; Cipollone, A.; Clementi, E.; et al. Quality Information Document CMEMS. 2022. Available online: https://catalogue.marine.copernicus.eu/documents/QUID/CMEMS-BS-QUID-007-004.pdf (accessed on 21 March 2023).
  58. Myslenkov, S.; Silvestrova, K.; Krechik, V.; Kapustina, M. Verification of the Ekman Upwelling Criterion with In Situ Temperature Measurements in the Southeastern Baltic Sea. J. Mar. Sci. Eng. 2023, 11, 179. [Google Scholar] [CrossRef]
  59. Krechik, V.; Myslenkov, S.; Kapustina, M. New possibilities in the study of coastal upwellings in the southeastern Baltic Sea with using thermistor chain. Geogr. Environ. Sustain. 2019, 12, 44–61. [Google Scholar] [CrossRef]
  60. Saha, S.; Moorthi, S.; Wu, X.; Wang, J.; Nadiga, S.; Tripp, P.; Behringer, D.; Hou, Y.-T.; Chuang, H.-Y.; Iredell, M.; et al. The NCEP climate forecast system version 2. J. Clim. 2014, 27, 2185–2208. [Google Scholar] [CrossRef]
  61. Available online: https://rp5.ru/ (accessed on 21 March 2023).
  62. Petrov, D. Properties of the frequency spectra of the temperature anomalies of ocean surface and near-surface air in a simple stochastic climate model with fluctuating parameters. Извecтия Poccийcкoй Aкaдeмии Hayк. Физикa Aтмocфepы u Oкeaнa 2019, 55, 27–36. [Google Scholar] [CrossRef]
  63. Khosravi, Y.; Bahri, A.; Tavakoli, A. Spectral Analysis of Spatial Relationship between Surface Wind Speed (SWS) and Sea Surface Temperature (SST) in Oman Sea. Phys. Geogr. Res. Q. 2018, 50, 473–489. [Google Scholar] [CrossRef]
  64. NEMO Ocean Engine; NEMO System Team. Scientific Notes of Climate Modelling Center, 27; Institute Pierre-Simon Laplace (IPSL): Guyancourt, France, 2022. [Google Scholar] [CrossRef]
  65. Mizyuk, A.I.; Korotaev, G.K.; Grigoriev, A.V.; Puzina, O.S.; Lishaev, P.N. Long-Term Variability of Thermohaline Characteristics of the Azov Sea Based on the Numerical Eddy-Resolving Model. Phys. Oceanogr. 2019, 26, 438–450. [Google Scholar] [CrossRef]
  66. EMODnet Bathymetry Consortium. EMODnet Digital Bathymetry (DTM 2016); EMODnet Bathymetry Consortium: Brussels, Belgium, 2020. [Google Scholar] [CrossRef]
  67. Large, W.G.; Yeager, S. Diurnal to Decadal Global Forcing for Ocean and Sea-Ice Models: The Data Sets and Flux Climatologies (No. NCAR/TN-460+STR); National Center of Atmospheric Research: Boulder, CO, USA, 2004. [Google Scholar] [CrossRef]
  68. Mulet, S.; Rio, M.-H.; Mignot, A.; Guinehut, S.; Morrow, R. A new estimate of the global 3D geostrophic ocean circulation based on satellite data and in-situ measurements. Deep. Sea Res. Part II Top. Stud. Oceanogr. 2012, 77, 70–81. [Google Scholar] [CrossRef]
  69. Dobricic, S.; Pinardi, N. An oceanographic three-dimensional variational data assimilation scheme. Ocean. Model. 2008, 22, 89–105. [Google Scholar] [CrossRef]
  70. Storto, A.; Dobricic, S.; Masina, S.; Di Pietro, P. Assimilating along-track altimetric observations through local hydrostatic adjustment in a global ocean variational assimilation system. Mon. Wea. Rev. 2011, 139, 738–754. [Google Scholar] [CrossRef]
  71. Jansen, E.; Martins, D.; Stefanizzi, L.; Ciliberti, S.A.; Gunduz, M.; Ilicak, M.; Lecci, R.; Cretí, S.; Causio, S.; Aydoğdu, A.; et al. BLKSEA_ANALYSISFORECAST_PHY_007_001, Black Sea Physical Analysis and Forecast (Copernicus Marine Service BS-Currents, EAS5 system) (Version 1) Data Set; Copernicus Monitoring Environment Marine Service (CMEMS): Ramonville-Saint-Agne, France, 2022. [Google Scholar] [CrossRef]
  72. Belokopytov, V.N. Interannual variations of the renewal of waters of the cold intermediate layer in the Black Sea for the last decades. Phys. Oceanogr. 2011, 20, 347–355. [Google Scholar] [CrossRef]
  73. Miladinova, S.; Stips, A.; Garcia-Gorriz, E.; Moy, D.M. Formation and changes of the Black Sea cold intermediate layer. Prog. Oceanogr. 2018, 167, 11–23. [Google Scholar] [CrossRef]
  74. Silvestrova, K.; Myslenkov, S.; Zatsepin, A. Variability of wind-driven coastal upwelling in the north-eastern Black Sea in 1979–2016 according to NCEP/CFSR data. Pure Appl. Geophys. 2018, 175, 4007–4015. [Google Scholar] [CrossRef]
  75. Zatsepin, A.G.; Silvestrova, K.P.; Kuklev, S.B.; Piotoukh, V.B.; Podymov, O.I. Observations of a cycle of intense coastal upwelling and downwelling at the research site of the Shirshov Institute of Oceanology in the Black Sea. Oceanology 2016, 56, 188–199. [Google Scholar] [CrossRef]
  76. Rubakina, V.A.; Kubryakov, A.A.; Stanichny, S.V. Seasonal and diurnal cycle of the Black Sea water temperature from temperature-profiling drifters data. Sovrem. Probl. Distantsionnogo Zondirovaniya Zemli Iz Kosm. 2019, 16, 268–281. [Google Scholar] [CrossRef]
  77. Ivanov, V.A.; Shul’ga, T.Y.; Bagaev, A.V.; Medvedeva, A.V.; Plastun, T.V.; Verzhevskaya, L.V.; Svishcheva, I.A. Internal Waves on the Black Sea Shelf near the Heracles Peninsula: Modeling and Observation. Morskoy Gidrofiz. Zhurnal 2019, 35, 322–340. [Google Scholar] [CrossRef]
  78. Ivanova, I.; Shlychkov, V. Internal Waves on the Black Sea Shelf. Bull. Russ. Acad. Sci. Phys. 2018, 82, 1573–1576. [Google Scholar] [CrossRef]
  79. Serebryany, A.; Khimchenko, E.; Popov, O.; Denisov, D.; Kenigsberger, G. Internal Waves Study on a Narrow Steep Shelf of the Black Sea Using the Spatial Antenna of Line Temperature Sensors. J. Mar. Sci. Eng. 2020, 8, 833. [Google Scholar] [CrossRef]
  80. Khimchenko, E.; Ostrovskii, A.; Klyuvitkin, A.; Piterbarg, L. Seasonal Variability of Near-Inertial Internal Waves in the Deep Central Part of the Black Sea. J. Mar. Sci. Eng. 2022, 10, 557. [Google Scholar] [CrossRef]
  81. Mizyuk, A. Numerical Modelling: Report; Marine Hydrophysical Institute: Sevastopol, Russia, 2022; pp. 1–47. (In Russian) [Google Scholar]
  82. Kolyuchkina, G.A.; Syomin, V.L.; Simakova, U.V.; Sergeeva, N.G.; Ananiev, R.A.; Dmitrevsky, N.N.; Ostrovskii, A.G. Benthic community structure near the margin of the oxic zone: A case study on the Black Sea. J. Mar. Syst. 2022, 227, 103691. [Google Scholar] [CrossRef]
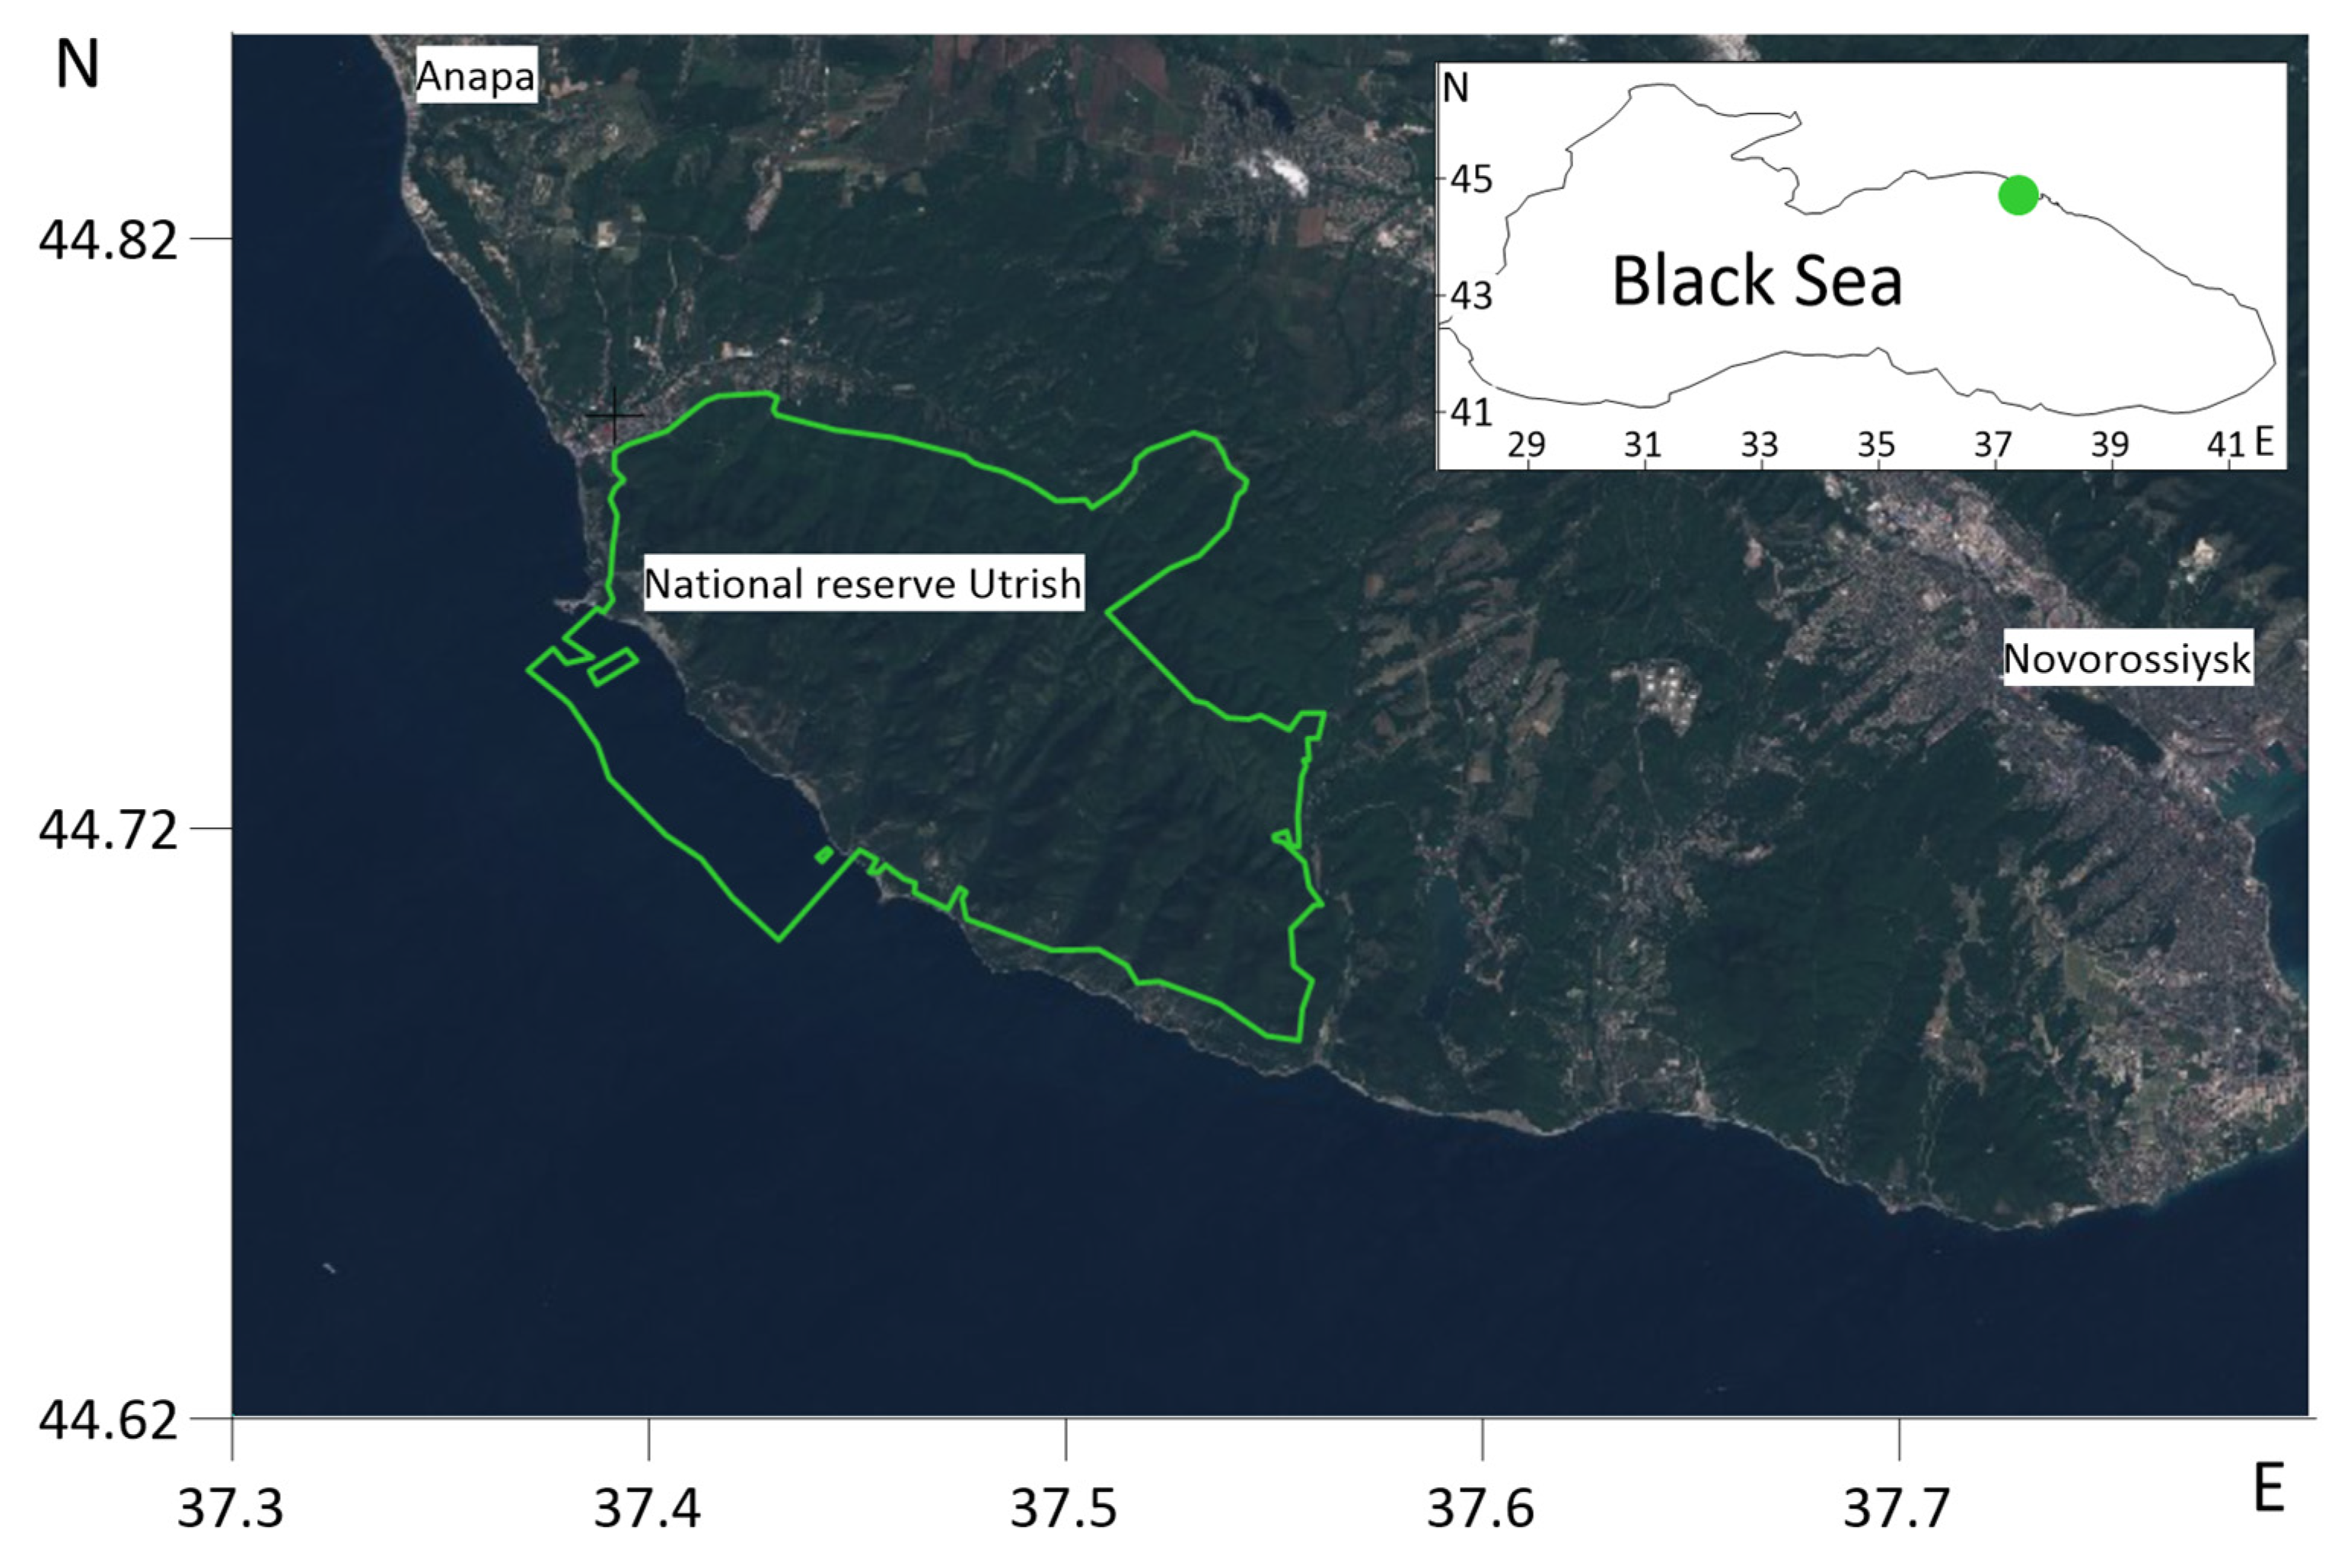
Figure 1. Location of the NR Utrish in the Black Sea.
Jmse 11 00887 g001
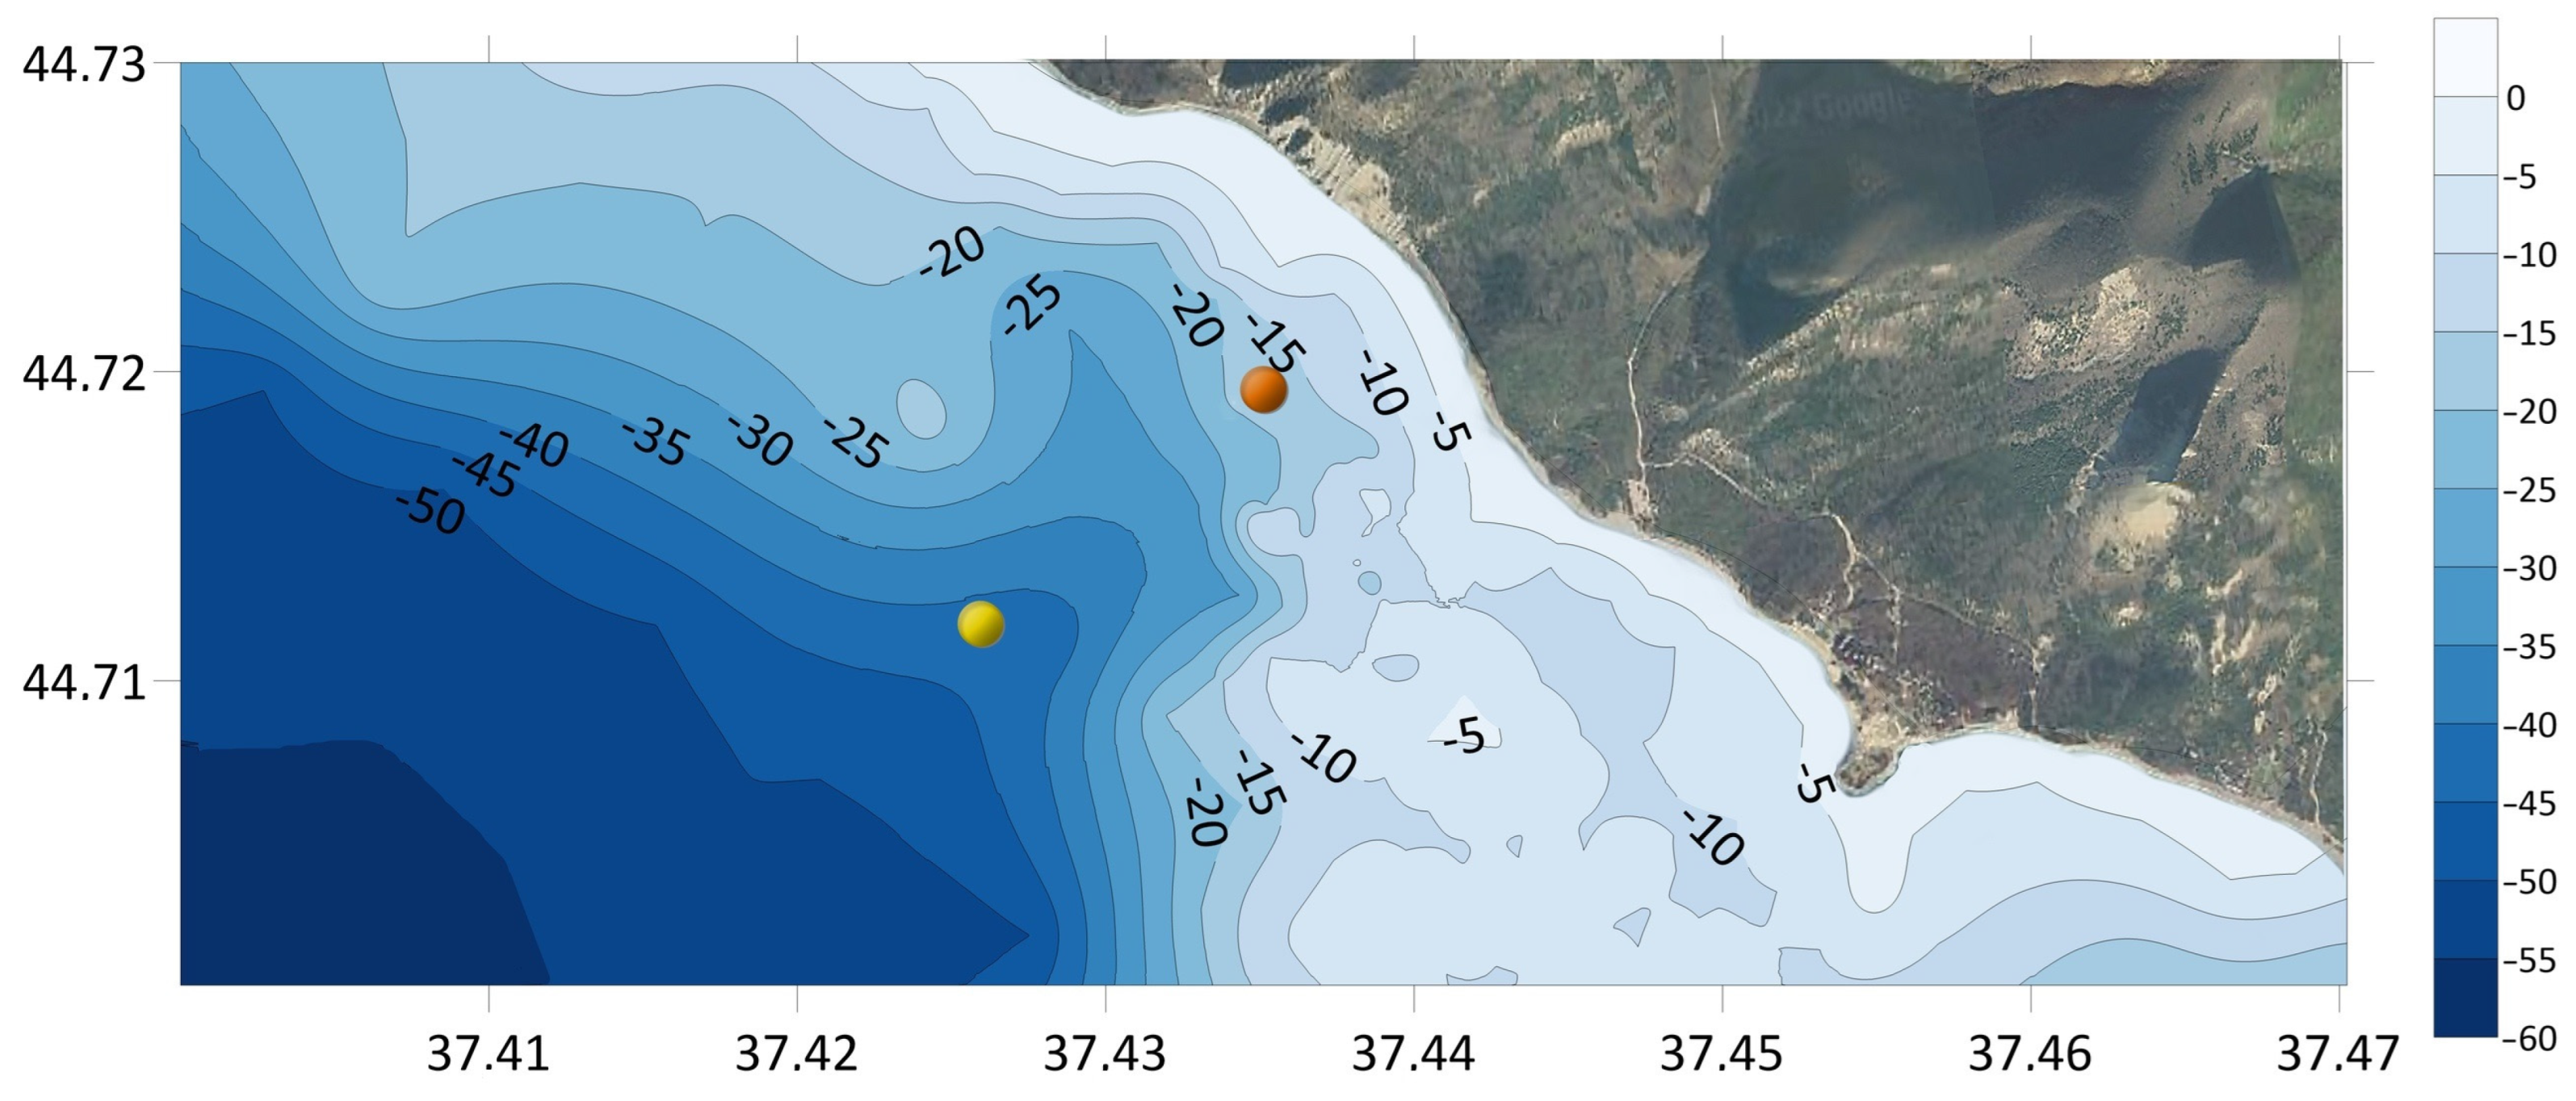
Figure 2. Thermistor chain location and bathymetry (m). The red circle indicates the first and second measurement period, and the yellow one indicates the third measurement period after 15 March 2020.
Jmse 11 00887 g002
Figure 3. Thermistor chain station. Yellow buoy indicates second measurement period, and red buoy indicates third measurement period.
Jmse 11 00887 g003
Figure 4. Water temperature at different depths according to the data of the thermistor chain during February–April 2020—bottom panel. Air temperature according to the Anapa weather station data—upper panel.
Jmse 11 00887 g004
Figure 5. Water temperature at different depths according to the thermistor chain data from 16 July 2020 to 20 February 2021—bottom panel. Air temperature according to the Anapa weather station data—upper panel.
Jmse 11 00887 g005
Figure 6. Water temperature according to the data of the thermistor chain from 15 March to 4 May 2022—bottom panel. Air temperature according to the Anapa weather station data—upper panel. The thermistor chain sank to the bottom after 25 October 2021.
Jmse 11 00887 g006
Figure 7. Water temperature, upwelling criteria and direction of currents during second measurement period from 18 July 2020 to 19 November 2020.
Jmse 11 00887 g007
Figure 8. Sharp temperature decrease in August 2020. Upper panel—wind speed. Lower panel—water temperature.
Jmse 11 00887 g008
Figure 9. Sharp temperature decrease in June 2021. Upper panel—wind speed. Lower panel—water temperature.
Jmse 11 00887 g009
Figure 10. Examples of 5 days of temperature spectra for the different periods.
Jmse 11 00887 g010
Figure 11. Diurnal cycle of the water and air temperature. Rectangles (SP1 … SP9) below x-axis show 5-day moving periods for spectra calculation. Green crosses show days with the visually confirmed diurnal cycle. Bottom panel: examples of nine spectra from 26 May to 7 June 2021.
Jmse 11 00887 g011
Figure 12. Repeatability of days with observed diurnal cycle for different months.
Jmse 11 00887 g012
Figure 13. Anomalous diurnal cycle in July 2021. Red stars mark 17 h oscillation. Water temperature according to the data of the thermistor chain—bottom panel. Air temperature according to the Anapa weather station data—upper panel.
Jmse 11 00887 g013
Figure 14. Water temperature at the surface (red line) and on horizon of 15.6 m (blue line) from 16 July to 29 August 2020. Examples of internal waves with period 10–20 h are marked with green crosses in the green rectangle.
Jmse 11 00887 g014
Figure 15. Water temperature at 7.8 m (green line), on 11.8 m (blue line) depths and on horizon at 15.6 m (dark blue line) from 22 March to 23 March 2020. Period of the ~13 min internal waves is marked by the red rectangle.
Jmse 11 00887 g015
Figure 16. Water temperature at the surface and 15 m according to the measurements (red line) and MHI model data (blue line) from 1 February 2020 to 25 October 2021.
Jmse 11 00887 g016
Figure 17. Water temperature at the surface and the 15 m layer according to the measurements (red line) and CMEMS1 model data (blue line) from 1 February to 25 April 2020.
Jmse 11 00887 g017
Figure 18. Water temperature at the surface and on the 15 m layer according to the measurements (red line) and CMEMS2 model data (blue line) from 1 January to 25 October 2021.
Jmse 11 00887 g018
Table 1. Statistical parameters of water temperature at different depths during the first measurement period of the thermochain (31 January 2020–21 April 2020).
Thermistor Depth, mAverage
Temp
Median
Temp
Minimum
Temp
Maximum
Temp
Standard
Deviation
Variation
Coefficient
Comments
0.29.819.638.1412.990.840.09
2.59.829.638.1512.900.830.08
3.89.789.608.1412.400.810.08
5.99.289.238.1410.520.480.05Worked till 11 March 2020
7.89.409.378.1310.610.490.05Worked till 1 April 2020
9.79.739.578.1412.230.780.08
11.89.719.548.1212.060.770.08
13.89.709.528.1212.040.760.08
15.49.689.518.1312.040.750.08
Table 2. Statistical parameters of water temperature at different depths during the second measurement period of the thermochain (16 July 2020–14 March 2021).
Thermistor Depth, m Average
Temp
Median TempMinimum
Temp
Maximum
Temp
Standard
Deviation
Variation
Coefficient
Comments
0.217.8515.978.7327.886.230.35
1.420.3722.8812.1027.755.210.26Worked till 14 January 2021
5.317.8115.948.7527.076.190.35
8.717.7615.878.7526.986.150.35
11.617.6715.728.7326.956.100.35
15.617.4715.478.7426.925.980.34
19.616.9714.918.5426.835.720.34
Table 3. Statistical parameters of water temperature at different depths during the third measurement period of the thermochain (15 March 2021–25 October 2021—for each horizon, except bottom) (25 October 2021–4 May 2022—for the bottom).
Thermistor Depth Average
Temp
Median
Temp
Minimum
Temp
Maximum
Temp
Standard
Deviation
Variation
Coefficient
Comments
0.219.2019.719.1628.605.990.31
318.6418.809.2628.196.410.34
818.2118.789.0927.545.850.32
1815.5814.638.7127.085.590.36
2813.0610.708.6326.024.480.34
3312.3310.178.6125.143.910.32
Bottom (33 m)11.019.397.7018.572.870.2625 October 2021–4 May 2022
Table 4. Main statistical parameters for MHI and CMEMS1/2 models.
ModelDepth Model, m/Depth MeasurementPeriodSampleR CorrelationBias (Model-Measurement)RMSE
MHI1.3/0.21 February 2020–
25 October 2021
5450.990.030.91
MHI15.7/15.61 February 2020–
25 October 2021
5450.93−0.232.23
CMEMS12.5/0.21 February 2020–
21 April 2020
810.95−0.240.37
CMEMS117.5/15.61 February 2020–
21 April 2020
810.92−0.220.38
CMEMS20.5/0.21 January 2021–
25 October 2021
2960.990.170.79
CMEMS215.7/15.61 January 2021–
25 October 2021
2960.920.742.22
Table 5. Accuracy estimates of CMEMS1 and CMEMS2 models from QUID reports [57,71].
ModelDepth Model, m/Depth MeasurementBias (Model-Measurement)RMSE (Root Mean Square Error)
CMEMS1SST0.140.59
CMEMS15–10−0.0961.09
CMEMS110–20−0.0481.82
CMEMS2SST0.0800.330
CMEMS20–100.0060.593
CMEMS210–100−0.0310.634
Table 6. Accuracy estimates (mean and standard deviations) of MHI reanalysis model in the Black Sea from report [81].
Layer, mBias, °CRMSE, °C
0.0–5.00.0960.675
5.0–30.0−0.1821.515
Disclaimer/Publisher’s Note: The statements, opinions and data contained in all publications are solely those of the individual author(s) and contributor(s) and not of MDPI and/or the editor(s). MDPI and/or the editor(s) disclaim responsibility for any injury to people or property resulting from any ideas, methods, instructions or products referred to in the content.