Article

Numerical Study on Tsunami Force on Coastal Bridge Decks with Superelevation

1
School of Transportation Science and Engineering, Jilin Jianzhu University, Changchun 130118, China
2
Jiangxi Provincial Institute of Water Science, Nanchang 330029, China
3
Research Center for Coastal Structures, School of Ocean Engineering, Harbin Institute of Technology, Weihai 264209, China
4
State Key Lab of Subtropical Building Science, South China University of Technology, Guangzhou 510640, China
*
Author to whom correspondence should be addressed.
J. Mar. Sci. Eng. 2023, 11(4), 824; https://doi.org/10.3390/jmse11040824
Submission received: 25 March 2023 / Accepted: 12 April 2023 / Published: 13 April 2023
(This article belongs to the Section Ocean Engineering)

Abstract

:
Many coastal bridges have been destroyed or damaged by tsunami waves. Some studies have been conducted to investigate wave impact on bridge decks, but there is little concerning the effect of bridge superelevation. A three-dimensional (3D) dam break wave model based on OpenFOAM was developed to study tsunami-like wave impacts on bridge decks with superelevation. The Reynolds-averaged Navier–Stokes equations and the k-ɛ turbulence model were used. The numerical model was satisfactorily checked against Stoker’s analytical solution and the published hydrodynamic experiment. The validated model was employed to carry out parametric analyses to investigate the effects of upstream and downstream water depths and the bridge deck’s superelevation. The results show that the tsunami force is proportional to the relative wave height. The dam break wave impact on the bridge deck can be identified as two distinct scenarios according to whether the wave height is higher than the bridge deck top. The trend of the tsunami force is also different in different scenarios. The superelevation will significantly influence the tsunami forces acting on the box girder, with some exceptions.

1. Introduction

The recent occurrences of tsunamis in Indonesia (2004), Chile (2010), Japan (2011), and Tonga (2022) have caused significant devastation to structures and infrastructures in coastal regions. For instance, in the aftermath of the 2011 Japan Earthquake and Tsunami, over 300 bridges were damaged [1]. It is widely believed that the enormous forces generated by tsunami waves can result in the displacement and even the complete unseating or overturning of bridge decks [2]. Therefore, to protect coastal bridges from such disasters, it is necessary to gain a comprehensive understanding of the impact of tsunami waves on bridge decks.
Two distinct wave types have been utilized in previous studies to simulate the im-pact of a tsunami wave on bridge decks: solitary wave [3,4,5,6,7,8,9] and dam break wave [10,11,12,13,14,15,16]. Generally, solitary waves are well suited for simulating the propagation of tsunami waves in the ocean, while dam break waves are ideal for simulating the behavior of tsunami waves once they reach the shore. Leschka and Oumeraci [17] showed that solitary waves and surge forces on coastal structures have different characteristics. Chanson [18] analyzed the surge data observed since the 2004 tsunami disaster and compared them with the results of the analysis of breached waves, showing a reasonable agreement was observed in terms of the surge front celerity and free surface profile. However, there is currently no clear definition for the choice of wave type. In this paper, the dam breaking wave model was utilized to simulate tsunamis.
The factors affecting tsunami loads on bridges are mainly related to wave height, wave speed and girder clearance height, and the effects of these factors have been studied by many scholars [14,19,20,21,22,23,24,25]. These studies show that tsunami forces increase with an increasing wave height and speed and increase with a decreasing girder clearance height. Nakamura et al. [26] investigated the tsunami force characteristics of bridge superstructures from hydraulic model experiments and numerical simulations and derived a tsunami force estimation equation, which can accurately predict horizontal and vertical tsunami forces, except for the short wave period.
For the effect of the shape of the girder on tsunami forces, Winter et al. [23] investigated numerically the variation of the tsunami force in three-girder cases and two-girder cases; the results showed that the peak tsunami force in the three-girder cases was larger than that in the two-girder cases. Yang et al. [19] numerically investigated the tsunami forces for T-girder and box girder bridges, and the results showed that T-girder bridges have higher and more persistent horizontal peak forces. The upward force of the box girder bridge is significantly greater than that of the T-girder bridge. However, when the wave is high enough to impact the entire girder, the effect of the girder shape on the horizontal impact load is negligible. Huang et al. [4] conducted a series of experiments using cnoidal waves and solitary waves to investigate the characteristics of wave forces on box girders and T-beams, and the results showed that the interaction of the waves with these two types of girders differed significantly. Xu et al. [7] conducted a numerical parametric study on the characteristics of solitary-wave-induced force on a typical coastal double-bridge panel.
Farvizi et al. [11] conducted physical modeling experiments to measure the borehole impact forces and pressures for different tsunami borehole strengths on bridge decks with different abutment types (wingwalls and spillways) and different opening and inundation ratios. It was shown that the horizontal and vertical forces increased with an increasing inundation rate for both abutments. The horizontal forces showed a decreasing trend as the opening rate decreased, while the vertical forces initially increased with a decreasing opening rate and then decreased. Lukkunaprasit and Lau [27] investigated the effect of bridge piers on tsunami forces through experiments using isolated waves and showed that for intact bridge structures, the actual component forces generated by hydrodynamic pressures acting on piers alone can be increased by 50% compared to independent piers.
The effect of the air during the tsunami impact is not negligible. Yang et al. [15] numerically investigated the air escape and pressure variation during the submergence of multichamber beams. The results show that when the inundation ratio is small, the air in the chambers is transferred to the adjacent chambers sequentially and finally escapes from the downstream chamber; when the inundation ratio is large, the air in the chambers is drawn into the water or vortex and then escapes directly from the chambers. Issakhov and Borsikbayeva [28] investigated the influence of trapped air on tsunami forces on two common bridge types, and the experimental results show that the air retention had a significant effect on the tsunami loads, wave–structure interactions, and bridge structural response. Bullock et al. [29] conducted drop tests using seawater and freshwater and showed that the maximum impact pressure and rise time were influenced by the level of aeration and impact intensity.
Motley et al. [30] and Farvizi et al. [12] investigated the characteristics of tsunami forces on skewed bridges by numerical simulations and experiments, respectively. The results show that the horizontal and vertical forces, as well as the overturning moment, showed a decreasing trend with the increase in the tilt angle. The lateral force, cross-rolling moment, and cross-swing moment showed an increasing trend with the increase in the tilt angle.
To mitigate damage to bridges from tsunami waves, Xu et al. [6], Hayatdavoodi et al. [3], and Seiffert et al. [31] investigated the effect of air relief openings on tsunami loads. The results show that the air relief venting hole can significantly reduce the vertical tsunami force but increases the horizontal tsunami force. Wei and Dalrymple [32], Nassiraei et al. [33], and Gao et al. [34] investigated the effect of breakwaters on the tsunami force of girders, and the results showed that breakwaters can significantly reduce the tsunami force, and there exists an optimum value for the distance between breakwaters and girders. Nakao et al. [13], Zhang and Hoshikuma [35], and Abukawa et al. [36] investigated the effect of fairings on tsunami forces acting on girders, and the results showed that fairings can significantly reduce the horizontal forces but increase the vertical forces. Nakamura et al. [37] numerically investigated the effect of fairings and fenders on the girder on tsunami forces and showed that both fairings and fenders reduce the horizontal tsunami forces and are independent of the fairing height and fender configuration. In addition, when the fairing surface is configured upward, the downward tsunami force increases and makes the girder more stable.
Bridges are usually built with a superelevation at the curve to ensure the safety of vehicles during turning. Winter et al. [21] investigated the effect of the superelevation on the tsunami force of a T-girder bridge by numerical simulation, and the results showed that the superelevation can significantly affect the tsunami force on the girder. Bricker and Nakayama [38] reached similar conclusions. However, there have been few studies conducted on the effects of tsunami forces on box girder bridges with superelevation. Considering the widespread utilization of box girder bridges in modern construction projects, it is essential to undertake research on the impact of tsunami forces on box girder bridges with superelevation.
This paper established a three-dimensional numerical model to investigate the effect of superelevation on tsunami wave forces acting on box girders. First, a brief introduction of the numerical model built based on OpenFOAM is presented. Then, the numerical model was validated by Stoker’s analytical solution and the published hydrodynamic experiment. The effect of the properties of the incident dam break wave, elevation of the bridge deck, and superelevation of the bridge deck are discussed in Section 3. Finally, several conclusions and findings are summarized.

2. Materials and Methods

2.1. Simulation Methodology

The Open-Source Field Operation and Manipulation software package, generally known as OpenFOAM, was employed in this study. The solver interFoam was used to solve the flow field during the dam break wave impact on bridge decks. The interFoam utilizes the volume of fluid (VOF) method to simulate the flow of two incompressible fluids separated by a free interface. An indicator function, α 1 , was defined, which had a value of 1.0 corresponding to the regions occupied by water (water: ρ = 1000   kg / m 3 and υ = 1.0 × 10 6   m 2 / s ) and a value of 0.0 for air (air: ρ = 1.22   k g / m 3 and υ = 1.48 × 10 5   m 2 / s ); when α is between 0 and 1, this implies that the cell is occupied by a mixture of these two fluids along the free surface, where ρ is the mass density of the fluid, and υ is the kinematic viscosity. The gravitational acceleration was g = 9.81   m / s 2 . The intermediate values indicate the cells belonging to the free interface. The present numerical model utilized the Reynolds-averaged stress (RAS) and standard k - ε turbulence models, which have been successfully used in previous studies on wave impact structures [21,38,39]. However, it is worth noting that a large-eddy simulation (LES) turbulence model would provide even greater accuracy and precision. Assuming that the fluid is incompressible, the RANS equations can be written as
u ¯ i x i = 0
ρ u ¯ i t + ρ u ¯ j u ¯ i x j = p ¯ x i + μ 2 u ¯ i x j x j ρ u i u j ¯ x j
where u ¯ i is the mean velocity in the i-direction, u i is the fluctuating component of the velocity in the i-direction, and p ¯ is the mean pressure. If u i is the velocity component in the i-direction, then u i = u ¯ i + u i . The Reynolds stress term in Equation (2) can be computed with
ρ u i u j ¯ = υ t ρ u ¯ i x j + u ¯ j x i 2 3 k ρ δ i j
where k is the turbulent kinetic energy. A standard k - ε model was applied to solve for the turbulent kinetic energy, k , and dissipation, ε ,
k t + k u ¯ j x j = x j υ + υ t σ k k x j + P k ρ ε
ε t + ε u ¯ j x j = x j υ + υ t σ k ε x j + C ε 1 ε k ρ P k C ε 2 ε 2 k
where
P k = ρ u i u j ¯ u ¯ j x i
The turbulence eddy viscosity, υ t , is calculated by
υ t = C μ k 2 ε
The previously mentioned coefficients were applied in this paper as C ε 1 = 1.44 , C ε 2 = 1.92 , C μ = 0.09 , σ k = 1.0 and σ ε = 1.3 [40].
The initial conditions for the air/water phase indicator ( α 1 ), velocity ( U ), pressure on the boundary minus the hydrostatic pressure ( p r g h ), turbulent kinetic energy ( k ) and turbulent dissipation ( ε ) were specified for all cases, as described in Table 1.
To ensure the stability of the numerical calculation process, the time step, δ t , is automatically controlled by the solver so that the time step in all cells is less than the user-defined maximum Courant number ( δ t | U | / δ x ) of 0.5. Here, U is the velocity vector through the cell, while δ x is the cell size in the velocity direction.

2.2. Numerical Model

In the present study, a three-dimensional (3D) numerical model was set up to investigate the wave impact on the bridge deck with superelevation. Figure 1 shows a diagrammatic sketch of the numerical model. A Cartesian coordinate was defined with the origin located at the bottom-left corner of the wave flume. The x-axis was defined along the direction of the dam break wave, while the y-axis yielded a vertical direction. The length of the flume was 30 m in the x-direction in which the reservoir length was 12 m. The bridge deck was located 7.6 m downstream from the gate. The numerical model was 1 m in width along the z-axis, which was perpendicular to the x–y plane, as shown in Figure 1. The convention for positive superelevation is demonstrated in Figure 1. It should be noted that the 3D numerical model was preferred to study the wave impact on the bridge deck, because the two-dimensional (2D) numerical model cannot capture the air behavior along the bridge span. According to Motley et al. [30], air would stagnate among the structural components in the 2D model, resulting in an overestimation of the wave forces acting on the bridge deck.
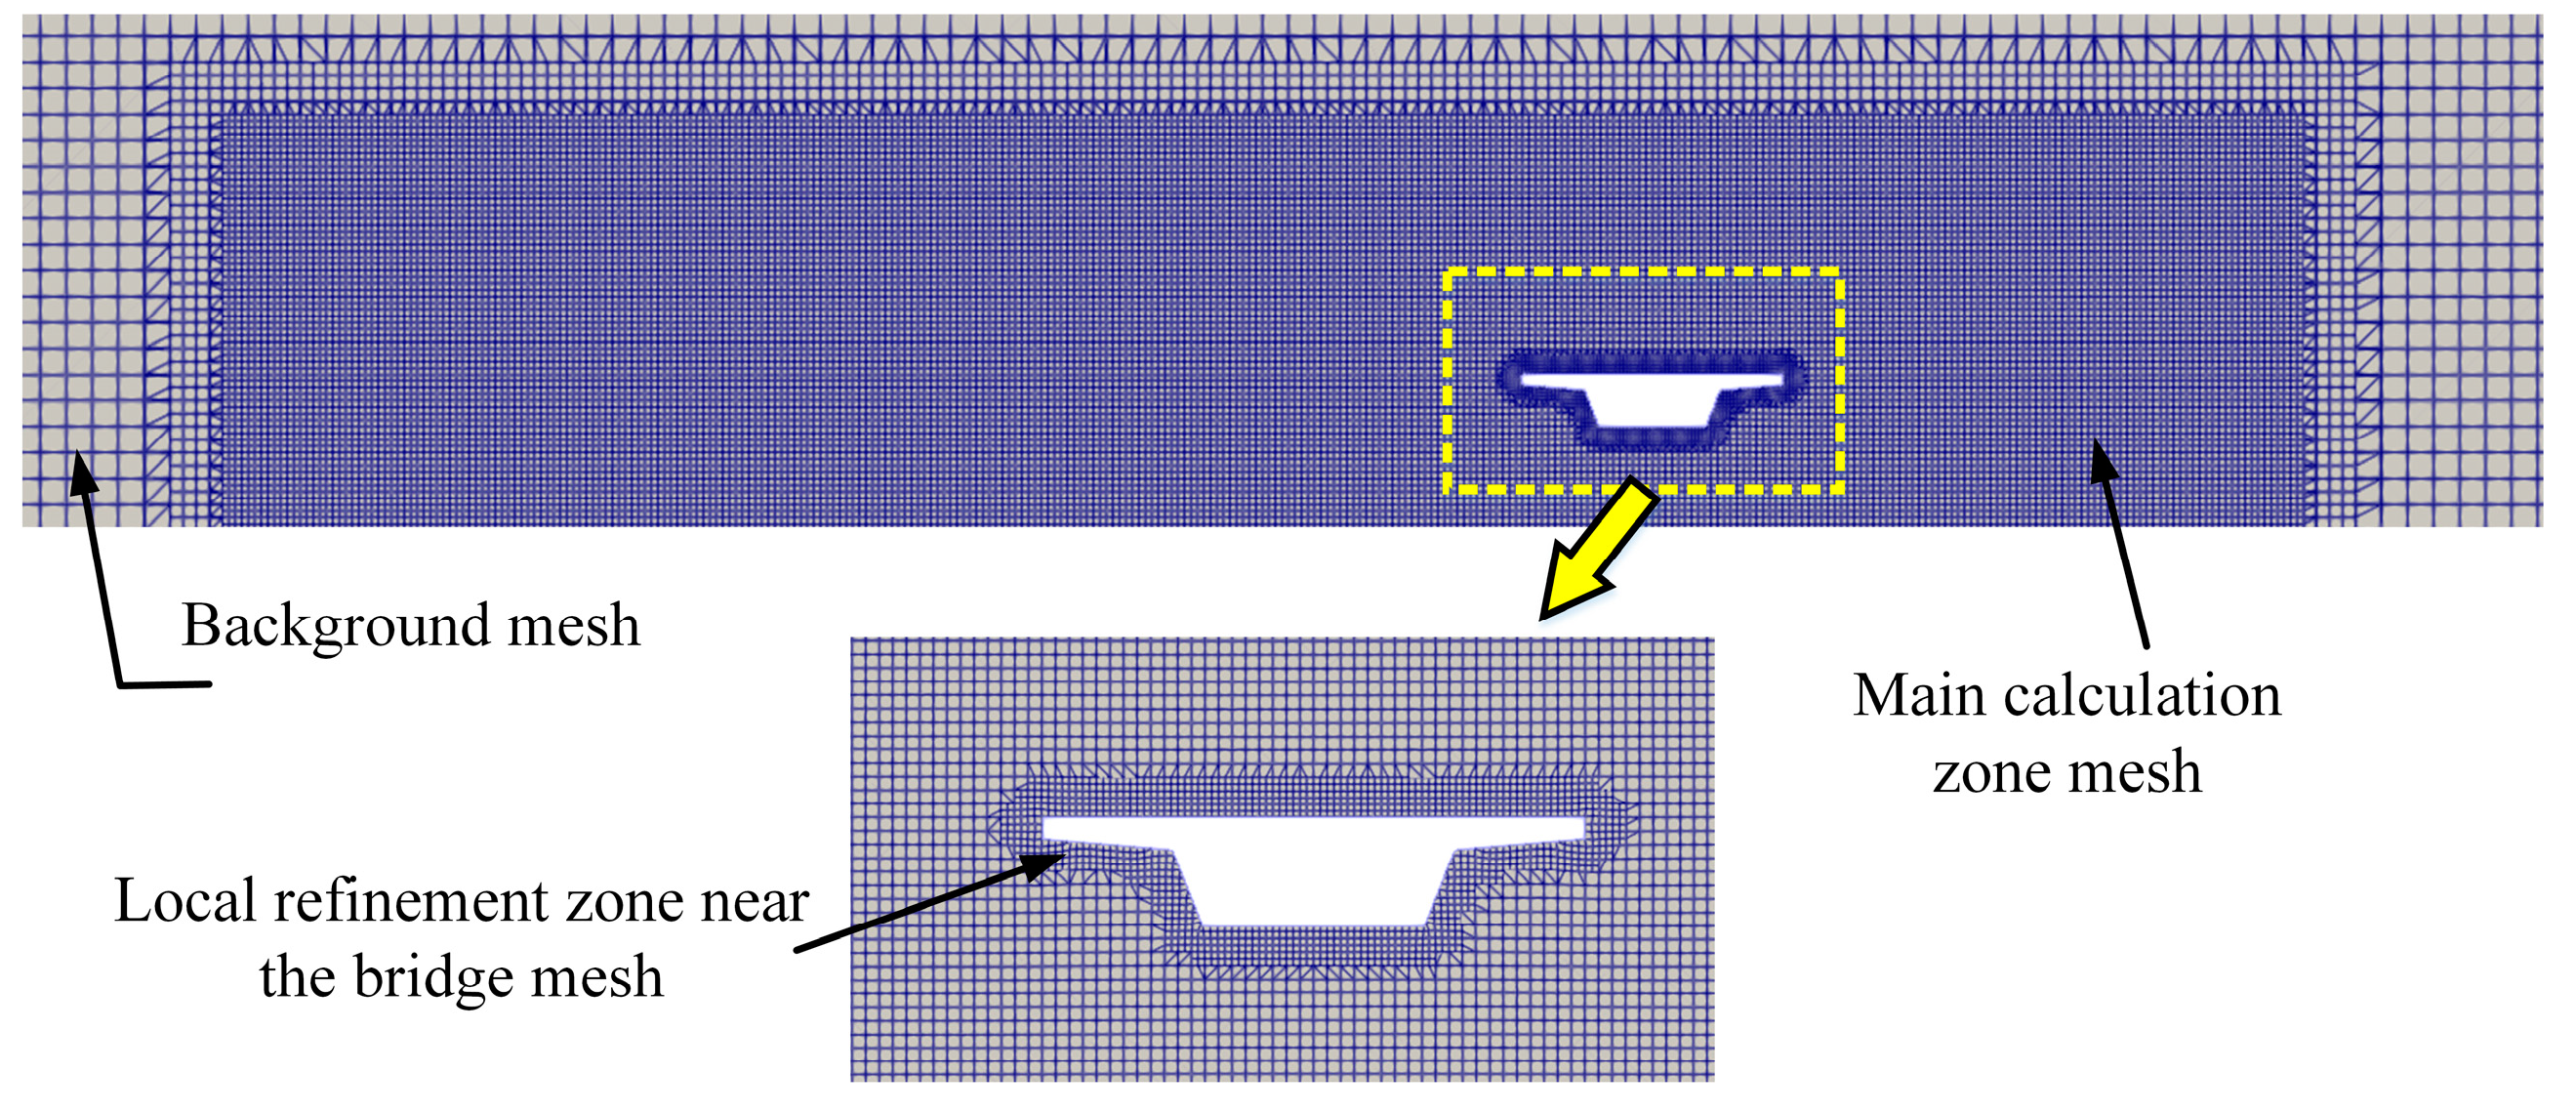
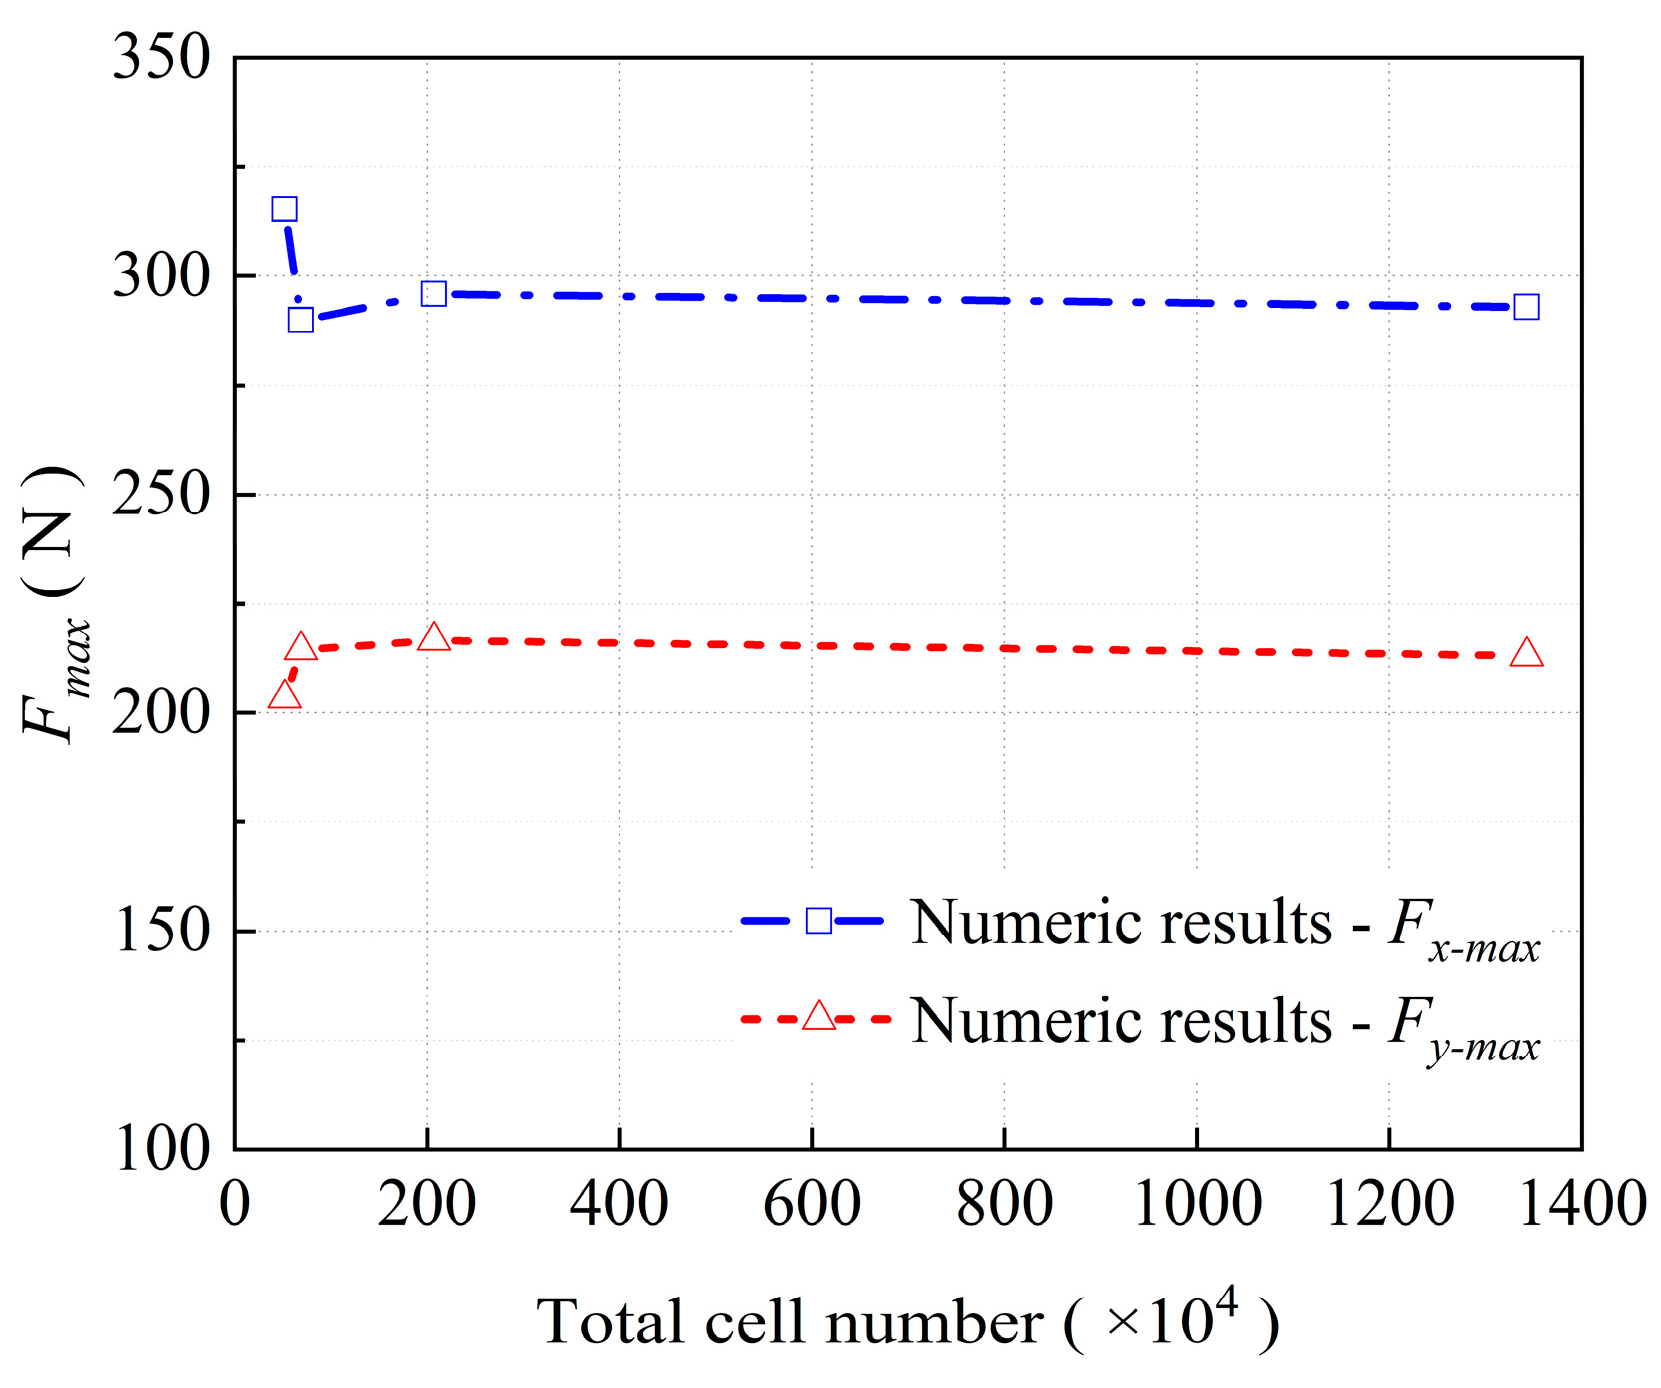
Three different levels of mesh were generated in the present numerical study, i.e., background, main calculation zone, and local refinement zone around the bridge deck, as shown in Figure 2. The meshes in the main calculation zone, with a 5.0 m length and 0.8 m height, were refined to obtain details of the fluid field during wave impact. The cell lengths were 0.05 m and 0.00625 m for the background and the local refinement zone, respectively. A mesh sensitivity analysis was carried out with four different mesh sizes of the main calculation zone. The cell length, total mesh number, and calculation time (using a computer with a double Inter Xeon Gold 5218R processor (2.1 GHz and 40 M cache) CPU and 128 G internal storage) for four different mesh sizes are listed in Table 2. Figure 3 shows the maximum horizontal force (Fx-max) and vertical forces (Fy-max) acting on the bridge deck during the dam break wave impact. It can be seen that the maximum tsunami-induced forces oscillated with a mesh size change from 0.05 m to 0.0125 m. However, further mesh refinement did not significantly improve the numerical results of the forces. A mesh size of 0.0125 m in the main calculation zone was adopted in the following analysis to achieve a balance between the accuracy and computational consumption.

2.3. Validation

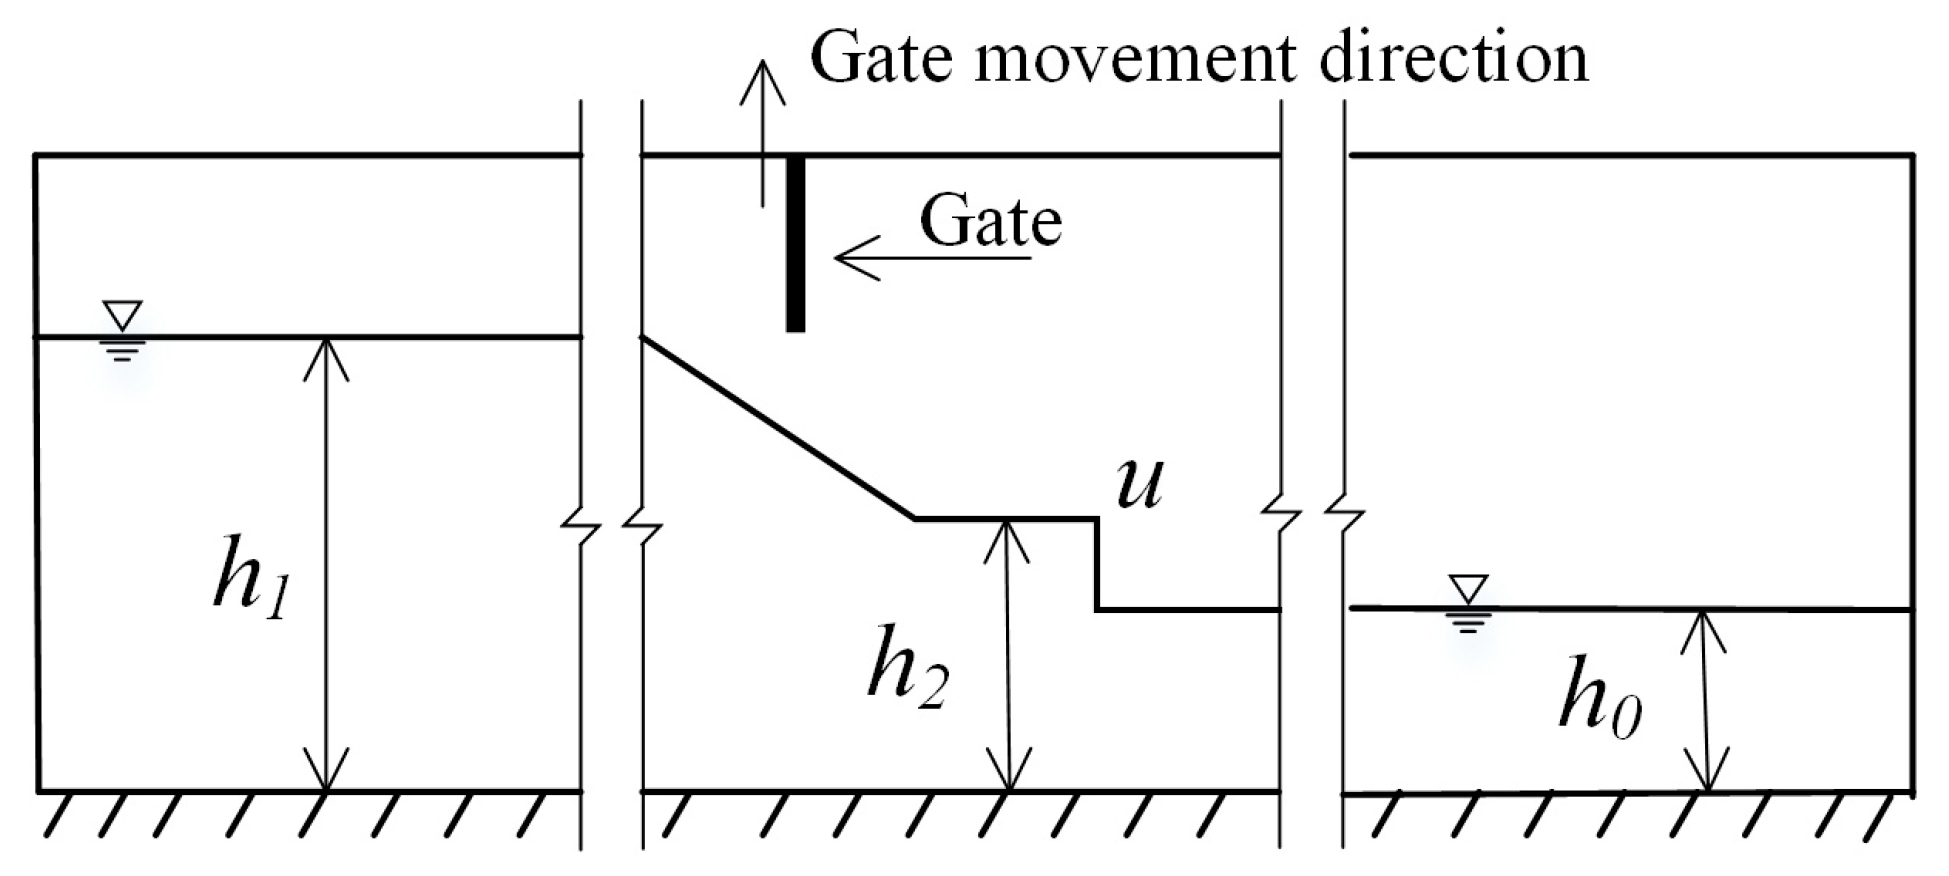
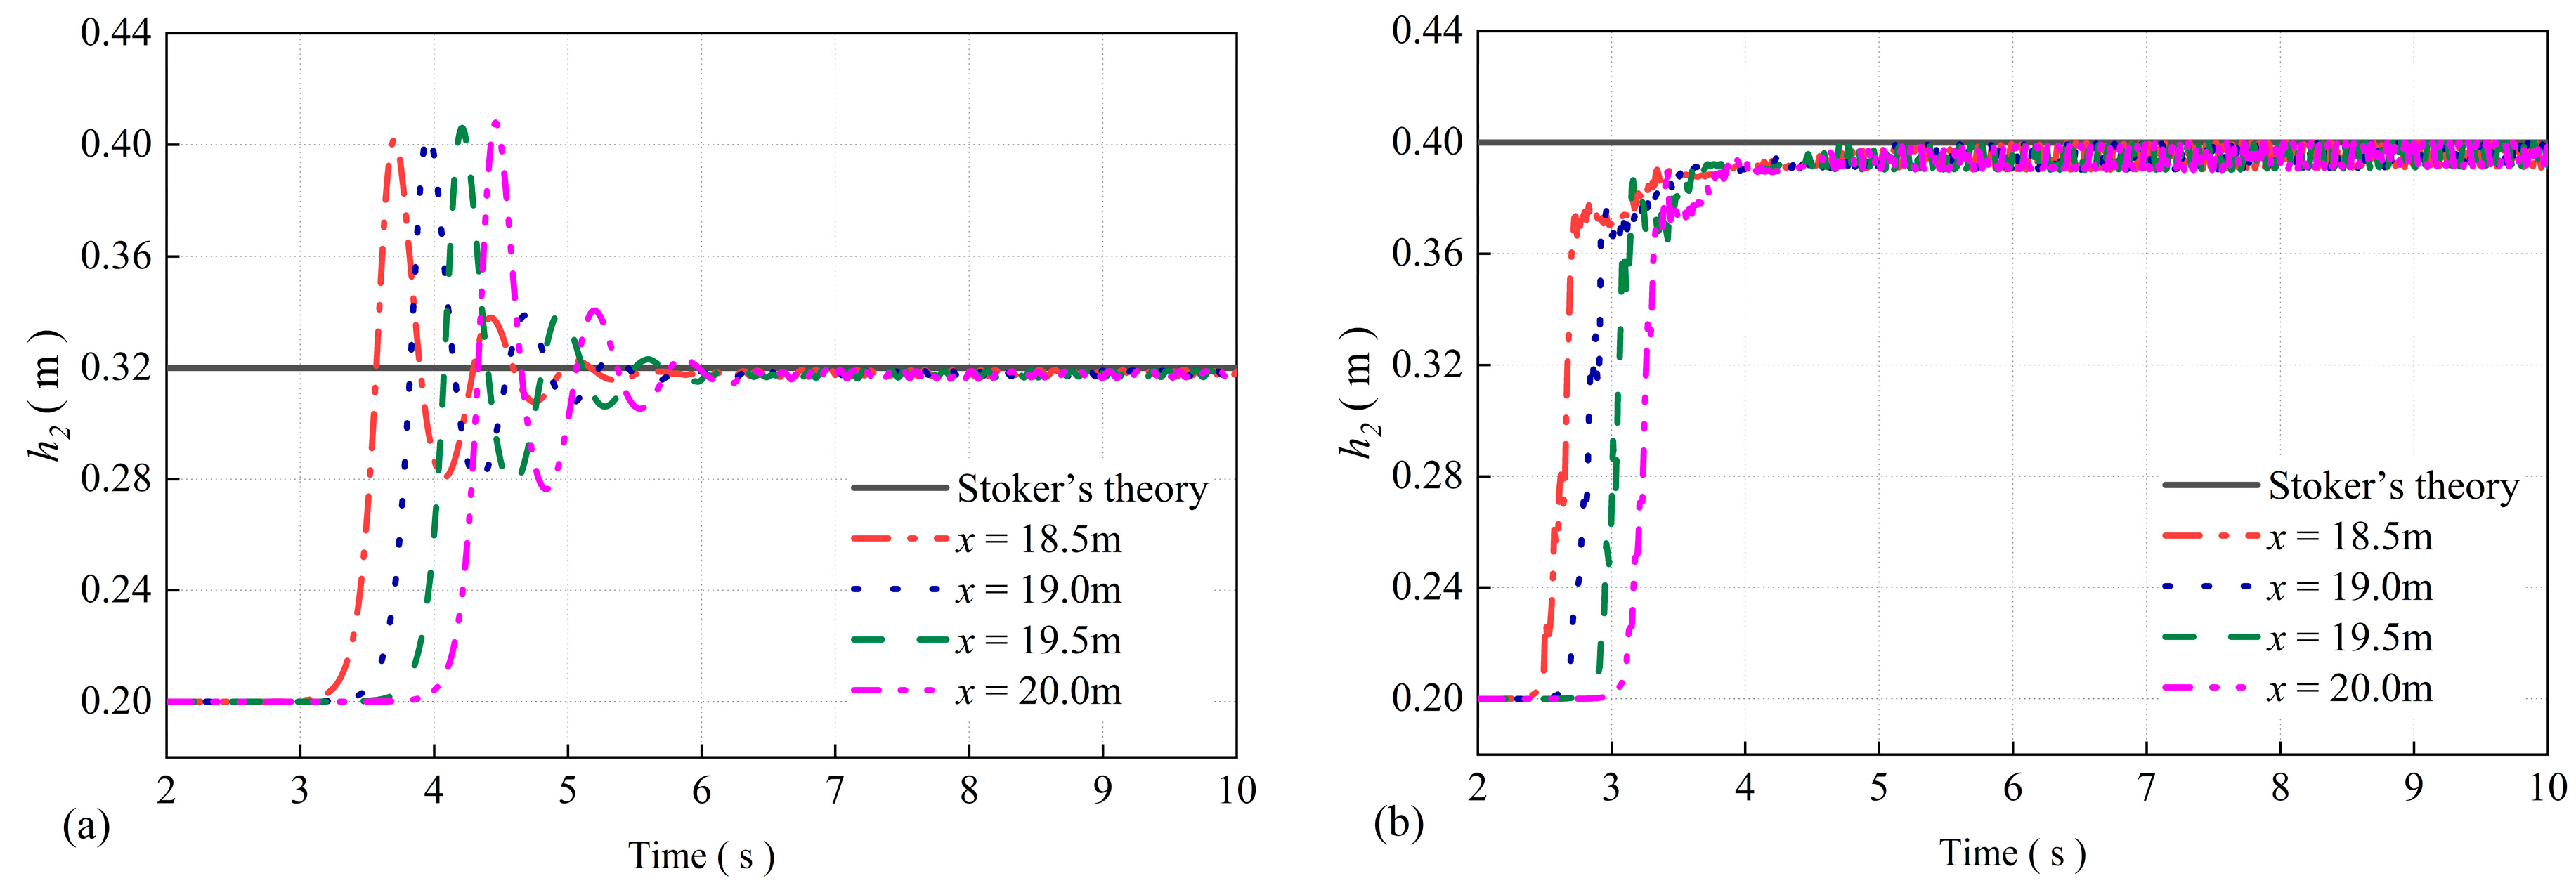
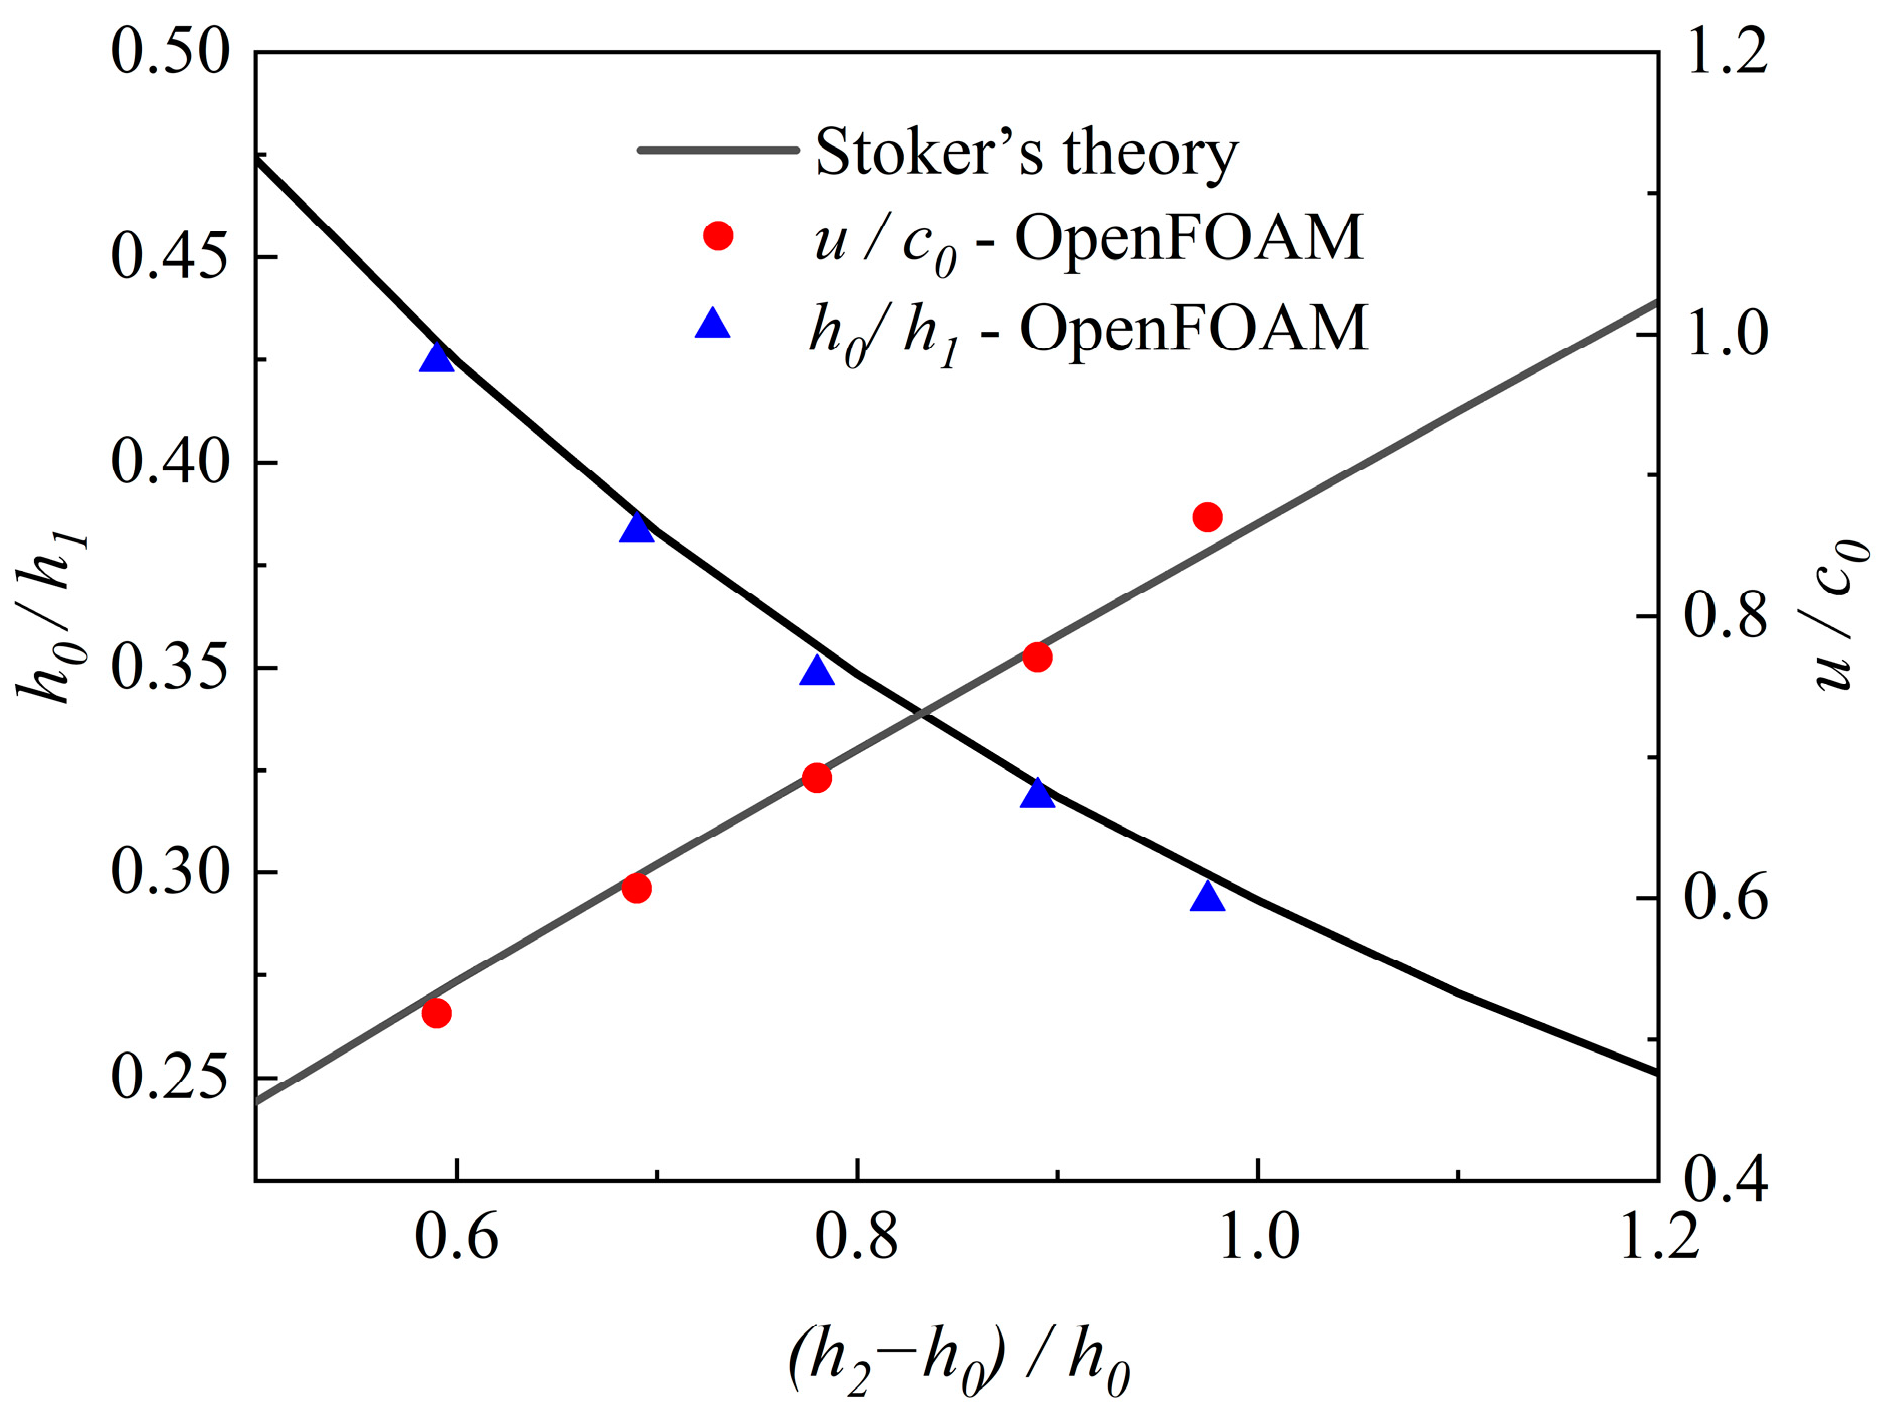
All tsunami-like waves used in this study were calibrated in the empty wave flume. Stoker’s theory [41], as shown in Figure 4, was employed to check the wave height and velocity obtained by the present numerical model. According to Stoker’s theory, the free surface profile (h2) after the dam break is related to the water depth of the upstream reservoir (h1) and downstream (h0) at the initial time. Figure 5 shows the calculated time series of the free surface at monitoring locations (x = 18.5, 19.0, 19.5 and 20.0 m) compared with Stoker’s analytical solution for two cases. It can be concluded from Figure 5 that the free surface profiles measured at the monitoring locations after the wave fronts all gradually converged to a stable water level, which is in good agreement with Stoker’s analytical solution. Furthermore, the dimensionless wave height h 2 h 0 / h 0 and wave velocity u / c 0 (where c 0 = g h 0 ) were checked against Stoker’s theory, as shown in Figure 6. The results indicate that both the wave height and the wave velocity predicted by the present numerical model were consistent with Stoker’s analytical solution.
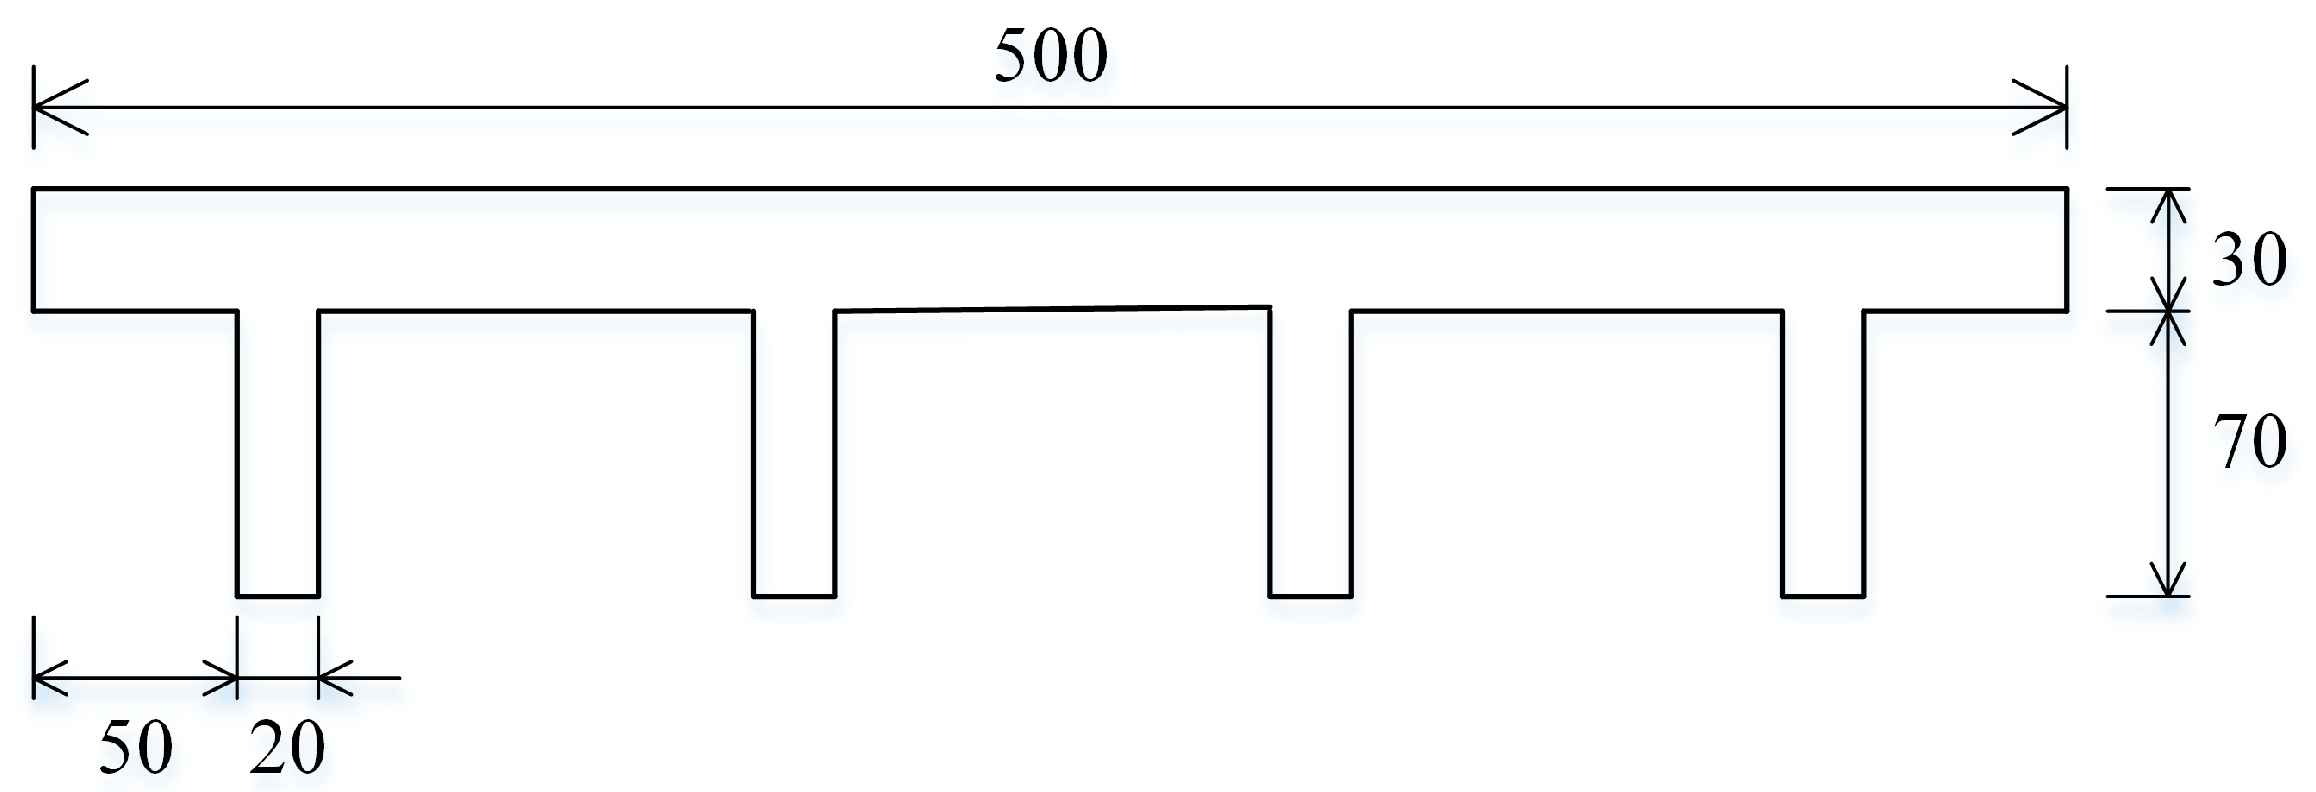
The hydrodynamic experiment conducted by Nakao et al. [42] was employed to validate the present numerical model. The investigation was carried out in a wave flume with a size of 30 m in length, 1 m in width and 1 m in height. A 0.1 m thick sluice gate was used to release the water from the 12 m reservoir zone to the 18 m still water zone. The 1/20 scale bridge deck model was set 19.6 m downstream of the sluice gate and 0.2 m high from the flume bottom. A total of five different configurations of bridge models were tested by Nakao et al. [42], in which Model 5 was simulated in this section. Model 5 was a T-girder bridge deck with one slab and four rectangular girders, as shown in Figure 7. The reservoir water level (RWL) was h1 = 0.617 m, the still water level (SWL) h0 = 0.1 m, the bridge deck elevation Zd = 0.2 m and the bridge deck superelevation θ = 0 ° . The tsunami-induced forces were measured by biaxial load cells installed between the bridge model and the supporting pier. It should be noted that the pier was not considered in the present study.
Figure 8 shows the tsunami-induced forces on the T-girder bridge deck. The present numerical model was run under two conditions: with and without a pier, represented by the green, short, and dashed line and the red, dashed line in Figure 8, respectively. In Figure 8, the solid line represents the experimental results measured by Nakao et al. [42], and the dot–dash line represents the numerical results obtained by Motley et al. [30]. It can be seen from Figure 8a that the horizontal force rose sharply when the dam break wave reached the bridge deck. The maximum horizontal force occurred at the impact stage when the wave water started to contact the bridge deck. The horizontal force gradually tended to a relatively stable value after an oscillation decline. It should be noted that the experimental data lag behind the numerical results, with a time difference of approximately 0.4 s. This time difference result of the gate release was not instantaneous during the experiment, which was not simulated in the numerical model. To facilitate a more intuitive comparison of the wave forces, the numerical data presented in Figure 8 were shifted backward. A similar treatment was carried out by Motley et al. [30]. Based on the results presented in Figure 8a, it can be concluded that the present numerical model overestimates the horizontal force by 15–25 percent during the steady state. Nonetheless, from an engineering safety perspective, the horizontal forces obtained using the present numerical model are conservative. As shown in Figure 8b, the present numerical model reasonably predicted the vertical forces acting on the bridge deck with consideration of the pier. To concentrate on the effect of the superelevation, the pier was neglected in the following numerical study.

2.4. Numerical Test Plan

The dam break wave acting on a box girder bridge deck was studied in this paper. Figure 9. shows the configuration of the 1/20 scale box girder bridge deck, which was adopted from Yang et al. [19]. The dam break wave generated by different depths of the upstream reservoir over different depths of the downstream were considered in this study. Figure 10. shows the wave heights and corresponding velocities of all incident dam break waves calculated by Stoker’s theory. In this study, the different elevations (Zd, as shown in Figure 1) and different superelevations of the bridge deck (distinguished by the rotation angle, as shown in Figure 1) were simulated.

3. Results and Discussion

3.1. Time Histories of the Wave Forces

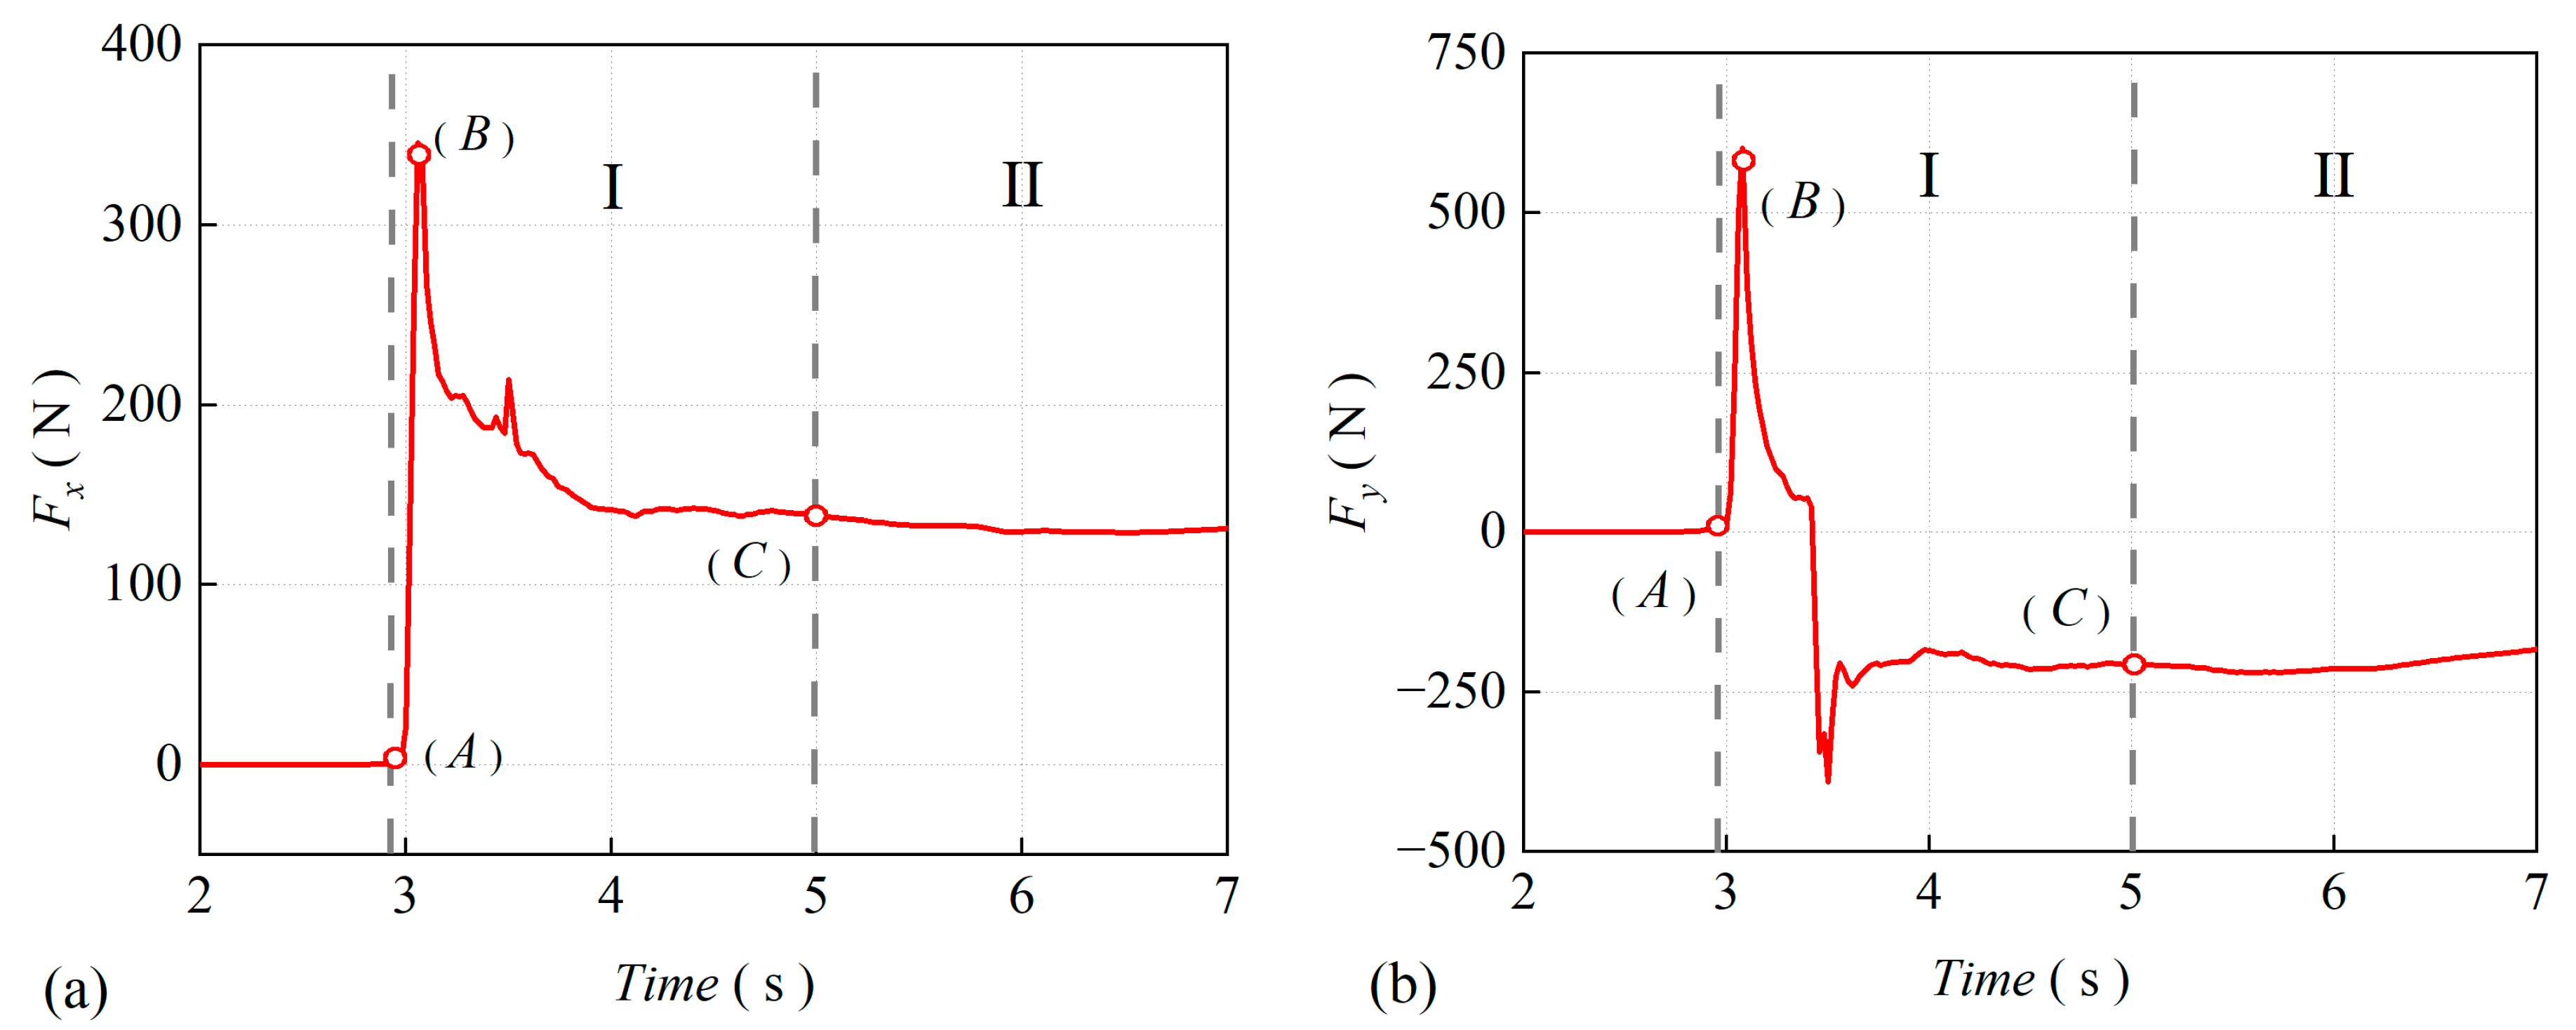
Figure 11 shows the time series of the forces acting on the box girder bridge for the case h1 = 0.7 m, Zd = 0.2 m, h0 = 0.7 m and θ = 0 ° . It can be seen that the forces acting on the bridge model by the dam break wave can be divided into two stages: impact stage (I) and the flow around stage (II). The impact stage is divided into two substages: rising stage (from Moment A to force peak Moment B) and descending stage (from Moment B to Moment C). Snapshots of the fluid field are displayed in Figure 12.

3.2. Characteristic Tsunami Forces for a Box Girder Bridge Deck without Superelevation

In this section, the effects of different parameters on tsunami forces are studied more comprehensively, with varying upstream reservoir water depths, downstream still water depths and deck clearances. In order to represent the test cases with an upstream reservoir water depth, downstream still water depth and deck clearance in a dimensionless form, the following ratios were calculated
R = Z d h 0 h 0
Q = h 1 h 0 h 0
where R is the relative clearance height, Q is the relative reservoir height, Z d is the distance from the bottom of the deck to the bottom of the flume, h 0 is the downstream still water depth and h 1 is the upstream reservoir water depth, as shown in Figure 1.
The tsunami forces on the box girder bridge deck are nondimensionalized without the loss of generality, as follows
F x * = F x , max 0.5 ρ u 2 A v
F y * = F y , max 0.5 ρ u 2 A h
where ρ is the water density, u is the bore velocity, A v is the vertical projected area of the bridge deck and A h is the horizontal projected area of the bridge deck.
The depth of the downstream still water was h 0 = 0.1 m, and the investigation of tsunami force characteristics was conducted by varying the upstream reservoir water depth and deck height. As shown in Figure 13a, when the relative wave height was h 2 / ( Z d + h ) 1 , the tsunami wave height was below the top of the bridge deck, i.e., non-overtopping stage. As the relative wave height increased, the area of the tsunami wave acting on the bridge girder increased; thus, the horizontal tsunami force also increased. When the relative wave height was h 2 / ( Z d + h ) > 1 , the tsunami wave height was higher than the top of the bridge deck, i.e., overtopping stage. In the overtopping stage, the area of the tsunami wave acting on the bridge girder was equal to the vertical projection of the girder, and as the relative wave height increased, more water crossed over the girder. Thus, the horizontal tsunami force decreased with an increasing relative wave height. As the relative clearance height, R, increased, the horizontal tsunami force tended to decrease, and it was more obvious in the overtopping stage. As shown in Figure 13b, with the variation in the relative wave height, h 2 / ( Z d + h ) , the vertical tsunami force had the same trend as the horizontal tsunami force. In the overtopping stage, the vertical tsunami force decreased with an increasing relative wave height. In the non-overtopping stage, the vertical tsunami force increased with the relative wave height increase. The tendency of the vertical tsunami force was inversely proportional to the relative clearance height, R.
With a deck height of Z d = 0.2 m, an investigation of the tsunami force characteristics was conducted by varying the upstream reservoir water depth and downstream still water depth. Figure 14 shows the trend of the vertical tsunami force, with Z d remaining constant, which was similar to that of the horizontal tsunami force with h 0 remaining constant. However, there was a gentle trend of the tsunami force with the variation of the relative wave height h 2 / ( Z d + h ) . As the relative clearance height, R, increased, the horizontal tsunami force tended to decrease. However, the variation in the tsunami force was not significant at R = 0.67∓1.50. Figure 14b shows that the trend of the vertical tsunami force was the same as that of the horizontal tsunami force, and it was also flatter than that of the horizontal tsunami force, with h 0 remaining constant. In addition, the vertical tsunami force tended to decrease with the relative clearance height, R, increases. Moreover, the variation of the vertical tsunami force with R was insignificant. This means that the effect of the variation of the downstream still water depth on the tsunami force was not significant, especially for the vertical tsunami force.
With an upstream reservoir water depth of h 1 = 0.6 m, an investigation of the tsunami force characteristics was conducted by varying the downstream still water depth and deck height. As shown in Figure 15a, the trend of the horizontal tsunami force was also divided into two stages: non-overtopping stage and overtopping stage. In the non-overtopping stage, the horizontal tsunami force was proportional to the relative wave height h 2 / ( Z d + h ) . Meanwhile, it was inversely proportional to h 2 / ( Z d + h ) in the overtopping stage. As the relative reservoir height, Q, increased, the horizontal tsunami force decreased in the overtopping stage. in Figure 15b shows that the vertical tsunami force increased with the increase in h 2 / ( Z d + h ) for both stages. As the relative reservoir height, Q, increased, the wave is increased, although the wave height decreased. Furthermore, in the overtopping stage, the change in the vertical tsunami force was not significant. In the non-overtopping stage, the increasing trend of the vertical tsunami force was the result of a larger contact area. In the overtopping stage, although the increase in Q led to more water crossing over the top of the deck, the increase in the wave speed was not negligible. Larger wave velocities lead to larger tsunami forces, and in the case of a constant upstream reservoir depth, the wave velocity becomes the main factor affecting the varying tsunami forces in the overtopping stage. Thus, the vertical tsunami force increased with the increase in Q in the non-overtopping stage and decreased with increase in Q in the overtopping stage.

3.3. Characteristic Tsunami Forces for a Box Girder Bridge Deck with Superelevation

In order to evaluate the effect of the superelevation on box girder bridges, 0°, ±2°, ±4°, ±6°, ±7.5°, ±9°, ±10.5° and ±12° were selected for the analysis.
In the impact stage, the tsunami forces on the box girder bridge deck were nondimensionalized, as follows
F x * = F x , max F 0 x , max
F y * = F y , max F 0 y , max
where F 0 x , max is the peak horizontal tsunami force at θ = 0 ° , and F 0 y , max is the peak vertical tsunami force at θ = 0 ° .
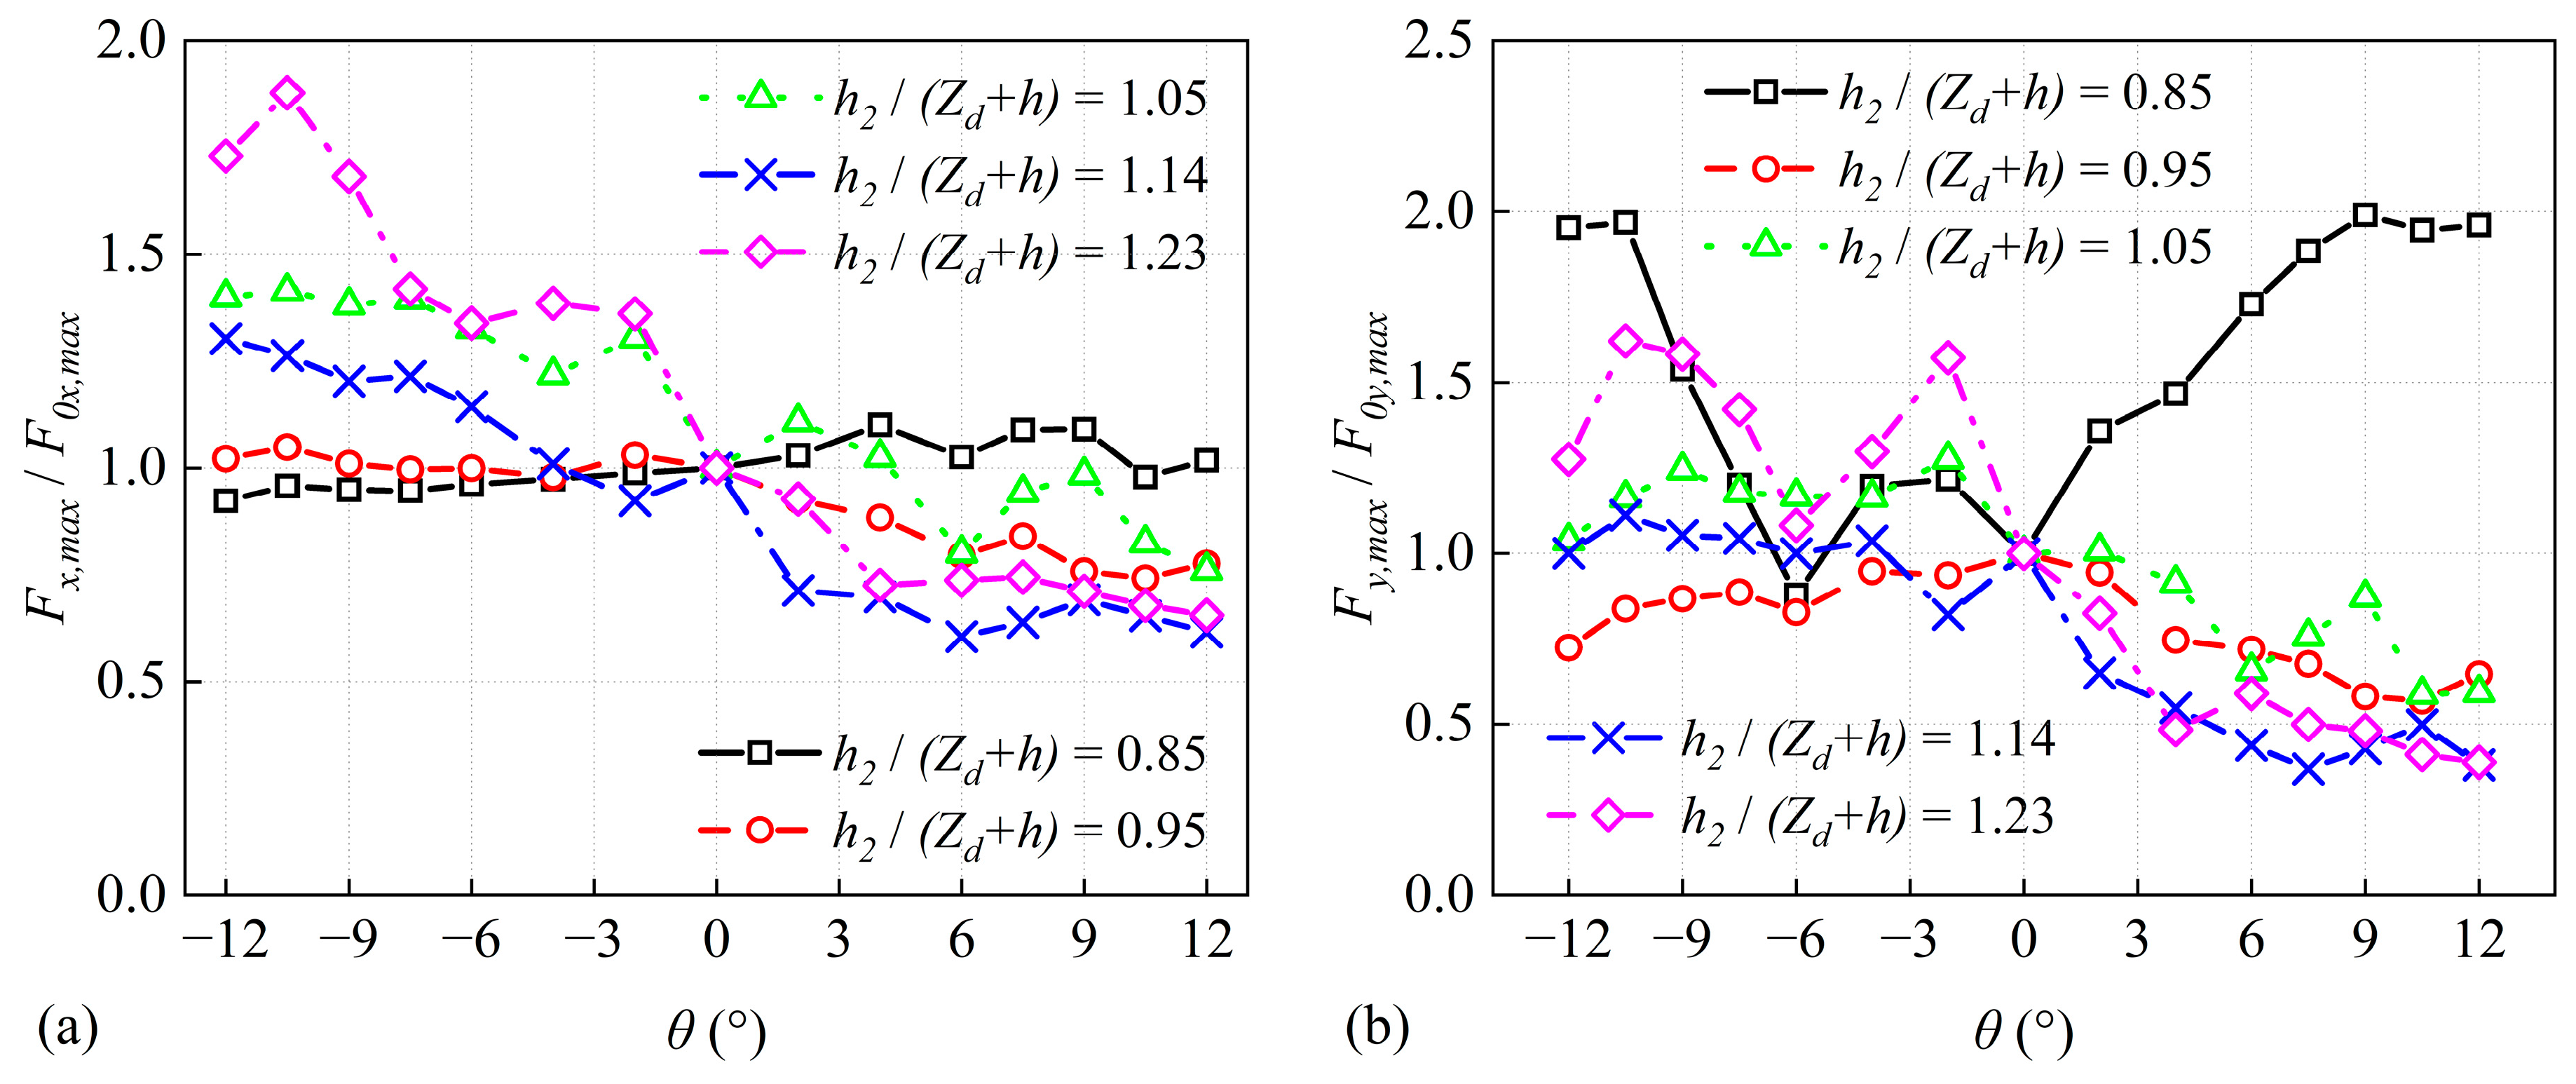
With a deck height of Z d = 0.2 m and downstream still water depth of h 0 = 0.1 m, an investigation of the tsunami force characteristics was conducted by varying the upstream reservoir water depth and girder superelevation. Figure 16a displays the trend of the relative horizontal tsunami force with θ and relative wave height of h 2 / ( Z d + h ) . The relative horizontal tsunami force decreased with the increasing superelevation, and this tendency became more pronounced as the relative wave height increased. In addition, the tsunami force caused by the negative superelevation was significantly larger than that of the positive superelevation in the overtopping stage. In the case of positive superelevation, more water flowed through the upper part of the deck, which led to a reduction of the tsunami force. In the negative superelevation case, the bottom surface of the beam was the main contributor to the tsunami force, and the uneven bottom configuration led to a larger tsunami force. However, when the relative wave height was h 2 / ( Z d + h ) = 0.85 , the relative horizontal tsunami force increased with the increase in the superelevation. At h 2 / ( Z d + h ) = 0.85 (i.e., non-overtopping stage), a positive superelevation increased the contact area between the water and the girder side plate, which caused a larger tsunami force. However, in the negative superelevation case, although the contact area increased, the contact area between the water and the side plate was reduced; thus, the tsunami force was reduced. As shown in Figure 16b, the trend of the relative vertical tsunami force was similar to that of the relative horizontal tsunami force, which decreased with the increase in the superelevation. In addition, the effect of the negative superelevation on the tsunami force was greater than the effect of the positive superelevation. Moreover, at h 2 / ( Z d + h ) = 0.85 (i.e., non-overtopping stage), the vertical tsunami force decreased and then increased with the superelevation, because the change in the superelevation increased the contact area between the water and the girder, which in turn increased the tsunami force.
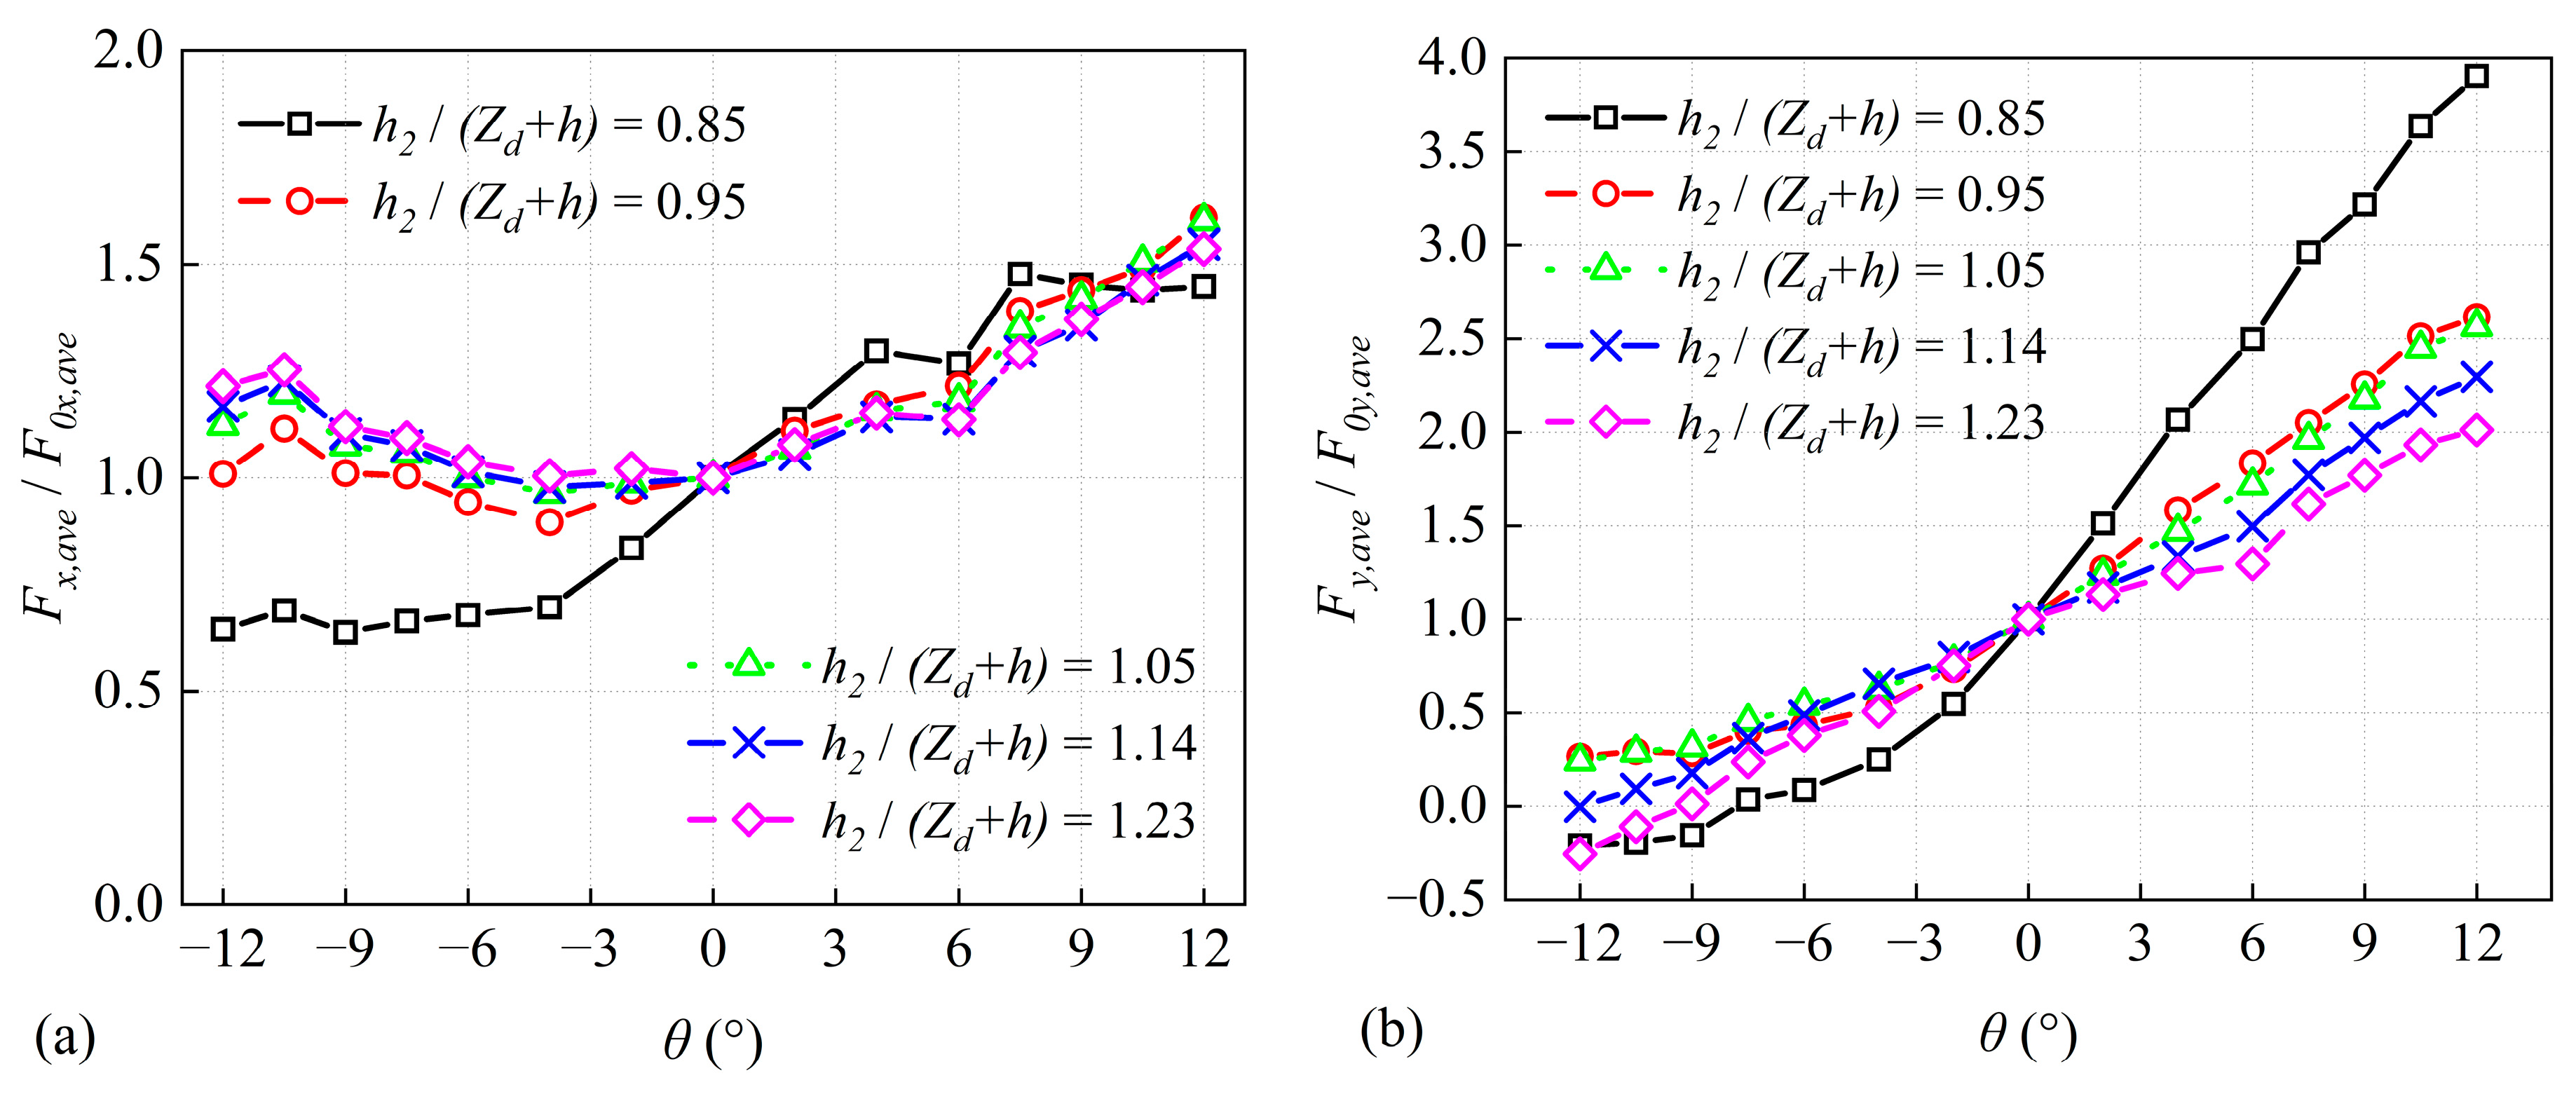
In the flow-around stage, the tsunami forces on the box girder bridge deck were nondimensionalized, as follows
F x * = F x , a v e F 0 x , a v e
F y * = F y , a v e F 0 y , a v e
where F x , a v e is the average horizontal tsunami force during 5 s–7 s, F y , a v e is the average vertical tsunami force during 5 s–7 s, F 0 x , a v e is the average horizontal tsunami force during 5 s–7 s at θ = 0 ° and F 0 y , a v e is the average vertical tsunami force during 5 s–7 s at θ = 0 ° .
Figure 17a shows the trend of the average horizontal tsunami force with θ and a relative wave height of h 2 / ( Z d + h ) . The average horizontal tsunami force decreased and then increased with the increase in the superelevation, and the tsunami force of the positive superelevation was larger than that of the negative superelevation. The vertical projection area of the girder increased with the superelevation, resulting in a larger contact area between the water and the girder. Therefore, the tsunami force also increased. However, in the case of the negative superelevation, the horizontal component of the gravity of the water canceled part of the horizontal tsunami force, so the average horizontal tsunami force in the negative superelevation was smaller than the average tsunami force in the superelevation. In the overtopping stage, the influence of the variation in the relative wave height on the average horizontal tsunami force was not significant. However, in the non-overtopping stage, the horizontal tsunami force increased with the increase in the superelevation. In the case of the negative superelevation, the lift at the bottom of the girder reduces the contact area between the water and the girder side plates, which in turn led to smaller horizontal tsunami forces. In the case of a positive superelevation, a larger contact area between the water and the girder side plate was achieved, thus leading to a higher horizontal tsunami force. As shown in Figure 17b, the average vertical tsunami force increased with the increase in the superelevation. With the increases in the superelevation, more water acts on the deck, thus enlarging the negative vertical force. However, in the case of a negative superelevation, the waves act mainly on the bottom of the girder, generating a positive vertical force. As the negative superelevation grows, the front side of the bridge is lifted higher and less water crosses the deck, resulting in a decrease in the negative vertical force generated by the water. This explains the generation of positive average vertical tsunami forces at 12 ° . In the overtopping stage, it was not obvious that the average vertical tsunami force was affected by the relative wave height. However, in the non-overtopping stage (i.e., h 2 / ( Z d + h ) = 0.85 ), the average vertical tsunami force was more influenced by the superelevation, and the maximum average vertical tsunami force reached four times that at θ = 0 ° .

4. Conclusions

In this study, a 3D dam break numerical model was developed to simulate the tsunami wave impact on a box girder bridge deck with superelevation, which has seldom been studied in the existing research works. The numerical model was validated by Stoker’s analytical solution and the hydrodynamic experiment conducted by Nakao et al. The effect of the depth of the reservoir, elevation of the bridge deck, downstream still water depth and bridge superelevation on tsunami-like wave generated forces were investigated by the validated numerical model. The following conclusions are drawn from this study:
(1) The two stages of tsunami impact on a box girder were divided into the impact stage and the flow-around stage, where the impact stage can be divided into two substages: rising stage and descending stage. Tsunami waves acting on box beams can be divided into the non-overtopping stage and overtopping stage, and the trend of the tsunami forces varies from case to case.
(2) For box girders without a superelevation, the tsunami force increases with the relative wave height in the non-overtopping stage and decreases with the relative wave height in the overtopping stage. However, in the case of a small relative storage depth, the horizontal tsunami force increases with the increase in the relative wave height in the overtopping stage. The tsunami force decreases with an increasing relative clearance, R, and is more significant in the overtopping stage. The vertical tsunami force increases with increases in Q in the non-overtopping stage and decreases with increases in Q in the overtopping stage.
(3) For box girders with a superelevation, the relative tsunami forces were investigated for the impact stage and the flow-around stage. During the impact stage, the relative tsunami force decreases with an increasing superelevation, but in the non-overtopping stage, the relative tsunami force increases with an increasing superelevation. The relative tsunami force increases with the relative wave height and is more significant in the case of a negative superelevation. During the flow-around stage, the relative average horizontal tsunami force decreases and then increases with an increase in the superelevation, but in the non-overtopping stage, the relative average horizontal tsunami force increases with the increase of superelevation, the relative average vertical tsunami force increases with the increase in the superelevation, and is more significant in the non-overtopping stage. In addition, under certain circumstances, the average vertical tsunami force turns into a lifting force in the case of negative superelevation.

Author Contributions

Y.S., Writing—original draft, Visualization, Data curation and Methodology; J.J., Visualization and Data curation; H.L., Visualization and Data curation; F.C., Project administration and Supervision; Q.F., Methodology, Data curation, Funding acquisition and Writing—original draft. All authors have read and agreed to the published version of the manuscript.

Funding

The authors greatly appreciate the financial support from the National Natural Science Foundation of China (52178128). This work was also partially supported by the State Key Lab of Subtropical Building Science, South China University of Technology (2022ZB18).

Data Availability Statement

The data presented in this study are available upon request.

Conflicts of Interest

The authors declare no conflict of interest.

Notation List

The following symbols are used in this paper:
h0Downstream still water depth (m)
h1Upstream reservoir water depth (m)
h2Wave height (m)
ZdDistance from the flume bed to the bottom of the deck (m)
θGirder superelevation (°)
hGirder height (m)
uBore velocity (m/s)
Fx, FyMeasured horizontal and vertical forces (N)
RRelative clearance height
QRelative reservoir height
Fx,max, Fy,maxMaximum value of the measured horizontal and vertical forces (N)
AvVertical projected area of the bridge deck (m2)
AhHorizontal projected area of the bridge deck (m2)
Fx,ave, Fy,aveAverage horizontal and average tsunami forces during the flow-around stage (N)
F0x,ave, F0y,aveAverage horizontal and average tsunami forces during the flow-around stage at θ = 0° (N)

References

  1. Kazama, M.; Noda, T. Damage statistics (Summary of the 2011 off the Pacific Coast of Tohoku Earthquake damage). Soils Found. 2012, 52, 780–792. [Google Scholar] [CrossRef] [Green Version]
  2. Maruyama, K.; Tanaka, Y.; Hosoda, A. Damage of bridge structures by huge tsunami and evaluation of tsunami force on bridges. In Proceedings of the 8th International Symposium on Social Management Systems, New York, NY, USA, 1 May 2012. [Google Scholar]
  3. Hayatdavoodi, M.; Seiffert, B.; Ertekin, R.C. Experiments and computations of solitary-wave forces on a coastal-bridge deck. Part II: Deck with girders. Coast. Eng. 2014, 88, 210–228. [Google Scholar] [CrossRef]
  4. Huang, B.; Zhu, B.; Cui, S.; Duan, L.; Zhang, J. Experimental and numerical modelling of wave forces on coastal bridge superstructures with box girders, Part I: Regular waves. Ocean Eng. 2018, 149, 53–77. [Google Scholar] [CrossRef]
  5. Istrati, D.; Buckle, I. Role of Trapped Air on the Tsunami-Induced Transient Loads and Response of Coastal Bridges. Geosciences 2019, 9, 191. [Google Scholar] [CrossRef] [Green Version]
  6. Xu, G.; Cai, C.S.; Chen, Q. Countermeasure of Air Venting Holes in the Bridge Deck–Wave Interaction under Solitary Waves. J. Perform. Constr. Facil 2017, 31, 04016071. [Google Scholar] [CrossRef]
  7. Xu, G.; Cai, C.S.; Han, Y. Investigating the Characteristics of the Solitary Wave-Induced Forces on Coastal Twin Bridge Decks. J. Perform. Constr. Facil 2016, 30, 04015076. [Google Scholar] [CrossRef]
  8. Zhao, E.; Sun, J.; Tang, Y.; Mu, L.; Jiang, H. Numerical investigation of tsunami wave impacts on different coastal bridge decks using immersed boundary method. Ocean Eng. 2020, 201, 107132. [Google Scholar] [CrossRef]
  9. Qu, K.; Tang, H.S.; Agrawal, A.; Cai, Y.; Jiang, C.B. Numerical investigation of hydrodynamic load on bridge deck under joint action of solitary wave and current. Appl. Ocean Res. 2018, 75, 100–116. [Google Scholar] [CrossRef]
  10. Chen, C.; Melville, B.W.; Nandasena, N.A.K.; Farvizi, F. An Experimental Investigation of Tsunami Bore Impacts on a Coastal Bridge Model with Different Contraction Ratios. J. Coast. Res. 2018, 342, 460–469. [Google Scholar] [CrossRef]
  11. Farvizi, F.; Melville, B.W.; Shamseldin, A.Y.; Shafiei, S. Experimental investigation of the effects of contraction on tsunami-induced forces and pressures on a box section bridge. J. Hydro-Environ. Res. 2022, 40, 116–130. [Google Scholar] [CrossRef]
  12. Farvizi, F.; Melville, B.W.; Shamseldin, A.Y.; Shafiei, S.; Hendi, E. Experimental investigation of tsunami bore-induced forces and pressures on skewed box section bridges. Ocean Eng. 2021, 224, 108730. [Google Scholar] [CrossRef]
  13. Nakao, H.; Nozaka, K.; Izuno, K.; Kobayashi, H. Tsunami hydrodynamic force on various bridge sections. In Proceedings of the 15th World Conference on Earthquake Engineering, Lisbon, Portugal, 24–28 September 2012. [Google Scholar]
  14. Xu, Z.; Melville, B.; Nandasena, N.A.K.; Whittaker, C.; Shamseldin, A.; Farvizi, F. Tsunami loads on slab bridges. Coast. Eng. 2021, 165, 103853. [Google Scholar] [CrossRef]
  15. Yang, W.; Liu, Y.; Yang, Y.; Liu, D.; Ning, J.; Zhang, Y.; Yang, H. Study on air escape in submerging process of multi-box girder attacked by flood. Ocean Eng. 2023, 273, 113891. [Google Scholar] [CrossRef]
  16. Istrati, D.; Buckle, I.G. Effect of fluid-structure interaction on connection forces in bridges due to tsunami loads. In Proceedings of the 30th US-Japan Bridge Engineering Workshop, Washington, DC, USA, 21–23 October 2014. [Google Scholar]
  17. Leschka, S.; Oumeraci, H. Solitary waves and bores passing three cylinders-effect of distance and arrangement. In Proceedings of the 34th Conference on Coastal Engineering, Seoul, Republic of Korea, 15–20 June 2014. [Google Scholar]
  18. Chanson, H. Tsunami surges on dry coastal plains: Application of dam break wave equations. Coast. Eng. J. 2006, 48, 355–370. [Google Scholar] [CrossRef] [Green Version]
  19. Yang, Z.; Huang, B.; Zhu, B.; Zhang, J.; Kang, A. Comparative Study of Tsunami-Like Wave-Induced Forces on Medium-Scale Models of Box Girder and T-Girder Bridges. J. Bridge Eng. 2021, 26, 04020125. [Google Scholar] [CrossRef]
  20. Wong, H.K. Three-Dimensional Effects of Tsunami Impact on Bridges. Ph.D. Thesis, University of Washington, Washington, DC, USA, 2015. [Google Scholar]
  21. Fang, Q.; Liu, J.; Hong, R.; Guo, A.; Li, H. Experimental investigation of focused wave action on coastal bridges with box girder. Coast. Eng. 2021, 165, 103857. [Google Scholar] [CrossRef]
  22. Guo, A.; Fang, Q.; Bai, X.; Li, H. Hydrodynamic Experiment of the Wave Force Acting on the Superstructures of Coastal Bridges. J. Bridge Eng. 2015, 20, 04015012. [Google Scholar] [CrossRef]
  23. Winter, A.O.; Motley, M.R.; Eberhard, M.O. Tsunami-Like Wave Loading of Individual Bridge Components. J. Bridge Eng. 2018, 23, 04017137. [Google Scholar] [CrossRef]
  24. Yang, W.; Lai, W.; Zhu, Q.; Zhang, C.; Li, F. Study on generation mechanism of vertical force peak values on T-girder attacked by tsunami bore. Ocean Eng. 2020, 196, 106782. [Google Scholar] [CrossRef]
  25. Nakamura, T.; Sawa, Y.; Mizutani, N. Experimental Study on Characteristics Of Tsunami-Induced Pressure And Force Acting on a Bridge Superstructure. J. Jpn. Soc. Civ. Eng. Ser. B3 (Ocean. Eng.) 2014, 70, I_420–I_425. [Google Scholar] [CrossRef] [Green Version]
  26. Nakamura, T.; Sawa, Y.; Mizutani, N. Study on the Evaluation of Temporal Change in Horizontal and Vertical Tsunami Forces Acting on a Bridge Superstructure. Coast. Eng. J. 2018, 58, 1640020. [Google Scholar] [CrossRef] [Green Version]
  27. Lukkunaprasit, P.; Lau, T.L. Influence of bridge deck on tsunami loading on inland bridge piers. IES J. Part A Civ. Struct. Eng. 2011, 4, 115–121. [Google Scholar] [CrossRef]
  28. Issakhov, A.; Borsikbayeva, A. The impact of a multilevel protection column on the propagation of a water wave and pressure distribution during a dam break: Numerical simulation. J. Hydrol. 2021, 598, 126212. [Google Scholar] [CrossRef]
  29. Bullock, G.; Crawford, A.; Hewson, P.; Walkden, M.; Bird, P. The influence of air and scale on wave impact pressures. Coast. Eng. 2001, 42, 291–312. [Google Scholar] [CrossRef]
  30. Motley, M.R.; Wong, H.K.; Qin, X.; Winter, A.O.; Eberhard, M.O. Tsunami-Induced Forces on Skewed Bridges. J. Waterw. Port Coast. Ocean. Eng. 2016, 142, 04015025. [Google Scholar] [CrossRef]
  31. Seiffert, B.R.; Ertekin, R.C.; Robertson, I.N. Wave loads on a coastal bridge deck and the role of entrapped air. Appl. Ocean Res. 2015, 53, 91–106. [Google Scholar] [CrossRef]
  32. Wei, Z.; Dalrymple, R.A. Numerical study on mitigating tsunami force on bridges by an SPH model. J. Ocean. Eng. Mar. Energy 2016, 2, 365–380. [Google Scholar] [CrossRef] [Green Version]
  33. Nassiraei, H.; Heidarzadeh, M.; Shafieefar, M. Numerical Simulation of Long Waves (Tsunami) Forces on Caisson Breakwaters. Sharif J. Civ. Eng. 2016, 32, 3–12. [Google Scholar]
  34. Gao, H.; Song, Y.; Fang, Q.; Li, S. Wave forces on box-girder-type bridge deck located behind trench or breakwater. Ocean Eng. 2021, 237, 109618. [Google Scholar] [CrossRef]
  35. Zhang, G.; Hoshikuma, J.-i. An Experimental Study on Countermeasure for Mitigating Tsunami Effect on Highway Bridge. In Proceedings of the 15th World Conference on Earthquake Engineering, Lisbon, Portugal, 24–28 September 2012. [Google Scholar]
  36. Abukawa, T.; Nakamura, Y.; Hasegawa, A. Effect of reducing tsunami damage by installing fairing in Kesen-Bridge. Earthq. Struct. 2014, 7, 1045–1060. [Google Scholar] [CrossRef]
  37. Nakamura, T.; Mizutani, N.; Ren, X. Study on Countermeasures for Reducing Tsunami Force Acting on a Bridge Superstructure And Its Effect on the Motion Of the Superstructure. J. Jpn. Soc. Civ. Eng. Ser. B3 (Ocean. Eng.) 2013, 69, I_359–I_364. [Google Scholar] [CrossRef] [Green Version]
  38. Bricker, J.D.; Nakayama, A. Contribution of Trapped Air, Deck Superelevation, and Nearby Structures to Bridge Deck Failure during a Tsunami. J. Hydraul. Eng. 2014, 140, 05014002. [Google Scholar] [CrossRef]
  39. Shigematsu, T.; Liu, P.L.F.; Oda, K. Numerical modeling of the initial stages of dam-break waves. J. Hydraul. Res. 2004, 42, 183–195. [Google Scholar] [CrossRef]
  40. Launder, B.E.; Sharma, B.I. Application of the energy-dissipation model of turbulence to the calculation of flow near a spinning disc. Lett. Heat Mass Transfer 1974, 1, 131–137. [Google Scholar] [CrossRef]
  41. Stoker, J. Water Waves. The Mathematical Theory with Applications; Wiley-Interscience: New York, NY, USA, 1957. [Google Scholar]
  42. Nakao, H.; Zhang, G.; Sumimura, T.; Hoshikuma, J. Effect of cross-sectional configuration of superstructure on hydrodynamic behavior of bridges subjected to tsunami-induced loading. J. Jpn. Soc. Civ. Eng. Ser. A1 (Struct. Eng. Earthq. Eng.) 2013, 69, I.42–I.54. [Google Scholar]
Figure 1. Sketch of the numerical setup.
Jmse 11 00824 g001
Figure 2. Three different meshes applied in the numerical model.
Jmse 11 00824 g002
Figure 3. Maximum tsunami-induced forces calculated by the present model with different mesh sizes in the main calculation domain.
Jmse 11 00824 g003
Figure 4. Sketch of the empty wave flume.
Jmse 11 00824 g004
Figure 5. Comparison of the numerical model with Stoker’s theoretical solution for the free surface height: (a) h1 = 0.471 m, h0 = 0.200 m; (b) h1 = 0.682 m, h0 = 0.200 m.
Jmse 11 00824 g005
Figure 6. Comparison between the numerical model and Stoker’s theoretical solution.
Jmse 11 00824 g006
Figure 7. Configuration of the T-type girder (units: mm).
Jmse 11 00824 g007
Figure 8. Comparison of the (a) horizontal force and (b) vertical force on the bridge deck between the presented numerical model and published works.
Jmse 11 00824 g008
Figure 9. Configuration of the box girder (units: mm).
Jmse 11 00824 g009
Figure 10. (a) Wave height and (b) wave speed calculated by Stoker’s theory.
Jmse 11 00824 g010
Figure 11. Time history of the (a) total horizontal forces and (b) total vertical forces on the box girder.
Jmse 11 00824 g011
Figure 12. Snapshots of the tsunami-like wave impacting the bridge.
Jmse 11 00824 g012
Figure 13. Normalized maximum tsunami forces at different relative wave heights: (a) horizontal tsunami force; (b) vertical tsunami force (h0 = 0.1 m).
Jmse 11 00824 g013
Figure 14. Normalized maximum tsunami forces at different relative wave heights: (a) horizontal tsunami force; (b) vertical tsunami force (Zd = 0.2 m).
Jmse 11 00824 g014
Figure 15. Normalized maximum tsunami forces at different relative wave heights: (a) horizontal tsunami force; (b) vertical tsunami force (h1 = 0.6 m).
Jmse 11 00824 g015
Figure 16. Relative tsunami force when (a) horizontal and (b) vertical during the impact stage (h0 = 0.1 m, Zd = 0.2 m).
Jmse 11 00824 g016
Figure 17. Relative average tsunami force when (a) horizontal and (b) vertical during the flow-around stage (h0 = 0.1 m, Zd = 0.2 m).
Jmse 11 00824 g017
Table 1. Model boundary conditions.
Boundaryα1εkprghU
BottomzeroGradientepsilonWallFunctionkqRWallFunctionfixedFluxPressurefixedValue
Left wallzeroGradientepsilonWallFunctionkqRWallFunctionfixedFluxPressurefixedValue
Right wallzeroGradientepsilonWallFunctionkqRWallFunctionfixedFluxPressurefixedValue
AtmosphereinletOutletzeroGradientzeroGradienttotalPressurepressureInletOutletVelocity
Bridge modelzeroGradientepsilonWallFunctionkqRWallFunctionfixedFluxPressurefixedValue
Front wallzeroGradientepsilonWallFunctionkqRWallFunctionfixedFluxPressurefixedValue
Back wallzeroGradientepsilonWallFunctionkqRWallFunctionfixedFluxPressurefixedValue
Table 2. Mesh sensitivity testing of the main calculation zone (using a computer with a double Inter Xeon Gold 5218R processor (2.1 GHz and 40 M cache) CPU).
Cell Length (m)Total Mesh NumberCalculation Time (h)
0.05526,0411.32
0.025691,8292.05
0.01252,074,9039.47
0.0062513,431,024235
Disclaimer/Publisher’s Note: The statements, opinions and data contained in all publications are solely those of the individual author(s) and contributor(s) and not of MDPI and/or the editor(s). MDPI and/or the editor(s) disclaim responsibility for any injury to people or property resulting from any ideas, methods, instructions or products referred to in the content.