Article

Multiphase Flow Simulation of ITTC Standard Cavitator for Underwater Radiated Noise Prediction

1
VTT Technical Research Centre of Finland Ltd., Tekniikantie 21, 02150 Espoo, Finland
2
Schiffbau-Versuchsanstalt Potsdam GmbH, Marquardter Chaussee 100, 14469 Potsdam, Germany
3
CNR-INM, Institute of Marine Engineering, Via di Vallerano 139, 00128 Rome, Italy
*
Author to whom correspondence should be addressed.
J. Mar. Sci. Eng. 2023, 11(4), 820; https://doi.org/10.3390/jmse11040820
Submission received: 28 February 2023 / Revised: 23 March 2023 / Accepted: 5 April 2023 / Published: 12 April 2023

Abstract

:
This work focuses on the main issues related to noise measurements in cavitation tunnels. The scope of the paper is to twofold: to obtain a better understanding on the main phenomena underlying experiments and to define consistent cavitation tunnel measurement corrections for background noise, wall reflections, and distance normalisation. To this aim, the acoustic field generated by the ITTC standard cavitator model inside a cavitation tunnel is predicted by Lighthill’s acoustic analogy and solved through a finite element method that inherently accounts for the presence of the walls. Sources of sound detection relies on two multiphase CFD solvers, namely, the homogeneous mixture model—Volume of Fluid method and the Euler–Euler formulations. Starting from the computation of the sound pressure level in the free field with the assumption of spherical spreading without absorption, corrections from losses and spreading are detected by the above approach. Background-corrected sound pressure levels are identified and then compared with the source levels measured in the cavitation tunnel of the Potsdam Model Basin (SVA). It is found that free-field computations corrected by tunnel-induced effects match well with experiments up to 100 Hz (in the one-third octave band), whereas relevant discrepancies arise out of this range that need further investigations.

1. Introduction

The mitigation of Underwater Radiated Noise (URN) is important to any type of vessel as a reaction to environmental concerns. For this reason, underwater ship noise and its impact on marine life is receiving a great deal of attention worldwide. Literature studies demonstrate that over the last three decades, shipping has caused an increase in the sea’s natural background noise level from 20 to 30 dB, especially in the [10, 300] Hz frequency range, which is particularly hazardous for marine life. For this reason, URN regulations are becoming more and more stringent. Underwater noise is also an issue in military vessels due to risk of detection by sonar systems or interference with on-board equipment. Generally, URN from ships comes from different sources such as vibroacoustic contributions from the machinery, generators, and gears, as well as hydroacoustincs from propulsors, hull-flows, and appendages. Among them, marine propellers, especially in cavitating conditions, are particularly noisy due to fluctuations in the cavitation volumes (generating tones in the blade passing frequency and its multipliers) and the collapse of cavitating structures (inducing broadband signals). Moreover, cavitation can appear in a range of different forms such as sheet, cloud, and vortex cavitation that occur at different temporal and spatial scales.
Focusing on cavitating flows, experiments inside cavitation tunnels are frequently used to characterize radiated sound levels. Although a compendium of tunnel and hydrophone installations may be found in Bark et al. [1], Doolan et al. [2]; Felli [3], Jeona and Joob [4] and Tani et al. [5,6], the diversity of installations in use is large, and no valid international standard for noise measurements exists, differently from the aeroacoustic field (see for instance, the standard ISO-5136:2003 [7] governing the sound power determination of ducted fans). These limits, even in light of the fairly loose guidelines by International Towing Tank Conference [8], make the development of standard measurement procedures in cavitation tunnels, for both model and full scale measurements, an urgent need for researchers, especially when results between different premises are compared or transferred to other conditions. Following International Towing Tank Conference [8], it is proven that the main issues concerning cavitation tunnel noise measurements are: (i) correction for background noise; (ii) distance normalisation; (iii) correction for tunnel wall reflections; and (iv) scaling of the model-scale results up to the full scale. Background noise is measured by replacing the propeller with a dummy hub and then running the test facility at the same speed, shaft rate, and depressurzsation level as in the test with the propeller.
Distance normalisation is accomplished by transforming the sound pressure measured at distance r from the source into a reference distance of 1 m, assuming the ideal condition of spherical or cylindrical spreading. Corrections for tunnel wall reflections are identified by a known source placed at specific locations in the test section, yielding the transfer function between source and received acoustic signal; such a procedure is source-dependent, in that the correction derived for a specific type of source typically does not apply to others. (Since reflections are not the only phenomenon covered by this procedure, it should be better referred to as correction for tunnel environment). In this context, elastic effects play a crucial role since the boundary of the tunnel does not behave like a perfectly reflecting body, thus transferring a relevant amount of sound power from water to the walls (from air to steel, the portion transferred is approximately 0.004%) Vér and Beranek [9], giving rise to local resonances which interfere with measurements.
Note that the windows of a typical cavitation tunnel (made of some plastic material or glass) are particularly prone to resonant vibrations due to the pressure field inside the acoustic cavity. Such resonances may cause several unwanted consequences, such as signal-disturbing vibrations of sensors clamped to the windows, disruptive sound radiation, and local pressure minima with phase reversal on the tunnel wall.
The above discussion has inspired the present paper, which proposes a numerical investigation to define consistent cavitation tunnel measurement corrections for background noise, wall reflections, and distance normalisation. The scope of the paper is to obtain a better understanding on the main issues underlying cavitation tunnel experiments in an attempt to propose possible solutions of practical interest. In detail, the sound field of an ITTC standard cavitator model in a cavitation tunnel is predicted by solving Lighthill’s acoustic analogy with a Finite Element Method (FEM) formulation, where the sources of sound are detached by two multiphase flow simulations based on the homogeneous mixture model–Volume of Fluid (VOF) method [10,11,12,13,14,15,16,17] and the Euler–Euler (EE) approach [18]. Starting from the computation of the sound pressure level in the free field, and assuming spherical spreading without absorption, Computational Fluid Dynamics (CFD) and Computational Hydroacoustics (CHA) allows the definition of an equivalent sound pressure level that accounts for corrections due to acoustic spreading and losses, whereas a devoted FEM analysis of the tunnel yields information on teh vibroacoustic effects on wall-mounted sensors. Using this approach, background-corrected sound pressure levels are identified and then compared with the source levels measured at the cavitation tunnel of the Potsdam Model Basin (SVA). The ITTC cavitator is chosen for its advantages of its stationary bodies over rotating ones (such as propellers) in dealing with cavitation phenomena.
The paper is organised as follows: Section 2 presents the main steps and theoretical formulations used throughout the manuscript, whereas Section 3 shows the numerical results. Specifically, Section 3.1 and Section 3.2 discuss tunnel vibroacoustics and environmental effects. Section 3.3 deals with CFD simulations, whilst in Section 3.4, acoustic outcomes are shown, along with the comparison with experiments. Finally, Section 4 presents the conclusions of the investigation.

2. Background

2.1. Principles in URN Measurements

Sound emitted by a source is described by two quantities, sound power and directivity, the first being the rate at which sound energy is emitted per unit time and the latter being a measure of the directional features of the source. At a given observer position, the acoustic pressure depends on the surrounding environment, just like ship structures, reflections at sea bottom and free-surface, absorption and temperature gradients. By denoting with p the sound pressure, ρ 0 the density of sea water, and c the sound speed, the acoustic intensity I = p / ρ 0 c is particularly suited to describe acoustic propagation phenomena. Under the assumptions a point source, wave spherical spreading without absorption (pressure varying as 1 / r ), and an acoustic observer in a far free field, the integration of I over a sphere of radius r yields the sound power W = 4 π r 2 p ( r ) 2 / Z 0 ( Z 0 = ρ 0 c denotes the acoustic impedance of the medium), whose Sound Pressure Level L p (dB) is
L p ( r ) = L W + 10 l g Q 4 π r 2
where L W is the Sound Power Level and Q is the directivity factor (Q = 1).
Starting from the knowledge of the Sound Pressure Level L p measured in the far free field and corrected for background noise, acoustic spreading, and losses, URN measurement typically relies on the Source Level L s that, at a distance r from the i-th hydrophone, recasts
L s ( r , i ) = L p + G
where L p is the measured and background-corrected Sound Pressure Level and G is a function accounting for corrections from acoustic spreading and losses. (Confusingly, in underwater acoustics, this function is sometimes called transmission loss ( T L ) (see, for instance, Ainslie and Morfey [19])). The issues related to the use of Equation (2) are due to the discrepancies found in the estimation of the corrective factors, such as losses and reflections. Focusing on measurements in a cavitation tunnel, corrections for the tunnel environment, including vibroacoustic effects, and the understanding of their dependence on the source-type are crucial aspects to quantify the test’s repeatability as well as its uncertainties. Following the scope of the paper declared in Section 1, an equivalent Sound Pressure Level L p , e q v may be defined for a direct comparisons with the Source Levels L s measured in a cavitation tunnel. To this aim, starting from Equation (1), corrections from losses and spreading (namely, the G function) are detected by high-fidelity CFD-CHA simulations, whereas an FEM analysis of the tunnel cavity defines Sound Pressure Levels L p corrected for the more significant background effects, such as vibrations and reflections.

2.2. Multiphase Flow Solution

The numerical modelling of cavitation is challenging, as it can occur in a vast range of scales from dispersed micro-bubbles, to continuous sheets of vapour structures with clear and visible interfaces between the liquid and gas regions, to vortex cavitation. The phase change rate and multiphase phenomena are also complex. Numerical predictions of cavitation problems in engineering applications are mostly treated with homogeneous mixture flow models, where single momentum and turbulence equations are used for the mixture of the phases. Homogeneous mixture model–Volume of Fluid (VOF) based approaches predict the water and vapour regions as a mixture of these phases and the cavitation physics are accounted for by a mass-transfer model and vapour-fraction transport equation. Different widely applied cavitation multiphase flow models are reviewed by Niedźwiedzka et al. [20] and Luo et al. [21], focusing, for instance, on a homogeneous mixture context. Applying such models, several rather complex phenomena have been addressed recently, such as vortex cavitation and its inception [22], ship hull pressure pulses [10], bubbly or cloudy cavitation in ship propeller wakes [23], erosion [24], sheet-to-cloud cavitation transition [25], and even shock waves [26] for model-scale ship propellers. Work has been conducted on improving mass-transfer models in an attempt to better capture various cavitation features [14,27]. Good-quality predictions of cavitating cases from analyses applying VOF cavitation models can be commonly expected, albeit mainly for problems that feature segregated vapour regions which can be clearly distinguished or identified such as vortex or steady sheet cavitation. The description of such multiphase flows prevents accounting for any phase interaction mechanisms in dispersed systems; the resolutions of, e.g., small vapour bubbles typically observed in streaks or cloudy cavities or during the transition from sheet to cloud cavitation would require impractical numerical resolutions using such an approach.
Methods in the Eulerian–Lagrangian framework [28,29], which include both the continuum two-phase flow as well as subgrid bubbles and nuclei and account for the interactions between phases, aim to remedy some of the issues of purely homogeneous VOF-based modelling. An Eulerian description can be assigned to the water and vapour phases with VOF-type transfer for larger structures that are non-dispersed, and a Lagrangian description can be used for the dispersed smaller structures. An essential feature in such modelling is the distinction and transition between these two representations. Different force contributions can be accounted for in the Lagrangian description, such as the lift and drag of the bubbles. For instance, Hsiao et al. [29], Wang et al. [30,31], Lidtke et al. [32], and Yakubov et al. [33] have used a VOF model together with a Lagrangian method for bubbles to assess the multiscale flow features of cavitating flows.
An inhomogeneous Euler–Euler (EE) solution approach [18] can also act as a feasible alternative in complex cavitation flow problems. The EE method relies on phasic conservation equations and size distributions of dispersed phases that can be based on a population balance method or interfacial area transport; it also permits accounting for phase interactions and a range of multiphase flow phenomena and also transfers well to subgrid scales. Employing conservation equations for each phase separately, the interphase transfer and interaction processes are included in the formulation through the modelling of interphase exchange terms. This allows for the resolution of phenomena such as relative velocity between phases and the associated drag and lift forces, bubble size distributions, and bubble break-up and coalescencing that cannot be accounted for using homogeneous mixture–VOF models (unless the dispersed phase is fully resolved with the numerical methods and the grid, which is extremely computationally expensive). While computationally slightly more costly, an inhomogeneous flow model enables a physically sound framework for predicting cavitation flow.
These methods have been seldomly applied to hydrodynamic cavitating problems, although some investigations have recently been reported [34,35,36]. For instance, Edelbauer [34] employed an inhomogeneous flow solution to study a cavitating injector flow with liquid jet spray break-up using a combined Euler–Euler solver for liquid–vapour phases and a Volume of Fluid approach for liquid–gas phases. Moreover, Li and Carrica [35] developed a population balance method for cavitating flows and evaluated it for cavitating hydrofoils.
In this work, the solution to the cavitating multiphase flow past the cavitator is obtained both by the homogeneous VOF and inhomogeneous EE modelling methods implemented in the OpenFOAM (Version 8) CFD platform.
The homogeneous flow model is based on the Navier–Stokes equations for two incompressible, isothermal, and immiscible fluids with their phase-changes accounted for by mass-transfer models. The governing equations for the homogeneous mixture model in differential form are
ρ m t + · ( ρ m U ) = 0
ρ m U t + · ( ρ m U U ) = p + ρ m g + · μ m , eff U + U T ,
where ρ m is the mixture density, U the velocity vector, p is the pressure, g is the acceleration due to gravity, and μ e f f is the effective viscosity.
The effective viscosity is μ e f f = μ + μ t , where μ is the molecular viscosity and μ t is the turbulent viscosity, determined by turbulence modelling. The mixture’s material properties are calculated as ρ m = ϕ α ϕ ρ ϕ and μ m = ϕ α ϕ μ ϕ , where α ϕ is the volume fraction of each phase ϕ . For the volume fraction, the following holds: ϕ α ϕ = 1 . Cavitation is modelled using a transport equation for the liquid-phase volume fraction. In the case of a constant density for each phase, we have
α t + · ( α U ) = 1 ρ l d m d t .
The term d m / d t on the right-hand side denotes the mass transfer. Several cavitation mass-transfer models have been developed in the past [37,38,39,40,41], and typically, the mass-transfer rate is proportional to a pressure difference from the saturated state or to the square root of that. The mass-transfer terms are separated into two contributions as m ˙ = m ˙ + m ˙ + for evaporation and condensation, respectively. A number of mass-transfer models are available in OpenFOAM for homogeneous mixture modelling, and in the present work, we use the Kunz model [37]. The Kunz model treats evaporation as proportional to the liquid volume fraction and the pressure below the vapour pressure and treats the condensation as a cubic function of the volume fraction:
m ˙ = C d e s t ρ v α l min ( 0 , p p sat ) 1 / 2 ρ l V 2 t and m ˙ + = C p r o d ρ v α l 2 ( 1 α l ) t ,
where C d e s t is the evaporation constant and C p r o d is the condensation constant. In the expressions above, t represents a mean flow time scale, which we take as c / V (c is the max. chord of the foil, and V is the inlet flow speed). The values of the empirical coefficients are set as C c ( = C p r o d ) = C v ( = C d e s t ) = 1000 . Furthermore, in the OpenFOAM implementation, the Kunz model is slightly modified so that the condensation term is switched off when the pressure is less than the saturation vapour pressure, as described in the source code.
For the EE solution, the employed solver application, called the multiphaseEulerFoam, is a general-purpose CFD solver for n-phase flow problems featuring heat transfer, chemistry, and mass transfer [18,42]. A selection of interfacial force and transfer models is available, as well as single-phase and multiphase specific turbulence modelling approaches for RANS and LES applications. Continuity and momentum equations are used for each phase, and the phases can be treated as incompressible or compressible. Interfacial transfer models are used for each phase pair. The continuity equation for phase ϕ is
α ϕ ρ ϕ t + · ( α ϕ ρ ϕ U ϕ ) = d m ϕ d t + S fvOpt , ρ , ϕ .
The term d m ϕ / d t depicts the mass transfer in and out of the phase, and S fvOpt , ρ , ϕ is a possible user-defined mass source term. The interfacial phase change mass flux was obtained from the Kunz model described above [18].
The phase momentum equations are
α ϕ ρ ϕ U ϕ t + · ( α ϕ ρ ϕ U ϕ U ϕ ) S ce , ϕ U ϕ + R ϕ + α ϕ p ρ ϕ g = M ϕ ,
where S ce , ϕ denotes a continuity error correction term. The formulation for R ϕ depends on the selected turbulence model. For linear stress models such as laminar and commonly applied eddy viscosity turbulence models, it is
R ϕ = · α ϕ μ ϕ , eff ( U ϕ + U ϕ T ) 2 3 ( · U ϕ ) I ,
where μ ϕ , eff is the effective viscosity, including molecular and turbulent viscosities, for phase ϕ . The turbulence modelling can be chosen for each phase separately, and both liquid and gas phases are currently treated using the same turbulence model, which is described briefly below. The interfacial momentum transfer term M ϕ consists of general drag, lift, virtual mass, turbulent dispersion, and wall lubrication forces. For a two-phase system with phases ϕ = 1 and 2, these are
M 1 = K d ( U 1 U 2 ) M l K v m D U 1 D t D U 1 D t M t d M w l ,
M 2 = K d ( U 2 U 1 ) + M l K v m D U 2 D t D U 1 D t + M t d + M w l .
Here, K d and K v m are momentum transfer coefficients for drag and virtual mass forces, respectively. The terms M l , M t d , and M w l are forces due to lift, turbulent dispersion, and wall lubrication. There are numerous selectable run-time options for modelling each of the forces, applicable for different multiphase flow configurations and flow topologies. For interfacial transfer in the present work, the drag model of Ishii and Zuber [43] is applied. The transfer coefficient for drag is calculated for each phase pair from
K d = 3 4 C d R e d α d ρ c ν c d d 2 C s ,
where the subscript d denotes the dispersed phase and c denotes the continuous phase, R e d = | U c U d | d d / ν c is a Reynolds number, ν c the kinematic viscosity, d d is the diameter, and C s is an optional swarm coefficient, which is set here as C s = 1. The drag coefficient C d is modelled with the Ishii–Zuber model [43], intended for bubbly flows, for spherical and distorted bubbles when the liquid phase is the dominant one. Dispersed phase particles are grouped into a number of size classes having their own representative diameters. They are then placed in different groups that are transported separately; different mechanisms, coalescences, break-ups, mass transfers, density changes, etc., are taken into account for the transfer of the dispersed phase between different size classes. A population balance (method of classes) modelling is used to predict the local mean dispersed phase diameter. The main concept of the class method is that dispersed phase particles are grouped into a number of size classes that each have a representative diameter. The classes can then be placed in different groups that are transported separately. Different mechanisms, coalescences, break-ups, mass transfers, density changes, etc., can transfer the dispersed phases between different size classes. In the population balance method, the size group of fraction f i = V i / α is determined, where V i is the volume concentration of phase i, calculated as
f i t + · f i α U = Sources .
In the above expression, Sources denotes the exchange terms between size groups and consists of bubble break-up, coalescence, and drift due to cavitation phase changes. A description of population balance modelling is given by Lehnigk [44].
The base turbulence modelling used throughout the paper for both homogeneous VOF and EE solutions relies on a hybrid Reynolds-Averaged Navies–Stokes–Large Eddy Simulation (RANS-LES) model based on the k ω Shear Stress Transport (SST) of Menter and Esch [45] with Scale-Adaptive Simulation (SAS) by Egorov and Menter [46]. The SST model is zonal, where the k ω equations are solved (only) inside the boundary layer, whereas the standard k ε model equations by Launder and Spalding [47] are solved away from the walls. Here, k denotes the turbulent kinetic energy, ε is its dissipation, and ω is its specific dissipation. The application of a high-fidelity turbulence modelling approach is crucial in cavitating problems, as some RANS methods have been noted to over-predict eddy viscosity levels, which in turn can smear the dynamic structures of the flow field [48,49]. The SAS approach adjusts the turbulent length scale based on the local flow. It yields RANS solutions for stationary flows, whereas in zones with transient instabilities, it reduces the eddy viscosity according to a von Kármán length scale, which represents the locally resolved vortex size. The length scale is described as a ratio of the first and second derivatives of the velocity, where the former is represented as the invariant strain rate and the latter by the magnitude of the Laplacian of the velocity.
The flow equations in the case of both VOF and EE modelling are discretised with a collocated finite volume method. Equations are solved sequentially using a PIMPLE algorithm that merges the SIMPLE [50] and PISO [51] methods [52]. Three outer iteration loops are employed, with two to three PISO loops for the pressure equation within each outer iteration to ensure proper convergence of the pressure equation. Tolerances for residuals of the iterative solvers are set as 10 9 for all variables, except for the void fraction equations for which the solver tolerances were lowered to 10 12 . All variables are discretised using second-order spatial schemes, with non-orthogonal correction applied for gradient terms. Specifically, the convection terms for the volume fractions are treated using a central difference scheme with a TVD (total variation diminishing) limiter to avoid excessive numerical diffusion and to ensure proper resolution and physical boundedness within the iterative solution. Time-accurate simulations are carried out to resolve the flow field. A first-order implicit scheme is applied for time derivatives, with a time step determined by a maximum Courant number of 1, and in practice, this results in time steps of the order of 10 μs.

2.3. Hydroacoustics

The concept of the acoustic analogy was pioneered by Lighthill in his classical study of the sound generated by a turbulent jet (see Lighthill [53,54]). In those studies, the exact equations of motion, i.e., the conservation of mass and momentum, were recast as an inhomogeneous wave equation computing turbulence-generated sound through a distribution of sources into an ideal fluid at rest. Lighthill’s equation does not take into account the presence of solid surfaces in the field; a more general formulation, applicable to the cases where a stationary solid surface is present in the flow field, was developed by Curle [55], and later generalised by Williams and Hawkings [56] (FWH) for moving and permeable surfaces Di Francescantonio [57] and Brenter [58], demonstrate the advantages of the permeable FWH surface in computational acoustics; meanwhile, the relationship between the permeable FWH equation and Kirchoff methods (Farassat and Myers [59] and Lyrintzis [60]) has been highlighted in Brenter [58].
The available literature shows several applications of the acoustic analogies for URN problems. Among them (just to cite a few), for non-cavitating propellers, Wang et al. [61] suggests a fast volume integration method to determine the Lighthill stres, whereas Testa et al. [62] proposes some general driving criteria in the use of the FWH equation for permeable surfaces. Similarly, Lloyd et al. [63], Sezen et al. [64], and Lidtke et al. [12] present hydroacoustic results for cavitating propellers, whereas recent papers for submarine propellers in the behind condition are documented in Testa and Greco [65] and Ku et al. [66]. In this context, the boundary integral formulations used to solve the governing wave equations yield noise signatures valid only for external propagation problems in a free field. However, for the aim of this paper, the free-space assumption is not physically consistent, in that the acoustic cavity with its own (elastic) boundaries (of general shape) need to be modelled. For this reason, noise results are hereafter carried out by solving the variational formulation of Lighthill’s analogy equations in an FEM context that is naturally able to handle interior acoustic problems in the presence of vibrating structures, bathymetry-dependent fluid properties, porous materials, etc. (if any). After a prior CFD analysis of the flow past the cavitator to detect the sound sources, URN predictions are obtained by the ACTRAN™ solver developed by Free Field Technologies SA [67] based on an FEM solution of Lighthill’s acoustic analogy in the frequency domain. The main aspects of the formulation are briefly summarised. More details on wetted and cavitating propellers in a cavitation tunnel can be found in [17].
We start from Lighthill’s acoustic analogy
2 ρ t 2 c 0 2 2 ρ x i x i = 2 T i j x i x j ,
where c and ρ are the speed of sound and density (subscript 0 refers to the fluid at rest); T i j = ρ u i u j + ( p p 0 ) c 0 2 ( ρ ρ 0 ) 2 δ i j τ i j is the Lighthill stress tensor; and τ i j , u l , and p are the viscous stress tensor, fluid velocity, and pressure, respectively. By assuming an isentropic, high-Reynolds-number, low-Mach-number flow for which T ˜ i j = ρ u i u j , the frequency domain transform of Equation (14) yields
ω 2 c 0 2 ψ + 2 ψ x i x i = 1 i ω 2 T ˜ i j x i x j ,
where the potential ψ is related to the Fourier transform of the density by ρ ˜ = i ω ψ / c 0 2 , where ω is the angular frequency (to prevent confusion, the symbol i denotes here the imaginary unit). Following Free Field Technologies SA [67] and Viitanen et al. [17], the variational formulation for density perturbations (both for stationary and moving geometries) recasts
Ω ω 2 c 2 ψ δ ψ d Ω Ω ψ x i δ ψ x i d Ω = Ω i ω δ ψ x i T ˜ i j x j d Ω Γ δ ψ i ω x i ( c 2 ρ ˜ δ i j + T ˜ i j ) n i d Γ ,
where Ω and Γ are the volume and boundary surface, respectively; δ ψ is a test function; and n i is the normal vector. The spatial FEM discretisation of Equation (16) provides a linear system of equations for the known potential ψ at each frequency of interest. For multiphase flows, the densities and velocities of each phase have to be known: from a mixture model (homogeneous VOF solution), the mixture velocity is first solved and the Lighthill tensor is further defined by the dyadic product T = ρ m U U , with ρ m = ϕ α ϕ ρ ϕ , α ϕ representing the volume fraction, and ρ ϕ representing the density of each phase. In case of nonhomogeneous EE solutions, the velocities of each phase U ϕ are solved individually; in case of two phases, such as liquid l and gas g, the Lighthill tensor reads T = α l ρ l U l U l + α g ρ g U g U g .
Moreover, following Saarinen and Siikonen [68], for incompressible flows, the forcing term of Equation (15), namely · · T , can be directly related to the Q-criterion, which is the second invariant of the velocity gradient tensor U , by the relation · · T = 2 ρ Q , where
2 Q = | Ω | 2 | S | 2
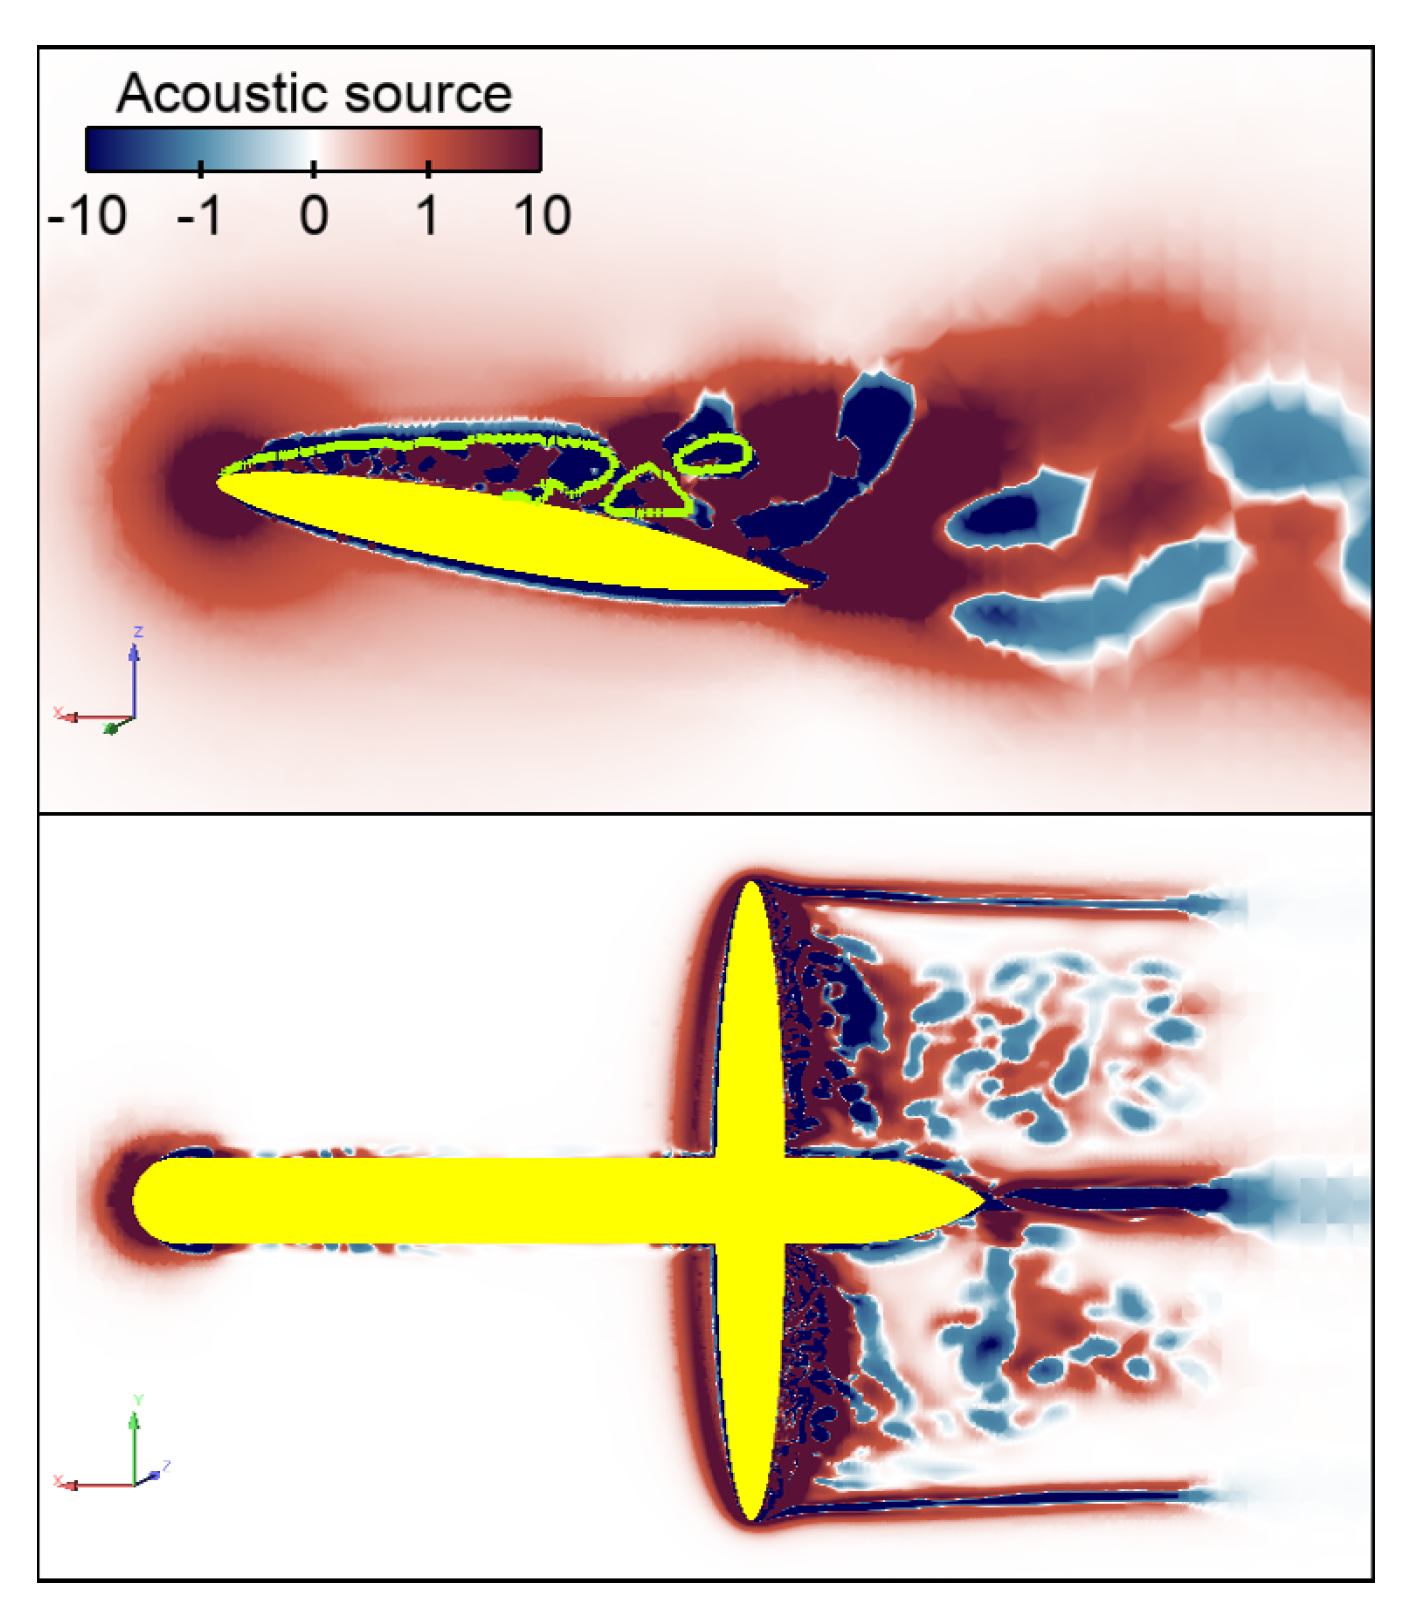
with Ω = ( U U T ) / 2 and S = ( U + U T ) / 2 denoting rotation and strain rate tensors, respectively. Vortical flow structures can be fruitfully investigated using the Q-criterion, and by definition, vortex regions are found as those where Q > 0 ; that is, vorticity dominates over strain rate. Notice that positive Q values result in a local pressure drop, which can also signify regions prone to evaporation given sufficiently low pressure magnitudes at these locations. Typically, a non-dimensional acoustic source term is used, S = 2 ρ / ρ Q , where Q = Q d 2 / U 2 , with d denoting the chord length of the hydrofoils. When a homogeneous VOF solution yields the mixture velocity, the Q-criterion of the mixture can be directly carried out. Similarly, if the inhomogeneous EE solution is used, velocities of both phases are known, and in turn, the Q-criterion of each one provides information on the acoustic source terms related to the liquid Q ( U l ) and gas Q ( U g ) . This is illustrated in Figure 1, where the acoustic source is given as non-dimensional for each phase. In the phase interface, the liquid contribution follows from the generation of vorticity, whereas the gas part is more complicated and has mixed flow features. Another approximation with the EE solution is to evaluate the Q-criterion using the volumetric mixture velocity, U m = α l U l + α g U g , which can then be used to illustrate the acoustic source distribution, as shown in Figure 2.
Visualisation of the acoustic source term reveals regions of the flow field prone to sound generation. Regions of greater magnitudes of S will produce a greater acoustic output. As an example, the source terms shown in Figure 1 and Figure 2 reveal the vorticity and vortex cavitation as notable contributors to the sound source, and the complex flow field in the wake of the wings is mainly due to cavity shedding, in addition to the leading edges of the cavitator and the foils and to the unsteady sources generated near the hemispherical head that convect at a distance downstream, near the boundary layer of the cavitator. It may serve as a tool to compare noisy and quiet geometries, as demonstrated, for instance, by Saarinen and Mustakallio [69]. Using S as a proxy of the actual radiated sound power with, e.g., localised probes and corresponding Fourier spectra, however, is not sensible, as its distributions vary rapidly in time and space. Instead, a subsequent CHA analysis is needed to predict the actual sound levels and directivities.

3. Numerical Results

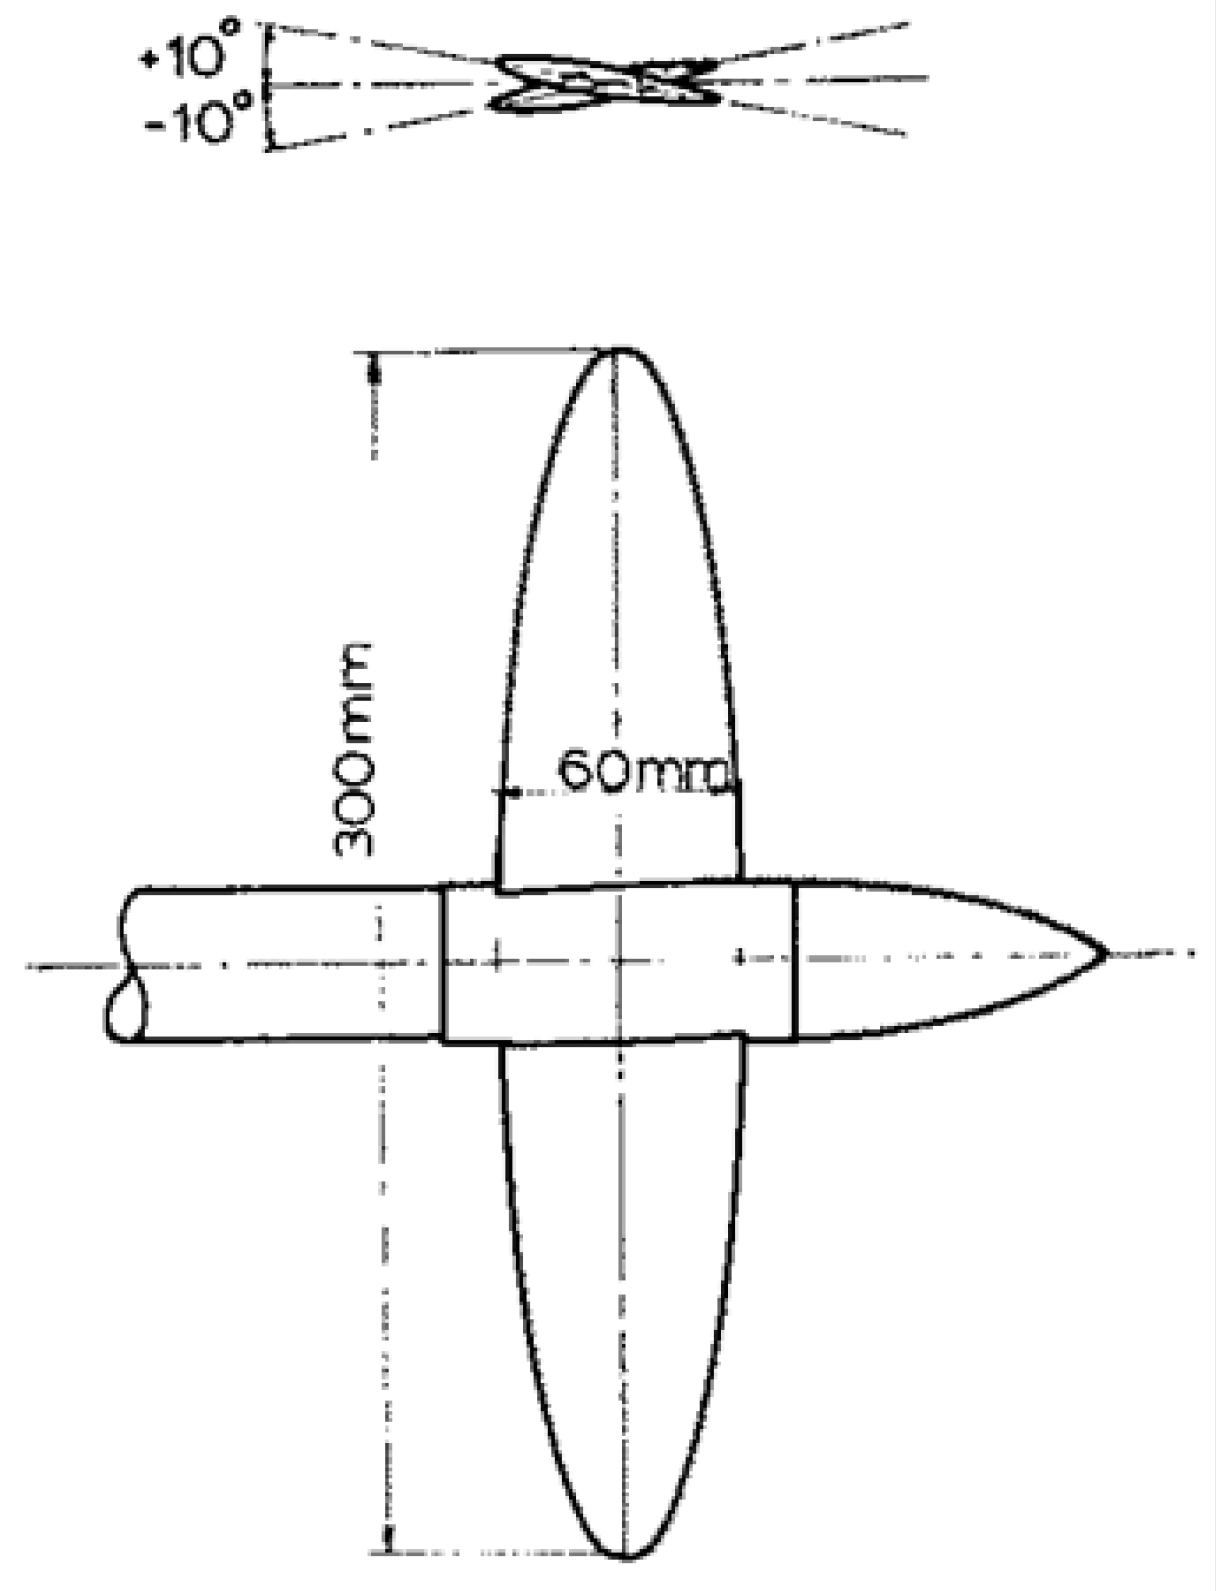
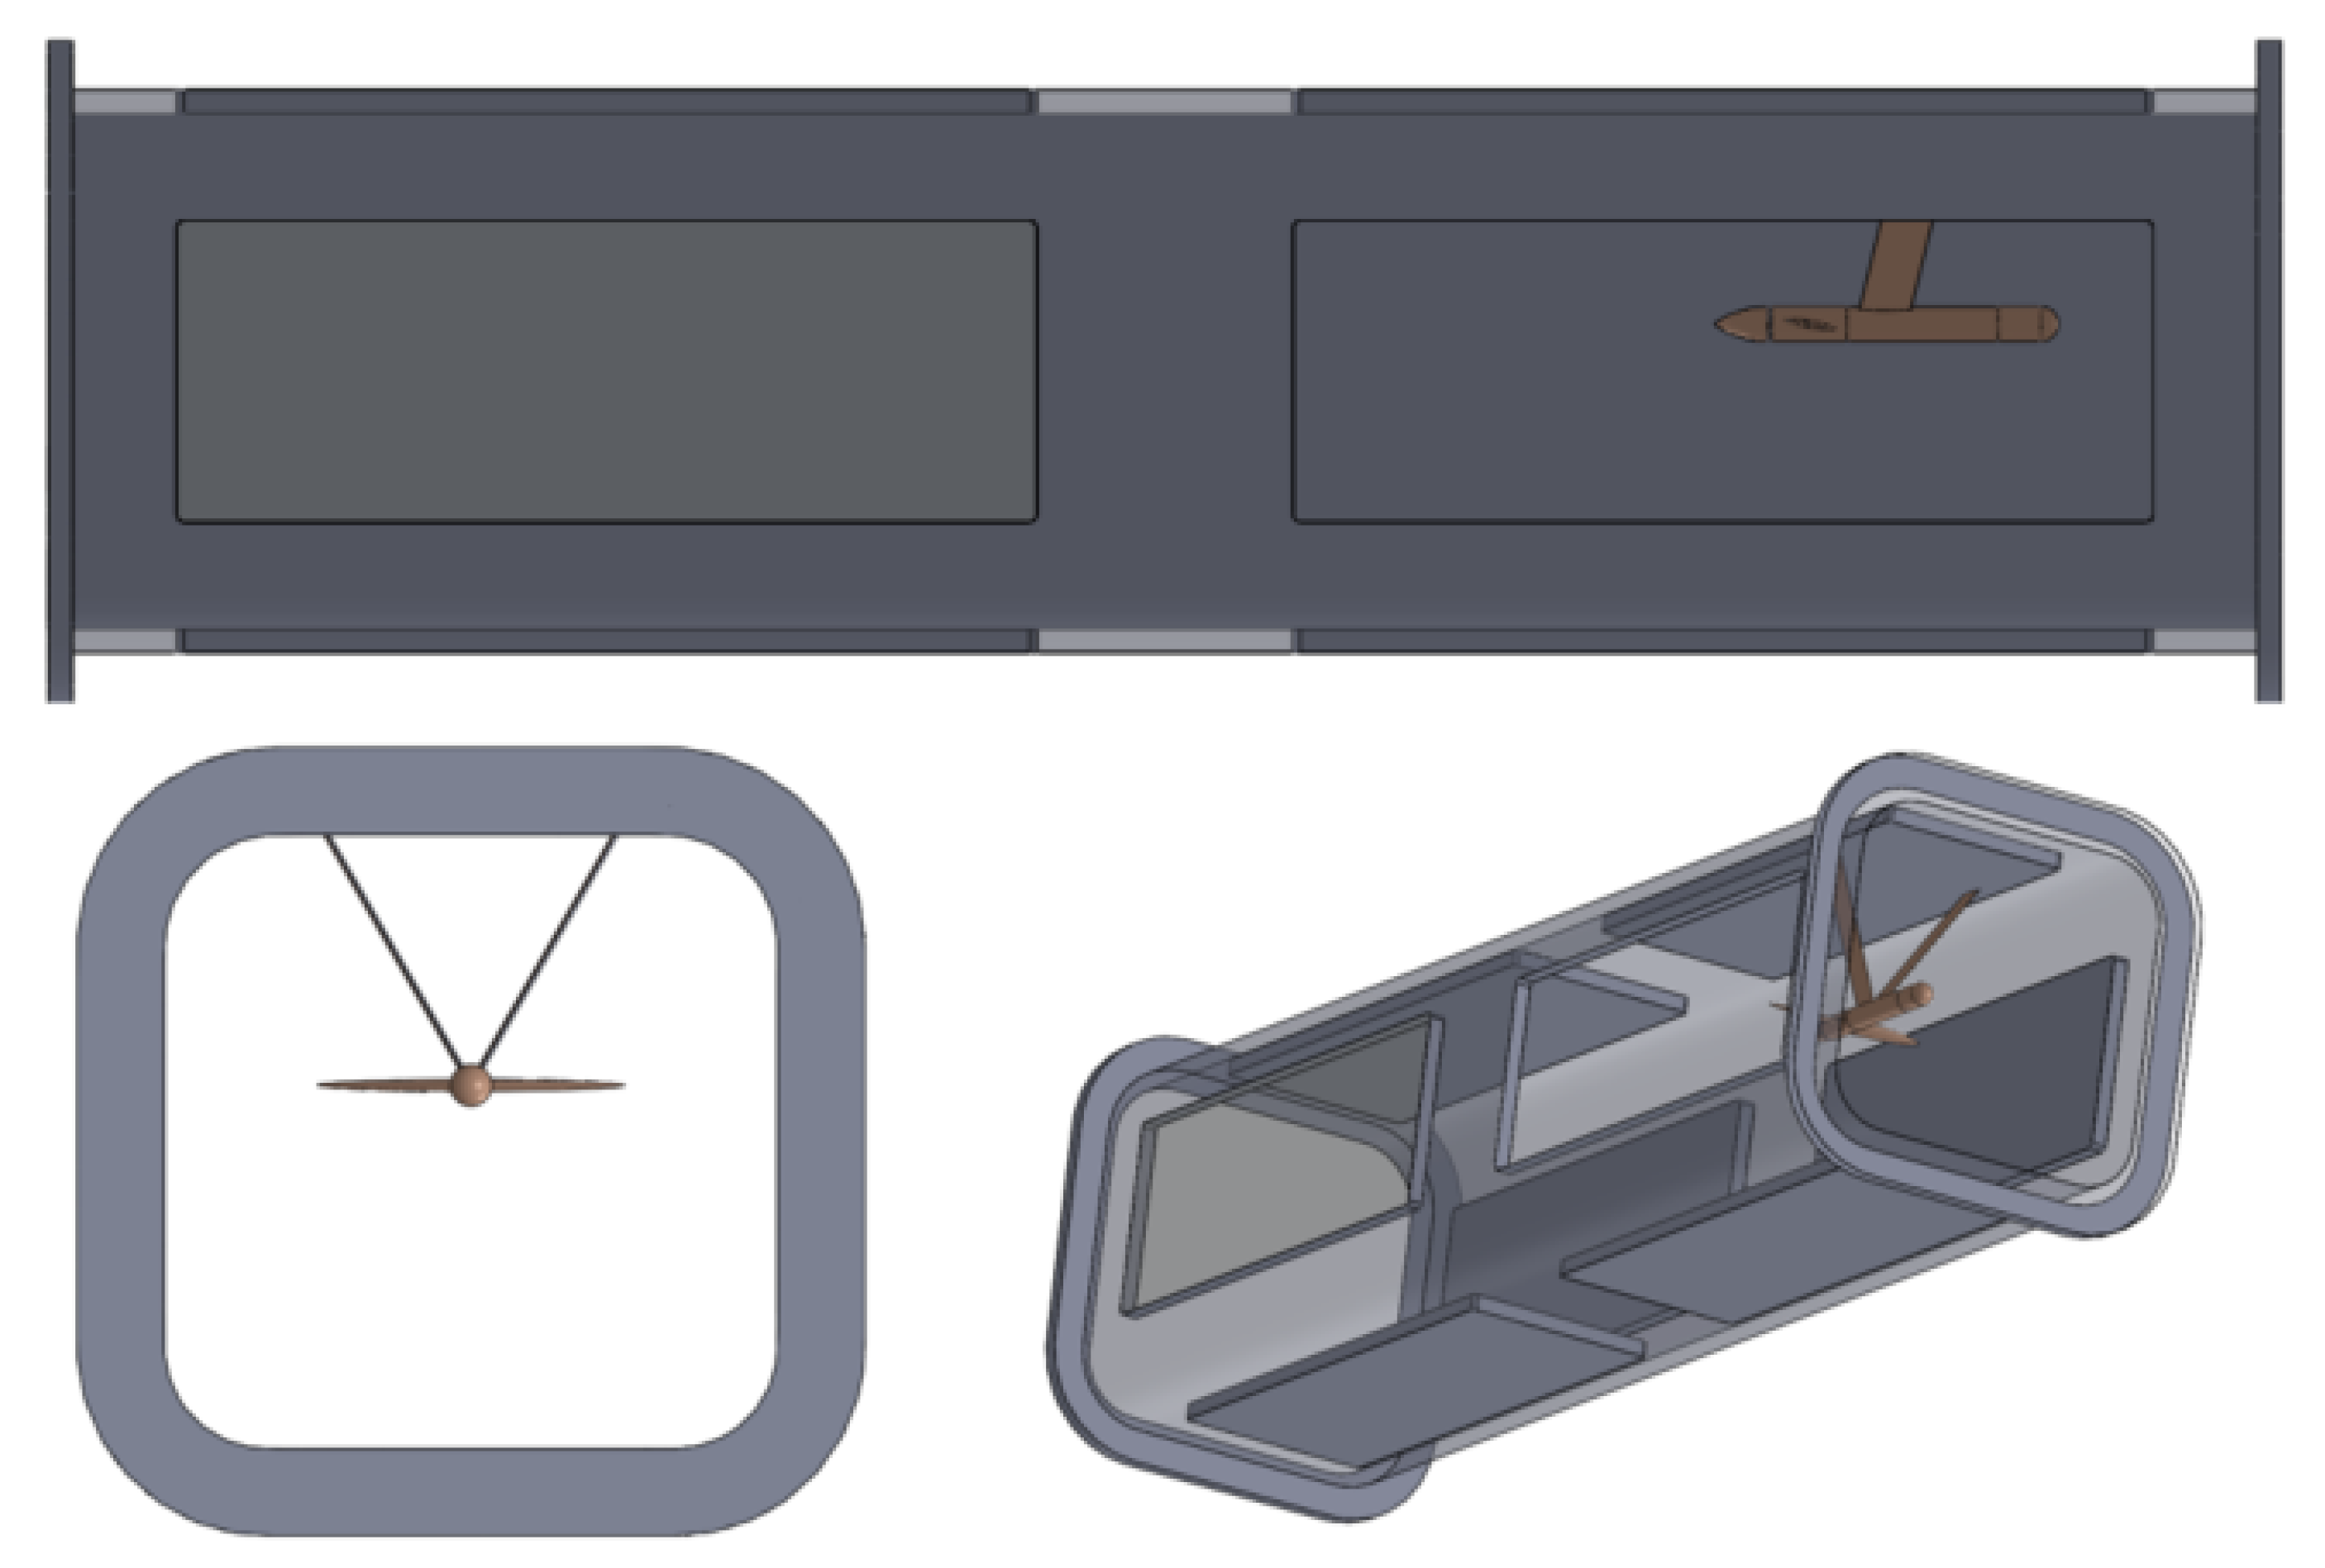
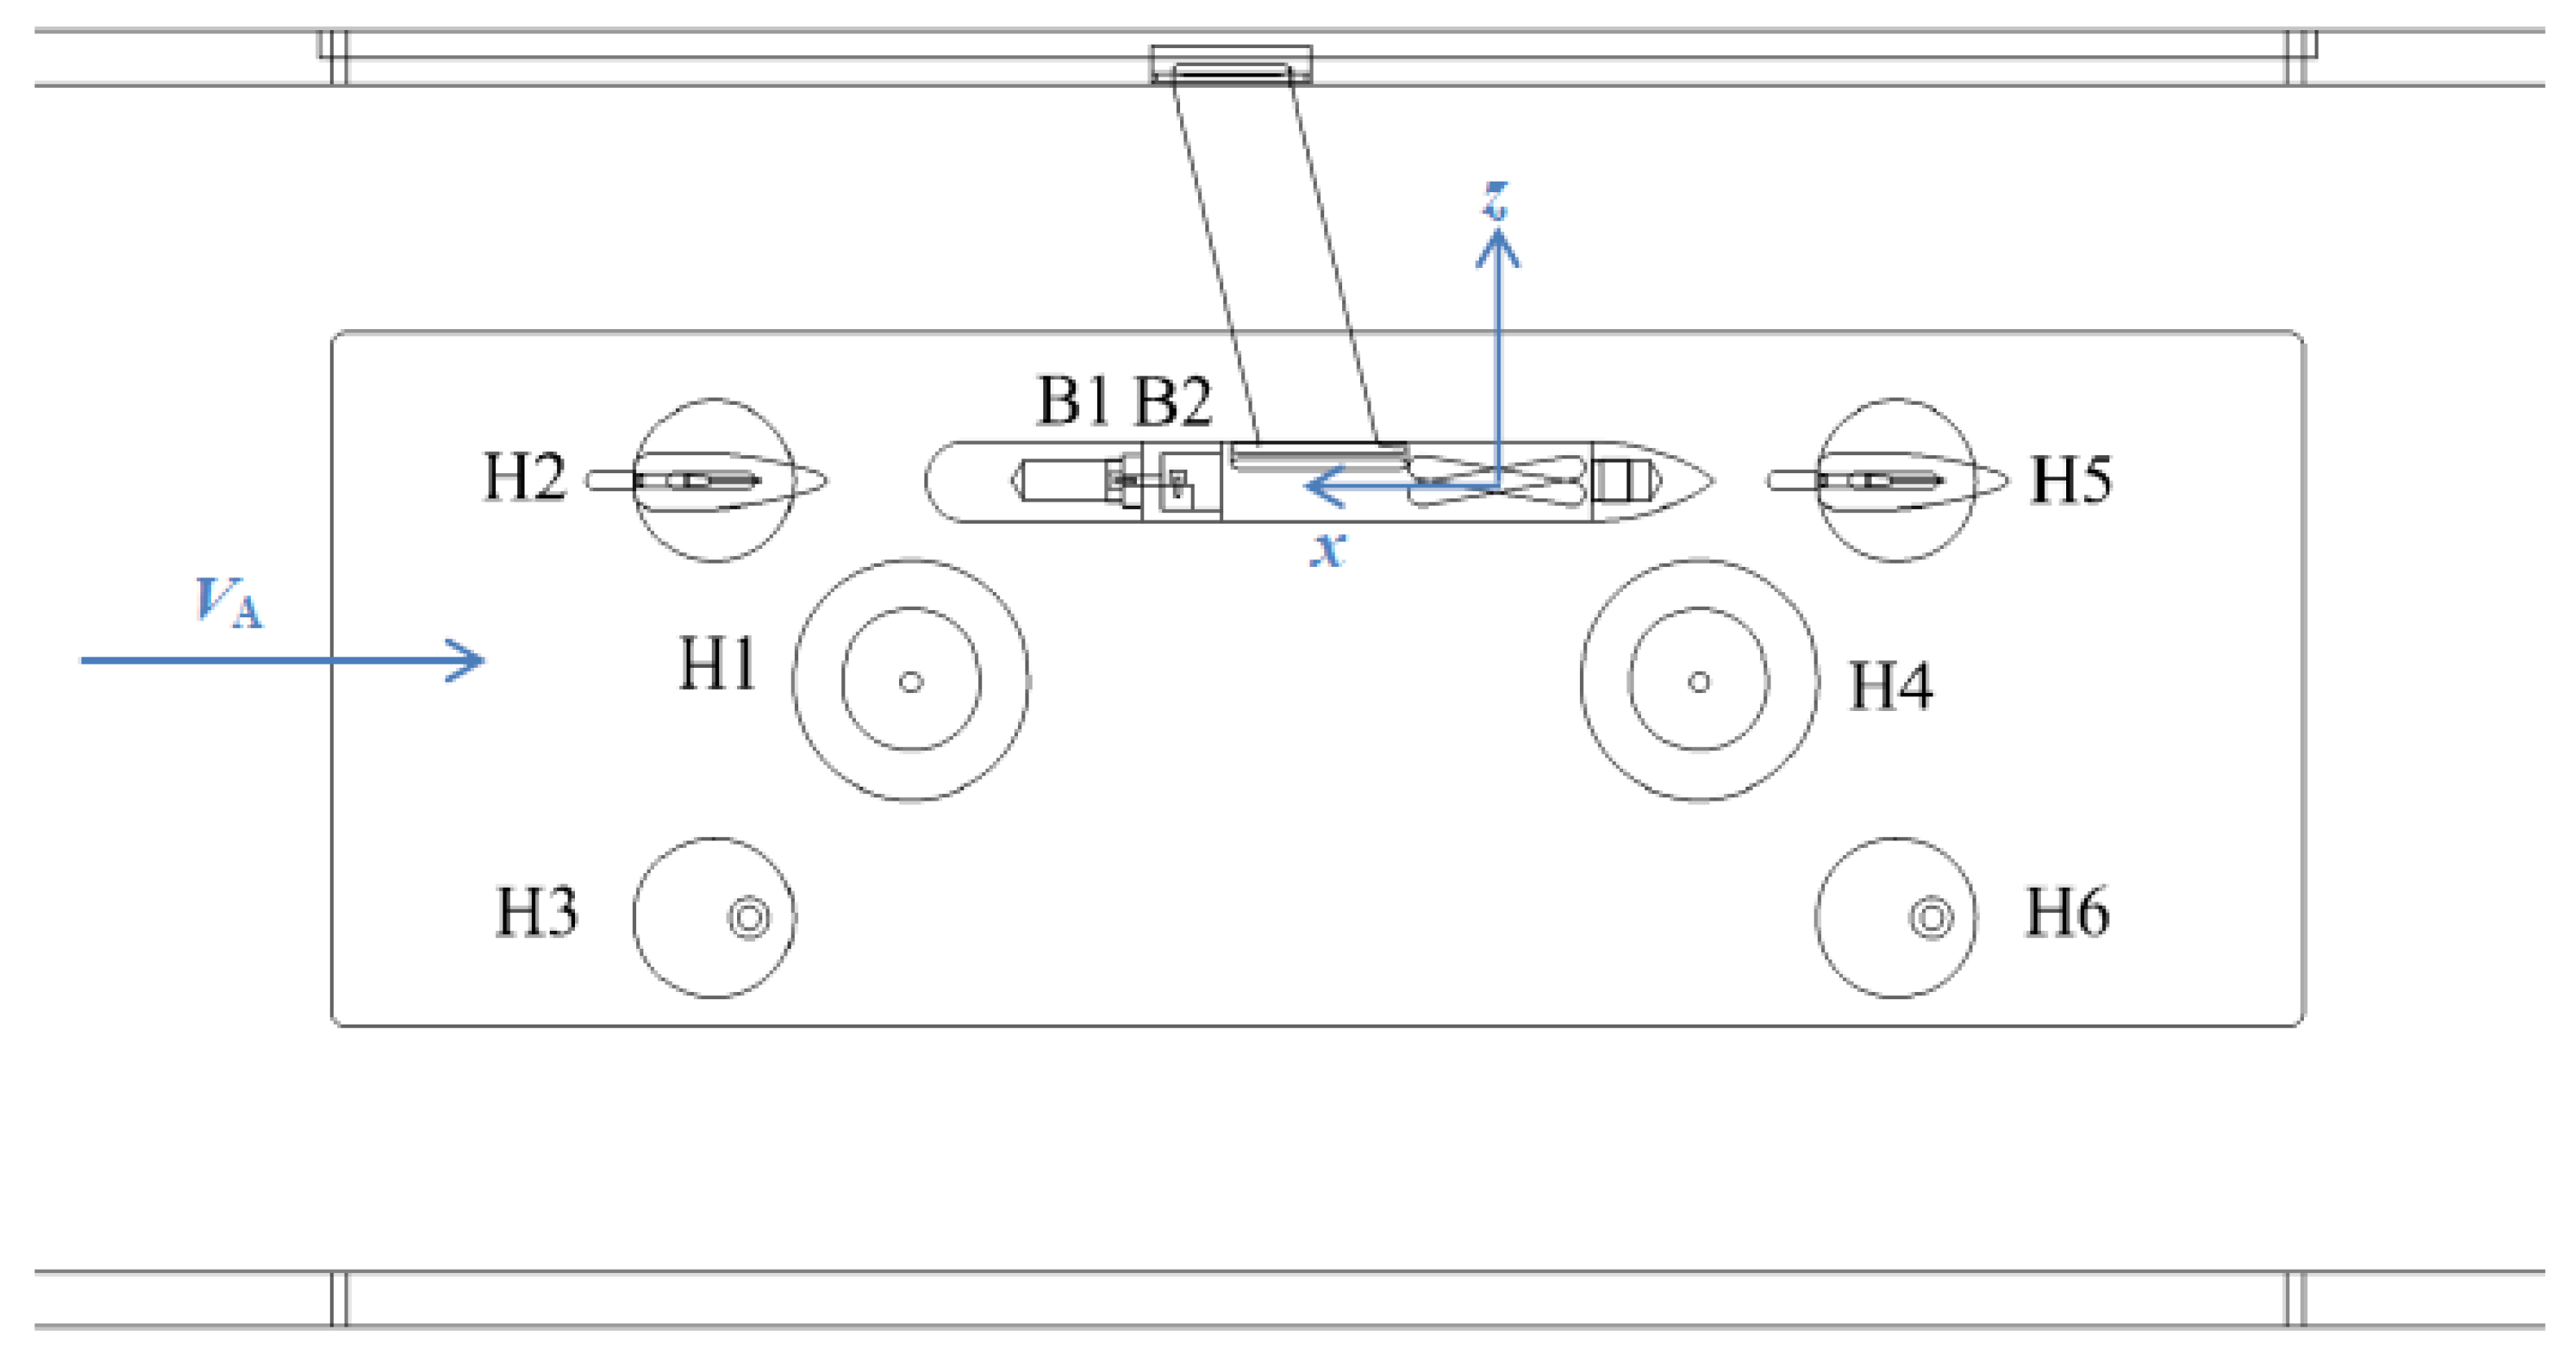
In this section, the hydrodynamic/hydroacoustic behaviour of the ITTC standard cavitator, operating inside a cavitation tunnel and in free-space, is investigated for an inflow velocity of U = 8 m/s and a cavitation number σ = 2 ( p p sat ) / ρ 0 U 2 of 0.53 ( p sat denotes the vapour pressure). The cavitator consists of a body with two elliptic planform wings attached to it (see Figure 3), the main geometrical features of which are listed in Table 1. The tunnel is modelled as an elastic cavity of rectangular cross-section of 600 mm × 600 mm; for clarity, a sketch of the cavitator, attached to the ceiling of the cavitation tunnel by two supports, is shown in Figure 4. A detailed study on the cavitator’s cavitation dynamics is shown in Ref. [49]; the reader is referred to this paper for further details. For hydroacoustic purposes, a set of six hydrophones, depicted in Figure 5, is used. Three hydrophones are placed upstream (one in the acoustic chamber, one aligned parallel to the flow, and one aligned longitudinal to the flow), whilst the other three are located downstream, in a similar arrangement. The coordinate system is located in the middle of the cavitator (see Figure 5). Their coordinates are listed in Table 2.
The results of the experiments, carried out at the SVA Potsdam test facility in terms of cavitation observation and noise measurements, are hereafter used for comparison. In the following, the procedure for the noise measurements in the cavitation tunnel is shortly described. The signals from the (piston phone calibrated) hydrophones are recorded with STUDIO software with a sampling frequency of 100 kHz. Then, Fast Fourier Transform (FFT) is used with the von Hann window to achieve the frequency spectra. Signals in which the noise is dominated by the background noise ( L p , b ) are eliminated using 3 dB as the threshold, Δ L p = L p L p , b < 3 dB. An estimate of the free-field SPL is derived from the experiments by using a cavitation-tunnel-specific transfer function determined as proposed by International Towing Tank Conference [8]. Finally, the results are normalised to the distance of 1 m assuming a spherical (or cylindrical) spreading.
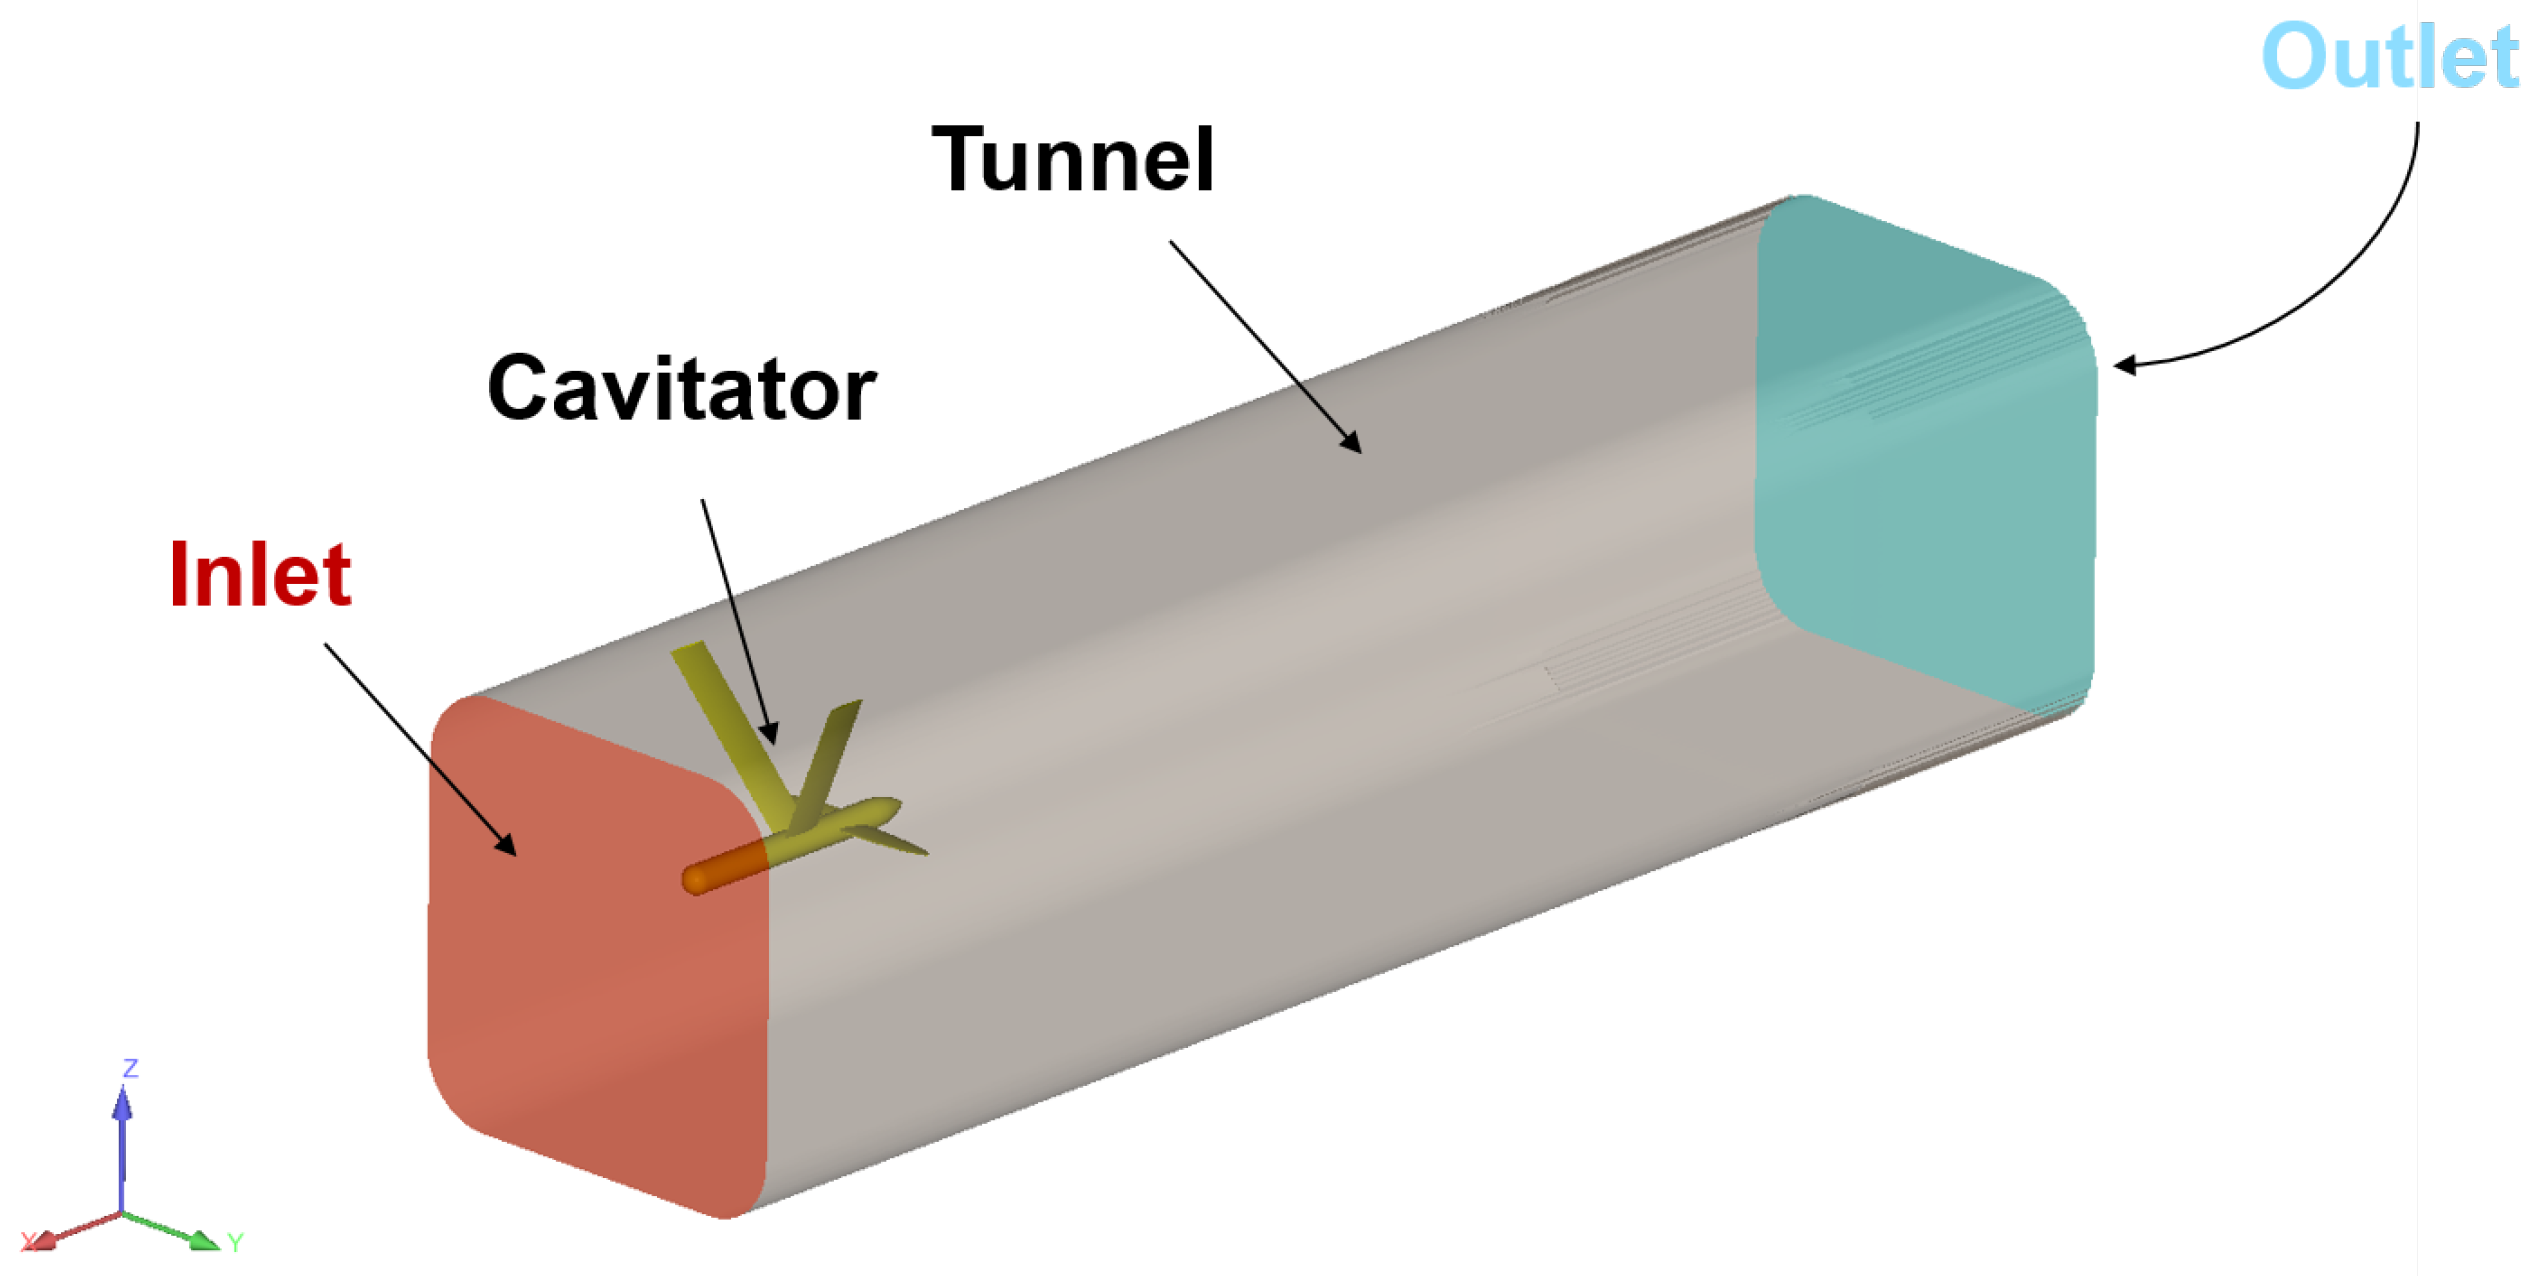
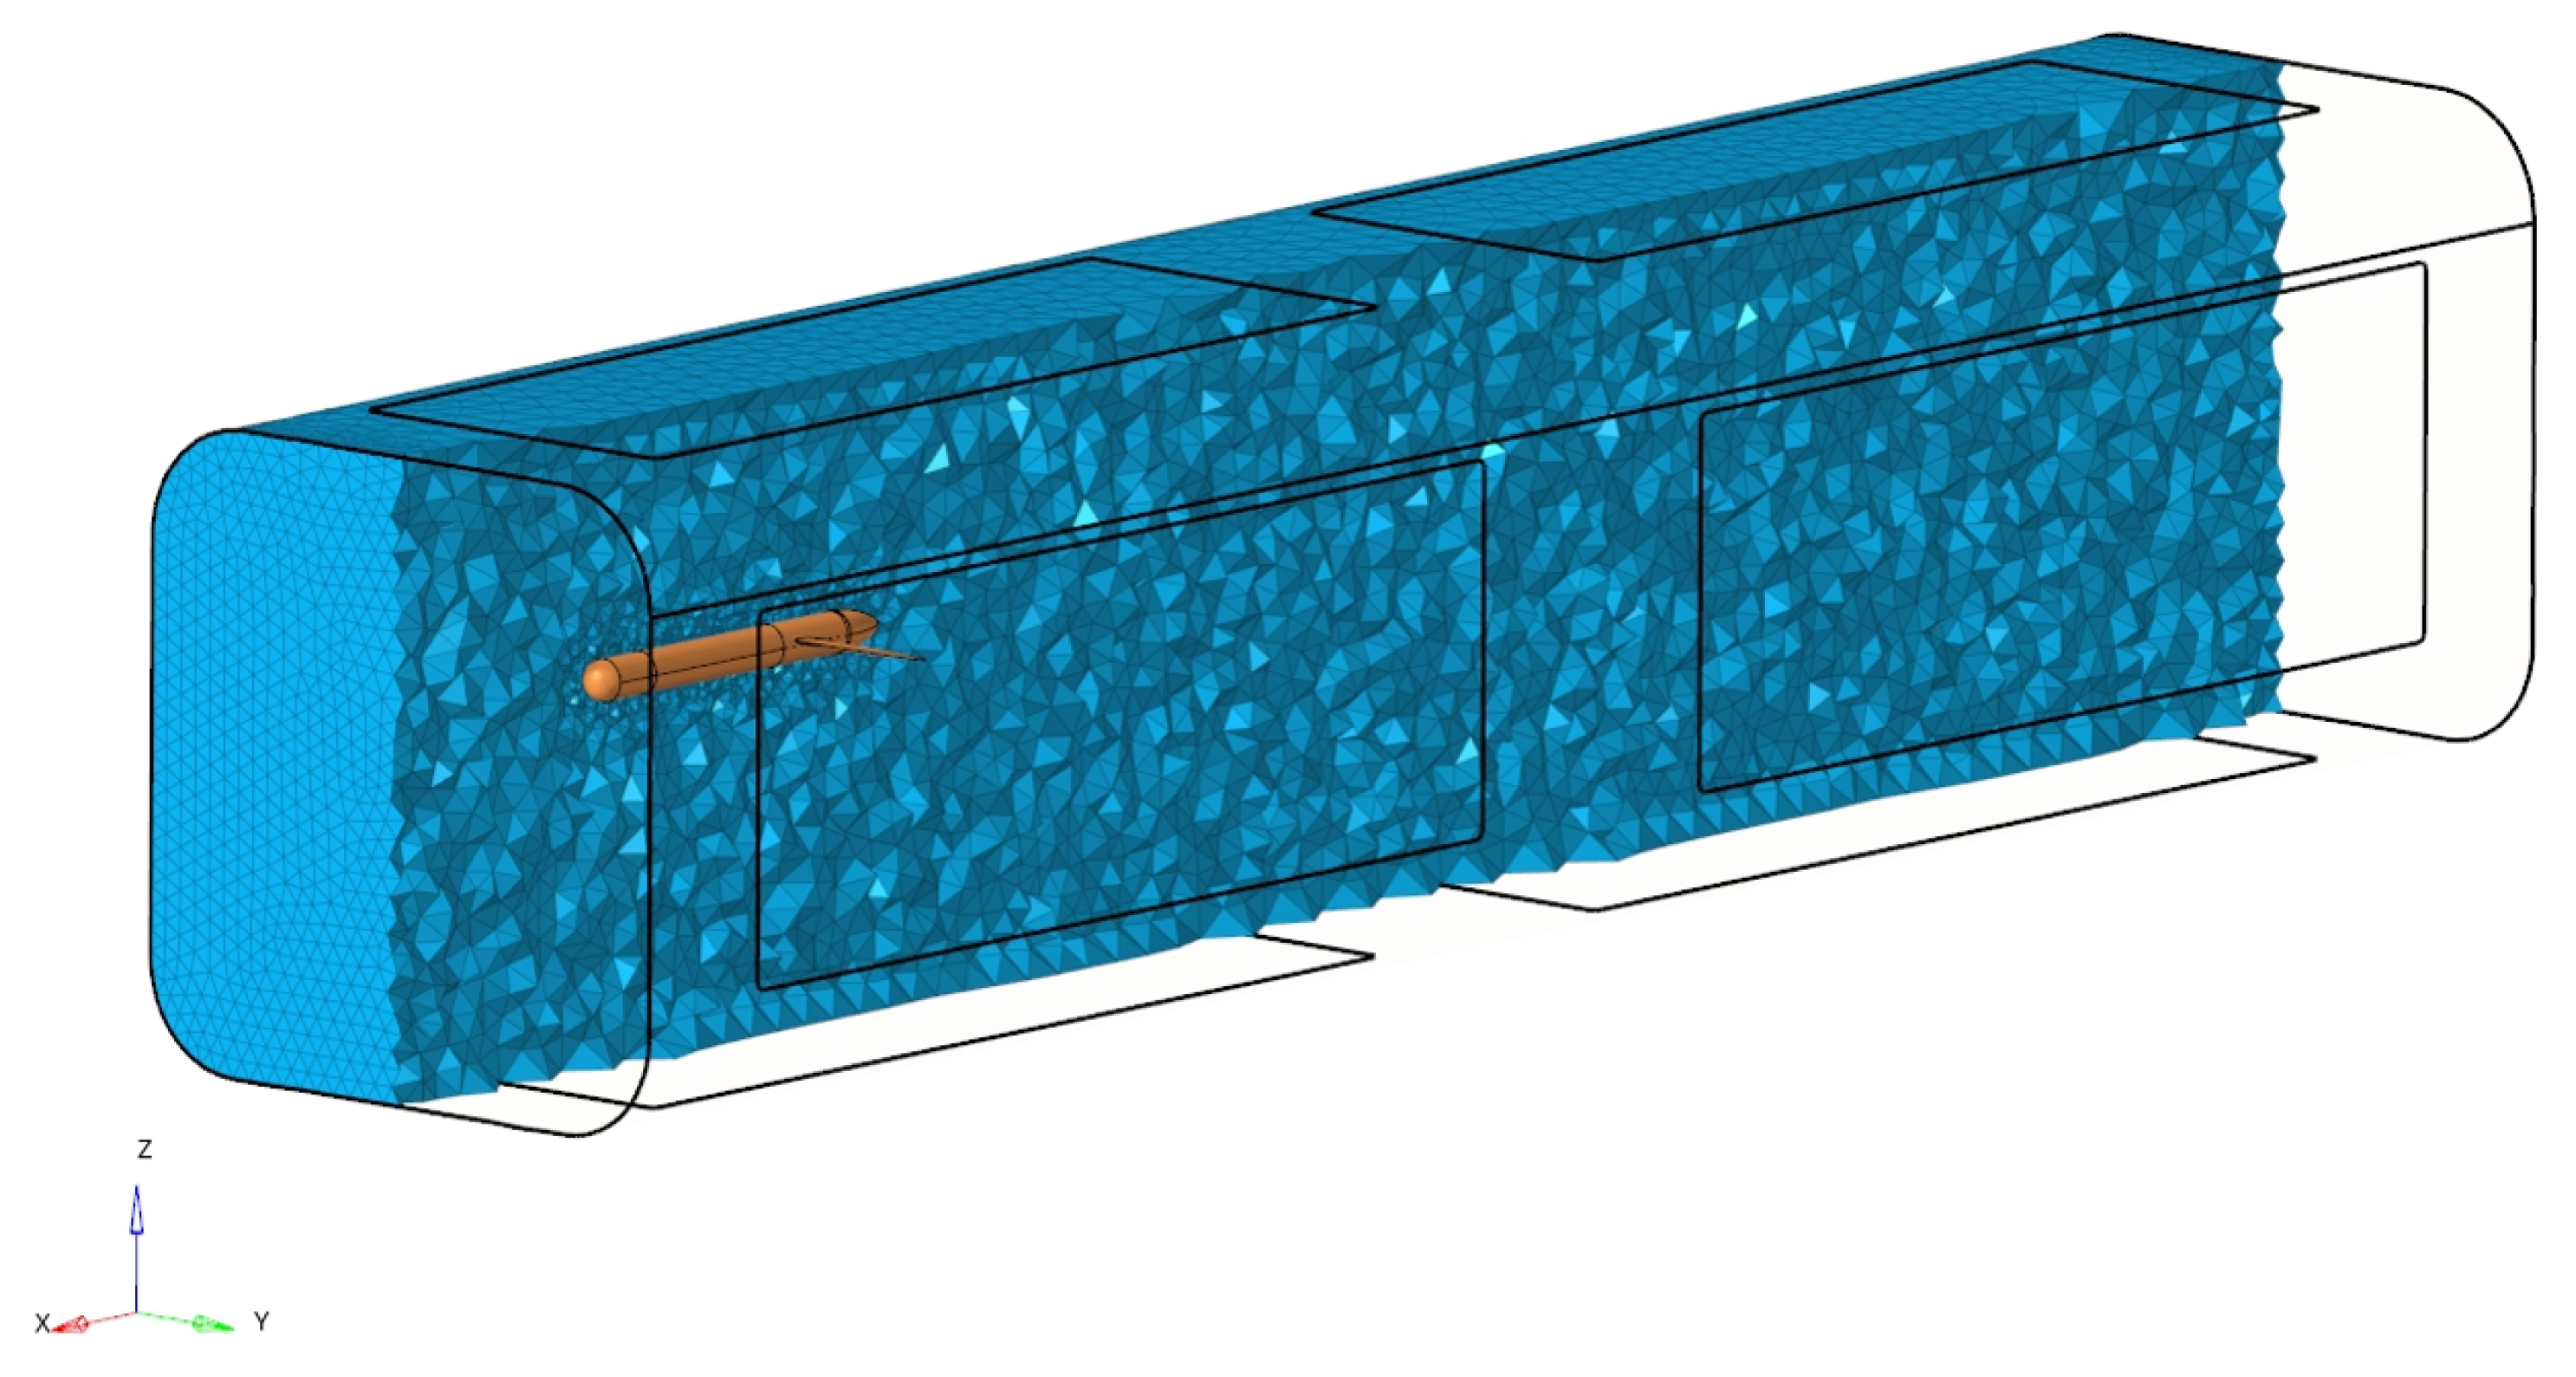
A sketch of the CFD domain used in this investigation is shown in Figure 6 and Figure 7. The grid consists of roughly 5.1 M cells, characterised by a clustering nearby the hub and wing tips to accurately detect the hub vortex and wing tip vortices. A grid refinement normalised to the surfaces is adapted ( y + 30) to model the turbulence of wall function applications.
Before showing hydrodynamic and hydroacoustic results, the tunnel’s vibroacoustic effects and the effect of the tunnel environment on the experimental results are investigated in the following subsections.

3.1. Vibroacoustic Effects

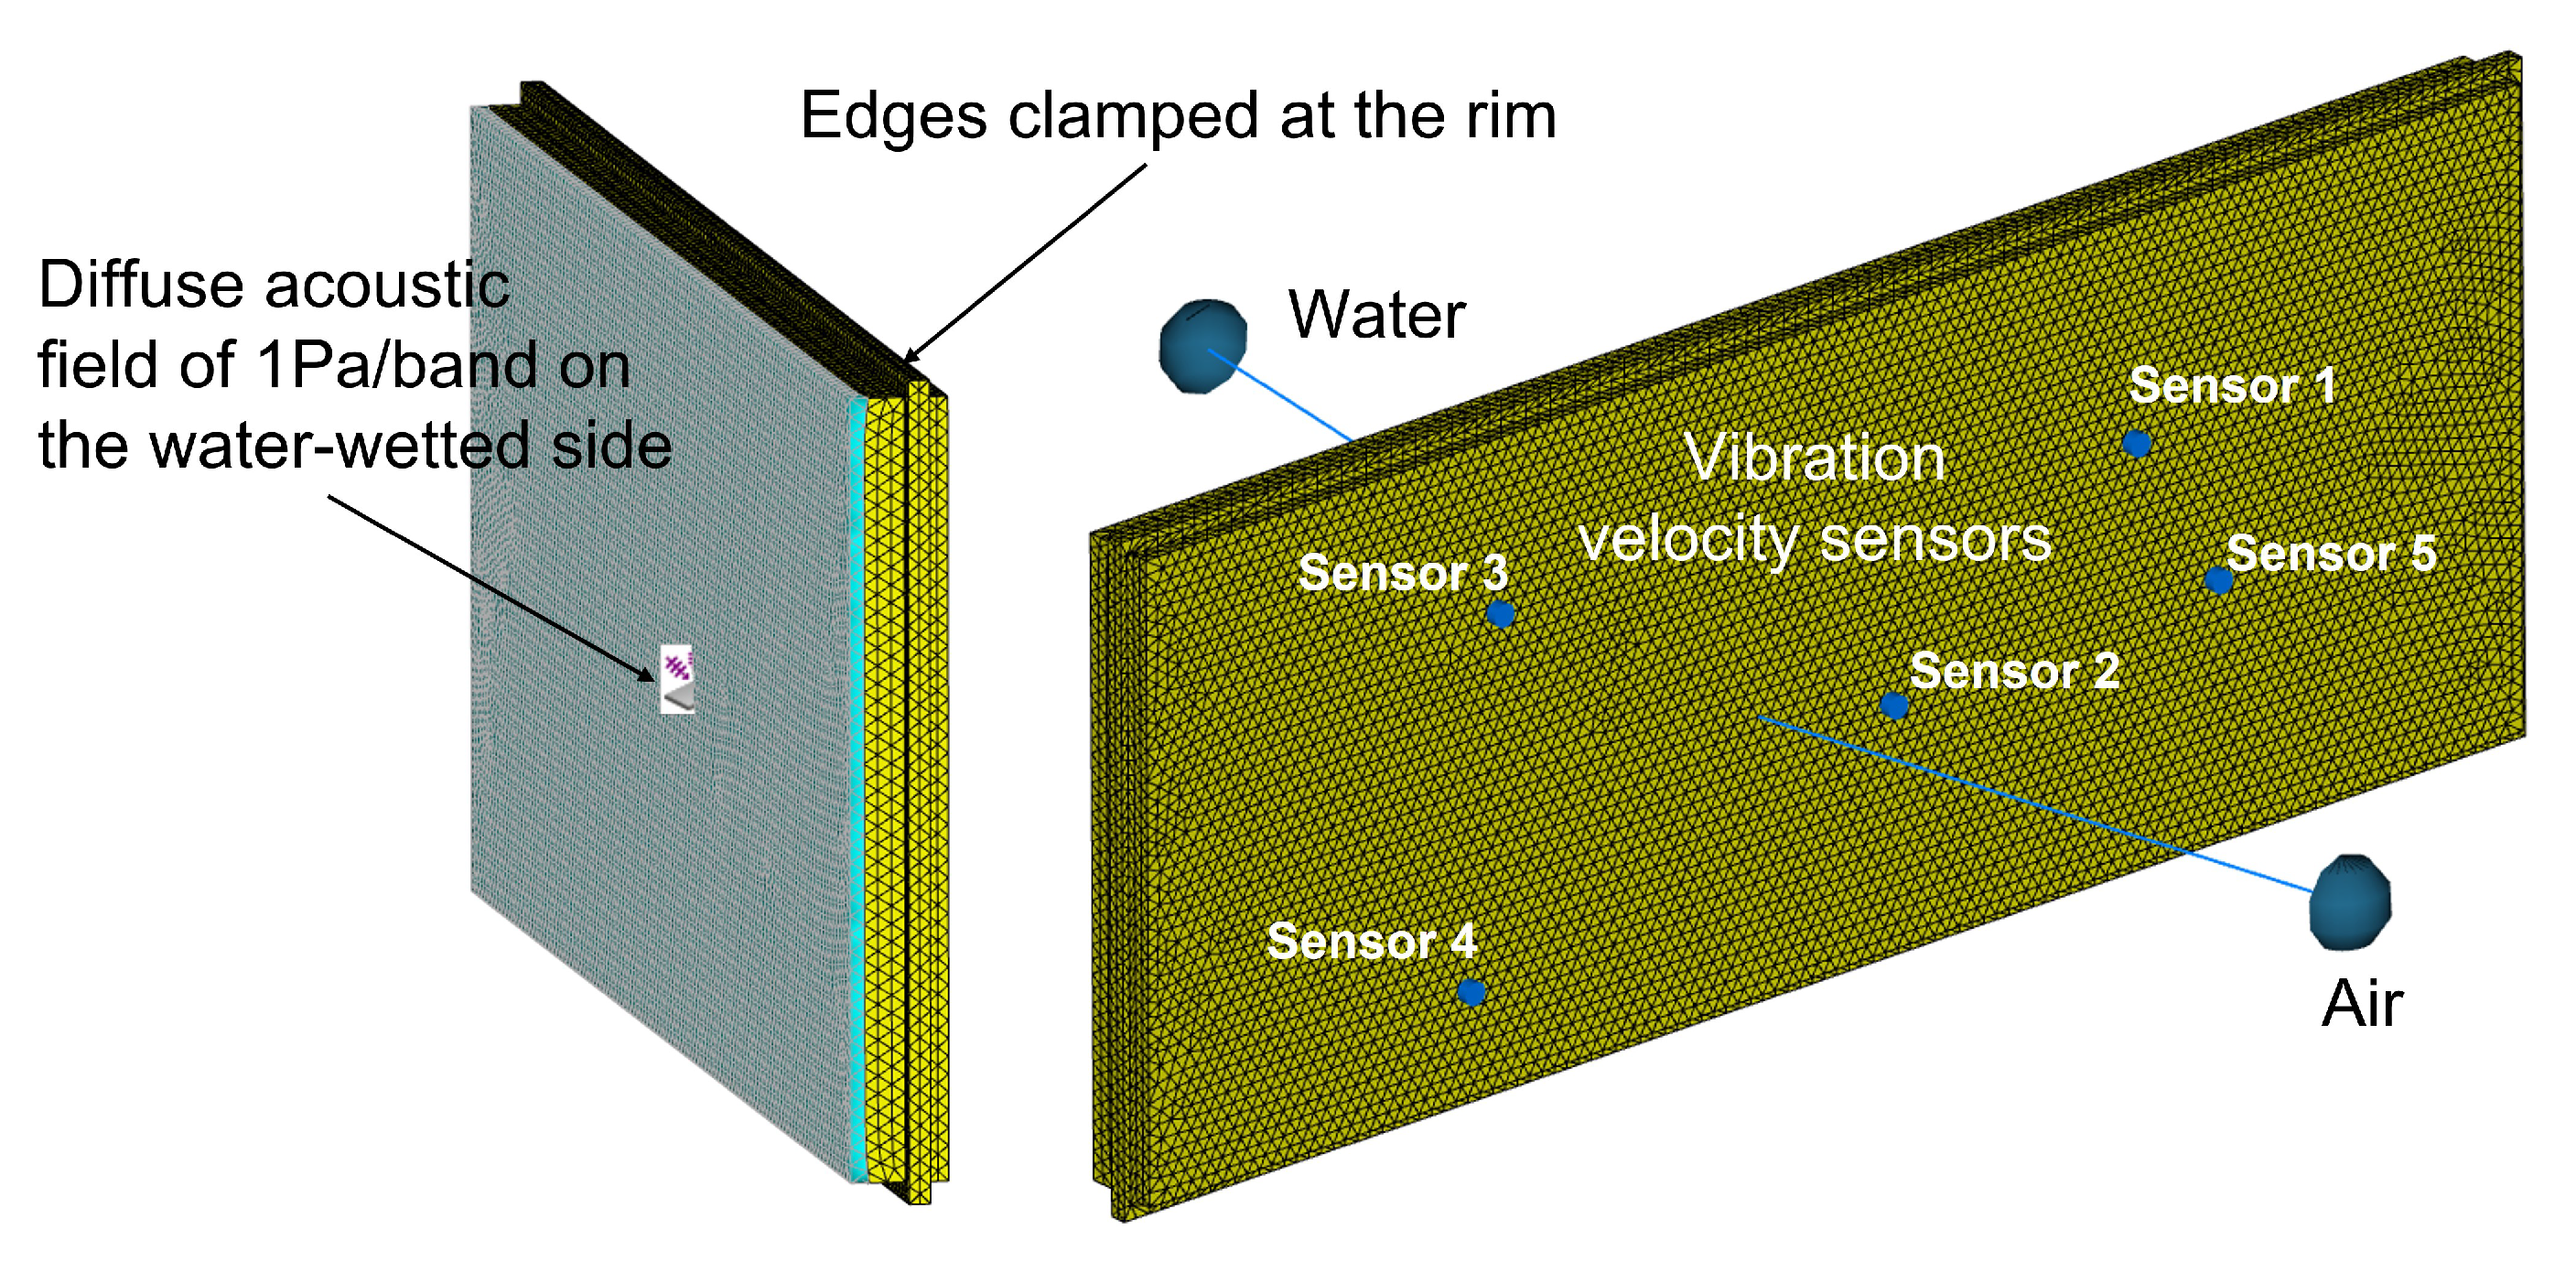
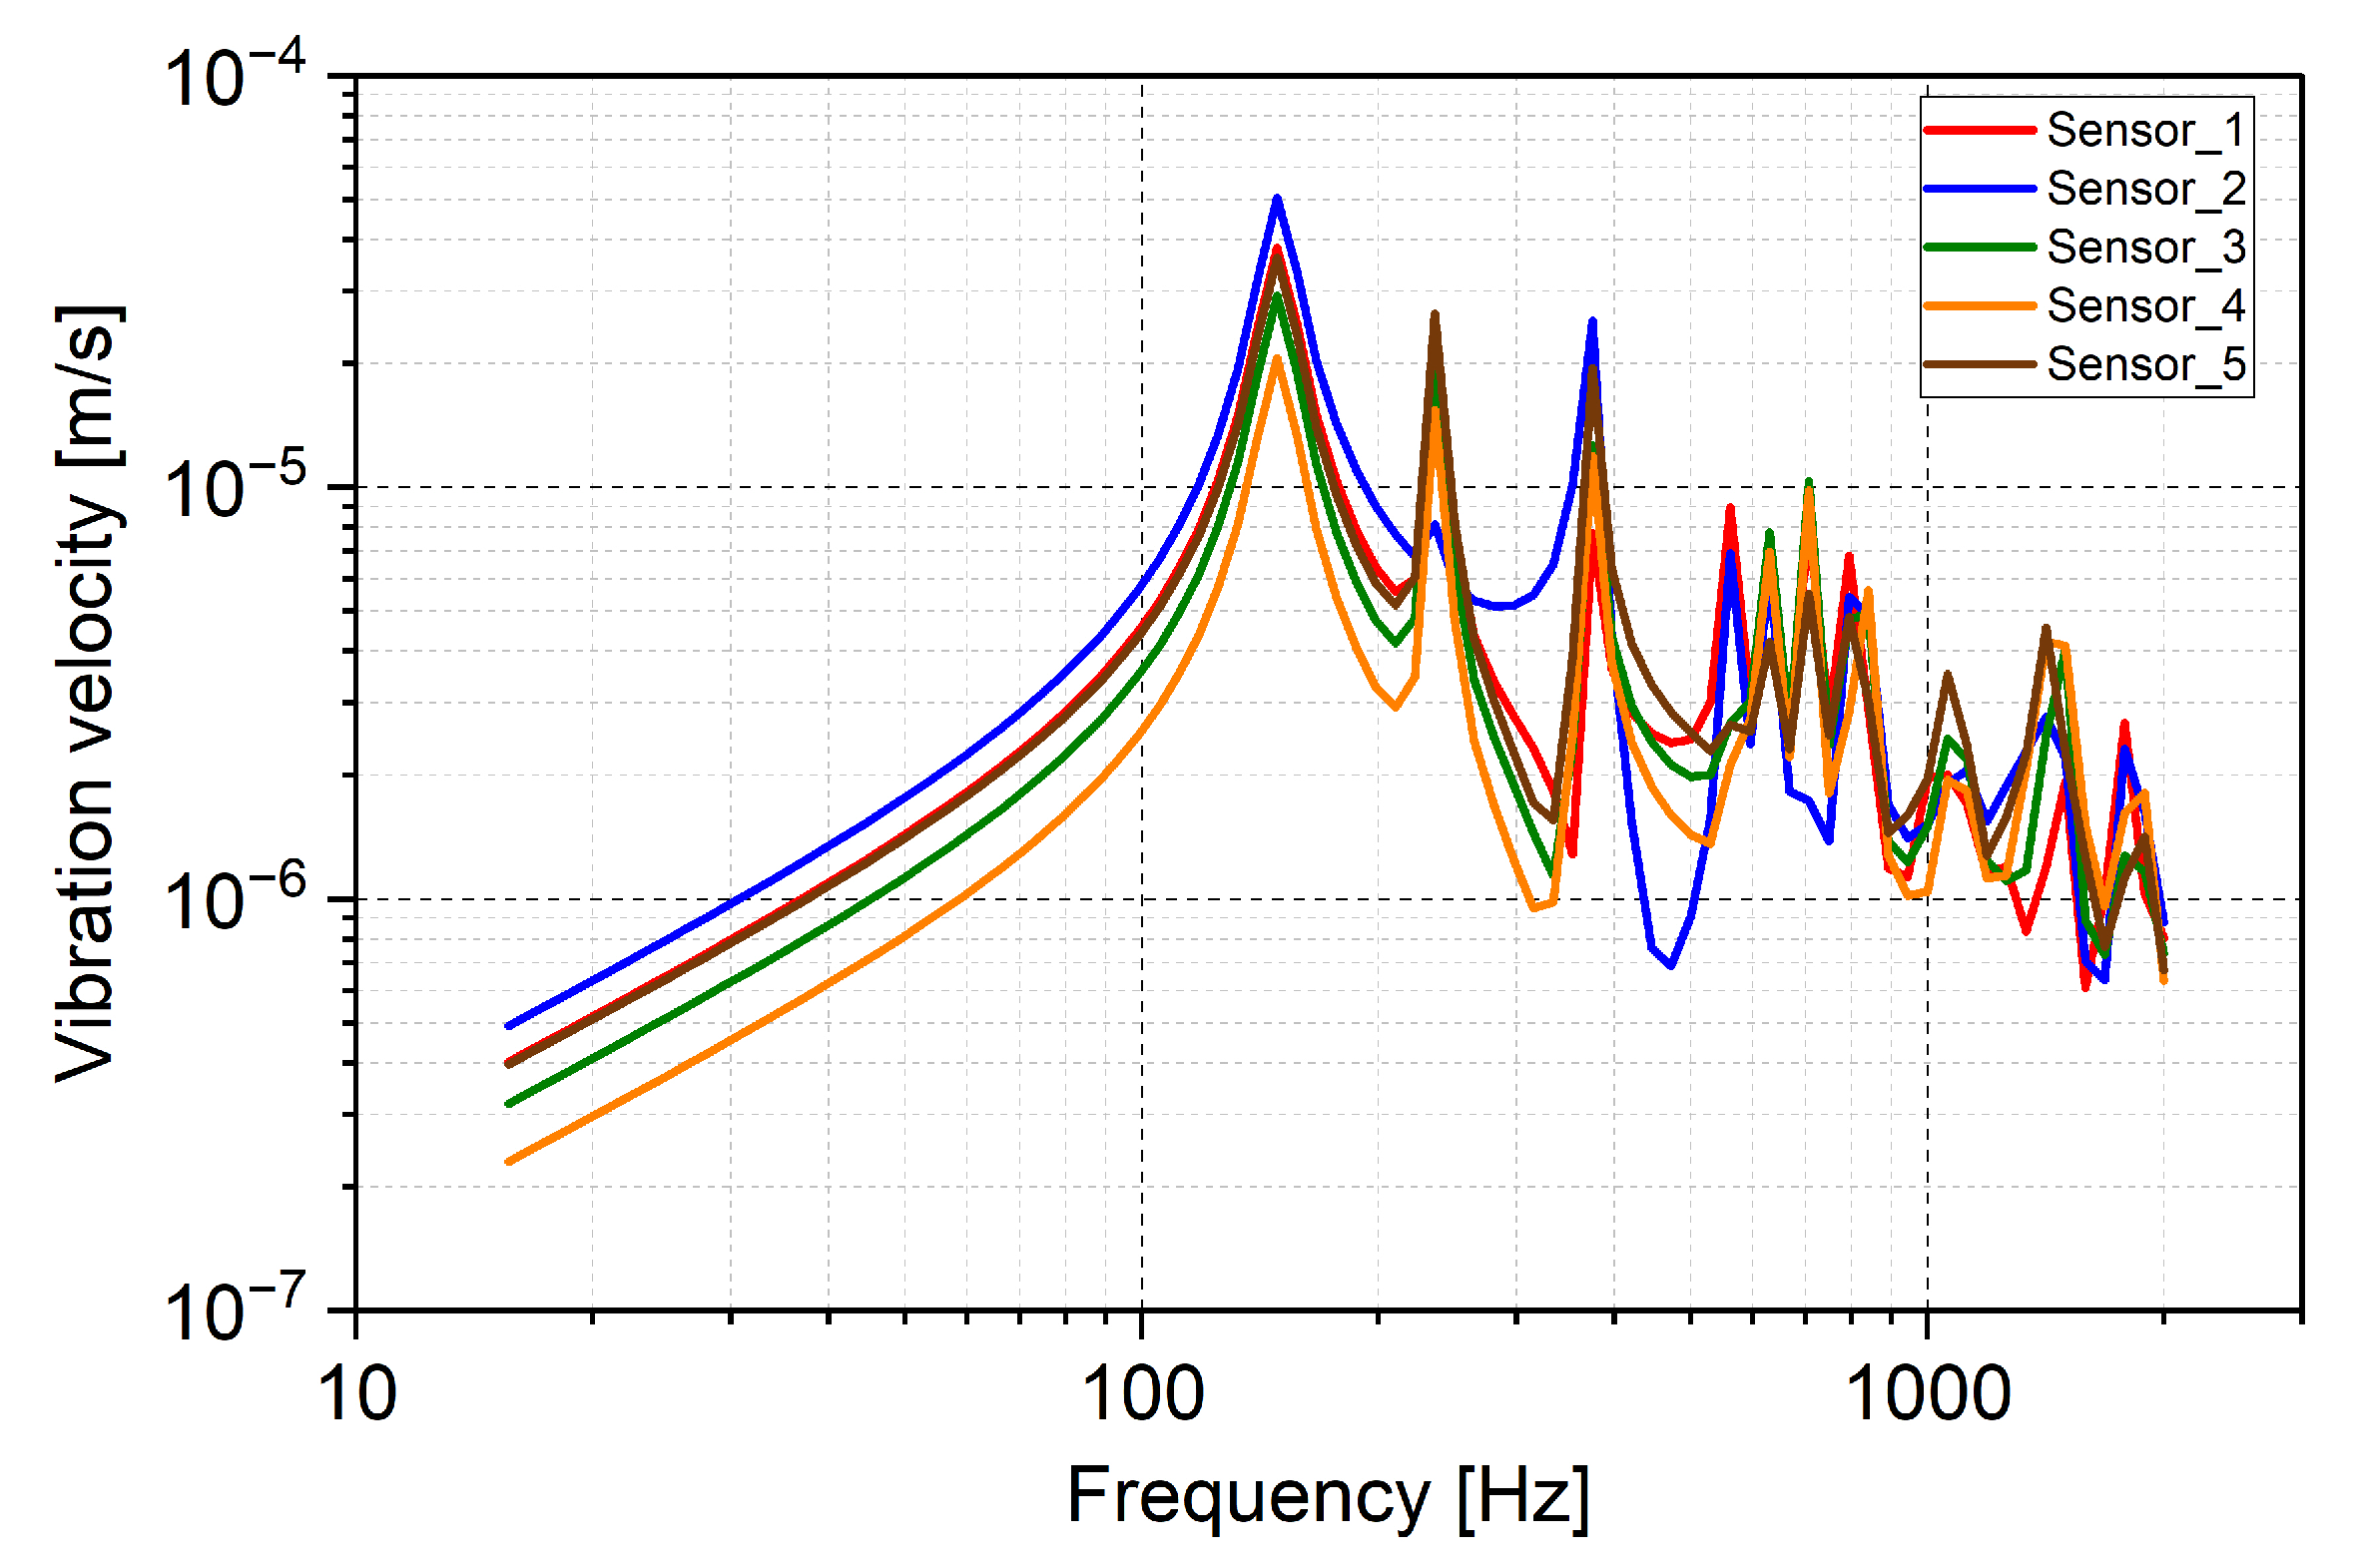
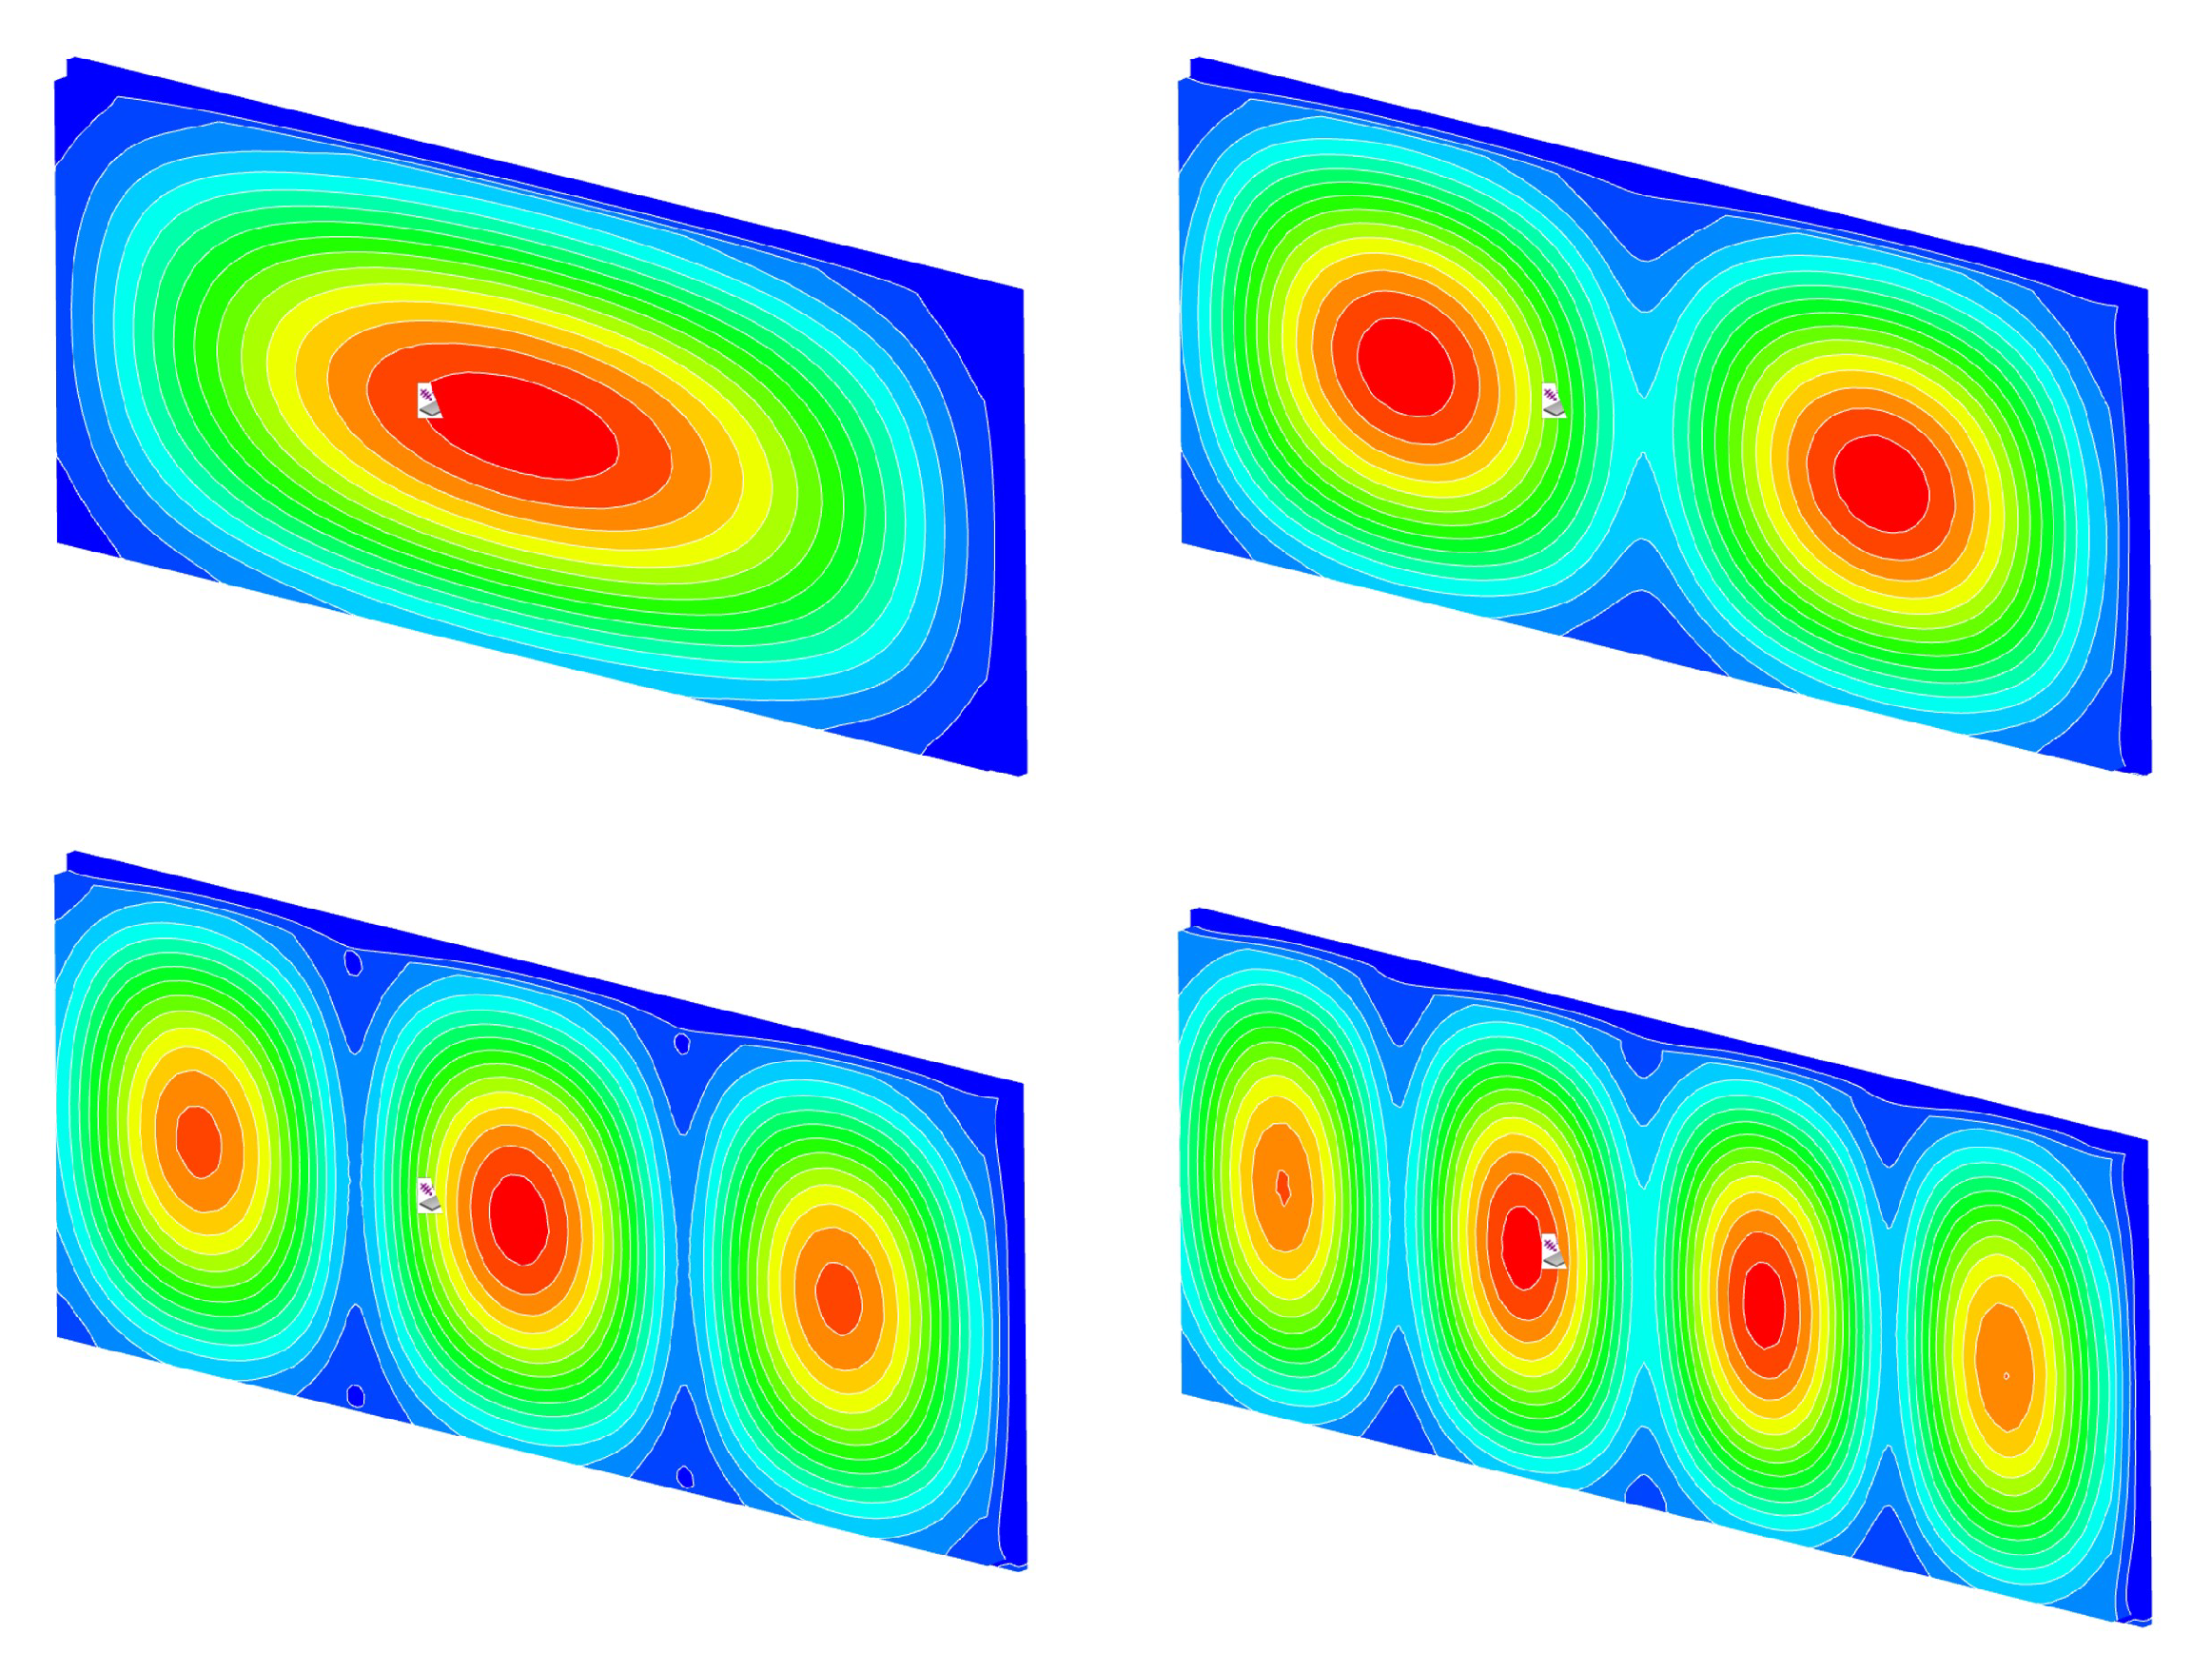
Vibroacoustic effects on noise measurements are investigated using an FEM analysis of a typical window used in cavitation tunnels, a sketch of which is shown in Figure 4. The window is modelled as a 1030 mm × 410 mm × 50 mm structure of acrylic plastic material (Young modulus E = 4 GPa, density ρ = 1400 kg/m3), clamped from the rim (see Figure 8). The structural model of the window has approx. 126,000 elements and 29,000 nodes. The structural elements used are four-node, linear, solid tetra elements of the type Nastran CTETRA. The nominal element size is 10 mm, and there are eight elements in the thickness direction of the window. The structural modes were solved using the NX Nastran up to 3000 Hz. There are 38 structural modes with in vacuo eigen-frequencies between 318 and 2980 Hz. The full model was solved using the VA One software v. 2020.1 at one-twelfth octave centre frequencies between 15.625 and 2000 Hz. A diffuse acoustic field (DAF) of 1 Pa is used as the excitation on the water-side surface of the plate. The induced vibration velocity in a surface normal direction is predicted at the air side using five randomly selected sensors (see the blue points in Figure 8). There are no other structures, like the rest of the tunnel involved in this model. For definition and properties of the incident DAF, as well as the associated response and radiation of structures, see Pierce [70], Shorter and Langley [71] and Langley [72]. There is no need to define any particular source when the DAF is used to excite the structure between two semi-infinite fluid domains. The surface connections to the semi-infinite fluids (SIFs) of air and water project the frequency-dependent, reactive, and resistive components of fluid loading on the structural modes. In the frequency domain, the structural response shown in Figure 9 is similar for each sensor, with relevant peaks in the range of [130, 600] Hz; the shape of the lowest structural modes is depicted in Figure 10. As shown, the vibroacoustic response of a window may be considerable.

3.2. Effect of the Tunnel Environment

Reflections from the tunnel walls and the cavitator (modelled here as rigid bodies) are investigated via an acoustic FEM analysis of the cavity where inlet and outlet sections are modelled as reflection-free closures. A sketch of the FEM model is depicted in Figure 11. The tunnel cavity is discretised by using ten-node quadratic tetrahedral elements to solve the Helmholtz equation. The FEM model has approximately 660,000 degrees of freedom and is usable up to (approximately) 3000 Hz, when four (quadratic) elements per wavelength are required.
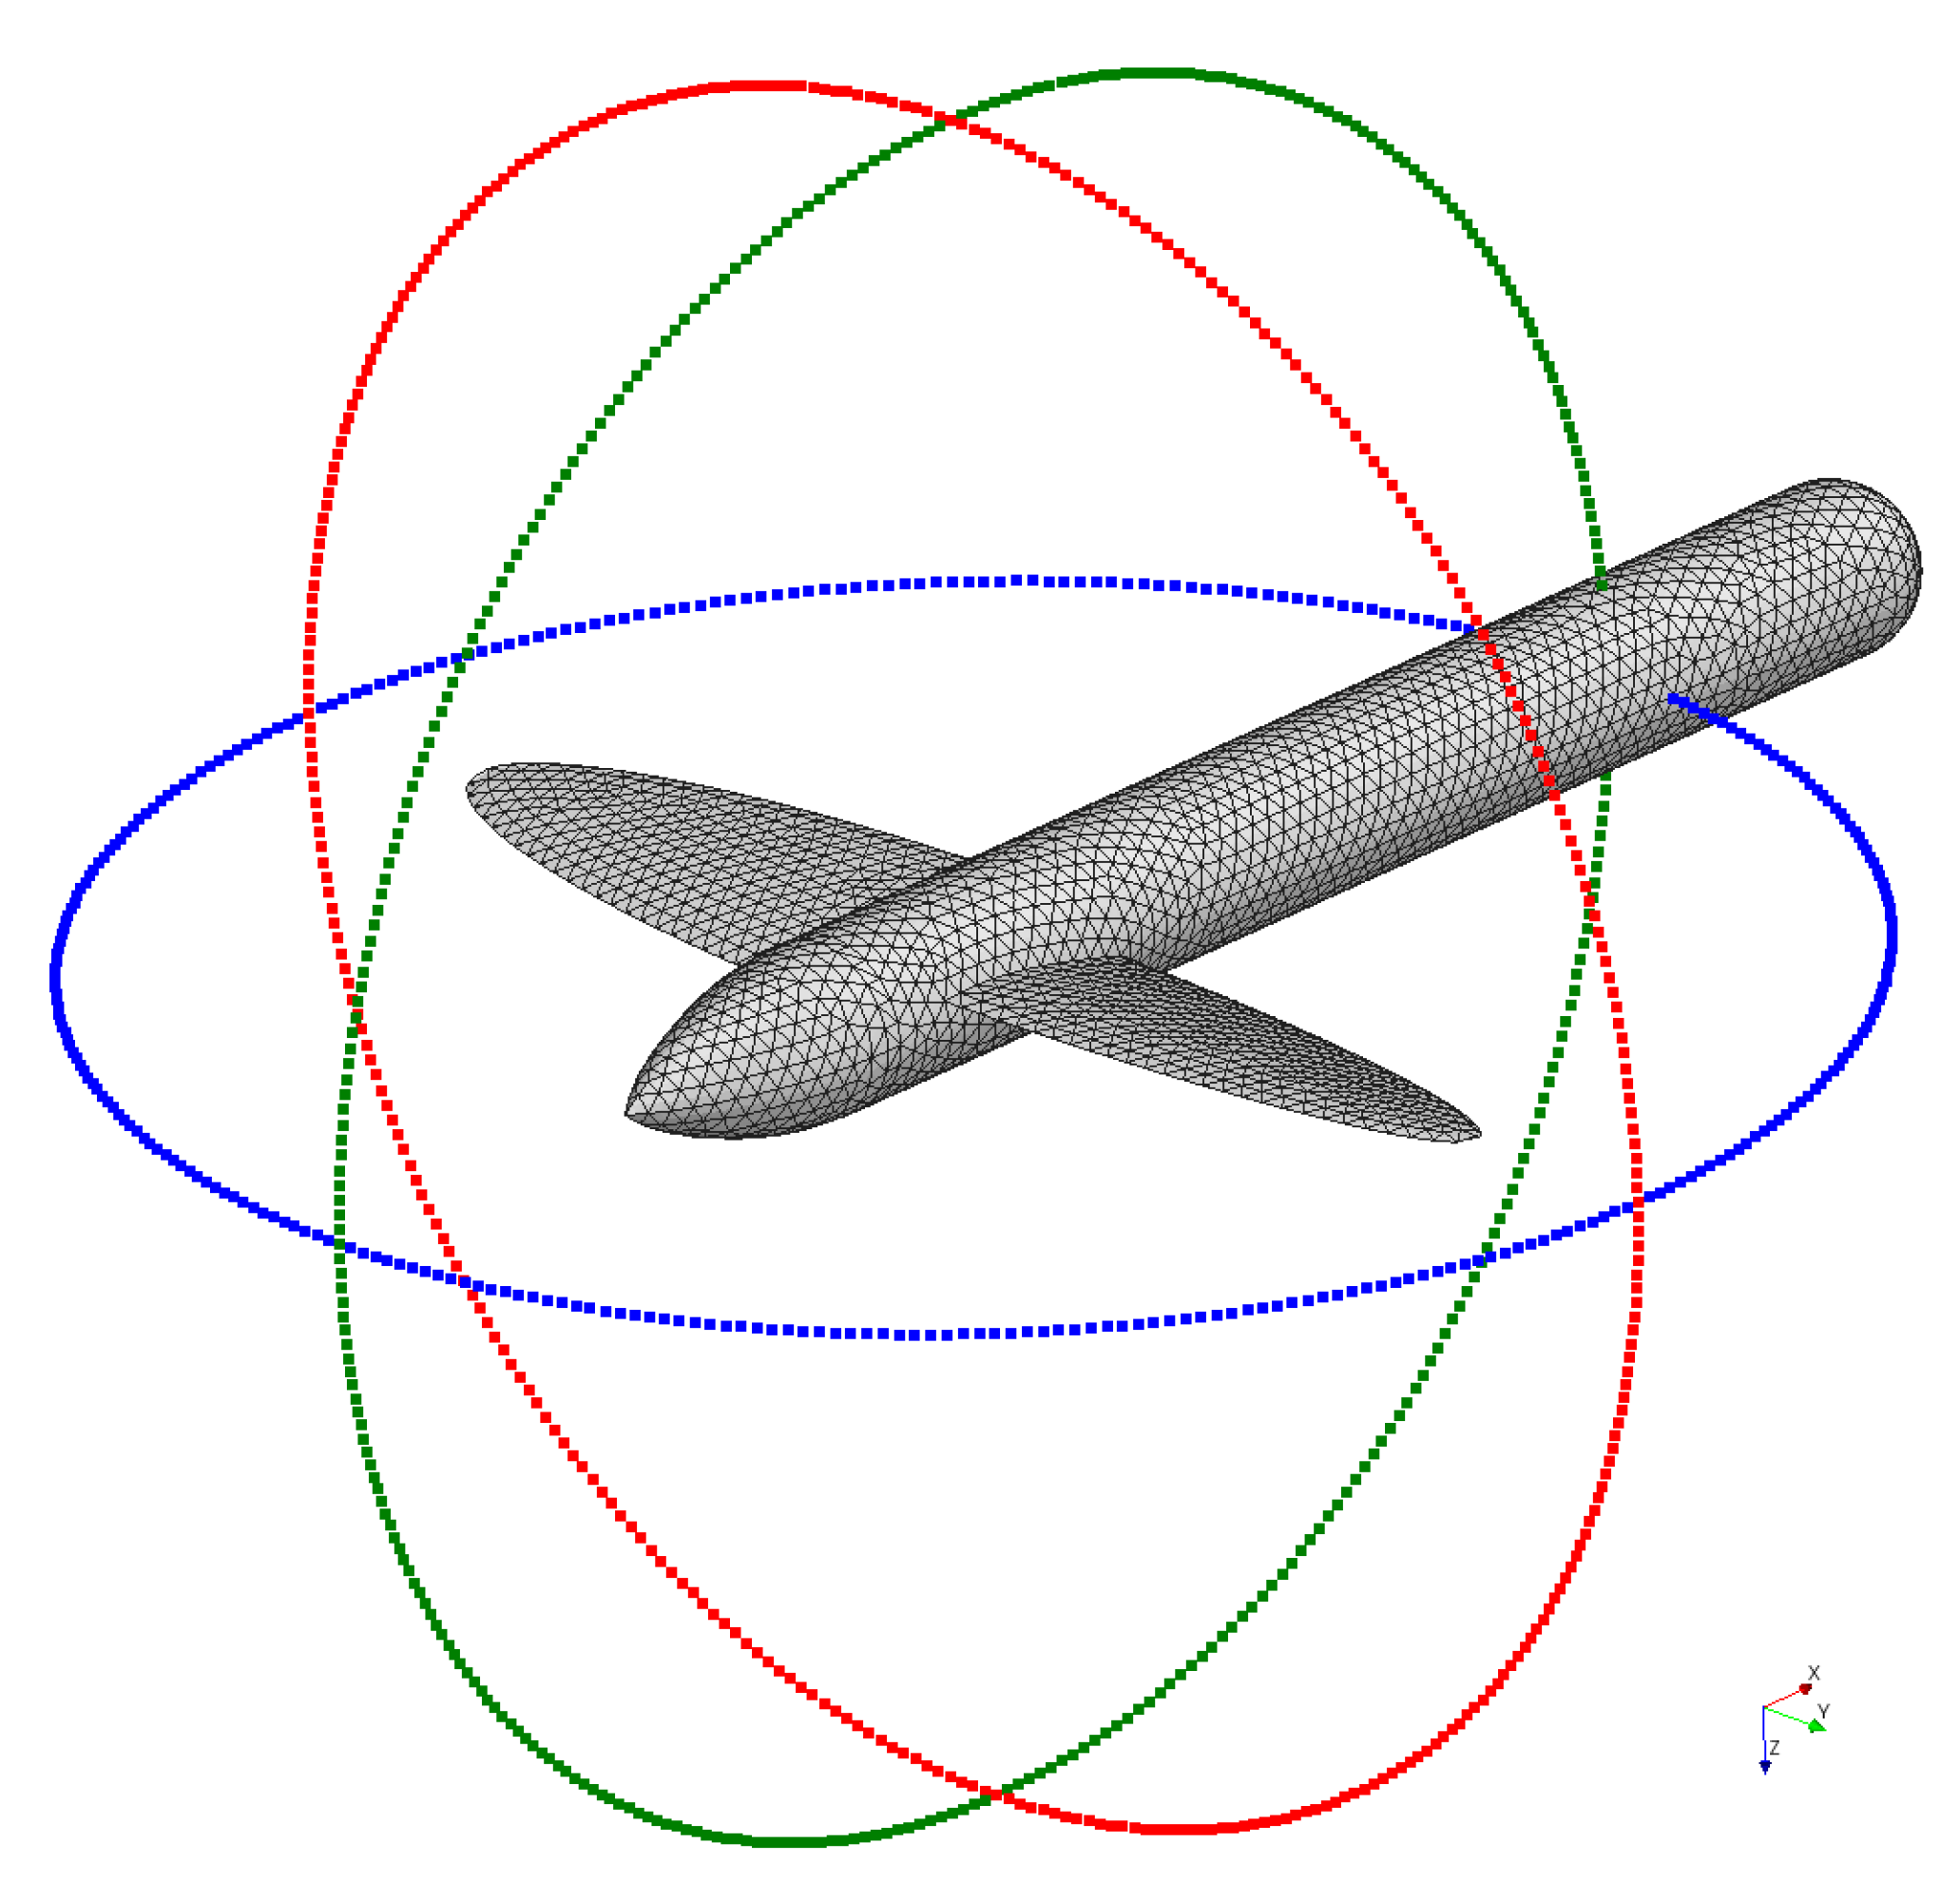
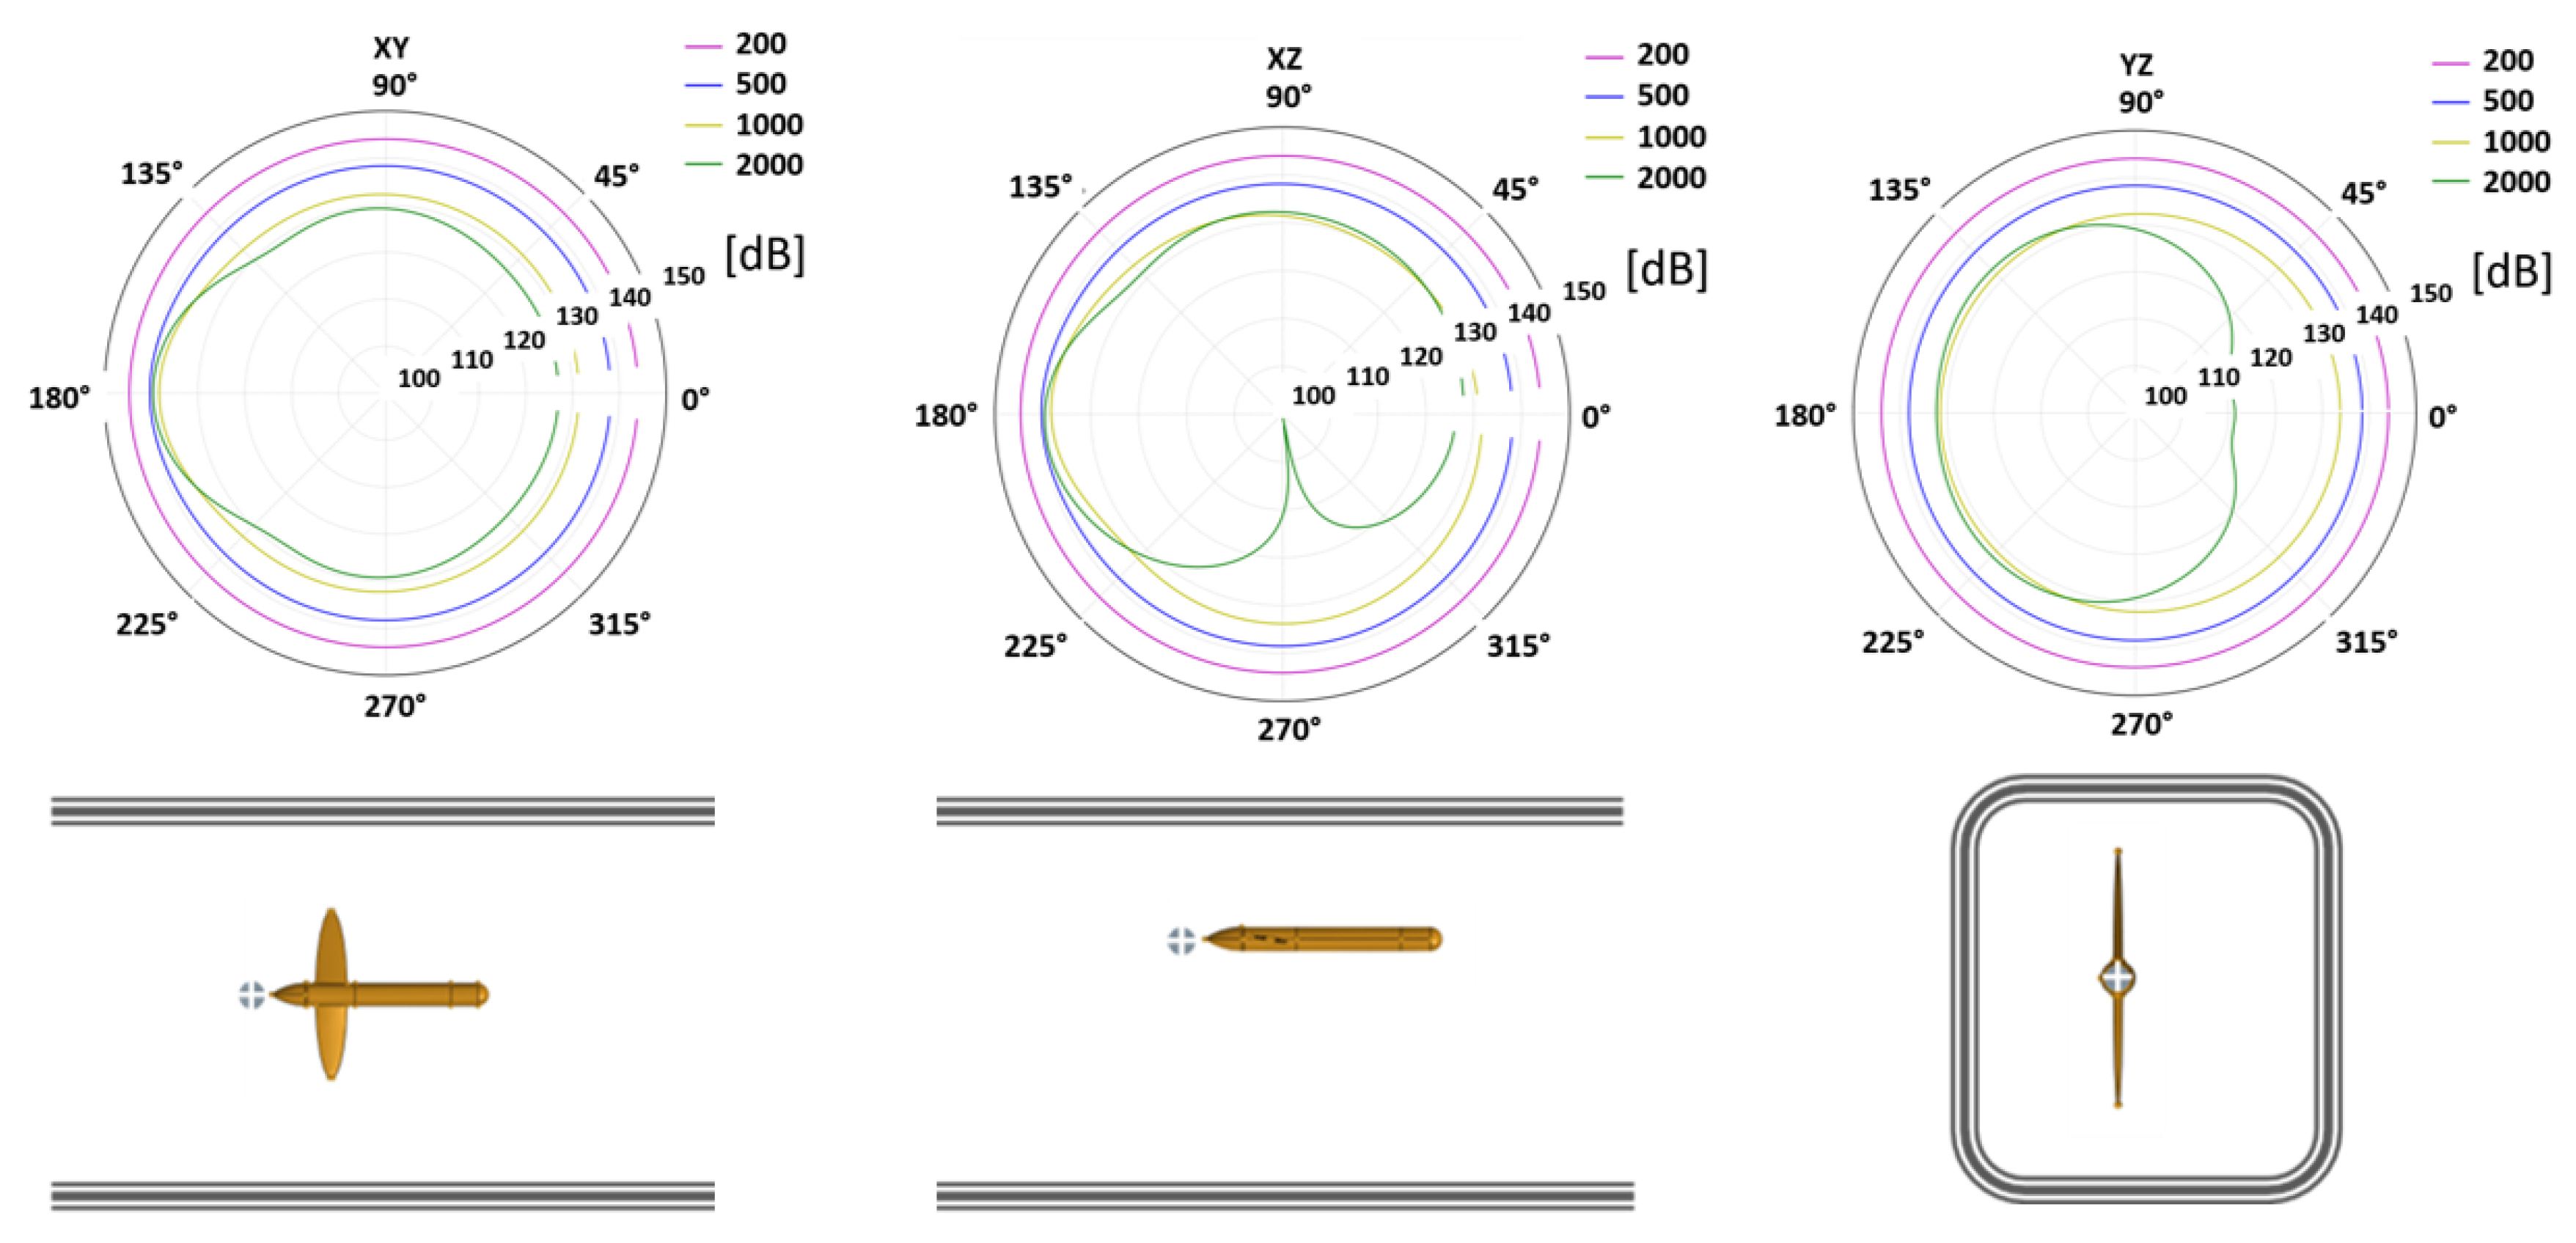
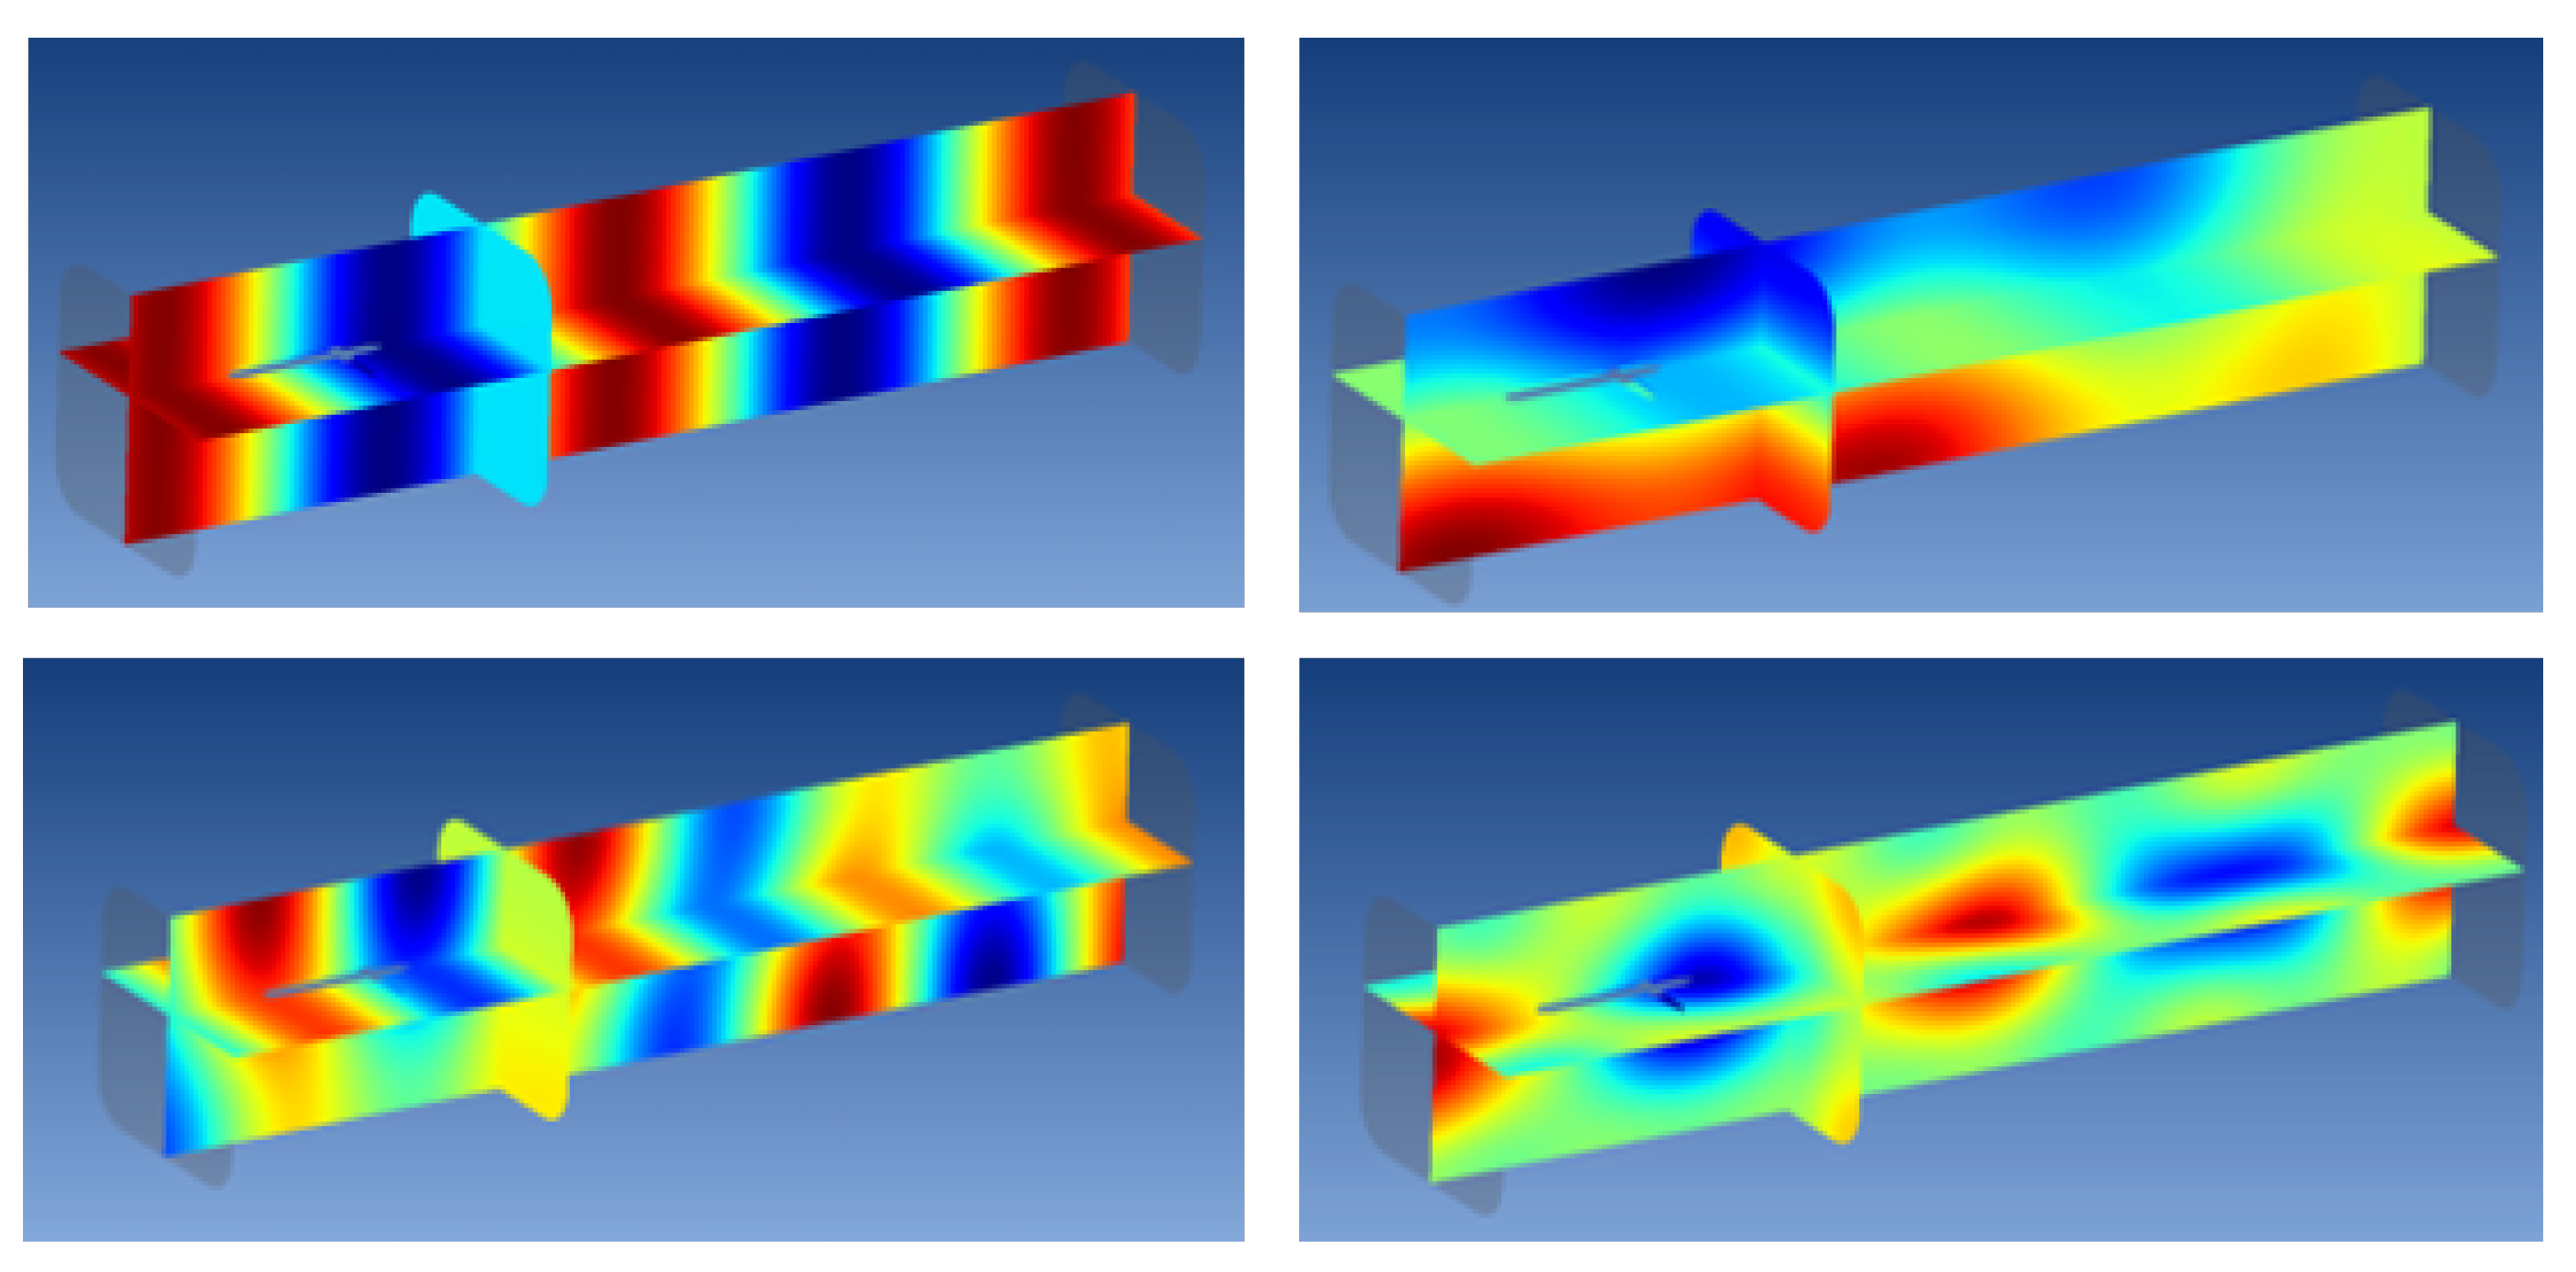
First, a 1 Pa monopole, placed near the tip of the cavitator (x = −120 mm) and oscillating at frequencies of 200 Hz, 500 Hz, 1000 Hz, and 2000 Hz, is used for acoustic excitation. Sound directivity is computed along circles of a 0.2 m radius, centred in the middle of the cavitator wing, laying in the horizontal, longitudinal, and transversal planes (see blue, green, and red circles in Figure 12, respectively). FEM directivity plots shown in Figure 13 highlight the loss of the circular shape above 1000 Hz, meaning that beyond this frequency, the assumption of spherical (or cylindrical) spreading fails, even for the elementary monopole source. Similarly, Figure 14 depicts the contour plots of the pressure magnitude on three mutual orthogonal planes centred in the middle of the cavitator wing. These results confirm that the acoustic pressure inside the tunnel deeply depends on the hydrophone’s location.
Next, a comparison between sound powers in the cavitation tunnel and in the free field is presented. The free-field FEM model shown in Figure 15 consists of a spherical domain of diameter D = 3 m, discretised by ten-node quadratic tetrahedral elements, yielding approximately 715,000 degrees of freedom. This modelling is also usable up to (approximately) 3000 Hz, when four quadratic elements per wavelength are required.
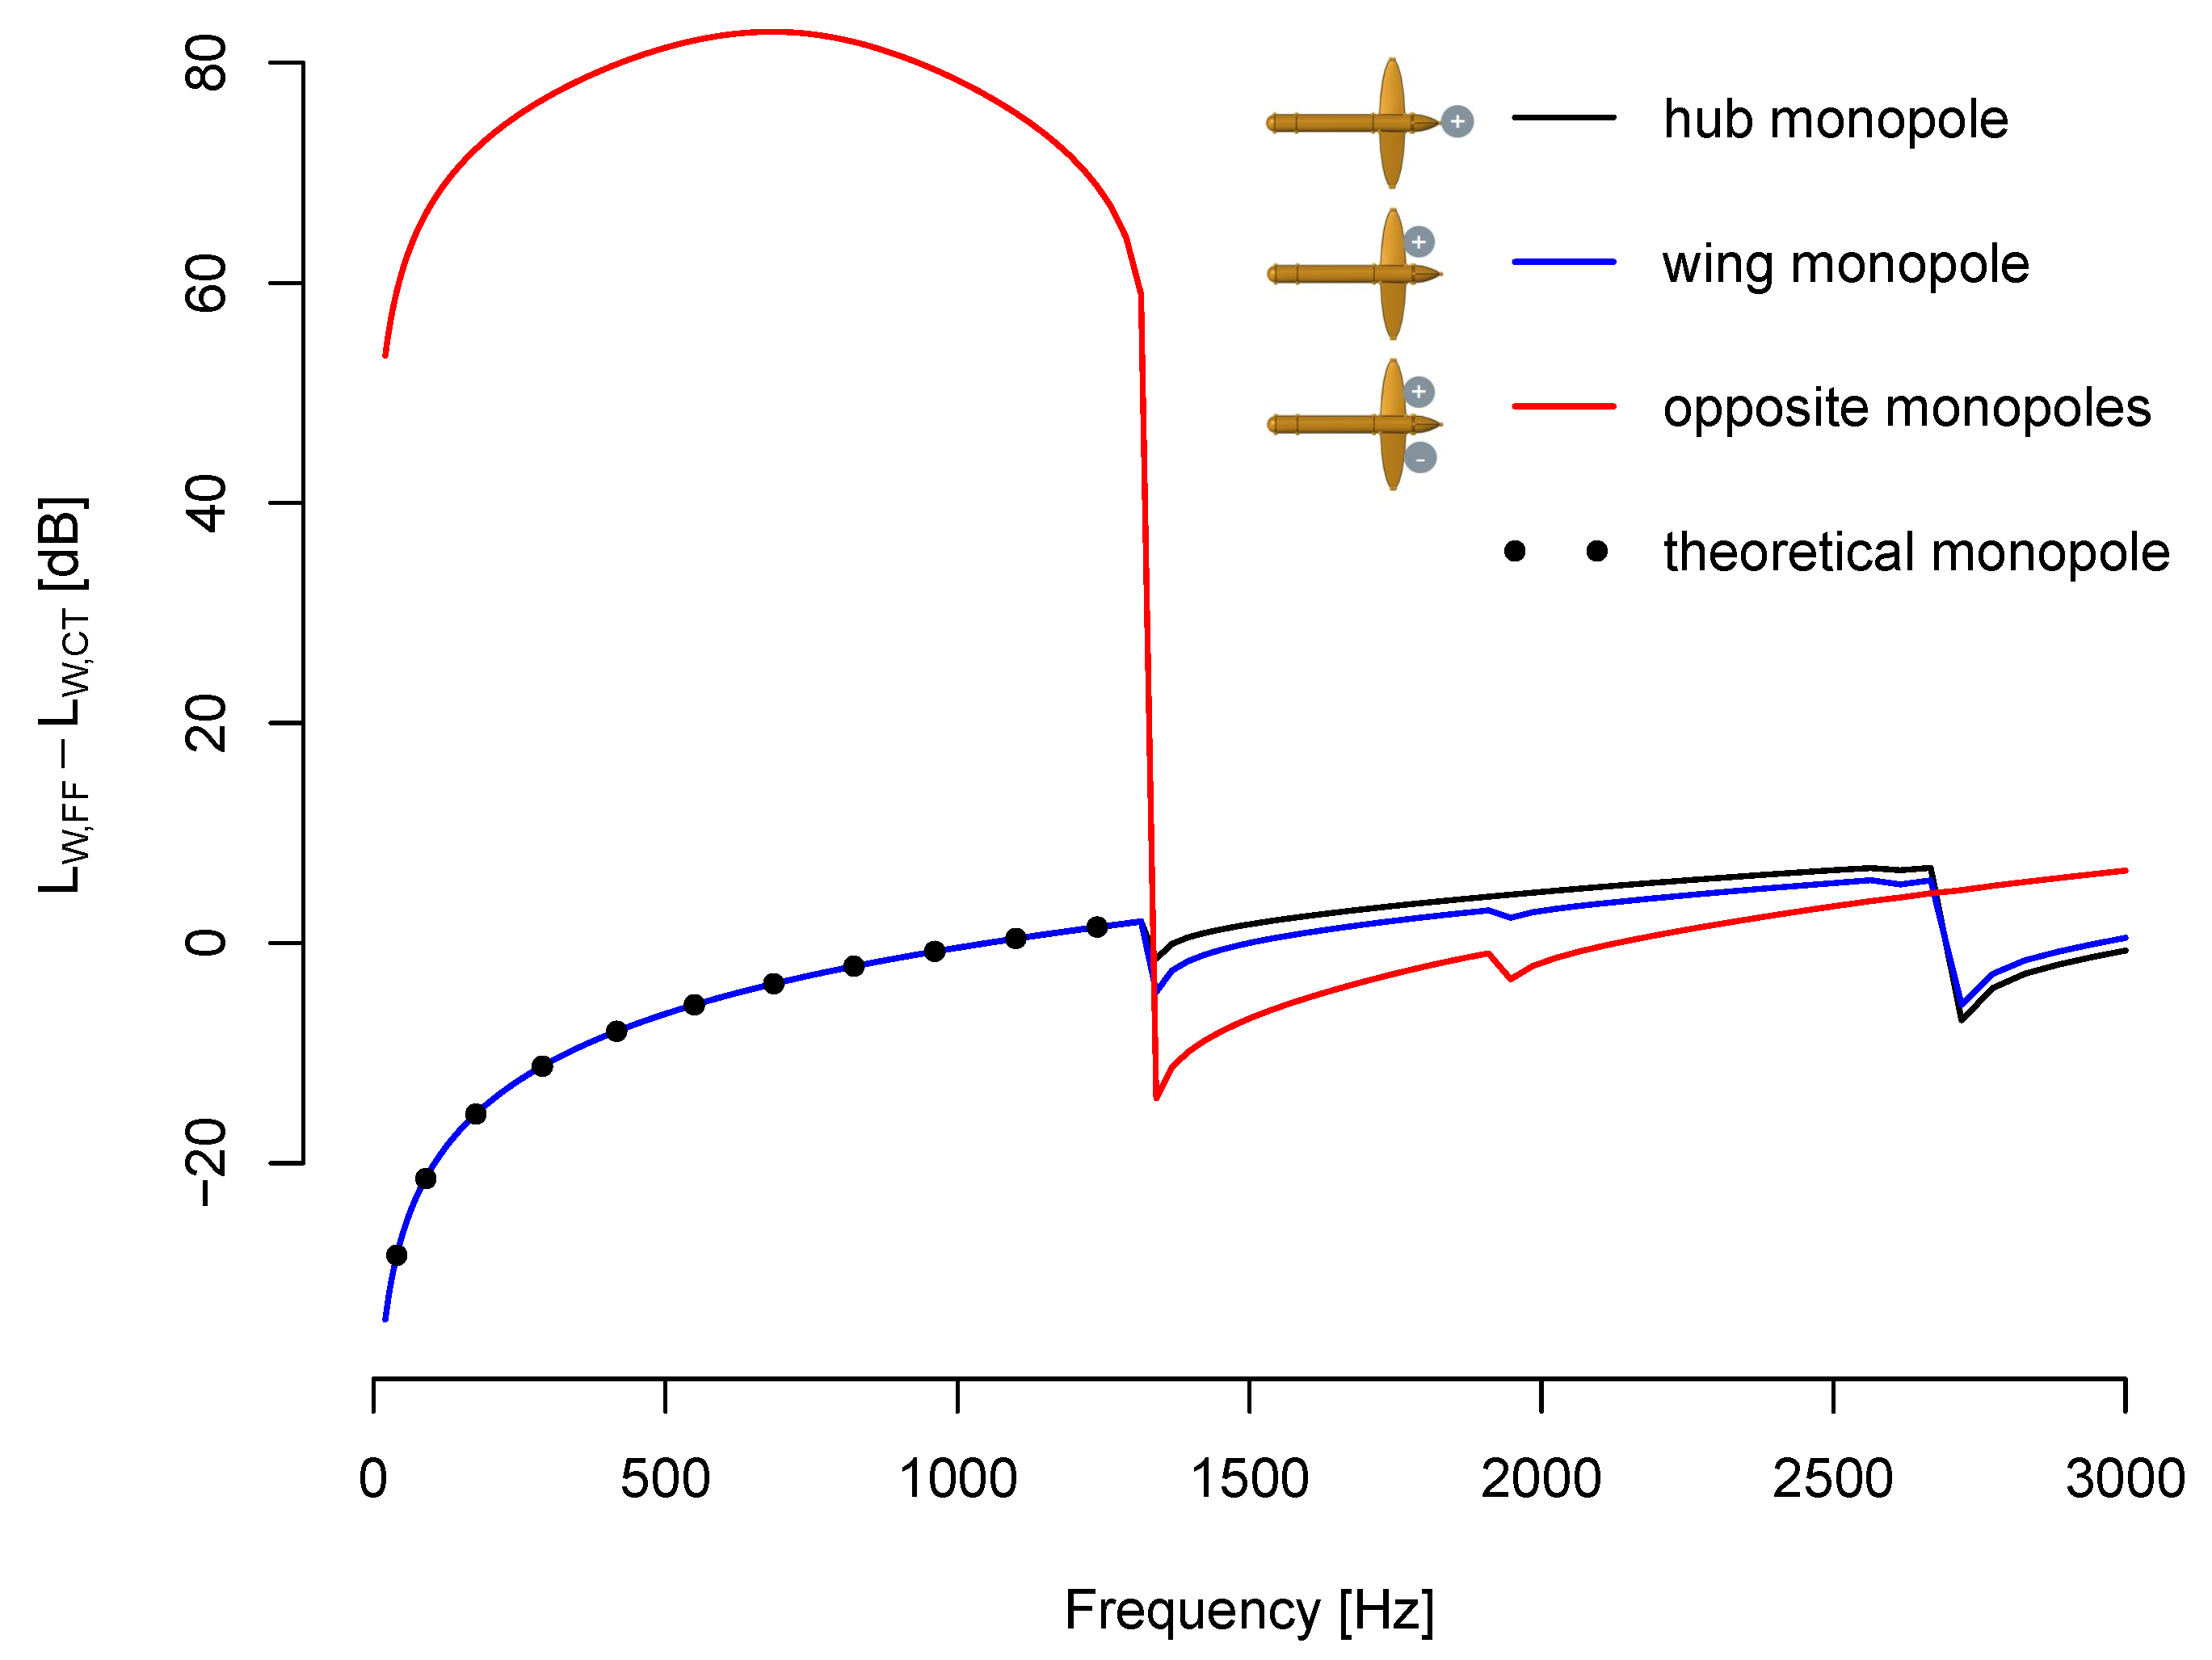
For each frequency of interest and for monopole(s) of amplitude | S ^ | and frequency ω placed in (i) the longitudinal plane in front of the hub x = −120 mm (hub monopole); (ii) on the left side of the wing near the tip x = −29 mm, y = −74.5 mm (wing monopole); and (iii) at both sides of the wing, oscillating out-of-phase (opposite monopoles); the FEM-based correction ( L W , F F - L W , C T ) depicted in Figure 16 highlights its dependence on source location (subscripts F F and C T stand for free field and cavitation tunnel, respectively). Notice that two monopoles with opposite phases create a sort of sound-cancelling dipole that increases the sound power correction significantly. Moreover, in the hub and wing monopole cases, the comparison between FEM and analytical results are based on
W F F = 2 π | S ^ | 2 ρ 0 c 0 ,
W C T = 4 π 2 | S ^ | 2 c 0 A ω 2 ρ 0 ,
where A denotes the cross-sectional area of the duct (note that Equation (19) is valid only in the plane wave frequency range), which highlights how the FEM analysis matches the theoretical results in the plane-wave frequency range.

3.3. Flow Simulation

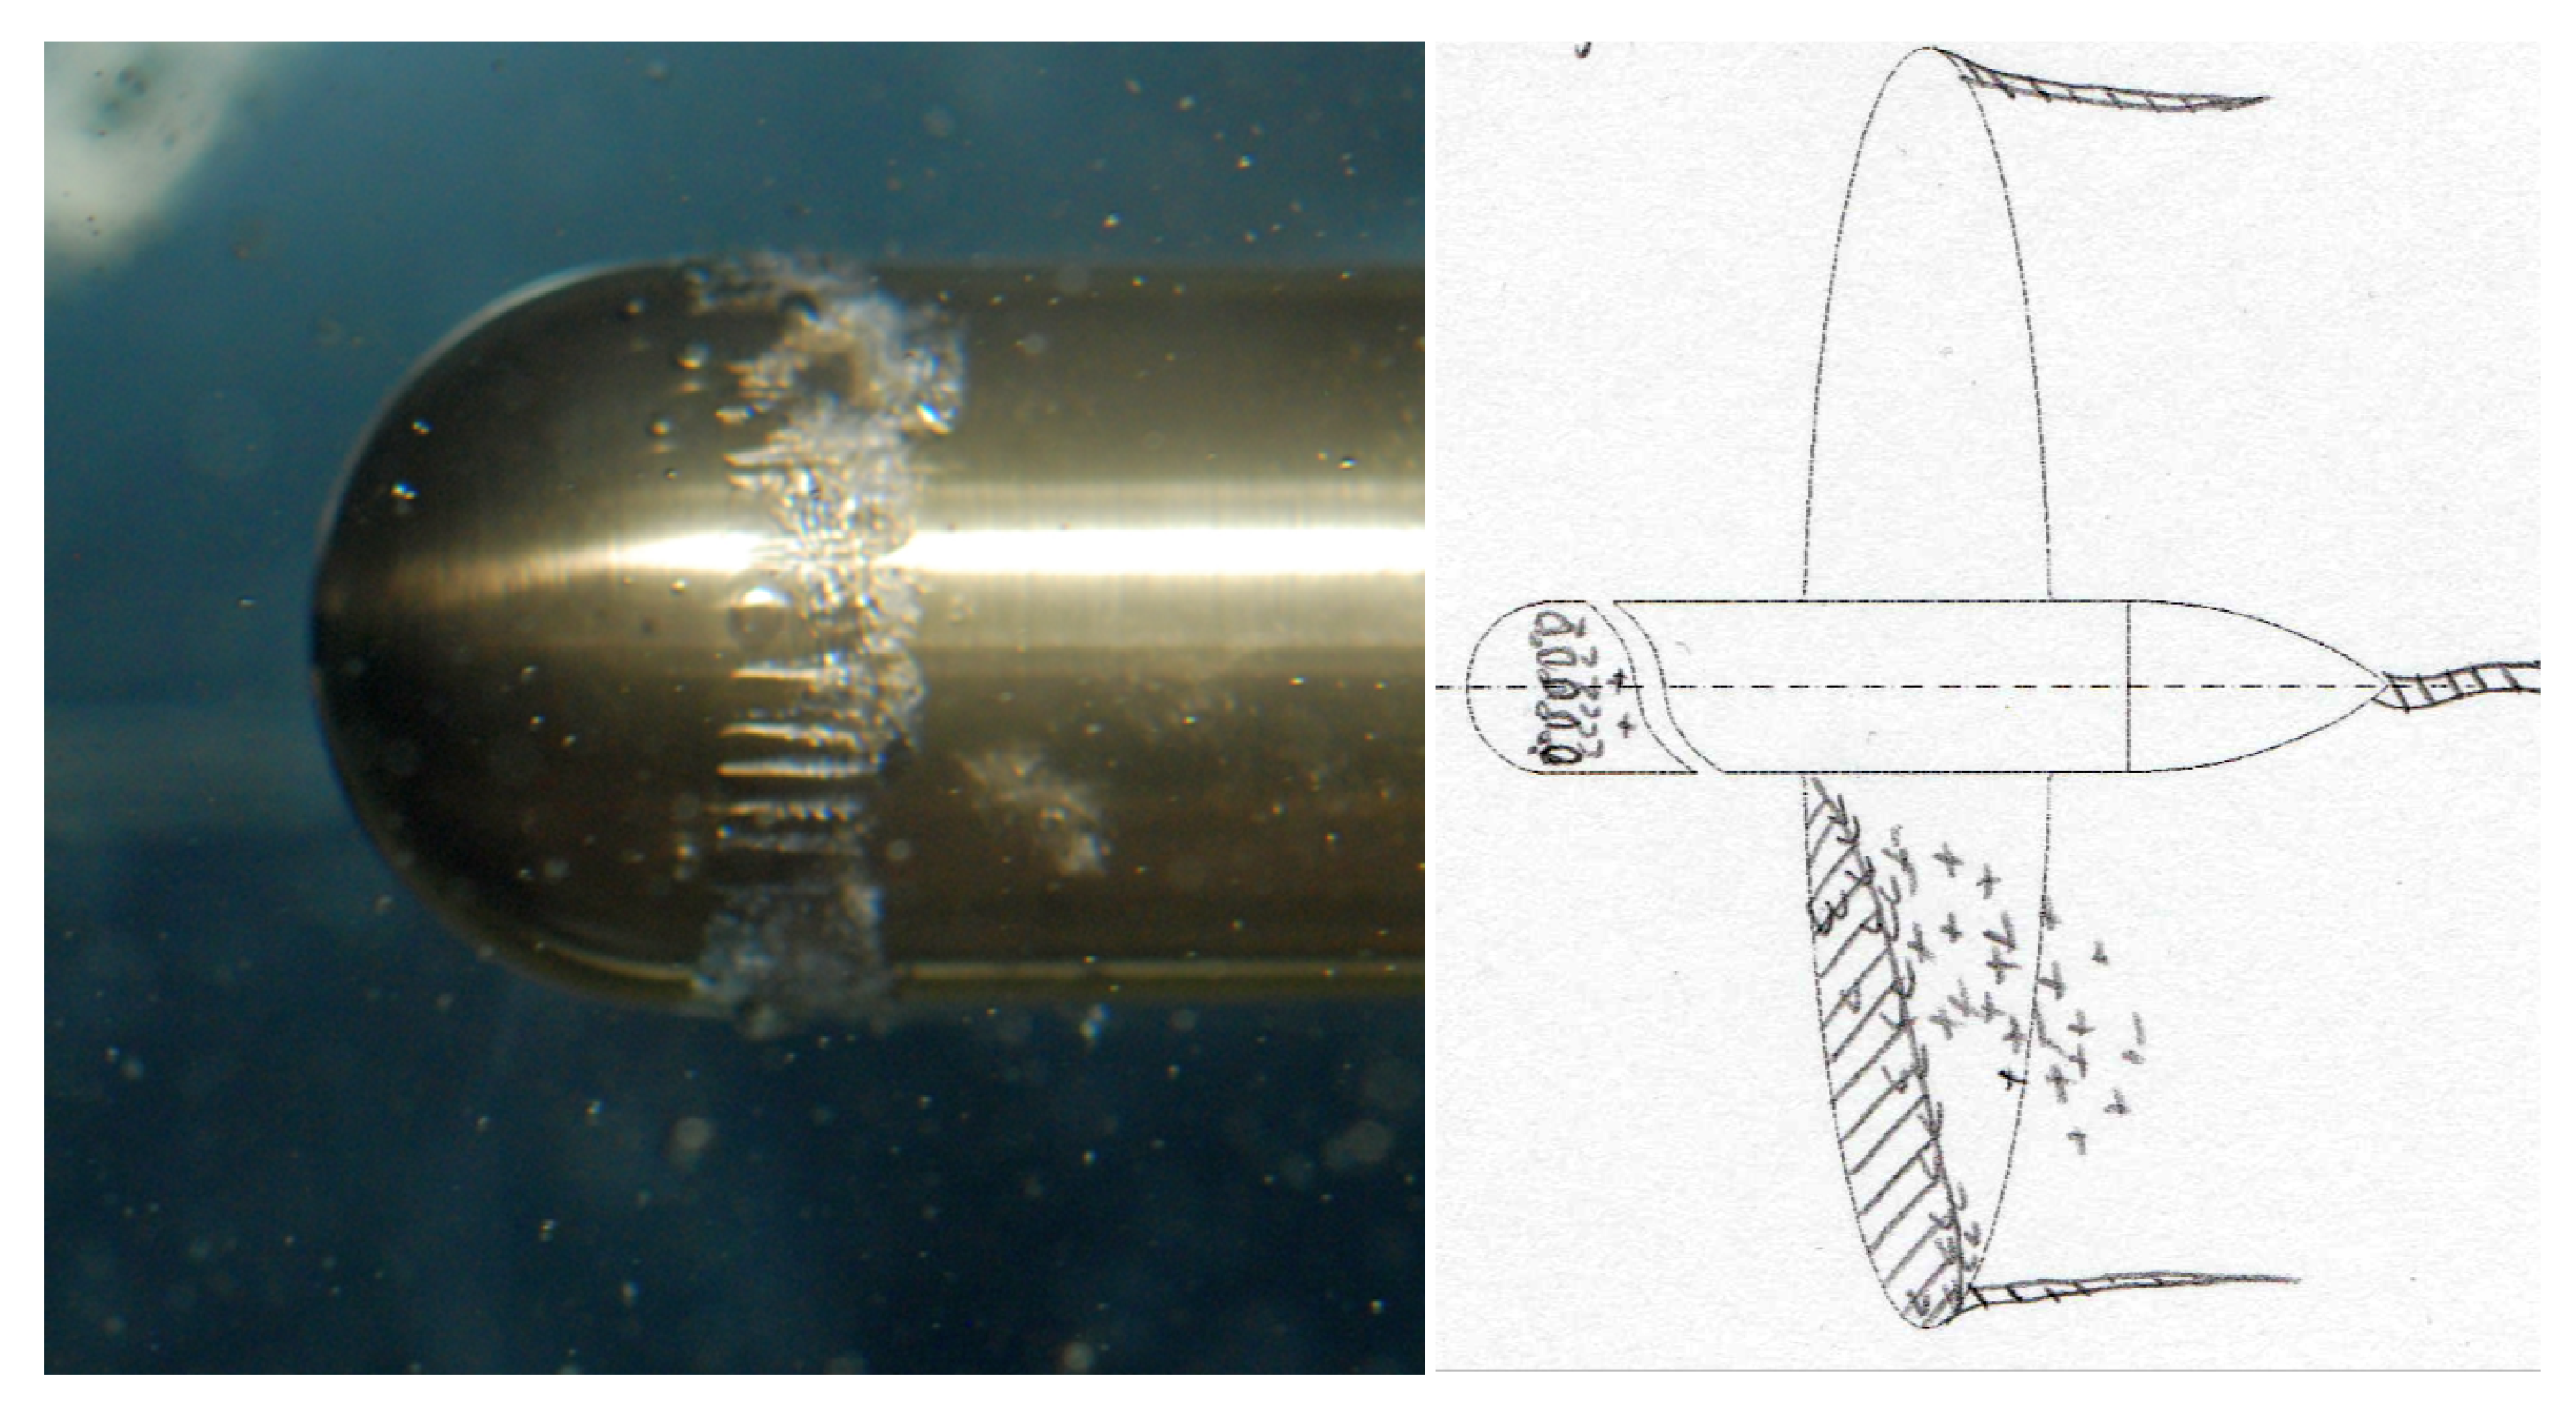
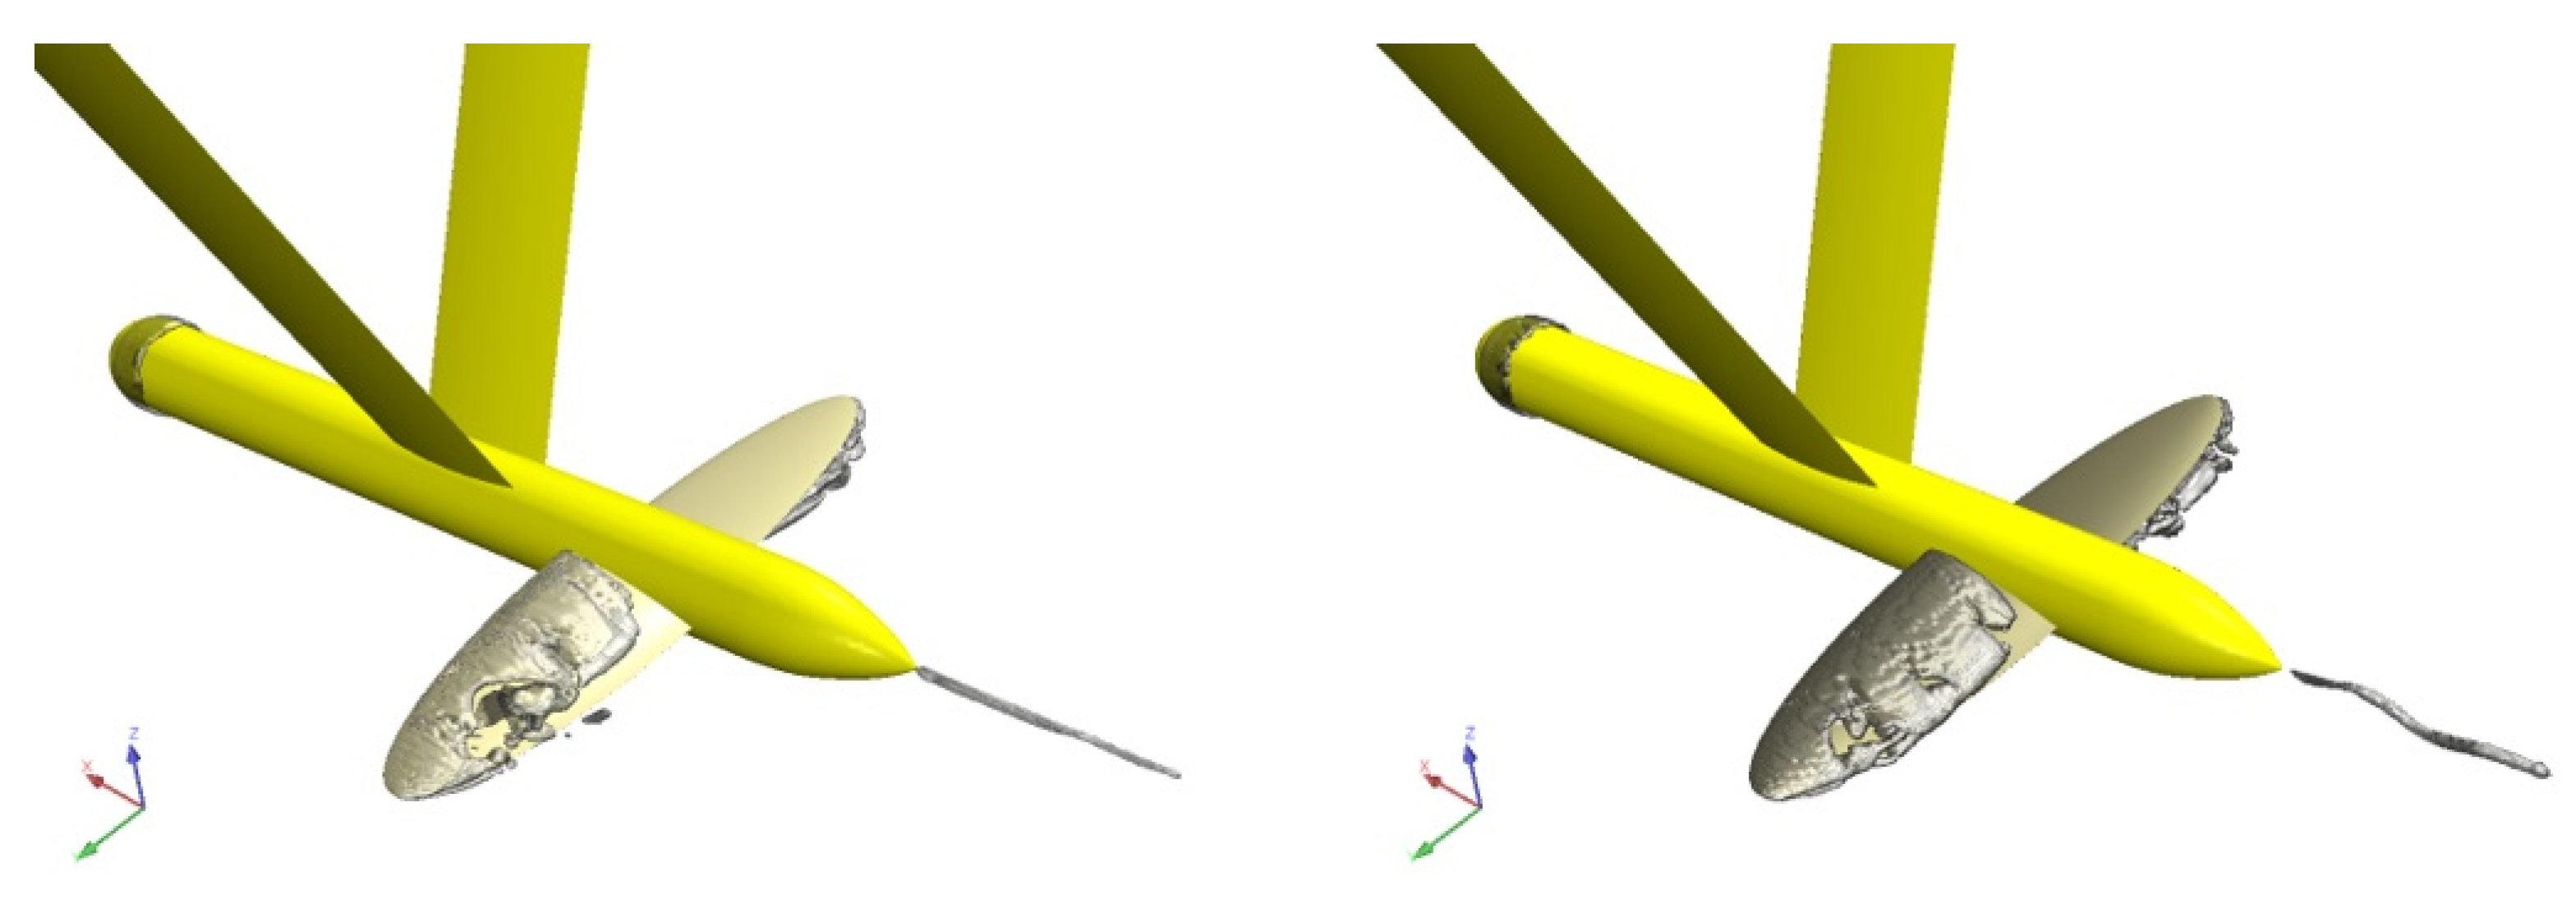
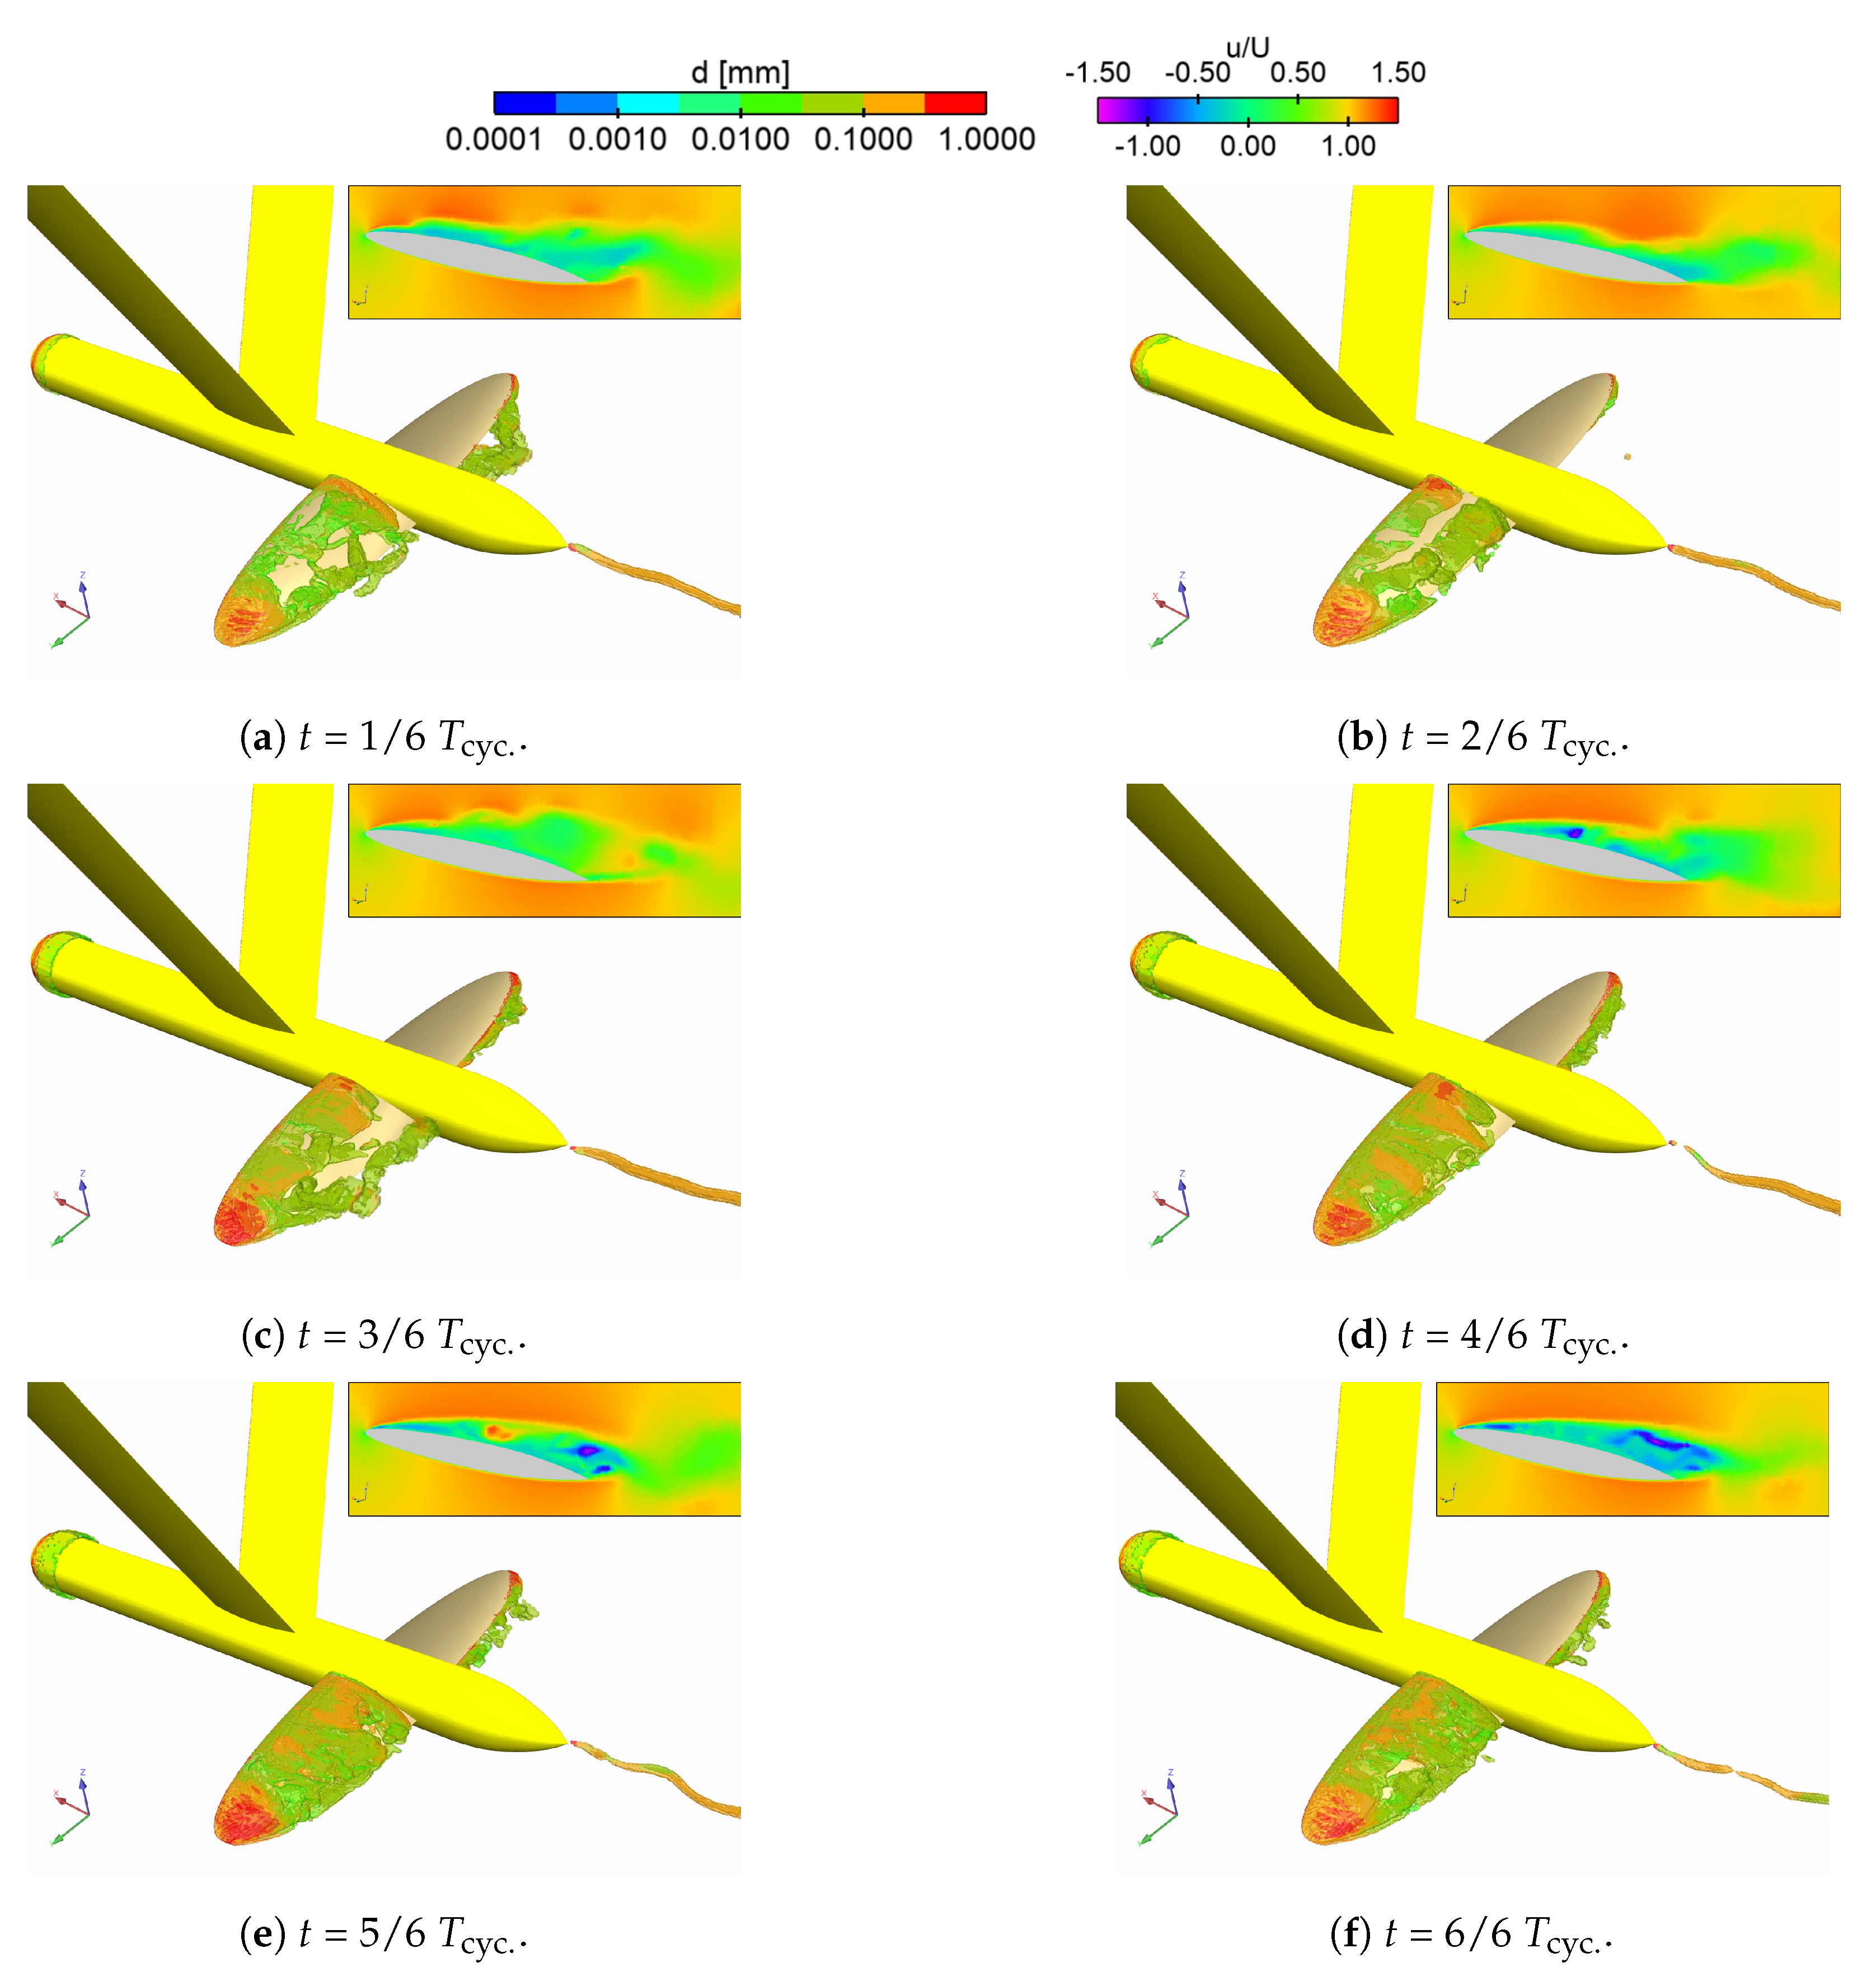
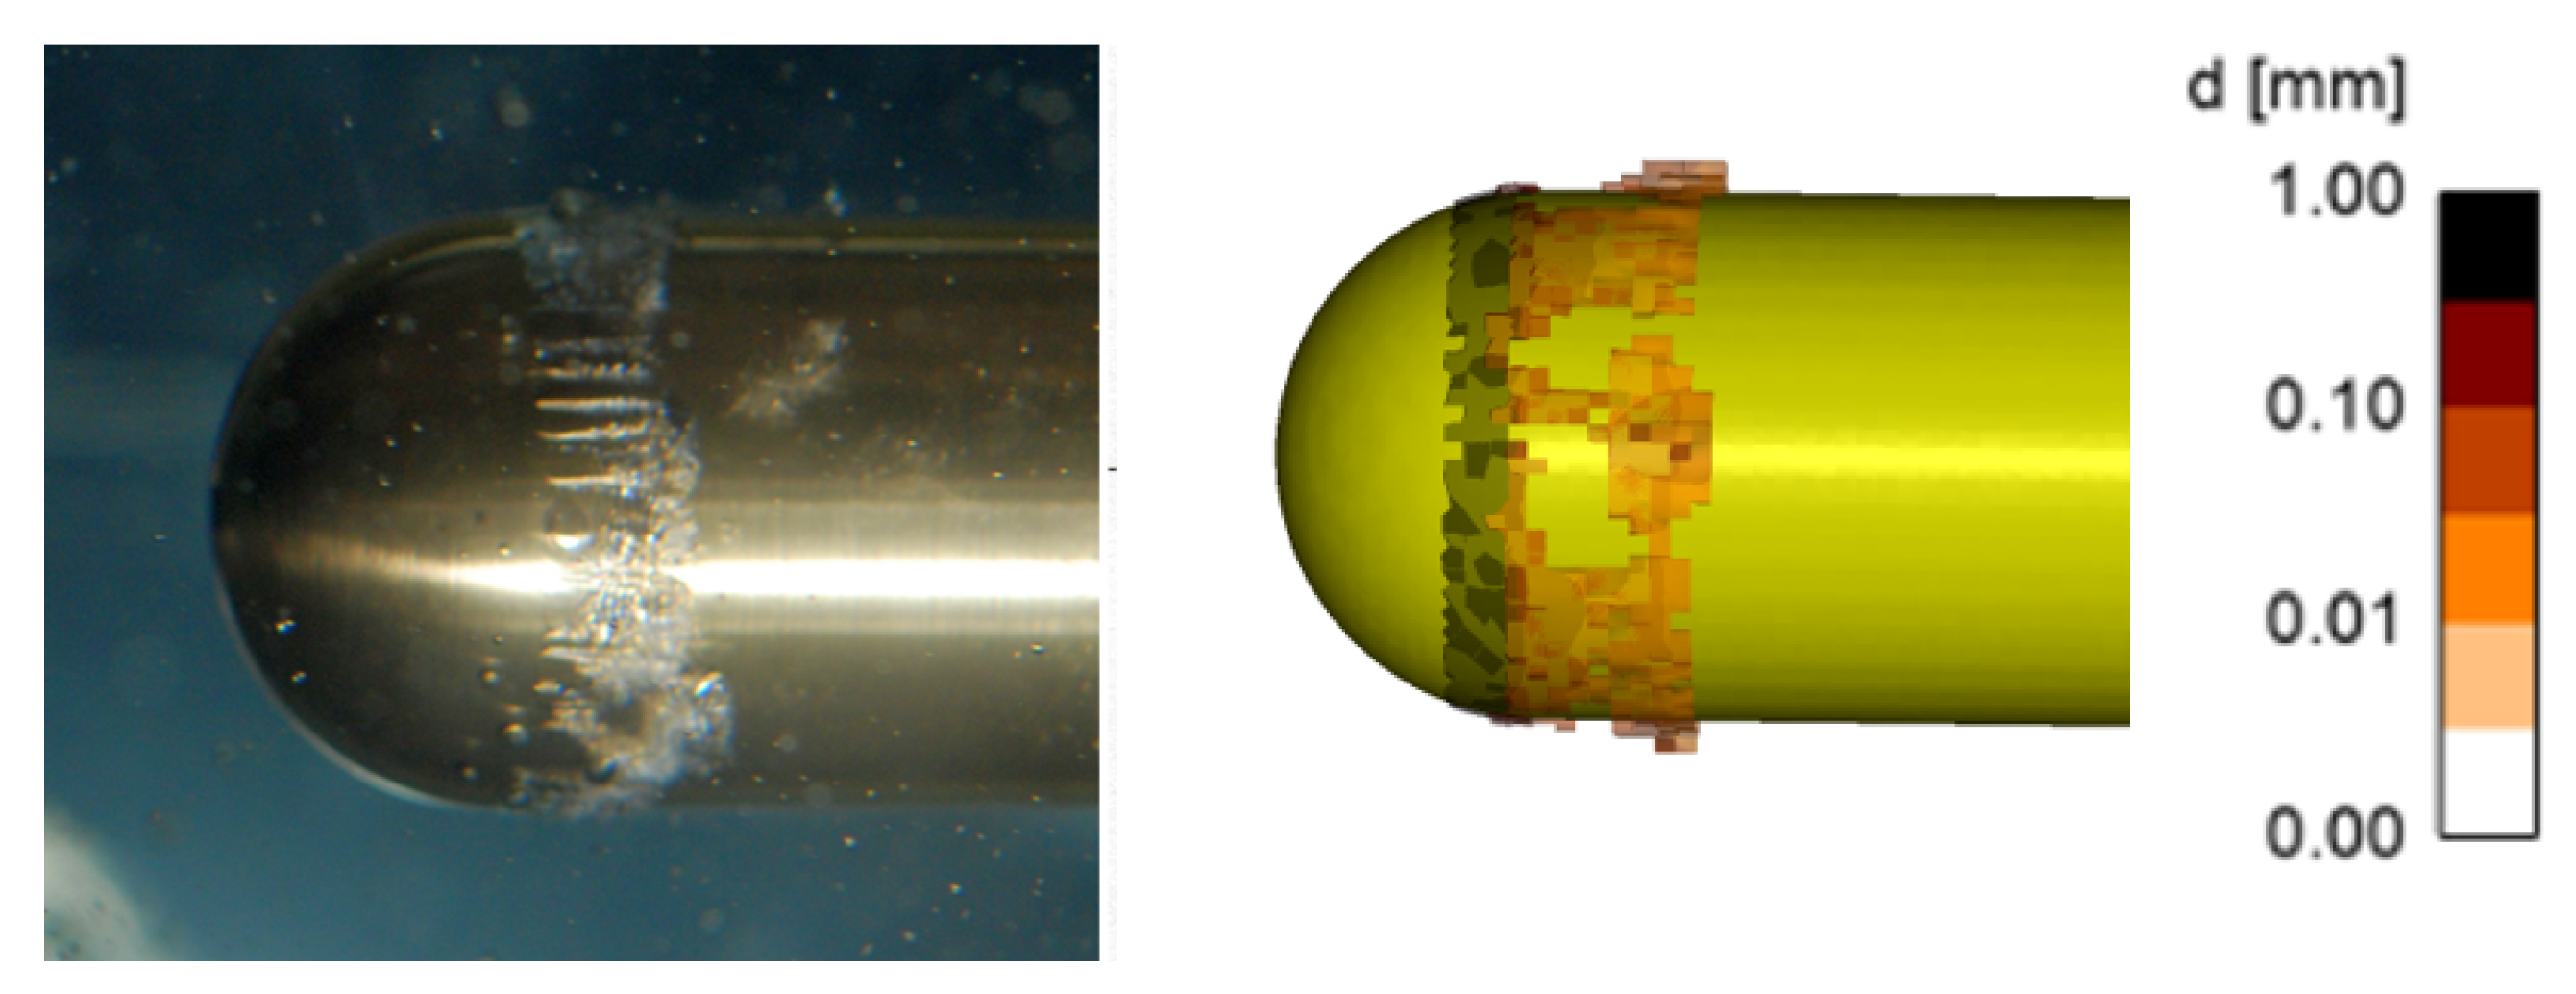
The hydrodynamic results of the cavitator obtained using VOF and EE formulations are presented hereafter, and whenever possible, a comparison with the experiments is addressed. The left side of Figure 17 shows an experimental view of the cavitation extended on the head of the cavitator, whereas the sketch of the mean cavity region on the wing is depicted on the right side. For the operating condition, Figure 18 compares the snapshots of the multiphase CFD simulations in terms of vapour cavity; the agreement is very good, as also confirmed by the average lift coefficients C L equal to 0.064 for the VOF model and 0.065 for the EE one, respectively. To visualise the cavitation dynamics, we provide the animations from the VOF and EE simulations, corresponding to the snapshots in Figure 18, as Supplementary Material (Video S1) to this paper. Numerical predictions of cavitation shedding are shown in Figure 19, where six frames, sourced from the EE modelling, highlight the evolution of the vapour regions on the wing and downstream of the hub, each lasting 5.7 ms. In this visualisation, the cavitation volume ( α g [ 0.1 , 0.9 ] ) is coloured by the predicted diameter of the vapour phase. For each frame, an insert shows the mixture speed u m / U on a plane at midspan of the left wing; it highlights the occurrence of the periodic shedding of sheet cavitation into smaller structures, along with the presence of a re-entrant jet at the cavity closure of the attached vapour sheet that drives the liquid phase underneath the main cavity, breaking it off to the wake of the wing. Experiments show that attached sheet cavitation inception occurs at the leading edge, covering half of the suction side and breaking off as cloud cavitation (Figure 17).
The CFD of the hydrodynamics predicts that almost the entire suction side is covered by transient sheet-like vapour structures, with a strong and periodic shedding of fine vapour clouds downstream. Specifically, both VOF and EE simulations yield wake vapour areas composed of tiny bubbles ( O ( 0.01 mm ) ) with a shedding phenomenon occurring at (approximately) 29 Hz. Neither experimental data of the cavity shedding nor high-speed videos of the time evolution of the cavity volume are available. With the same colour scale used in Figure 19, Figure 20 depicts cavity growth and detachment obtained from EE computations through a sequence of snapshots at 2 ms intervals, taken close to the left wing. It is found that during the growth phase, the dispersed phase diameter grows as well (at some regions of the wing) up to 1 mm. Moreover, cavity evolution exhibits a strong three-dimensional variation spanwise, with a rapid variation (in time) in the distribution of the dispersed phase diameter near the tip.
A comparison between experimental and EE-based predictions of the vapour region near the hemispherical head of the cavitator is depicted in Figure 21, where the colour map on the right side refers to the iso-volume of α g coloured by d gas . It is shown that at the closure of the streak cavities, the vapour appears to break into smaller, finer structures, whilst greater diameters are predicted at the fore part of the cavity and smaller ones farther downstream. A very good matching between experiments and computation is found.
CFD simulations (see Figure 22 and Figure 23) highlight that unsteady suction-side sheet cavities deeply affect the pressure coefficient C p and axial flow-field velocity u, even though such disturbances dissipate quickly near the end of the cavitator as the grid resolution deteriorates. A snapshot of the vapour volume and vortical structures departing from the hub and wing tips is given in Figure 24, where the non-dimensional vorticity Ω = Ω · d / U (d being the maximum chord length) is used to emphasize vortical structures. Although (weak) vortices are visible, the numerical resolution does not allow the pressure in the vortices to drop below the saturation pressure so that the phase change does not occur, differently from the (notably stronger) hub vortex, where the pressure does drop sufficiently for cavitation to take place. Lastly, snapshots from the VOF and EE computations are shown in Figure 25 to establish a visual correlation between cavity evolution and the distribution of acoustic sources (based on the non-dimensional Q-criterion). As Supplementary Material to this paper, we provide the animation files of these two cases to demonstrate the cavitation dynamics and acoustic sources during the cavity shedding cycles. Here, EE computations, relying on the volumetric mixture velocity, yield a vapour region described by slightly finer structures compared to the VOF-based results, which, on the contrary, seem to be a bit more uniform. Similar considerations hold for the wake vorticity field solution. In addition, it is found that the cavitating hub vortex is smaller, in terms of diameter, when the VOF formulation is considered. Furthermore, inside the time-window analysed herein, a reduced time-variation of the hub vortex is observed compared to the EE computation. This is ascribable to the CFD grid used in the computation, allowing the vapour structures to dissipate quite quickly after detaching the foils, thus allowing the VOF solution to preserve them for a slightly longer distance than the EE solution does. Note that the distribution of EE-based acoustic sources appears to be wider and more spread out than the VOF model. The coarsening of the computational grid causes the sudden termination of the flow field’s description beyond a given distance, approximately three times the max. chord length in the wake of the cavitator.

3.4. Noise Simulations

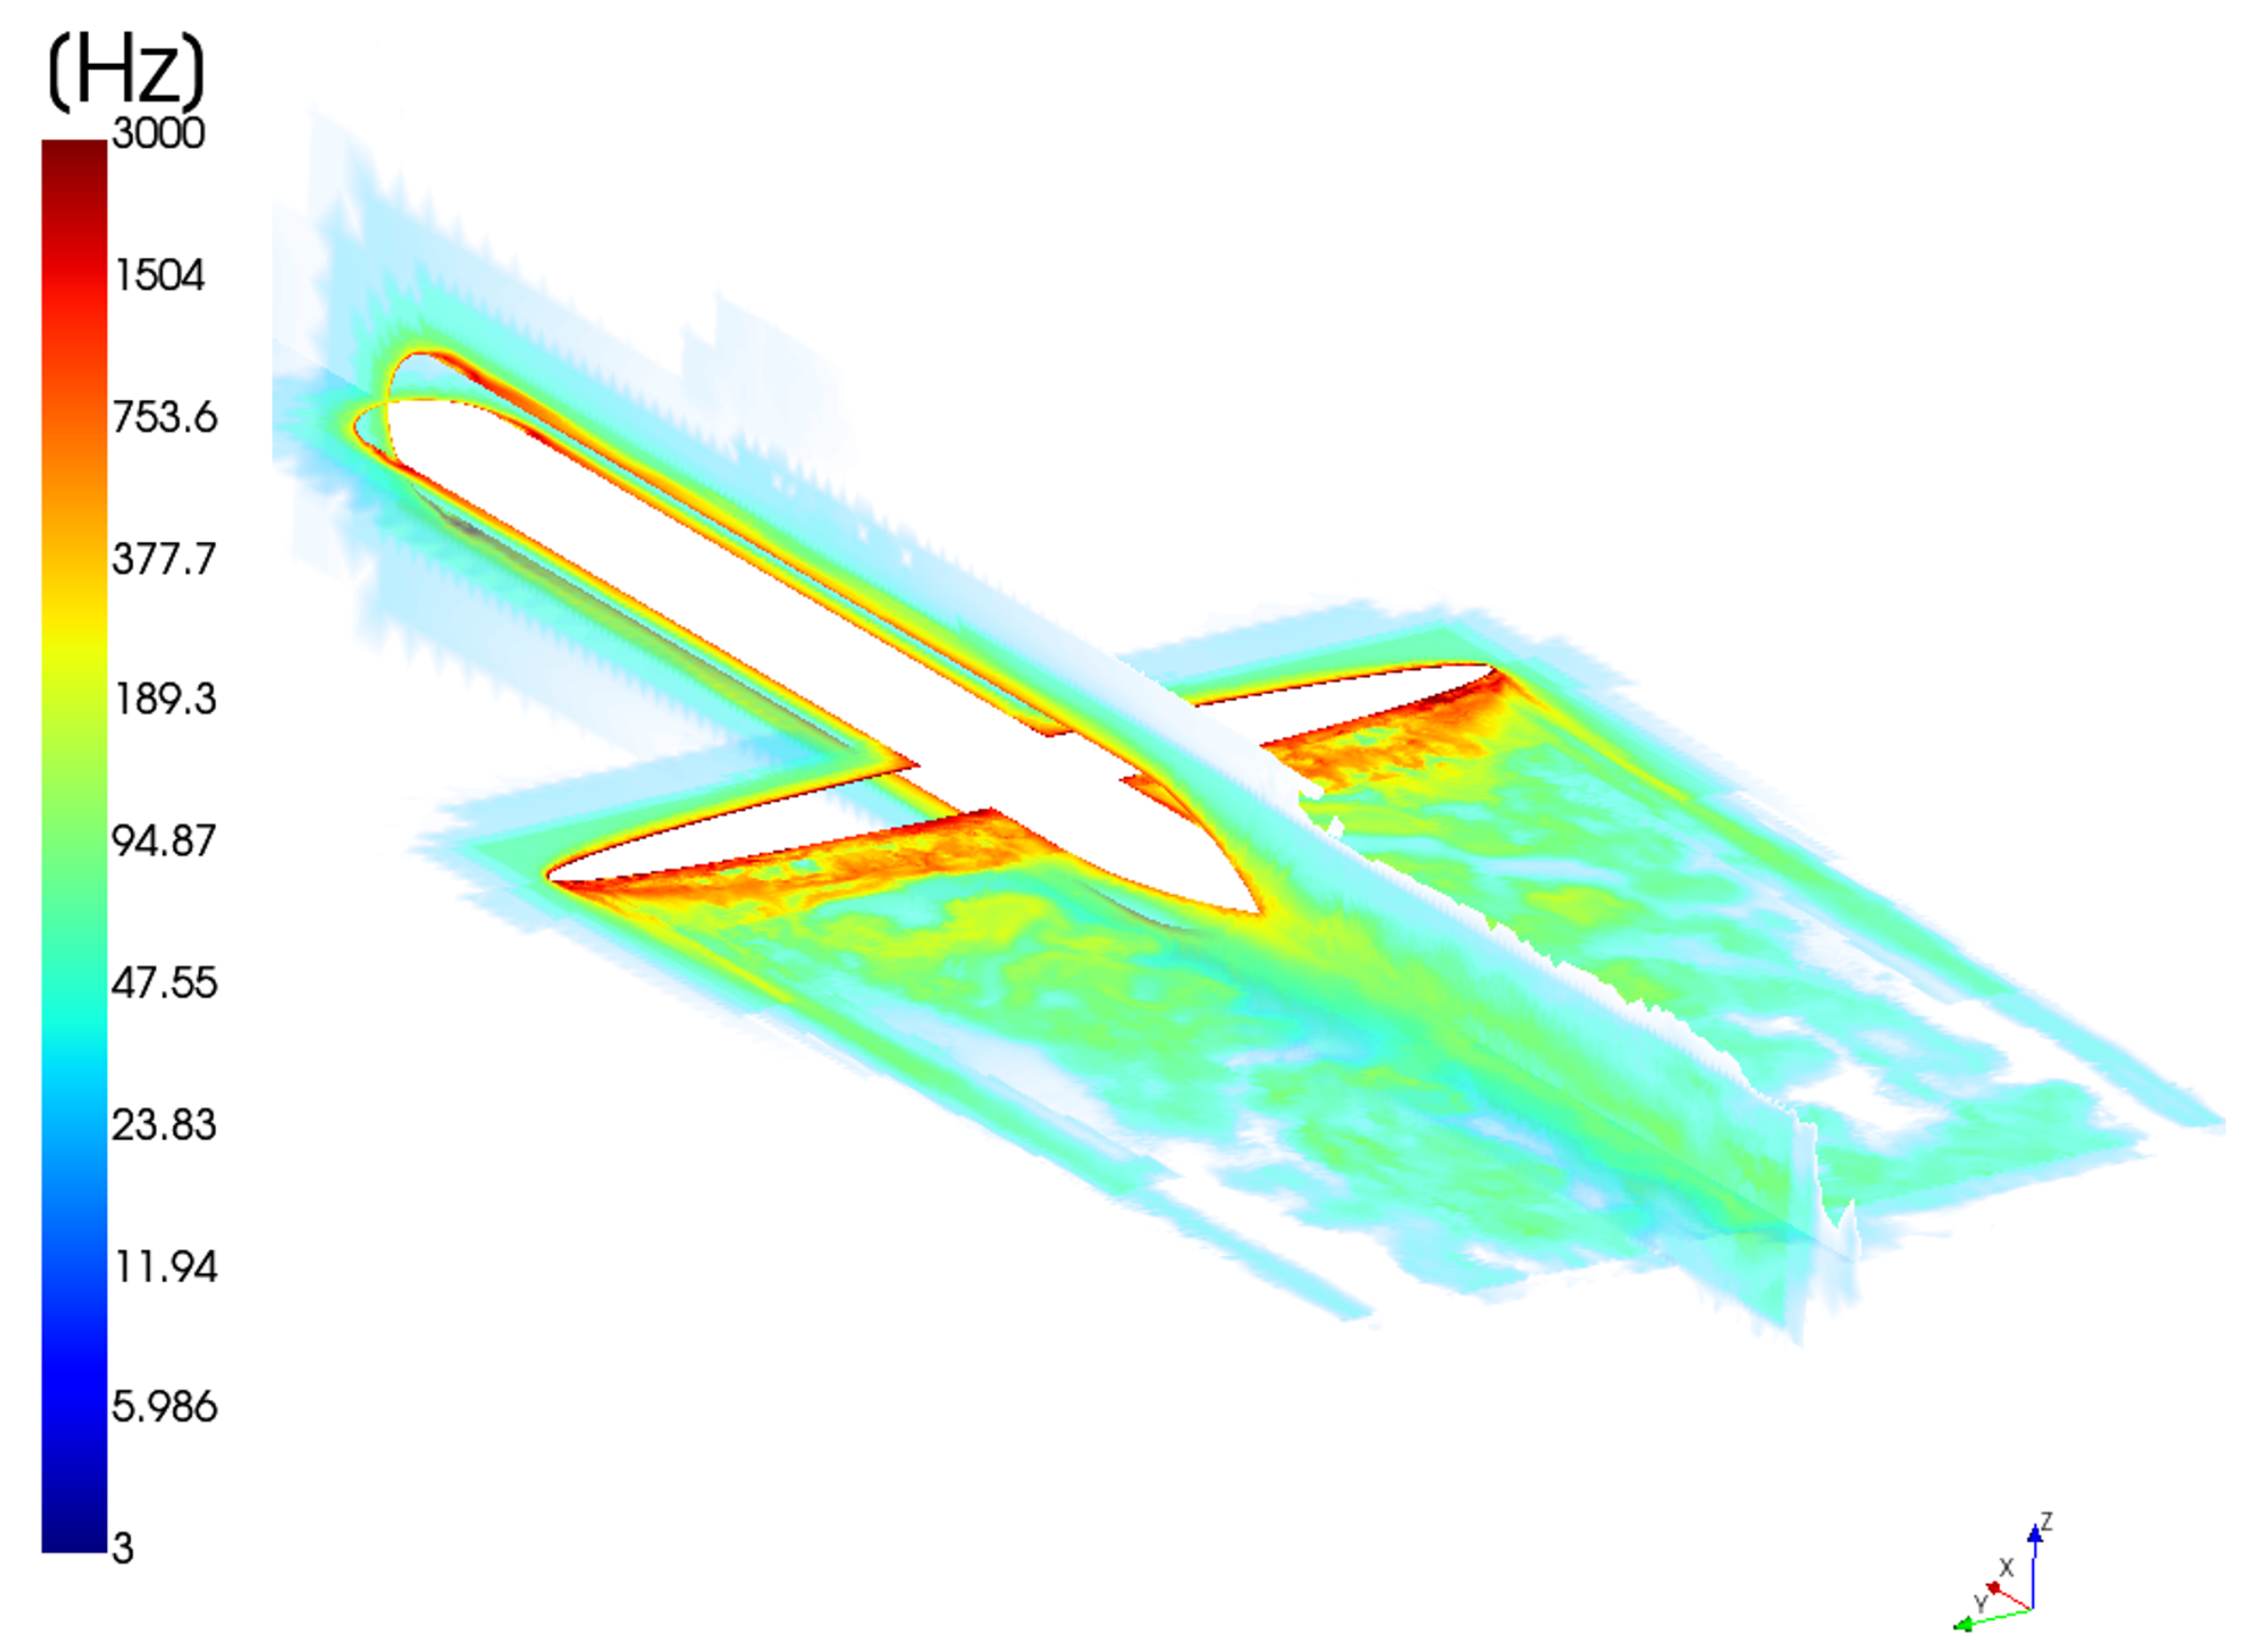
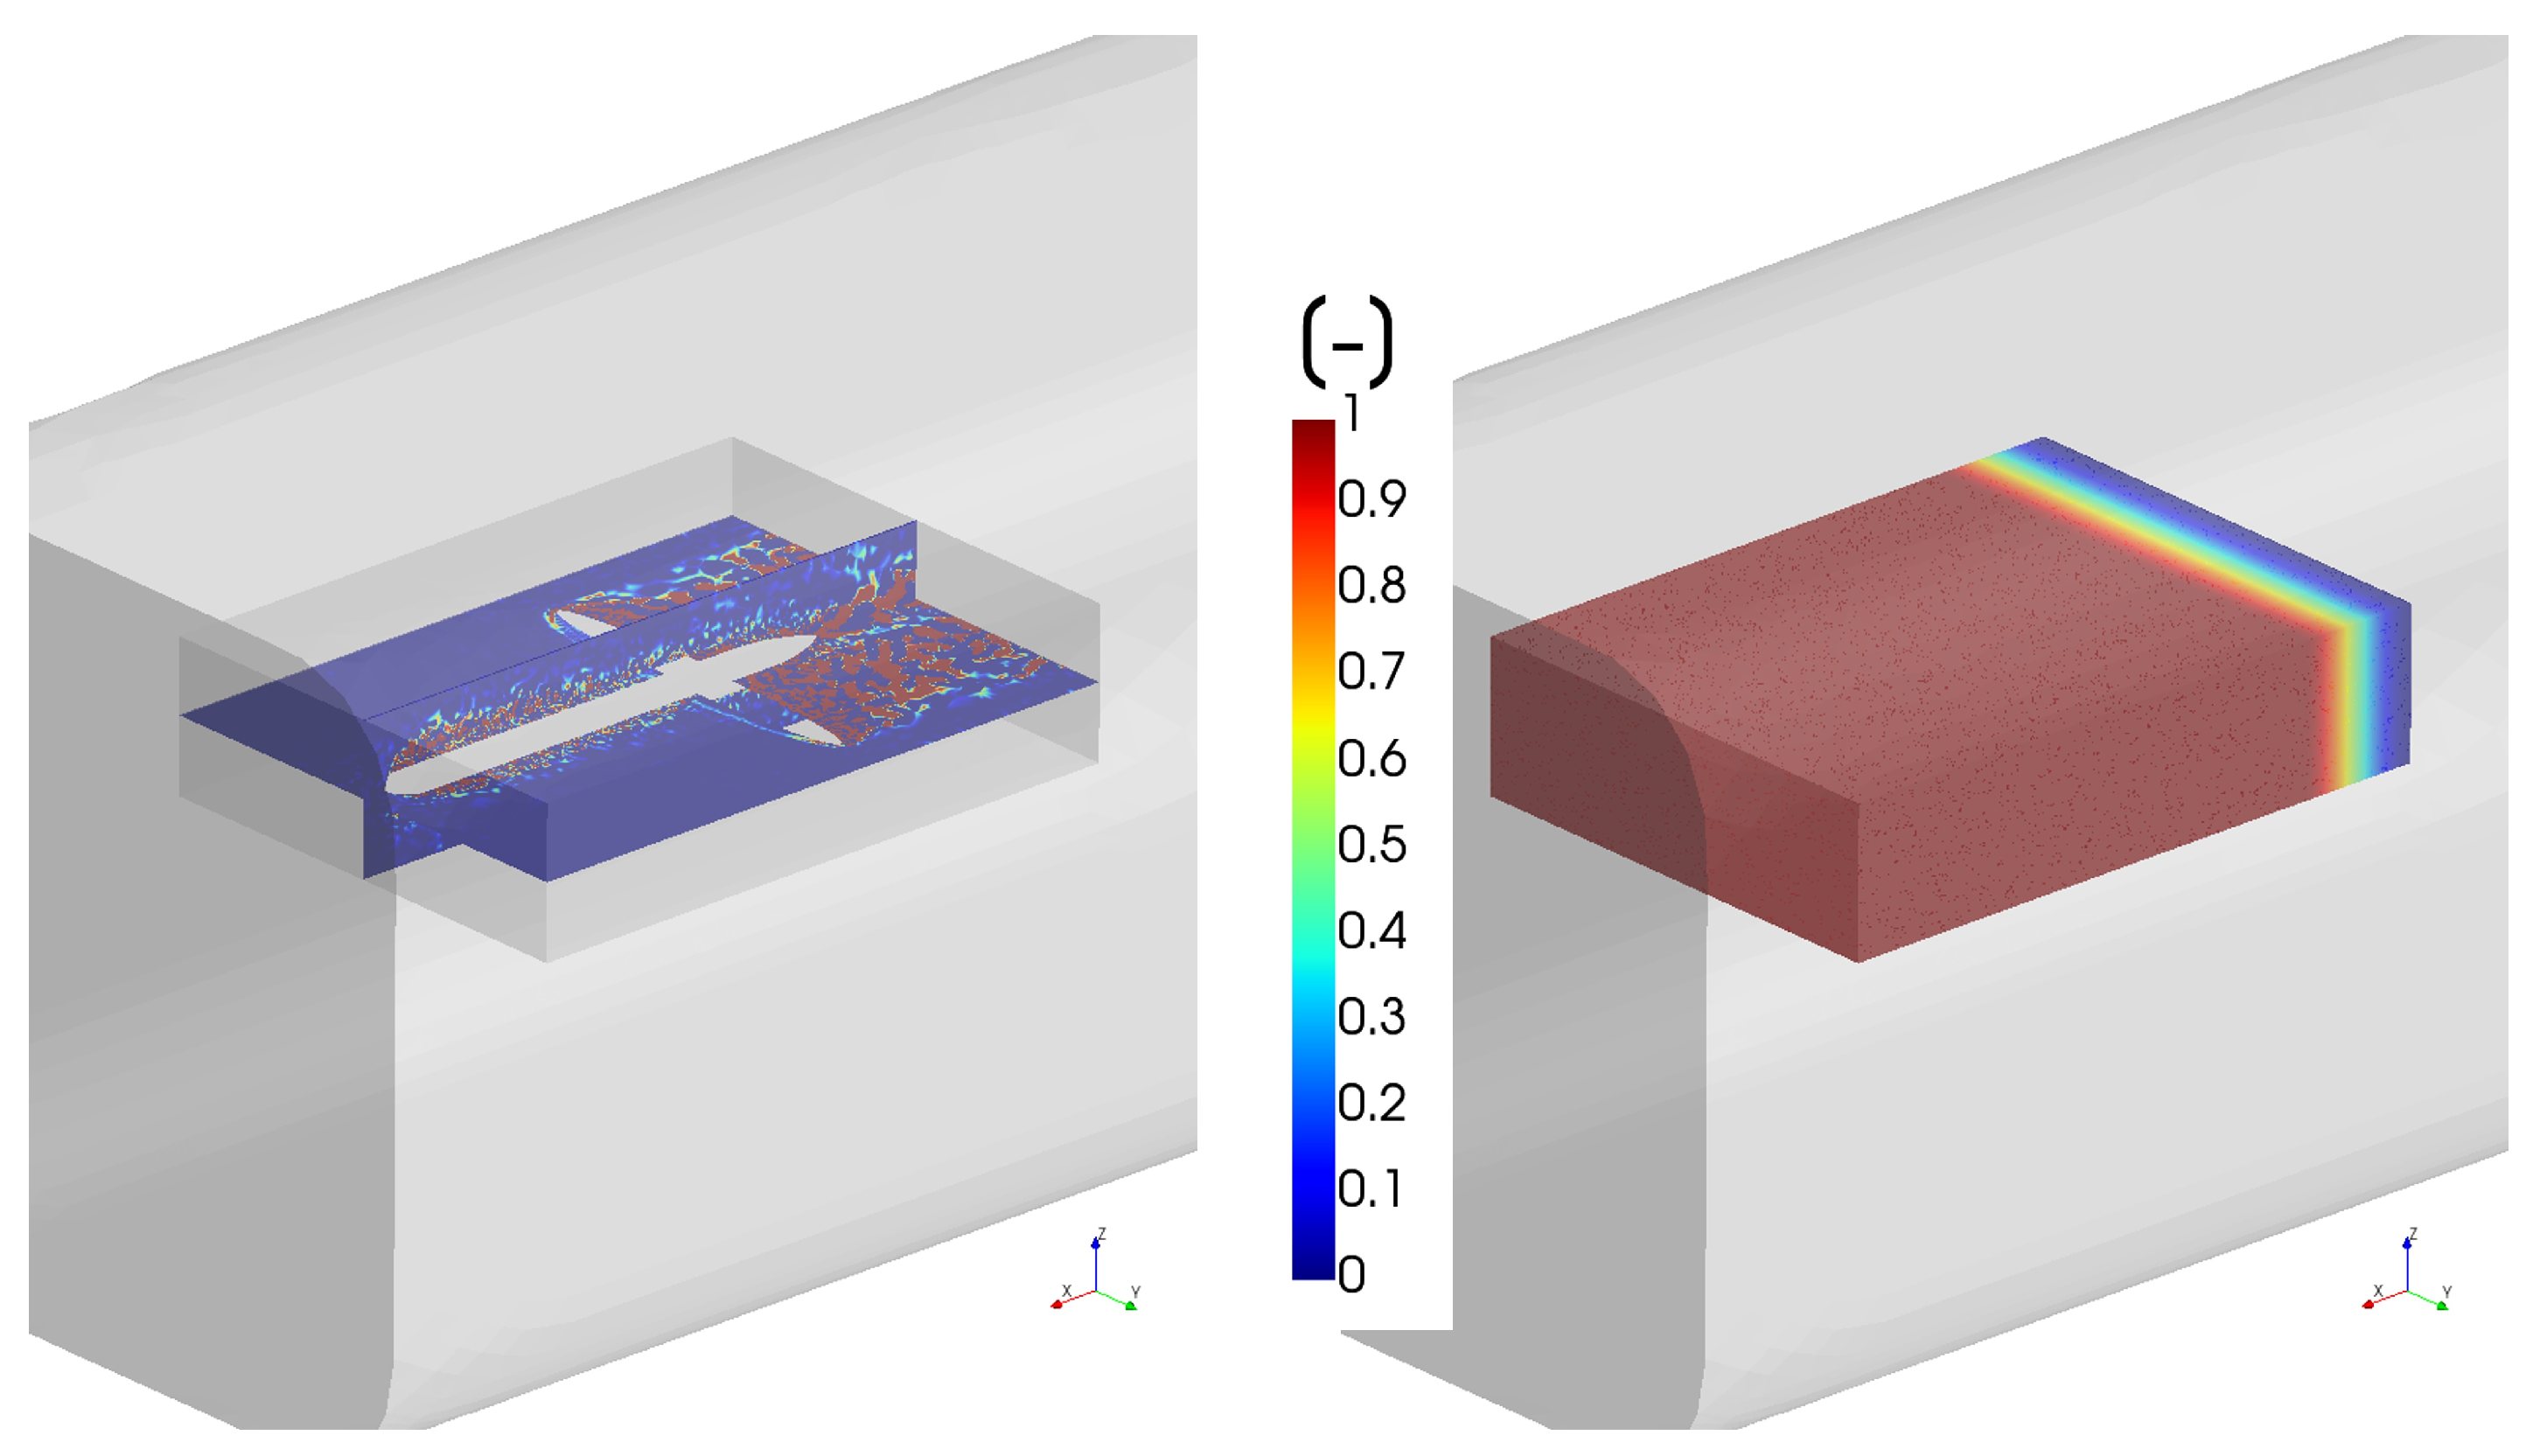
The acoustic analysis is able to capture noise signals at frequencies ranging from f min = 20 Hz (due to the CFD–CHA simulation time of 0.2 s) and f max = 2.5 kHz (imposed by the Nyquist criterion for a CFD time step of 0.2 ms). The quality of the CFD grid affects the mesh cut-off frequency, that is, the maximum hydroacoustic excitation frequency, according to f M C = A k α ε β ( Δ x ) γ , (Bailly and Juve [73], Bechara et al. [74]). Here, A is a constant, typically set to 1; k is the turbulent kinetic energy; ε is the turbulent dissipation rate (in the k ω turbulence model, ε = 0.09 ω k ); Δ x is the element size in the CFD mesh; and α , β , and γ are constants that can be derived from a dimensional analysis. For the VOF simulation of the cavitator in steady condition, the colour map of Figure 26 shows the mesh frequency cut-off distribution associated with a coarse mesh. f M C is of the order of a few hundred Hz in the wake field and approximately 1000–2000 Hz close to the wing; a limit of 3000 Hz is chosen for noise analysis in the cavitation tunnel and free-field conditions. Moreover, to avoid nonphysical noise due to the truncation of the wake structure at the end of the CFD domain, a spatial filter is applied to smoothly damp the downstream vortices; otherwise, they are sharply cut. Specifically, at each node of the acoustic mesh, the sources of noise are multiplied by a factor ranging from one (at 0.83 c m a x from the final section of the domain, c m a x being the maximum chord of the wing) to zero at the end of the CFD mapping domain (see Figure 27).
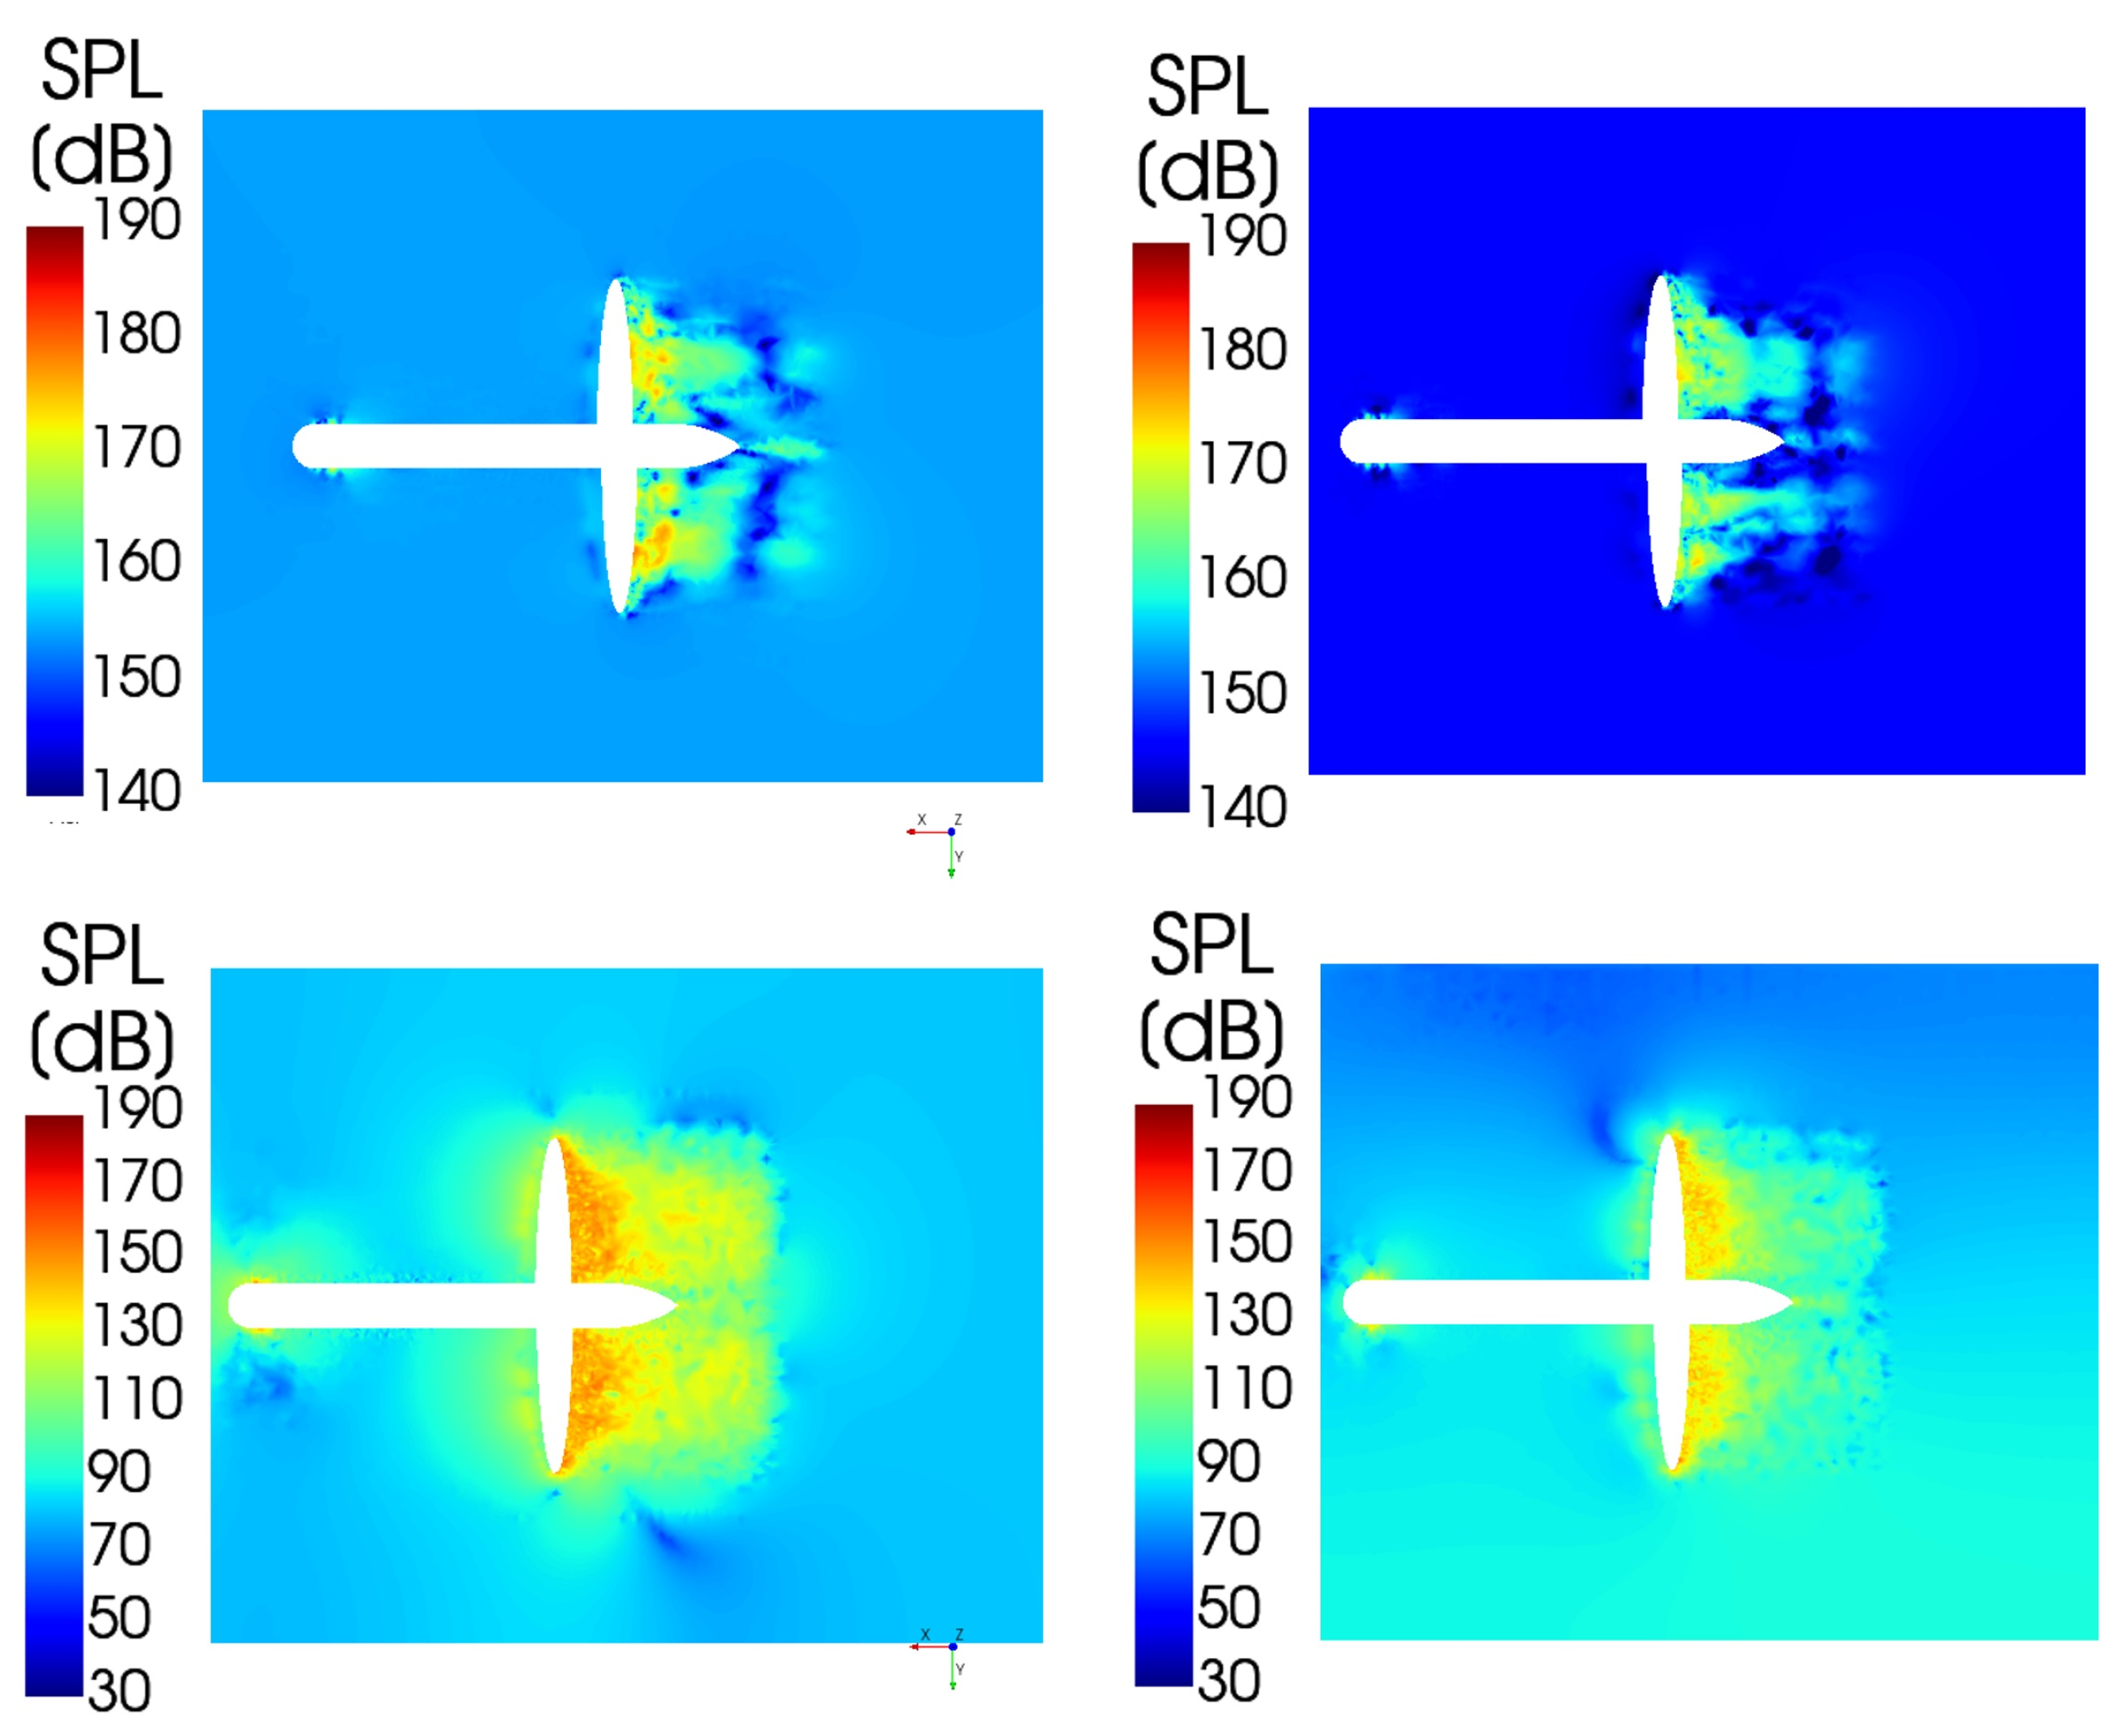
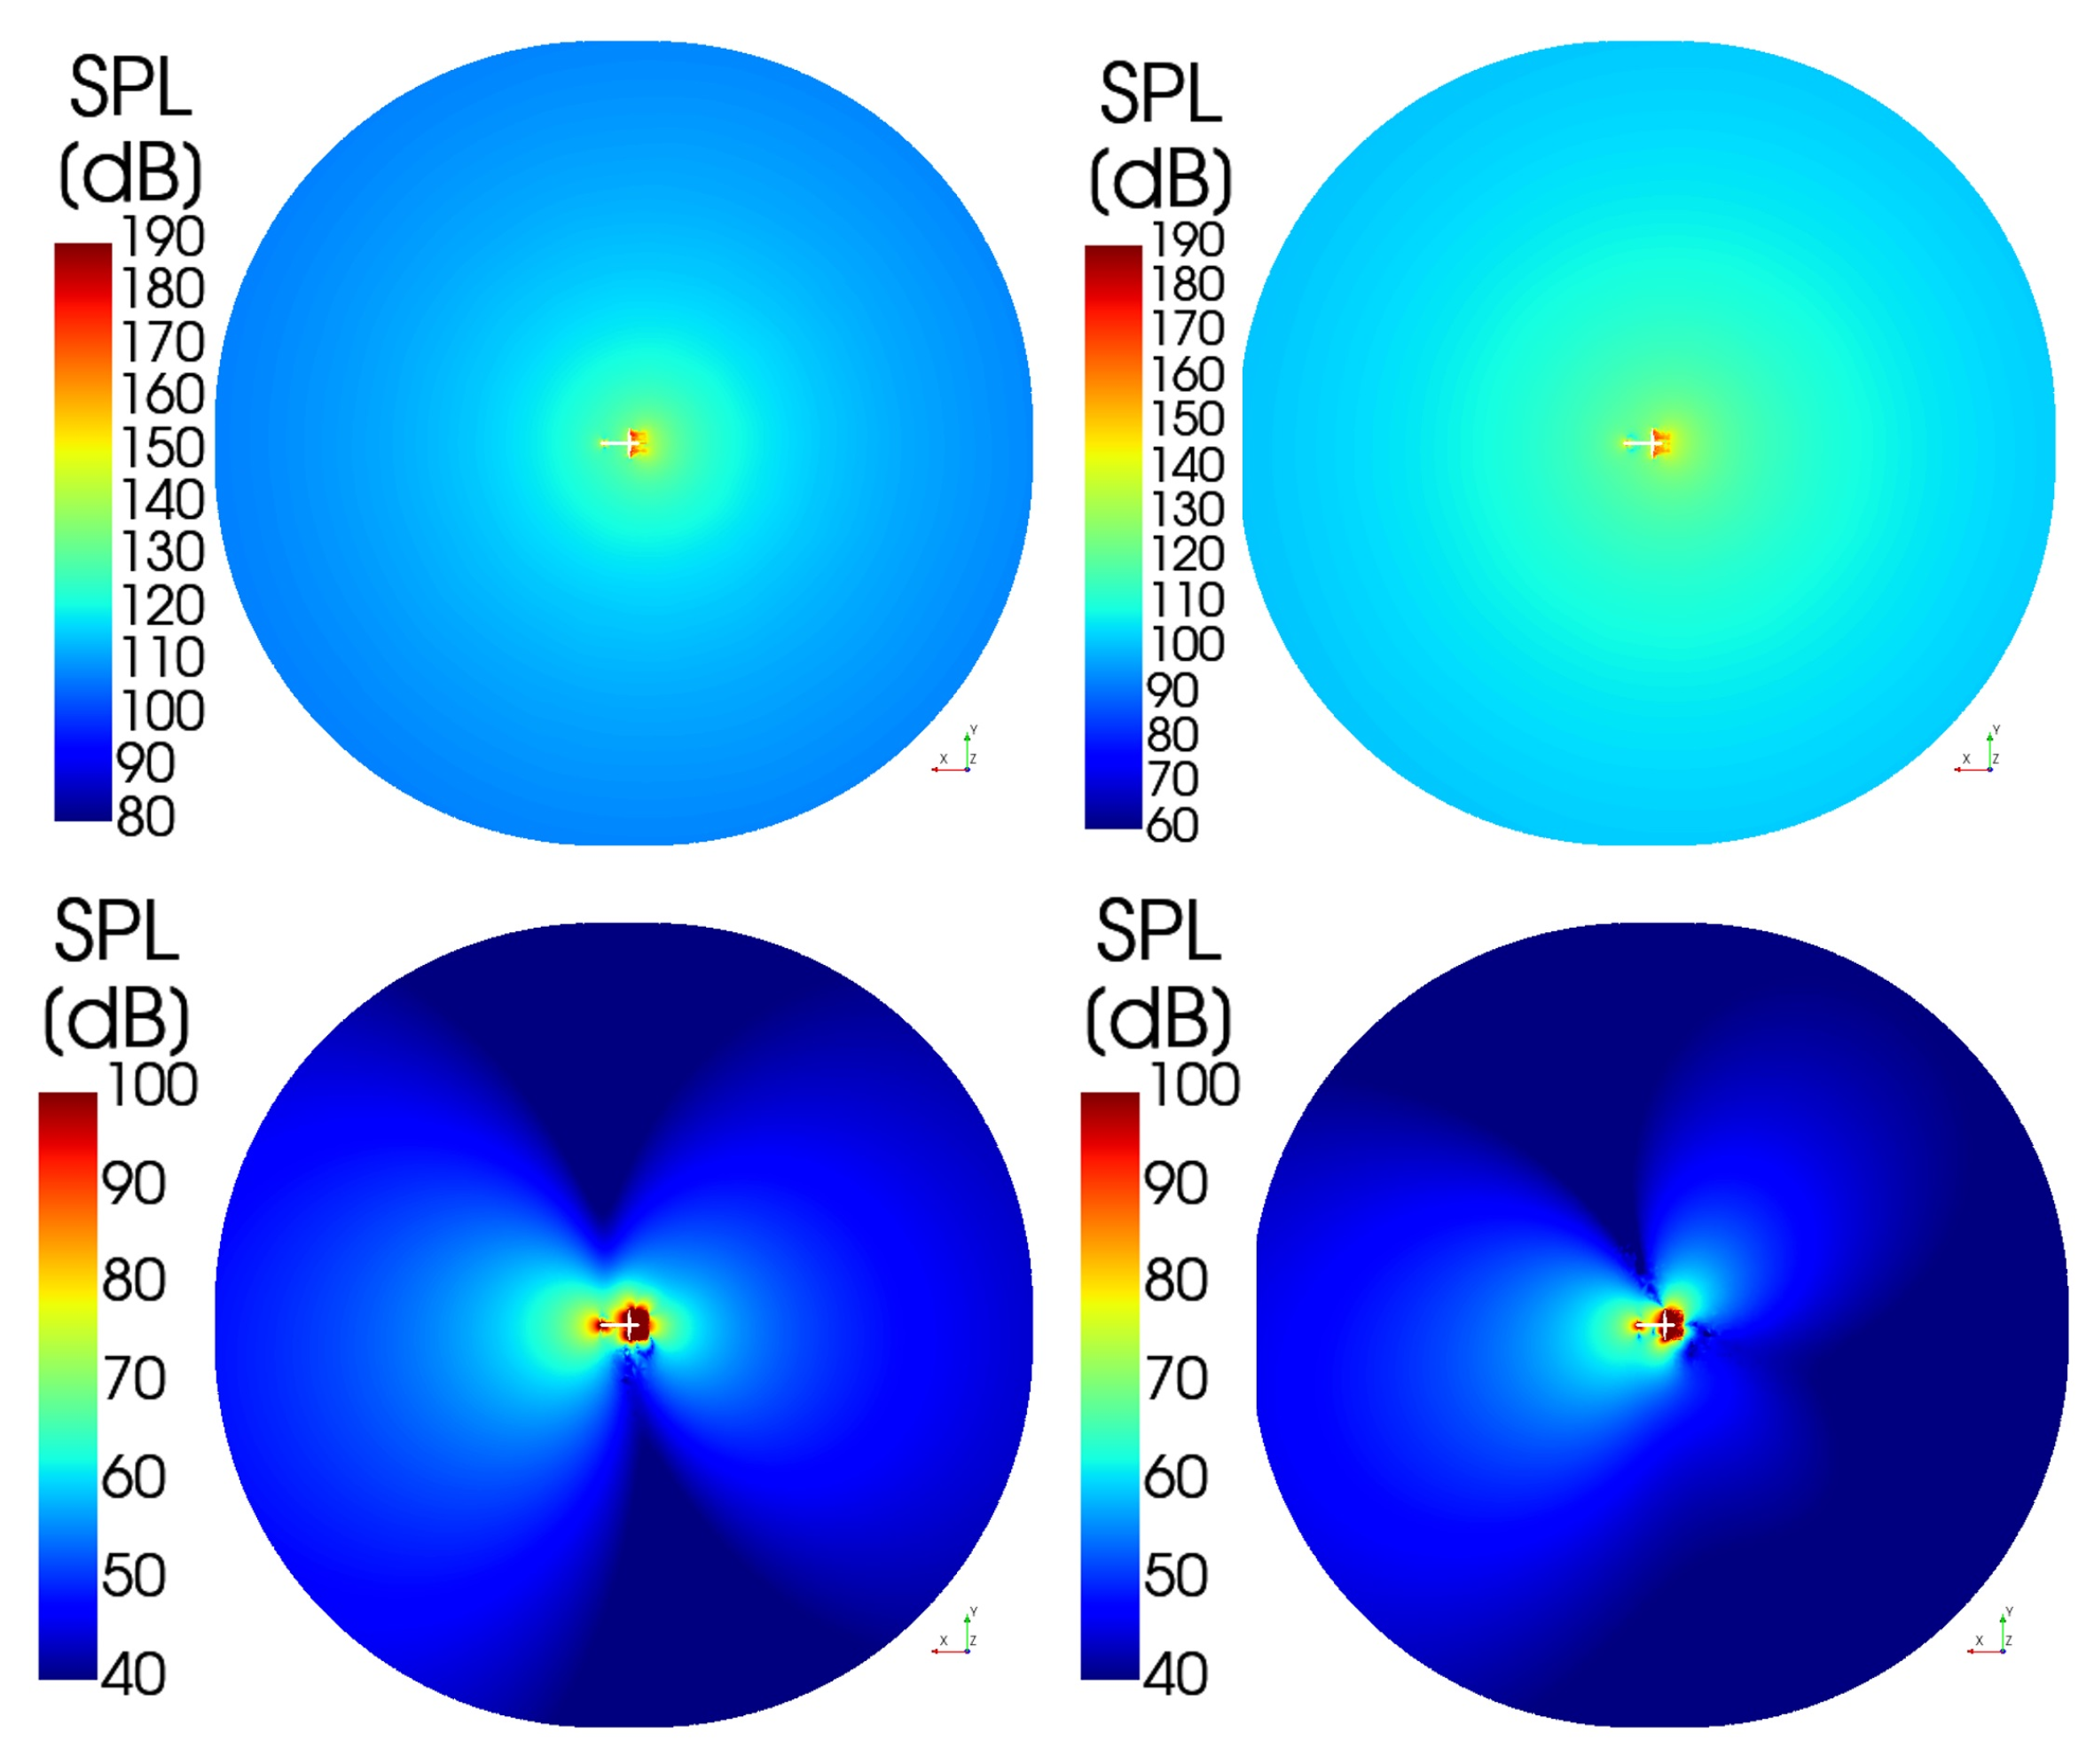
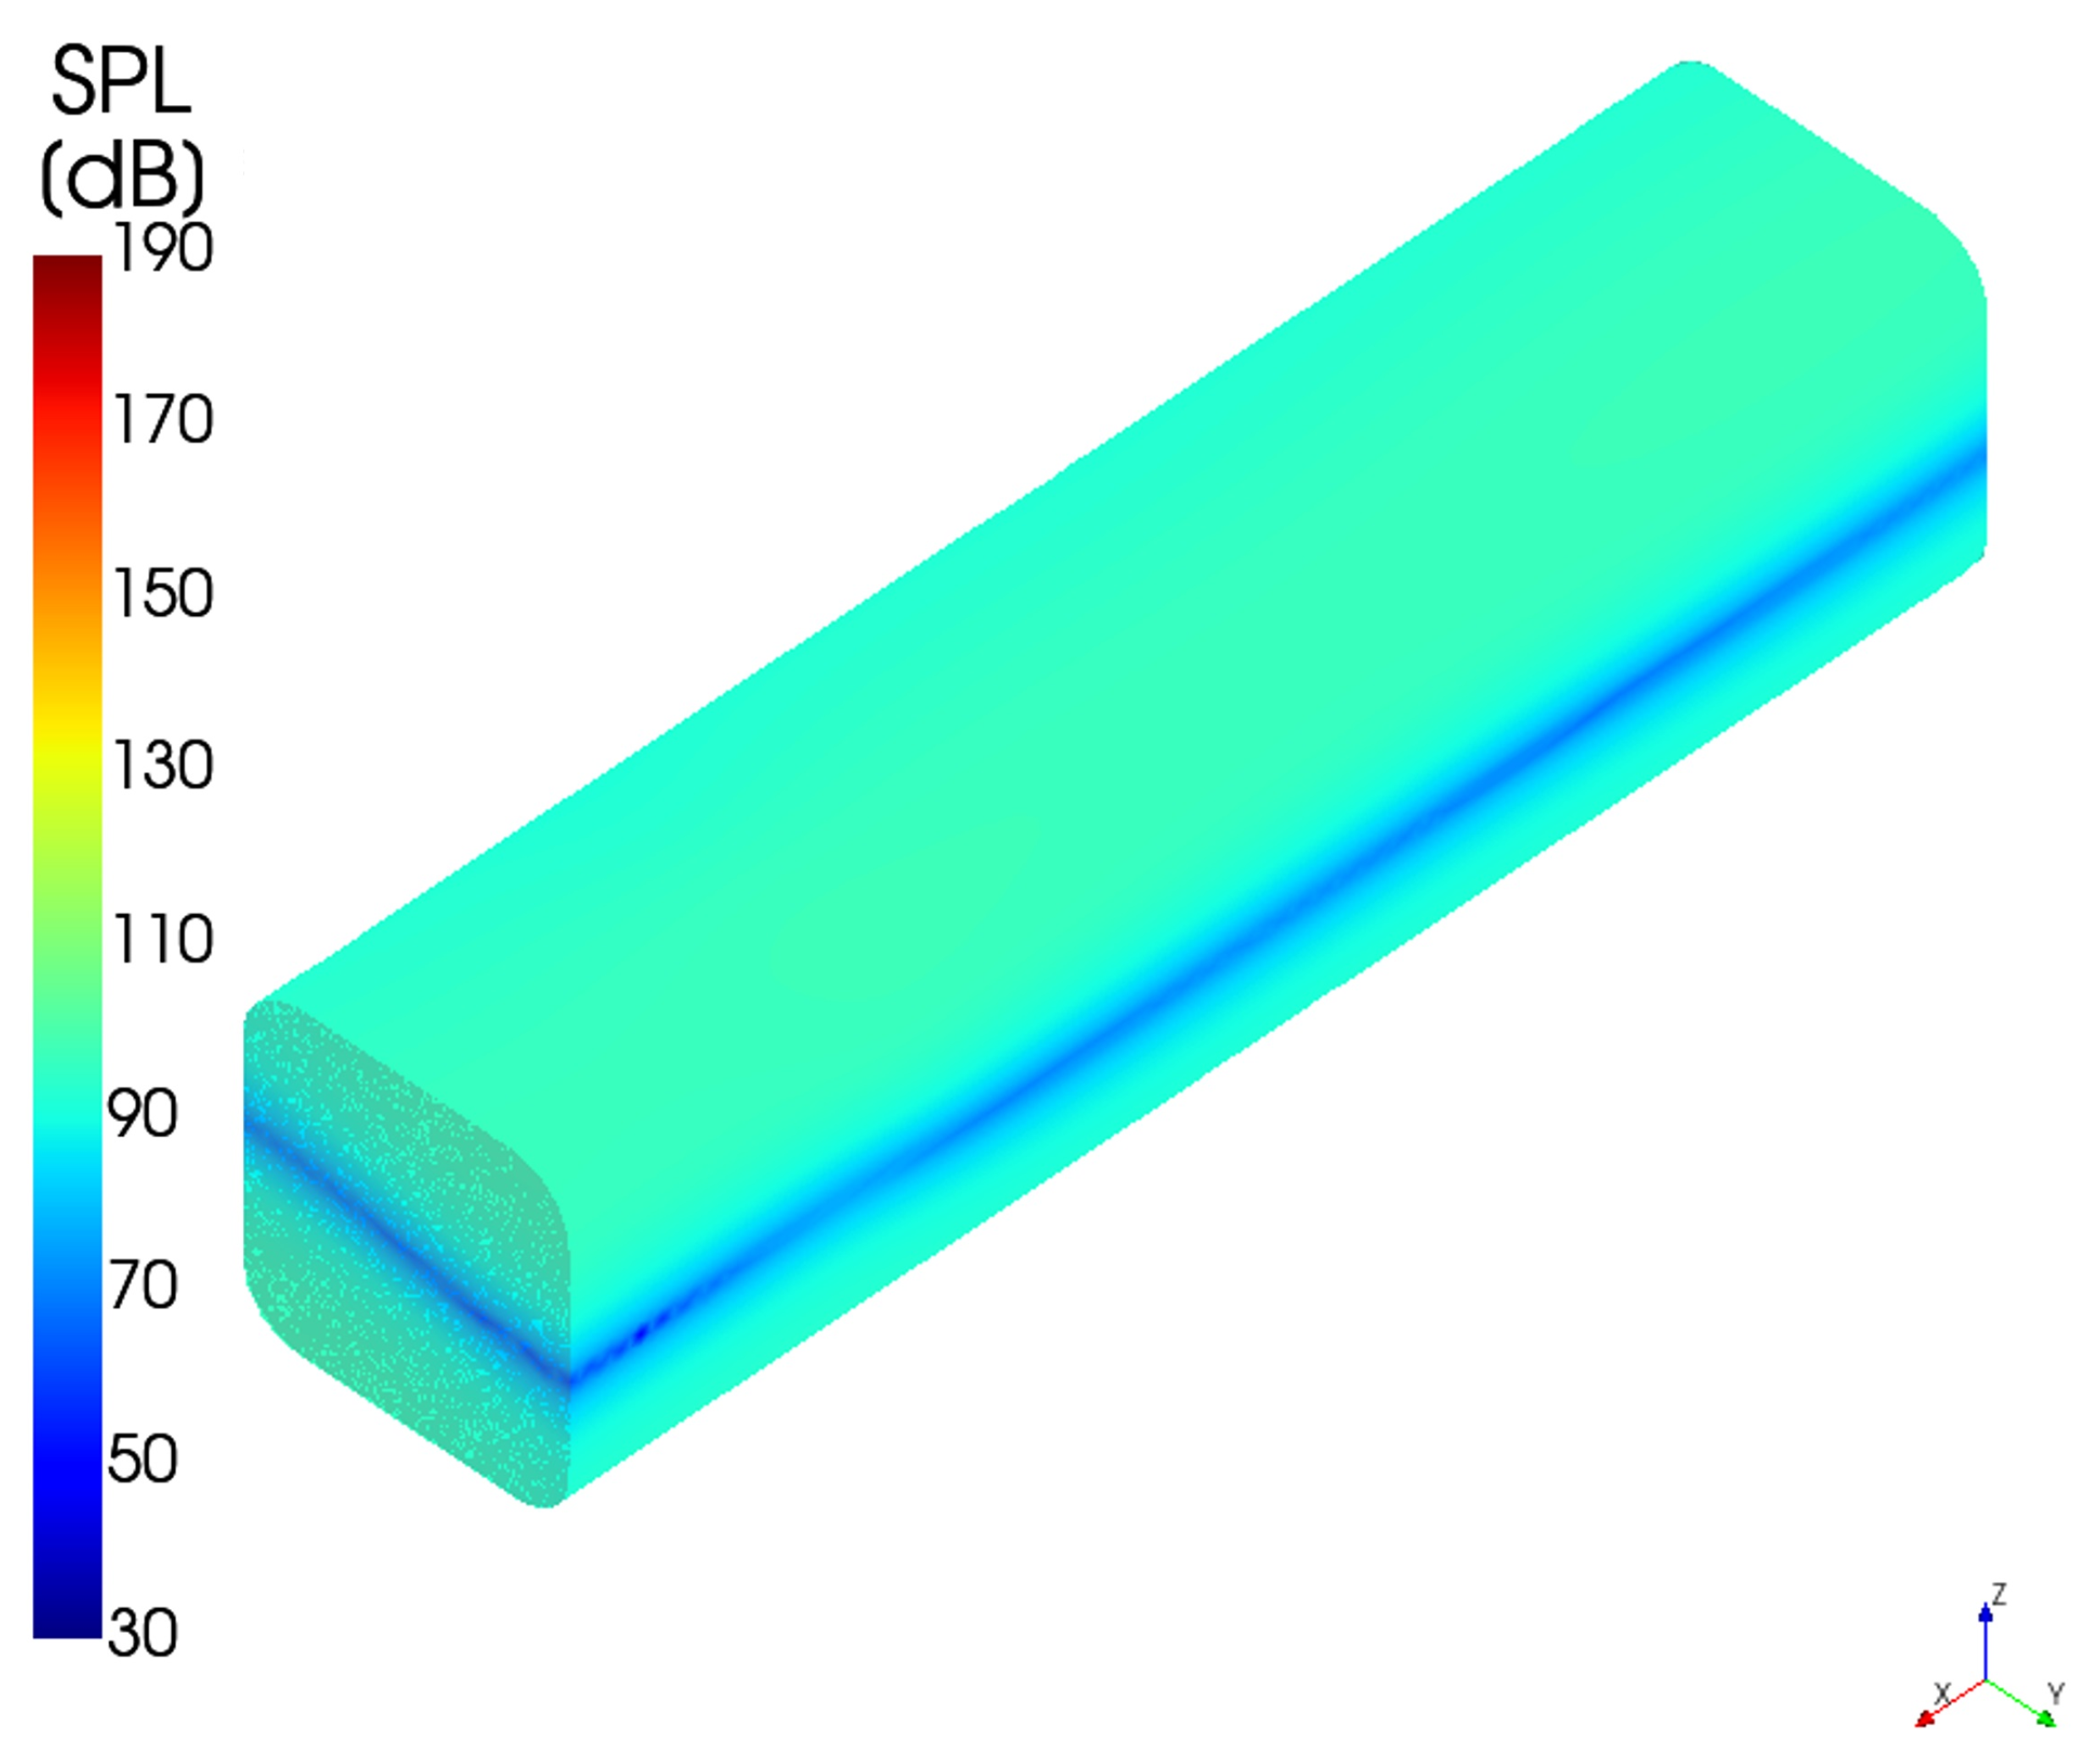
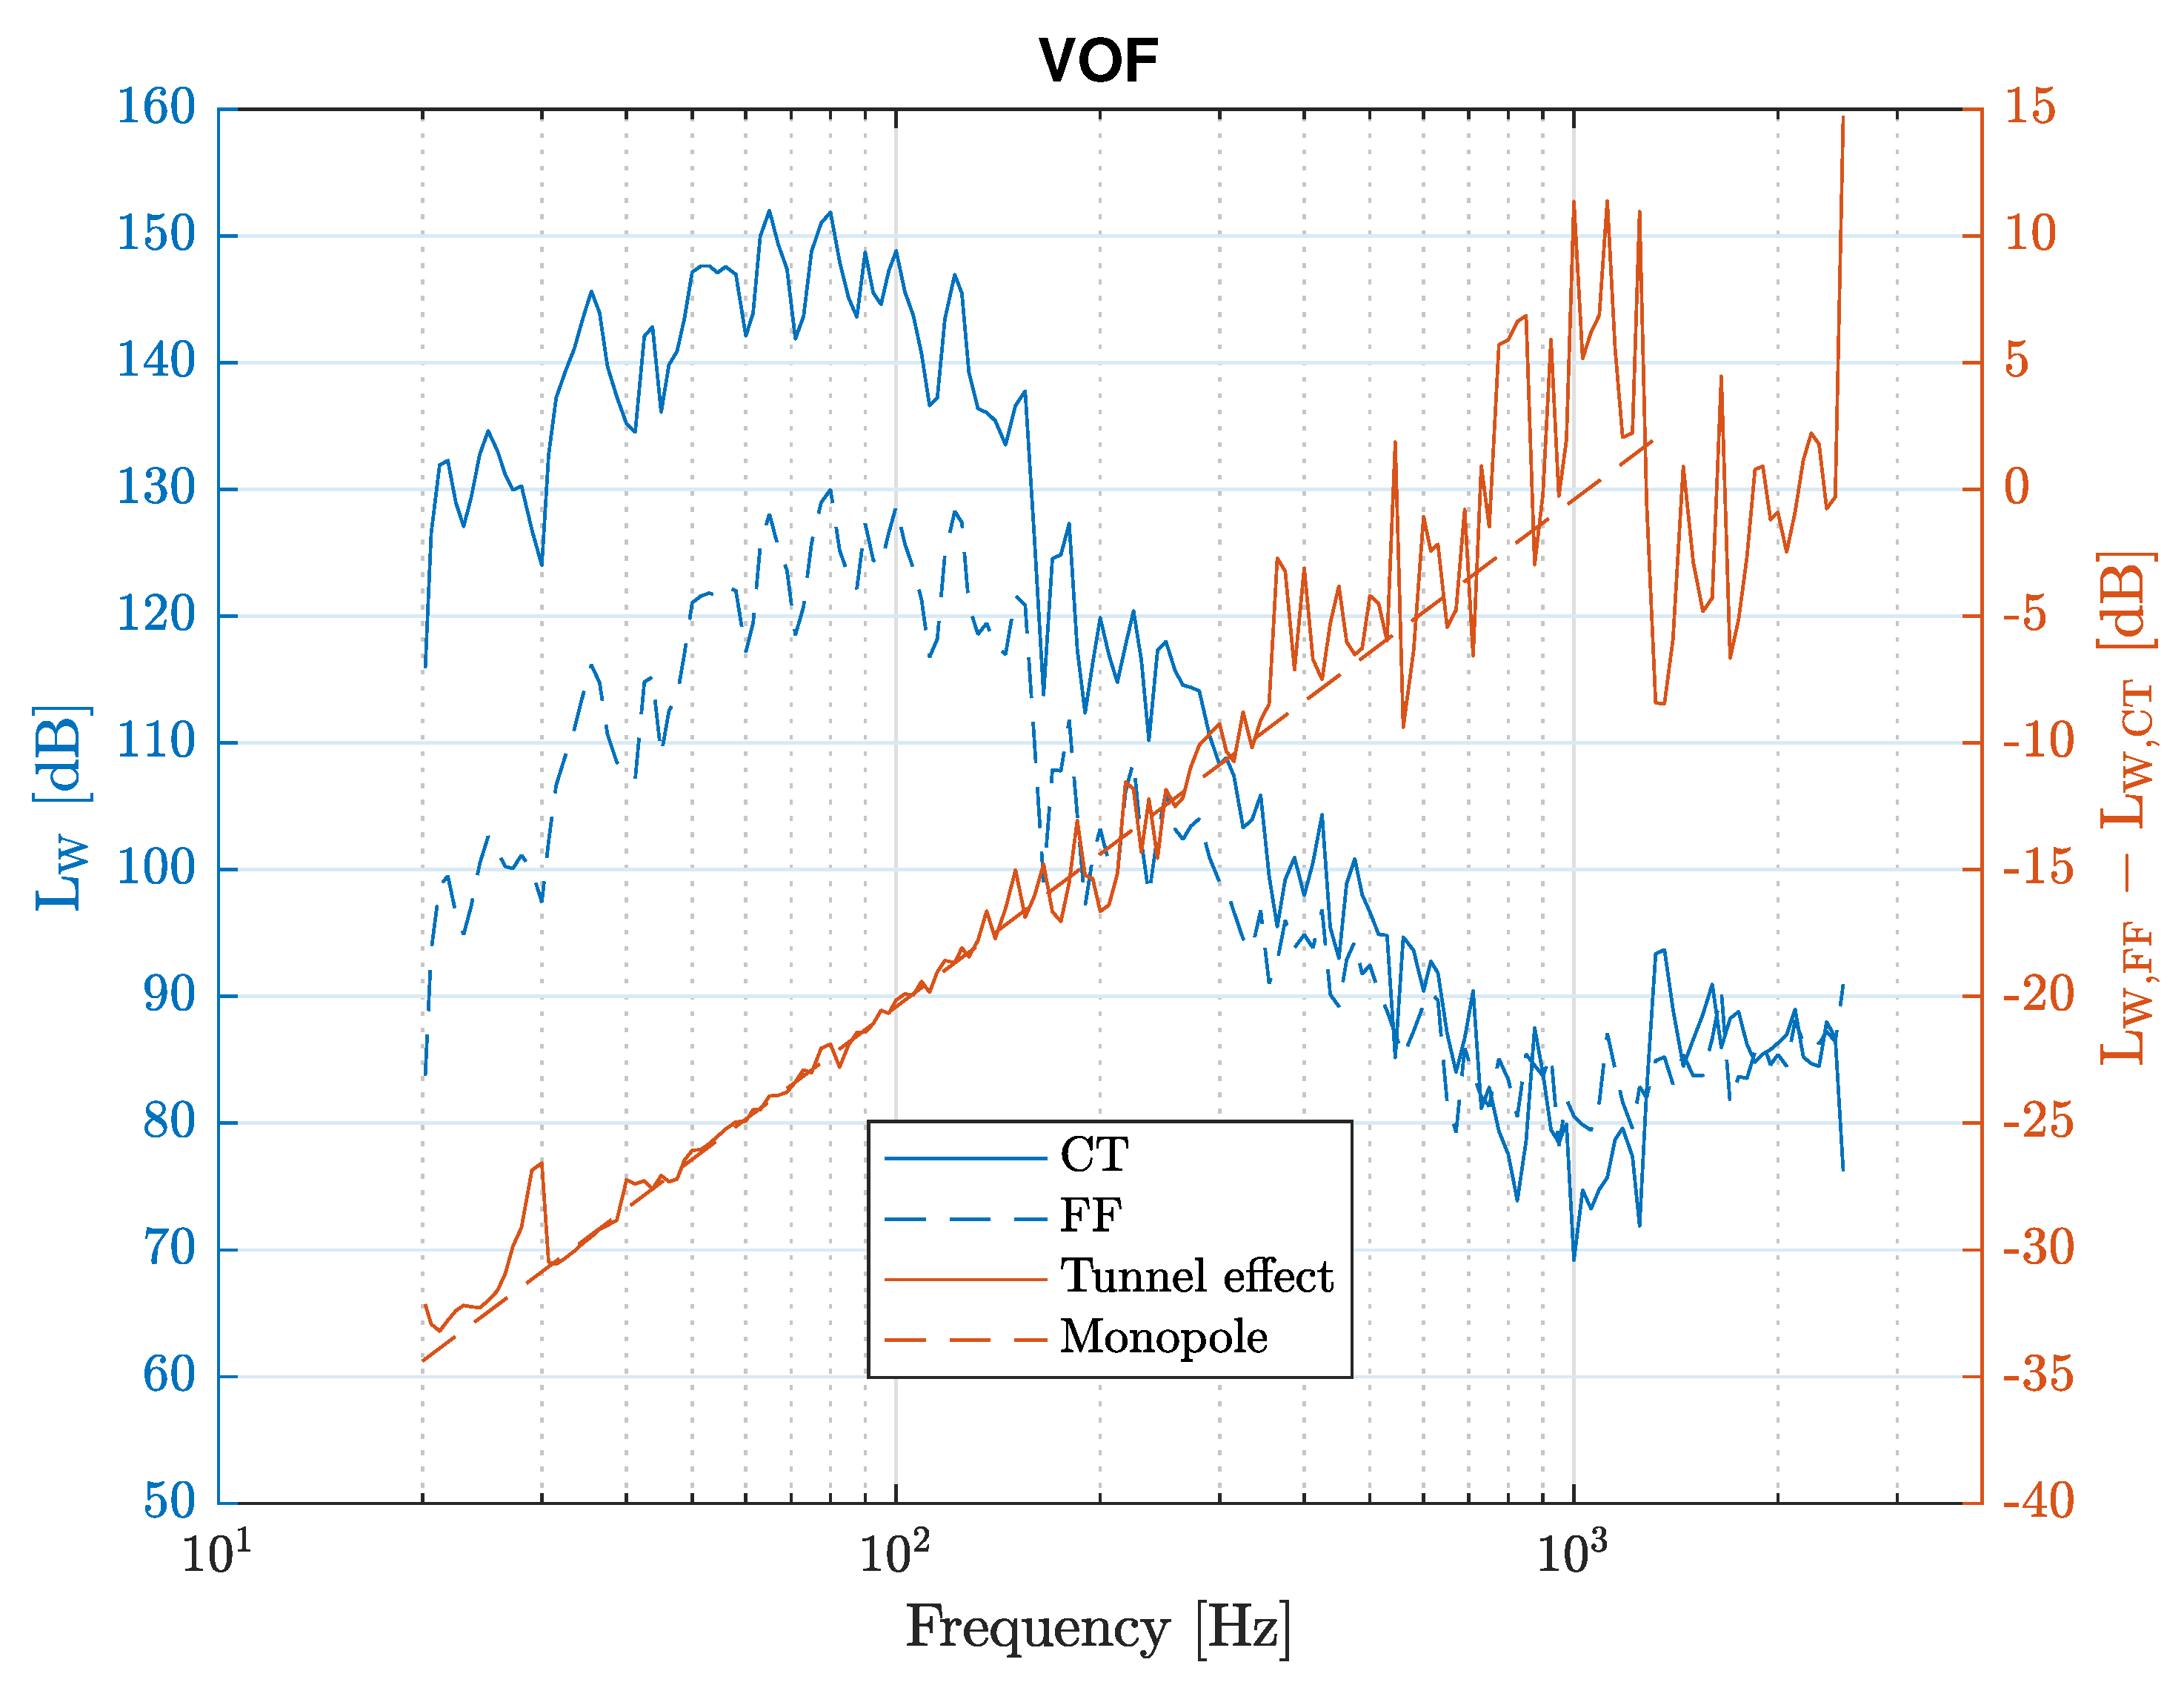
Sound pressure level contours in the cavitation tunnel and in the free-field condition are shown in Figure 28 and Figure 29, respectively, for the VOF-based simulation at selected frequencies. It is notable how the pressure distribution deviates from the spherical spreading. For the sake of completeness, the acoustic pressure on the walls (approximately) at 1300 Hz is shown in Figure 30, where variations are emphasised by cutting off the higher-order acoustic modes in the tunnel. Note the occurrence of differences up to 70 dB between the nodal plane and the rest of the tunnel. Sound power levels for the cavitator test case in the cavitation tunnel (CT) and the free field (FF) are shown in Figure 31 and Figure 32, along with correction effects due to computations and monopole-based analytical solution 10 l g ( 2 π A ( f / c 0 ) 2 ) (see Equations (18) and (19)). It is shown that CHA based on VOF and EE CFD yields corrections that match the monopole-based curve well, at least up to 200 Hz. Out of this range, the correction terms oscillate past the analytical solution. In addition, such figures highlight that higher sound power levels are predicted by the EE modelling below (approximately) 30 Hz, whereas values of 20 dB higher are found by the VOF formulation in the range [50, 100] Hz.
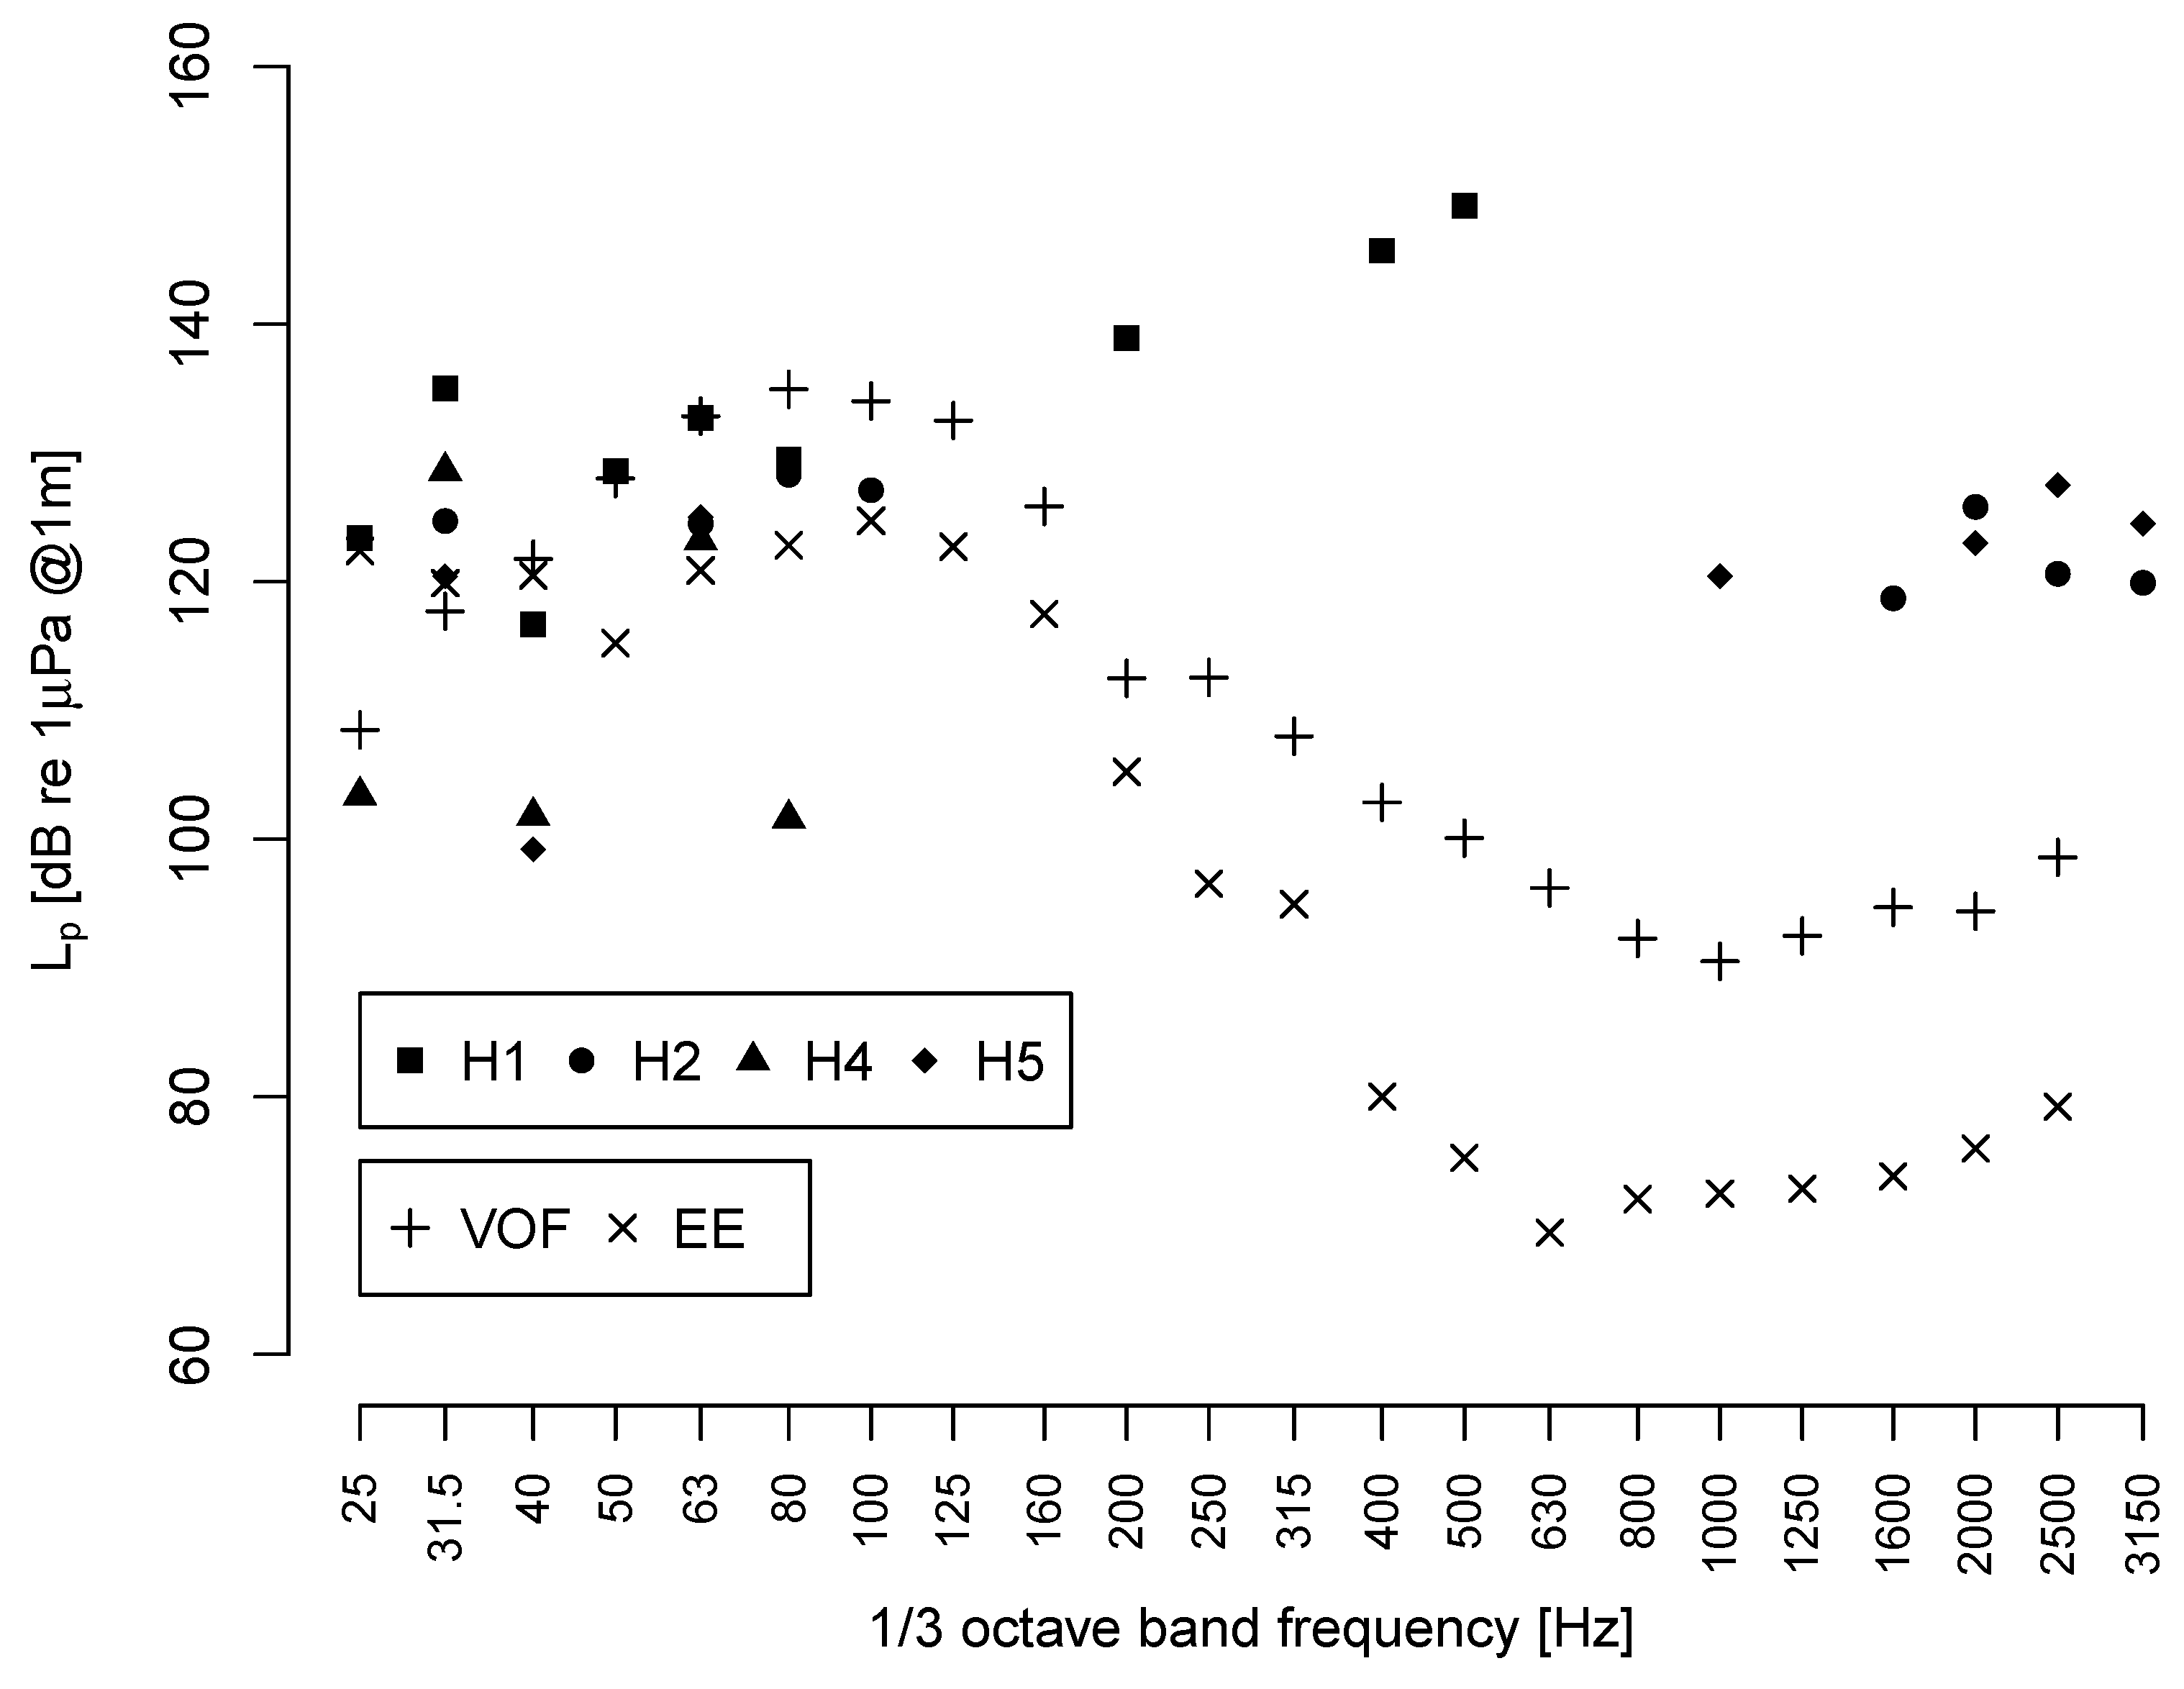
The performance of the corrections herein identified are verified by comparing numerical results and experimental outcomes carried out at the SVA model basin (see Figure 33), following the lay-out shown in Figure 5 (refer to Table 2 for the hydrophone placement). Experimental signals at each hydrophone are labelled by filled symbols; due to high level of background noise, signatures from hydrophones transversal to the flow (namely, H3 and H6) are not shown. As can be seen from Figure 33, some hydrophones give results only at the very lowest frequencies, whereas high-frequency results are best captured using some other hydrophones. The deviation is largest (approximately 30 dB) at the one-third octave band frequency of 80 Hz. In addition, results are missing at some one-third octave bands. As discussed in this paper, there are several challenges concerning the cavitation tunnel noise measurements, i.e., the assumption of the spherical or cylindrical spreading and the estimated cavitation tunnel environment correction.
In one-third octave bands, equivalent sound pressure levels are defined by the FF predictions of Figure 31 and Figure 32, modified by the correction terms. Although VOF-based results are slightly higher than the EE-based ones above the 31.5 Hz band, both predictions remain within the range of measurements up to the 100 Hz band. For higher frequencies, discrepancies are notable; a poor agreement is ascribable to unmodelled phenomena occurring in cavitation tunnel noise measurements as well as to the rough assumptions made in using Equation (1) to convert sound power into equivalent sound pressure level. However, the good correlation up to 100 Hz confirms that the numerical procedure assessed in this investigation can be fruitfully used to identify physically consistent cavitation tunnel corrections.

4. Conclusions

In this paper, cavitation phenomena and noise predictions of an ITTC standard cavitator operating inside a cavitation tunnel are investigated to define consistent cavitation tunnel measurement corrections for background noise, walls reflections, and distance normalisation. In order to highlight the main uncertainties in noise measurements, the risk of local structural resonances (which might potentially interfere with measurements) was first investigated using an FEM analysis of a window-like structure excited by a diffuse acoustic field inside the tunnel. In addition, the acoustic effects related to the type/directivity of the noise source(s) determined by an FEM model of the acoustic cavity are discussed. Next, using homogeneous VOF and inhomogeneous EE multiphase CFD modelling, cavitator hydrodynamics are predicted. The comparison between these CFD approaches shows a very good level of agreement in terms of vapour zone extension and lift coefficients: turbulence modelling affects flow field features and cavitation dynamics, and a scale-resolving approach is required to capture transient flow and cavitation structures well.
The solution of Lighthill’s acoustic analogy, within the framework of an FEM approach, allowed the elasticity of boundaries geometry to be properly taken into account. The numerical–experimental comparison with the results carried out in the SVA model basin shows that the equivalent sound pressure levels defined from the free-field computations, modified by tunnel corrections, stay within the range of measurements up to 100 Hz (one-third octave bands are used), whereas relevant discrepancies arise for higher frequencies.
The poor agreement in the higher frequencies is due to the unmodelled phenomena occurring in cavitation tunnel noise measurements, as well as to the rough assumptions made in the conversion of sound power into an equivalent sound pressure level. Thus, additional investigation are required to define an enhanced equivalent pressure level for higher frequencies. Despite this drawback, the good level of accuracy up to 100 Hz confirms that the numerical procedure assessed herein can be fruitfully used to identify physically consistent cavitation tunnel corrections.

Supplementary Materials

The following supporting information can be downloaded at: https://www.mdpi.com/article/10.3390/jmse11040820/s1. Video S1: S1_VOF_EE_simulations_cavitation_dynamics.mp4, corresponding to snapshots shown in Figure 18; Video S2: S2_EE_simulations_cavitation_dynamics_vapour_diameter.mp4, corresponding to snapshots shown in Figure 19; Video S3: S3_VOF_EE_simulations_acoustic_sources.mp4, corresponding to snapshots shown in Figure 25.

Author Contributions

A.H. conducted the cavitation tunnel and free-field hydroacoustic simulations of the ITTC standard cavitator and performed the underwater radiated noise analyses. V.V. conducted the computational multiphase flow simulations of the cavitator and analysed the cavitation phenomena and the related acoustic source terms. J.T. conducted the vibroacoustic cavitation tunnel simulations and studied the sound generation mechanisms. R.K. conducted the cavitator noise measurements. C.T. commented on and supervised the paper. J.M. administrated the project. All authors participated in the writing of the paper. All authors have read and agreed to the published version of the manuscript.

Funding

This research was funded by the VTT Technical Research Centre of Finland Ltd. and Business Finland as part of the ModProp project.

Institutional Review Board Statement

Not applicable.

Informed Consent Statement

Not applicable.

Data Availability Statement

Not applicable.

Acknowledgments

The authors wish to acknowledge VTT’s HPC cluster (“The Doctor”) and CSC—IT Center for Science, Finland, for computational resources.

Conflicts of Interest

The authors declare no conflict of interest.

Abbreviations

The following abbreviations are used in this manuscript:
CFDComputational Fluid Dynamics
CHAComputational Hydroacoustics
DNSDirect Numerical Simulation
EEEuler-Euler
FEMFinite Element Method
FFTFast Fourier Transform
FWHFfowcs-Williams Hawkings
ITTCInternational Towing Tank Conference
LESLarge Eddy Simulation
NACANational Advisory Committee for Aeronautics
RANSReynolds-Averaged Navier–Stokes
SASScale-Adaptive Simulation
SPLSound Pressure Level
SLSource Level
SSTShear Stress Transport
URNUnderwater Radiated Noise
VOFVolume of Fluid

References

  1. Bark, G.; Van Berlekom, W.B. Experimental Investigations of Cavitation Dynamics and Cavitation Noise; Swedish State Shipbuilding Experimental Tank: Goeteborg, Sweden, 1979. [Google Scholar]
  2. Doolan, C.; Brandner, P.; Butler, D.; Pearce, B.; Moreau, D.; Brooks, L. Hydroacoustic characterisation of the AMC cavitation tunnel. In Acoustics 2013 Victor Harbor: Science, Technology and Amenity; Australian Acoustical Society: Perth, Australia, 2013; pp. 1–7. [Google Scholar]
  3. Felli, M. Noise measurements techniques and hydrodynamic aspects related to cavitation noise. In HydroTesting Alliance HTA; Sustainable Surface Transport Project 31316; European Commission: Brussels, Belgium, 2011. [Google Scholar]
  4. Jeona, J.; Joob, W. Prediction of propeller radiated noise by onboard measurement. In Proceedings of the UA2014 2nd Underwater Acoustics Conference and Exhibition, Rhodes, Greece, 22–27 June 2014; pp. 667–674. [Google Scholar]
  5. Tani, G.; Viviani, M.; Hallander, J.; Johansson, T.; Rizzuto, E. Propeller underwater radiated noise: A comparison between model scale measurements in two different facilities and full scale measurements. Appl. Ocean Res. 2016, 56, 48–66. [Google Scholar] [CrossRef]
  6. Tani, G.; Viviani, M.; Felli, M.; Lafeber, F.H.; Lloyd, T.; Aktas, B.; Atlar, M.; Turkmen, S.; Seol, H.; Hallander, J.; et al. Noise measurements of a cavitating propeller in different facilities: Results of the round robin test programme. Ocean Eng. 2020, 213, 107599. [Google Scholar] [CrossRef]
  7. ISO-5136:2003; Acoustics—Determination of Sound Power Radiated into a Duct by Fans and Other Air-moving Devices—In-duct Method. ISO: Geneva, Switzerland, 2003.
  8. International Towing Tank Conference. Model Scale Propeller Cavitation Noise Measurements; ITTC Association: Zürich, Switzerland, 2017. [Google Scholar]
  9. Vér, I.L.; Beranek, L.L. Noise and Vibration Control Engineering: Principles and Applications; John Wiley & Sons: Hoboken, NJ, USA, 2005. [Google Scholar]
  10. Ge, M.; Svennberg, U.; Bensow, R. Investigation on RANS prediction of propeller induced pressure pulses and sheet-tip cavitation interactions in behind hull condition. Ocean Eng. 2020, 209, 107503. [Google Scholar] [CrossRef]
  11. Li, Z.; Qian, Z.; Ji, B. Transient cavitating flow structure and acoustic analysis of a hydrofoil with whalelike wavy leading edge. Appl. Math. Model. 2020, 85, 60–88. [Google Scholar] [CrossRef]
  12. Lidtke, A.; Lloyd, T.; Lafeber, F.H.; Bosschers, J. Predicting cavitating propeller noise in off-design conditions using scale-resolving CFD simulations. Ocean Eng. 2022, 254, 111176. [Google Scholar] [CrossRef]
  13. Sedlář, M.; Krátkỳ, T.; Komárek, M.; Vyroubal, M. Numerical Analysis and Experimental Investigation of Cavitating Flows Considering Thermal and Compressibility Effects. Energies 2022, 15, 6503. [Google Scholar] [CrossRef]
  14. Biçer, B.; Sou, A. Application of the improved cavitation model to turbulent cavitating flow in fuel injector nozzle. Appl. Math. Model. 2016, 40, 4712–4726. [Google Scholar] [CrossRef]
  15. Ghahramani, E.; Jahangir, S.; Neuhauser, M.; Bourgeois, S.; Poelma, C.; Bensow, R. Experimental and numerical study of cavitating flow around a surface mounted semi-circular cylinder. Int. J. Multiph. Flow 2020, 124, 103191. [Google Scholar] [CrossRef]
  16. Asnaghi, A.; Svennberg, U.; Bensow, R. Large eddy simulations of cavitating tip vortex flows. Ocean Eng. 2020, 195, 106703. [Google Scholar] [CrossRef]
  17. Viitanen, V.M.; Hynninen, A.; Sipilä, T.; Siikonen, T. DDES of Wetted and Cavitating Marine Propeller for CHA Underwater Noise Assessment. J. Mar. Sci. Eng. 2018, 6, 56. [Google Scholar] [CrossRef] [Green Version]
  18. Viitanen, V.; Peltola, J. Hydrodynamic cavitation investigations with homogeneous and inhomogeneous multiphase flow models in OpenFOAM context. In Proceedings of the 11th International Symposium on Cavitation, Daejeon, Republic of Korea, 10–13 May 2021. [Google Scholar]
  19. Ainslie, M.A.; Morfey, C.L. “Transmission loss” and “propagation loss” in undersea acoustics. J. Acoust. Soc. Am. 2005, 118, 603–604. [Google Scholar] [CrossRef]
  20. Niedźwiedzka, A.; Schnerr, G.H.; Sobieski, W. Review of numerical models of cavitating flows with the use of the homogeneous approach. Arch. Thermodyn. 2016, 37, 71–88. [Google Scholar] [CrossRef]
  21. Luo, X.; Ji, B.; Tsujimoto, Y. A review of cavitation in hydraulic machinery. J. Hydrodyn. 2016, 28, 335–358. [Google Scholar] [CrossRef]
  22. Asnaghi, A.; Svennberg, U.; Bensow, R. Analysis of tip vortex inception prediction methods. Ocean Eng. 2018, 167, 187–203. [Google Scholar] [CrossRef]
  23. Viitanen, V.; Siikonen, T.; Sánchez-Caja, A. Cavitation on Model-and Full-Scale Marine Propellers: Steady And Transient Viscous Flow Simulations At Different Reynolds Numbers. J. Mar. Sci. Eng. 2020, 8, 141. [Google Scholar] [CrossRef] [Green Version]
  24. Eskilsson, C.; Bensow, R.E. Estimation of Cavitation Erosion Intensity Using CFD: Numerical Comparison of Three Different Methods. In Proceedings of the Fourth International Symposium on Marine Propulsors (smp’15), Austin, TX, USA, 1–3 June 2015. [Google Scholar]
  25. Gnanaskandan, A.; Mahesh, K. Large eddy simulation of the transition from sheet to cloud cavitation over a wedge. Int. J. Multiph. Flow 2016, 83, 86–102. [Google Scholar] [CrossRef] [Green Version]
  26. Budich, B.; Schmidt, S.J.; Adams, N.A. Numerical Investigation of a Cavitating Model Propeller Including Compressible Shock Wave Dynamics. In Proceedings of the Fourth International Symposium on Marine Propulsors (smp’15), Austin, TX, USA, 1–3 June 2015. [Google Scholar]
  27. Asnaghi, A.; Feymark, A.; Bensow, R. Improvement of cavitation mass transfer modeling based on local flow properties. Int. J. Multiph. Flow 2017, 93, 142–157. [Google Scholar] [CrossRef]
  28. Shams, E.; Finn, J.; Apte, S. A numerical scheme for Euler–Lagrange simulation of bubbly flows in complex systems. Int. J. Numer. Methods Fluids 2011, 67, 1865–1898. [Google Scholar] [CrossRef]
  29. Hsiao, C.T.; Ma, J.; Chahine, G.L. Multiscale tow-phase flow modeling of sheet and cloud cavitation. Int. J. Multiph. Flow 2017, 90, 102–117. [Google Scholar] [CrossRef] [Green Version]
  30. Wang, z.; Li, L.; Li, X.; Zhu, Z.; Yang, S.; Yang, G. Investigation on multiscale features of cavitating flow in convergent-divergent test section using Eulerian-Lagrangian method. Int. J. Mech. Sci. 2022, 238, 107853. [Google Scholar] [CrossRef]
  31. Wang, Z.; Cheng, H.; Ji, B. Euler–Lagrange study of cavitating turbulent flow around a hydrofoil. Phys. Fluids 2021, 33, 112108. [Google Scholar] [CrossRef]
  32. Lidtke, A.; Turnock, S.; Humphrey, V. Multi-Scale Modelling of Cavitation-Induced Pressure around the Delft Twist 11 Hydrofoil. In Proceeding of the 31st Symposium on Naval Hydrodynamics, Monterey, CA, USA, 11–16 September 2016. [Google Scholar]
  33. Yakubov, S.; Cankurt, B.; Abdel-Maksoud, M.; Rung, T. Hybrid MPI/OpenMP parallelization of an Euler–Lagrange approach to cavitation modelling. Comput. Fluids 2013, 80, 365–371. [Google Scholar] [CrossRef]
  34. Edelbauer, W. Numerical simulation of cavitating injector flow and liquid spray break-up by combination of Eulerian–Eulerian and Volume-of-Fluid methods. Comput. Fluids 2017, 144, 19–33. [Google Scholar] [CrossRef]
  35. Li, J.; Carrica, P. A population balance cavitation model. Int. J. Multiph. Flow 2021, 138, 103617. [Google Scholar] [CrossRef]
  36. Cristofaro, M.; Edelbauer, W.; Gavaises, M.; Koukouvinis, P. Numerical simulation of compressible cavitating two-phase flows with a pressure-based solver. In Proceedings of the 28th Conference on Liquid Atomization and Spray Systems, ILASS-EUROPE 2017, Valencia, Spain, 6–8 September 2017. [Google Scholar]
  37. Kunz, R.F.; Boger, D.A.; Stinebring, D.R.; Chyczewski, T.S.; Lindau, J.W.; Gibeling, H.J.; Venkateswaran, S.; Govindan, T. A preconditioned Navier–Stokes method for two-phase flows with application to cavitation prediction. Comput. Fluids 2000, 29, 849–875. [Google Scholar] [CrossRef]
  38. Schnerr, G.H.; Sauer, J. Physical and numerical modeling of unsteady cavitation dynamics. In Proceedings of the Fourth International Conference on Multiphase Flow, ICMF, New Orleans, LO, USA, 27 May–1 June 2001; Volume 1. [Google Scholar]
  39. Choi, Y.H.; Merkle, C.L. The application of preconditioning in viscous flows. J. Comput. Phys. 1993, 105, 207–230. [Google Scholar] [CrossRef]
  40. Zwart, P.; Gerber, A.; Belamri, T. A two-phase flow model for predicting cavitation dynamics. In Proceedings of the Fifth International Conference on Multiphase Flow, Yokohama, Japan, 30 May–4 June 2004; Volume 152. [Google Scholar]
  41. Singhal, A.; Athavale, M.; Li, H.; Jiang, Y. Mathematical basis and validation of the full cavitation model. J. Fluids Eng. 2002, 124, 617–624. [Google Scholar] [CrossRef]
  42. Peltola, J.; Pättikangas, T.; Bainbridge, W.; Lehnigk, R.; Schlegel, F. On development and validation of subcooled nucleate boiling models for OpenFOAM Foundation release. In Proceedings of the 18th International Topical Meeting on Nuclear Reactor Thermal Hydraulics, NURETH 2019, American Nuclear Society (ANS), Portland, OR, USA, 18–23 August 2019; pp. 2149–2163. [Google Scholar]
  43. Ishii, M.; Zuber, N. Drag coefficient and relative velocity in bubbly, droplet or particulate flows. AIChE J. 1979, 25, 843–855. [Google Scholar] [CrossRef]
  44. Lehnigk, R. A Generalized Population Balance Model for the Simulation of Polydisperse Multiphase Flows within the Euler-Euler Framework. Ph.D. Thesis, Technische Universität Dresden, Dresden, Germany, 2020. [Google Scholar]
  45. Menter, F.; Esch, T. Elements of industrial heat transfer predictions. In Proceedings of the 16th Brazilian Congress of Mechanical Engineering, Uberlandia, Brazil, 26–30 November 2001. [Google Scholar]
  46. Egorov, Y.; Menter, F. Development and application of SST–SAS model in the DESIDER project. In Advances in Hybrid RANS-LES Modelling; Springer: Berlin/Heidelberg, Germany, 2008; Volume 97, pp. 261–270. [Google Scholar]
  47. Launder, B.E.; Spalding, B. The numerical computation of turbulent flows. Comput. Methods Appl. Mech. Eng. 1974, 3, 269–289. [Google Scholar] [CrossRef]
  48. Bensow, R. Simulation of the unsteady cavitation on the Delft Twist11 foil using RANS, DES and LES. In Proceedings of the Second International Symposium on Marine Propulsors, Hamburg, Germany, 15–17 June 2011. [Google Scholar]
  49. Viitanen, V.; Sipilä, T.; Sánchez-Caja, A.; Siikonen, T. Compressible Two-Phase Viscous Flow Investigations of Cavitation Dynamics for the ITTC Standard Cavitator. Appl. Sci. 2020, 10, 69–85. [Google Scholar] [CrossRef]
  50. Caretto, L.; Gosman, A.; Patankar, S.; Spalding, D. Two calculation procedures for steady, three-dimensional flows with recirculation. In Proceedings of the Third International Conference on Numerical Methods in Fluid Mechanics: Vol. II Problems of Fluid Mechanics; Springer: Berlin/Heidelberg, Germany, 1973; pp. 60–68. [Google Scholar]
  51. Issa, R. Solution of the implicitly discretised fluid flow equations by operator-splitting. J. Comput. Phys. 1986, 62, 40–65. [Google Scholar] [CrossRef]
  52. Weller, H. Pressure-Velocity Solution Algorithms for Transient Flows; OpenCFD Ltd.: Reading, UK, 2005. [Google Scholar]
  53. Lighthill, M.J. On sound generated aerodynamically. I. General theory. Proc. R. Soc. Lond. Math. Phys. Eng. Sci. 1952, 211, 564–587. [Google Scholar]
  54. Lighthill, M.J. On sound generated aerodynamically. II. Turbulence as a source of sound. Proc. R. Soc. Lond. Math. Phys. Eng. Sci. 1954, 222, 1–32. [Google Scholar]
  55. Curle, N. The influence of solid boundaries upon aerodynamic sound. Proc. R. Soc. Lond. Ser. A Math. Phys. Sci. 1955, 231, 505–514. [Google Scholar]
  56. Williams, J.F.; Hawkings, D.L. Sound generation by turbulence and surfaces in arbitrary motion. Philos. Trans. R. Soc. Lond. Ser. A Math. Phys. Sci. 1969, 264, 321–342. [Google Scholar]
  57. Di Francescantonio, P. A new boundary integral formulation for the prediction of sound radiation. J. Sound Vib. 1997, 202, 491–509. [Google Scholar] [CrossRef]
  58. Brenter, F.F.K.S. The Acoustic Analogy and the Prediction of the Noise of Rotating Blades Theoretical and Computational Fluid Dynamics. Theor. Comput. Fluid Dyn. 1998, 10, 155–170. [Google Scholar]
  59. Farassat, F.; Myers, M. Extension of Kirchhoff’s formula to radiation from moving surfaces. J. Sound Vib. 1988, 123, 451–460. [Google Scholar] [CrossRef] [Green Version]
  60. Lyrintzis, A.S. Review: The Use of Kirchhoff’s Method in Computational Aeroacoustics. J. Fluids Eng. 1994, 116, 665–676. [Google Scholar] [CrossRef]
  61. Wang, Y.; Mikkola, T.; Hirdaris, S. A fast and storage-saving method for direct volumetric integration of FWH acoustic analogy. Ocean Eng. 2022, 261, 112087. [Google Scholar] [CrossRef]
  62. Testa, C.; Porcacchia, F.; Zaghi, S.; Gennaretti, M. Study of a FWH-based permeable-surface formulation for propeller hydroacoustics. Ocean Eng. 2021, 240, 109828. [Google Scholar] [CrossRef]
  63. Lloyd, T.; Rijpkema, D.; van Wijngaarden, E. Marine propeller acoustic modelling: Comparing CFD results with an acoustic analogy method. In Proceedings of the Fourth International Symposium on Marine Propulsors (smp’15), Austin, TX, USA, 1–3 June 2015. [Google Scholar]
  64. Sezen, S.; Atlar, M.; Fitzsimmons, P.; Sasaki, N.; Tani, G.; Yilmaz, N.; Aktas, B. Numerical cavitation noise prediction of a benchmark research vessel propeller. Ocean Eng. 2020, 211, 107549. [Google Scholar] [CrossRef]
  65. Testa, C.; Greco, L. Prediction of submarine scattered noise by the acoustic analogy. J. Sound Vib. 2018, 426, 186–218. [Google Scholar] [CrossRef]
  66. Ku, G.; Cho, J.; Cheong, C.; Seol, H. Numerical investigation of tip-vortex cavitation noise of submarine propellers using hybrid computational hydro-acoustic approach. Ocean Eng. 2021, 238, 109693. [Google Scholar] [CrossRef]
  67. Free Field Technologies SA. Actran 2021 User Manual; Free Field Technologies—MSC Software Belgium SA: Mont-Saint-Guibert, Belgium, 2021. [Google Scholar]
  68. Saarinen, P.; Siikonen, T. Simulation of HVAC flow noise sources with an exit vent as an example. Int. J. Vent. 2016, 15, 45–66. [Google Scholar] [CrossRef]
  69. Saarinen, P.; Mustakallio, P. Simulation of flow noise generation in a circular ceiling diffuser—A comparison between a silent and a noisy design by using CFD and Lighthill’s acoustic analogy. In Proceedings of the 7th International Symposium on Heating, Ventilation and Air Conditioning: Proceedings of ISHVAC 2011, Shanghai, China, 6–9 November 2011. [Google Scholar]
  70. Pierce, A. Acoustics: An Introduction to Its Physical Principles and Applications; Acoustical Society of America: Berlin/Heidelberg, Germany, 1989. [Google Scholar]
  71. Shorter, P.J.; Langley, R.S. On the reciprocity relationship between direct field radiation and diffuse reverberant loading. J. Acoust. Soc. Am. 2005, 117, 85–95. [Google Scholar] [CrossRef] [PubMed]
  72. Langley, R. Numerical evaluation of the acoustic radiation from planar structures with general baffle conditions using wavelets. J. Acoust. Soc. Am. 2007, 121, 766–777. [Google Scholar] [CrossRef]
  73. Bailly, C.; Juve, D. A stochastic approach to compute subsonic noise using linearized Euler’s equations. In Proceedings of the 5th AIAA/CEAS Aeroacoustics Conference and Exhibit, Seattle, WA, USA, 10–12 May 1999; p. 1872. [Google Scholar]
  74. Bechara, W.; Bailly, C.; Lafon, P.; Candel, S.M. Stochastic approach to noise modeling for free turbulent flows. AIAA J. 1994, 32, 455–463. [Google Scholar] [CrossRef] [Green Version]
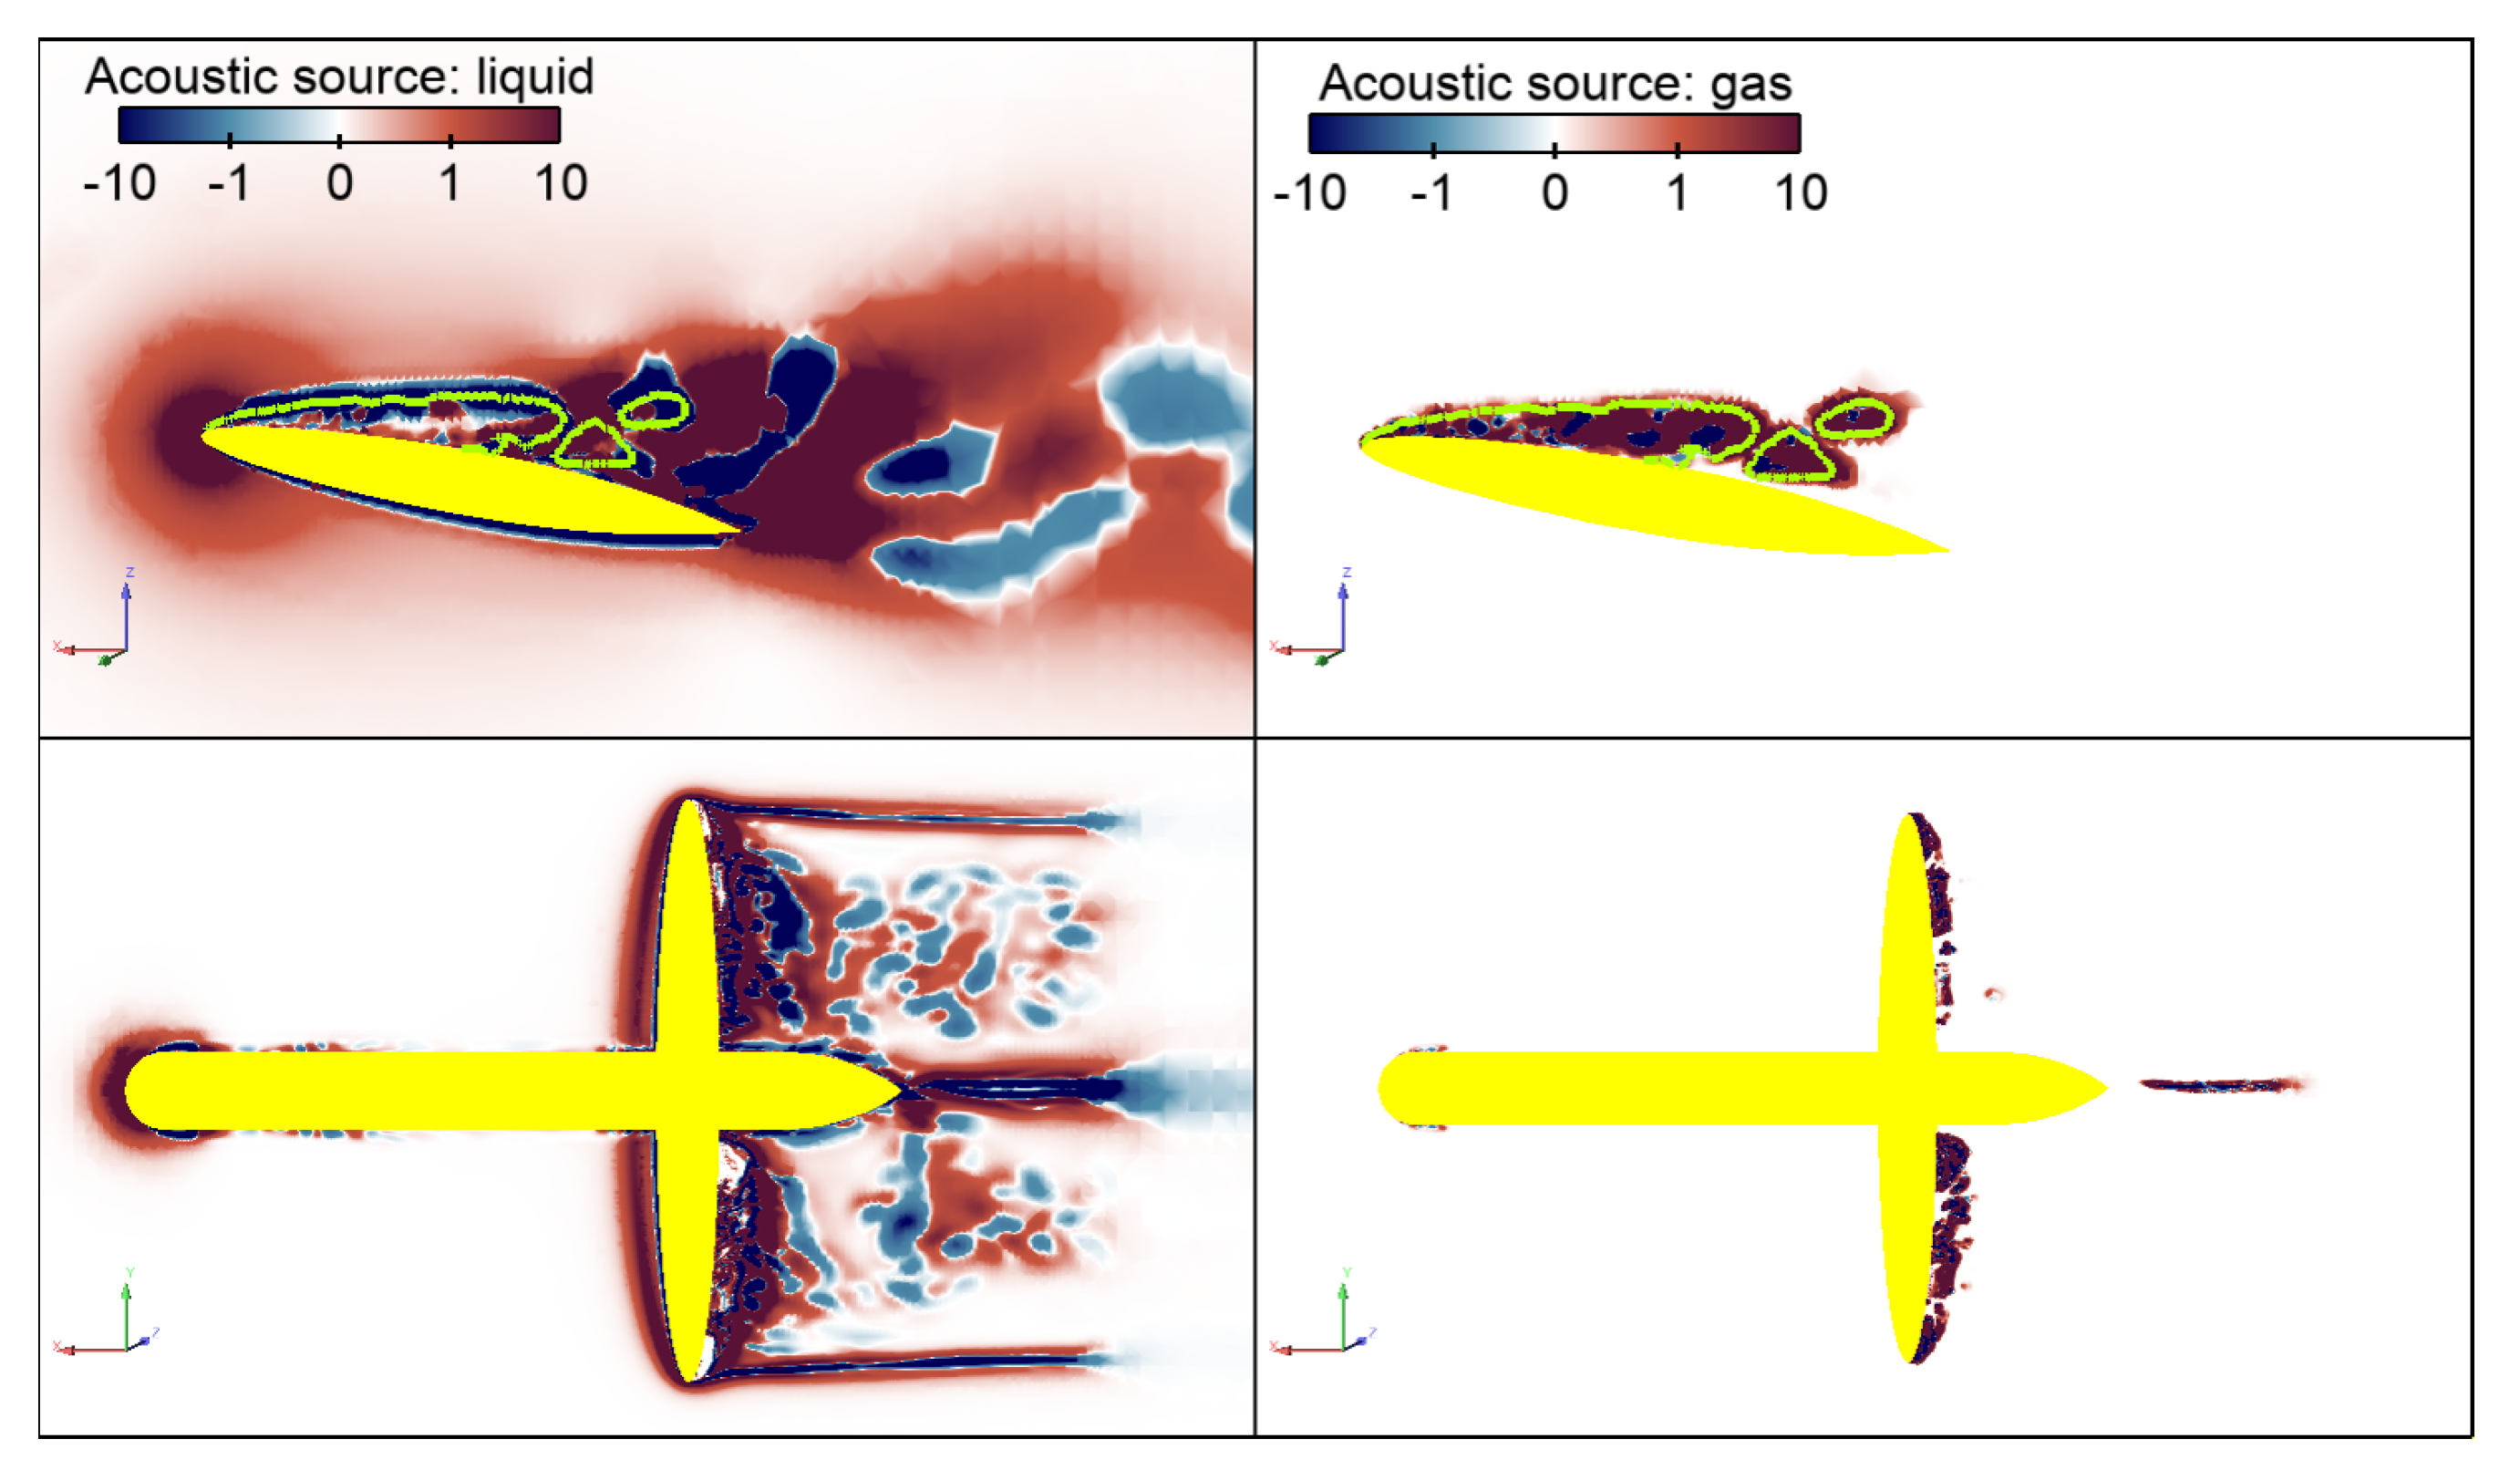
Figure 1. Illustration of acoustic source term contributions from liquid and gas phases individually. A snapshot from an EE flow solution. Frames on the left show the liquid phase and frames on the right show the gas phase contributions. Top frames are at the y-plane taken at midchord of the left wing, and bottom frames are at the z-plane taken in the middle of the cavitator. The green lines denote a contour of α g = 0.1 . The flow is from left to right.
Jmse 11 00820 g001
Figure 2. Illustration of acoustic source term based on the volumetric mixture velocity. A snapshot from EE flow solution. Top frames are at the y-plane taken at midchord of the left wing, and bottom frames are at the z-plane taken in the middle of the cavitator. The green lines denote a contour of α g = 0.1 . The flow is from left to right.
Jmse 11 00820 g002
Figure 3. Schematic view of the cavitator.
Jmse 11 00820 g003
Figure 4. Sketch of the cavitation tunnel with the cavitator inside.
Jmse 11 00820 g004
Figure 5. Sketch of the hydrophone placement inside the cavitation tunnel and the common frame of reference.
Jmse 11 00820 g005
Figure 6. Computational domain for the CFD solution of the cavitator.
Jmse 11 00820 g006
Figure 7. Views of the computational grid for the CFD solution of the cavitator.
Jmse 11 00820 g007
Figure 8. FEM model of the cavitation tunnel window and sensor placements.
Jmse 11 00820 g008
Figure 9. Window vibration velocities at sensors as functions of frequency.
Jmse 11 00820 g009
Figure 10. Lowest structural modes of the window at frequencies of 148 Hz, 236 Hz, 374 Hz, and 561 Hz.
Jmse 11 00820 g010
Figure 11. FEM acoustic model of the cavitation tunnel.
Jmse 11 00820 g011
Figure 12. Circles used for the directivity noise analysis.
Jmse 11 00820 g012
Figure 13. Directivity plots at 200 Hz, 500 Hz, 1000 Hz, and 2000 Hz. Monopole marked with + sign.
Jmse 11 00820 g013
Figure 14. Noise maps: top left, 1000 Hz; top right, 1500 Hz; bottom left, 2000 Hz; bottom right, 3000 Hz.
Jmse 11 00820 g014
Figure 15. Sketch of the free-field FEM model of the cavitator.
Jmse 11 00820 g015
Figure 16. Correction terms for sound power levels for monopole(s) near the cavitator.
Jmse 11 00820 g016
Figure 17. Cavitation extent observed in the experiments— U = 8 m/s and σ = 0.53 from [49]. Photograph of the head of the cavitator (left); sketch of the mean cavitation extent on the cavitator (right).
Jmse 11 00820 g017
Figure 18. Snapshots of the CFD simulations by VOF (left) and EE (right) multiphase flow models. Animation file demonstrating the cavitation dynamics is provided as Supplementary Material (Video S1) to this paper.
Jmse 11 00820 g018
Figure 19. Visualisation of a cavitation shedding cycle from EE simulations. The time interval between two consecutive images is equal to 5.7 ms. Cavity volume by α g [ 0.1 , 0.9 ] is coloured according to the predicted diameter of the vapour phase. The insert frame shows u m / U on the y-plane at midspan. Animation file corresponding to the snapshots is provided as Supplementary Material (Video S2) to this paper.
Jmse 11 00820 g019
Figure 20. Visualisation of cavity growth and detachment from EE simulations. Top frames: u m / U on the y-plane at midspan. Bottom frames: Closer view of vapour phase near the left wing with cavitation volume shown as α g [ 0.1 , 0.9 ] coloured according to the predicted diameter of the vapour phase. Time interval between two consecutive images is 2 ms.
Jmse 11 00820 g020
Figure 21. Cavitation near the hemispherical head of the cavitator. Photograph from experiments (left); snapshot of the CFD simulations using EE multiphase flow model showing an iso-volume of α g coloured by d gas (right).
Jmse 11 00820 g021
Figure 22. Snapshot of VOF (left) and EE (right) CFD simulations of u / U at the mid plane in the vertical direction. Mixture velocity used for the EE solution.
Jmse 11 00820 g022
Figure 23. Snapshot of VOF (left) and EE (right) CFD simulations of the pressure coefficient at the mid-plane in the vertical direction.
Jmse 11 00820 g023
Figure 24. Snapshot of VOF (left) and EE (right) CFD simulations of the cavity volume and vortical structures with | Ω | = 10 as purple.
Jmse 11 00820 g024
Figure 25. Snapshots from VOF (left) and EE (right) simulations illustrating instantaneous cavitation evolution and acoustic source term distribution. Top left frames: isosurfaces of α g = 0.1 . Bottom left frames: isosurfaces of Q = 1 . Right frames show the non-dimensional acoustic source term. Top right frames: cut plane at midchord of left wing. Bottom right frames: cut plane at middle of cavitator. Animations of the cavitation and acoustic source evolution are given as Supplementary Material (Video S3).
Jmse 11 00820 g025
Figure 26. Mesh frequency cut-off of steady hydrofoil VOF solution with coarse mesh.
Jmse 11 00820 g026
Figure 27. Noise sources (left side) and the spatial filter distributions in the CFD mapping domain.
Jmse 11 00820 g027
Figure 28. Sound pressure level contours in cavitation tunnel at 80 Hz (top left), 125 Hz (top right), 700 Hz (bottom left), and 1300 Hz (bottom right)—VOF solution.
Jmse 11 00820 g028
Figure 29. Sound pressure level contours in free field at 80 Hz (top left), 125 Hz (top right), 700 Hz (bottom left), and 1300 Hz (bottom right). Diameter of the free-field sphere is d = 3 m—VOF solution.
Jmse 11 00820 g029
Figure 30. Sound pressure at the cavitation tunnel walls at approximately 1300 Hz—VOF solution.
Jmse 11 00820 g030
Figure 31. Sound power levels and correction terms for the cavitator test case (VOF solution) in cavitation tunnel (CT) and in free field (FF).
Jmse 11 00820 g031
Figure 32. Sound power levels and correction terms for the cavitator test case (EE solution) in cavitation tunnel (CT) and in free field (FF).
Jmse 11 00820 g032
Figure 33. Measured and simulated cavitator noise comparison in 1/3 octave bands.
Jmse 11 00820 g033
Table 1. Main geometrical features. The foil section type is NACA 16-012.
Geometrical FeatureValue
Length [mm]400
Height [mm]200
Hub diameter [mm]20
Inclination angle of foils [∘]±10
Width of foils [mm]300
Max. chord of foils [mm]60
Table 2. Hydrophone coordinates and arrangement description in the cavitation tunnel.
No.x [mm]y [mm]z [mm]Arrangement
H1297.4−388.4−100.0In acoustic chamber, upstream
H2457.6−292.20.0Longitudinal to the flow, upstream
H3379.4−282.2−220.0Transversal to the flow, upstream
H4−102.6−388.4−100.0In acoustic chamber, downstream
H5−142.4−292.20.0Longitudinal to the flow, downstream
H6−220.6−282.2−220.0Transversal to the flow, downstream
Disclaimer/Publisher’s Note: The statements, opinions and data contained in all publications are solely those of the individual author(s) and contributor(s) and not of MDPI and/or the editor(s). MDPI and/or the editor(s) disclaim responsibility for any injury to people or property resulting from any ideas, methods, instructions or products referred to in the content.