Article

Experimental Study on the Stability and Wave Force of a Breakwater Transition under Multiangle Oblique Waves

1
China Harbor Engineer Company Ltd., Beijing 100027, China
2
Tianjin Research Institute for Water Transport Engineering, National Engineering Research Center of Port Hydraulic Construction Technology, Tianjin 300456, China
*
Authors to whom correspondence should be addressed.
J. Mar. Sci. Eng. 2023, 11(3), 631; https://doi.org/10.3390/jmse11030631
Submission received: 2 March 2023 / Revised: 13 March 2023 / Accepted: 15 March 2023 / Published: 16 March 2023

Abstract

:
Based on the failure and instability of different structural transitions of offshore breakwater, this paper provides a basis for understanding the instability mechanism and also provides suggestions for engineering repair. Based on the breakwater project in the regulation of the bay of Shandong Province, physical model tests with a scale of 1:36 were carried out. This study revealed the wave characteristics, the force performance, and the instability mechanism in the transition. In the test, the relationships between 5°, 15°, 35°, and 75° oblique waves, the wave force, and the stable weight of the Accropode were simulated, revealing that the generation of a shock wave current is related to the wave direction angle, which results in the local wave height increasing by 2.05 times. The result that the design weight of the armour block is unstable and stable after optimization is obtained. The wave force of the caisson of the transition was concentrated in the anti-arc section of the superstructure, and the maximum horizontal force, buoyancy force, and impact pressure were 935.6 kN, 419.1 kN, and 65.9 kPa, respectively. The instability mechanism was determined as the poor connection between the accropode and the caisson, and the wave energy concentration. Compared with the calculation results of the standard formula, the correction coefficients of the overtopping volume, the wave crest elevation, the wave force, and the Accropode weight at the transition of breakwater were 1.95, 1.97, 1.60, and 4.0, respectively. The test results have solved the practical problems of the project and can also provide a reference for similar projects.

1. Introduction

Waves contain huge amounts of energy. In order to block the direct effect of large waves in the open sea and to ensure the utility of the water area in a port and the safety of the wharf and other infrastructure, it is usually necessary to build a breakwater. In recent years, with the development of port construction, port sites have gradually expanded from a natural bay with good natural conditions to the open sea, and breakwater construction has also had to face a harsh hydrodynamic environment.
Influenced by factors such as an increase in the water depth, the deterioration of wave conditions in offshore construction, and restrictions on the exploitation of backfill stones, designs propose the adoption of two different structural combinations of vertical caissons and breakwater at appropriate water depths [1,2,3]. However, in recent years, as the intensity of extreme sea conditions increases at the transition of two structures, accidents regarding breakwater instability have occurred [4,5]. Figure 1a shows a breakwater transition in Guangdong Province of China that was damaged in a typhoon, causing huge economic losses to the enterprise [6]. As seen from the damaged site of the project in Figure 1, breakwater transition failure was different from that of other regions. Figure 1a shows the caisson sliding at the breakwater transition and the Accropode rolling down to the upper part of the caisson, resulting in the mixing of different structures; Figure 1b shows the instability of the armor block. The main differences between the two types of breakwater instability are as follows: ① the hydrodynamic characteristics are different, as the former has wave energy concentration and backwater; ② the connection of the armor block is different, as while the former consists of two different structures joined by a poor connection, the latter is normal.
In order to understand the mechanism of breakwater failure and instability and to provide a basis for the engineering repair, it is necessary to first verify the wave characteristics at the breakwater transition; establish the relationship between the characteristics of the wave, the force, and the stability weight of armor; compare them with the design value calculated by the standard formula to obtain the deviation between them; and then provide the corresponding correction coefficient.
Referencing previous research results, and focusing on the research on multiangle wave action at the transition, there are few relevant achievements at home and abroad at present, but there are many research results on the stability of the same structure armor block or the wave force on the vertical caisson.
For the research on the stability of the breakwater armor under wave action, Zhang et al. [7] pointed out that when oblique waves impact the stability of the seawall, the positions prone to instability, due to the wave breaking, are shown at the wave side at the back of the breakwater head and the steep change in the topography at the bottom of the breakwater. Chang et al. [8] used the action of normally incident waves in their study of the stability of hollow square blocks at four corners, and, with it, found the limitation of the formula for calculating the stable weight in the standard, and proposed the model test results to provide a necessary supplement for the design basis.
Jiang et al. [9] used physical tests to point out that an oblique wave at a certain angle is more dangerous to the Accropode than a normal wave, and they proposed that the influence of the poor occlusion function of the armor should be considered for the lateral action. Ref. [10] determined the calculation method of the stability weight of a breakwater’s bottom protection Accropode under the action of different oblique waves through theoretical analysis and test comparisons. Foreign scholars have conducted stability studies on the transition between a slope-type breakwater armor and a wave energy conversion device embedded in the breakwater using different submerged and oblique wave combinations. They obtained the instability mechanism of the armor between the two and analyzed the optimal location of the device on the breakwater body section [11,12,13].
According to the statistics of calculation formulas derived by researchers in various countries regarding the armor stability weight under oblique wave action, there are mainly two categories. The methods adopted are based on the industry-recognized Equation (1) [14] for the armor stability weight under normal wave action, and the influence factors in Equation (1) are modified according to the characteristics of the oblique wave action; that is, the first category modifies the wave height. The calculation formula obtained is shown in Equation (2). The other method is to modify the stability coefficient, and this calculation formula is shown in Equation (3).
W / γ b H s 3 = K D f γ b γ / γ f m
H s , θ = H s sin β x
K D , θ = K s K D cos θ ε
where W is the stable weight of the armor; K D , θ , H s , θ is the block stability coefficient and the effective wave height under the action of oblique waves at different angles; γ b and γ are the weight of the block and water, respectively; H s is the design wave height; K D is the stability coefficient of the armor; θ is slope angle; β is the angle between wave incidence direction and the breakwater axis; m is the slope gradient; K s is the influence coefficient of the wave direction distribution; and ε is a parameter representing the influence of the wave incidence direction on the stability of the armor, which is generally between 1.0 and 1.1.
For the research results on wave forces acting on vertical caissons, Allsop [15] found through experimental research that the wave breaking impact force of an oblique wave acting on the unit length of breakwater is smaller than that of a normal wave, and the formula of wave breaking impact force reduction coefficient is given as follows:
γ h = 1 X L C L P
where γ h is the reduction coefficient, and X is the coefficient. When the incidence angles are 0°, 15°, and 30°, the corresponding coefficients are 1.35, 1.69, and 1.96, respectively. L C is the unit dike length, and L P is the wavelength of the spectral peak period.
Battjes [16] solved the spatially related problem of wave forces acting on vertical breakwaters by non-breaking waves, and derived the reduction coefficient of wave loads acting on long structures by oblique waves and multidirectional waves.
The longitudinal reduction coefficient of horizontal force is:
γ h = 1 1.67 L C s i n β / L P
The longitudinal reduction coefficient of buoyancy force is:
γ u = 1 0.99 L C s i n β / L P
In the empirical formula from Goda [17,18], the influence of one-way wave oblique action is considered by introducing relevant coefficients. In the calculation, only the inverse relationship between the incident wave angle and the wave force per unit length of the breakwater is considered, and the influence on the total force of the whole structure is ignored.
Chen et al. [19] conducted tests on the forces acting on vertical caissons using waves of different angles, pointing out that the oblique irregular wave forces acting on a unit length of the breakwater decreased with the increase in the wave direction angle. Franco [20] proposed that when the incident angle is less than 40°, compared with a normal wave force, the structural force can be multiplied by the reduction factor related to the wave angle. Hong [21] obtained the wave incidence angle ( θ = 40 ° ) in an experimental study on the effect of oblique and multidirectional waves on open bed caisson breakwaters in a deep-water nonbroken sea area, and the wave force reached the maximum. Madrigal [22] gives the curve of wave force reduction coefficient ( γ 2 ) of oblique waves and two kinds of multidirectional waves (direction distribution width A = 15° and 30°) with relative breakwater length ( L C / L P ) by testing when the main wave direction angle is 0°, 20° and 40°. Li et al. [23], through a model test, obtained that the wave force on the structure decreased with the increase in the wave incidence angle, and they provided a formula for the reduction coefficient of the wave force on a unit length of breakwater. Yu et al. [24] discussed the influence of the wave angle of the wave forces on vertical breakwaters based on an experimental study of a three-dimensional wave physical model, and they proposed a variation law between the wave angle and the structural forces under the condition of whether the waves were broken. They also proposed a calculation formula between the wave angle and vertical structures. Through experiments and theoretical analysis, it was obtained that when the wave incidence angle is less than or equal to 45°, the wave force decreases with the increase in the incidence angle, and a formula that is conducive to the angle’s calculation is provided [25,26]. Wang et al. [27] used the numerical simulation method to study the wave force analysis of the small angle change in the wave face of a vertical breakwater, and they obtained the relationship between the angle and wave force, and the influence of oblique waves, in particular. Some scholars have demonstrated the relationship between overtopping and the wave force of vertical caissons when extreme sea waves are vertically incident through physical model test results, numerical simulation. Such overtopping waves and their accompanying wave forces can induce various mechanisms of structure failure that result in structural instability [28]. Extensive experimental studies have been conducted to estimate the forces and pressures that are induced by a tsunami bore and exerted on structures [29]. At present, the formulas are used most often for caisson design [30].
A summary of the research results of various scholars on the relationship between the wave force on the caisson and the wave incidence angle under the action of oblique waves, can be uniformly described by the following formula:
P β = B k p P
k p = 1 + sin β 22.5 ° 2
where P β is the wave force under oblique wave action at different angles; P is the wave force under the normal wave action; B is the bottom width of the caisson; k p is the reduction factor.
There are few studies on the transition of breakwaters, but there are some results from other projects. For example, Ge et al. [31] studied the stability of an armor block at the transition between an artificial island and an immersed tunnel under wave current coupling, and they obtained the relationship between the stability and the incident wave height under different wave current coupling angles. Zhang et al. [32] demonstrated the stability of an armor block using the transition between the breakwater and the near shore. Ge et al. [33] provided the wave characteristics and structural stability of a breakwater connection section with the same breakwater structure. Kua et al. [34] provided the research results of a wave force and wave direction angle at a bridge bottom under different wave actions at the bridge and the shore structure.
In sum, the current achievements rarely involve paying attention to the wave characteristics, the stability of armor, and the wave forces of caissons at the breakwater transition, at the same time. In addition, it is difficult to refer to the relevant provisions in the specification for design values. In light of this, a physical model test with a scale of 1:36 was carried out against the background of the Shandong Rizhao Bay breakwater regulation project.
In the present study, a physical experiment was conducted to measure the specific wave height, overtopping, the wave force on the caisson, and the stability of the armor block in the breakwater transition zone. The test results obtained were compared with the calculated values of the standard formula or the empirical formula adopted by the designer, and the corresponding adjustment coefficient, so as to meet the design needs of this supporting project, and provide basic data and technical support for subsequent similar projects.

2. Model Test Design

2.1. Project Background

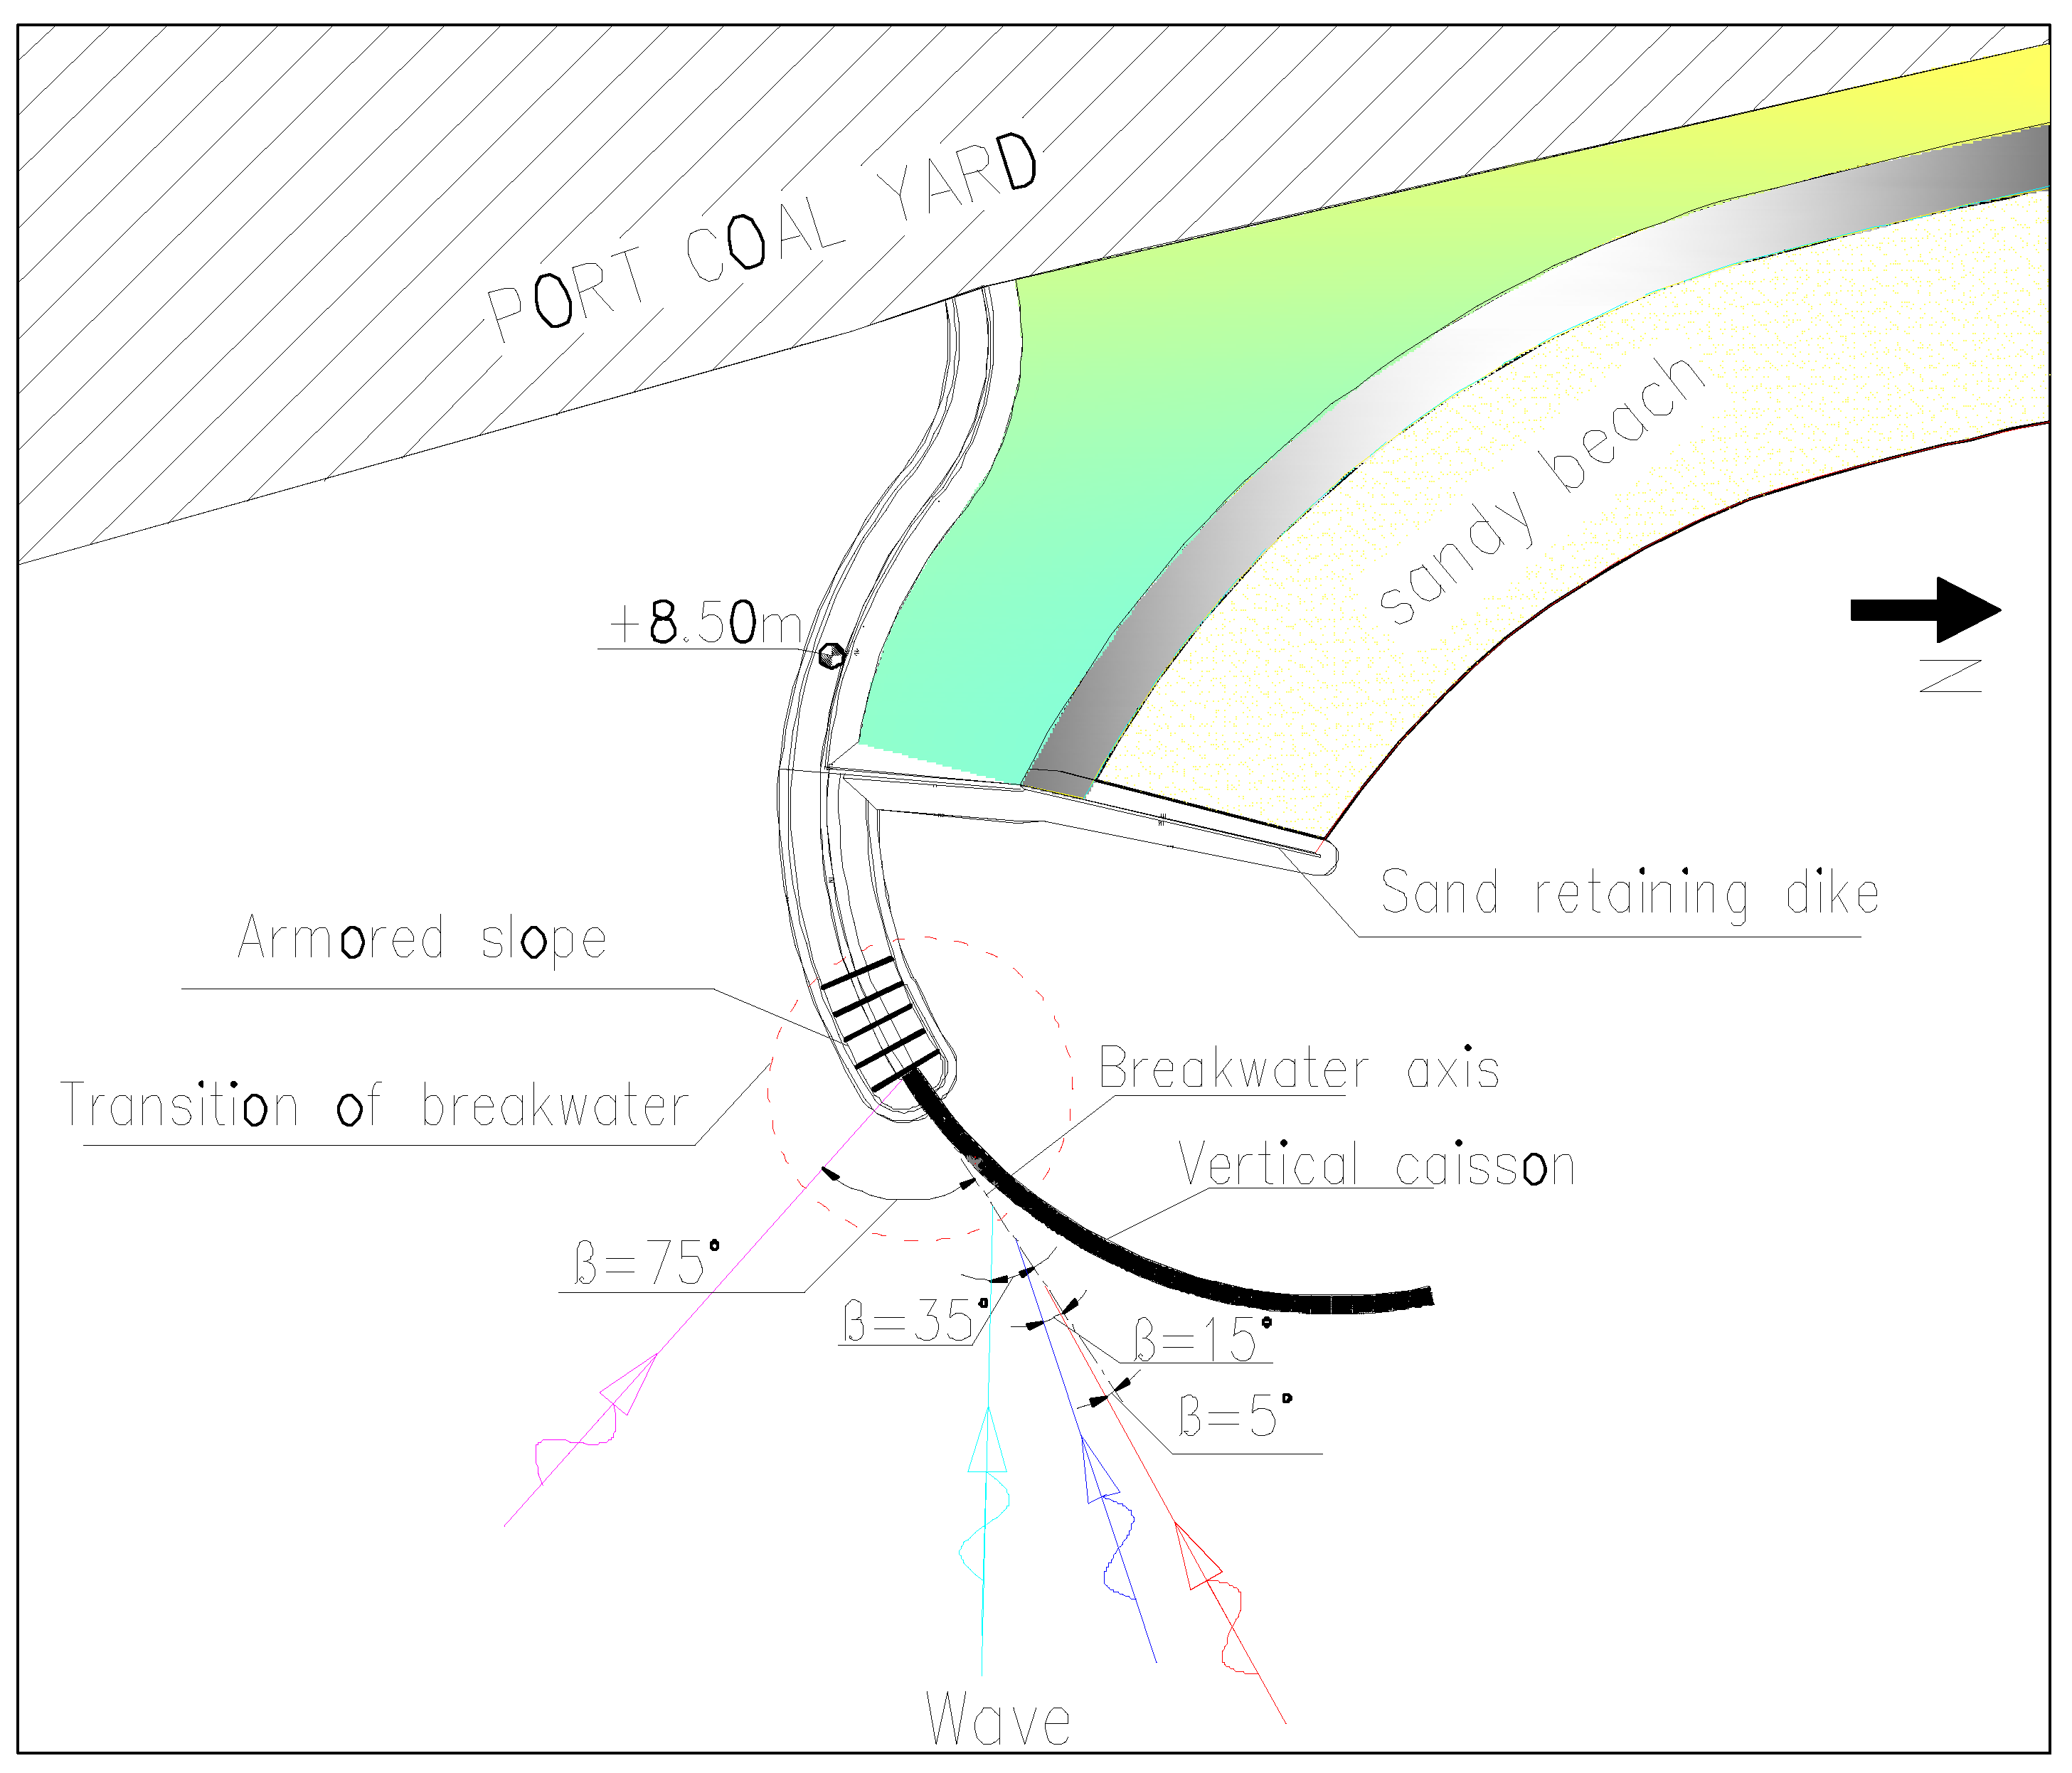
Based on the Shandong Rizhao Bay breakwater project [35], in order to achieve coordination between the port and the city, it was proposed to restore the 1882 m (Note: prototype size is the same below.) shoreline of the port coal yard as the ecological coast of the artificial beach. At the same time, in order to resist the erosion of the artificial beach by strong waves from the open sea, an 885.4 m sand retaining breakwater will be built. The project’s layout is shown in Figure 2.
Figure 3 shows the structural section at the transition of breakwater. The dimensions of caisson are 18.66 m (long) × 16.86 m(width) × 19.5 m (height); the top elevation is +8.5 m; the underwater terrain elevation of the breakwater transition area is between −15.0 m and −19.0 m; an 8T Accropode is being used for the slope structure armor block; and a 2T Accropode is being used for the port side.

2.2. Model Design

The whole 885.4 m breakwater was simulated, including the 300 m vertical caisson structure at the sea side and the 585.4 m slope-type armor structure near the shore. According to the relevant provisions of the Technical Code for Simulation Test of Port and Waterway Engineering (JTJ/T231-2021) [36], the normal model was adopted, which was designed according to the Froude number similarity law. The geometric scale of the model was L r = 1:36; the time scale was T r = L r 1 / 2 ; the weight scale was M r = L r 3 ; the wave force scale was F r = L r 3 ; the pressure scale was P r = L r ; and the wave height scale was H r = L r .
The test was carried out in a 40 m wide and 50 m long harbor basin equipped with 10 movable irregular wave makers (4 m/set). The wave-making capacity at the maximum wave-making depth was 0.8 m, the wave height was 0–0.3 m, and the period was 0.5–4.0 s. In order to reduce the wave boundary reflection, wave absorbers were set around the harbor basin. For the model making, the terrain within the simulation range was made using the pile point method, with a 1.0 × 1.0 m grid layout. For the local steep terrain, the method of the densities of the pile points was adopted, and the elevation was controlled by a level. All errors met the requirements of the test specification. For the simulation of the vertical caisson, plastic plates were used to make and reinforce the internal structure. The size deviation was controlled to within ±1.0 mm. At the same time, in order to ensure that the center of gravity and the mass of the caisson were similar to the original, iron blocks were added as counterweights. The armor blocks and stones were simulated and selected according to the weight scale, and the quality deviation was controlled to within ±10%. See Figure 4 for the model’s layout.

2.3. Test Condition Design and Environmental Simulation

  • Water level conditions: In order to reflect the influence of overtopping on stability and wave force, two water levels of +5.90 m and +0.57 m were selected for the test.
  • Wave conditions: According to the distribution of wave frequency in the open sea and the consideration of the most unfavorable waves, four angles, β = 5°, 15°, 35°, and 75°, were selected between the wave incidence direction and the axis of the breakwater. See Table 1 for wave elements. (Note: the definition method of β is the same as above. See Figure 2 for details). See Table 1 for the test conditions.
Wave simulation: An irregular wave was adopted; the JONSWAP spectrum was also adopted ( γ = 3.3 ). The simulation of each test condition included no fewer than 1000 waves.
The overtopping volume was measured by the self-developed automatic water collection device. The water was weighed and converted into volume and then converted into the prototype to obtain the average overtopping volume per unit length per unit time.

2.4. Layout of Measuring Points

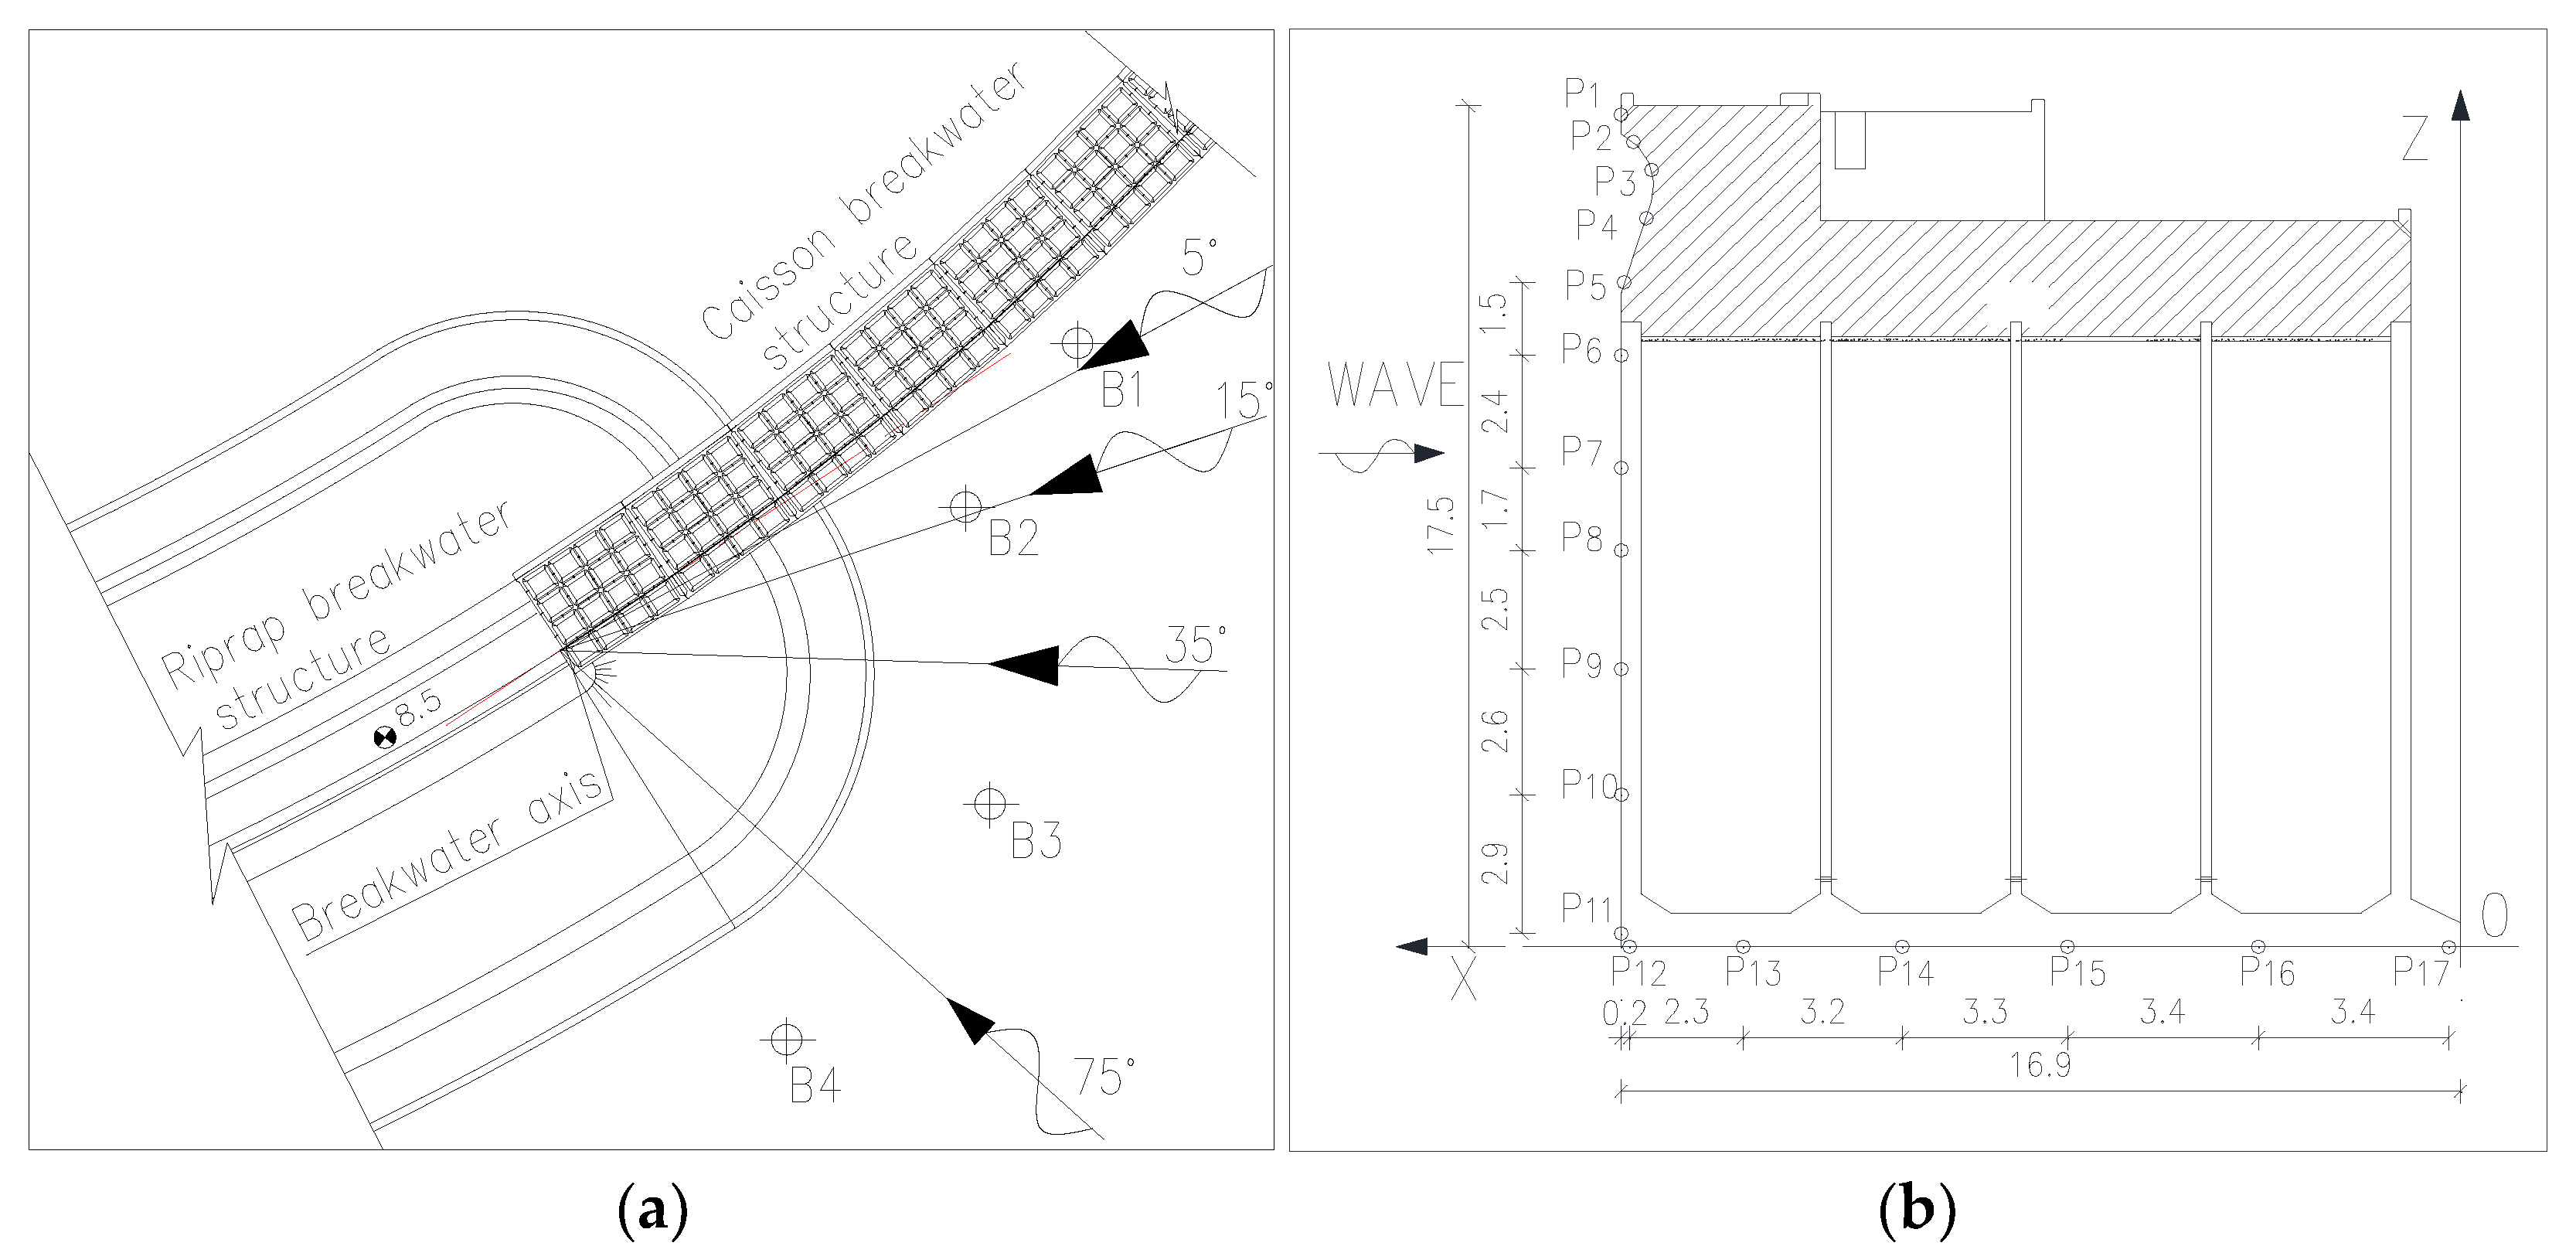
In order to monitor the wave height change caused in the transition zone of the breakwater by the wave energy concentration and the backwater, four wave height sensors (B1–B4) were arranged, as shown in Figure 5a.
For the measurement of the wave force on the caisson at the breakwater transition, the caisson at the exact transition with the sloping embankment was selected, and 17 measuring points (P1–P17) were arranged at the bottom of the caisson and at the side facing the wave. See Figure 5b for the layout of the measuring points. The horizontal force (Fx) and the buoyancy force (Fu) on the caisson was obtained by the point pressure integration of Equation (9). The specific method is as follows: The first step is to set the initial values of all sensors to zero under still water conditions. For measuring points below the still water surface, the hydrostatic pressure at this time is taken as the zero point of the corresponding measuring point, and for measuring points above the still water surface, the atmospheric pressure at this time is taken as the zero point. The pressure value collected in the test is the difference between the actual pressure of the measuring point and the corresponding pressure of the measuring point at the time of zero calibration, that is, the wave hydrodynamic pressure received (the buoyancy result given in the test does not include the hydrostatic buoyancy).
F j t = p t S j   j = X , Z
where F j t is the wave force in the X and Z directions; p t is the pressure of each measuring point; S j is the projected area of the area occupied by each measuring point in the X and Z directions. See Table 2 for details.

3. Results

3.1. Analysis of the Wave Characteristics Change Law

Based on the special position of the transition of the breakwater, the internal concave angle was formed by two structures. When the waves were incident at different angles, complex hydrodynamic conditions, such as the obvious wave energy concentration, backwater, overtopping, and a whirlpool, formed, as shown in Figure 6.
The wave overtopping was collected under the action of 5°, 15°, 35°, and 75° waves at the high water level, and compared to the calculation results of the overtopping volume formula (10) in the Hydrological Code for Ports and Waterways (JTS 145-2015) [37], and the fitting formula (11) proposed by Van der Meer [38]. Formula (7) is used to calculate the reduction coefficient of angle influence overtopping, as shown in Table 3.
Q = 0.07 H c / H s exp 0.5 b 1 2 H s σ K A H s 2 T P 0.3 m + tan h d H s 2.8 2 ln g T P 2 m 2 π H s
where Q is the overtopping amount per unit of time and width; H c is the height of the breakwater crest above the static water surface; b 1 is the front shoulder width of the slope; σ is the empirical coefficient, taken as 0.6; K A is the influence coefficient of the slope structure, taken as 0.45; T p is the spectral peak period; m is the slope gradient coefficient; and g is the weight acceleration.
Q g H s 3 = 0.09 e x p 1.5 H c H s r f r β r v 1.3
where r f is the armor influence coefficient for the Accropode, a value of 0.46 [39]; r β is the influence coefficient of wave incidence angle, a value of 1.0 for normal incidence; and r v is the influence coefficient of wave wall.
It can be seen from the table that: ① compared with the results of the overtopping at different angles, the 35° wave action was the largest; ② the calculation results of Chinese standards and Van der Meer are smaller than the test results, and the difference between Chinese standards and Van der Meer is ± 20%; ③ it can be concluded that in the special area of the connection section, when the design adopted the formula in the specification, a correction factor of 1.56–1.95 should be multiplied on the basis of the calculated results.
The impact of the wave energy concentration at the breakwater transition was further analyzed, and the change rules of the wave height and the wave crest height in this area under the action of 5°, 15°, 35°, and 75° waves were collected, and the results obtained from the wave crest height calculation (Equation (12) in the standards [37]) were compared, as shown in Table 4. The following can be observed from the table: ① With respect to the law of wave height variation, it was 1.21–2.05 times higher than the design’s wave height due to nonlinear effects; in particular, when the 35° wave acted, the composite wave height was 2.05 times the incident wave’s height. ② With respect to the variation law of the wave crest elevation, the test value of the wave crest height was 1.29–1.97 times the standard calculation value. It can be concluded that the increase in the wave height was the main reason for the failure of the connection section in the project. Therefore, in the special area of the connection section, when the design adopts the standard formula for calculation, an adjustment coefficient of 1.21–2.05 should be multiplied on the basis of the calculation results.
η 1 % = H 1 % 2 + π H 1 % 2 2 L s cos h 2 π d L s cos h 4 π d L s + 2 4 sin h 2 π d L s 3
L s = g 1.15 T m 2 2 π tan h 2 π d L s
where η 1 % is the height of the wave crest; L s is the effective wave length.

3.2. Analysis of the Force Variation Law of the Vertical Caisson

3.2.1. Variation Law of the Wave Force

According to the test, the caisson was subjected to the wave force, which was mainly composed of the pressure generated by the hydrostatic pressure and the instantaneous wave impact force. The wave force results under the wave actions of 5°, 15°, 35°, and 75° angles were collected, and the results of the calculation of Equations (14)–(18) under the conditions of H / L   ≥ 1/30 and d / L = 0.139~0.2 in the specification [37] were compared,and the calculation results of the internationally accepted Goda Equations (19)–(28) are used for comparison. See Table 5 for the comparison results of the wave forces.
The following can be observed from the table: ① When comparing the wave action at different angles, a 75° angle produces the largest wave force and a 15° angle produces the smallest, and the maximum horizontal force and buoyancy were F xmax = 935.6 kN and F umax = 419.1 kN, respectively. ② When comparing the wave action at different water levels, the wave force generated at a low water level is greater than that generated at a high water level. The main reason for this is that when compared with the low water level, the waves at the high water level produce a large number of overtopping waves, which leads to the weakening of wave energy. ③ Comparing the wave force results, the formula calculation results are smaller than the experimental values; The comparison of the calculation results between the two formulas shows that the Chinese standard is smaller than the GODA formula on the whole. ④ Compared to the standard calculation formula, the test result was 1.08–1.55 times the calculated value. The analysis showed that the reason for the deviation was that the calculation formula considers the reduction coefficient ( k p ) of oblique incidence, and coefficient ( k p ) was less than 1.0. The product of the two factors ultimately leads to a further smaller calculated value. It can be concluded that for special areas, the wave force on the caisson under oblique wave action is not reduced, but is instead multiplied by an amplification factor of 1.13–1.6 according to this test.
F x = 0.5 k p H + η + d 1 p b + γ d 1 γ d 1 2
F u = 0.5 k p B p b
k p = 0.5 1 + sin β 22.5 °
p b = p s p s γ H cos h 2 π d L d 1 d
p s = γ H cos h 2 π d L + γ d H + η d + H + η
where p d is the pressure at the toe of the caisson at the seaside; p s is the static water surface pressure; and d 1 is the water depth on the rubble foundation bed.
F x = 0.5 B P s + P b d 1 + P s + P m h c *
F u = 0.5 α 1 α 3 B γ H
P s = α 1 + α 2 γ H
P d = P s / cos h 2 π d / L
P b = α 3 P s
P m = P s 1 h c / η * , η * > h c 0 ,   η * h c
α 1 = 0.6 + 0.5 4 π d / L s i n h 4 π d / L 2
α 2 = m i n d d 2 3 d H d 2 2 , 2 d 2 H
α 3 = 1 d 1 d 1 1 c o s h 2 π d / L
h c * = m i n η * , h c
where η * is the height between the zero pressure point and the static water surface.

3.2.2. Variation Law of the Maximum Wave Pressure

  • Pressure distribution at the moment of the maximum wave force
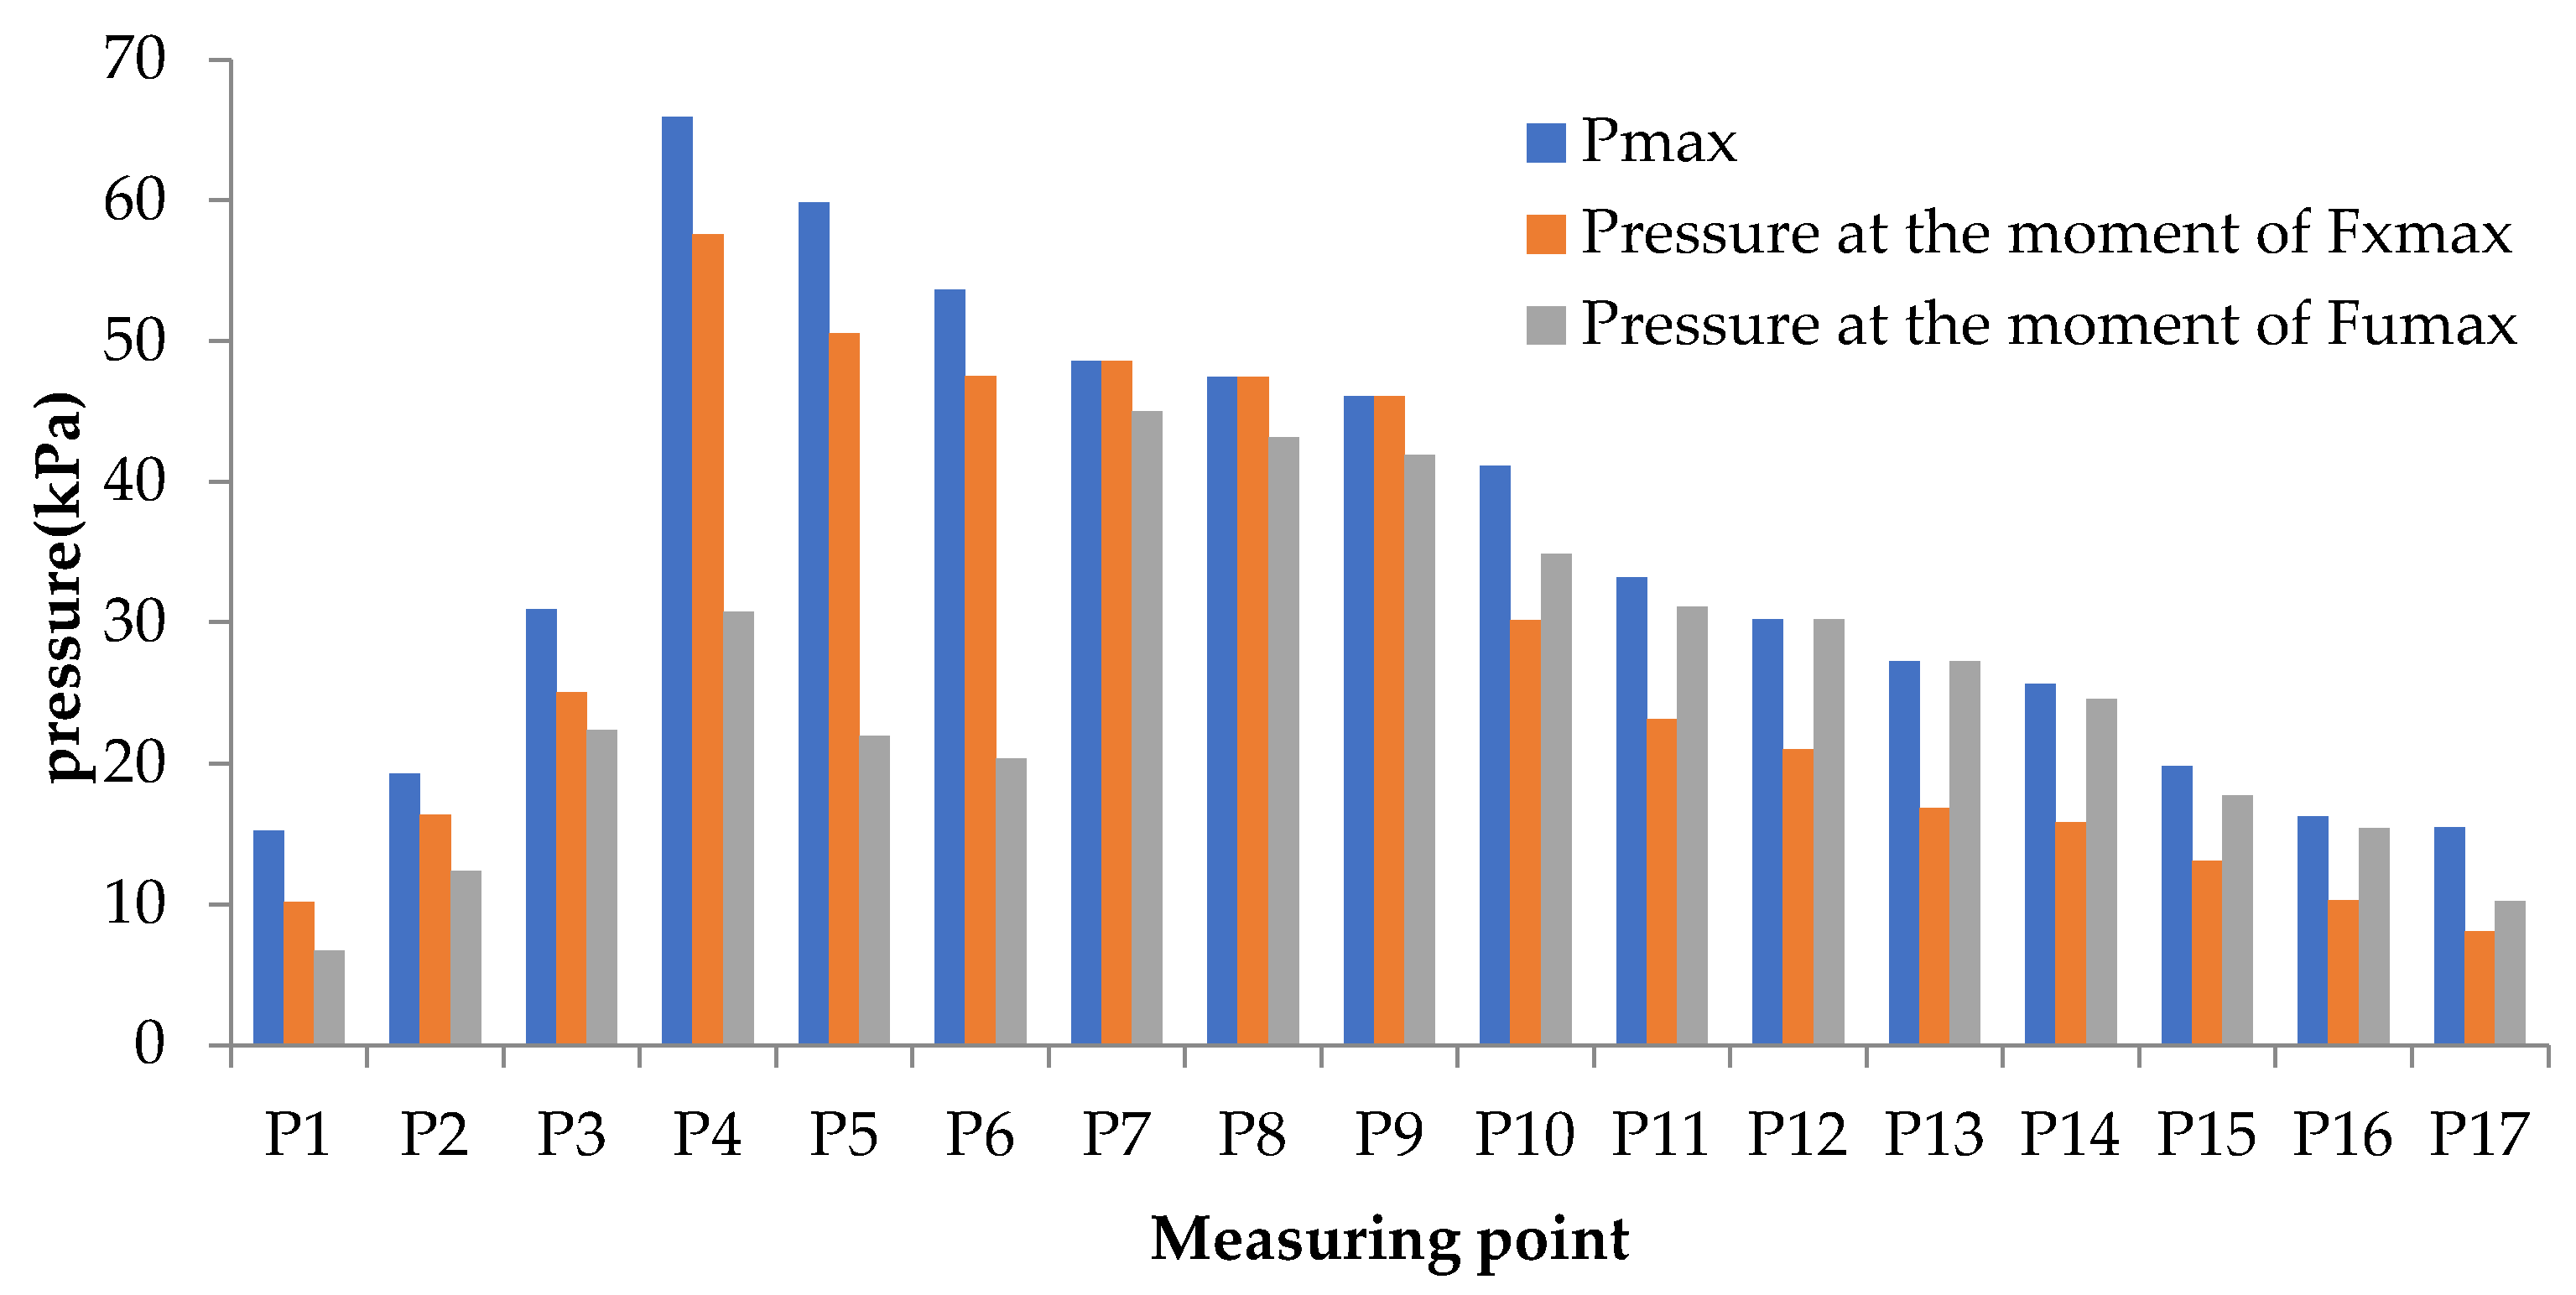
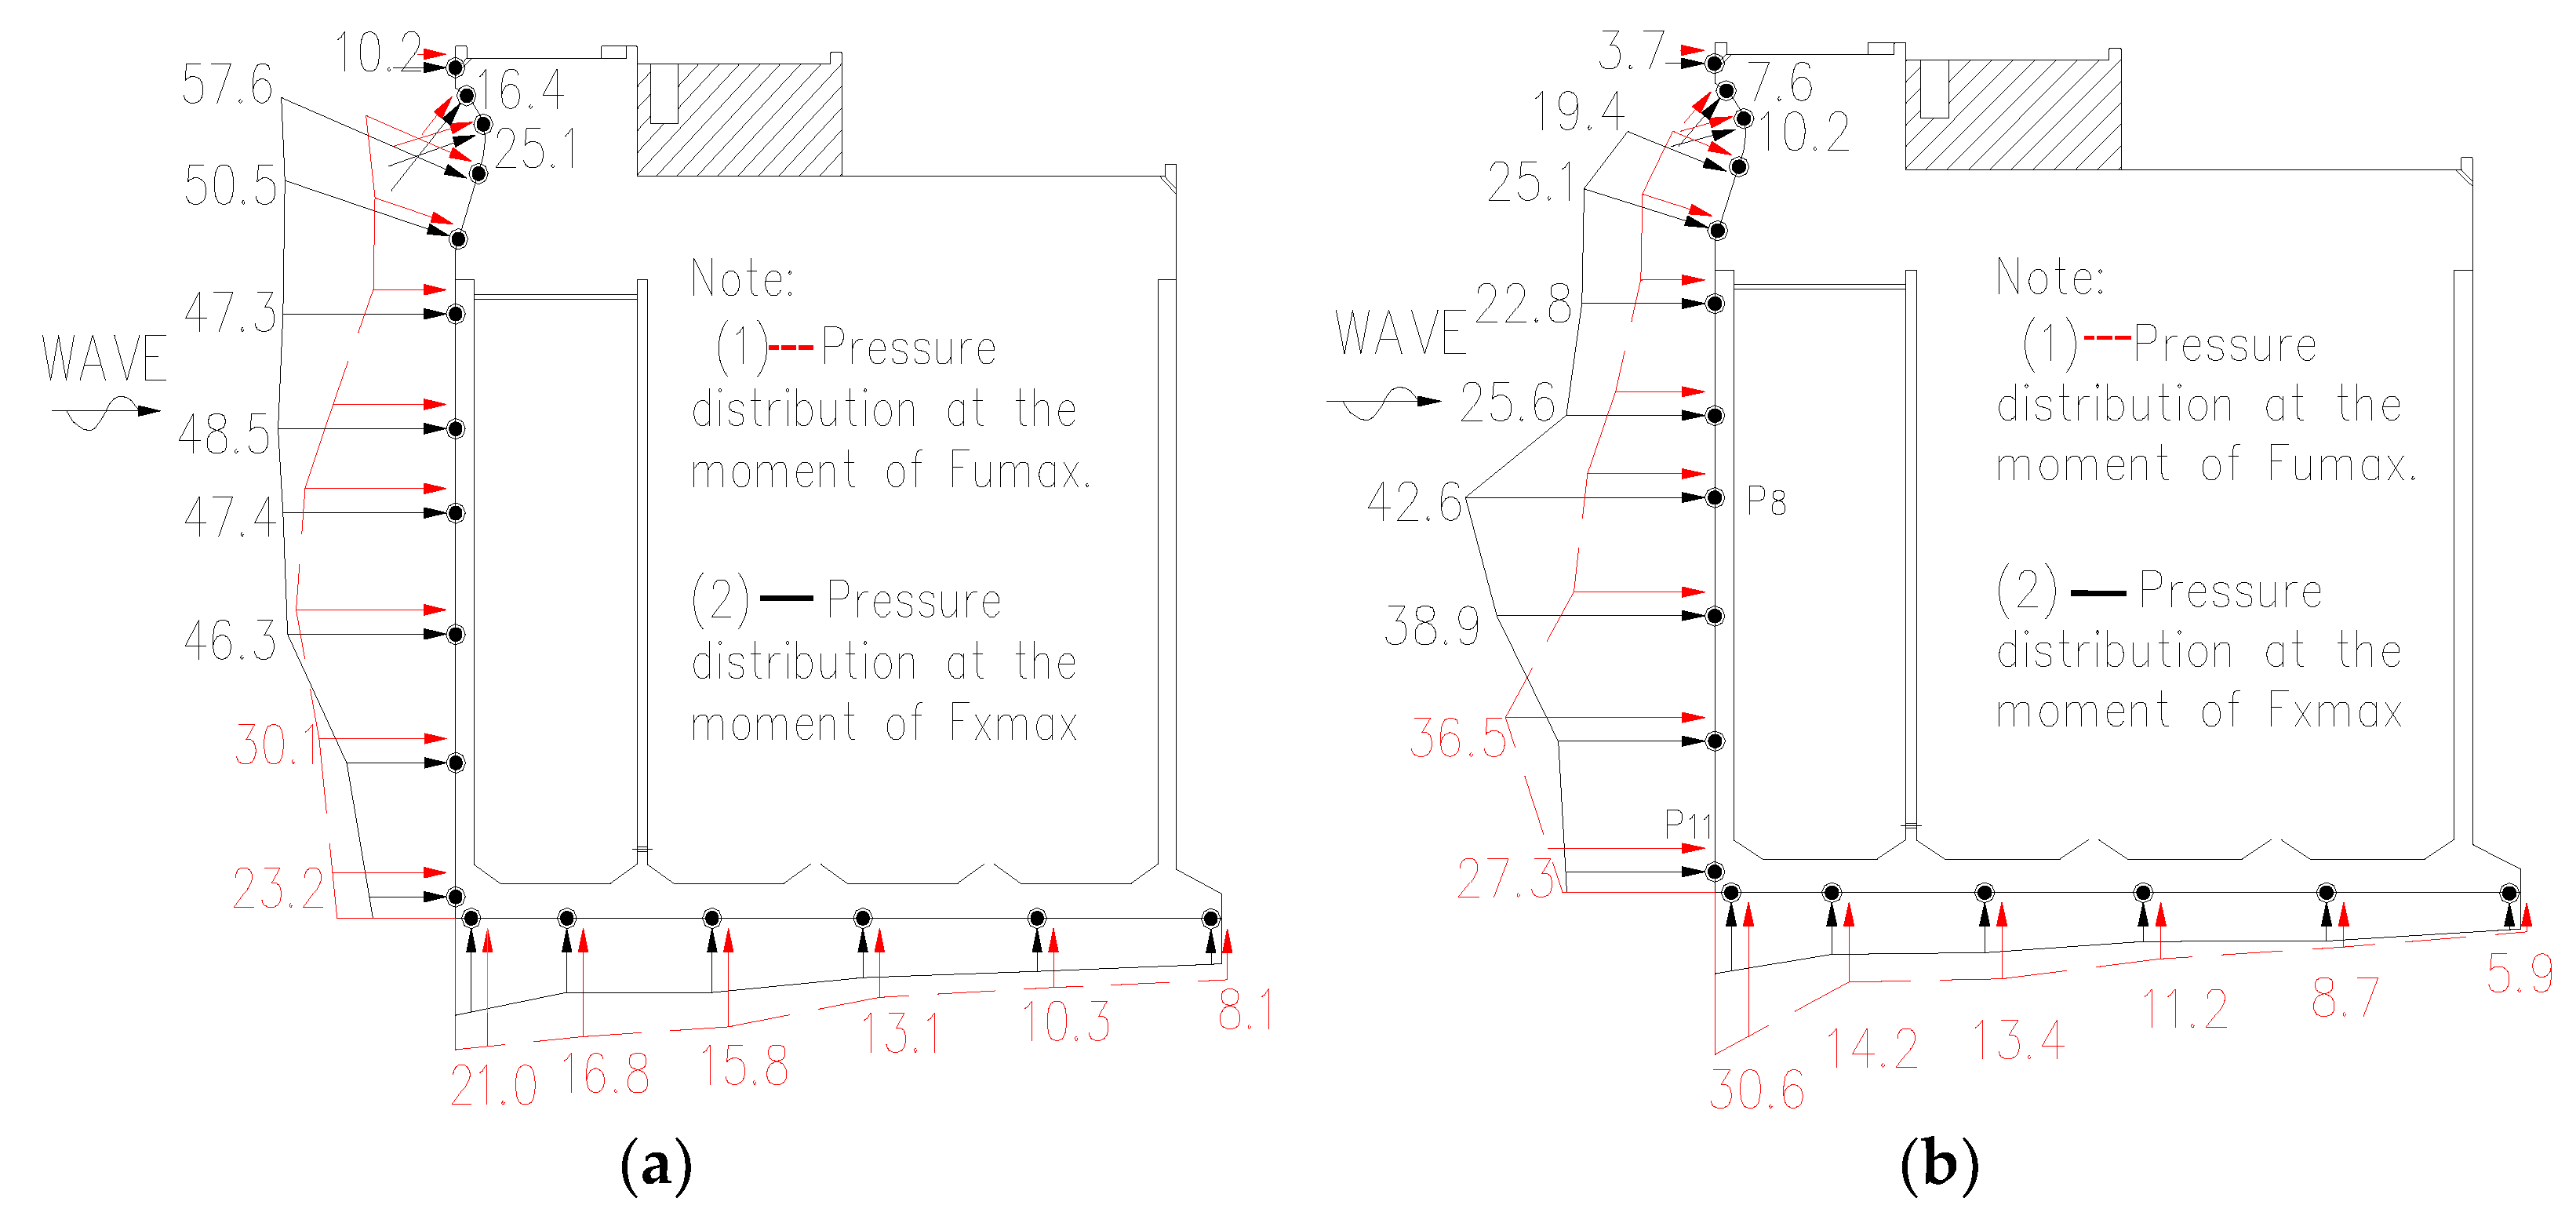
According to the statistics of the pressure distribution law of each measuring point, there was a phase difference in time when each measuring point was subjected to the maximum pressure during the wave action. At the same time, the pressure generated at each measuring point, corresponding to the time when the caisson was subjected to the maximum wave force, was not necessarily the maximum pressure. In order to further understand the relationship between the force and the pressure, the caisson subjected to the maximum wave force at the 75° wave condition was selected. The statistical relationship between the two is shown in Figure 7 and Figure 8. The following can be observed from the figure: ① most of the pressure between the force and the pressure occurs at different times, and the synchronization rate was less than 5%; ② at the moment of the maximum horizontal force, the pressure at measuring point P4 was the largest, with a P xmax = 57.58 kPa, the buoyancy force at the bottom of the caisson was the largest, at measuring point P12, with a P umax = 30.22 kPa, and the pressure distribution at the whole bottom was trapezoidal.
2.
Distribution law of the maximum pressure at each measuring point
The maximum pressure results of measuring points P1–P17 were collected and compared with the calculation results of the pressure (Equation (29) in the specification [37]). See Table 6 for the statistics. The following can be observed from the results in the table: ① The test value is 1.02–1.29 times the calculated value; ② the wave impact pressure on the wave side of the caisson is greater than that on the bottom of the caisson. Therefore, in the special area of breakwater, when the designer adopts the standard formula for calculation, it is necessary to multiply the design value by a factor of 1.02–1.29.
p 1 % γ H 1 % = 4.5 1 Δ h η 1 % 0.3 e 0.9 Δ h η 1 % 0.75 2
where p 1 % is the pressure formed under the action of 1% wave height with cumulative frequency; Δ h is the height from the bottom of the panel to the static water level; η 1 % is the height of the wave crest, corresponding to H1% wave height above the static water surface.

3.3. Analysis of the Stability Variation Law of the Armor Block

During the test, it was found that the instability location of the Accropode at the breakwater transition was mainly in two areas: ① the weak area, where the sector arc of the seaside slope engages with the Accropode at the vertical caisson; ② the overtopping impact area, at the corner of the harbor-side revetment and the top of the breakwater. See Figure 9 for the instability area of the Accropode.
By considering the wave action at different water levels, the stability results of the armor were obtained at the breakwater transition, and compared with the calculation results of Equations (30) and (31), as required in the Code for Design of Breakwater and Revetment (TJS154-2018) [39]. The comparison results are shown in Table 7. The following can be observed from the results found in the table: ① Under the action of waves, the 2T Accropode designed at the port side is unstable and optimized to 8T stability; the 8T Accropode designed at the sea side is unstable and optimized to 12T stability. ② Compared with the effect of different wave incidence angles on stability, a 35° wave action is the least favorable for sea side protection, and a 75° wave action is the least favorable for the harbor basin protection. ③ The wave force calculation results of Chinese Standards and the Rock Manual Equation are smaller than the test results, but the comparison between the two wave force calculation formulas shows that the Chinese Standards calculation is greater than the Rock Manual Equation calculation at small angles, and the Rock Manual Equation calculation is greater than the Chinese Standards calculation when it is close to the normal direction. ④ The test results were compared with the code calculation and design values, and the deviation from the code formula calculation using the reduction coefficient K D . β was 1.47–2.50 times, and the deviation from the design value was 1.0–1.5 times. It can be concluded that for special areas, the stable weight of the armor block under oblique wave action is not reduced, but is instead multiplied by an amplification factor of 1.47–2.50, according to this test.
W = 0.1 γ b H 3 K D γ b γ 1 3 cot α
K D . β = K D sin k β 22.5 °
where K D is the stability coefficient, taken as 16 (according to Chinese specifications, 15–18 is selected for the Accropode, and the middle value is selected for this calculation); k is the test coefficient, taken as 1.50.

4. Discussion

Based on the above experimental research results, it is found that the following aspects need to be further improved and supplemented in the follow-up study during the experiment: (1) This study only considers the single dynamic condition of waves, but there is also the influence of tidal current under actual natural conditions to account for, and it is easy to form vortex and backflow at the breakwater transition. The next step is to carry out the research under the wave-current coupling at the transition of the breakwater. (2) Concerning the influence of water level, only a high water level and a low water level were considered. Due to the difference of water level, different breaking forms and breaking positions of incident waves will be formed. According to the requirements of the “Code for Design of Breakwater and Revetment” (JTS154-2018), the weight of the armor in the crushing area should be increased by no less than 25%. Therefore, the wave breaking caused by the change in water level will also have an increased impact on the stable weight of the armor block, and this change is worth further study. (3) For the design of the weight of the armor in the special area of the breakwater transition, the amount of overtopping caused by backwater is large, so it is recommended that the same weight of the armor be used as far as possible for the inside and outside of the breakwater. The complex hydrodynamic conditions in these special areas need the attention of designers. (4) At this early stage of breakwater design, values are calculated by the standard formula, but in order to ensure structural safety, physical model tests should be carried out to the greatest extent possible, in order to obtain more reasonable design values.

5. Conclusions

Based on small number of research results reached on the stability and the wave force at the transition zone, and the difficulty inherent in taking design parameters, a physical model test with a scale of 1:36 was carried out. The multi-wave action of 5°, 15°, 35°, and 75° is simulated in the test, which reveals the wave characteristics, the mechanical properties, and the failure mechanism of the transition zone:
(1)
For the unfavorable hydrodynamic environment characteristics of the breakwater transition, the maximum overtopping volume was 0.345 m3 (m·s)−1, the maximum specific wave height was 2.05, and other key parameters were obtained. Compared with the calculation results of the Chinese standard formula and the Van der Meer empirical formula, the maximum overtopping volume and the wave crest height are 1.95 and 1.39 times the calculation of the latter, respectively.
(2)
The wave force on the caisson was directly proportional to the incident wave direction angle and inversely proportional to the water level; that is, the wave action at the low water level β = 75° was the largest, and the horizontal force and the buoyancy force were F xmax = 935.6 kN and F umax = 419.1 kN, respectively. Compared with the calculation results of the Chinese code formula and the Goda empirical formula, the maximum wave force was 1.60 times the calculation of the latter.
(3)
For the instability mechanism of the Accropode at the transition of the breakwater, it was mainly caused by the poor connection between the armor block and the caisson, as well as by the wave energy concentration and other adverse factors.
(4)
For the weight of the Accropode, the designs weighing 2T and 8T were unstable, and were only stable after optimization tests for 8T and 12T. Compared with the calculation results of the Chinese code formula, the maximum test result is 2.50 times the calculation. Therefore, for special areas, the stable weight of the armor block under oblique wave action is not reduced, but is instead multiplied by an amplification factor of 1.47–2.50, according to this test.
The research results solve the practical problems. At the same time, the overtopping volume, the wave height, and the wave force, obtained from the test in the special area of the breakwater transition, have a large deviation from the design values. Therefore, it is necessary to carry out physical model tests for major project construction.

Author Contributions

G.W.: data collection, model design and testing, and data analysis; L.G.: model design and testing, paper preparation, and wave force data processing and analysis; T.Y.: testing, wave overtopping collection, and wave height data processing and analysis; Y.Z.: stability test of armor block, including design scheme and optimization scheme, and data processing and analysis; S.C.: series group model testing, test instrument debugging, test terrain processing, and data verification. All authors have read and agreed to the published version of the manuscript.

Funding

This study was financially supported by the National Natural Science Foundation of China (52101316) Special Fund for Central Scientific Research Institutes (TKS20210110, TKS20220301, and TKS20220110) and Tianjin Science and Technology Foundation (Grant No. 21JCQNJC00480).

Institutional Review Board Statement

Not applicable.

Informed Consent Statement

Not applicable.

Data Availability Statement

Data sharing is applicable to this article, as new data were created or analyzed in this study.

Acknowledgments

This physical model test was conducted in the experimental harbor basin of the Tianjin Research Institute for Water Transport Engineering.

Conflicts of Interest

The authors declare no competing interests. The corresponding author is responsible for submitting a competing interest statement on behalf of all authors of the paper.

References

  1. Wang, M.R. Inquiry on the design method for deep-water breakwater. Port Eng. Technol. 2010, 47, 1–7+41. [Google Scholar] [CrossRef]
  2. Xu, P.L. Discussion on stone dumping and filling construction and quality control of deep-water breakwater. Build. Eng. Technol. Des. 2020, 17, 2392. [Google Scholar] [CrossRef]
  3. Zhuo, M.C. Research on construction technology of stone dumping and filling of deep-water breakwater. Real Estate Guide 2014, 14, 400. [Google Scholar] [CrossRef]
  4. Qiu, X.B.; Qin, J.; Chen, L.Z. Brief analysis on repair design of typhoon damaged breakwater. Port Eng. Technol. 2021, 58, 15–17. [Google Scholar] [CrossRef]
  5. Ju, J. Damage and cause analysis of port breakwater. Urban Archit. 2014, 35, 307. [Google Scholar] [CrossRef]
  6. Ge, L.Z. Research Report on Local Wave Physical Model Test of Breakwater Restoration Project after Typhoon "Shanzhu" in 2018; Tianjin Research Institute for Water Transport Engineering: Tianjin, China, 2019. [Google Scholar]
  7. Zhang, H.C.; Dong, S.; Liu, Y.L.; Li, Y.L. Experimental study on the action of oblique irregular waves on the head of sloping breakwater. Water Transp. Eng. 2013, 4, 20–24. [Google Scholar] [CrossRef]
  8. Chang, M.; Xia, Y.Q.; Zhang, H.C.; Liu, Y.L. Discussion on the stable weight of armor block under the action of oblique waves. Port Eng. Technol. 2017, 54, 40–42+47. [Google Scholar] [CrossRef]
  9. Jiang, Y.P.; Liu, C.X.; Peng, C. Impact of steep slope and gentle slope topography on revetment works under wave action. Water Transp. Eng. 2015, 4, 61–65. [Google Scholar] [CrossRef]
  10. Wu, S.S.; Zhang, W.; Yuan, H.P. Study on stability characteristics of concrete interlocking row at different parts of bottom protection. Water Transp. Eng. 2008, 11, 53–57. [Google Scholar] [CrossRef]
  11. Clemente, D.; Calheiros-Cabral, T.; Rosa-Santos, P.; Taveira-Pinto, F. Hydraulic and Structural Assessment of a Rubble-Mound Breakwater with a Hybrid Wave Energy Converter. J. Mar. Sci. Eng. 2021, 9, 922. [Google Scholar] [CrossRef]
  12. Vicinanza, D.; Contestabile, P.; Quvang Harck Nørgaard, J.Q.H.; Lykke Andersen, T. Innovative rubble mound breakwaters for overtopping wave energy conversion. Coast. Eng. 2014, 88, 154–170. [Google Scholar] [CrossRef]
  13. Kralli, V.-E.; Theodossiou, N.; Karambas, T. Optimal Design of Overtopping Breakwater for Energy Conversion (OBREC) Systems Using the Harmony Search Algorithm. Front. Energy Res. 2019, 7, 11. [Google Scholar] [CrossRef] [Green Version]
  14. Tsang, S.Y.; Liaw, S.R. A design short-crested wave force model for vertical deep-water breakwaters. In Proceedings of the Coastal Engineering ASCE, Tokyo, Japan, 3–6 March 2012; pp. 563–735. [Google Scholar]
  15. Allsop, N.W.H.; Calabrese, M. Impact loadings on vertical walls in directional seas. In Proceedings of the 26th International Conference on Coastal Engineering, Copenhagen, Denmark, 22–26 June 1998; pp. 2056–2068. [Google Scholar]
  16. Battjies, J.A. Effects of short-crestedness on wave loads on long structures. Appl. Ocean. Res. 1982, 4, 165–172. [Google Scholar] [CrossRef]
  17. Goda, Y. Random Seas and Design Marine Structures; University of Tokyo Press: Tokyo, Japan, 1985; pp. 116–119. [Google Scholar]
  18. Goda, Y.; Tabata, T.; Yamamoto, S. Technical Standards and Commentaries for Port and Harbour Facilities in Japan; The Overseas Coastal Area Development Institute of Japan: Tokyo, Japan, 2002. [Google Scholar]
  19. Chen, J.; Duan, Z.H.; Cui, Y.Q.; Guan, J.; Gao, Q.Y.; Cao, C. Experimental Study on Tsunami Local Scour Law in the Entrance Area of Vertical Breakwater. Ocean Bull. 2017, 36, 475–480. [Google Scholar] [CrossRef]
  20. Franco, C.; Van Der Meer, J.W.; Franco, L. Multidirectional wave loads on vertical breakwaters. In Proceedings of the 25th International Conference on Coastal Engineering, Orlando, FL, USA, 2–6 September 1996; pp. 2008–2021. [Google Scholar]
  21. Hong, G.G.; Wen, F.; Wei, B. Theoretical Model and Random Simulation for Nonlinear Interaction of Irregular Waves with Vertical Wall. China Ocean Eng. 1993, 7, 263–288. [Google Scholar]
  22. Madrigal, B.G. Loads on caisson breakwaters in multidirectional random non-breaking seas. In Proceedings of the 5th International Conference on Coastal and Port Engineering in Developing Countries, Cape Town, South Africa, 29 September–2 October 2019; pp. 1314–1326. [Google Scholar]
  23. Li, B.X.; Yu, Y.X.; Zhang, N.C. Wave force of multi-directional random wave acting on vertical breakwater. J. Dalian Univ. Technol. 2004, 44, 575–581. [Google Scholar] [CrossRef]
  24. Yu, Y.X.; Li, B.X.; Zhang, N.C.; Hu, J.P. Wave load of oblique and multi-directional irregular waves acting on straight wall embankment. Water Transp. Eng. 2011, 1, 24–28. [Google Scholar] [CrossRef]
  25. Hsu, J.C. Short Peak Wave. Coastal and Marine Engineering Manual; Dalian University of Technology Press: Dalian, China, 1922; pp. 69–129. [Google Scholar]
  26. Fenton, J.D. Wave forces on vertical walls. J. Waterw. Port Coast. Ocean Eng. 1985, 111, 693–718. [Google Scholar] [CrossRef]
  27. Wang, H.L.; Zhang, Y.; Zhao, J. Wave force analysis on small angle change of wave face of vertical breakwater. Water Transp. Eng. 2022, 29–38, 44. [Google Scholar] [CrossRef]
  28. Hsu, H.C.; Chen, Y.Y.; Chen, Y.R.; Li, M.S. Experimental Study of Forces Influencing Vertical Breakwater under Extreme Waves. Water 2022, 14, 657. [Google Scholar] [CrossRef]
  29. Cuomo, G.; Allsop, W.; Bruce, T.; Pearson, J. Breaking wave loads at vertical seawalls and breakwaters. Coast. Eng. 2010, 57, 424–439. [Google Scholar] [CrossRef] [Green Version]
  30. Alam, M.S.; Winter, A.O.; Galant, G.; Shekhar, K.; Barbosa, A.R.; Motley, M.R.; Eberhard, M.O.; Cox, D.T.; Arduino, P.; Lomonaco, P. Tsunami-Like Wave-Induced Lateral and Uplift Pressures and Forces on an Elevated Coastal Structure. J. Water. Port Coast. Ocean Eng. 2020, 146, 04020008. [Google Scholar] [CrossRef]
  31. Ge, L.; Chen, H.; Chen, S.; Liu, H.Y. Experimental Study on Wave Current Characteristics and Stability of the Junction of Artificial Island and Subsea Tunnel. J. Mar. Sci. Eng. 2022, 10, 1525. [Google Scholar] [CrossRef]
  32. Zhang, H.C.; Dong, S.; Liu, Y.L.; Wang, H.F. The law of oblique wave propagation along vertical breakwater and its influence on the bank slope breakwater. In Proceedings of the 15th China Ocean (Coastal) Engineering Symposium, Taiyuan China, 3–6 August 2011; pp. 727–731. [Google Scholar]
  33. Ge, L.Z.; Luan, Y.N.; Chen, H.B.; Liu, H.Y. Experimental study on stability of breakwater junction block under oblique wave action and wave force on caisson structure. Oceanogr. Bull. 2021, 40, 113–120. [Google Scholar] [CrossRef]
  34. Kuai, Y.R.; Qi, M.L.; Li, J.Z. Wave force analysis of bridge substructure near the coast. J. Zhejiang Univ. Eng. Ed. 2018, 52, 2356–2364. [Google Scholar] [CrossRef]
  35. Shao, T.Z.; Guo, F.L. Research on the Layout of Artificial Beach Sand Retaining Dike in Rizhao Port Return to Sea Project. Waterw. Port 2020, 41, 157–165. [Google Scholar] [CrossRef]
  36. Ministry of Transport. Technical Code for Simulation Test of Water Transportation Engineering; People’s Communications Publishing House Co., Ltd.: Beijing, China, 2021. [Google Scholar]
  37. Ministry of Transport. Code of Hydrology for Harbor and Waterway; People’s Communications Publishing House Co., Ltd.: Beijing, China, 2015. [Google Scholar]
  38. Bruce, T.; Van der Meer, J.W.; Franco, L.; Pearson, J. A comparison of overtopping performance of different rubble mound breakwater armour. In Proceedings of the 30th International Conference on Coastal Engineering, San Diego, CA,,USA, 3–8 September 2006; pp. 1034–1043. [Google Scholar]
  39. Ministry of Transport. Code for Design of Breakwater and Revetment; People’s Communications Publishing House Co., Ltd.: Beijing, China, 2018. [Google Scholar]
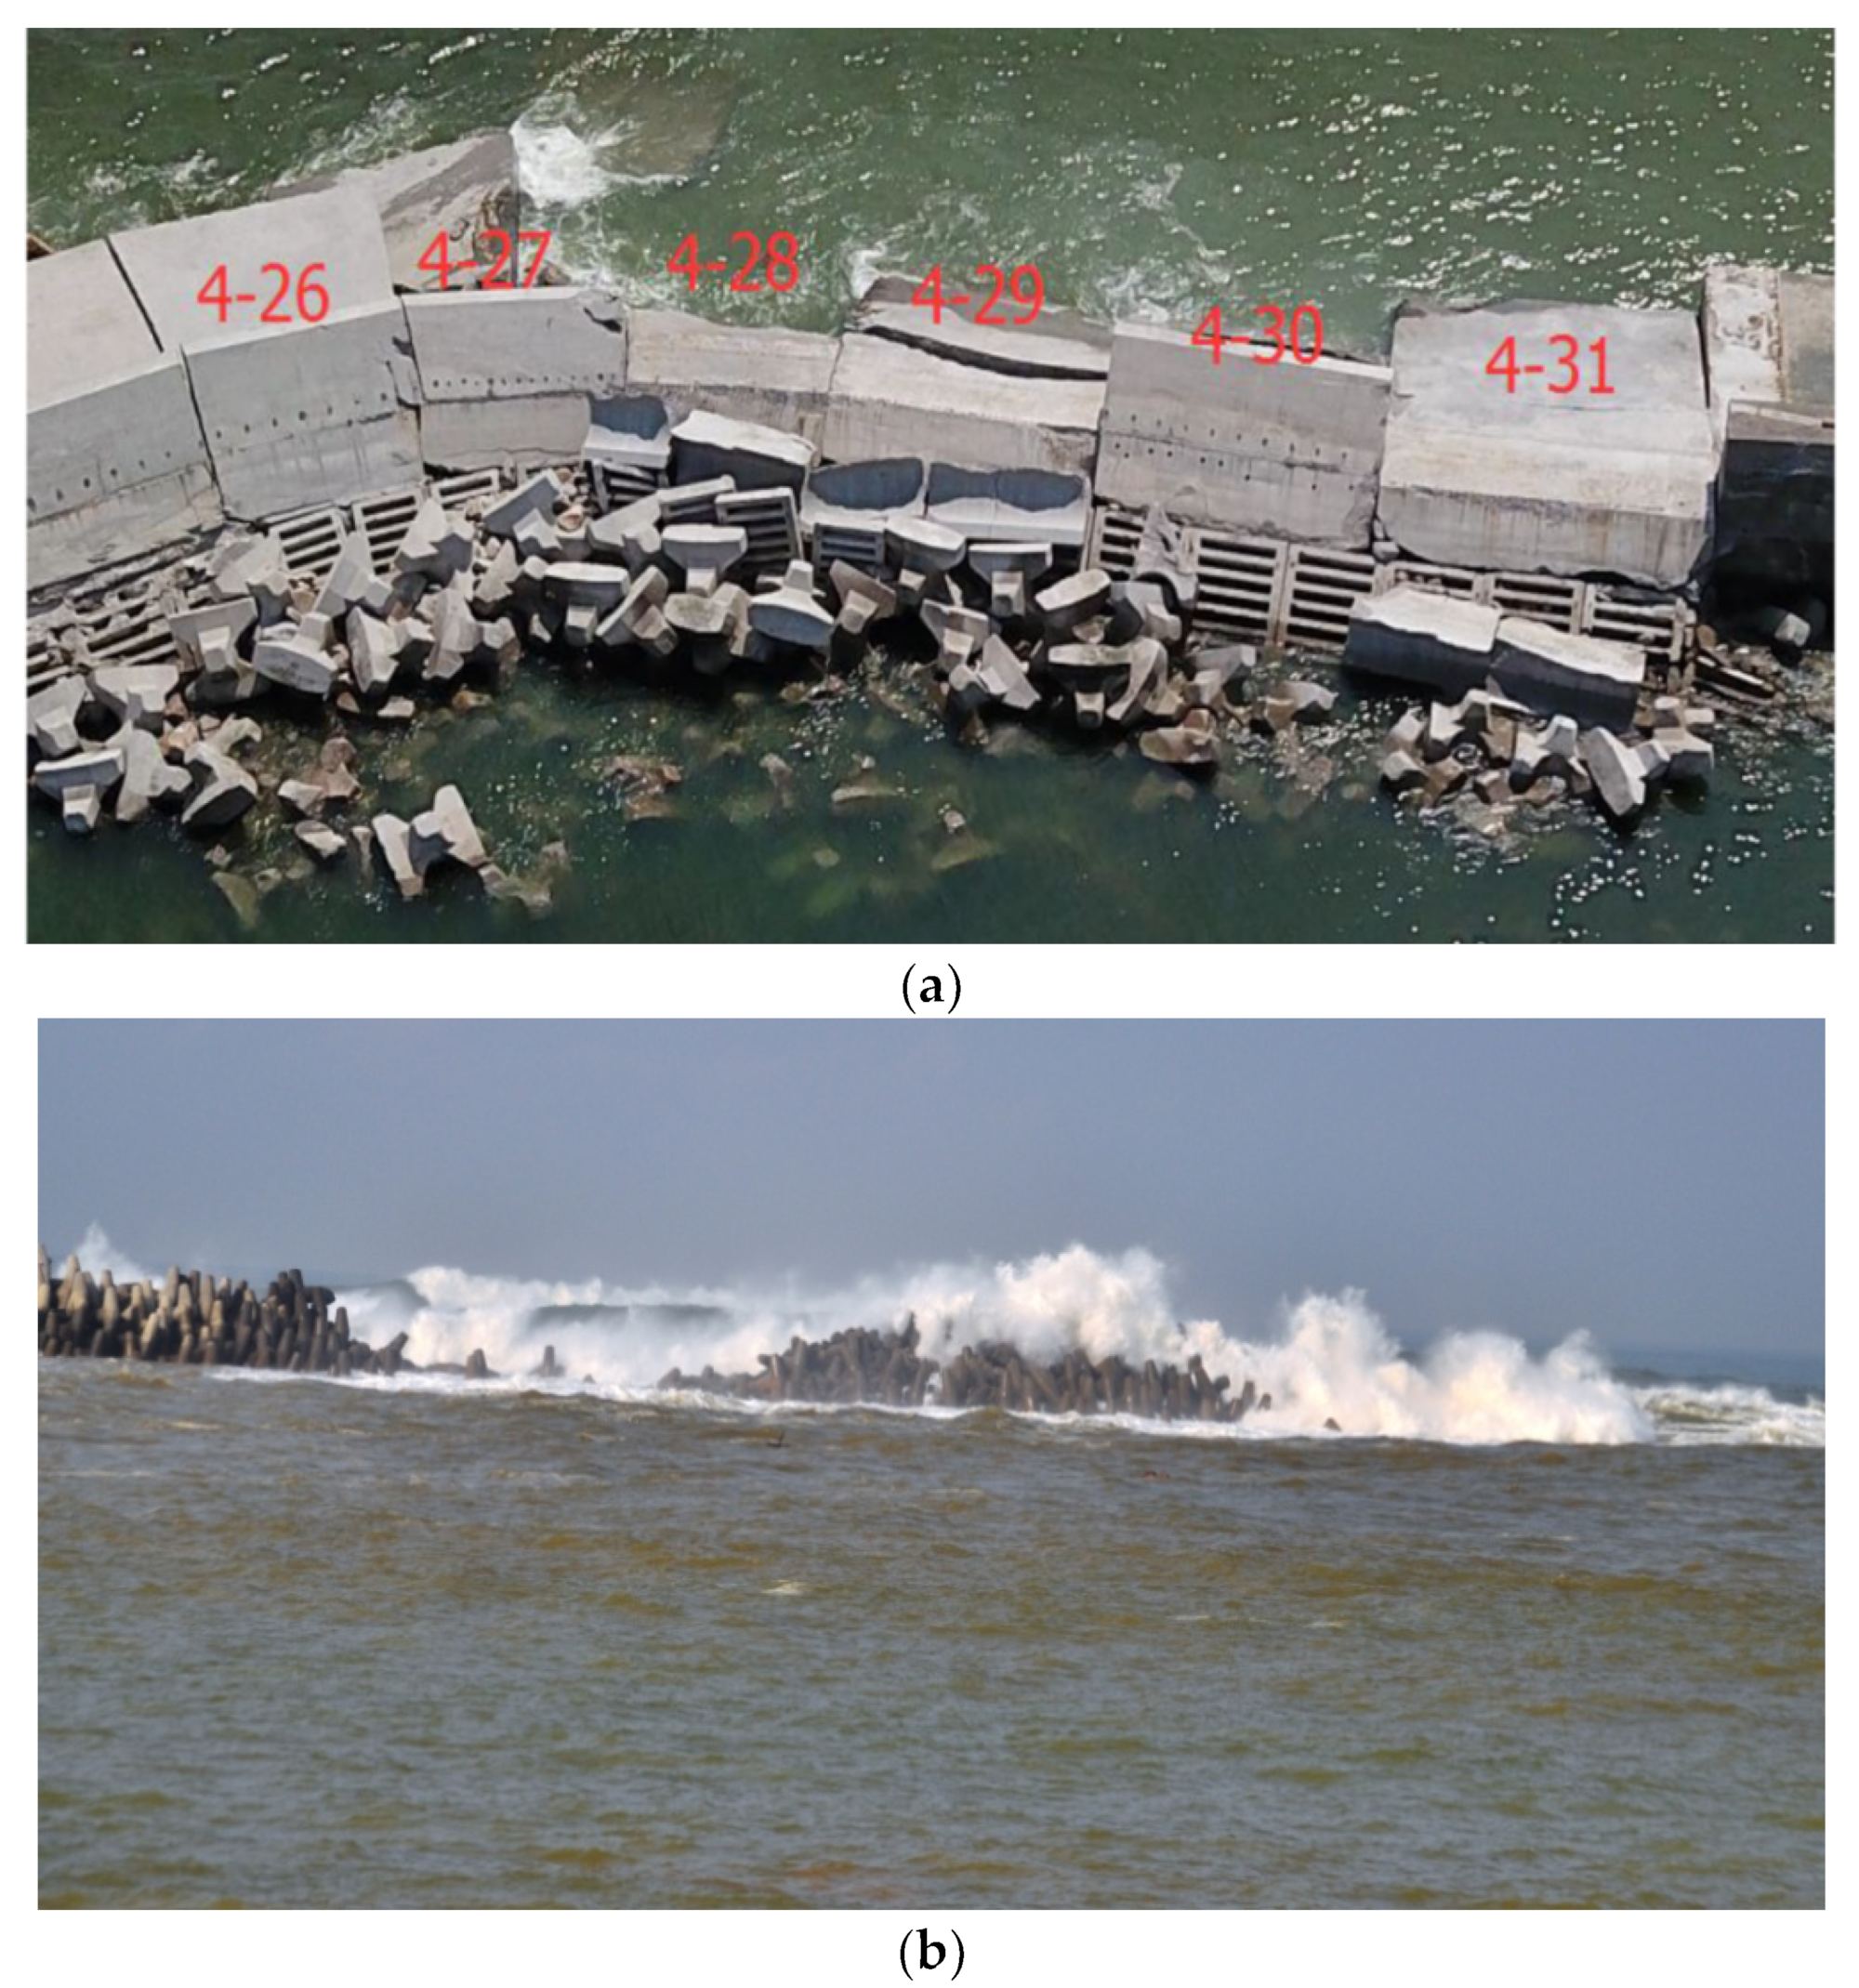
Figure 1. Site damage and instability of breakwater: (a) damage of transition zone of different structures of breakwater; (b) damage of breakwater head with the same structure.
Jmse 11 00631 g001
Figure 2. Layout plan of the transition of breakwater project.
Jmse 11 00631 g002
Figure 3. Cross-section of the transition of the different structures.
Jmse 11 00631 g003
Figure 4. Layout plan of the breakwater transition on the model.
Jmse 11 00631 g004
Figure 5. Layout of the measuring points and definition of the coordinate system (unit: m): (a) arrangement of the wave height measuring points; (b) arrangement of the pressure measuring points.
Jmse 11 00631 g005
Figure 6. Overtopping and whirlpool phenomenon at the transition under the action of waves: (a) overtopping at a high water level; (b) whirlpool phenomenon.
Jmse 11 00631 g006
Figure 7. Synchronization rate of P i and P max at the time of the maximum wave force.
Jmse 11 00631 g007
Figure 8. Layout of the measuring points and definition of the coordinate system (unit: m): (a) arrangement of the wave height measuring points; (b) arrangement of the pressure measuring points.
Jmse 11 00631 g008
Figure 9. Comparison of the stability of the armor block before and after the test. (a) Block placement before testing at sea side; (c) Instability of block after testing at sea side; (b) Block placement before testing at harbor side; (d) Instability of block after testing at harbor side.
Jmse 11 00631 g009aJmse 11 00631 g009b
Table 1. Test conditions.
TypeWave DirectionW.L (m) H 1 %   ( m ) Hs (m) T m   ( s )
Prototype value5°, 15°, 35°, 75°+5.906.774.888.9
+0.575.243.838.9
Model value5°, 15°, 35°, 75°+0.160.190.141.48
+0.020.150.111.48
NOTE: W.L is the water level; H 1 % is wave height with 1% cumulative frequency; Hs is the significant wave height; T m is the average period; the same below.
Table 2. Representative area of pressure measuring points.
PointSj(m2)PointSj(m2)
P129.9P1097.2
P225.2P1170.2
P333.5P1251.8
P441.8P13103.0
P535.3P14118.4
P686.0P15126.4
P779.6P16132.1
P875.2P1774.9
P983.5//
Table 3. Wave overtopping at the transition of the breakwater.
Wave DirectionQ(m3·(m·s)−1)Correction Factor
Test ValueCalculated Value
Chinese StandardsVan der MeerChinese StandardsVan der Meer
0.0560.0310.0361.821.56
15°0.1340.0690.0821.951.63
35°0.3450.2050.2201.681.57
75°0.2740.1560.1451.761.89
Table 4. Results of the wave height and wave crest height.
WavePointW.L (+0.57 m)W.L (+5.90 m)
Specific Wave HeightMaximum Wave Crest HeightSpecific Wave HeightMaximum Wave Crest Height
Test
value
Calculated
Value
Correction FactorTest
Value
Calculated
Value
Correction
Factor
B11.385.013.741.341.254.793.661.31
B21.585.601.501.395.801.58
B31.425.311.421.285.351.46
B41.354.961.331.214.711.29
15°B11.425.844.211.391.305.794.051.43
B21.837.081.681.526.911.71
B31.706.151.461.396.041.49
B41.535.991.421.285.791.43
35°B11.647.334.771.541.597.754.861.59
B22.058.901.871.919.321.59
B31.867.661.611.748.491.59
B41.657.121.491.537.631.59
75°B11.689.704.931.971.618.744.731.85
B21.879.171.861.568.431.78
B31.668.091.641.427.601.61
B41.497.551.531.366.581.39
Note: Specific wave height is H1% of synthetic wave height and H1% of design wave height.
Table 5. Forces on the caissons calculated by tests and specifications under different conditions.
W.LWave Direction F x / kN F u / kN
Test ValueCalculated
Value
Correction FactorTest
Value
Calculated
Value
Correction Factor
C-SG-EC-SG-EC-SG-EC-SG-E
+5.90 m445.5320.5313.71.391.42228.3191.8184.11.191.24
15°654.2457.5503.21.431.30292.9242.1227.11.211.29
35°718.0448.8531.91.601.35278.0210.6237.61.321.17
75°787.1521.3558.21.511.41337.8263.9270.21.281.25
+0.57 m489.7371.0333.11.321.47289.9256.5239.61.131.21
15°644.3477.3473.81.351.36349.0277.0283.71.261.23
35°835.5535.6668.41.561.25358.5261.7267.51.371.34
75°935.6588.4673.11.591.39419.1332.6358.21.261.17
Note: C-S stands for Chinese standards; G-E stands for Goda Equation.
Table 6. Comparison of the test and calculated maximum pressure results.
W.LPointPressure (kPa)PointPressure (kPa)
Test ValueCalculated
Value
Correction FactorTest ValueCalculated
Value
Correction Factor
+5.90 mP115.212.51.22P1041.137.11.11
P219.316.91.14P1133.231.01.07
P330.925.81.20P1230.226.81.13
P465.955.51.19P1327.225.81.05
P559.850.31.19P1425.622.81.13
P653.742.91.25P1519.817.11.16
P748.537.91.28P1616.212.91.25
P847.438.41.23P1715.512.81.22
P946.141.01.13////
+0.57 mP11.11.01.13P1040.133.81.19
P29.38.51.09P1138.932.31.21
P310.78.31.29P1225.722.71.13
P411.29.21.22P1320.219.51.04
P515.512.81.22P1415.314.41.06
P622.520.51.10P1514.414.21.02
P743.838.81.13P1610.09.21.09
P846.742.21.11P173.13.01.04
P942.139.61.06////
Table 7. Stability weight of Accropode tested and calculated under different wave angles.
Wave
Direction
Test Stable Weight of AccropodeCalculated Stable Weight
of Accropoder
Design Stable Weight
of Accropode
Outside
(T)
Inside
(T)
K D . β All
Area
(T)
Correction FactorOutside
(T)
Inside
(T)
Correction Factor
OutsideInside
8.06.031.63.22.508.02.01.03.0
15°10.06.023.74.32.338.02.01.33.0
35°12.06.019.45.62.148.02.01.53.0
75°10.08.015.26.81.478.02.01.34.0
Disclaimer/Publisher’s Note: The statements, opinions and data contained in all publications are solely those of the individual author(s) and contributor(s) and not of MDPI and/or the editor(s). MDPI and/or the editor(s) disclaim responsibility for any injury to people or property resulting from any ideas, methods, instructions or products referred to in the content.