1. Introduction
Submarine pipelines are a key element in any offshore oil field development [
1] and they are regarded as the main structures for the transportation of oil and gas on the seabed. These structures are exposed to a harsh seawater environment, which may lead to the deterioration of structural properties [
2]. Corrosion on the pipe surface after a long time of servicing in the seawater environment is one of the common deterioration mechanisms in pipelines [
3].
In addition, due to the erosion and unevenness of the seabed, a gap is often formed between some segments of the pipeline and the surface of the seabed. Periodic vibration may occur when the frequency of the vortex generated by current flows is close to the frequency of the free-spanning pipeline [
4,
5]. The long-term vibration may lead to fatigue failure of the pipeline. Also, motions of floating platforms, thermal cycles, and start-up and shut-down cycles have been regarded as another source of fatigue [
6].
Additionally, the corrosive environment significantly affects the crack nucleation stage and reduces fatigue strength in dry air conditions [
7]. Corrosion may enhance fatigue crack growth in the presence of cyclic loads, once cracks are initiated [
8,
9]. Therefore, corrosion fatigue crack growth is one of the most frequent phenomena which leads to the cracking of subsea pipelines resulting in a reduction of the resistance capacity and loss of asset integrity during their service life [
5]. Although submarine pipelines are usually associated with the use of high-quality materials and innovative technology, the failure of these structures may result in serious environmental and economic consequences [
10].
Fatigue cracking is affected by different kinds of uncertainties, including material properties, model choice, and its parameters, measurement data such as the number of cycles and crack length, and also simplification and idealization in analytical and numerical evaluations [
11,
12]. Therefore, the fatigue process should be considered a stochastic problem taking into account different sources of variability and uncertainty [
13]. Probabilistic models related to structural deterioration are needed for planning structural maintenance and risk-based decision for marine structures [
14,
15,
16,
17]. Reliability methods provide a framework to consider the uncertainties and stochastic behaviour of the random variables on safety assessment and service-life prediction of structures which are important steps for risk-based maintenance and periodic inspection.
Limit state-based and data-based are the two main approaches in reliability analysis. The former approach is based on structural reliability theory combined with degradation models of structural resistance. In this approach, statistical information related to the basic variables of the limit state function is required. Ultimate, serviceability, and fatigue are major common limit states in structures. Ultimate limit state-based has been largely used in the reliability assessment of pipelines in recent years [
18,
19,
20,
21,
22]. Also, a few studies have investigated the reliability level of pipelines regarding fatigue limit state. Shabani et al. [
23] estimated the fatigue failure probability of subsea pipelines due to the vortex-induced vibration. He and Zhou [
24] investigated the fatigue reliability of dented pipelines. They applied the S-N curve to define the limit state function. Also, Pinheiro et al. [
25] proposed a new fatigue life assessment methodology for steel pipelines containing plain dents. They defined analytical expressions to estimate stress concentration factors for different types of dent shapes.
Another approach for estimating the reliability of structures is based on the statistical analysis of the failure data. The accuracy of this approach depends on the quality and quantity of the experimental data [
13]. Garbatov and Guedes Soares [
14] used historical data for structural maintenance planning of corroded deck plates of tankers. They also used the data-based approach to fatigue reliability assessment of dented pipelines by estimating the distribution of the number of load cycles to achieve crack initiation. They assumed Weibull distribution for the failure load cycles that fit the limited experimental data. Dong et al. [
26] investigated the fatigue reliability of single-sided girth welds in offshore pipelines and risers based on the calibration of the crack propagation analyses to the S–N data.
S-N curve-based damage mechanics and fracture mechanics are the two main approaches to estimating the crack initiation and crack propagation of marine structures due to cyclic loads, respectively [
27]. Most of the previous research on fatigue reliability-based assessment of pipelines concentrated on the S-N curve based on damage mechanics [
14,
24]. The S-N curve predicts the strength of non-cracked structures based on the crack initiation of a critical section as a function of the number of load cycles [
28]. The curve is depicted by applying cyclic loads on smooth and non-cracked specimens [
2]. However, mechanical damages in the form of cracks and defects are inevitable in the pipeline due to the operation activities, fabrication errors, and also corrosive seawater environment [
29]. The fracture mechanics approaches take into account the initial cracks in fatigue life assessment and can be used in risk and reliability analysis of cracked structural components.
The main purpose of this study is to investigate the fracture mechanics-based fatigue reliability analysis of submarine pipelines in a corrosive environment. The main challenge in the fatigue reliability assessment of cracked pipelines is the lack of sufficient experimental or field data since the production of experimental fatigue data to construct a distribution is difficult and time-consuming. With such limited data, the Bayesian approach can be suitable. This approach has been applied for reliability assessment and maintenance and inspection planning of structures [
30,
31,
32,
33].
In this study, the Bayesian method is used to incorporate limited experimental data into a fracture mechanics-based model of fatigue to estimate the reliability of pipelines. The proposed methodology to estimate the fatigue failure probability has three main steps. At first, the probabilistic distribution of the parameters of the fatigue model is obtained using the Bayesian updating approach regarding associated uncertainties. Then, the distribution of load cycles at the critical size is estimated based on the updated model and defined limit state function. Markov Chain Monte Carlo (MCMC) simulation is used for draws the samples of the distribution. Finally, having a large number of generated failure data, the fatigue failure probability of pipelines can be calculated using the data-based reliability approach. The approach applied in this study is based on the limited experimental data related to the corrosion fatigue crack growth of serviced API 5L X56 submarine pipelines.
This study is organized as follows: In
Section 2, a fatigue crack growth model based on Paris’ law is introduced. Available experimental data for API 5L X56 submarine pipelines is presented in
Section 3. In
Section 4, probabilistic modelling of fatigue crack growth is developed based on the Bayesian approach for submarine pipeline, and the updated distribution of model parameters is obtained based on the experimental data and physic-based fatigue model. Finally, the reliability level of a submarine pipeline is evaluated, and the effect of different parameters on reliability analysis is investigated through a sensitivity study.
2. Fatigue Crack Growth Model
In general, the fatigue crack growth process includes three regions: Region I, which represents the early development of a fatigue crack with a small value of the crack growth rate, region II which represents the intermediate crack propagation with stable crack growth and region III, with a rapid fatigue crack growth. In the intermediate stage, the crack growth rate can be expressed based on the Paris law as follow [
34]:
where
a is the crack length,
N is the number of load cycles,
C and
m are material constants. The stress range intensity factor, Δ
K is proportional to stress range Δ
σ, geometry function
Y(
a), and the square root of the crack length as follows:
By integration of Equation (1), the number of cycles
N which leads to the crack length
aN can be obtained as:
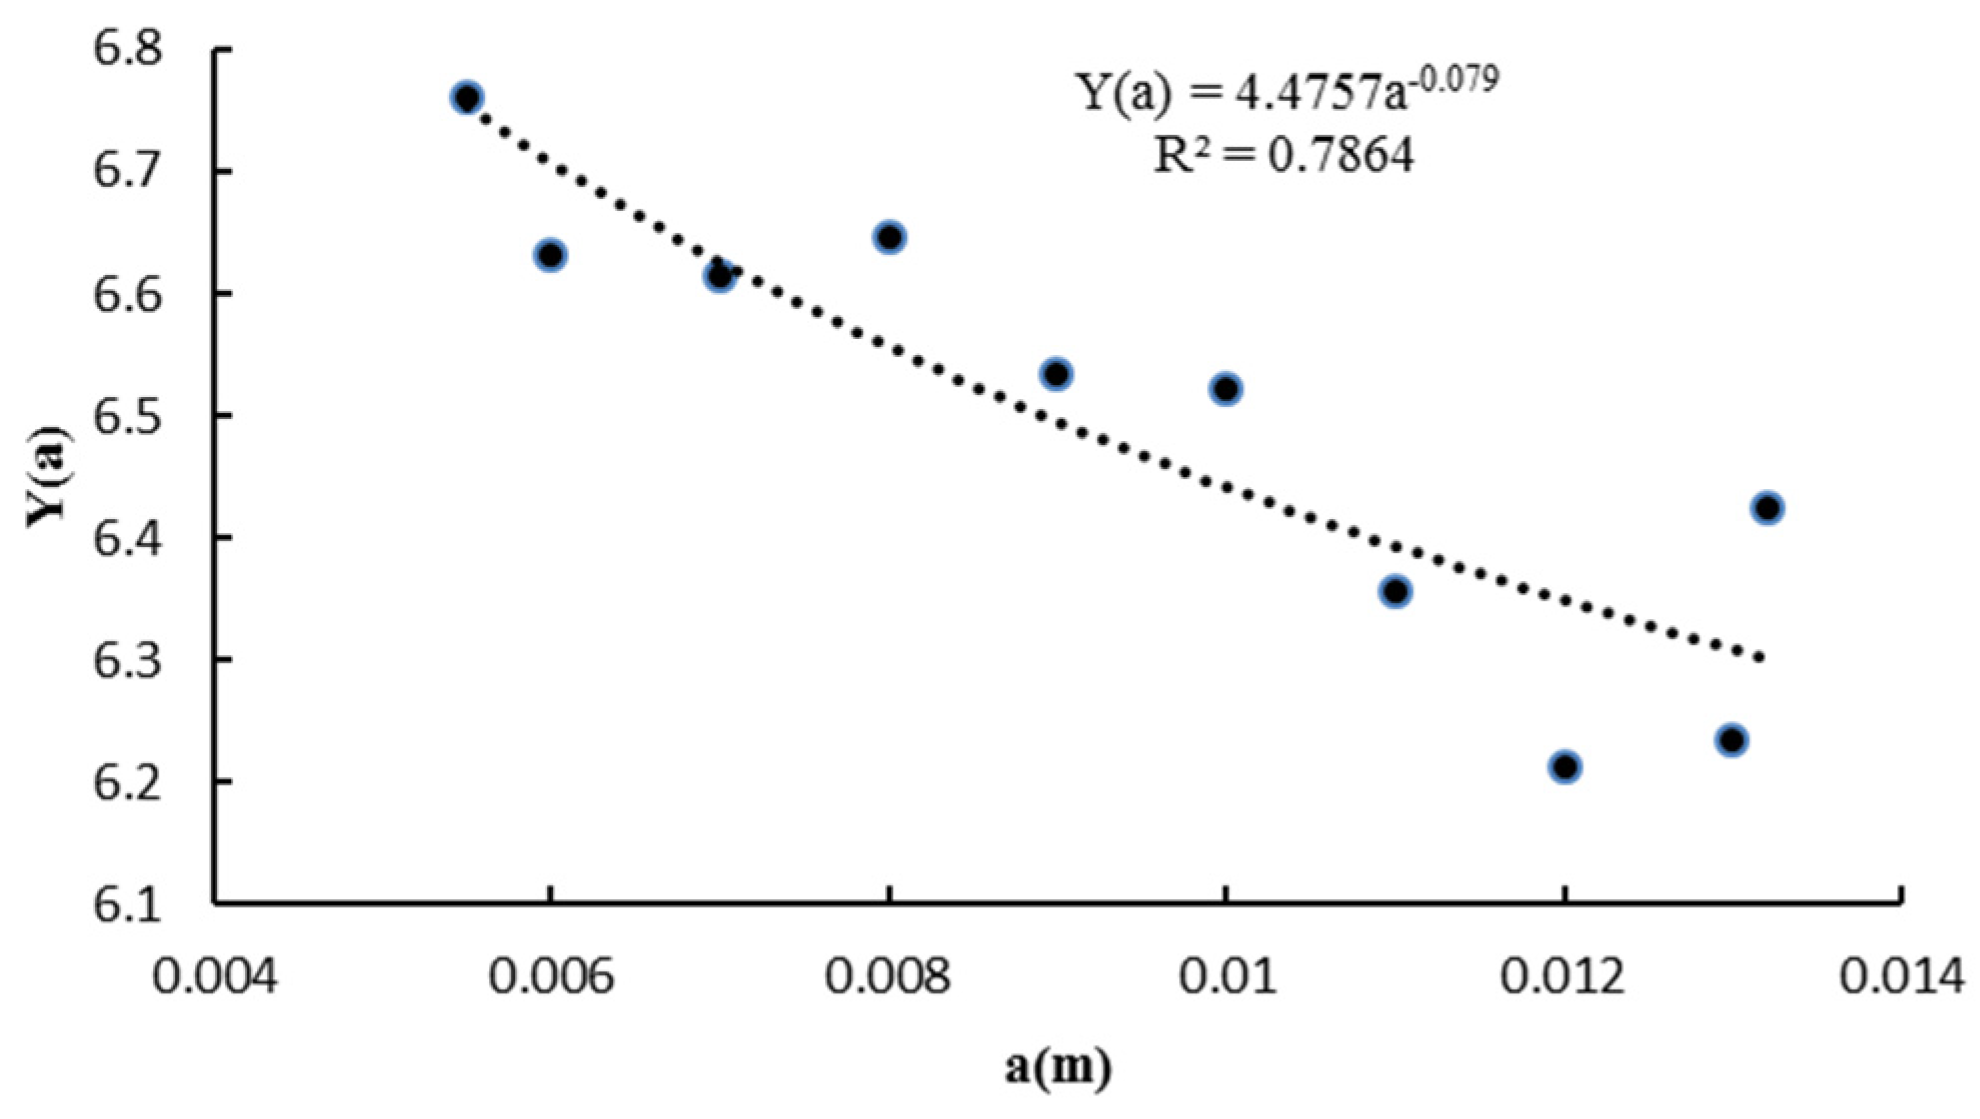
In the fatigue analysis of marine structures, the stress range is usually assumed to follow the Weibull distribution [
35,
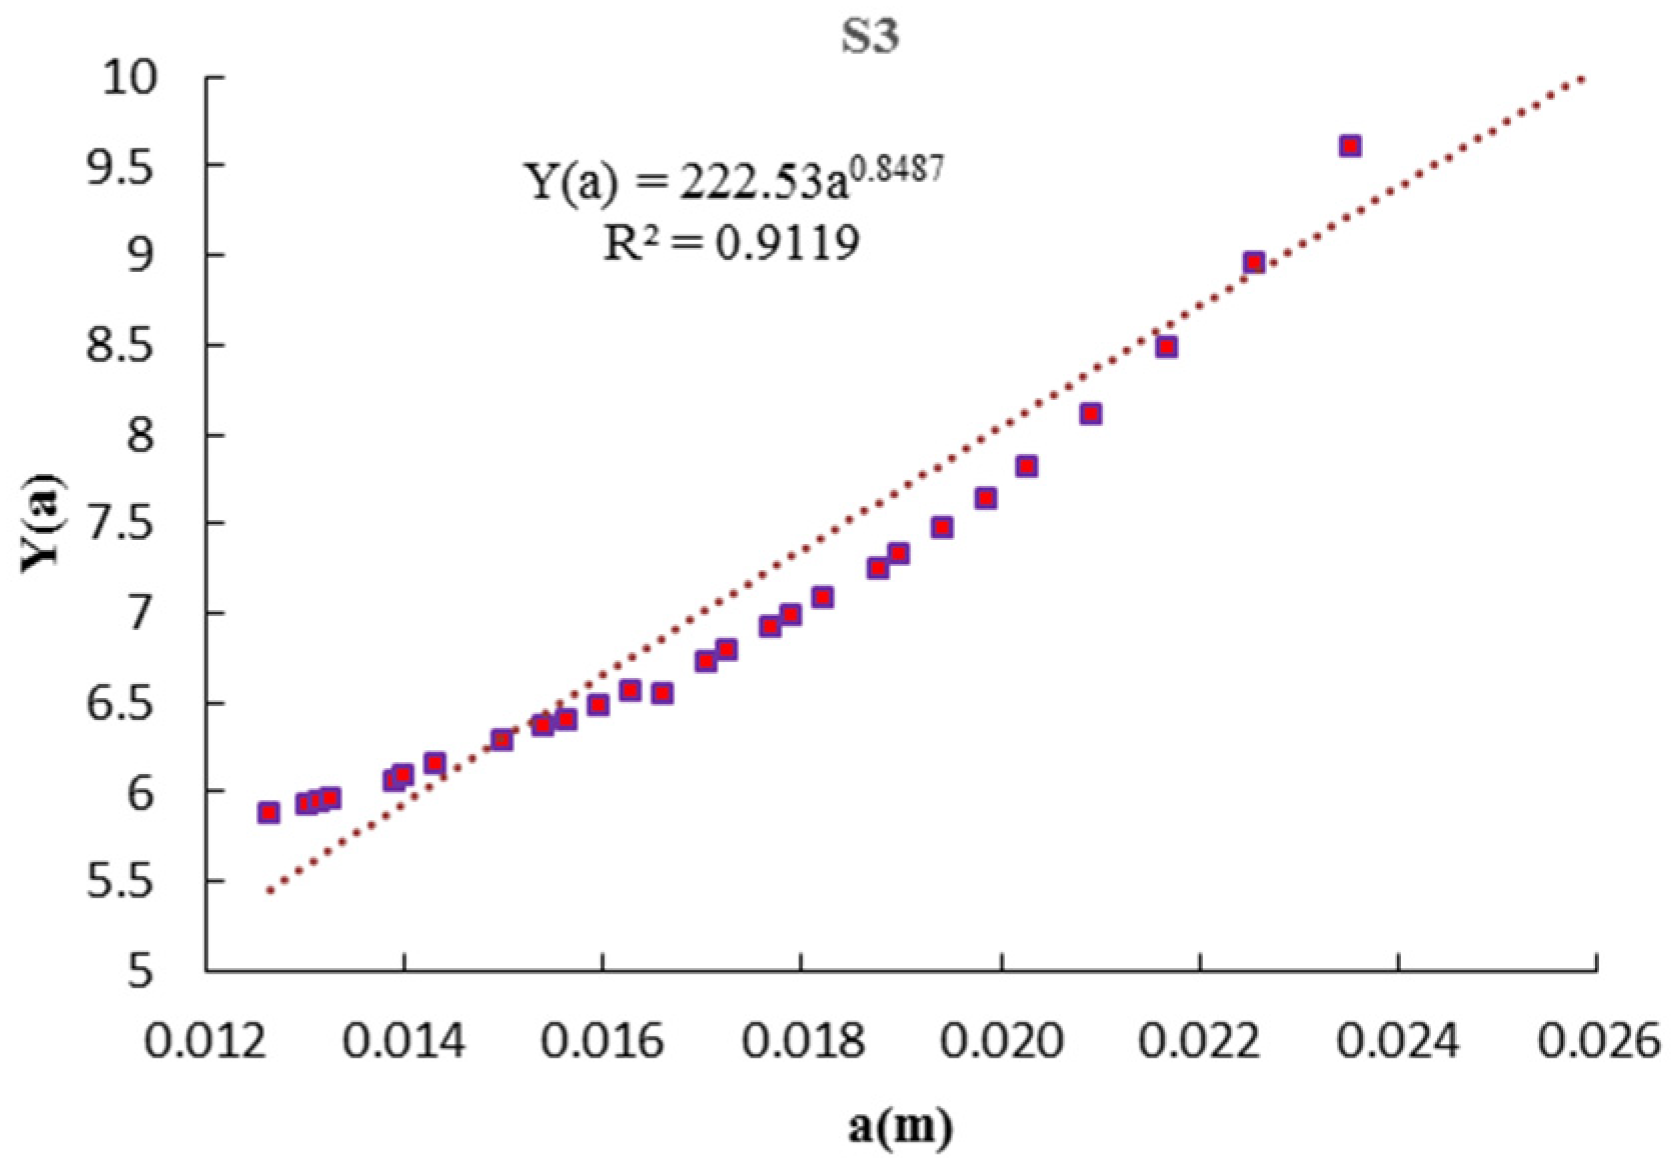
36]. Regarding the Weibull distribution for the stress range and geometry factor as a power function [
15,
37],
Y(
a)
= AaB, an analytical solution for Equation (3) can be obtained as:
where
u and
α are scale and shape parameters of the Weibull distribution of stress range and Γ is the Gamma function. Since the investigated pipelines are located in a corrosive environment, the interaction between corrosion and fatigue needs to be considered in the physics-based fatigue model. Corrosion-enhance fatigue crack growth can be modelled by the production of a correction factor,
Ccr, to the material parameters
C [
38], as indicated in the Equation (4). Assuming the failure limit state function as
g(X) = acr − aN, the number of cycles to failure can be calculated based on Equation (4) regarding
acr = aN.However, the statistical information of the basic random variables vector is required to obtain the probabilistic distribution function of load cycles to failure. Regarding fracture mechanic-based fatigue reliability analysis of submarine pipelines, such information is not available. Instead, the limited experimental data related to the fatigue crack growth of pipelines (a-N curve) are available in the literature. In the first step of this study, the Bayesian approach has been applied to obtain the probabilistic model of fatigue crack growth parameters, which is explained in
Section 4.
4. Probabilistic Modelling of Fatigue Crack Growth
Consider
M as a chosen model, which is a function of the vector modelling parameter
θ, and
D as a quantity of interest to be assessed. The probabilistic description of
D can be calculated as [
39,
40]:
In Equation (6), ε is the combination of measurement and model parameter uncertainties, and z is the independent model variables where those values are fixed during the analysis. Given the probability distribution function of model parameters (i.e., stress range, material parameters m, C and Ccr and geometry function A and B in Equation (4)), the probabilistic result of model output (i.e., crack length at each number of load cycles (N, aN) in Equation (4)) can be calculated.
However, the real challenge arises when the statistical parameters of the input variables are not available. In this case, to obtain the probabilistic response of a physic-based model such as Equation (4), the probability distribution function of input variables describing the material, geometric, and loads need to be updated based on a given set of observation
D [
39]. In this study, the experimental results of the pipeline crack growth in a corrosive environment are regarded as the measured data.
The Bayesian approach provides a framework to evaluate the posterior distribution function of model parameters based on prior information and observed experimental data. The main advantage of the Bayesian updating approach lies in its ability to combine different sources of uncertainty based on Bayes’ theorem:
where
P(θ|D) represents the posterior distribution of the model parameters after being updated.
P(θ) is the probability distribution function of model parameters θ before updating. The prior distribution may be estimated based on various prior information such as expert knowledge, experimental data, and empirical judgment. Estimating the prior distribution depends on the amount of available information [
41]. In the practical engineering problem, the normal distribution can be employed as a prior distribution when the mean value of parameters is known, [
39]. In addition, uniform prior is assumed when there is no information about the parameters.
P(D|θ) represents the likelihood function of the occurrence of the measurement data
D given model parameters
θ. The likelihood function indicates the agreement between the response of the model and the target measured values. In this study, the normal distribution, which is a common choice of the likelihood function, is regarded as [
42]:
where
k is the number of measured data (experimental crack length for different numbers of cycles),
Dj is the
jth measured crack length and
Mj(
θ) is the
jth computed crack length based on the chosen model with the parameters
θ.
εj represents the error between the model output and experimental results of the crack length and
ϭj is its standard variation. In fact, ε is the combination of modelling and measurement errors due to bias and noise of the data. Under the assumption that
ε is just affected by the measurement noise, it can be modelled by a zero mean normal distribution with the standard deviation of
ϭ [
43]. In this study,
ϭ is regarded as an unknown variable and its probability distribution function is calculated based on the updating process. Regarding
k observed experimental data
D = {D1, D2, …, Dk}, the posterior distribution can be expressed as:
Equation (9) indicates the proportional relation between the posterior distribution with the prior distribution and the likelihood function. A normalizing constant can be multiplied to the right side of Equation (7) to make the posterior distribution integration 1. The posterior distribution in Equation (8) represents the updated distribution of model parameters in the presence of some observed data.
In general, the posterior distribution is a product of complex functions and it is not possible to generate samples directly from it [
12,
44,
45]. In such a case, sampling-based methods such as advanced Monte Carlo sampling methods can be used [
12]. In this paper MCMC simulation, specifically the Metropolis-Hasting (MH) algorithm [
46], is applied to generate samples based on the posterior distribution of interest. MH algorithm can generate samples from any probability distribution with a given posterior function such as Equation (9). The MH sampler is a random walk algorithm where the next candidate sample
θi+1 is generated only based on the current sample
θi. Each candidate sample is generated based on the so-called proposal distribution
q(
θi+1,
θi), which is a symmetrical function, that is
q(
θi+1,
θi)=
q(
θi,
θi+1). The generated candidate samples are accepted or rejected based on an acceptance probability which can be defined as follows:
Equation (10) implies that the candidate samples are accepted if they have a higher probability compared to the current samples. In practical problems, this criterion can be achieved by comparing the acceptance probability r with generating a random number s from a uniform distribution between 0 and 1, s~U [0,1]. The proposed sample is accepted if r(θi, θi+1) ≥ s, otherwise it is rejected.
The main challenges of MCMC are related to the initial samples since they are in general, not distributed according to the stationary distribution. Therefore, the initial samples may be located far away from the posterior distribution and move very slowly to the high-probability regions [
42]. In such a case, many samples need to be generated to converge the posterior distribution. To avoid the impact of the inaccurate initial samples, a portion of initial samples
nburn-in can be discarded.
For the investigated pipeline, the material parameters
m and
C, the corrosion-enhancement parameter
Ccr and the error between model output and observed data
ε are considered random variables and their PDF need to be updated. Gao et al. [
2] proposed the material parameters of
m = 2.66 and
lnC = −24.15 for the submarine pipelines of API X56 steel materials. Also, some studies proposed the C
cr of 3 for steel materials under free corrosion conditions [
38,
47]. In this study, the previous literature results combined with engineering judgment are used to estimate the prior distribution of model parameters. The normal distribution with the mean values of 2.66, −24.15, and 3 and the standard deviation of 0.25, 0.5, and 0.2 are considered for the prior distribution of
m,
lnC, and C
cr. It should be mentioned that for case
S3, which has a larger value of
R,
lnC = −22.15 is considered. In addition, the likelihood function is modelled as a normal distribution with a standard deviation of
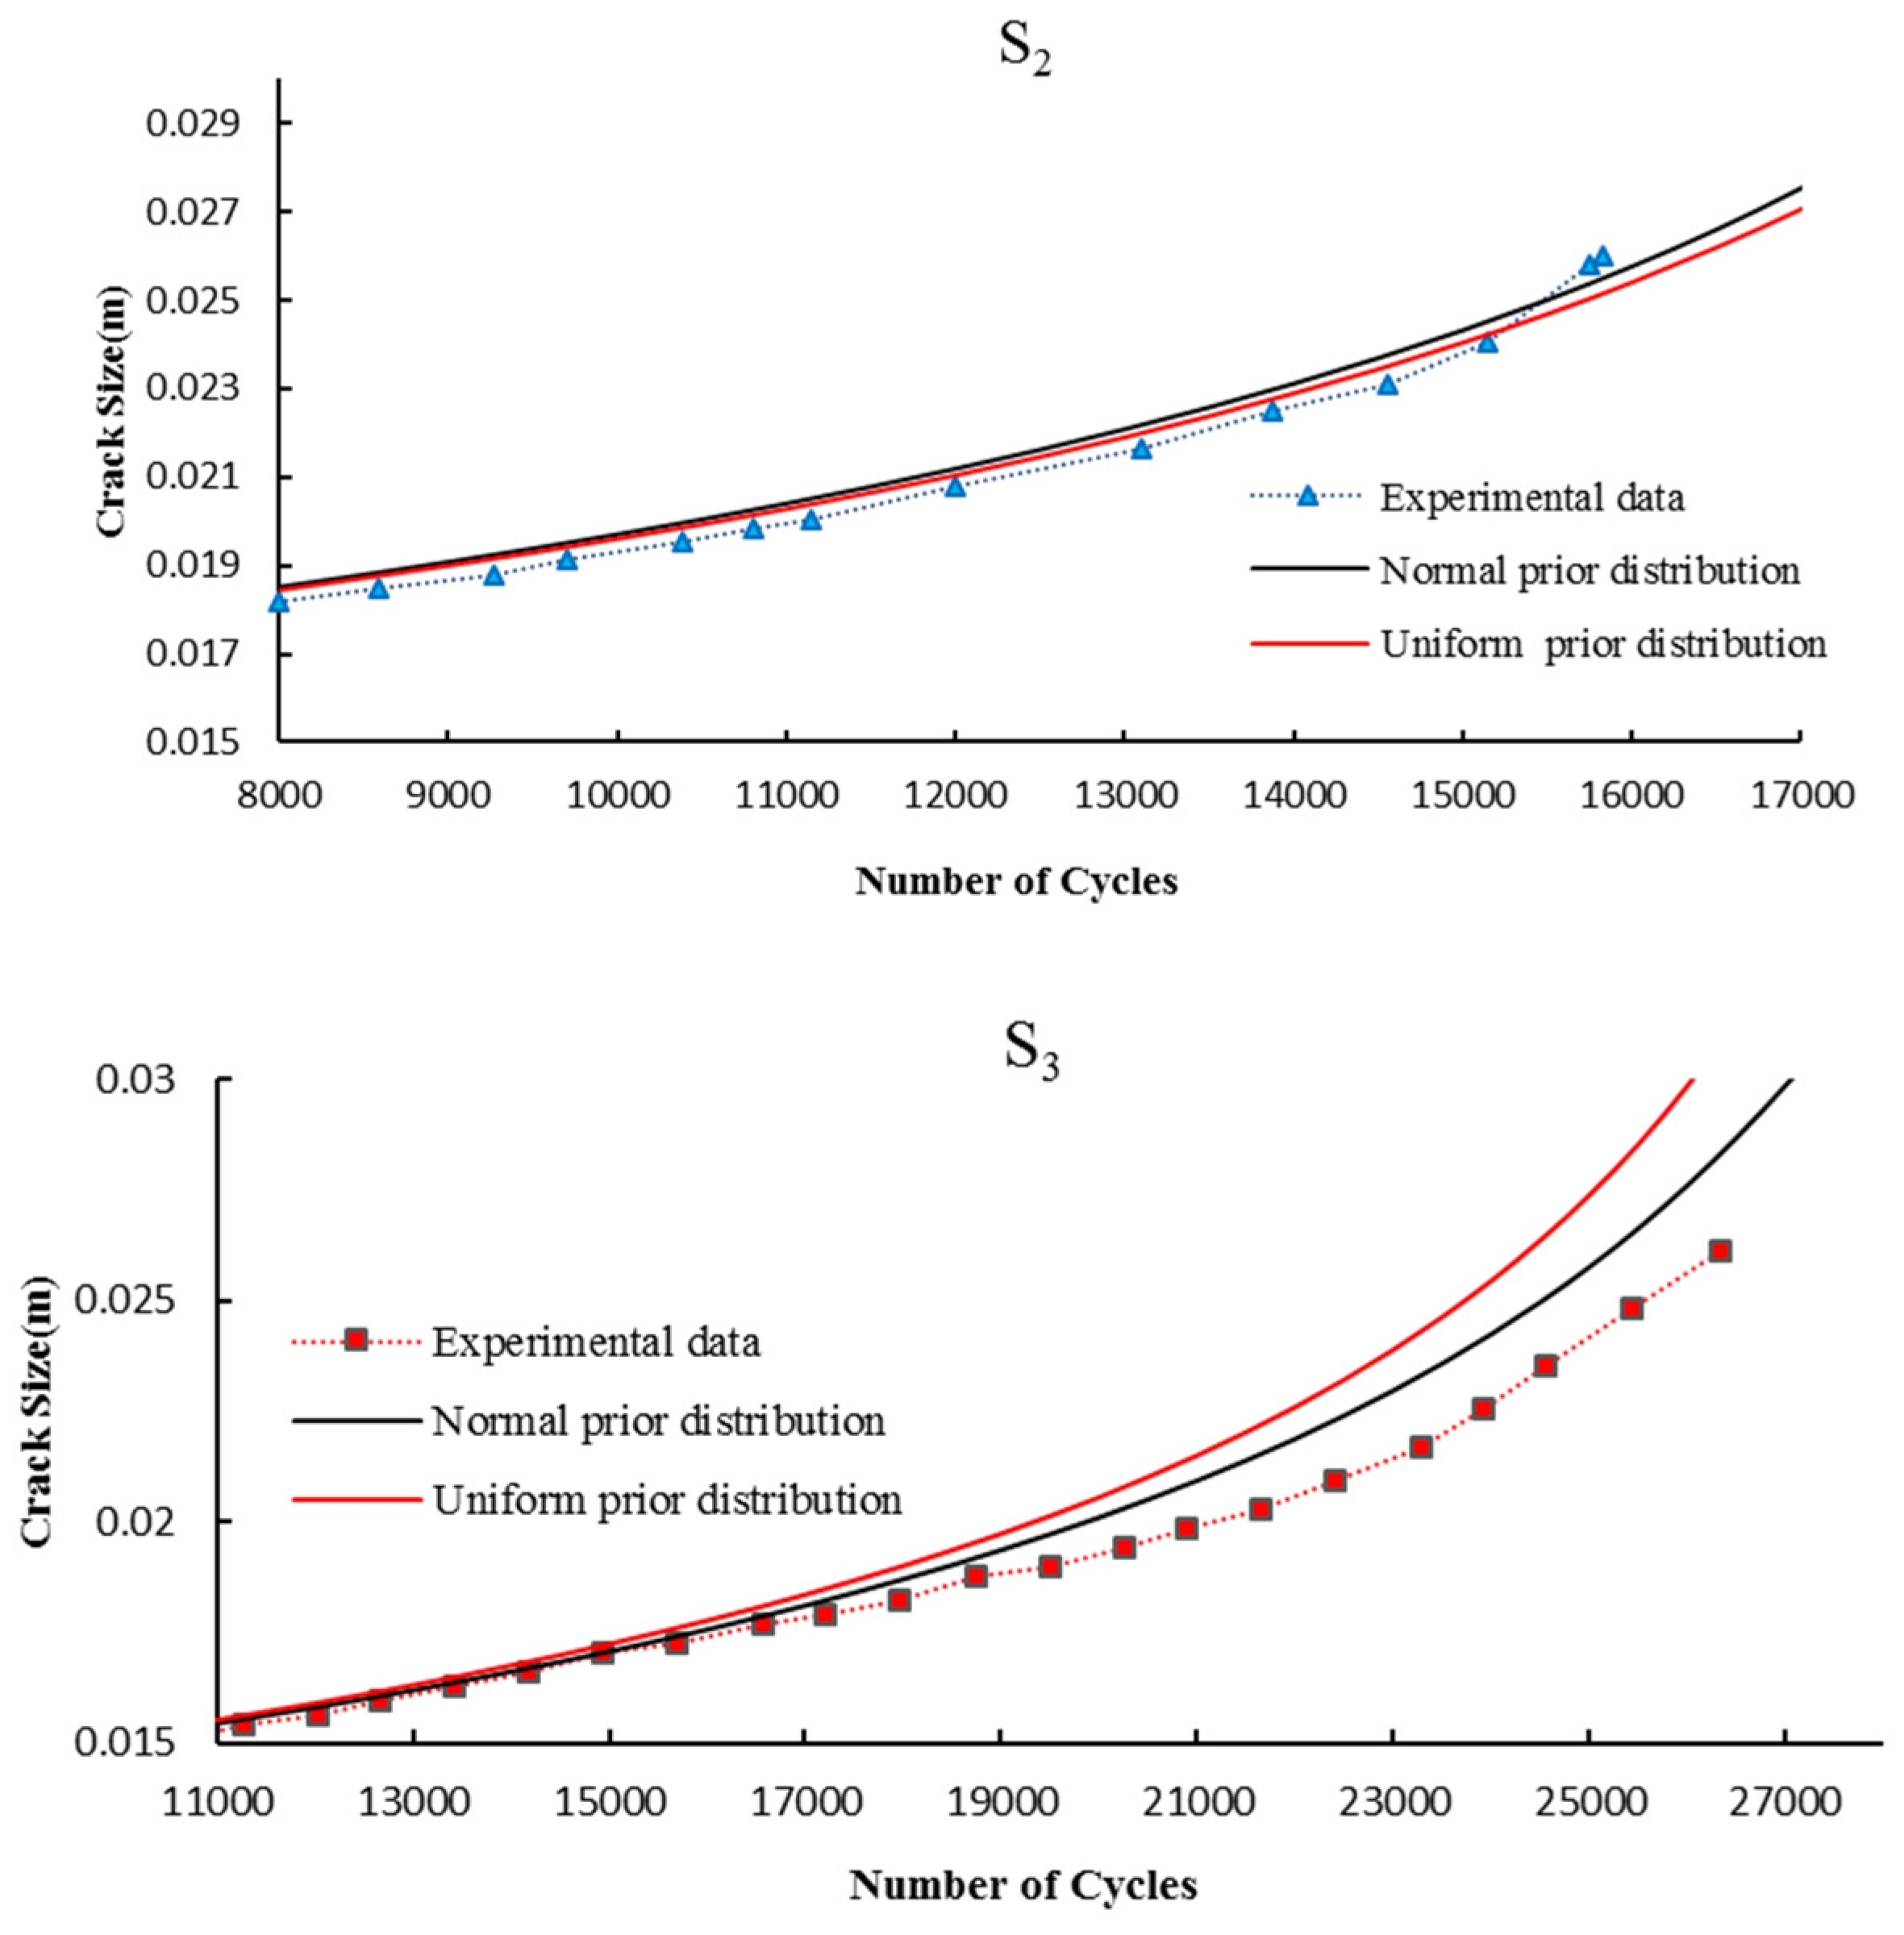
ϭ, and its parameters is obtained from the updating process. To avoid the wrong choice of assumed prior distribution, the uniform distribution is also examined and the fatigue crack growth results are compared with the obtained results from the prior normal distribution in
Appendix B.
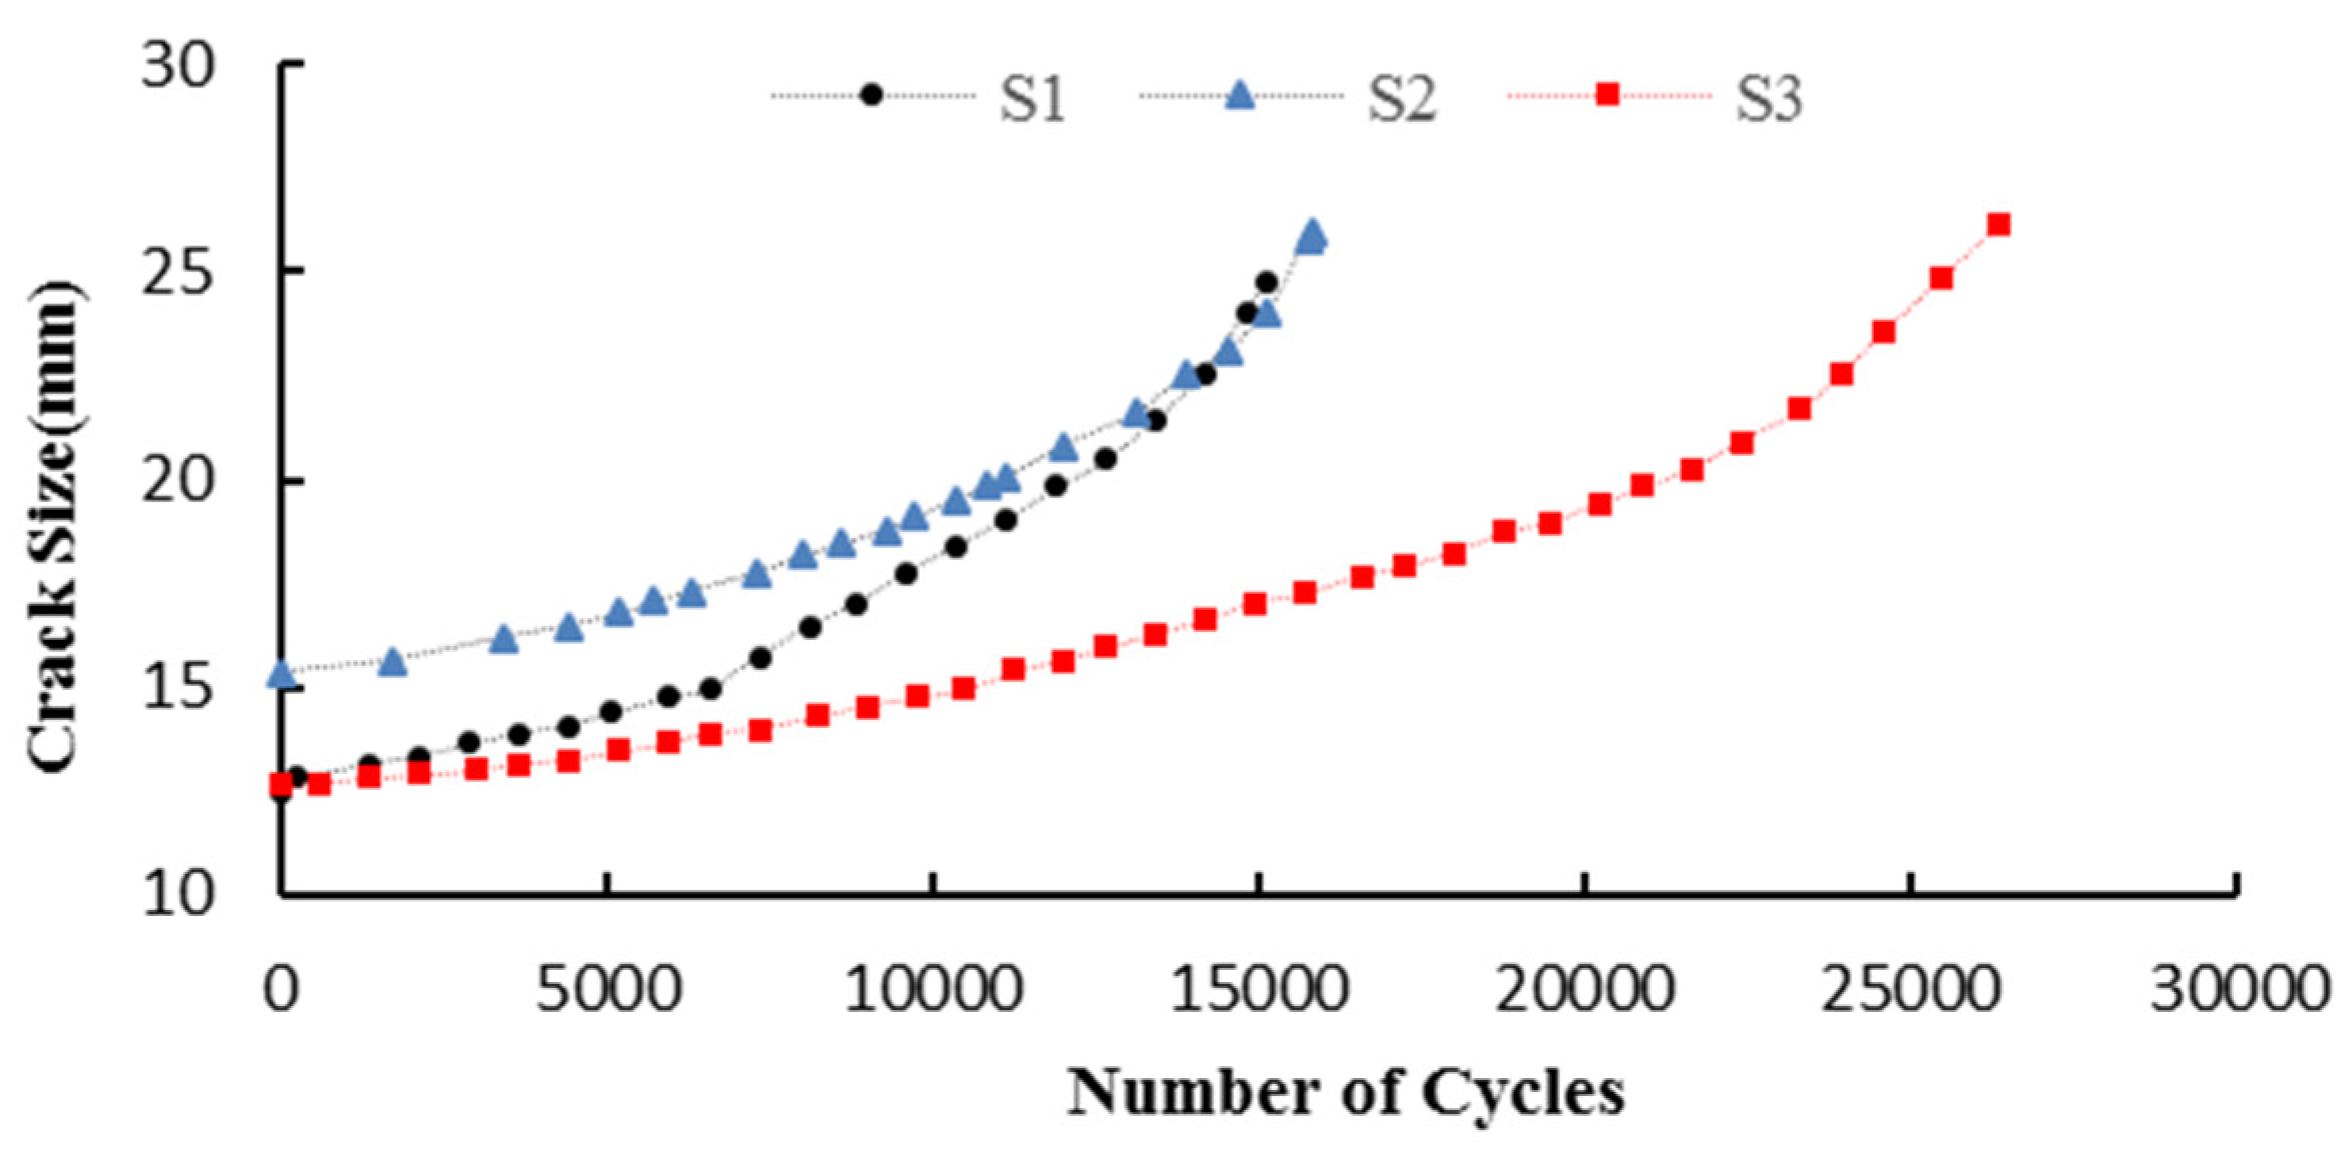
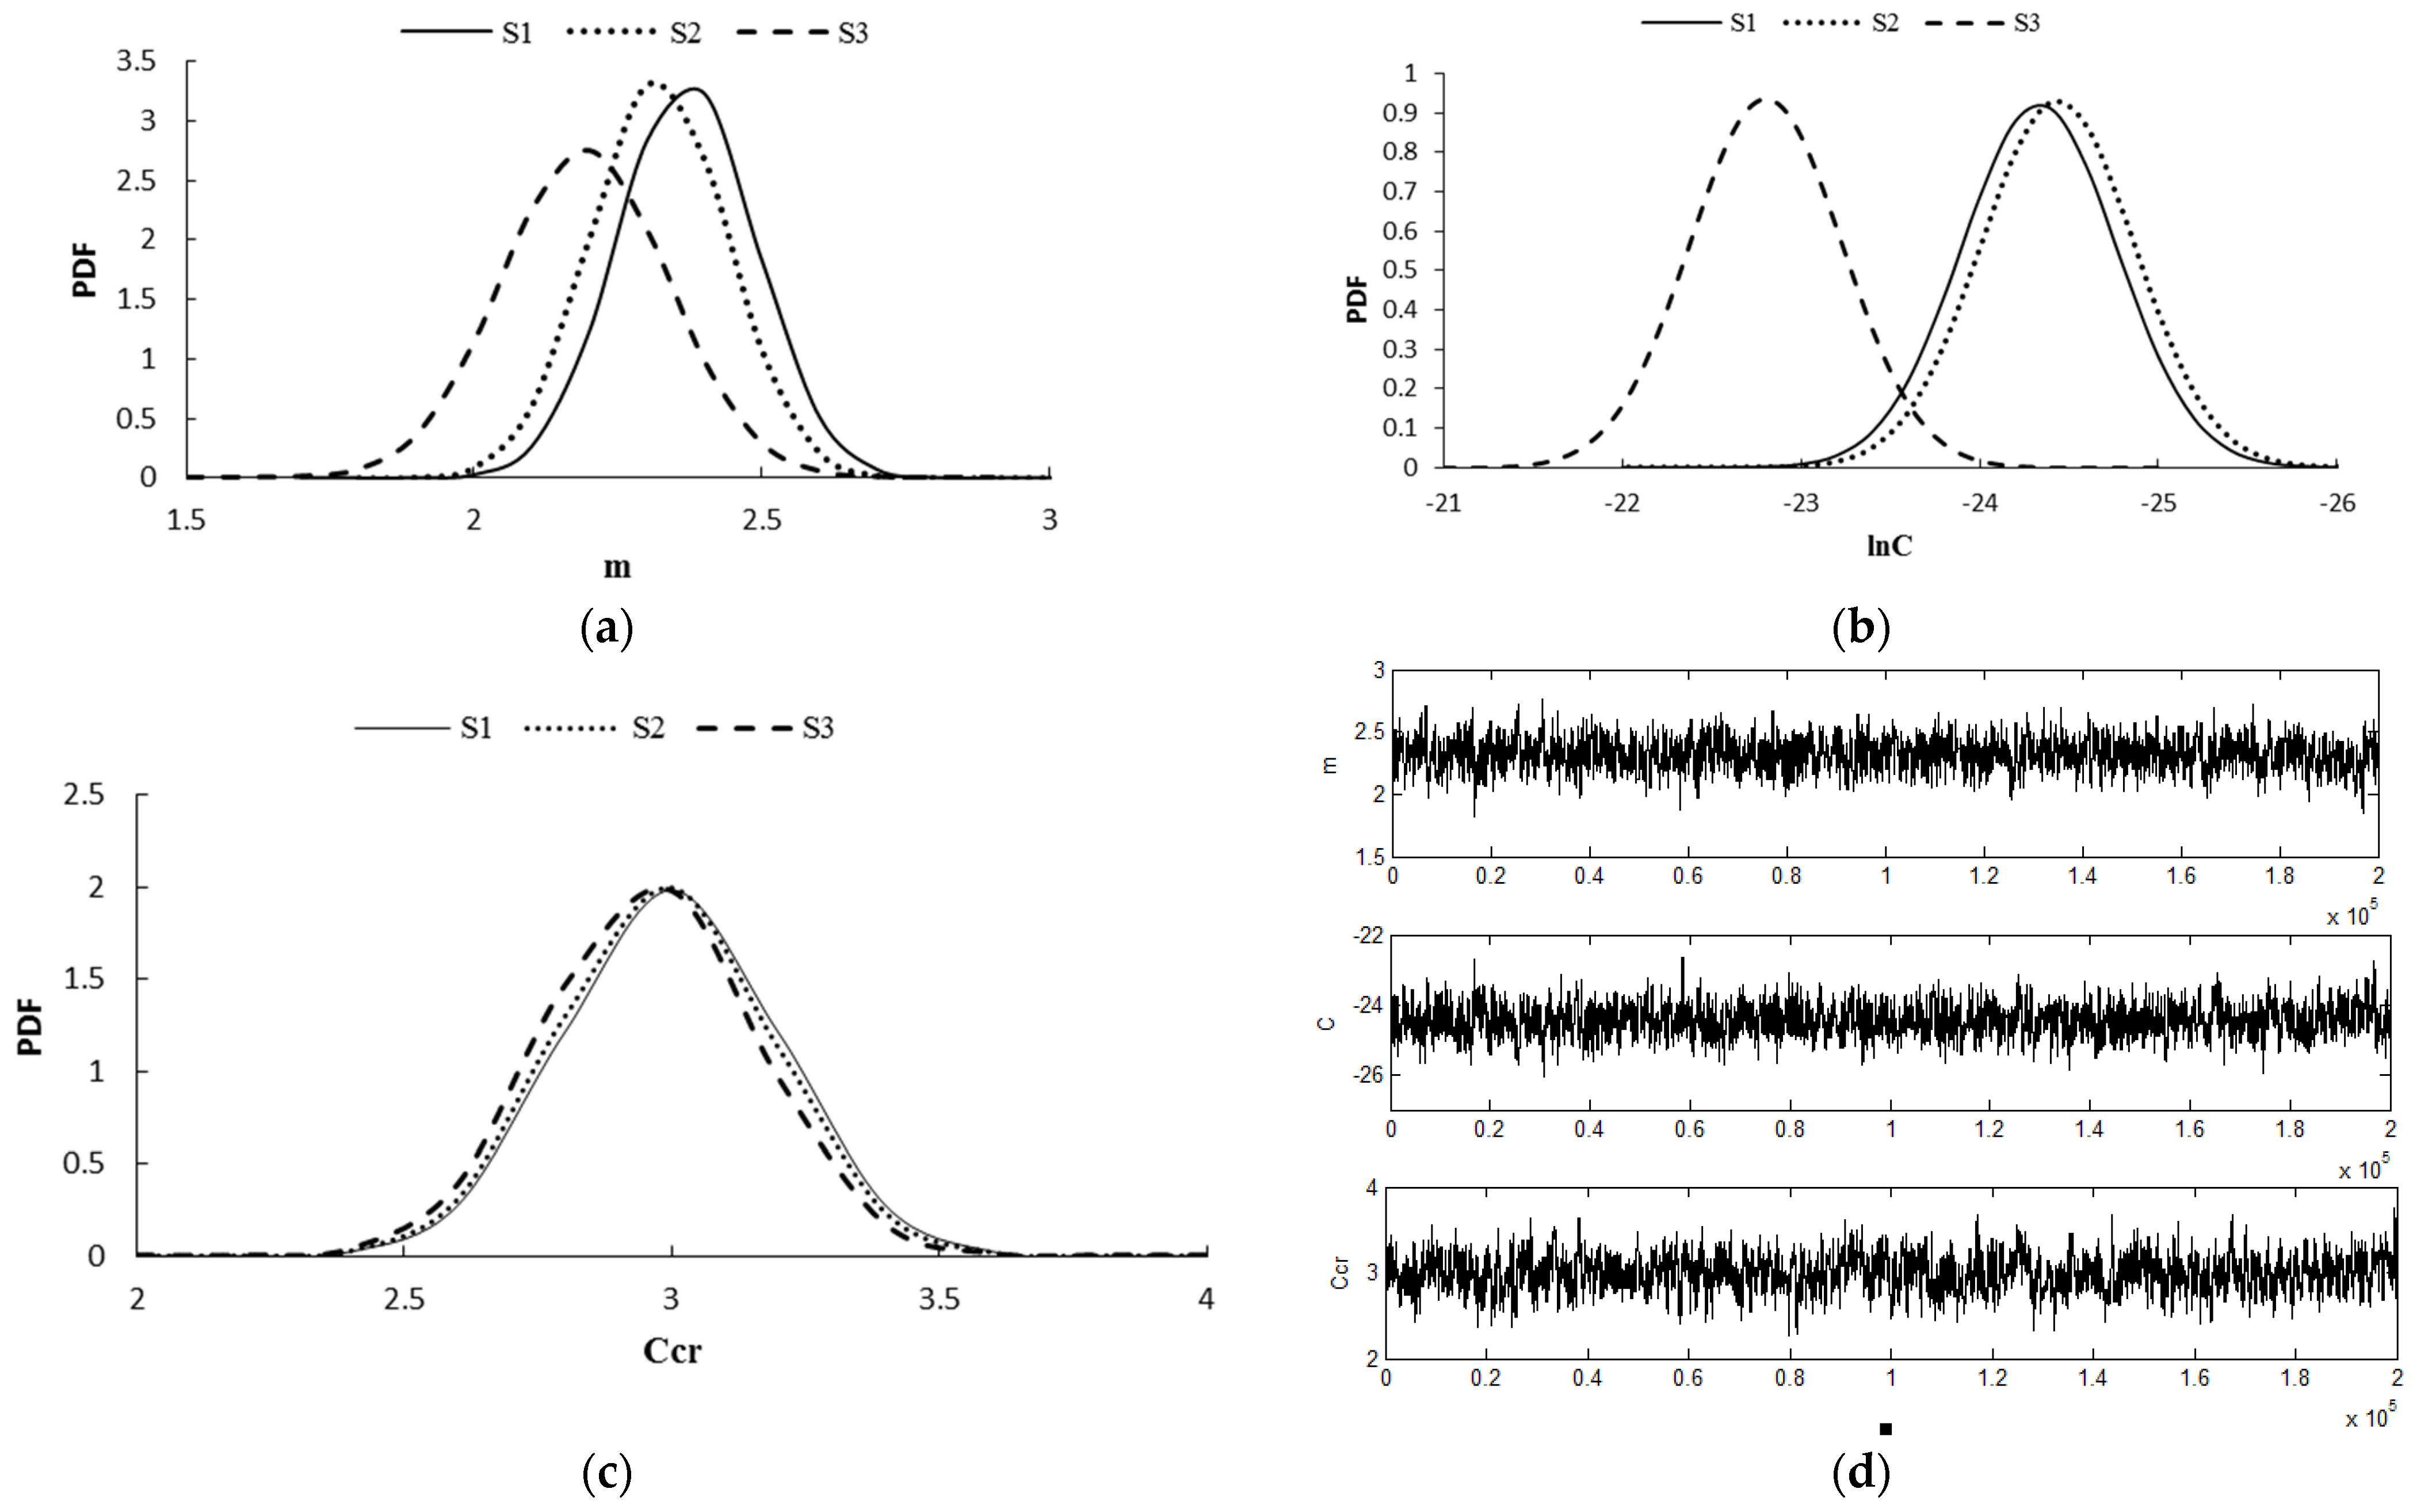
A normal distribution with a mean value of 0.5 mm and a standard deviation of 0.1 mm is regarded for the prior distribution of ϭ. Half of the experimental data of each specimen (experimental data before 8000 cycles for
S1 and
S2 and also before 11,000 cycles for
S3) have been used to update model parameters. The results of the posterior distribution of model parameters and MCMC chains are presented in
Figure 4 and
Table 2. It can be observed that the uncertainty of material parameters
m and
lnC are reduced in comparison with the prior distribution for all three investigated cases. However, the mean and standard deviation values of the corrosion-enhance parameter have changed slightly.
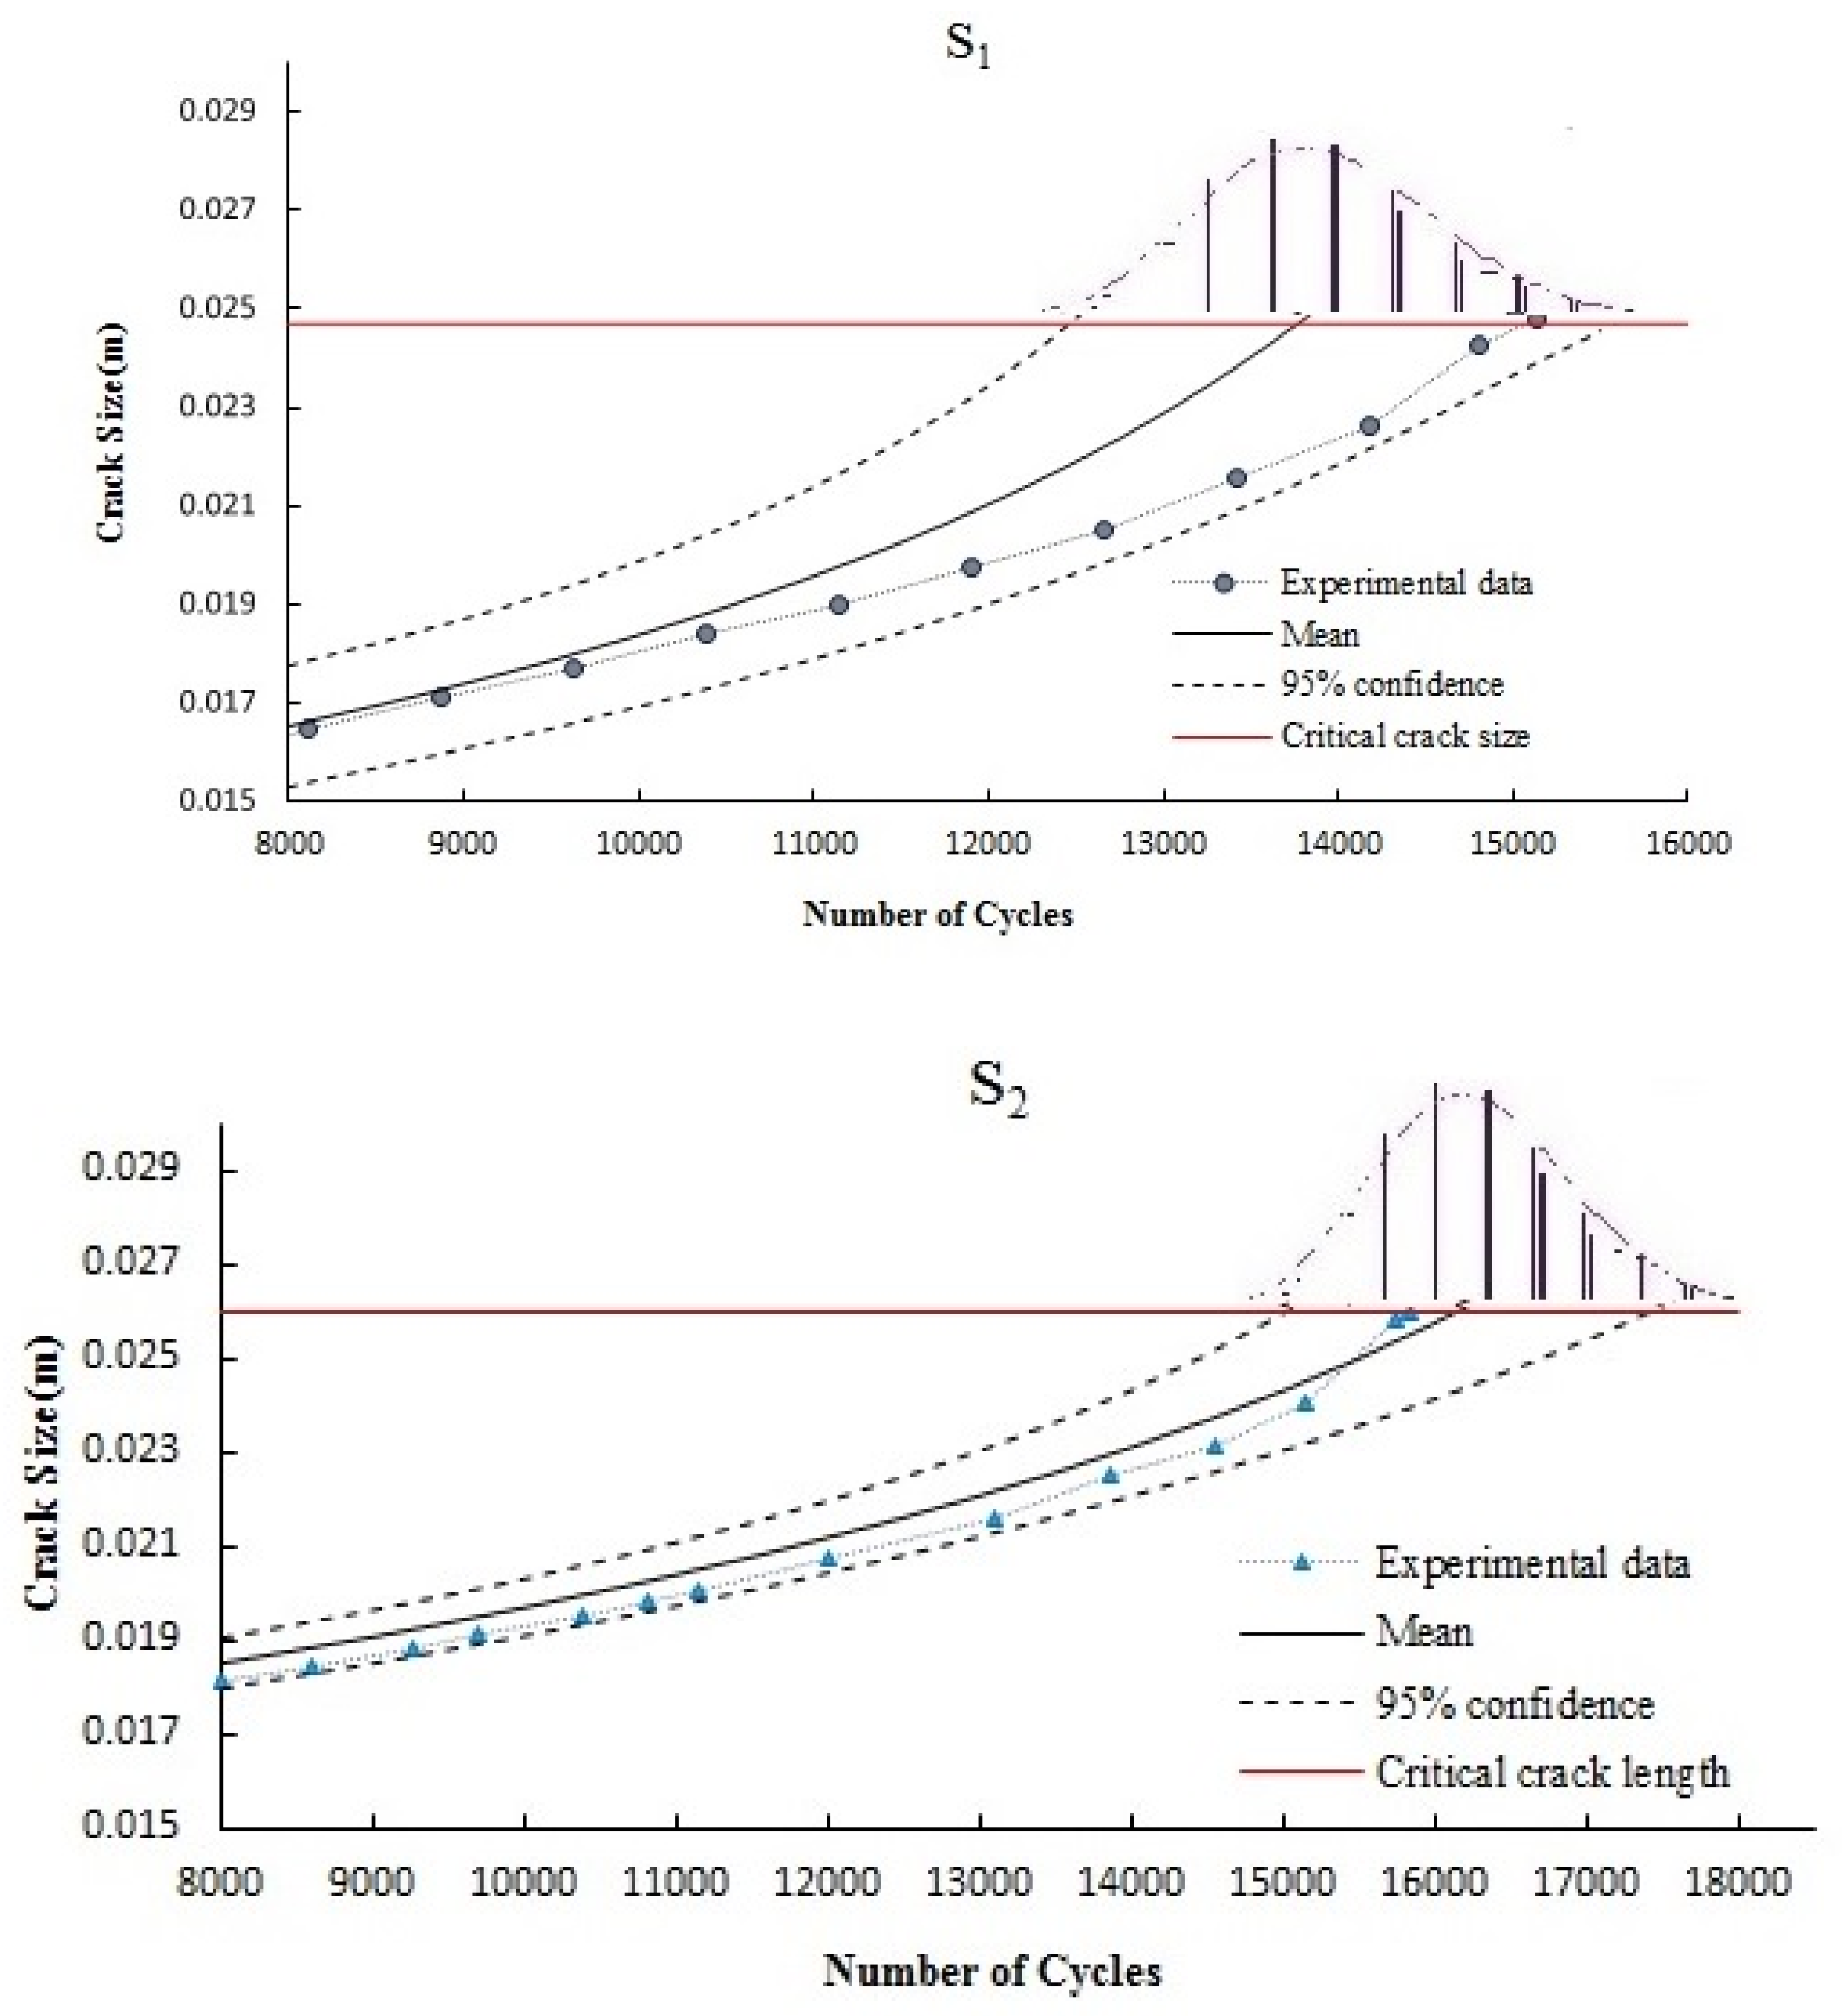
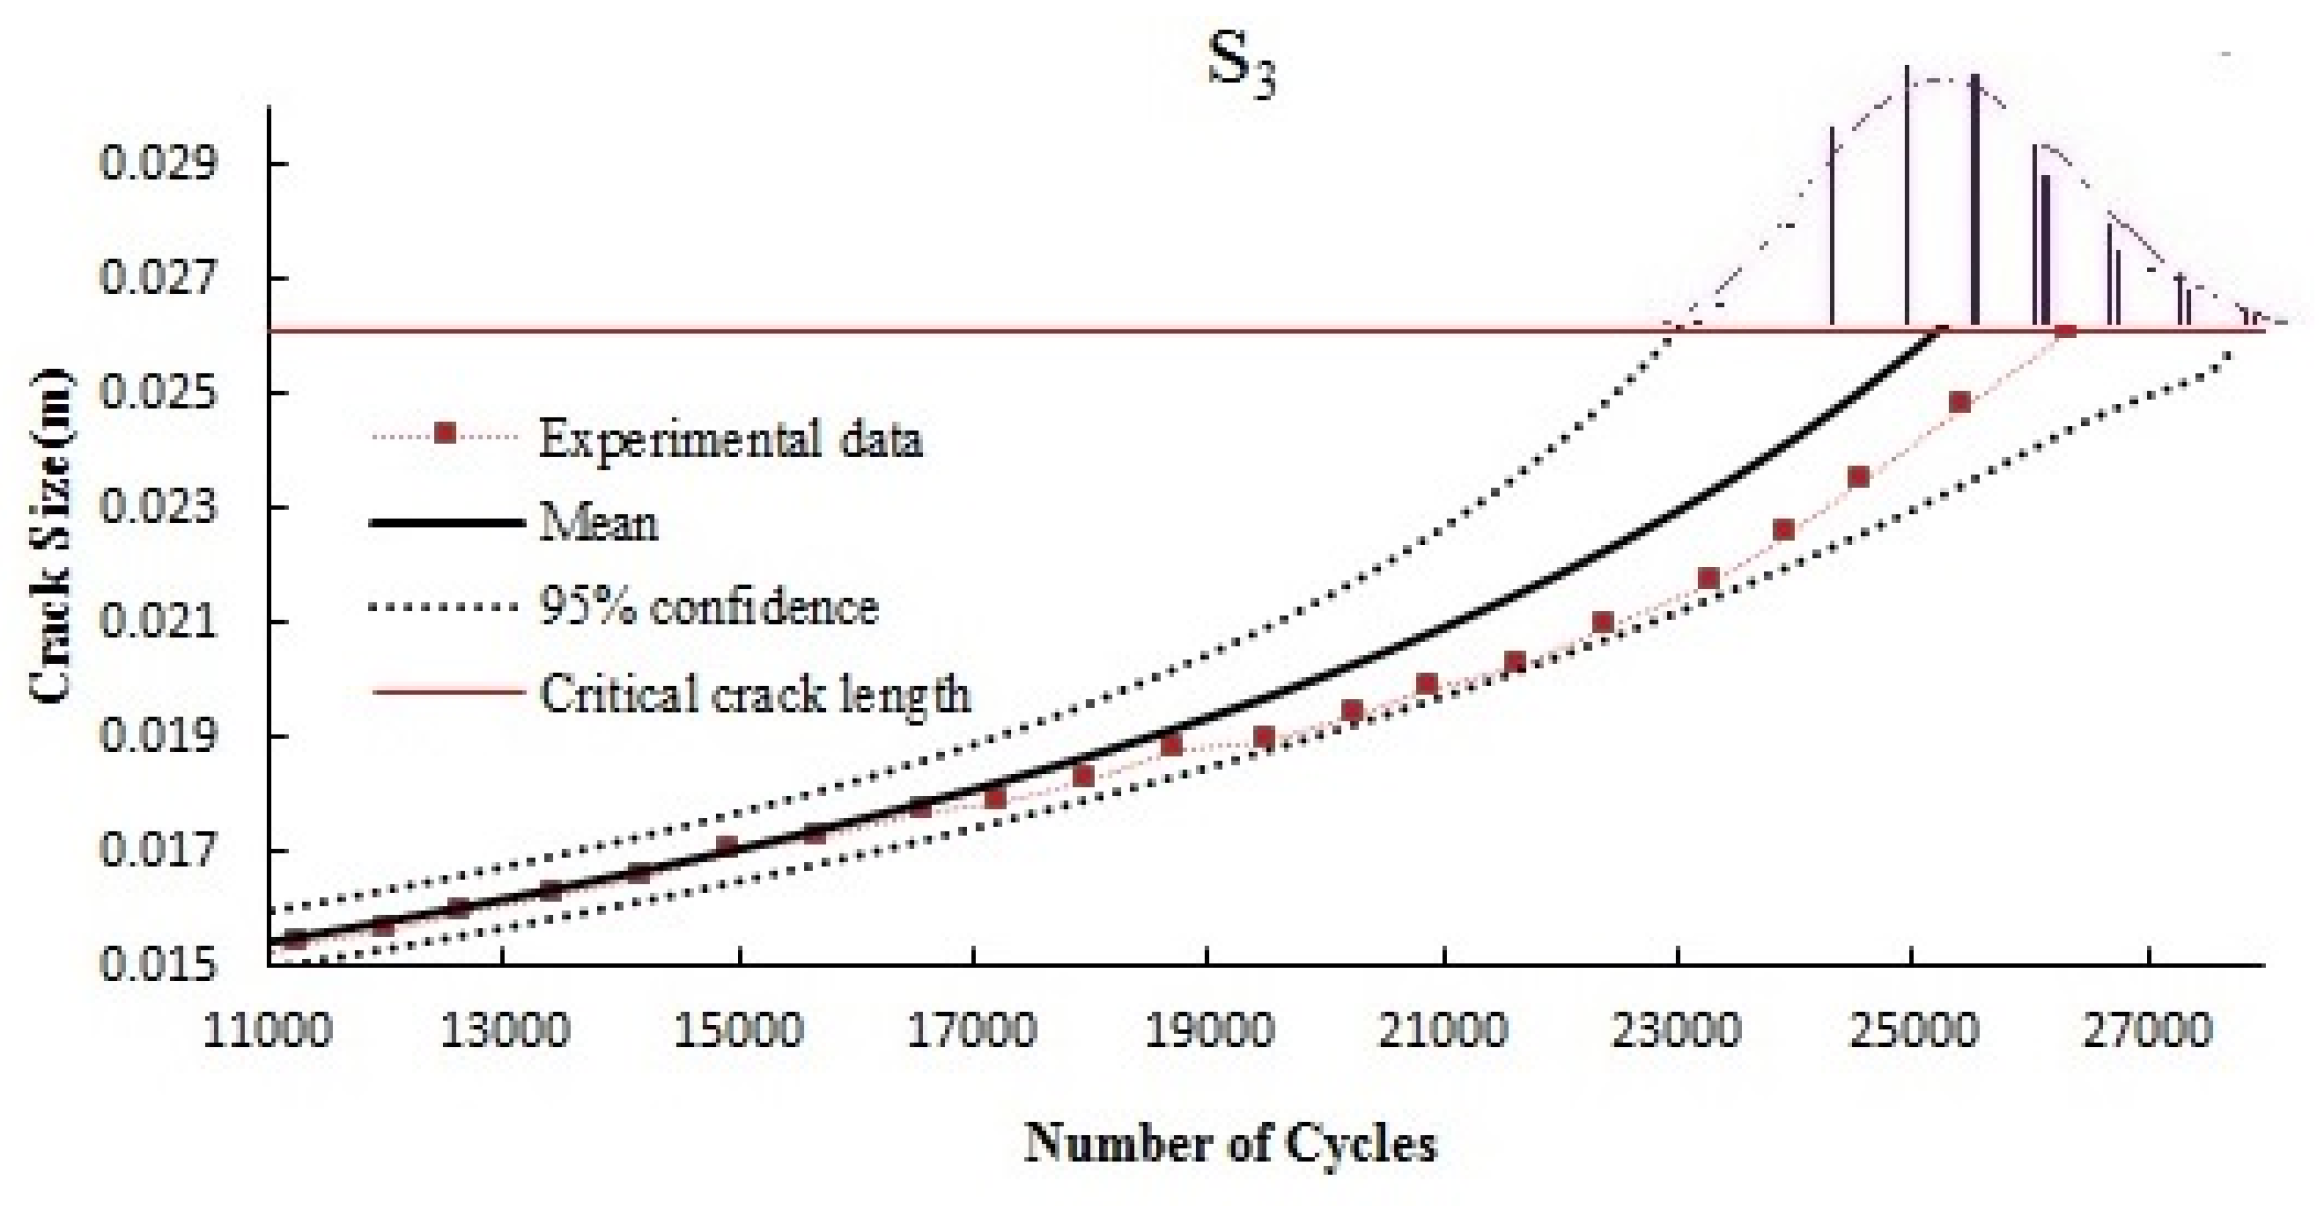
The probability distribution function of crack length after updating model parameters based on experimental data can be obtained using the fatigue model of Equation (4). The probability of crack length can be expressed as follows:
where
P(
aN|
θ,
D) is the probability of crack length for given model parameters and
P(
θ,
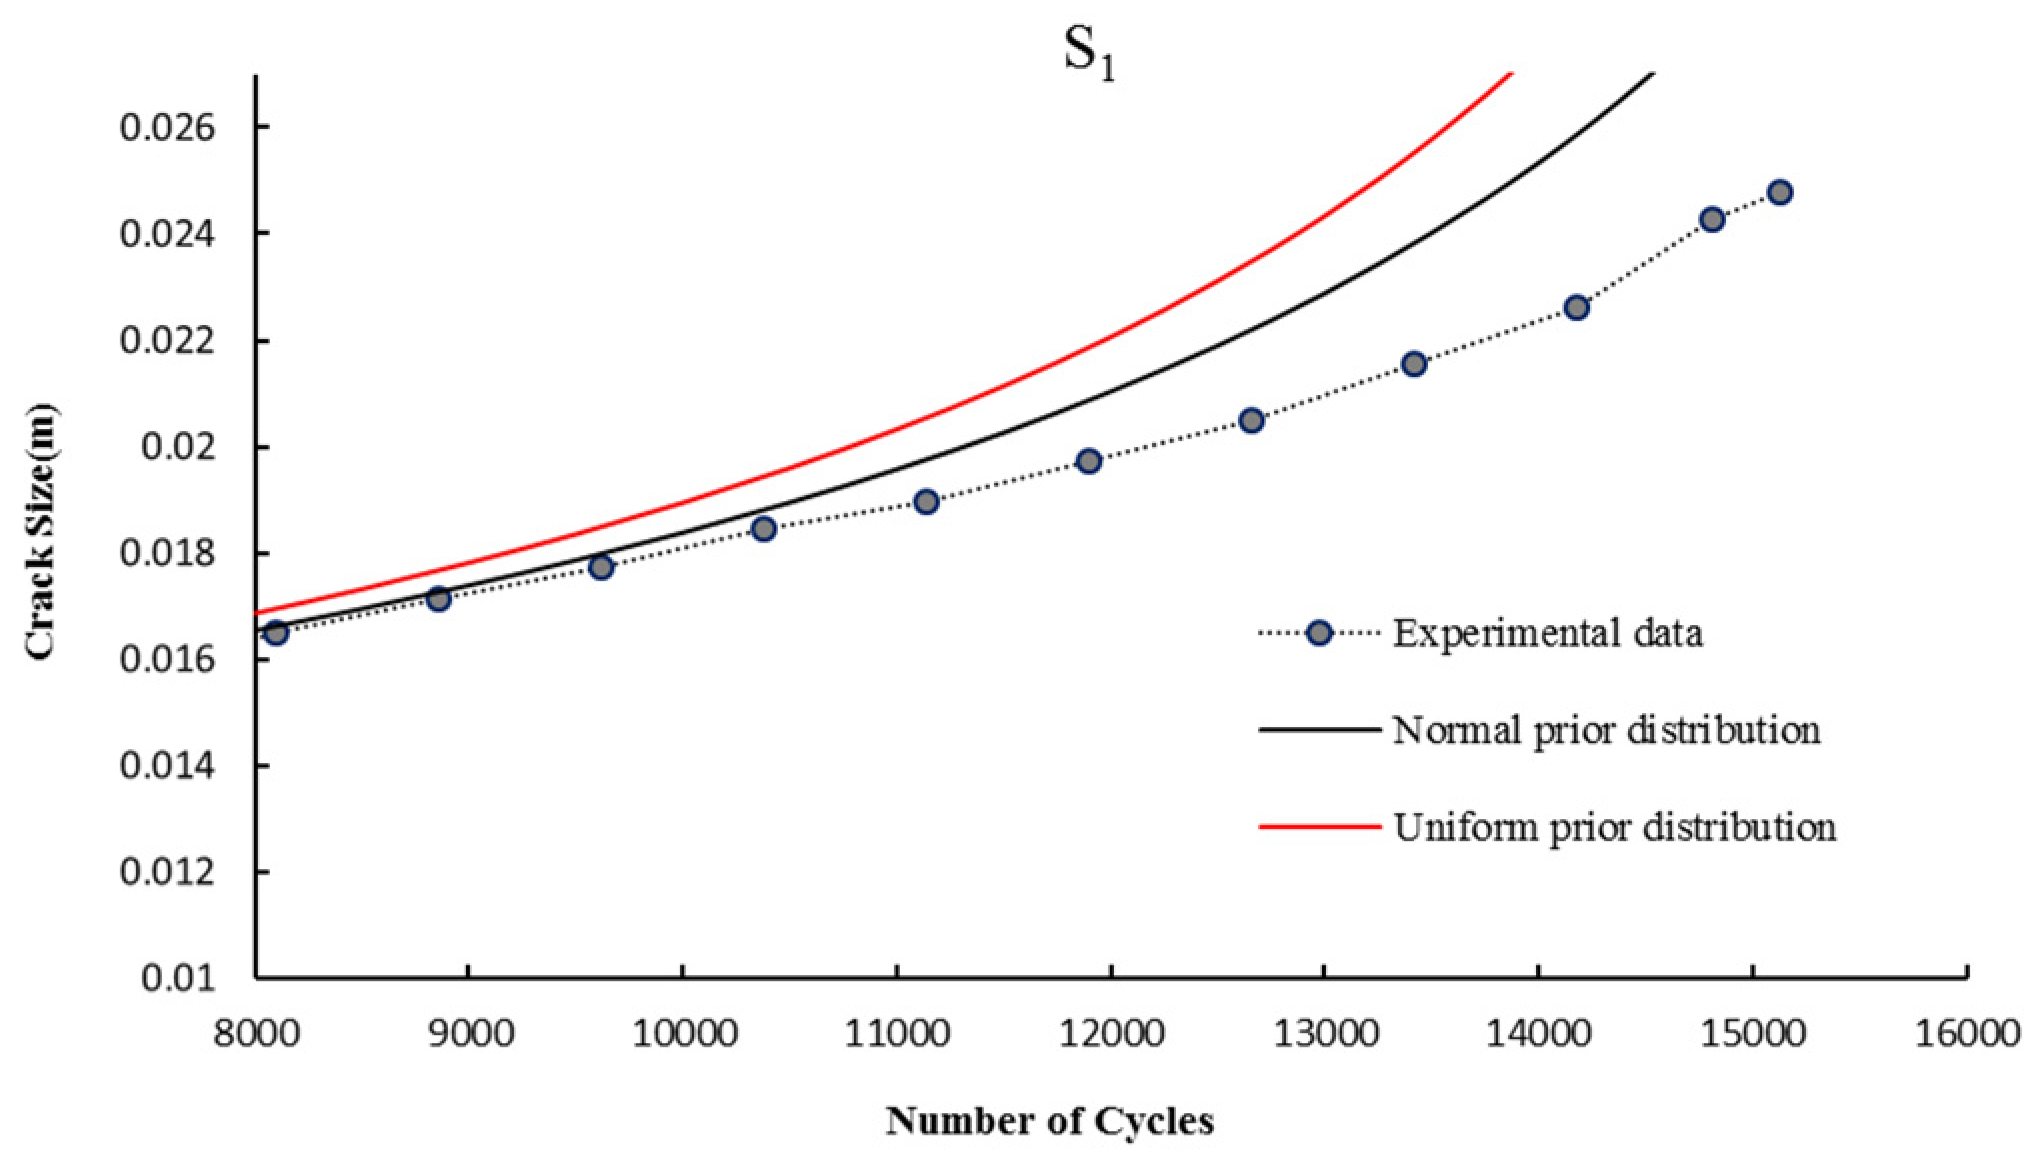
D) is the posterior distribution of the parameters. 200,000 samples are generated using MCMC simulation to update model parameters and estimate the crack growth curve. The crack length growth of the three investigated cases is presented in
Figure 5. Here, the probabilistic results of fatigue crack growth are estimated using a 95% confidence interval and compared with the experimental results. Confidence interval extraction in the crack growth curve is explained in detail in the reference [
43]. It can be observed that the estimated crack growth is in acceptable agreement with the experimental results. Although the mean values of the probabilistic model are different from the experimental results in some of the load cycles (particularly in the case of S
1), the 95% confidence interval covers all of the experimental data.
5. Reliability Analysis
This section presents the reliability analysis of the investigated pipelines based on the uncertainty modelling of the basic variables which are indicated by the pdf of the posterior distribution of model parameters. The reliability function can be measured by the probability that the crack growth length
aN does not exceed the critical crack size for an arbitrary load cycle within the considered interval, that is:
The reliability can also be expressed with the help of the hazard function [
48]. The “hazard function”
h(N) for discrete load cycles is defined as the probability of structural failure at load cycle
N, given that the structure has not failed under a previous loading. Regarding
Nf as the load cycles to failure, the hazard function can be expressed as [
49]:
where
fNf(N) and
FNf(N) are the probability distribution function (PDF) and cumulative distribution function (CDF) of the load cycles to failure, respectively. The reliability analysis can be expressed based on the hazard function as follows [
50]:
Due to a large number of load cycles in fatigue FNf(N) = FNf(N − 1). Therefore, Equation (14) leads to well-known relation of L(N) = 1 − FNf(N). Given the probability distribution of the failure, the structural reliability can be estimated.
The critical crack length for each specimen is considered equal to the values of
af in
Table 1.
af is the final crack length when the back-face strain gauge fails or the fatigue crack growth rate exceeds 0.01 mm/cycles during the fatigue test process [
5]. This criterion corresponds to the end of the stable region of crack growth (region II). In this paper, the values of
af are considered as the critical values of crack length and the distribution of the number of cycles that lead to
aN = acr are calculated based on the limit state function obtained from Equation (5) regarding the PDF of updated model parameters as basic variables. The statistical parameters of the distribution of the number of cycles to failure are indicated in
Table 3. The probabilistic results are compared with the experimental data and deterministic results obtained from the finite element method (FEM), presented in [
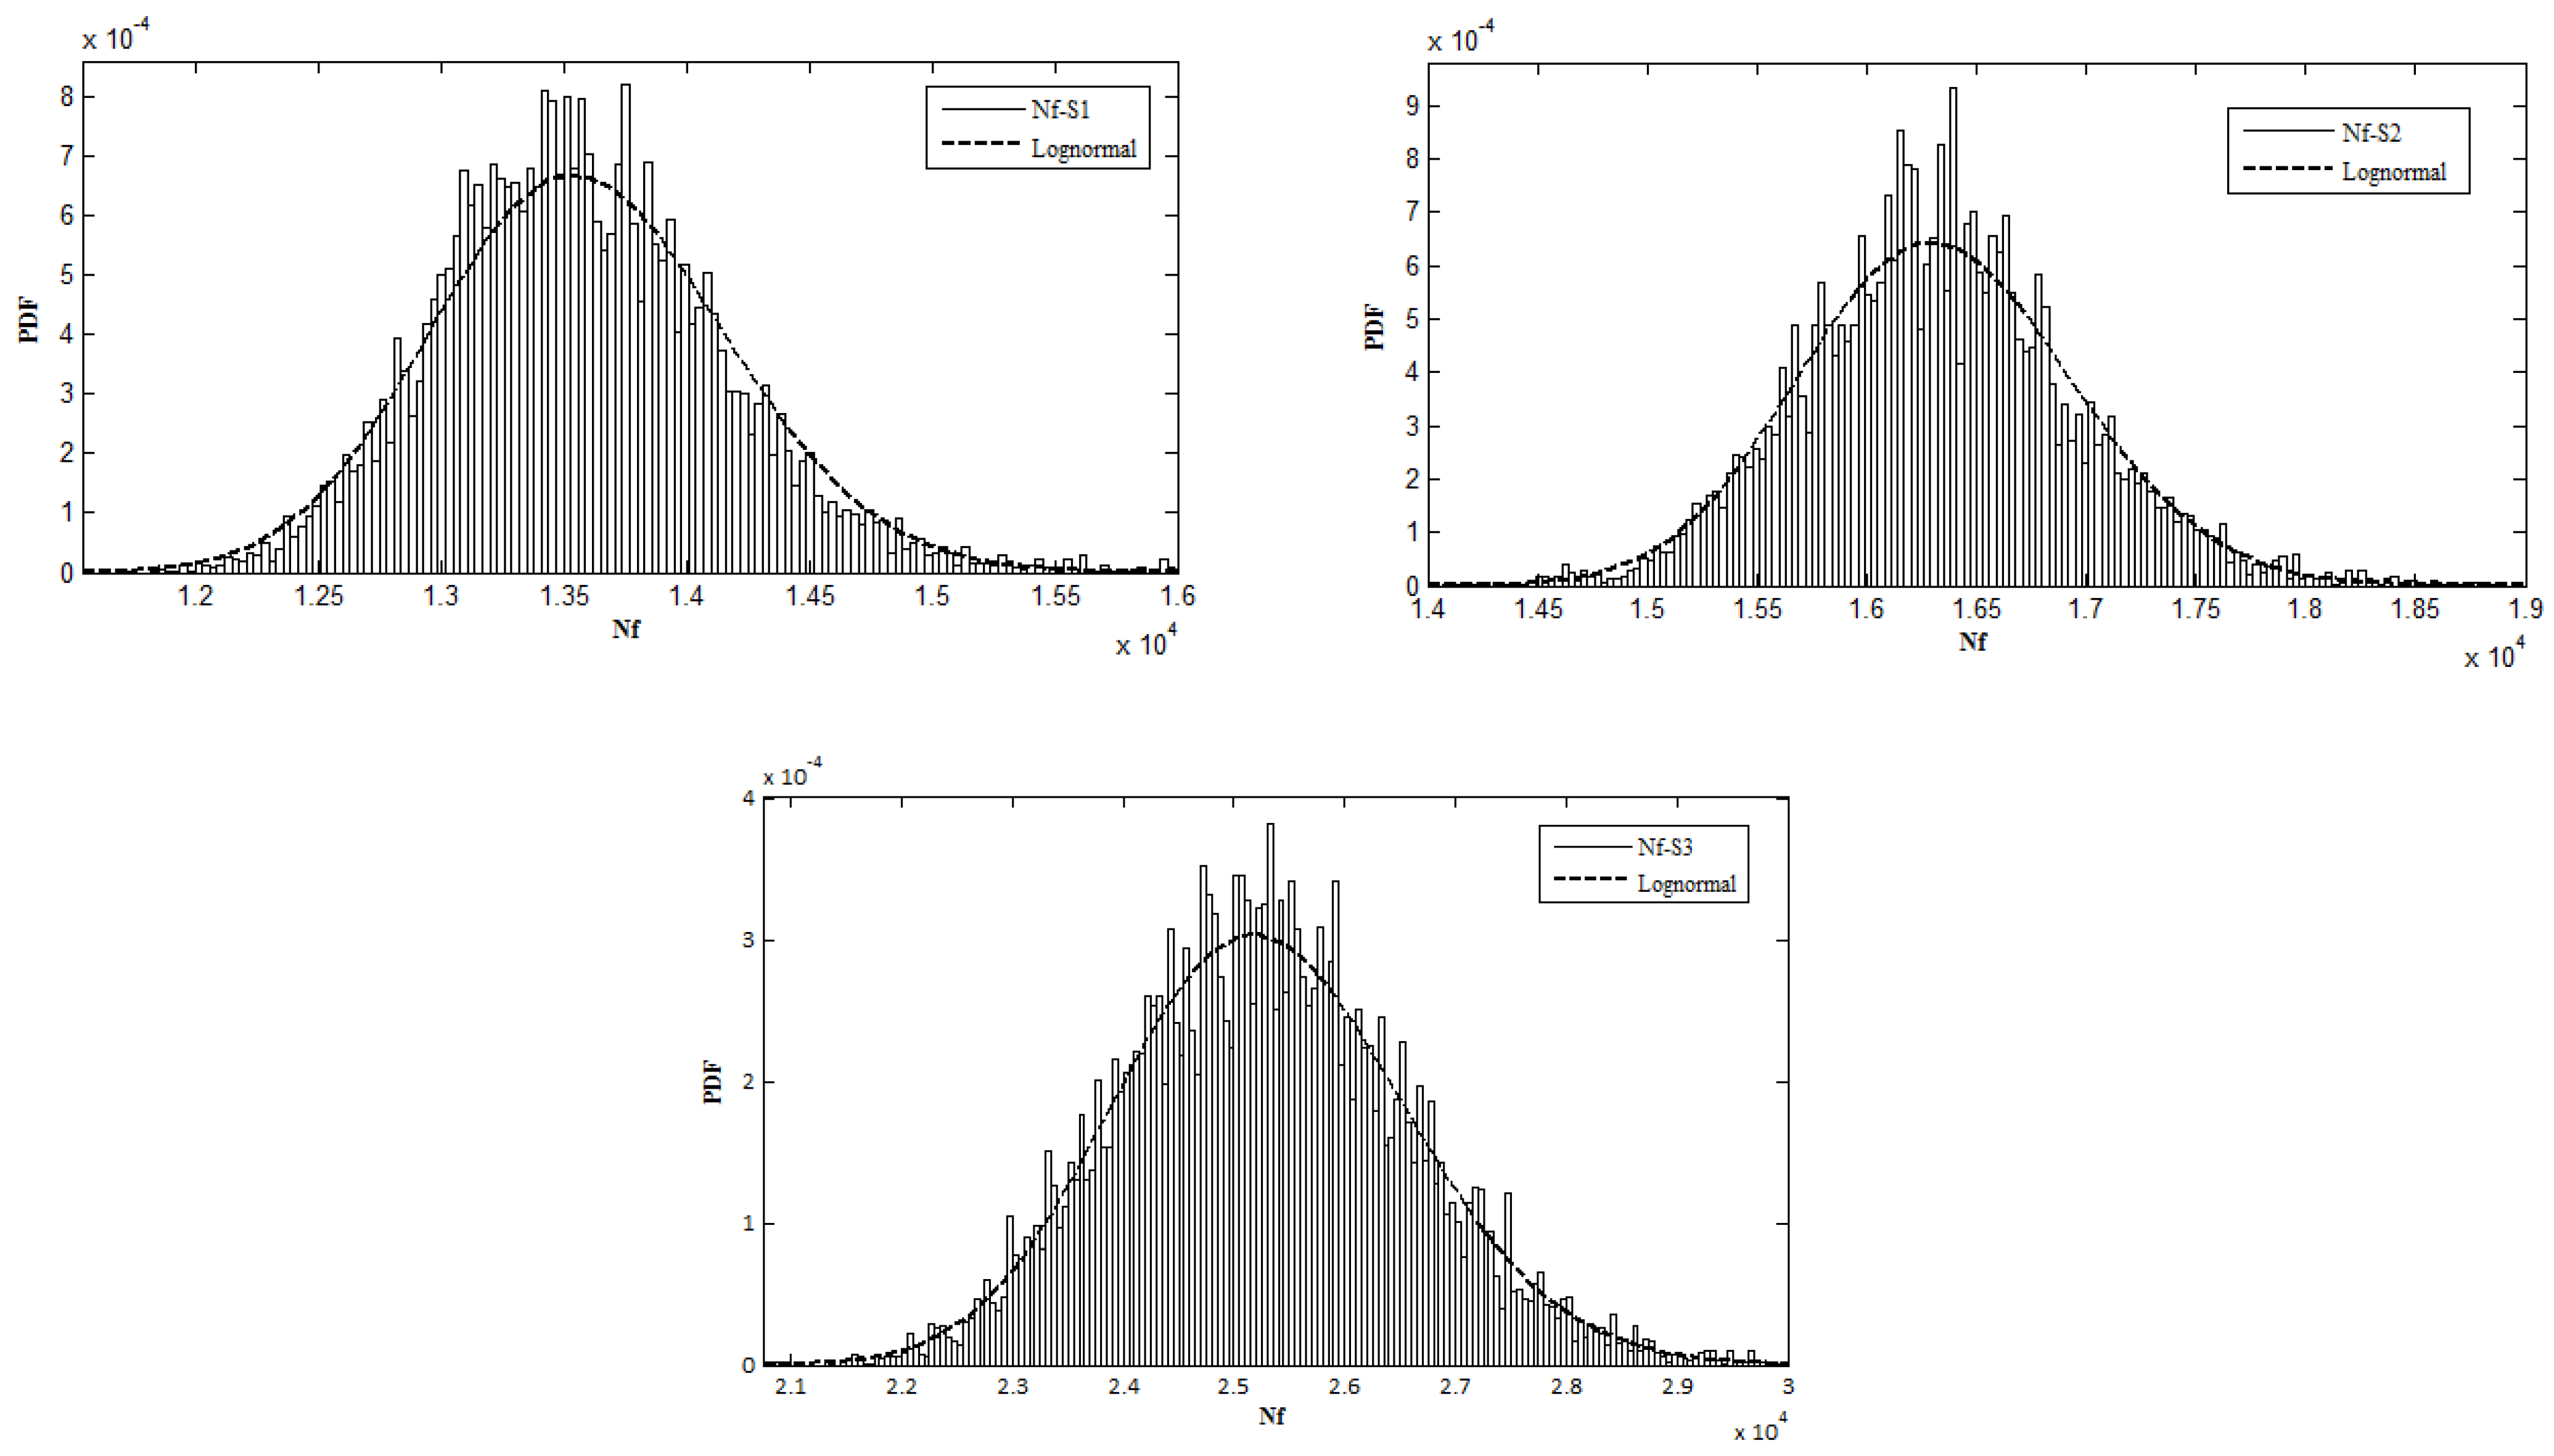
5]. It can be observed that the probabilistic results of failure load cycles provide an acceptable estimation of fatigue life. In addition, the PDF of failure load cycles are presented in
Figure 6. It should be mentioned that Weibull distribution often has been used to model the failure data [
14,
51]. However, it is observed that the estimated PDF of failure load cycles in three investigated cases follows lognormal distribution instead of a Weibull distribution. This can be due to the disregarding of the stress range uncertainty, which usually follows the Weibull distribution.
The reliability analysis of the investigated cases is indicated in
Figure 7. It can be observed that the stress ratio
R has a significant effect on the reliability level of structures. Increasing the stress ratio from
R = 0.1 in the case of
S1 to
R = 0.4 in the case of
S3 leads to a remarkable increase in the reliability function. Also, the reliability function is affected by maximum loads
Pmax. The reliability function of
S2 with
Pmax = 9 Kn is higher than the reliability function of
S1 with
Pmax = 11 Kn, even if
S2 has a larger initial crack length. In addition,
Table 4 indicates the performance assessment of the investigated cases based on the reliability index, which is calculated as:
where Φ is the standard normal function. In
Table 4,
β < 2,
and
β > 4 are regarded as poor performance (red), good performance (yellow) and excellent performance (green) of pipelines, respectively [
14], and the associated number of load cycles to each performance levels are indicated.
It should be noted that the estimated reliability level of the investigated cases is based on the assumption of deterministic stress range and initial crack size. The impact of uncertainties of this parameter is investigated through the reliability assessment of a full-scale API 5L X56 submarine pipeline with a diameter of 219 mm and a thickness of 14 mm. The maximum applied load is 235 Kn and the stress ratio R and load frequency are 0.1 and 0.5, respectively.
The material parameters
m and ln
C are only affected by the fatigue test environment and material [
2]. Therefore, the updated probabilistic modelling of parameters in case
S2 can be considered in this example. For the sensitivity studies, different values of uncertainties are considered for stress range and initial crack size as described in
Table 5. Also, the corrosion-enhancement factor may change from environment to environment. Therefore, different mean values of this parameter are regarded to investigate its impact on the reliability assessment of submarine pipelines. Here the critical value of crack depth is defined as 0.8 of the pipeline wall thickness. It should be mentioned that the finite element results for the stress intensity factor of the investigated submarine pipeline can be found in Gao et.al [
2]. The geometry function parameters are calculated based on the finite element results for the stress intensity factor, as explained in
Appendix A.
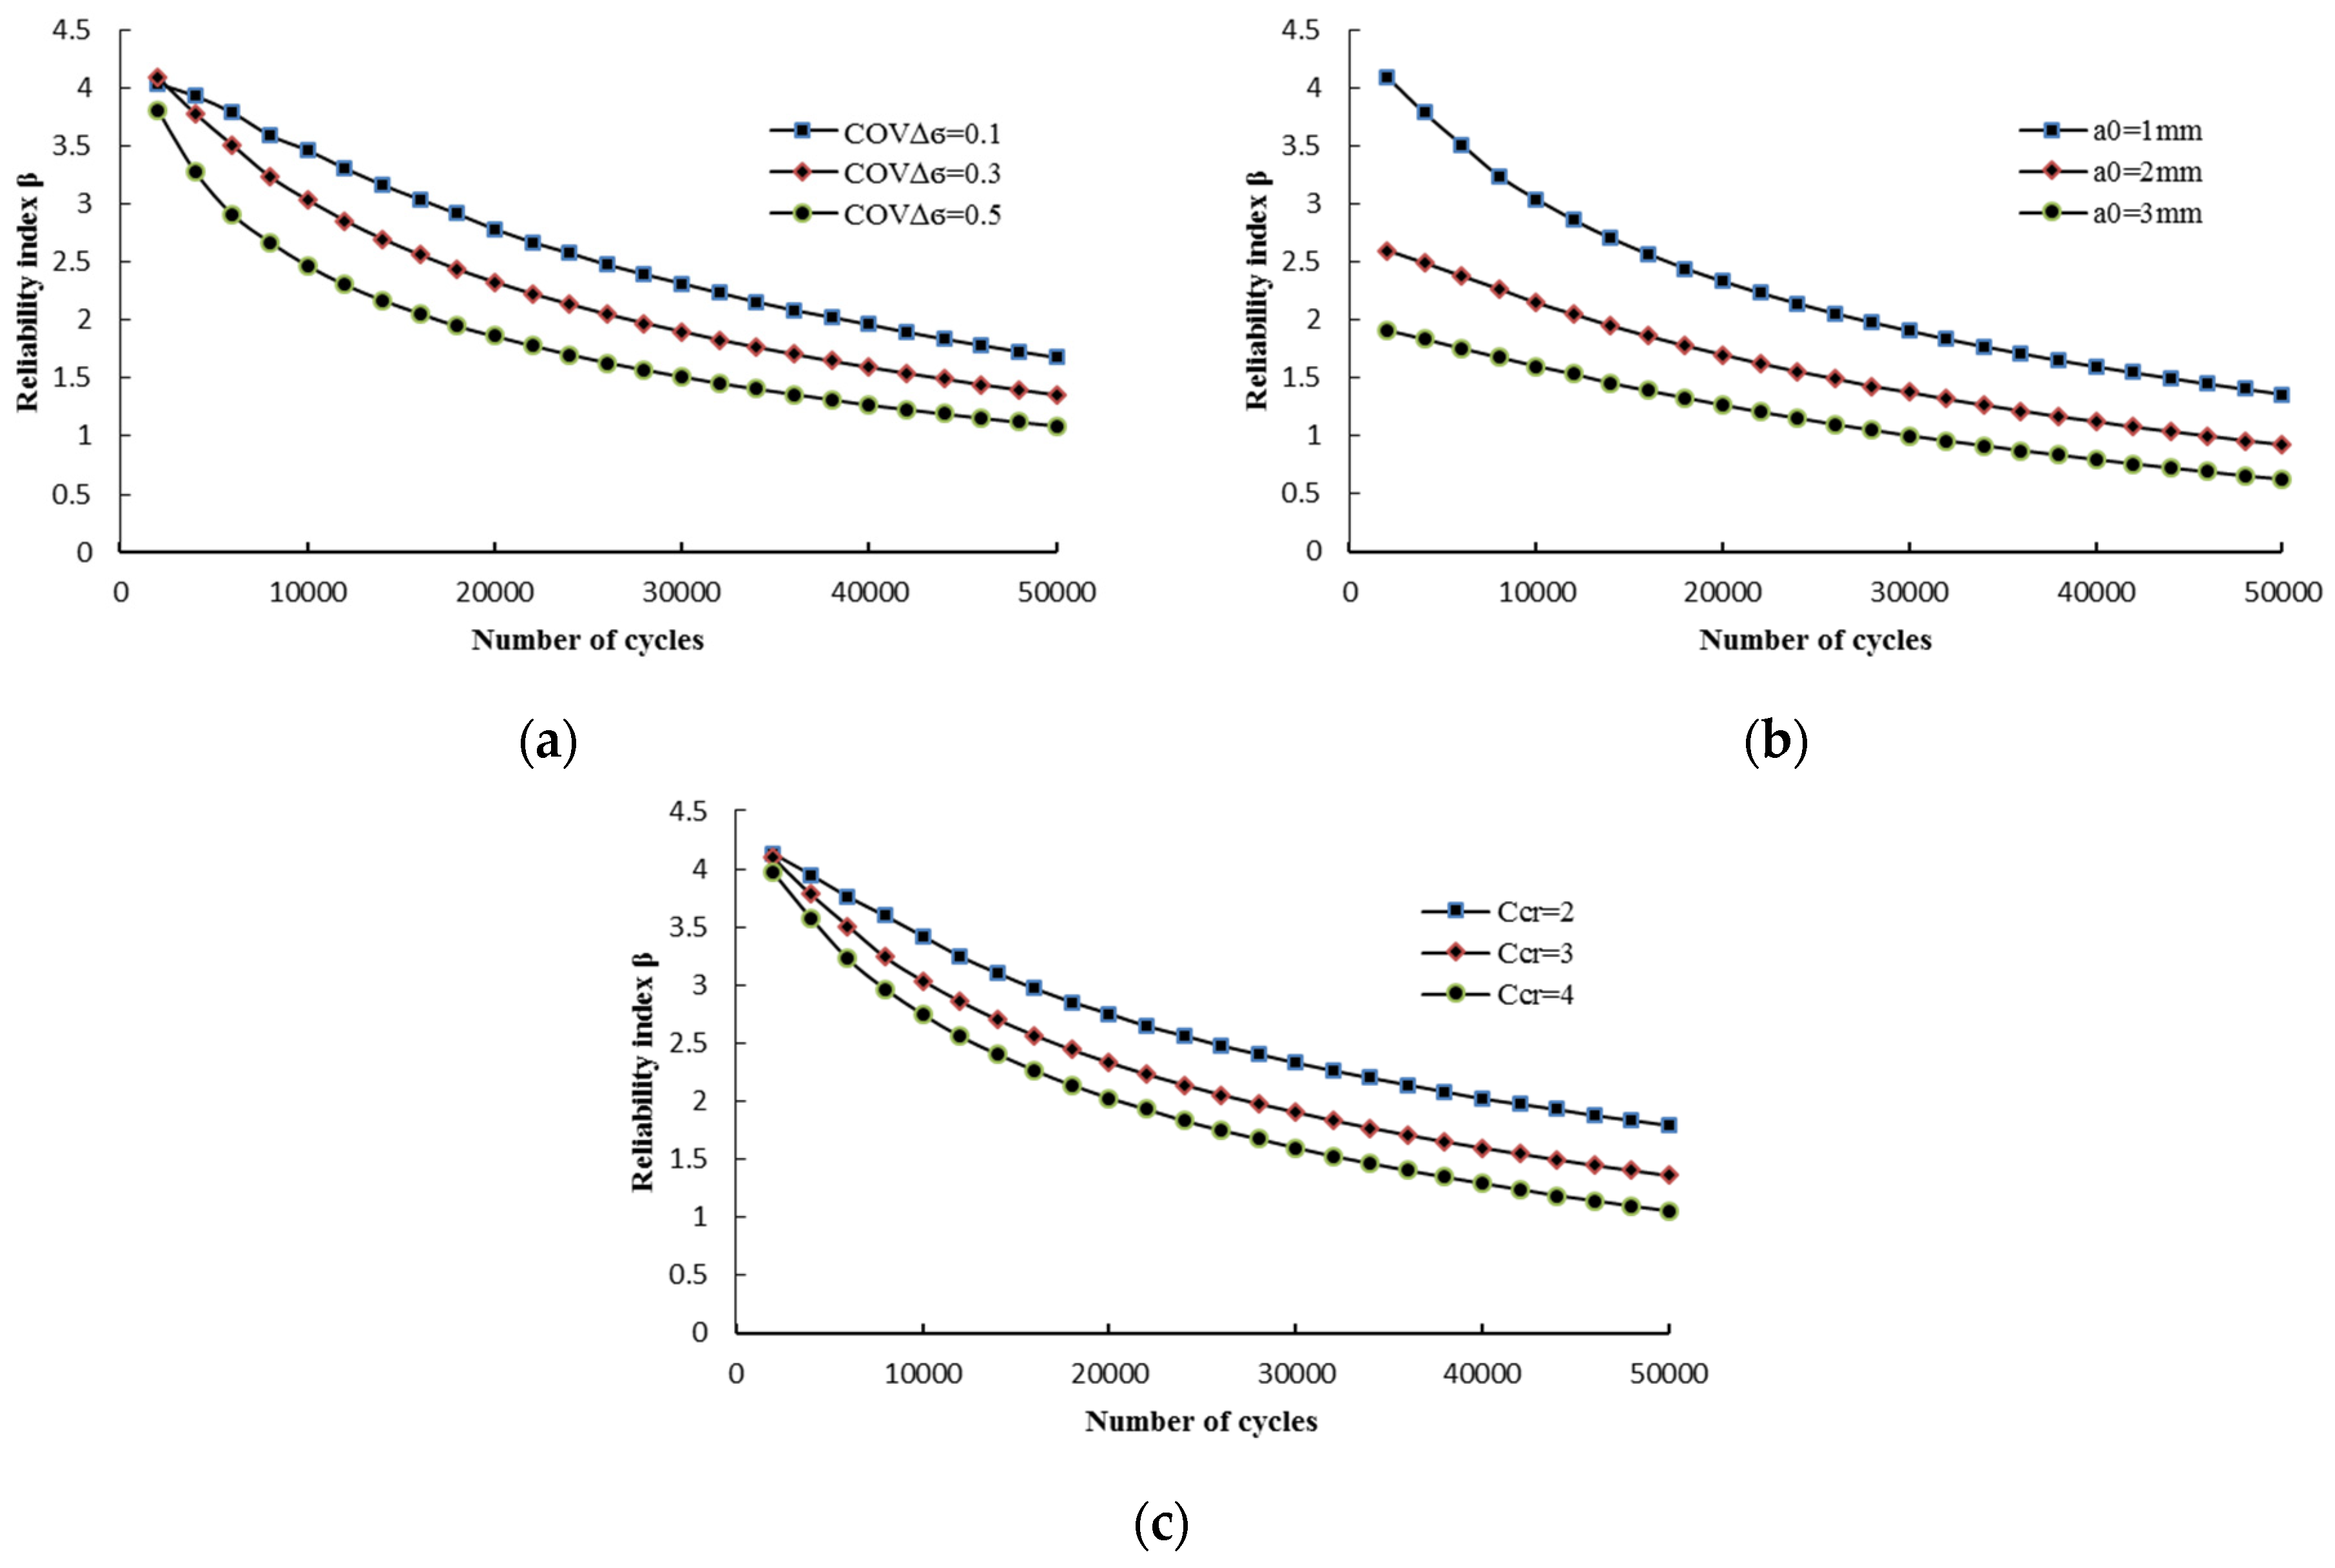
Figure 8 presents the impact of different parameters on the reliability results of the investigated pipeline. The effect of stress range uncertainty is depicted in
Figure 8a, assuming the mean value of
a0 and
Ccr is 1 mm and 3, respectively. As expected, the increasing uncertainty in the stress range leads to lower values of reliability indices. The slope of the
β-N curve increases with the increase of stress range coefficient of variation at the early stage of the fatigue process (lower values of load cycles). However, for the larger number of load cycles, the slope of the
β-N curve becomes flatter for different values of coefficient of variation.
Figure 8b shows the impact of initial crack size on the reliability level of the investigated pipeline for
Ccr = 3 and
COVΔσ = 0.3. It can be observed that increasing of initial crack size significantly decreases the reliability level, particularly at the early stage of the fatigue process. For the higher number of load cycles, the difference between reliability indices becomes lower for different values of initial crack size. The impact of the corrosion-enhancement factor on reliability assessment is depicted in
Figure 8c for
a0 = 1 mm and
COVΔσ = 0.3. It appears that the corrosion enhancement parameter mostly affects the reliability level in a higher number of load cycles.
Another important parameter that may affect the reliability assessment of submarine pipelines is the correlation between material parameters
m and ln
C. Some of the previous studies have indicated the relation between material parameters [
52,
53].
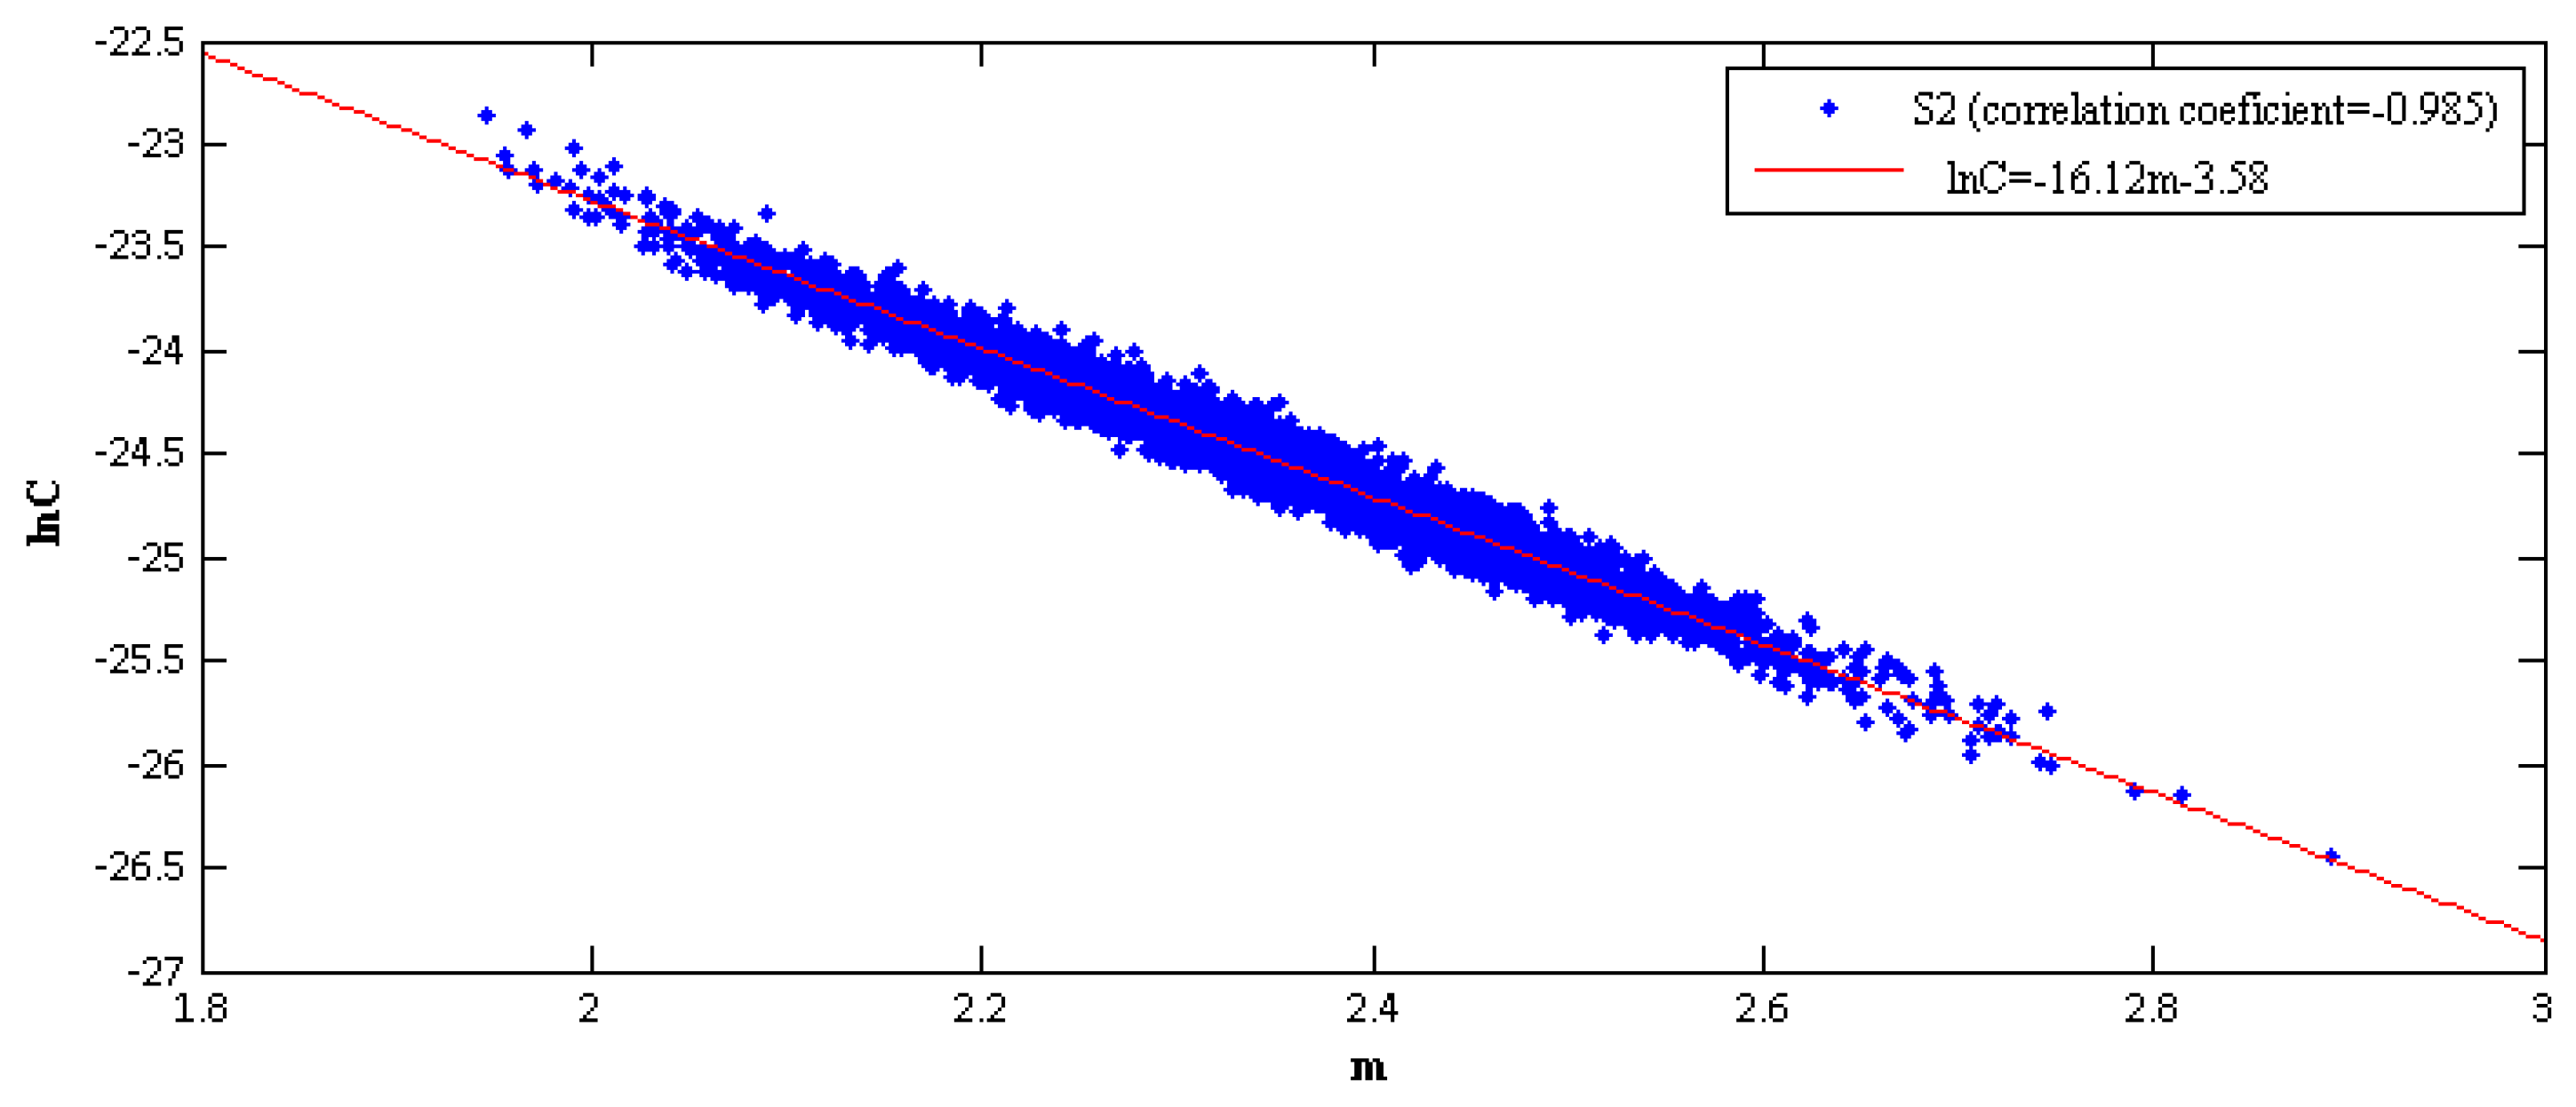
Figure 9 presents the interrelation between the material parameters
m and ln
C for investigated case S
2. It can be observed a strong linear relationship with a negative correlation coefficient of 0.985 between the material parameters of the API 5L X56 submarine pipeline.
To investigate the effect of correlation between material parameters on reliability assessment, a multivariate normal distribution has been used to generate correlated random numbers. The probability density function of the h-dimensional multivariate normal distribution can be expressed as:
where
x and
μ are vectors of random variables and their mean values respectively.
Σ is a
h-by-
h covariance matrix which is a function of the correlation coefficient and standard deviation of random variables. Since two variables (
m, lnC) with a normal distribution are considered correlated variables, Equation (16) with
h = 2 is used to generate correlated random numbers for material parameters. As an alternative method for sampling from correlated random variables, the Nataf transformation method, which assumes a normal Copula function for the joint distribution of random variables, can be also applicable [
48].
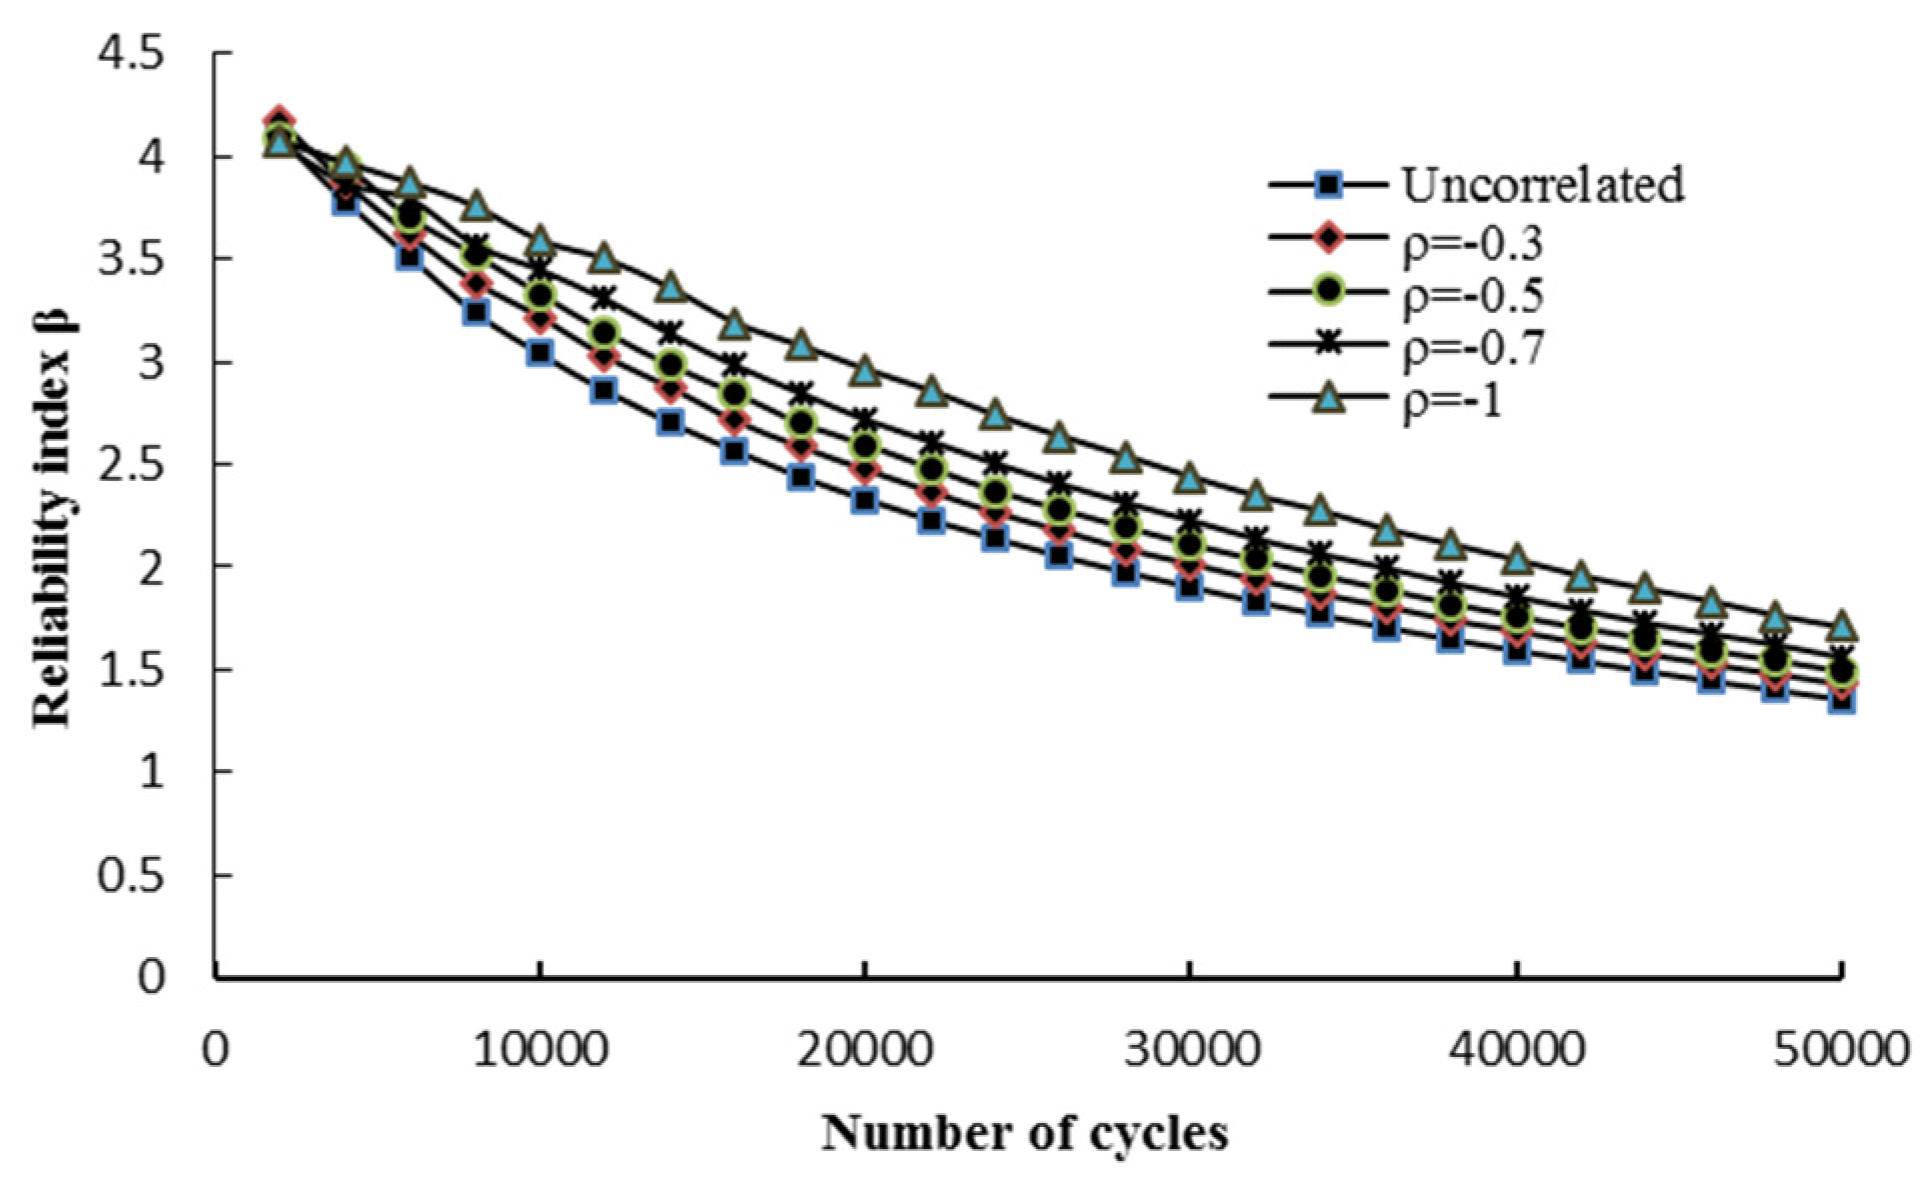
Figure 10 indicates the impact of different values of the correlation coefficient between material parameters on the reliability assessment of investigated pipeline. It can be observed that increasing negative correlation coefficients leads to higher values of reliability indices. The lowest reliability curve is related to the uncorrelated situation and the highest curve is to a fully negatively correlated situation. This implies that disregarding the negative correlation between material parameters leads to a conservative assessment of the fatigue safety level of submarine pipelines.


