Abstract
Due to the influence of environmental noise, sidelobe data, and tunnel emission under the background of multi-background underwater surveying and mapping, it is challenging to detect seafloor terrain in the background noise. Constant false alarm detection of seafloor terrain under the condition of constant false alarm probability has been an important research field. The constant false alarm detection can eliminate noise interference in a water body in the seabed topography mapping process and provide clear and accurate seabed topography information. Therefore, it is a challenging task to increase the detection probability, reduce the missing probability, and increase the detection speed in constant false alarm detection methods. Aiming at the shortcomings of the existing algorithms, this paper proposes an efficient weighted cell averaged constant false alarm detection method (WCA-CFAR). First, the cross-window reference unit sampling method is used to improve the detection speed and accurately sample the background noise unit. Then, the reference unit weighted average constant false alarm detection method is employed to calculate the detection threshold to achieve the purpose of target detection. The proposed method is verified by the simulation data detection test and a test on the actual lake test data. The test results show that the proposed method can effectively reduce the missing detection probability and improve the detection probability.
1. Introduction
A multi-beam echo sounder (MBES) is one of the most important high-tech marine survey equipment pieces in the field of contemporary marine survey. The MBES has been widely used in many applications, including hydrographic surveys, oceanographic engineering, exploration, and development of seafloor resources [1,2,3]. The prerequisite for sonar to obtain information on the seabed terrain, the geomorphic information, is to detect the underwater terrain detected. The underwater environment is complex and changeable, and sonar information acquisition has often been accompanied by various underwater noise and sonar equipment noise interference. Therefore, target detection in a complex environment is an important and fundamental problem in the field of sonar signal processing [4]. The false alarm probability is the probability of being mistaken for a target. In sonar image target detection, the strength of various interferences is random, so it is difficult to ensure constant false alarm probability if a fixed threshold is used to detect targets. Therefore, under the interference of inhomogeneous noise, maintaining the false alarm probability of target detection being stable has always been a hot research topic.
Garcia, Fernando et al. [5,6] assumed that the background power was distributed in a variety of Weibull clutters, and the detection threshold of the cell-averaged constant false alarm detection method (CA-CFAR) was calculated to realize target detection. Acosta, Gerardo, G et al. [7] extended the CA-CFAR method from a one-dimensional method to a two-dimensional method and applied it to the target detection of side-scan sonar. The CA-CFAR has a good detection effect in an environment with a uniform noise distribution, but there is a problem of a high false positive rate, which can occur under the condition of a non-uniform noise distribution. Pace, Phillip. et al. [8] used the subset with the greatest background power in a reference unit subset as a reference unit to calculate the detection threshold and proposed the greatest constant false alarm rate processor (GO-CFAR). Moore Jerry. et al. [9] employed the GO-CFAR method to detect radar targets whose signal amplitude is Swerling I fluctuation. Liu, Na Na et al. [10] applied the algorithm to the target detection from radar images. Chalabi, Izzeddine et al. [11] assumed that the background interference obeyed the Gamma distribution and calculated a constant false alarm threshold to detect the target. The GO-CFAR method can solve the problem of false alarms. The GO-CFAR method increases the missing alarm probability of a detector while keeping the false alarm probability constant. Li, Ming-Dian. et al. [12] adopted the adaptive superpixel level method to optimize the performance of the CFAR detector and achieved good results in dense ship detection. Messali, Zoubeida. et al. [13] proposed the smallest constant false alarm rate processor (SO-CFAR) by using the smallest background power in a reference unit subset as a reference value to calculate the detection threshold. The SO-CFAR method can solve the problem of missing alarms. The SO-CFAR method assures the missing alarm probability while reducing the false alarm probability. Ruida, Chen et al. [14] used a sequential selection CFAR method to detect targets in vehicle-mounted millimeter wave radar data. The problems of false and missing alarms are mutually restrictive, so how to achieve a balance between them has been crucial for constant false alarm target detection. The characteristics of traditional CA-CFAR, GO-CFAR, and SO-CFAR methods are shown in Table 1.

Table 1.
The characteristics of traditional methods.
Finn et al. [15] used a CFAR method with a window structure spanning two clutter spaces to detect one-dimensional signal targets. Zhou, Jie et al. [16] used a sliding window of quantile truncation statistics to improve the CFAR method to realize remote sensing target detection. Wang, Weijiang et al. [17] improved the reference window structure and used it to detect two-dimensional radar targets. The detection probability and speed of the CA-CFAR method are affected by the selection window size of a reference unit. Namely, if the selection window is too large, the operation speed will decrease sharply, but if the selection window is too small, the algorithm cannot accurately estimate the background noise power. Therefore, achieving an accurate estimation of computing speed and background noise has been another key problem to be solved in constant false alarm target detection. Aiming at the aforementioned two problems, this paper designs a cross-window acquisition reference unit to estimate the background noise in the horizontal and vertical directions in an MBES image, which improves the background noise estimation accuracy of an algorithm. Since a cross window is smaller than a rectangular window reference unit of the traditional CFAR method, the calculation speed of the algorithm can be improved. In this study, the relevant reference windows are all cross windows.
In addition, the weighted average method is used to calculate the detection threshold of the CFAR in four directions of the reference window. In this way, the contribution of the reference units in the four directions to the background noise estimation can be dynamically improved. Therefore, an accurate target detection threshold can be obtained, and a dynamic balance between false and missed detection rates can be achieved.
The main contributions are listed in the following, and the organization of the rest of this paper is provided:
(1) This paper develops a weighted unit average constant false alarm detection method (WCA-CFAR). In the WCA-CFAR method, the total clutter estimate is obtained by weighting a subset of reference units. The optimal weight is obtained under the condition of maximizing the detection probability while maintaining constant false alarm probability.
(2) In this study, multi-beam sonar is used to measure the seabed, which is strongly backscattered, so the energy can leak into other beams, causing strong interference to the lateral beam. Both horizontal and vertical noise interferences are large, and if the reference unit obtained by the rectangular window is used to estimate the background noise, the result will be inaccurate. In addition, not only the calculation time will be long, but also the false alarm rate will increase. Therefore, horizontal and vertical cross windows are used to obtain the reference unit, which reduces the calculation speed and increases the accuracy of the background noise power estimation.
(3) The proposed WCA-CFAR method is tested and compared with the SO-CFAR, CA-CFAR, and GO-CFAR methods through the simulation and lake tests.
The rest of this article is organized as follows. Section 2 discusses the 1D-CA-CFAR method, extends it to the 2D-CA-CFAR method, and analyzes the influence of different reference cell windows on the noise power estimation performance. Section 3 introduces the WCA-CFAR method, which can solve the problem of time complexity and achieve a balance between correct and missed detection probabilities in traditional detection methods. Section 4 compares the simulation and measured data and analyzes different CFAR methods to verify the effectiveness of the proposed method. Section 5 concludes this paper.
2. Materials and Methods
To discuss the relevant theories of constant false alarm detection better, this section presents the 1D-CFAR and 2D-CFAR models and, on this basis, proposes the WCA-CFAR method.
2.1. Basic Two-Dimensional Constant False Alarm Detection Model
The false alarm refers to being mistaken for a target, and its occurrence probability is called the false alarm probability. A constant false alarm detection model can calculate the detection threshold based on the constant false alarm probability under the assumption of the background interference distribution and can detect targets by using the detection threshold. The CFAR model has been widely used in sonar target detection applications.
A constant false alarm detector is an important part of sonar information processing. A two-dimensional (2D) constant false alarm detection model is a derivative model of a one-dimensional (1D) constant false alarm detection model. To analyze the 2D-CFAR model better, first, the relevant parameters of the 1D-CFAR model are explained, as shown in Figure 1.
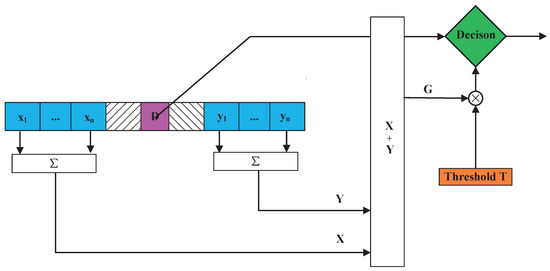
Figure 1.
The structure of a 1D constant false alarm detection model.
The structure of the 1D-CFAR detector is presented in Figure 1. Considering the representation methods used in most studies on the CFAR mentioned in the previous section, this study uses and to represent the reference unit sampling (blue unit) on the two sides of the detection unit; the reference sliding window length is set to , where n is the left or right reference sliding window length; X and Y are the local estimates of the background noise intensity in the left and right sliding windows, respectively; the adaptive decision criterion is defined by:
where is the hypothesis expressing that there is a target; denotes the hypothesis expressing that there is no target; G is the estimate of the noise power level in the reference sliding window; T is the nominal factor; D represents the detection statistic of the detection unit (the pink unit).
The two closest neighbors to the detection unit denote protection units that are used to prevent the target’s energy from leaking into the reference unit, affecting the two local estimates of the noise strength of the CFAR detector. The 1D-CFAR detector can accurately calculate the detection threshold (i.e., orange part) according to the background environment (i.e., blue part). Based on the detection threshold, it is judged whether the detection unit (i.e., pink part) represents a target.
The window shape of the 2D-CFAR model reference unit has an impact on the estimation result of the background power and the detection speed of the 2D-CFAR algorithm. Therefore, to analyze the impact of the window shape on the target detection result, this study explains the relevant parameters of different window shapes. Considering the problem of large noise interference in the horizontal and vertical directions of the MBES, the following related algorithms all use the cross window. First, the total background noise power is estimated based on the sampled data in the reference window. Then, the detection threshold is obtained by multiplying the threshold factor with the total background power. Finally, the interference target is removed under the condition of ensuring the false alarm probability. The structural diagrams of the rectangular and cross windows are shown in Figure 2. In Figure 2A,B, D represents the detection statistic of the detection unit (pink unit). Figure 2A shows eight adjacent units of D; Figure 2B shows four adjacent units of D are protection units; the remaining units represent the reference sampling units (blue units). The time complexity of the two windows is analyzed in the following. Assume that the number of sonar image pixels is m, the number of these units n, and the algorithm complexity of the cross window is . Then, algorithm complexity of the rectangular window is , the algorithm complexity of the cross window is lower, and the CFAR method using a cross reference window is faster than the CFAR method using a rectangle reference window. Because the multi-beam sonar acquisition data have a low signal-to-noise ratio (SNR) in the horizontal and vertical directions, to estimate the environmental background better, this paper uses a cross-reference window for data sampling.
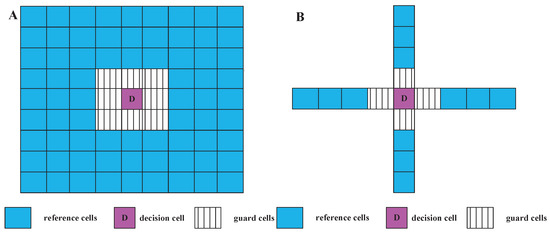
Figure 2.
Structural diagrams of sampling windows: (A) rectangular sampling window; (B) cross window sampling window.
Based on the relevant description of the CFAR model and the selection of the reference window, a cross window is used as a reference window in the MBES 2D-CA-CFAR problem. As shown in Figure 3, reference units in the upper, lower, left, and right directions are represented by , , , and , respectively. The reference sliding window length is . In addition, X, Y, Z, and U are local estimates of noise in the four directions; G is the estimated noise level, and T is the nominal factor In the 2D-CA-CFAR problem, G is estimated by adding and summing X, Y, Z, and U.
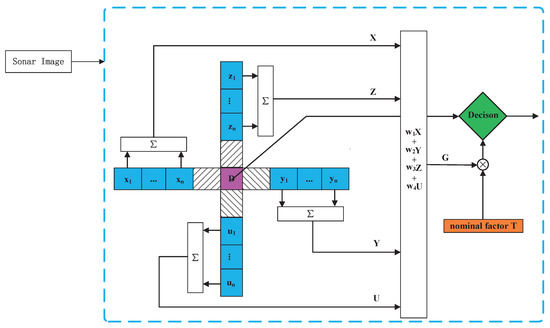
Figure 3.
The basic 2D-CFAR model structure.
The background power estimation in a detector is performed using reference cell samples when , , and are all equal to one, the 2D-CFAR becomes the CA-CFAR, and the total background power G is estimated as follows:
where G is the total background power; is the noise power of the left reference unit; is the noise power of the right reference unit; is the noise power of the upper reference unit; is the noise power of the lower reference unit.
Assuming that each reference cell sample within the reference window follows an exponential distribution, which represents a special case of the distribution for , the probability density function of the distribution can be expressed as follows:
where and are two parameters; the function for the integer , is given by ; when , then ; can be obtained from Equation (3), and the probability density distribution is an exponential distribution. Then, the exponential distribution probability density function is defined by:
Under the assumption expressing that there is no target in the reference cell, is the average power of background noise, which is expressed in . Under the assumption expressing that there is a target, is , where is the ratio of the target power to the average noise power. The value of is defined as follows:
The reference unit samples are , , , and , and the background noise power is .
In the detection threshold expression of , T denotes the nominal factor, and G is the estimated noise level; S and G are random variables. By solving the statistical average over G, the false alarm probability is obtained as follows.
Assume that indicates that there is no target, represents the probability of judging a target under the no-target condition, D is the power of the unit to be detected, denotes the expectation of , and is the expectation of . Then, it holds that:
where is the probability density function of G, and is the moment-generating function (MGF), and it is defined by .
2.2. WCA-CFAR False Alarm Detector Model
Considering that the constant false alarm probability and the false negative probability in the basic two-dimensional CFAR detection model cannot be satisfied at the same time, it can be found that in the average unit CFAR detection method, the four reference cell subsets play an equal role in estimating the background noise distribution. However, the noise distribution in the horizontal and vertical directions in the MBES images is different [3]; namely, the noise power in the vertical direction is higher than in the horizontal direction, so the average unit constant false alarm detection method is prone to false alarms. Therefore, the WCA-CFAR method is proposed. Based on the average unit constant false alarm detection method, the WCA-CFAR method sets four different weight coefficients for the reference unit subsets in the four directions of the detection unit. The total background power represents the sum of the products of each reference unit subset and the weight coefficient. Therefore, the background power of the four reference units can be adjusted to be consistent with the weight coefficient change. Accordingly, the problem of false alarm rate increase caused by a difference in the background power between the vertical and horizontal directions of the MBES can be solved.
For a weighted unit averaged constant false alarm detection detector, the total background power estimate is obtained by weighting the local estimates of the upper, lower, left, and right reference windows. The basic WCA-CFAR model structure is shown in Figure 3.
where , , and are the optimal weight obtained when maintaining a constant false alarm probability. At the same time, the detection probability is maximized.
According to the moment-generating function relationship of the sum of four random variables, the moment-generating function of the sum of multiple statistically independent random variables is equal to the product of their individual moment-generating functions. The moment-generating function of is obtained by:
where , , , .
The false alarm probability of the WCA-CFAR detection model at the background power is obtained by Equations (6)–(8) as follows:
Further, since it holds that:
Then, it follows that:
The nominal factor T can be calculated using Equation (11) at the preset false alarm probability.
3. Experiments
The software and hardware conditions, experimental data conditions, and performance analysis parameters used to evaluate the proposed method are presented in this section.
3.1. Experimental Hardware and Software
Experiments were run on a pc operating on Microsoft Windows 10 operating system, equipped with an NVIDIA GTX TITAN-XP GPU and 64 GB memory. Matlab R2019b version was used as a simulation environment for the related algorithms and an experiment on the actual lake data.
3.2. Experimental Datasets
In the detection performance analysis of the WCA-CFAR algorithm and related classical algorithms to analyze the target detection algorithms under the environment noise with exponential distribution, 1D simulation data were used. Then, considering the inconsistency between the vertical and horizontal noise powers in the actual operation of the MBES, the performance analysis of the algorithms was conducted using 2D actual lake data.
3.3. Performance Analysis
The performance of the proposed method for terrain detection was verified under ideal 1D data and actual terrain conditions. The method of simulation and measured data verification was used to analyze the performance of the proposed method.
Proposed Method Validation on Simulation Data:
The test simulated the constant false alarm detection of one-beam data of multi-beam sonar under the condition of exponentially distributed background noise power. The simulated noise and targets are shown in Figure 4.
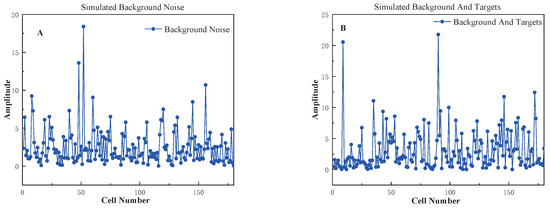
Figure 4.
The 1D simulated noise and target data.
Noise data included 148 sampling points; the background noise power was 20 dB; the reference window length was . There were two protection units on each side; the false alarm probability was . In the simulation test, the target was added to unit 64, and SNR was 20 dB.
In this study, the , , and methods were selected for comparison because they are the most widely used methods in target constant false alarm detection and have excellent performance in solving the false alarm problem and the false negative problem.
The proposed method was compared with the , , and methods, and the comparison results are shown in Figure 5.
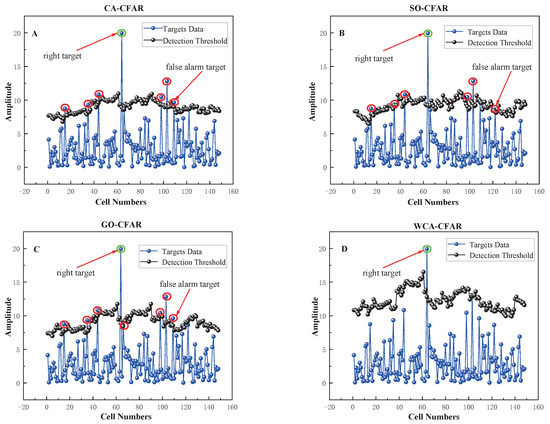
Figure 5.
Comparison results of different one-dimensional CFAR detection algorithms: (A) 1D-CA-CFAR method; (B) 1D-SO-CFAR method; (C) 1D-GO-CFAR method; (D) 1D-WCA-CFAR method.
The method detected seven points, the method also detected seven points, and the method detected eight points. The proposed method could accurately detect all target points. As shown in Table 2, the accuracy rate, recall rate, and precision of the proposed method were all 100%, and the optimal accuracy rates of the comparison methods were 95.94%; the optimal precision of the comparison methods was 14.28%.

Table 2.
Comparison of simulation test results.
The results indicated that the proposed method had better detection probability and lower false alarm probability in target detection than the other methods. However, in the proposed method, the detection threshold was calculated under the ideal assumption that the background noise was exponentially distributed, but this assumption could bring certain limitations to the proposed algorithm. Therefore, in future work, a variety of background noise models could be used to detect targets by switching different detection thresholds according to different noise distributions.
Proposed Method Validation on Lake Data:
A lake experiment was conducted using the HT48 series multi-beam echo sounder developed independently to evaluate the detection performance of the proposed method further.
The main technical parameters were as follows: the sampling frequency was 48 kHz, the center frequency was 12 kHz, and the transmitted signal was a single-frequency rectangular pulse. The HT series multi-beam sounder composition is shown in Figure 6.

Figure 6.
The HT multi-beam echo sonar structure diagram: (a) system composition diagram; (b) Mill’s cross-array sonar architecture.
The HT series multi-beam echo sounder was based on Mill’s cross-array sonar architecture, which connected all modules and embedded the processor and controller in a sonar head, making the installation process very simple. The control graphical user interface (GUI) installed on the computer allowed the surveyor to control the relevant operating parameters of the HT series multi-beam echo sounder. The GUI communicated with the sonar interface model (SIM) via Ethernet, which provided the operating power to the sonar head and routed the raw multi-beam data to the data acquisition computer. After the original echo signal was filtered, demodulated, and processed by the FFT beamforming, the actual test data on the lake were obtained and used for the verification of the proposed algorithm.
Lake experiment and data processing. The limitations of the 1D analog simulation were as follows. The distribution of the simulated noise power and the experimental environment were ideal. Therefore, to verify the effectiveness of the proposed method in solving the problem of non-uniform horizontal and vertical distributions of noise, a typical water area located in Songhua Lake, Jilin City, Jilin Province, China, was selected as a study area in experiments. The installation of the experimental device and location of the MBES equipment of the survey ship are presented in Figure 7.
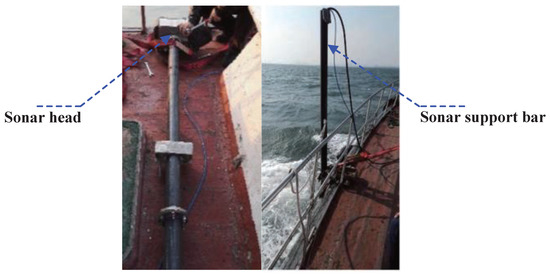
Figure 7.
The installation location of MBES equipment on the survey ship.
The measured data were the depth data of the lake bottom obtained by the experiment of Songhua Lake in Jilin Province, China, in 2020. The equipment parameters of the multi-beam sonar sounding system used in the test were as follows: sound speed was 1500 m/s, sampling frequency was 48 kHz, the center frequency was 12 kHz, and sampling point number was 10,000. Part of the channel data collected in the experiment is shown in Figure 8. After beamforming, the water body data map shown in Figure 9 was obtained.
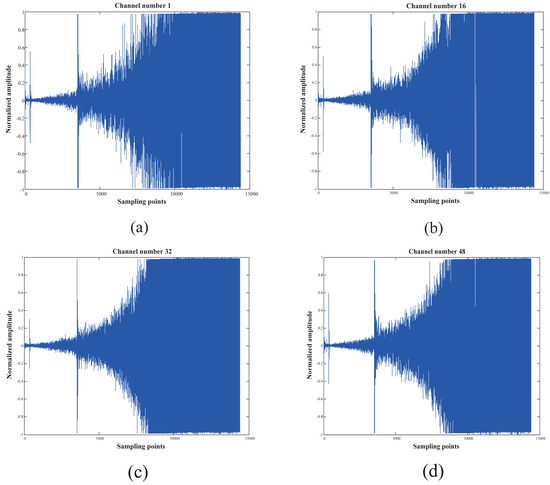
Figure 8.
The raw echo signals in different channels: (a) Channel 1; (b) Channel 16; (c) Channel 32; (d) Channel 48.
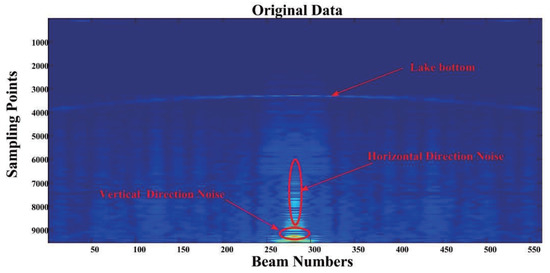
Figure 9.
The raw data after beamforming.
The proposed method and the , , and methods were all used for underwater terrain detection under the same conditions. To examine the performances of the four methods fairly, the four methods adopted the same setting parameters: reference window length was , and there were 120 protection units, which were evenly distributed in the upper, lower, right, and left directions of the target to be detected. The comparison results of the algorithms are shown in Figure 10.
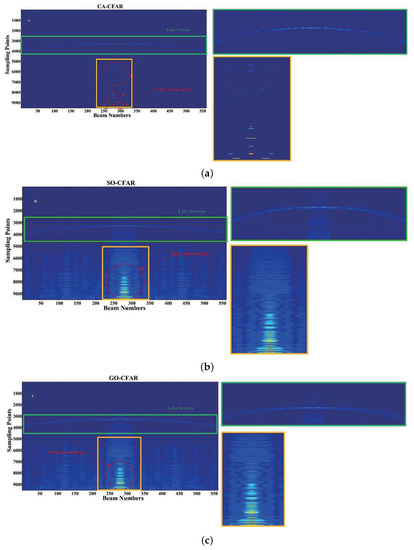
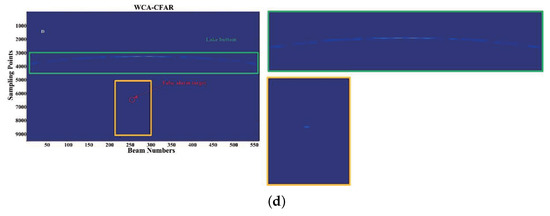
Figure 10.
Comparison results of the constant false alarm detection methods in the lake experiments: (a) the 2D-CA-CFAR method; (b) the 2D-SO-CFAR method; (c) the 2D-GO-CFAR method; (d) the 2D-WCA-CFAR method.
In Figure 10a, it can be seen that 2D-CA-CFAR could detect the target to a certain extent under the noise background, but the probability of a false alarm was high. Since the 2D-CA-CFAR method used the average value of the reference unit to calculate the detection threshold, when the MBES had large noise interference in the horizontal and vertical directions, the calculated detection threshold was low, and the false alarm problem occurred. Particularly, the problem of a false alarm was most severe in the position directly below (beam numbers in the area of 250–300), where the noise intensity was the largest. Further, as shown in Figure 10b,c, the 2D-SO-CFAR, and 2D-GO-CFAR methods used only one subset of the four reference unit subsets, which had the smallest or largest background power, to calculate the detection threshold. In this way, the calculated detection threshold was extremely small or extremely large, which caused the false and missed detection rates to increase. In the proposed method, the weighted average method was employed to allocate the importance of the four reference unit subsets in the detection threshold calculation process reasonably, so a more accurate estimation of the background noise could be achieved. The experimental results in Figure 10d show that the proposed method had better object detection ability than the 2D-CA-CFAR, 2D-SO-CFAR, and 2D-GO-CFAR methods under the condition of constant false alarm.
As shown in Table 3, the number of false alarm targets of the proposed method was 123, and the least number of false alarm targets of the comparison algorithms was 2851, which was approximately 20 times larger. Therefore, the proposed method could reduce the number of false alarm targets, showing a more obvious detection effect.

Table 3.
Comparison of detection results of the correlation algorithm in the lake test.
The above two experiments were performed, and the 1D simulation experiment was conducted to analyze the target detection ability of the WCA-CFAR method under the condition that noise obeyed an exponential distribution. The lake experiments were conducted to illustrate the inconsistency in the MBES data distribution, which reflects the ability of the WCA-CFAR method to solve such problems.
4. Discussion
By using the proposed method, the effect of the constant false alarm target detection method can be improved through accurate analysis and estimation of the underwater noise distribution. In the one-dimensional simulation experiment, the detection accuracy of the proposed method reached 100%, while the accuracy results of the comparison methods were only 95.94% (CA-CFAR, SO-CFAR) and 95.27% (GO-CFAR). In addition, the precision of the proposed method reached 100%, while the precision values of the comparison methods were only 14.28% and 12.5%. In the actual situation, where the horizontal and vertical noise distributions of the MBES system are inconsistent, the proposed method can achieve a good detection effect. In the lake surface experiment, the number of false alarm targets of the proposed method was 123, and that of the comparison method was 20 times larger. The proposed could remove the false alarm targets in the horizontal and vertical directions, achieving a good detection performance. In this study, the modeling of the correlation model is performed under the assumption that the noise distribution is an exponential distribution. Therefore, considering the diversity of noise distribution, In practical applications, some underwater noise obeys Gaussian distribution, log-Normal distribution, and K distribution, so solving the weighted average unit constant false alarm detection problem under different noise distribution conditions could be a further research direction.
5. Conclusions
This study analyzes the problem of constant false alarm detection in multi-beam bathymetry systems. First, considering large horizontal and vertical noise interferences of water body data obtained by multi-beam sonar, a cross-window sampling method is developed to sample the reference unit, and the background noise is estimated accurately. Second, the time complexity of the cross-window sampling method is analyzed, and the advantages of using the cross-window noise power estimation method are discussed. The weighted unit average constant false alarm detection method is proposed, and the noise distribution of the reference unit in the four directions sampled by the cross window is analyzed globally. The noise power is accurately estimated under the condition of ensuring constant false alarm probability; also, the detection probability is improved while the miss probability is reduced. The proposed method is compared with the CA-CFAR, SO-CFAR, and GO-CFAR methods through simulation tests and experimental lake tests. In the simulation tests, the detection accuracy, recall rate, and precision of the proposed method are all 100%. However, the comparison methods achieve an optimal accuracy rate of 95.94%, an optimal recall rate of 100%, and an optimal precision rate of only 14.28%. In the experimental lake tests, the number of false alarm targets of the proposed method is 123, while those of the comparison methods are 2851 and higher.
Author Contributions
Conceptualization, J.W. and H.L.; Methodology, J.W. and G.H.; Software, J.W.; Validation, J.W. and H.L.; Formal analysis, J.W. and C.L.; Investigation, J.W. and Y.W.; Resources, H.L.; Data curation, H.L.; Writing—original draft preparation, J.W.; Writing—review and editing, J.W. and H.L.; Visualization, J.W.; Supervision, G.H. and H.L.; Project administration, G.H. and H.L.; Funding acquisition, H.L. All authors have read and agreed to the published version of the manuscript.
Funding
This research was funded by National Natural Science Foundation of China under grant nos. U1906218 and 2021YFC3101803.; in part by Natural Science Foundation of Heilongjiang Province, under grant no. ZD2020D001; and in part by key areas of research and development plan key projects of Guangdong Province under grant no.2020B1111010002.
Institutional Review Board Statement
Not applicable.
Informed Consent Statement
Not applicable.
Data Availability Statement
Due to the nature of this research, participants of this study did not agree for their data to be shared publicly, so supporting data is not available.
Acknowledgments
We would like to thank Guanying Huo, L-3 Klein Associates, EdgeTech, Lcocean, Hydro-tech Marine, and Tritech for their great support for providing the valuable real side-scan sonar images.
Conflicts of Interest
The authors declare no conflict of interest.
References
- Ferrini, V.L. Dynamics of Nearshore Sedimentary Environments Revealed through the Analysis of Multibeam Sonar Data; State University of New York at Stony Brook: Stony Brook, NY, USA, 2004. [Google Scholar]
- Jung, D.; Kim, J.; Byun, G. Numerical modeling and simulation technique in time-domain for multibeam echo sounder. Int. J. Nav. Archit. Ocean. Eng. 2018, 10, 225–234. [Google Scholar] [CrossRef]
- Wang, J.; Li, H.; Du, W.; Xing, T.; Zhou, T. Seafloor terrain detection from acoustic images utilizing the fast two-dimensional CMLD-CFAR. Int. J. Nav. Archit. Ocean. Eng. 2021, 13, 187–193. [Google Scholar] [CrossRef]
- Yukuo, W.; Baowei, C.; Haisen, L. Tunnel effect elimination in multibeam bathymetry sonar based on MVDR algorithm. Hydrogr. Surv. Charting 2011, 31, 28–31. [Google Scholar]
- García, F.D.A.; Rodriguez, A.C.F.; Fraidenraich, G.; Santos Filho, J.C.S. CA-CFAR detection performance in homogeneous Weibull clutter. IEEE Geosci. Remote Sens. Lett. 2018, 16, 887–891. [Google Scholar] [CrossRef]
- Raghavan, R. Analysis of CA-CFAR processors for linear-law detection. IEEE Trans. Aerosp. Electron. Syst. 1992, 28, 661–665. [Google Scholar] [CrossRef]
- Acosta, G.G.; Villar, S.A. Accumulated CA–CFAR process in 2-D for online object detection from sidescan sonar data. IEEE J. Ocean. Eng. 2014, 40, 558–569. [Google Scholar] [CrossRef]
- Pace, P.E.; Taylor, L.L. False alarm analysis of the envelope detection GO-CFAR processor. IEEE Trans. Aerosp. Electron. Syst. 1994, 30, 848–864. [Google Scholar] [CrossRef]
- Moore, J.D.; Lawrence, N. Comparison of two CFAR methods used with square law detection of Swerling I targets. In Proceedings of the International Radar Conference, Arlington, VA, USA, 28–30 April 1980; pp. 403–409. [Google Scholar]
- Liu, N.N.; Li, J.; Cui, Y. A new detection algorithm based on CFAR for radar image with homogeneous background. Prog. Electromagn. Res. C 2010, 15, 13–22. [Google Scholar] [CrossRef]
- Chalabi, I. Application of CFAR detection to multiple pulses for gamma distributed clutter. Remote Sens. Lett. 2022, 13, 1011–1019. [Google Scholar] [CrossRef]
- Li, M.D.; Cui, X.C.; Chen, S.W. Adaptive superpixel-level CFAR detector for SAR inshore dense ship detection. IEEE Geosci. Remote Sens. Lett. 2021, 19, 1–5. [Google Scholar] [CrossRef]
- Messali, Z.; Soltani, F.; Sahmoudi, M. Robust radar detection of CA, GO and SO CFAR in Pearson measurements based on a non linear compression procedure for clutter reduction. Signal Image Video Process. 2008, 2, 169–176. [Google Scholar] [CrossRef]
- Ruida, C.; Yicheng, J.; Zhenwei, M.; Gang, Y.; Bing, W. A New CFAR Detection Algorithm Based on Sorting Selection for Vehicle Millimeter Wave Radar; Technical Report, SAE Technical Paper; SAE: Warrendale, PA, USA, 2020. [Google Scholar]
- Finn, H.M. A CFAR design for a window spanning two clutter fields. IEEE Trans. Aerosp. Electron. Syst. 1986, AES-22, 155–169. [Google Scholar] [CrossRef]
- Zhou, J.; Xie, J.; Liao, X.; Sun, C. Robust Sliding Window CFAR Detection Based on Quantile Truncated Statistics. IEEE Trans. Geosci. Remote Sens. 2022, 60, 5117823. [Google Scholar] [CrossRef]
- Wang, W.; Wang, R.; Jiang, R.; Yang, H.; Wang, X. Modified reference window for two-dimensional CFAR in radar target detection. J. Eng. 2019, 2019, 7924–7927. [Google Scholar] [CrossRef]
Disclaimer/Publisher’s Note: The statements, opinions and data contained in all publications are solely those of the individual author(s) and contributor(s) and not of MDPI and/or the editor(s). MDPI and/or the editor(s) disclaim responsibility for any injury to people or property resulting from any ideas, methods, instructions or products referred to in the content. |
© 2023 by the authors. Licensee MDPI, Basel, Switzerland. This article is an open access article distributed under the terms and conditions of the Creative Commons Attribution (CC BY) license (https://creativecommons.org/licenses/by/4.0/).