


Depositional Environment and Organic Matter Enrichment in the Lower Paleozoic Shale from the Northeastern Margin of the Yangtze Platform, South China

Abstract
1. Introduction
2. Geological Setting
3. Samples and Analyses
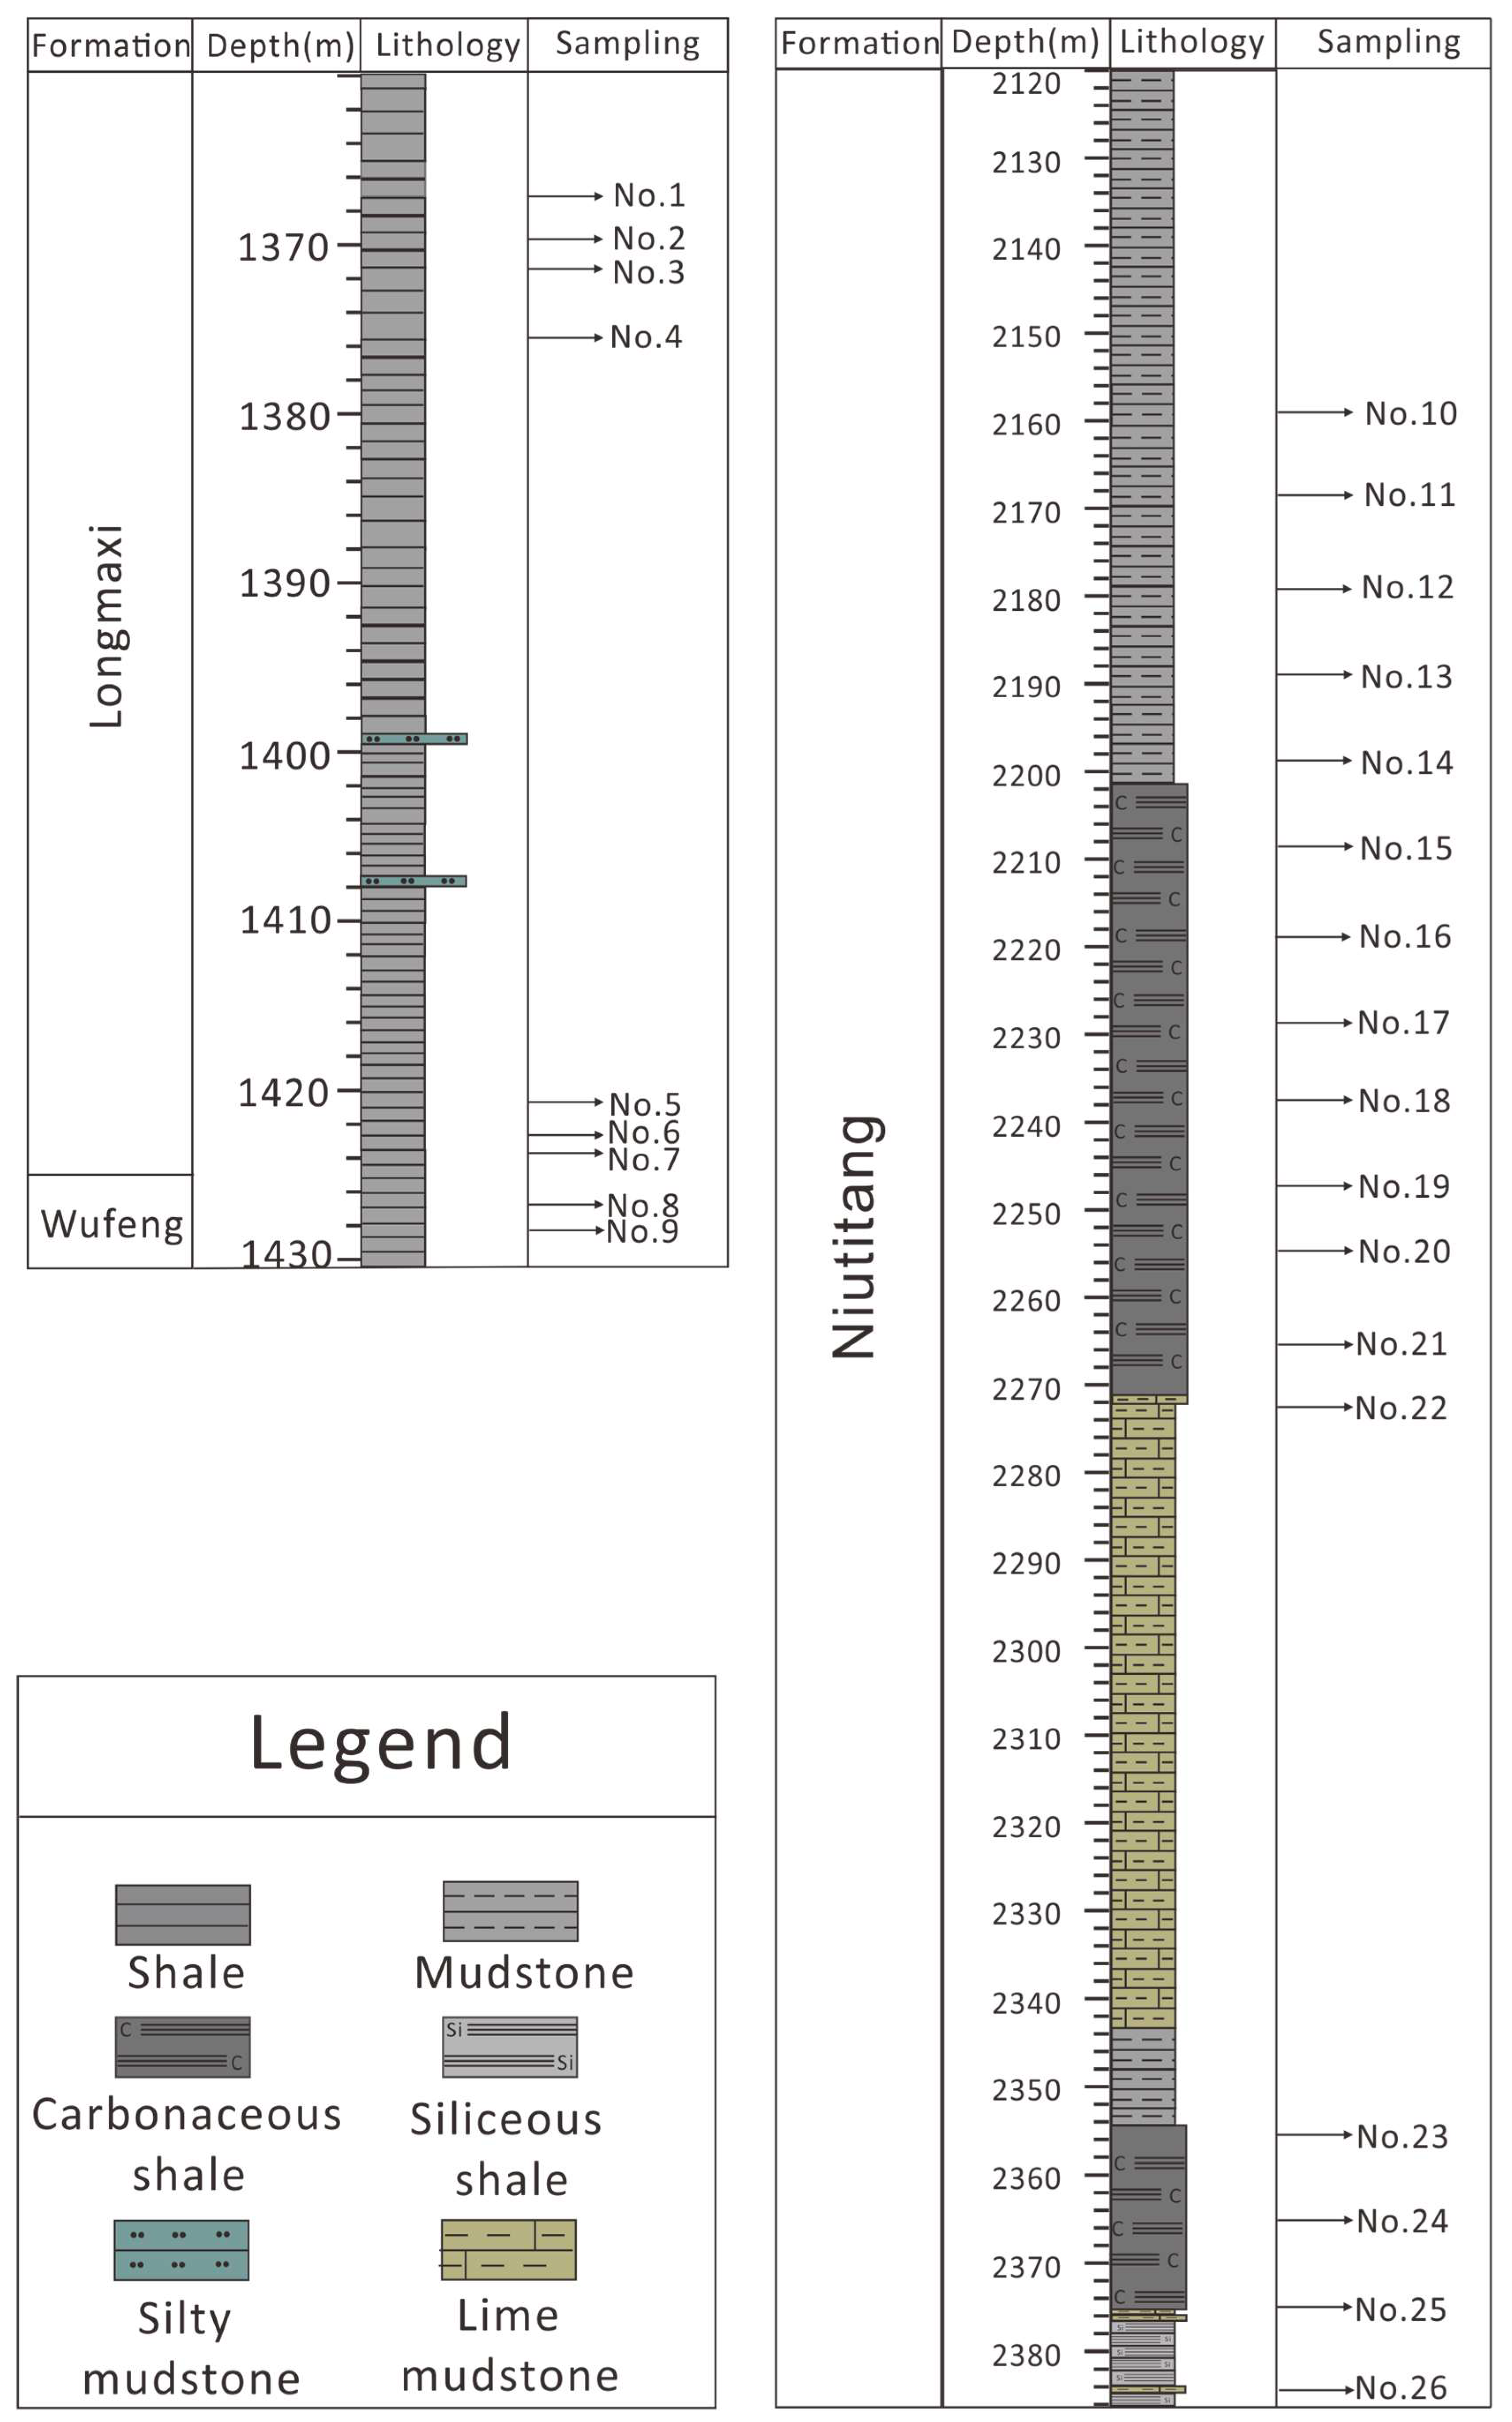
3.1. Samples
3.2. Analyses
- (1)
- TOC analysis: The shale samples were crushed and ground to greater than 200 mesh. The powdered sample was subjected to hydrochloric acid treatment (Vanalytically pure HCl: Vwater = 1:7) and kept at temperatures between 60 and 80 °C for two hours to thoroughly dissolve the carbonate minerals. The remaining material was dried at 100 °C after being rinsed with distilled water to a neutral pH. Finally, samples were analyzed on the CS-230 Carbon-Sulfur analyzer (LECO). The TOC contents are reported as wt%, after taking into account the material lost by acid treatment. The analytical uncertainty is less than 0.5%.
- (2)
- Mineral compositions analysis: A Bruker D8 Advance X-ray diffractometer with a Cu tube was used to analyze the mineral compositions after the shale had been crushed to more than 200 mesh. The Tube voltage and electric current were ≤40 kV and ≤40 mV, respectively. The scan ranges from 0 to 140° with a rate of 2°/min and step size of 0.02°. The analytical uncertainty is less than 5%.
- (3)
- Major elements analysis: The powdered samples (greater than 200 mesh) were dried at 105 °C and compressed into a specimen (32 mm i.d.) under the pressure of 30 tons using boric acid to rim the substrate. Then, the compressed specimen was measured by an Axios Panalytical X-ray fluorescence(XRF) spectrometry to obtain the concentration of the major elements. The analytical uncertainty is less than 3%.
- (4)
- Trace and rare earth elements analysis: Trace and rare earth elements concentration analysis was carried out by inductively coupled plasma mass spectrometry (ICP-MS) (Nu Attom, UK). The powder samples with >200 mesh were dried at 55 °C for 12 h. After that, the powder sample was digested by acid solution (HNO3 + HF). Then, the solutions were transferred and diluted for ICP-MS analysis to access the trace and rare earth elements concentration. Generally, the analytical uncertainty for most elements is less than 2%.
4. Results
4.1. TOC Content and Mineral Composition
4.2. Major Elements
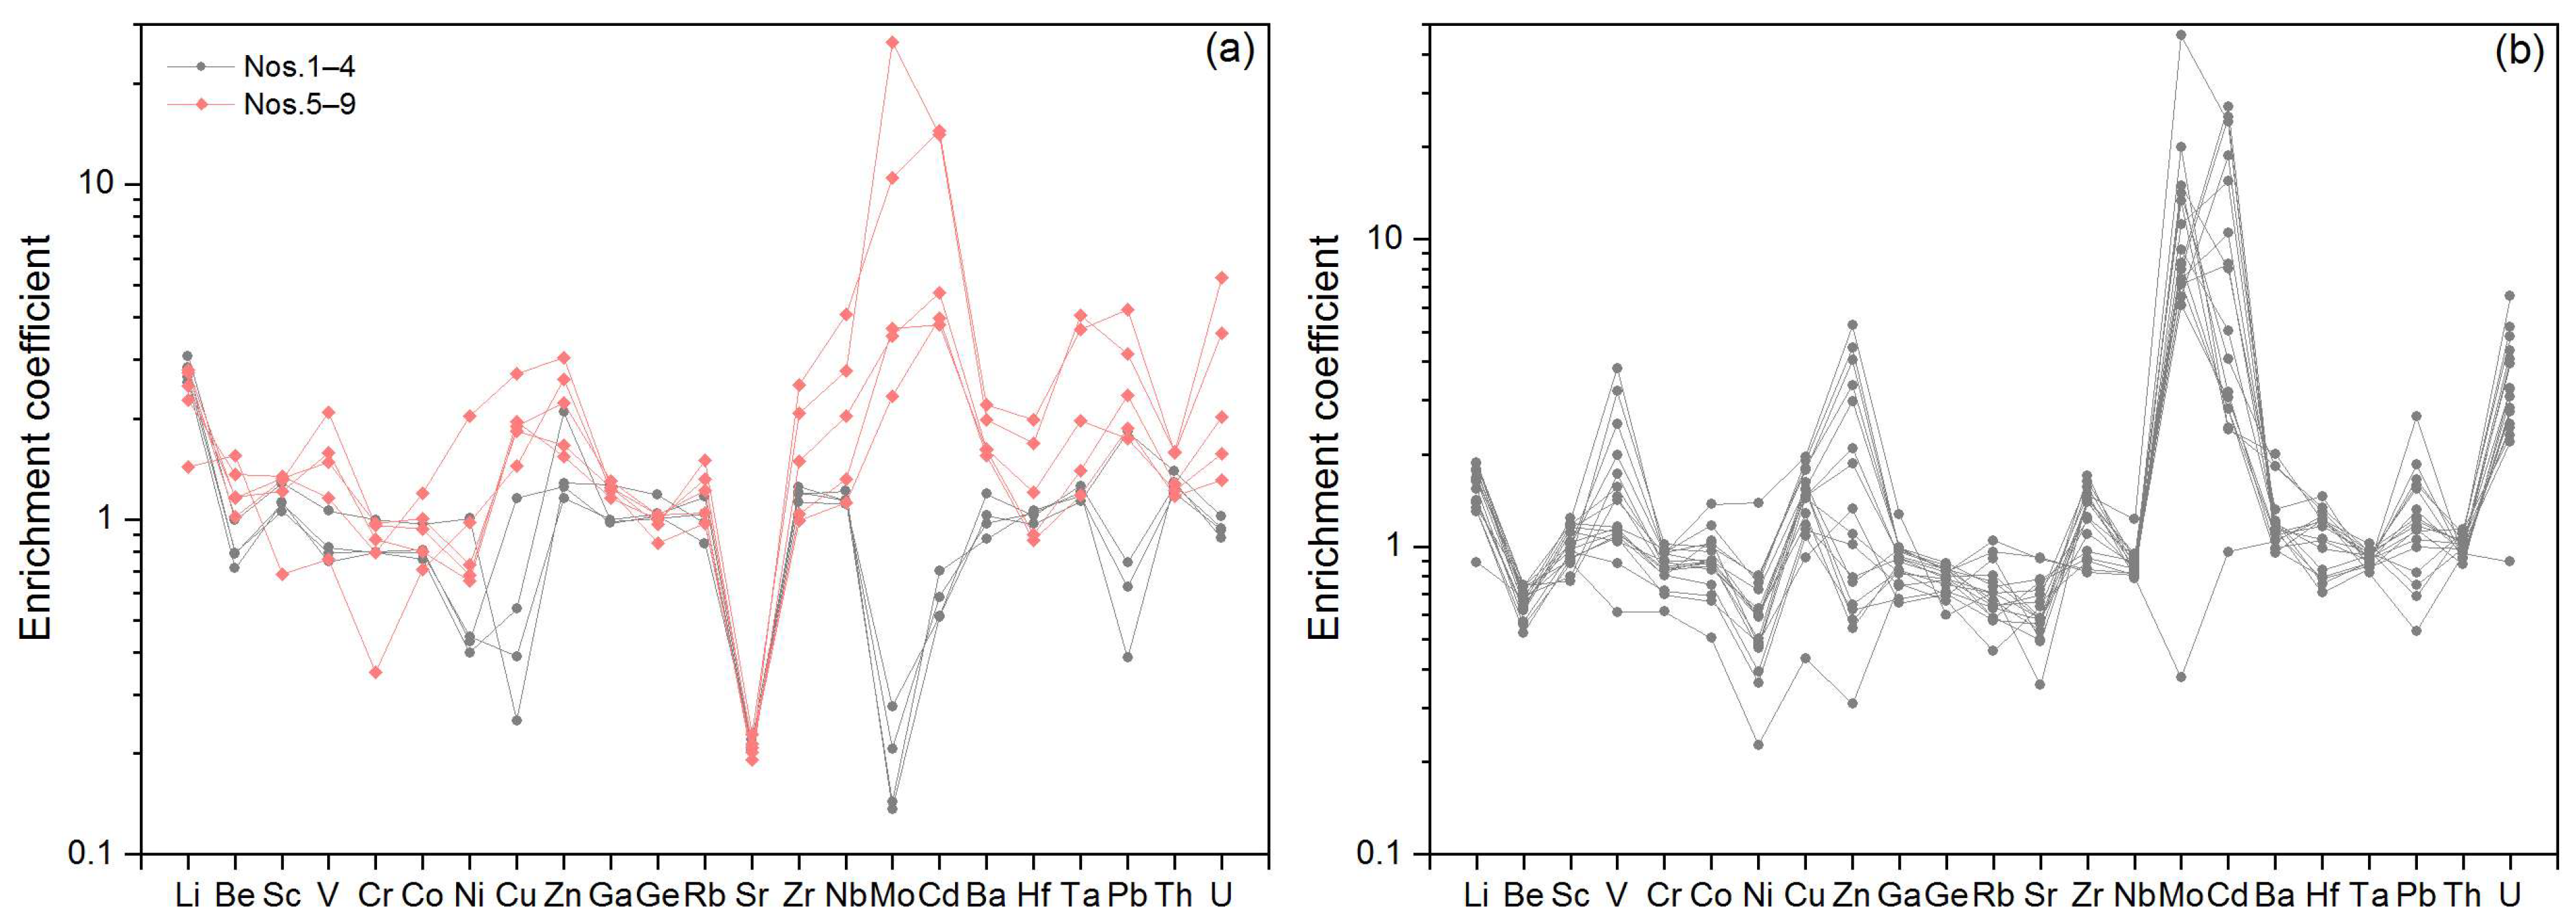
4.3. Trace Elements
4.4. Rare Earth Elements


| Formation | Sample Number | Depths | Li | Be | Sc | V | Cr | Co | Ni | Cu | Zn | Ga | Ge | Rb | Sr | Zr | Nb | Mo | Cd | Ba | Hf | Ta | Pb | Th | U |
|---|---|---|---|---|---|---|---|---|---|---|---|---|---|---|---|---|---|---|---|---|---|---|---|---|---|
| (m) | μg/g | ||||||||||||||||||||||||
| Wufeng- Longmaxi | 1 | 1366.90 | 61.40 | 2.98 | 17.45 | 113.39 | 84.64 | 16.43 | 44.29 | 6.28 | 91.14 | 21.51 | 1.89 | 109.01 | 72.91 | 226.31 | 14.56 | 0.20 | 0.05 | 655.30 | 5.95 | 1.26 | 12.61 | 13.44 | 2.63 |
| 2 | 1369.90 | 51.17 | 2.14 | 15.27 | 79.88 | 67.41 | 12.92 | 33.98 | 13.49 | 148.59 | 16.73 | 1.60 | 116.26 | 71.51 | 237.03 | 13.60 | 0.21 | 0.07 | 480.08 | 6.16 | 1.17 | 10.67 | 12.76 | 2.59 | |
| 3 | 1371.86 | 53.16 | 2.38 | 14.37 | 84.94 | 67.81 | 13.75 | 36.68 | 28.86 | 88.59 | 16.56 | 1.64 | 94.73 | 76.76 | 228.66 | 13.63 | 0.31 | 0.06 | 532.89 | 6.07 | 1.20 | 6.55 | 13.81 | 2.46 | |
| 4 | 1375.60 | 56.71 | 2.36 | 15.19 | 88.15 | 67.53 | 13.49 | 37.91 | 9.75 | 82.15 | 16.93 | 1.66 | 130.53 | 71.36 | 213.07 | 13.33 | 0.41 | 0.05 | 563.13 | 5.61 | 1.13 | 30.96 | 14.87 | 2.86 | |
| 5 | 1420.90 | 54.87 | 3.04 | 17.81 | 223.38 | 81.40 | 15.87 | 57.71 | 48.92 | 109.31 | 19.63 | 1.60 | 147.25 | 72.75 | 188.34 | 13.41 | 3.49 | 0.39 | 852.31 | 5.01 | 1.18 | 31.68 | 12.51 | 3.67 | |
| 6 | 1422.75 | 55.91 | 3.48 | 18.04 | 158.22 | 82.48 | 17.04 | 62.26 | 45.76 | 118.28 | 21.11 | 1.64 | 136.39 | 74.56 | 196.92 | 15.84 | 5.57 | 0.37 | 884.21 | 5.20 | 1.39 | 39.97 | 13.67 | 5.64 | |
| 7 | 1423.75 | 50.17 | 3.50 | 16.46 | 169.05 | 73.82 | 13.64 | 55.76 | 47.26 | 157.69 | 22.05 | 1.65 | 117.23 | 67.15 | 283.33 | 24.47 | 5.29 | 0.46 | 894.24 | 6.97 | 1.96 | 29.60 | 13.03 | 4.39 | |
| 8 | 1426.50 | 45.48 | 4.07 | 18.29 | 123.72 | 67.38 | 20.34 | 173.12 | 67.93 | 216.24 | 21.12 | 1.54 | 168.28 | 79.86 | 392.94 | 33.33 | 39.84 | 1.38 | 1089.65 | 9.79 | 4.06 | 52.88 | 16.99 | 14.74 | |
| 9 | 1428.21 | 28.70 | 4.66 | 9.32 | 81.46 | 29.63 | 12.03 | 83.17 | 36.09 | 186.41 | 20.76 | 1.35 | 108.56 | 70.68 | 478.97 | 49.12 | 15.65 | 1.41 | 1210.13 | 11.46 | 3.70 | 71.91 | 16.91 | 10.04 | |
| Niutitang | 10 | 2158.70 | 37.45 | 2.24 | 13.85 | 211.89 | 81.58 | 19.90 | 64.61 | 47.53 | 314.88 | 16.49 | 1.38 | 72.27 | 231.66 | 170.23 | 9.70 | 12.42 | 2.65 | 614.29 | 4.56 | 0.87 | 44.95 | 9.80 | 8.59 |
| 11 | 2168.93 | 37.56 | 2.11 | 13.89 | 269.18 | 81.63 | 17.47 | 67.41 | 44.35 | 287.45 | 16.42 | 1.35 | 65.58 | 271.11 | 173.93 | 10.16 | 11.93 | 2.44 | 539.22 | 4.63 | 0.88 | 31.38 | 9.85 | 7.93 | |
| 12 | 2179.25 | 37.27 | 2.22 | 12.29 | 342.91 | 86.53 | 17.03 | 68.38 | 45.01 | 238.01 | 16.90 | 1.41 | 82.91 | 274.90 | 183.65 | 10.77 | 9.78 | 1.83 | 668.00 | 4.86 | 0.94 | 26.27 | 9.77 | 7.69 | |
| 13 | 2188.60 | 33.02 | 2.24 | 10.52 | 155.66 | 71.24 | 14.74 | 50.17 | 36.64 | 148.43 | 15.58 | 1.32 | 117.19 | 318.98 | 160.62 | 9.84 | 11.13 | 1.03 | 667.63 | 4.39 | 0.89 | 22.39 | 10.19 | 7.72 | |
| 14 | 2198.00 | 35.15 | 2.08 | 10.90 | 184.15 | 73.09 | 15.24 | 61.53 | 38.61 | 211.33 | 16.92 | 1.33 | 107.88 | 322.79 | 156.54 | 9.68 | 16.81 | 1.51 | 631.54 | 4.11 | 0.85 | 19.43 | 9.35 | 9.14 | |
| 15 | 2208.00 | 32.65 | 1.95 | 14.08 | 122.95 | 68.34 | 17.82 | 40.56 | 38.32 | 46.10 | 14.24 | 1.21 | 79.39 | 253.23 | 233.45 | 10.07 | 22.47 | 0.31 | 545.17 | 6.10 | 0.90 | 28.14 | 11.10 | 11.04 | |
| 16 | 2218.50 | 33.55 | 2.11 | 13.40 | 119.10 | 71.29 | 15.29 | 39.72 | 35.98 | 78.17 | 13.92 | 1.26 | 79.24 | 204.75 | 209.37 | 10.39 | 13.91 | 0.50 | 653.60 | 5.72 | 0.94 | 20.73 | 11.02 | 9.17 | |
| 17 | 2228.84 | 30.83 | 1.71 | 13.09 | 94.50 | 61.08 | 11.78 | 30.66 | 27.01 | 44.36 | 11.49 | 1.14 | 70.68 | 203.72 | 266.21 | 10.27 | 9.18 | 0.30 | 610.31 | 7.00 | 0.91 | 17.91 | 10.90 | 6.16 | |
| 18 | 2237.38 | 35.18 | 2.03 | 12.49 | 116.63 | 68.64 | 12.76 | 33.34 | 28.38 | 72.05 | 12.67 | 1.25 | 65.85 | 174.23 | 264.79 | 10.60 | 12.56 | 0.27 | 526.23 | 7.09 | 1.02 | 12.75 | 10.58 | 7.01 | |
| 19 | 2246.86 | 37.23 | 1.99 | 16.11 | 166.77 | 76.01 | 14.33 | 53.32 | 36.64 | 132.33 | 15.81 | 1.35 | 86.13 | 203.01 | 236.76 | 11.16 | 10.71 | 0.81 | 626.99 | 6.13 | 0.97 | 11.72 | 12.15 | 6.44 | |
| 20 | 2254.60 | 35.81 | 1.91 | 15.67 | 151.43 | 80.99 | 15.06 | 42.65 | 40.45 | 54.40 | 16.76 | 1.35 | 74.83 | 186.09 | 272.48 | 11.34 | 10.84 | 0.27 | 603.84 | 6.75 | 0.96 | 19.94 | 11.20 | 6.82 | |
| 21 | 2265.80 | 26.05 | 1.58 | 12.60 | 114.38 | 59.39 | 11.31 | 41.41 | 23.05 | 94.09 | 11.15 | 1.12 | 64.35 | 196.47 | 324.33 | 9.73 | 22.46 | 0.79 | 727.90 | 8.46 | 0.86 | 16.94 | 10.51 | 11.46 | |
| 22 | 2273.20 | 26.06 | 1.67 | 12.03 | 65.48 | 52.30 | 8.57 | 19.29 | 10.83 | 21.88 | 12.89 | 1.07 | 51.24 | 224.14 | 281.72 | 9.49 | 0.56 | 0.09 | 574.39 | 7.32 | 0.82 | 9.03 | 10.15 | 2.50 | |
| 23 | 2355.80 | 27.76 | 1.86 | 15.18 | 111.23 | 76.39 | 15.35 | 50.48 | 32.03 | 38.50 | 15.17 | 1.29 | 90.41 | 205.50 | 296.12 | 10.51 | 29.87 | 0.24 | 1004.28 | 7.57 | 0.92 | 19.20 | 12.20 | 13.49 | |
| 24 | 2365.66 | 28.29 | 1.88 | 15.78 | 119.70 | 72.30 | 15.08 | 51.04 | 29.57 | 56.47 | 15.65 | 1.26 | 71.96 | 244.04 | 308.91 | 10.87 | 21.12 | 0.40 | 1006.17 | 7.76 | 0.96 | 14.02 | 11.97 | 14.56 | |
| 25 | 2375.95 | 26.69 | 2.25 | 16.20 | 124.07 | 83.55 | 16.43 | 50.78 | 38.34 | 40.94 | 14.24 | 1.11 | 102.50 | 172.50 | 270.43 | 11.17 | 20.08 | 0.24 | 1101.38 | 7.06 | 0.97 | 21.13 | 10.91 | 12.17 | |
| 26 | 2384.77 | 17.83 | 2.05 | 16.82 | 407.74 | 80.86 | 23.34 | 117.94 | 49.02 | 372.50 | 21.61 | 0.96 | 79.66 | 124.23 | 280.09 | 14.71 | 69.21 | 2.36 | 578.59 | 7.11 | 0.92 | 26.99 | 11.80 | 18.26 | |
| UCC * | 20.00 | 3 | 13.6 | 107 | 85 | 17 | 44 | 25 | 71 | 17 | 1.6 | 112 | 350 | 190 | 12 | 1.5 | 0.098 | 550 | 5.8 | 1 | 17 | 10.7 | 2.8 | ||
| Formations | Sample Number | Depth | La | Ce | Pr | Nd | Sm | Eu | Gd | Tb | Dy | Ho | Er | Tm | Yb | Lu | ΣREE |
|---|---|---|---|---|---|---|---|---|---|---|---|---|---|---|---|---|---|
| (m) | μg/g | ||||||||||||||||
| Wufeng- Longmaxi | 1 | 1366.90 | 40.41 | 86.92 | 9.41 | 34.30 | 6.82 | 1.27 | 5.86 | 0.97 | 5.69 | 1.15 | 3.37 | 0.51 | 3.30 | 0.50 | 200.48 |
| 2 | 1369.90 | 42.05 | 79.59 | 9.49 | 35.15 | 7.29 | 1.36 | 6.22 | 0.98 | 5.59 | 1.10 | 3.16 | 0.48 | 3.04 | 0.46 | 195.96 | |
| 3 | 1371.86 | 41.71 | 88.73 | 10.16 | 34.98 | 7.08 | 1.32 | 6.11 | 0.98 | 5.70 | 1.13 | 3.29 | 0.49 | 3.13 | 0.48 | 205.30 | |
| 4 | 1375.60 | 44.56 | 91.18 | 10.87 | 36.57 | 7.72 | 1.42 | 6.68 | 1.04 | 5.84 | 1.14 | 3.25 | 0.48 | 3.05 | 0.46 | 214.25 | |
| 5 | 1420.90 | 39.70 | 74.75 | 9.03 | 31.05 | 5.70 | 1.02 | 4.71 | 0.77 | 4.63 | 0.95 | 2.85 | 0.44 | 2.87 | 0.44 | 178.93 | |
| 6 | 1422.75 | 43.42 | 80.58 | 9.37 | 32.46 | 5.87 | 1.02 | 4.85 | 0.80 | 4.77 | 0.97 | 2.91 | 0.45 | 2.91 | 0.44 | 190.82 | |
| 7 | 1423.75 | 42.73 | 86.04 | 9.41 | 34.24 | 6.54 | 0.90 | 5.49 | 0.93 | 5.49 | 1.11 | 3.23 | 0.49 | 3.18 | 0.49 | 200.25 | |
| 8 | 1426.50 | 45.92 | 90.08 | 9.96 | 35.45 | 7.02 | 1.15 | 7.13 | 1.29 | 8.31 | 1.75 | 5.32 | 0.81 | 5.27 | 0.80 | 220.27 | |
| 9 | 1428.21 | 62.97 | 122.46 | 13.81 | 43.84 | 8.28 | 1.08 | 7.47 | 1.31 | 8.45 | 1.79 | 5.37 | 0.79 | 4.79 | 0.71 | 283.11 | |
| NIutitang | 10 | 2158.70 | 31.27 | 69.06 | 8.21 | 30.15 | 6.61 | 1.26 | 5.88 | 0.94 | 5.58 | 1.13 | 3.32 | 0.50 | 3.19 | 0.49 | 167.59 |
| 11 | 2168.93 | 30.01 | 71.13 | 7.87 | 31.30 | 7.20 | 1.45 | 6.60 | 1.05 | 6.16 | 1.24 | 3.57 | 0.53 | 3.34 | 0.51 | 171.97 | |
| 12 | 2179.25 | 32.48 | 71.16 | 8.00 | 30.23 | 6.37 | 1.29 | 5.93 | 0.96 | 5.69 | 1.16 | 3.38 | 0.50 | 3.21 | 0.49 | 170.82 | |
| 13 | 2188.60 | 33.84 | 73.22 | 8.51 | 30.15 | 6.37 | 1.24 | 5.80 | 0.94 | 5.57 | 1.13 | 3.32 | 0.49 | 3.10 | 0.48 | 174.14 | |
| 14 | 2198.00 | 30.70 | 69.19 | 7.30 | 28.34 | 5.83 | 1.18 | 5.31 | 0.86 | 5.14 | 1.05 | 3.06 | 0.46 | 2.92 | 0.45 | 161.80 | |
| 15 | 2208.00 | 35.40 | 71.33 | 9.12 | 31.43 | 5.93 | 1.11 | 5.24 | 0.85 | 5.11 | 1.04 | 3.08 | 0.46 | 2.97 | 0.46 | 173.54 | |
| 16 | 2218.50 | 32.64 | 68.22 | 8.73 | 28.96 | 5.97 | 1.14 | 5.28 | 0.86 | 5.22 | 1.07 | 3.16 | 0.47 | 3.02 | 0.46 | 165.22 | |
| 17 | 2228.84 | 30.01 | 57.51 | 7.36 | 26.21 | 6.34 | 1.24 | 5.95 | 0.95 | 5.51 | 1.09 | 3.14 | 0.46 | 2.93 | 0.45 | 149.15 | |
| 18 | 2237.38 | 28.78 | 61.94 | 8.19 | 27.18 | 5.74 | 1.10 | 5.14 | 0.84 | 5.09 | 1.04 | 3.09 | 0.46 | 2.97 | 0.46 | 152.02 | |
| 19 | 2246.86 | 34.72 | 72.77 | 8.29 | 31.22 | 6.43 | 1.25 | 5.81 | 0.95 | 5.59 | 1.13 | 3.29 | 0.49 | 3.13 | 0.48 | 175.56 | |
| 20 | 2254.60 | 32.90 | 70.59 | 8.05 | 30.39 | 6.21 | 1.15 | 5.30 | 0.88 | 5.31 | 1.09 | 3.24 | 0.49 | 3.17 | 0.49 | 169.27 | |
| 21 | 2265.80 | 31.18 | 58.75 | 8.11 | 28.80 | 6.74 | 1.30 | 6.34 | 1.02 | 5.94 | 1.18 | 3.42 | 0.50 | 3.22 | 0.50 | 157.00 | |
| 22 | 2273.20 | 29.89 | 60.36 | 7.58 | 28.05 | 5.83 | 1.13 | 5.26 | 0.84 | 4.95 | 1.00 | 2.91 | 0.44 | 2.83 | 0.44 | 151.51 | |
| 23 | 2355.80 | 40.19 | 77.66 | 9.26 | 33.38 | 6.13 | 1.13 | 5.26 | 0.84 | 4.99 | 1.01 | 2.99 | 0.45 | 2.91 | 0.45 | 186.63 | |
| 24 | 2365.66 | 35.17 | 68.46 | 8.60 | 33.68 | 7.27 | 1.40 | 6.59 | 1.04 | 5.95 | 1.18 | 3.41 | 0.50 | 3.21 | 0.49 | 176.94 | |
| 25 | 2375.95 | 36.04 | 66.93 | 8.86 | 29.98 | 5.80 | 1.08 | 5.10 | 0.84 | 5.08 | 1.05 | 3.10 | 0.46 | 3.00 | 0.47 | 167.79 | |
| 26 | 2384.77 | 34.87 | 63.39 | 8.09 | 31.57 | 6.37 | 1.20 | 5.70 | 0.93 | 5.55 | 1.13 | 3.33 | 0.50 | 3.17 | 0.49 | 166.29 | |
| NASC * | 32 | 73 | 7.9 | 33 | 5.7 | 1.24 | 5.2 | 0.85 | 5.8 | 1.04 | 3.4 | 0.5 | 3.1 | 0.48 | / | ||
5. Discussion
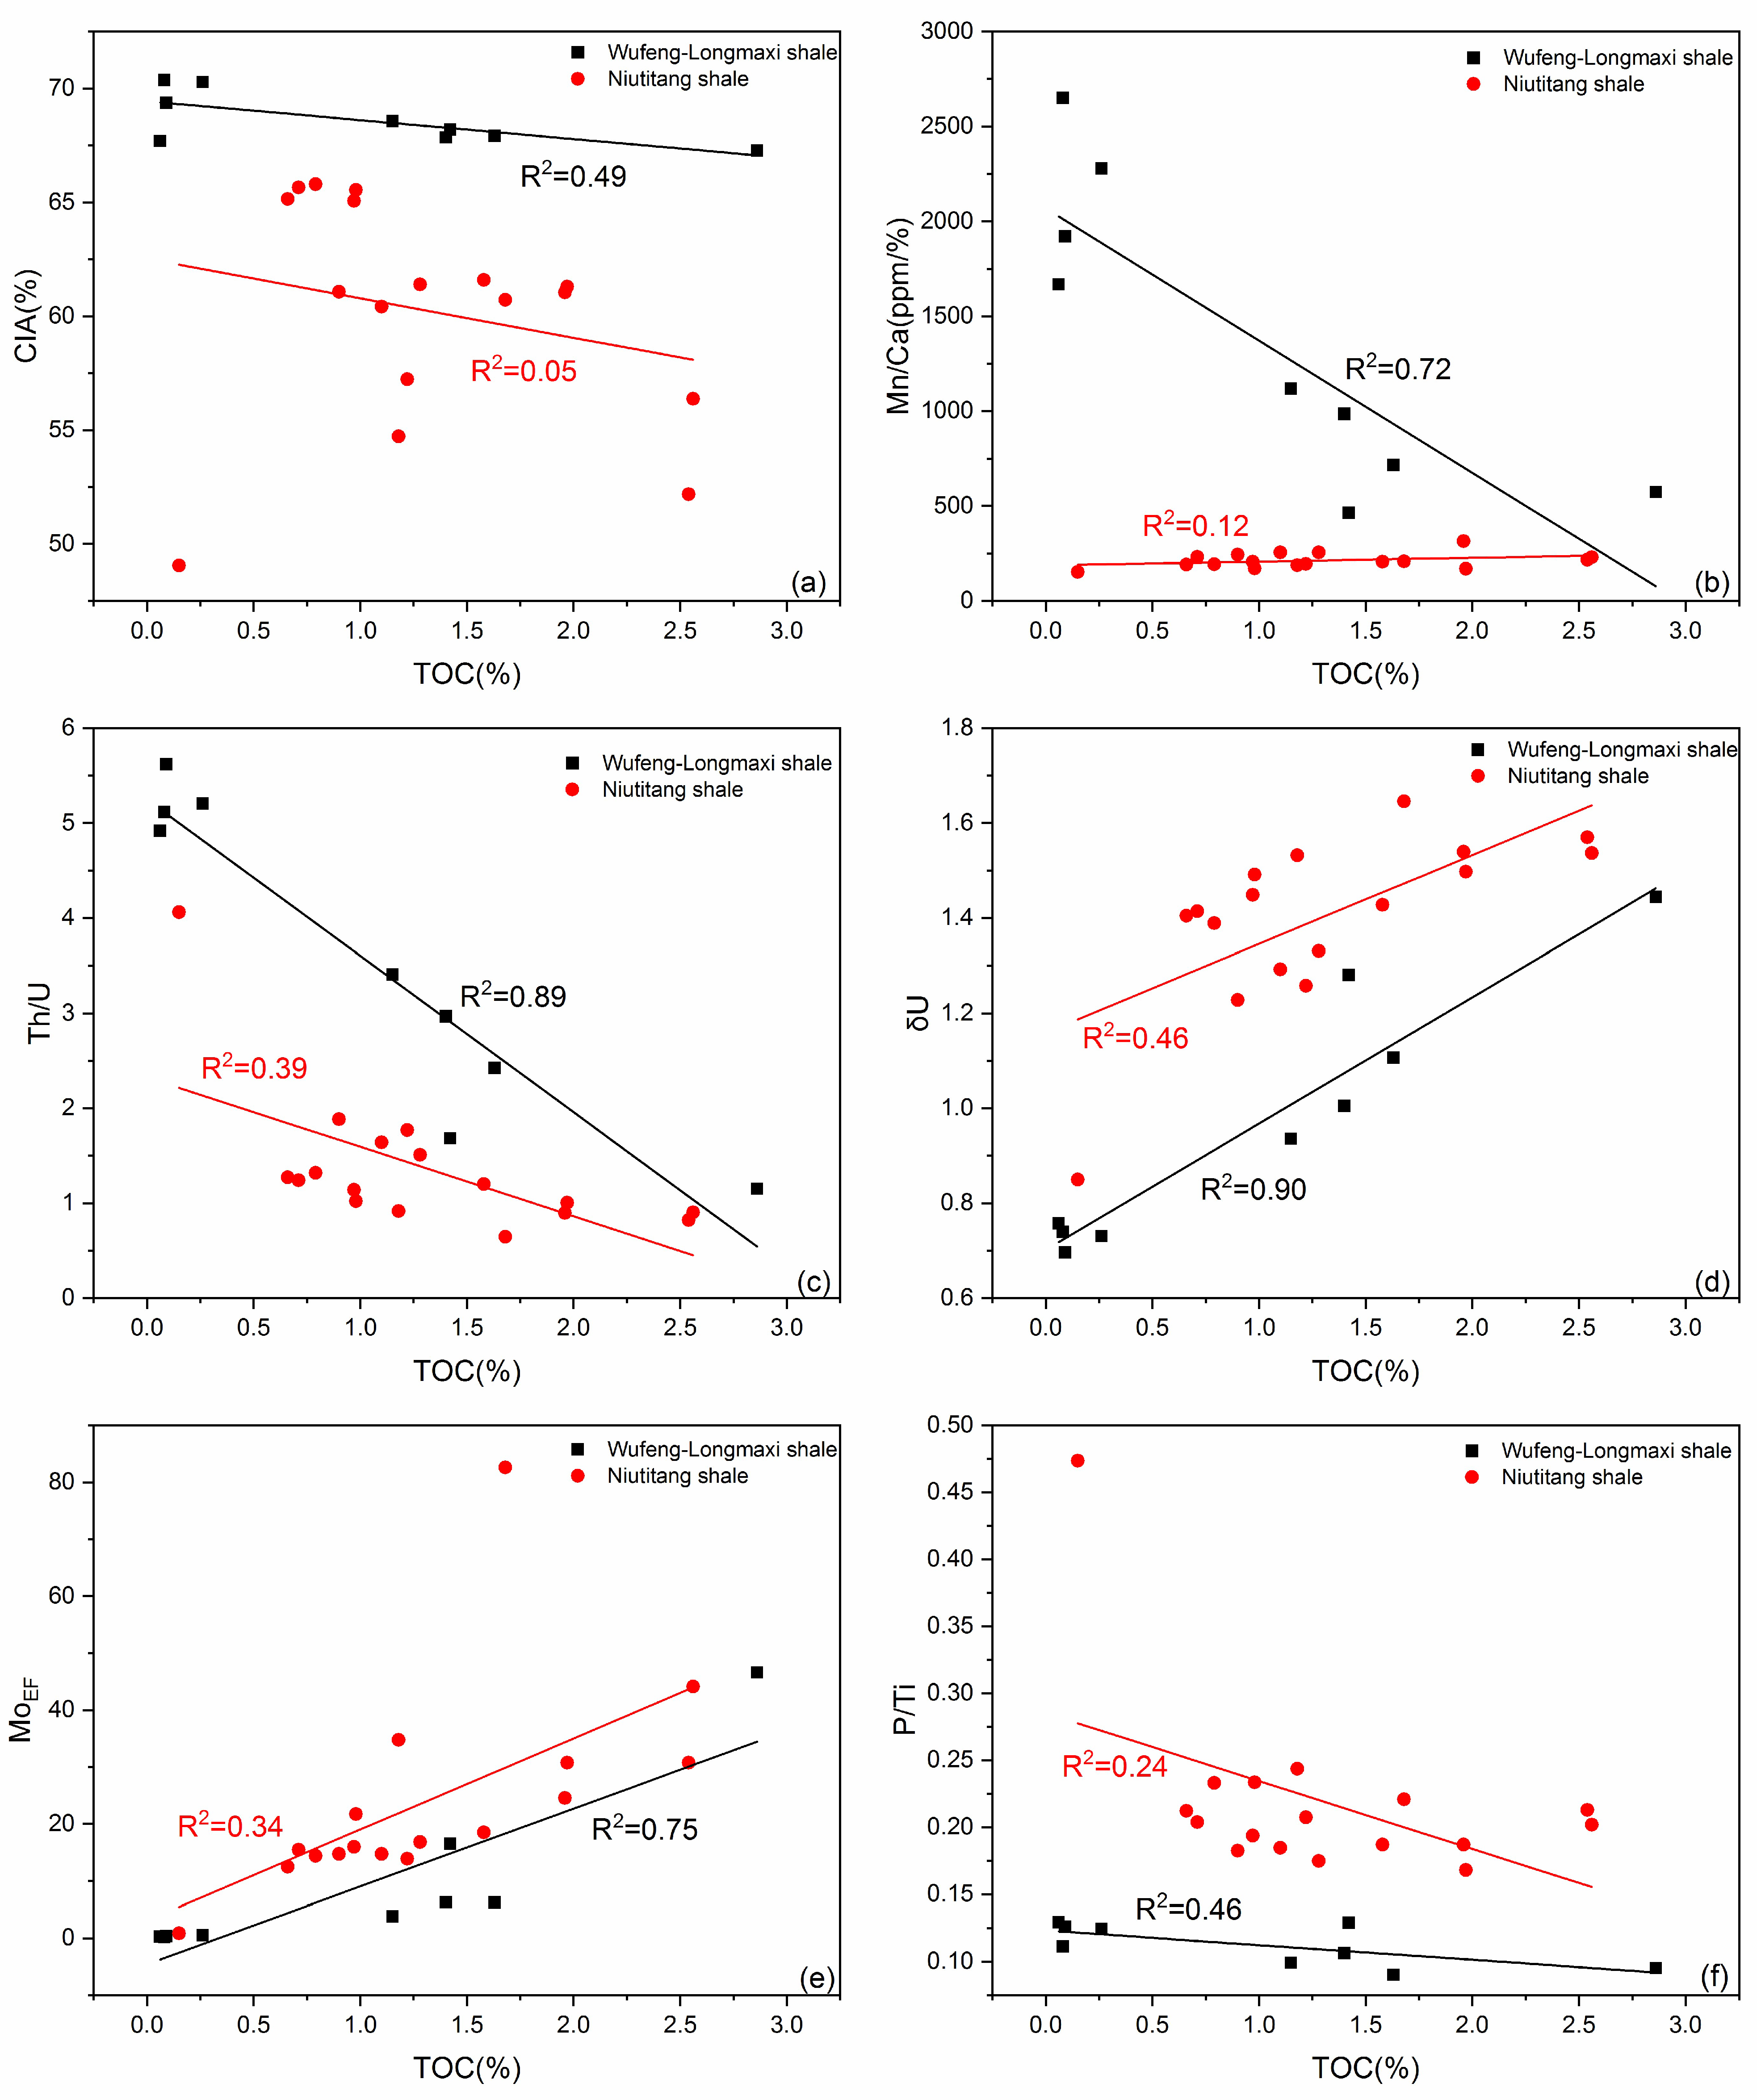
5.1. Chemical Weathering and Palaeoclimate
5.2. Terrestrial Influx Intensity, Provenance, and Tectonic Setting
5.3. Paleoredox Conditions and Water Mass Restriction
5.4. Paleoproductivity
5.5. Influence of Deposition Conditions on Organic Matter Enrichment
5.6. Depositional and Organic Enrichment Models
6. Conclusions
- (1)
- Warm and humid conditions existed for deposition of the Wufeng-Longmaxi samples. In contrast, palaeoclimatic condition indicators suggest cold andarid conditions in the Niutitang samples.
- (2)
- The terrestrial influx intensity in the Niutitang samples was relatively low. However, the terrestrial influx rate increased in the Wufeng and Longmaxi samples.
- (3)
- Parameters that measure palaeoredox conditions indicate an anoxic environment in the Niutitang, Wufeng and Lower Longmaxi samples. In contrast, the paleo-redox conditions were more oxic during the sedimentation of the Upper Longmaxi samples.
- (4)
- The P/Ti ratio reveals a low paleo-productivity for the Wufeng-Longmaxi and the Niutitang samples. Additionally, Wufeng-Longmaxi samples possess a lower paleo-productivity compared to the Niutitang samples in the well.
- (5)
- An obvious difference exists in the organic matter enrichment of the shale samples from different formations. The organic matter enrichment for samples in this study can be jointly influenced by paleo-redox conditions and paleo-productivity. Organic matter enrichment of the Niutitang shale is mainly driven by preservation rather than productivity. The dominant driving factor is the opposite for the Wufeng-Longmaxi shale.
Author Contributions
Funding
Institutional Review Board Statement
Informed Consent Statement
Data Availability Statement
Acknowledgments
Conflicts of Interest
References
- Dong, D.; Shi, Z.; Guan, Q.; Jiang, S.; Zhang, M.; Zhang, C.; Wang, S.; Sun, S.; Yu, R.; Liu, D.; et al. Progress, challenges and prospects of shale gas exploration in the Wufeng–Longmaxi reservoirs in the Sichuan Basin. Nat. Gas Ind. B 2018, 5, 415–424. [Google Scholar] [CrossRef]
- Zou, C.; Dong, D.; Wang, S.; Li, J.; Li, X.; Wang, Y.; Li, D.; Cheng, K. Geological characteristics and resource potential of shale gas in China. Pet. Explor. Dev. 2010, 37, 641–653. [Google Scholar] [CrossRef]
- Guo, T. The Fuling Shale Gas Field—A highly productive Silurian gas shale with high thermal maturity and complex evolution history, southeastern Sichuan Basin, China. Interpretation 2015, 3, SJ25–SJ34. [Google Scholar] [CrossRef]
- Chen, X.; Bao, S.; Zhai, G.; Zhou, Z.; Tong, C.; Wang, C. The discovery of shale gas within Lower Cambrian marine facies at Shan Nandi-1 well on the margin of Hannan palaeouplift. China Geol. 2018, 45, 412–413. [Google Scholar]
- Jarvie, D.M.; Hill, R.J.; Ruble, T.E.; Pollastro, R.M. Unconventional shale-gas systems: The Mississippian Barnett Shale of north-central Texas as one model for thermogenic shale-gas assessment. AAPG Bull. 2007, 91, 475–499. [Google Scholar] [CrossRef]
- Tissot, B.; Durand, B.; Espitalie, J.; Combaz, A. Influence of nature and diagenesis of organic matter in formation of petroleum. AAPG Bull. 1974, 58, 499–506. [Google Scholar]
- Wang, Y.; Zhu, Y.; Liu, S.; Zhang, R. Methane adsorption measurements and modeling for organic-rich marine shale samples. Fuel 2016, 172, 301–309. [Google Scholar] [CrossRef]
- Wu, Y.; Fan, T.; Jiang, S.; Yang, X.; Ding, H.; Meng, M.; Wei, D. Methane Adsorption Capacities of the Lower Paleozoic Marine Shales in the Yangtze Platform, South China. Energy Fuels 2015, 29, 4160–4167. [Google Scholar] [CrossRef]
- Zou, J.; Rezaee, R.; Xie, Q.; You, L.; Liu, K.; Saeedi, A. Investigation of moisture effect on methane adsorption capacity of shale samples. Fuel 2018, 232, 323–332. [Google Scholar] [CrossRef]
- Cox, G.M.; Jarrett, A.; Edwards, D.; Crockford, P.W.; Halverson, G.P.; Collins, A.S.; Poirier, A.; Li, Z.-X. Basin redox and primary productivity within the Mesoproterozoic Roper Seaway. Chem. Geol. 2016, 440, 101–114. [Google Scholar] [CrossRef]
- Li, Y.; Liu, W.; Liu, P.; Luo, H.; Wang, X.; Zhang, D.; Yuan, Y. Paleoenvironment and Organic Matter Enrichment of the Middle Ordovician Marine Carbonates in the Ordos Basin of China: Evidence from Element Geochemistry. ACS Earth Space Chem. 2022, 6, 44–55. [Google Scholar] [CrossRef]
- Mohialdeen, I.M.J.; Hakimi, M.H. Geochemical characterisation of Tithonian–Berriasian Chia Gara organic-rich rocks in northern Iraq with an emphasis on organic matter enrichment and the relationship to the bioproductivity and anoxia conditions. J. Asian Earth Sci. 2016, 116, 181–197. [Google Scholar] [CrossRef]
- Schmid, S.; Kunzmann, M.; Pagès, A. Inorganic geochemical evaluation of hydrocarbon source rock potential of Neoproterozoic strata in the Amadeus Basin, Australia. Mar. Pet. Geol. 2017, 86, 1092–1105. [Google Scholar] [CrossRef]
- Tribovillard, N.; Algeo, T.J.; Lyons, T.; Riboulleau, A. Trace metals as paleoredox and paleoproductivity proxies: An update. Chem. Geol. 2006, 232, 12–32. [Google Scholar] [CrossRef]
- Choi, J.H.; Hariya, Y. Geochemistry and depositional environment of Mn oxide deposits in the Tokoro Belt, northeastern Hokkaido, Japan. Econ. Geol. 1992, 87, 1265–1274. [Google Scholar] [CrossRef]
- Li, Y.; Zhang, T.; Ellis, G.S.; Shao, D. Depositional environment and organic matter accumulation of Upper Ordovician–Lower Silurian marine shale in the Upper Yangtze Platform, South China. Palaeogeogr. Palaeoclimatol. Palaeoecol. 2017, 466, 252–264. [Google Scholar] [CrossRef]
- Rimmer, S.M. Geochemical paleoredox indicators in Devonian–Mississippian black shales, Central Appalachian Basin (USA). Chem. Geol. 2004, 206, 373–391. [Google Scholar] [CrossRef]
- Pan, S.; Liao, Y.; Jiang, B.; Wan, Z.; Wang, F. Impact of natural weathering on source rocks: Organic and inorganic geochemical evidence from the Triassic Chang 7 outcrop profile in Tongchuan of the Southern Ordos Basin (China). Int. J. Coal Geol. 2022, 263, 104119. [Google Scholar] [CrossRef]
- Liu, Z.; Yan, D.; Du, X.; Li, S. Organic matter accumulation of the early Cambrian black shales on the flank of Micangshan-Hannan Uplift, northern upper Yangtze Block, South China. J. Pet. Sci. Eng. 2021, 200, 108378. [Google Scholar] [CrossRef]
- Chang, Y.; Xu, C.H.; Reiners, P.W. The exhumation evolution of the Micang Shan-Hannan uplift since Cretaceous: Evidence from apatite (U-Th)/He dating. Acta Geophys. Sin. 2010, 53, 912–919. [Google Scholar]
- Chen, X.; Guo, T.; Shi, D.; Hou, Q.; Wang, C. Pore structure characteristics and adsorption capacity of Niutitang Formation shale in southern Shaanxi. Lithol. Reserv 2019, 31, 52–60. [Google Scholar]
- Tian, T.; Yang, P.; Ren, Z.; Fu, D.; Zhou, S.; Yang, F.; Li, J. Hydrocarbon migration and accumulation in the Lower Cambrian to Neoproterozoic reservoirs in the Micangshan tectonic zone, China: New evidence of fluid inclusions. Energy Rep. 2020, 6, 721–733. [Google Scholar] [CrossRef]
- Zhang, Y.; Jia, X.; Wang, Z. Palaeogeography and provenance analysis of Early Cambrian Xiannüdong Formation in the Micangshan area. Acta Geol. Sin. 2019, 93, 2904–2920. [Google Scholar]
- Liu, W.; Yang, X.; Shu, S.; Liu, L.; Yuan, S. Precambrian Basement and Late Paleoproterozoic to Mesoproterozoic Tectonic Evolution of the SW Yangtze Block, South China: Constraints from Zircon U–Pb Dating and Hf Isotopes. Minerals 2018, 8, 333. [Google Scholar] [CrossRef]
- Ma, R.; Xiao, Y.; Wei, X.; He, Z.; Li, Y. The magmatic activity and tectonic evolution in the micangshan area, china. J. Mineral. Petrol. 1997, 17, 76–82. [Google Scholar]
- Li, Y.; Xiong, X.; Feng, Y. Mesozoic uplift of the Dabashan and Micangshan-Hannan Dome in the South Qinling orogenic belt. Sci. China Earth Sci. 2022, 65, 426–436. [Google Scholar] [CrossRef]
- Tian, T.; Zhou, S.; Fu, D.; Yang, F.; Li, J. Calculation of the original abundance of organic matter at high-over maturity: A case study of the Lower Cambrian Niutitang shale in the Micangshan-Hannan Uplift, SW China. J. Pet. Sci. Eng. 2019, 179, 645–654. [Google Scholar] [CrossRef]
- Tuo, J.; Wu, C.; Zhang, M. Organic matter properties and shale gas potential of Paleozoic shales in Sichuan Basin, China. J. Nat. Gas Sci. Eng. 2016, 28, 434–446. [Google Scholar] [CrossRef]
- Wu, J.; Liang, C.; Jiang, Z.; Zhang, C. Shale reservoir characterization and control factors on gas accumulation of the Lower Cambrian Niutitang shale, Sichuan Basin, South China. Geol. J. 2019, 54, 1604–1616. [Google Scholar] [CrossRef]
- Fan, J.; Melchin, M.J.; Chen, X.; Wang, Y.; Zhang, Y.; Chen, Q.; Chi, Z.; Chen, F. Biostratigraphy and geography of the Ordovician-Silurian Lungmachi black shales in South China. Sci. China Earth Sci. 2011, 54, 1854. [Google Scholar] [CrossRef]
- Xiao, B.; Xiong, L.; Zhao, Z.; Fu, X. Sedimentary tectonic pattern of Wufeng and Longmaxi Formations in the northern margin of Sichuan Basin, South China. Int. Geol. Rev. 2022, 64, 2166–2185. [Google Scholar] [CrossRef]
- McLennan, S.M. Rare earth elements in sedimentary rocks; influence of provenance and sedimentary processes. Rev. Mineral. Geochem. 1989, 21, 169–200. [Google Scholar]
- Taylor, S.R.; McLennan, S.M. The Continental Crust: Its Composition and Evolution; Blackwell Scientific Pub.: Palo Alto, CA, USA, 1985. [Google Scholar]
- McLennan, S.M.; Hemming, S.R.; Taylor, S.R.; Eriksson, K.A. Early Proterozoic crustal evolution: Geochemical and NdPb isotopic evidence from metasedimentary rocks, southwestern North America. Geochim. Cosmochim. Acta 1995, 59, 1153–1177. [Google Scholar] [CrossRef]
- Nesbitt, H.W.; Young, G.M. Early Proterozoic climates and plate motions inferred from major element chemistry of lutites. Nature 1982, 299, 715–717. [Google Scholar] [CrossRef]
- McLennan, S.M. Weathering and Global Denudation. J. Geol. 1993, 101, 295–303. [Google Scholar] [CrossRef]
- Fedo, C.M.; Wayne Nesbitt, H.; Young, G.M. Unraveling the effects of potassium metasomatism in sedimentary rocks and paleosols, with implications for paleoweathering conditions and provenance. Geology 1995, 23, 921–924. [Google Scholar] [CrossRef]
- Tao, S.; Xu, Y.; Tang, D.; Xu, H.; Li, S.; Chen, S.; Liu, W.; Cui, Y.; Gou, M. Geochemistry of the Shitoumei oil shale in the Santanghu Basin, Northwest China: Implications for paleoclimate conditions, weathering, provenance and tectonic setting. Int. J. Coal Geol. 2017, 184, 42–56. [Google Scholar] [CrossRef]
- Goodarzi, F. Comparison of the geochemistry of lacustrine oil shales of Mississippian age from Nova Scotia and New Brunswick, Canada. Int. J. Coal Geol. 2020, 220, 103398. [Google Scholar] [CrossRef]
- Goodarzi, F.; Goodarzi, N.N.; Malachowska, A. Elemental composition, environment of deposition of the lower Carboniferous Emma Fiord formation oil shale in Arctic Canada. Int. J. Coal Geol. 2021, 244, 103715. [Google Scholar] [CrossRef]
- Hayashi, K.-I.; Fujisawa, H.; Holland, H.D.; Ohmoto, H. Geochemistry of ∼1.9 Ga sedimentary rocks from northeastern Labrador, Canada. Geochim. Cosmochim. Acta 1997, 61, 4115–4137. [Google Scholar] [CrossRef]
- Li, Y.; Sun, P.; Liu, Z.; Yao, S.; Xu, Y.; Liu, R.; Li, Y. Geochemistry of the Permian Oil Shale in the Northern Bogda Mountain, Junggar Basin, Northwest China: Implications for Weathering, Provenance, and Tectonic Setting. ACS Earth Space Chem. 2020, 4, 1332–1348. [Google Scholar] [CrossRef]
- Yang, B.; Hu, B.; Bao, Z.; Zhang, Z. REE geochemical characteristics and depositional environment of the black shale-hosted Baiguoyuan Ag-V deposit in Xingshan, Hubei Province, China. J. Rare Earths 2011, 29, 499–506. [Google Scholar] [CrossRef]
- Zhao, Z.H. Trace Elements Geochemistry, 2nd ed.; Science Press: Beijing, China, 2016. [Google Scholar]
- Roser, B.P.; Korsch, R.J. Determination of Tectonic Setting of Sandstone-Mudstone Suites Using SiO2 Content and K2O/Na2O Ratio. J. Geol. 1986, 94, 635–650. [Google Scholar] [CrossRef]
- Hatch, J.R.; Leventhal, J.S. Relationship between inferred redox potential of the depositional environment and geochemistry of the Upper Pennsylvanian (Missourian) Stark Shale Member of the Dennis Limestone, Wabaunsee County, Kansas, U.S.A. Chem. Geol. 1992, 99, 65–82. [Google Scholar] [CrossRef]
- Jones, B.; Manning, D.A.C. Comparison of geochemical indices used for the interpretation of palaeoredox conditions in ancient mudstones. Chem. Geol. 1994, 111, 111–129. [Google Scholar] [CrossRef]
- Wei, Y.; Li, X.; Zhang, R.; Li, X.; Lu, S.; Qiu, Y.; Jiang, T.; Gao, Y.; Zhao, T.; Song, Z.; et al. Influence of a Paleosedimentary Environment on Shale Oil Enrichment: A Case Study on the Shahejie Formation of Raoyang Sag, Bohai Bay Basin, China. Front. Earth Sci. 2021, 9, 736054. [Google Scholar] [CrossRef]
- Zhao, B.; Li, R.; Qin, X.; Wang, N.; Zhou, W.; Khaled, A.; Zhao, D.; Zhang, Y.; Wu, X.; Liu, Q. Geochemical characteristics and mechanism of organic matter accumulation of marine-continental transitional shale of the lower permian Shanxi Formation, southeastern Ordos Basin, north China. J. Pet. Sci. Eng. 2021, 205, 108815. [Google Scholar] [CrossRef]
- Kimura, H.; Watanabe, Y. Oceanic anoxia at the Precambrian-Cambrian boundary. Geology 2001, 29, 995–998. [Google Scholar] [CrossRef]
- Wignall, P.B.; Twitchett, R.J. Oceanic Anoxia and the End Permian Mass Extinction. Science 1996, 272, 1155–1158. [Google Scholar] [CrossRef]
- Algeo, T.J.; Tribovillard, N. Environmental analysis of paleoceanographic systems based on molybdenum–uranium covariation. Chem. Geol. 2009, 268, 211–225. [Google Scholar] [CrossRef]
- Zheng, Y.; Anderson, R.F.; van Geen, A.; Kuwabara, J. Authigenic molybdenum formation in marine sediments: A link to pore water sulfide in the Santa Barbara Basin. Geochim. Cosmochim. Acta 2000, 64, 4165–4178. [Google Scholar] [CrossRef]
- Wang, C.; Wang, Q.; Chen, G.; He, L.; Xu, Y.; Chen, L.; Chen, D. Petrographic and geochemical characteristics of the lacustrine black shales from the Upper Triassic Yanchang Formation of the Ordos Basin, China: Implications for the organic matter accumulation. Mar. Pet. Geol. 2017, 86, 52–65. [Google Scholar] [CrossRef]
- Tribovillard, N.; Algeo, T.J.; Baudin, F.; Riboulleau, A. Analysis of marine environmental conditions based onmolybdenum–uranium covariation—Applications to Mesozoic paleoceanography. Chem. Geol. 2012, 324–325, 46–58. [Google Scholar] [CrossRef]
- Wu, Y.; Liu, C.; Liu, Y.; Gong, H.; Awan, R.S.; Li, G.; Zang, Q. Geochemical characteristics and the organic matter enrichment of the Upper Ordovician Tanjianshan Group, Qaidam Basin, China. J. Pet. Sci. Eng. 2022, 208, 109383. [Google Scholar] [CrossRef]
- Algeo, T.J.; Lyons, T.W. Mo–total organic carbon covariation in modern anoxic marine environments: Implications for analysis of paleoredox and paleohydrographic conditions. Paleoceanography 2006, 21, PA1016. [Google Scholar] [CrossRef]
- Gupta, L.P.; Kawahata, H. Downcore diagenetic changes in organic matter and implications for paleoproductivity estimates. Glob. Planet. Chang. 2006, 53, 122–136. [Google Scholar] [CrossRef]
- Chen, G.; Gang, W.; Chang, X.; Wang, N.; Zhang, P.; Cao, Q.; Xu, J. Paleoproductivity of the Chang 7 unit in the Ordos Basin (North China) and its controlling factors. Palaeogeogr. Palaeoclimatol. Palaeoecol. 2020, 551, 109741. [Google Scholar] [CrossRef]
- Xu, L.; Cheng, Y.; Zhang, J.; Liu, Y.; Yang, Y. Controls on the Organic Matter Accumulation of the Marine–Continental Transitional Shanxi Formation Shale in the Southeastern Ordos Basin. ACS Omega 2022, 7, 4317–4332. [Google Scholar] [CrossRef]
- Redfield, A.C. The Biological Control of Chemical Factors in the Environment. Am. Sci. 1958, 46, 230A-221. [Google Scholar]
- Paytan, A.; McLaughlin, K. The Oceanic Phosphorus Cycle. Chem. Rev. 2007, 107, 563–576. [Google Scholar] [CrossRef]
- Schoepfer, S.D.; Shen, J.; Wei, H.; Tyson, R.V.; Ingall, E.; Algeo, T.J. Total organic carbon, organic phosphorus, and biogenic barium fluxes as proxies for paleomarine productivity. Earth-Sci. Rev. 2015, 149, 23–52. [Google Scholar] [CrossRef]
- Yang, M.; Zuo, Y.; Fu, X.; Qiu, L.; Li, W.; Zhang, J.; Zheng, Z.; Zhang, J. Paleoenvironment of the Lower Ordovician Meitan Formation in the Sichuan Basin and Adjacent Areas, China. Minerals 2022, 12, 75. [Google Scholar] [CrossRef]
- Dembicki, J.H. Chapter 3-Source Rock Evaluation. In Practical Petroleum Geochemistry for Exploration and Production; Dembicki, J.H., Ed.; Elsevier: Amsterdam, The Netherlands, 2017; pp. 61–133. [Google Scholar]
- Sweere, T.; van den Boorn, S.; Dickson, A.J.; Reichart, G.-J. Definition of new trace-metal proxies for the controls on organic matter enrichment in marine sediments based on Mn, Co, Mo and Cd concentrations. Chem. Geol. 2016, 441, 235–245. [Google Scholar] [CrossRef]


| Formation | Sample Number | Depths (m) | TOC | Mineral Compositions | ||||||||
|---|---|---|---|---|---|---|---|---|---|---|---|---|
| Quartz | Feldspar | Berlinite | Muscovite | Pyrite | Clay | Calcite | Dolomite | Total | ||||
| % | % | % | % | % | % | % | % | % | % | |||
| Wufeng-Longmaxi | 1 | 1366.90 | 0.08 | 39.6 | 9.3 | / | 11.0 | / | 40.1 | / | / | 100.0 |
| 2 | 1369.90 | 0.06 | 39.6 | 21.4 | 6.4 | 15.6 | / | 17.0 | / | / | 100.0 | |
| 3 | 1371.86 | 0.09 | 44.5 | 13.7 | 8.4 | 8.3 | / | 25.1 | / | / | 100.0 | |
| 4 | 1375.60 | 0.26 | 29.6 | 26.7 | 8.7 | 15.7 | / | 19.3 | / | / | 100.0 | |
| 5 | 1420.90 | 1.15 | 39.8 | 6.5 | / | 23.9 | / | 29.8 | / | / | 100.0 | |
| 6 | 1422.75 | 1.63 | 33.4 | 8.6 | 12.4 | 18.0 | / | 27.6 | / | / | 100.0 | |
| 7 | 1423.75 | 1.40 | 35.3 | 4.8 | 8.8 | 20.5 | / | 30.6 | / | / | 100.0 | |
| 8 | 1426.50 | 2.86 | 40.4 | 6.7 | 6.5 | 12.5 | / | 32.5 | / | 1.4 | 100.0 | |
| 9 | 1428.21 | 1.42 | 42.5 | 12.4 | 7.5 | 8.2 | / | 29.4 | / | / | 100.0 | |
| Niutitang | 10 | 2158.70 | 0.97 | 27.7 | 24.9 | 9.1 | 5.5 | 1.6 | 28.3 | 2.1 | 0.8 | 100.0 |
| 11 | 2168.93 | 0.71 | 35.4 | 14.4 | 7.6 | 18.2 | / | 22.0 | 1.2 | 1.2 | 100.0 | |
| 12 | 2179.25 | 0.66 | 31.2 | 22.4 | 4.6 | 17.7 | / | 18.9 | 4.4 | 0.8 | 100.0 | |
| 13 | 2188.60 | 0.79 | 29.3 | 24.7 | 4.6 | 13.9 | / | 22.9 | 2.8 | 1.8 | 100.0 | |
| 14 | 2198.00 | 0.98 | 32.1 | 14.9 | / | 12.5 | 1.4 | 34.3 | 3.3 | 1.5 | 100.0 | |
| 15 | 2208.00 | 1.97 | 26.6 | 36.6 | 6.0 | 13.7 | / | 15.8 | 1.3 | / | 100.0 | |
| 16 | 2218.50 | 1.58 | 35.7 | 22.7 | 7.8 | 16.0 | / | 17.8 | / | / | 100.0 | |
| 17 | 2228.84 | 1.22 | 24.4 | 32.0 | 7.4 | 10.9 | 0.8 | 24.5 | / | / | 100.0 | |
| 18 | 2237.38 | 1.28 | 36.3 | 33.2 | 5.4 | 6.6 | / | 18.5 | / | / | 100.0 | |
| 19 | 2246.86 | 0.90 | 37.2 | 30.9 | 7.4 | 6.0 | / | 18.5 | / | / | 100.0 | |
| 20 | 2254.60 | 1.10 | 24.9 | 27.4 | 9.4 | 12.9 | 1.1 | 24.3 | / | / | 100.0 | |
| 21 | 2265.80 | 1.18 | 24.5 | 39.4 | 9.5 | 4.6 | 1.1 | 20.9 | / | / | 100.0 | |
| 22 | 2273.20 | 0.15 | 21.9 | 49.7 | / | 3.7 | 1.0 | 23.0 | / | 0.7 | 100.0 | |
| 23 | 2355.80 | 2.56 | 29.1 | 48.1 | 5.4 | 4.3 | / | 13.1 | / | / | 100.0 | |
| 24 | 2365.66 | 2.54 | 25.9 | 46.9 | 4.0 | 11.6 | / | 11.6 | / | / | 100.0 | |
| 25 | 2375.95 | 1.96 | 24.4 | 35.3 | 8.6 | 11.6 | 1.7 | 18.4 | / | / | 100.0 | |
| 26 | 2384.77 | 1.68 | 31.3 | 29.6 | 10.5 | 6.2 | 1.8 | 20.6 | / | / | 100.0 | |
| Formation | Sample Number | Depths | SiO2 | Al2O3 | TFe2O3 | CaO | MgO | K2O | Na2O | P2O5 | TiO2 | MnO | Other | Total |
|---|---|---|---|---|---|---|---|---|---|---|---|---|---|---|
| (m) | % | % | % | % | % | % | % | % | % | % | % | % | ||
| Wufeng -Longmaxi | 1 | 1366.90 | 63.24 | 16.68 | 6.79 | 0.32 | 2.30 | 4.09 | 1.22 | 0.11 | 0.74 | 0.08 | 4.12 | 99.71 |
| 2 | 1369.90 | 67.94 | 14.18 | 5.54 | 0.65 | 2.04 | 3.14 | 1.33 | 0.13 | 0.73 | 0.10 | 3.97 | 99.75 | |
| 3 | 1371.86 | 66.18 | 14.92 | 6.21 | 0.44 | 2.15 | 3.35 | 1.31 | 0.13 | 0.74 | 0.08 | 4.25 | 99.74 | |
| 4 | 1375.60 | 67.08 | 15.38 | 6.44 | 0.36 | 2.21 | 3.46 | 1.28 | 0.12 | 0.72 | 0.08 | 2.59 | 99.72 | |
| 5 | 1420.90 | 62.41 | 17.29 | 6.43 | 0.71 | 2.38 | 4.50 | 1.08 | 0.10 | 0.70 | 0.07 | 3.74 | 99.39 | |
| 6 | 1422.75 | 62.22 | 16.90 | 6.61 | 1.13 | 2.42 | 4.40 | 0.98 | 0.09 | 0.72 | 0.07 | 3.64 | 99.17 | |
| 7 | 1423.75 | 65.65 | 15.88 | 5.64 | 0.67 | 2.21 | 4.20 | 1.08 | 0.10 | 0.65 | 0.06 | 3.22 | 99.35 | |
| 8 | 1426.50 | 58.57 | 16.16 | 7.83 | 1.29 | 2.24 | 4.09 | 1.05 | 0.10 | 0.79 | 0.07 | 5.67 | 97.84 | |
| 9 | 1428.21 | 62.38 | 17.87 | 5.44 | 1.02 | 1.79 | 4.67 | 1.00 | 0.09 | 0.49 | 0.04 | 3.64 | 98.43 | |
| average | 63.96 | 16.14 | 6.32 | 0.73 | 2.19 | 3.99 | 1.15 | 0.11 | 0.46 | 0.26 | 0.26 | 99.23 | ||
| Niutitang | 10 | 2158.70 | 56.22 | 14.72 | 6.66 | 4.79 | 3.17 | 3.53 | 1.24 | 0.19 | 0.72 | 0.09 | 7.48 | 98.81 |
| 11 | 2168.93 | 55.08 | 14.56 | 6.48 | 5.82 | 3.27 | 3.40 | 1.20 | 0.21 | 0.76 | 0.12 | 8.01 | 98.89 | |
| 12 | 2179.25 | 56.57 | 14.82 | 6.07 | 5.26 | 3.21 | 3.49 | 1.26 | 0.23 | 0.78 | 0.09 | 7.27 | 99.05 | |
| 13 | 2188.60 | 53.69 | 14.65 | 6.14 | 6.82 | 3.53 | 3.52 | 1.16 | 0.24 | 0.75 | 0.12 | 8.50 | 99.10 | |
| 14 | 2198.00 | 54.42 | 14.61 | 5.93 | 6.76 | 3.41 | 3.51 | 1.18 | 0.24 | 0.75 | 0.11 | 8.21 | 99.13 | |
| 15 | 2208.00 | 58.60 | 13.80 | 5.58 | 4.68 | 2.70 | 3.13 | 1.62 | 0.17 | 0.75 | 0.07 | 7.68 | 98.79 | |
| 16 | 2218.50 | 61.13 | 14.21 | 5.36 | 3.02 | 2.62 | 3.30 | 1.61 | 0.19 | 0.73 | 0.06 | 6.75 | 98.96 | |
| 17 | 2228.84 | 63.43 | 12.52 | 4.66 | 3.19 | 2.24 | 2.76 | 1.94 | 0.21 | 0.74 | 0.06 | 7.37 | 99.11 | |
| 18 | 2237.38 | 62.71 | 14.15 | 5.07 | 2.65 | 2.76 | 3.21 | 1.65 | 0.18 | 0.75 | 0.06 | 6.00 | 99.19 | |
| 19 | 2246.86 | 61.92 | 13.77 | 5.32 | 2.73 | 2.70 | 3.20 | 1.62 | 0.19 | 0.75 | 0.06 | 6.90 | 99.15 | |
| 20 | 2254.60 | 62.84 | 13.92 | 5.41 | 2.26 | 2.61 | 3.18 | 1.72 | 0.19 | 0.75 | 0.05 | 6.12 | 99.06 | |
| 21 | 2265.80 | 65.74 | 12.22 | 4.77 | 3.00 | 2.01 | 2.64 | 2.20 | 0.24 | 0.71 | 0.05 | 5.26 | 98.85 | |
| 22 | 2273.20 | 62.88 | 12.22 | 4.00 | 3.74 | 2.21 | 2.52 | 3.03 | 0.47 | 0.73 | 0.05 | 7.48 | 99.32 | |
| 23 | 2355.80 | 62.65 | 12.79 | 4.88 | 1.93 | 2.10 | 3.12 | 1.84 | 0.22 | 0.80 | 0.04 | 8.44 | 98.80 | |
| 24 | 2365.66 | 63.53 | 12.98 | 4.74 | 2.85 | 2.09 | 3.00 | 2.10 | 0.24 | 0.81 | 0.06 | 6.45 | 98.85 | |
| 25 | 2375.95 | 63.03 | 15.45 | 5.31 | 1.53 | 2.37 | 3.61 | 1.93 | 0.21 | 0.83 | 0.04 | 4.04 | 98.35 | |
| 26 | 2384.77 | 62.49 | 15.83 | 4.94 | 2.06 | 1.92 | 3.60 | 1.59 | 0.25 | 0.82 | 0.04 | 4.58 | 98.10 | |
| average | 60.41 | 13.95 | 5.37 | 3.71 | 2.64 | 3.22 | 1.70 | 0.23 | 0.76 | 0.07 | 6.86 | 98.91 | ||
| Formations | Sample Number | Depths | Palaeclimate | Terrestrial Influx | Paleoredox Conditions | Paleo-Productivity | |||
|---|---|---|---|---|---|---|---|---|---|
| (m) | CIA | Mn/Ca (ppm/%) | Th/U | δU | MoEF | UEF | P/Ti | ||
| Wufeng-Longmaxi | 1 | 1366.90 | 70.37 | 2650.03 | 5.12 | 0.74 | 0.23 | 0.96 | 0.11 |
| 2 | 1369.90 | 67.70 | 1668.85 | 4.92 | 0.76 | 0.29 | 1.11 | 0.13 | |
| 3 | 1371.86 | 69.37 | 1920.55 | 5.62 | 0.70 | 0.39 | 1.00 | 0.13 | |
| 4 | 1375.60 | 70.28 | 2278.78 | 5.21 | 0.73 | 0.51 | 1.13 | 0.12 | |
| 5 | 1420.90 | 68.57 | 1118.61 | 3.41 | 0.94 | 3.82 | 1.29 | 0.10 | |
| 6 | 1422.75 | 67.93 | 716.73 | 2.42 | 1.11 | 6.23 | 2.04 | 0.09 | |
| 7 | 1423.75 | 67.85 | 985.68 | 2.97 | 1.01 | 6.30 | 1.68 | 0.11 | |
| 8 | 1426.50 | 67.27 | 573.60 | 1.15 | 1.44 | 46.58 | 5.56 | 0.10 | |
| 9 | 1428.21 | 68.20 | 465.01 | 1.68 | 1.28 | 16.55 | 3.43 | 0.13 | |
| Niutitang | 10 | 2158.70 | 65.07 | 207.62 | 1.14 | 1.45 | 15.94 | 3.56 | 0.19 |
| 11 | 2168.93 | 65.65 | 231.71 | 1.24 | 1.41 | 15.49 | 3.32 | 0.20 | |
| 12 | 2179.25 | 65.15 | 191.60 | 1.27 | 1.41 | 12.47 | 3.16 | 0.21 | |
| 13 | 2188.60 | 65.79 | 193.14 | 1.32 | 1.39 | 14.36 | 3.21 | 0.23 | |
| 14 | 2198.00 | 65.54 | 170.65 | 1.02 | 1.49 | 21.75 | 3.81 | 0.23 | |
| 15 | 2208.00 | 61.30 | 169.88 | 1.01 | 1.50 | 30.77 | 4.88 | 0.17 | |
| 16 | 2218.50 | 61.59 | 206.73 | 1.20 | 1.43 | 18.50 | 3.94 | 0.19 | |
| 17 | 2228.84 | 57.23 | 194.78 | 1.77 | 1.26 | 13.86 | 3.00 | 0.21 | |
| 18 | 2237.38 | 61.39 | 256.56 | 1.51 | 1.33 | 16.79 | 3.02 | 0.17 | |
| 19 | 2246.86 | 61.07 | 243.33 | 1.89 | 1.23 | 14.70 | 2.85 | 0.18 | |
| 20 | 2254.60 | 60.42 | 255.42 | 1.64 | 1.29 | 14.73 | 2.99 | 0.18 | |
| 21 | 2265.80 | 54.72 | 189.00 | 0.92 | 1.53 | 34.76 | 5.72 | 0.24 | |
| 22 | 2273.20 | 49.06 | 152.62 | 4.06 | 0.85 | 0.87 | 1.25 | 0.47 | |
| 23 | 2355.80 | 56.38 | 230.11 | 0.90 | 1.54 | 44.14 | 6.43 | 0.20 | |
| 24 | 2365.66 | 52.19 | 217.88 | 0.82 | 1.57 | 30.77 | 6.84 | 0.21 | |
| 25 | 2375.95 | 61.04 | 314.68 | 0.90 | 1.54 | 24.57 | 4.80 | 0.19 | |
| 26 | 2384.77 | 60.72 | 207.92 | 0.65 | 1.65 | 82.62 | 7.03 | 0.22 | |
Disclaimer/Publisher’s Note: The statements, opinions and data contained in all publications are solely those of the individual author(s) and contributor(s) and not of MDPI and/or the editor(s). MDPI and/or the editor(s) disclaim responsibility for any injury to people or property resulting from any ideas, methods, instructions or products referred to in the content. |
© 2023 by the authors. Licensee MDPI, Basel, Switzerland. This article is an open access article distributed under the terms and conditions of the Creative Commons Attribution (CC BY) license (https://creativecommons.org/licenses/by/4.0/).
Share and Cite
Liu, P.; Liu, C.; Guo, R. Depositional Environment and Organic Matter Enrichment in the Lower Paleozoic Shale from the Northeastern Margin of the Yangtze Platform, South China. J. Mar. Sci. Eng. 2023, 11, 501. https://doi.org/10.3390/jmse11030501
Liu P, Liu C, Guo R. Depositional Environment and Organic Matter Enrichment in the Lower Paleozoic Shale from the Northeastern Margin of the Yangtze Platform, South China. Journal of Marine Science and Engineering. 2023; 11(3):501. https://doi.org/10.3390/jmse11030501
Chicago/Turabian StyleLiu, Peng, Changjie Liu, and Ruiliang Guo. 2023. "Depositional Environment and Organic Matter Enrichment in the Lower Paleozoic Shale from the Northeastern Margin of the Yangtze Platform, South China" Journal of Marine Science and Engineering 11, no. 3: 501. https://doi.org/10.3390/jmse11030501
APA StyleLiu, P., Liu, C., & Guo, R. (2023). Depositional Environment and Organic Matter Enrichment in the Lower Paleozoic Shale from the Northeastern Margin of the Yangtze Platform, South China. Journal of Marine Science and Engineering, 11(3), 501. https://doi.org/10.3390/jmse11030501