1. Introduction
As a typical, complex and multi-discipline physical system, the marine steam power system includes a large amount of thermal equipment [
1], including boilers, main steam turbines, steam turbine generators, condensers, deaerators, feed pumps, etc., which involve electrical, mechanical, control and other fields, and it has typical nonlinear, multi-parameter, strong coupling characteristics. For such a complex multi-discipline physical system, it is difficult to accurately grasp the dynamic characteristics. Different from the thermal equipment of nuclear power plants, the marine steam power equipment needs to change its speed frequently due to the impact of the mission profile during operation; meanwhile, the operating environment is harsh due to the influence of high salt fog, strong wind and waves in marine conditions. Marine equipment frequently needs to operate under variable working conditions and in adverse conditions, which increases the load of the power system and also raises the requirements for the operation management of the marine power system. Therefore, it is imperative to carry out an accurate and effective dynamic characteristics analysis, online monitoring and a status evaluation of the marine steam power system under all working conditions.
At present, many scholars have carried out relevant research on marine power system. Nirbito et al. detailed the performance analysis of a propulsion system engine of an LNG tanker using a combined cycle whose components are a gas turbine, a steam turbine, and a heat recovery steam generator. The maximum power, fuel consumption rate and speed of the LNG carrier using a combined cycle under full load conditions are obtained through analysis of the model [
2]. Perabo et al. used the Open Simulation Platform (OSP) to carry out digital twin modeling and co-simulation of the power stage, generator set, local controller, etc. of a ship’s power propulsion system according to the complex and coupled characteristics of the ship’s power system, and analyzed the stability and dynamic characteristics of the system [
3]. Mrzljak et al. studied the steam turbine generator and feed water pump turbine of an LNG ship, analyzed their efficiency by measuring the actual operating parameters, and concluded that the energy conversion efficiency of the steam turbine generator could be improved by 1–3% by replacing the steam turbine with a motor to provide power for the feed water pump [
4]. Dulau et al. used Matlab/Simulink to simulate high, medium and low pressure steam turbines, analyzed the influence of the reheater, valve opening change and position height change on the system, and proposed that the key to control is to establish a steady-state response when the turbine is connected to the generator and other controllers in a closed loop [
5].
In summary, many scholars have carried out systematic research on marine power systems, including modeling methods, mathematical models, engineering applications, etc., but most scholars still carry out single-domain simulation and dynamic characteristic analysis for the subsystems and key equipment in the power system, while there is relatively little research on the coordination, multi-domain coupling, dynamic response and fault simulation of each piece of thermal equipment in the marine power system.
Due to the fact that traditional modeling methods focus on static analysis, it is difficult to analyze dynamic characteristics under variable conditions and fault conditions. Therefore, the establishment of a high-precision digital model of the system is the key to further promoting the digital and intelligent development of marine systems. As a new technology, digital twin is a key technology for realizing the mapping of physical system to a digital model [
6]. It makes full use of the physical model, equipment status, operating environment and other data, integrates multi-disciplinary and multi-timescale simulation processes, and completes virtual reality mapping in the information space, thus reflecting the full life cycle of the corresponding physical equipment [
7]. Therefore, the combination of multi-domain modeling, modular modeling and other methods to establish a high-precision digital model under the digital twin technology and carry out a dynamic characteristics simulation analysis can not only overcome the shortcomings of traditional modeling methods, but also lay a solid foundation for the successful application of digital twin technology in the marine steam power system.
The combination of multi-disciplinary modeling methods and digital twin technology can give full play to their advantages in modeling and simulation. At present, several scholars have carried out relevant research. Ryan put forward a model-driven method for the online monitoring and predictive maintenance of automobile braking system, established digital twin models of its key components using Ansys and the Modelica language, analyzed the signal response of the braking system under gear/mechanical failure, and laid a foundation for the subsequent diagnosis and prediction of the braking system [
8]. Fotias developed the model library of an electrical power system based on the Modelica language, which includes a multi-fidelity, multi-scale battery, power electronics and an electrical propulsion system sub-library, and used this library to build the digital twin model of an electrical power system in the process of product development, aiming to reduce development costs and carry out status monitoring [
9]. Zhou pointed out that the satellite communication station is a typical multi-disciplinary physical system, which is composed of six systems, including the antenna system, receiving system, transmitting system, communication system, control system and power supply system, through the demand analysis of the digital twin construction of satellite earth stations; the method of building a digital twin system of satellite communication equipment using MWorks multi-domain system modeling platform is proposed. Finally, the effectiveness and feasibility of the digital twin modeling method are verified [
10]. Vering et al. applied digital twin technology to the energy recovery devices in air conditioning systems. Based on the Modelica language, they developed their digital twin model to predict the behavior of the physical system. They communicated with the physical model through the Message Queuing Telemetry Transport (MQTT) interface to achieve the virtual reality mapping of the physical model and the digital twin model, which can improve the efficiency of energy recovery devices [
11]. In order to monitor the operation status of the space station in real time, Xing Tao et al. established seven subsystem models of dynamics and control, energy, environmental and thermal control, propulsion, information, data management, and measurement and control of the core cabin, test cabin I and test cabin II of the space station based on the Modelica language and the MWorks system simulation platform, covering the general system, subsystems, and key stand-alone equipment, and conducted simulation analyses of the typical working conditions of subsystems, respectively. The functional mock up interface (FMI) standard was adopted to integrate the digital twin models of a single cabin, two cabin, one font and three cabin T-shaped system of a space station, analyze and verify the rendezvous and docking, transposition and other scenarios, and achieve the analysis and verification of the system level, all boundaries and all working conditions of the space station [
12].
In a word, the thermal equipment of the marine steam power system is a typical and strong coupling complex system with complex composition and working conditions, and, with the traditional modeling method, it is difficult to satisfy the development requirements of digital and intelligent thermal equipment. In view of the advantages of multi-disciplinary modeling in the modeling of complex physical systems and the wide application of digital twin technology in equipment health management, this paper combines the ideas of multi-disciplinary modeling and modular modeling under the digital twin technology system to build a digital model of the main equipment and subsystems of the marine steam power system, and uses the Modelica language and the MWorks system simulation platform to build the digital model of the marine steam power system. It also carries out an accurate and effective dynamic characteristic analysis and fault simulation, which makes a preliminary exploration for the application of digital twin technology in marine steam power systems, and provides support for the health management of marine thermal equipment.
3. Digital Modeling of Marine Steam Power System Based on Modelica
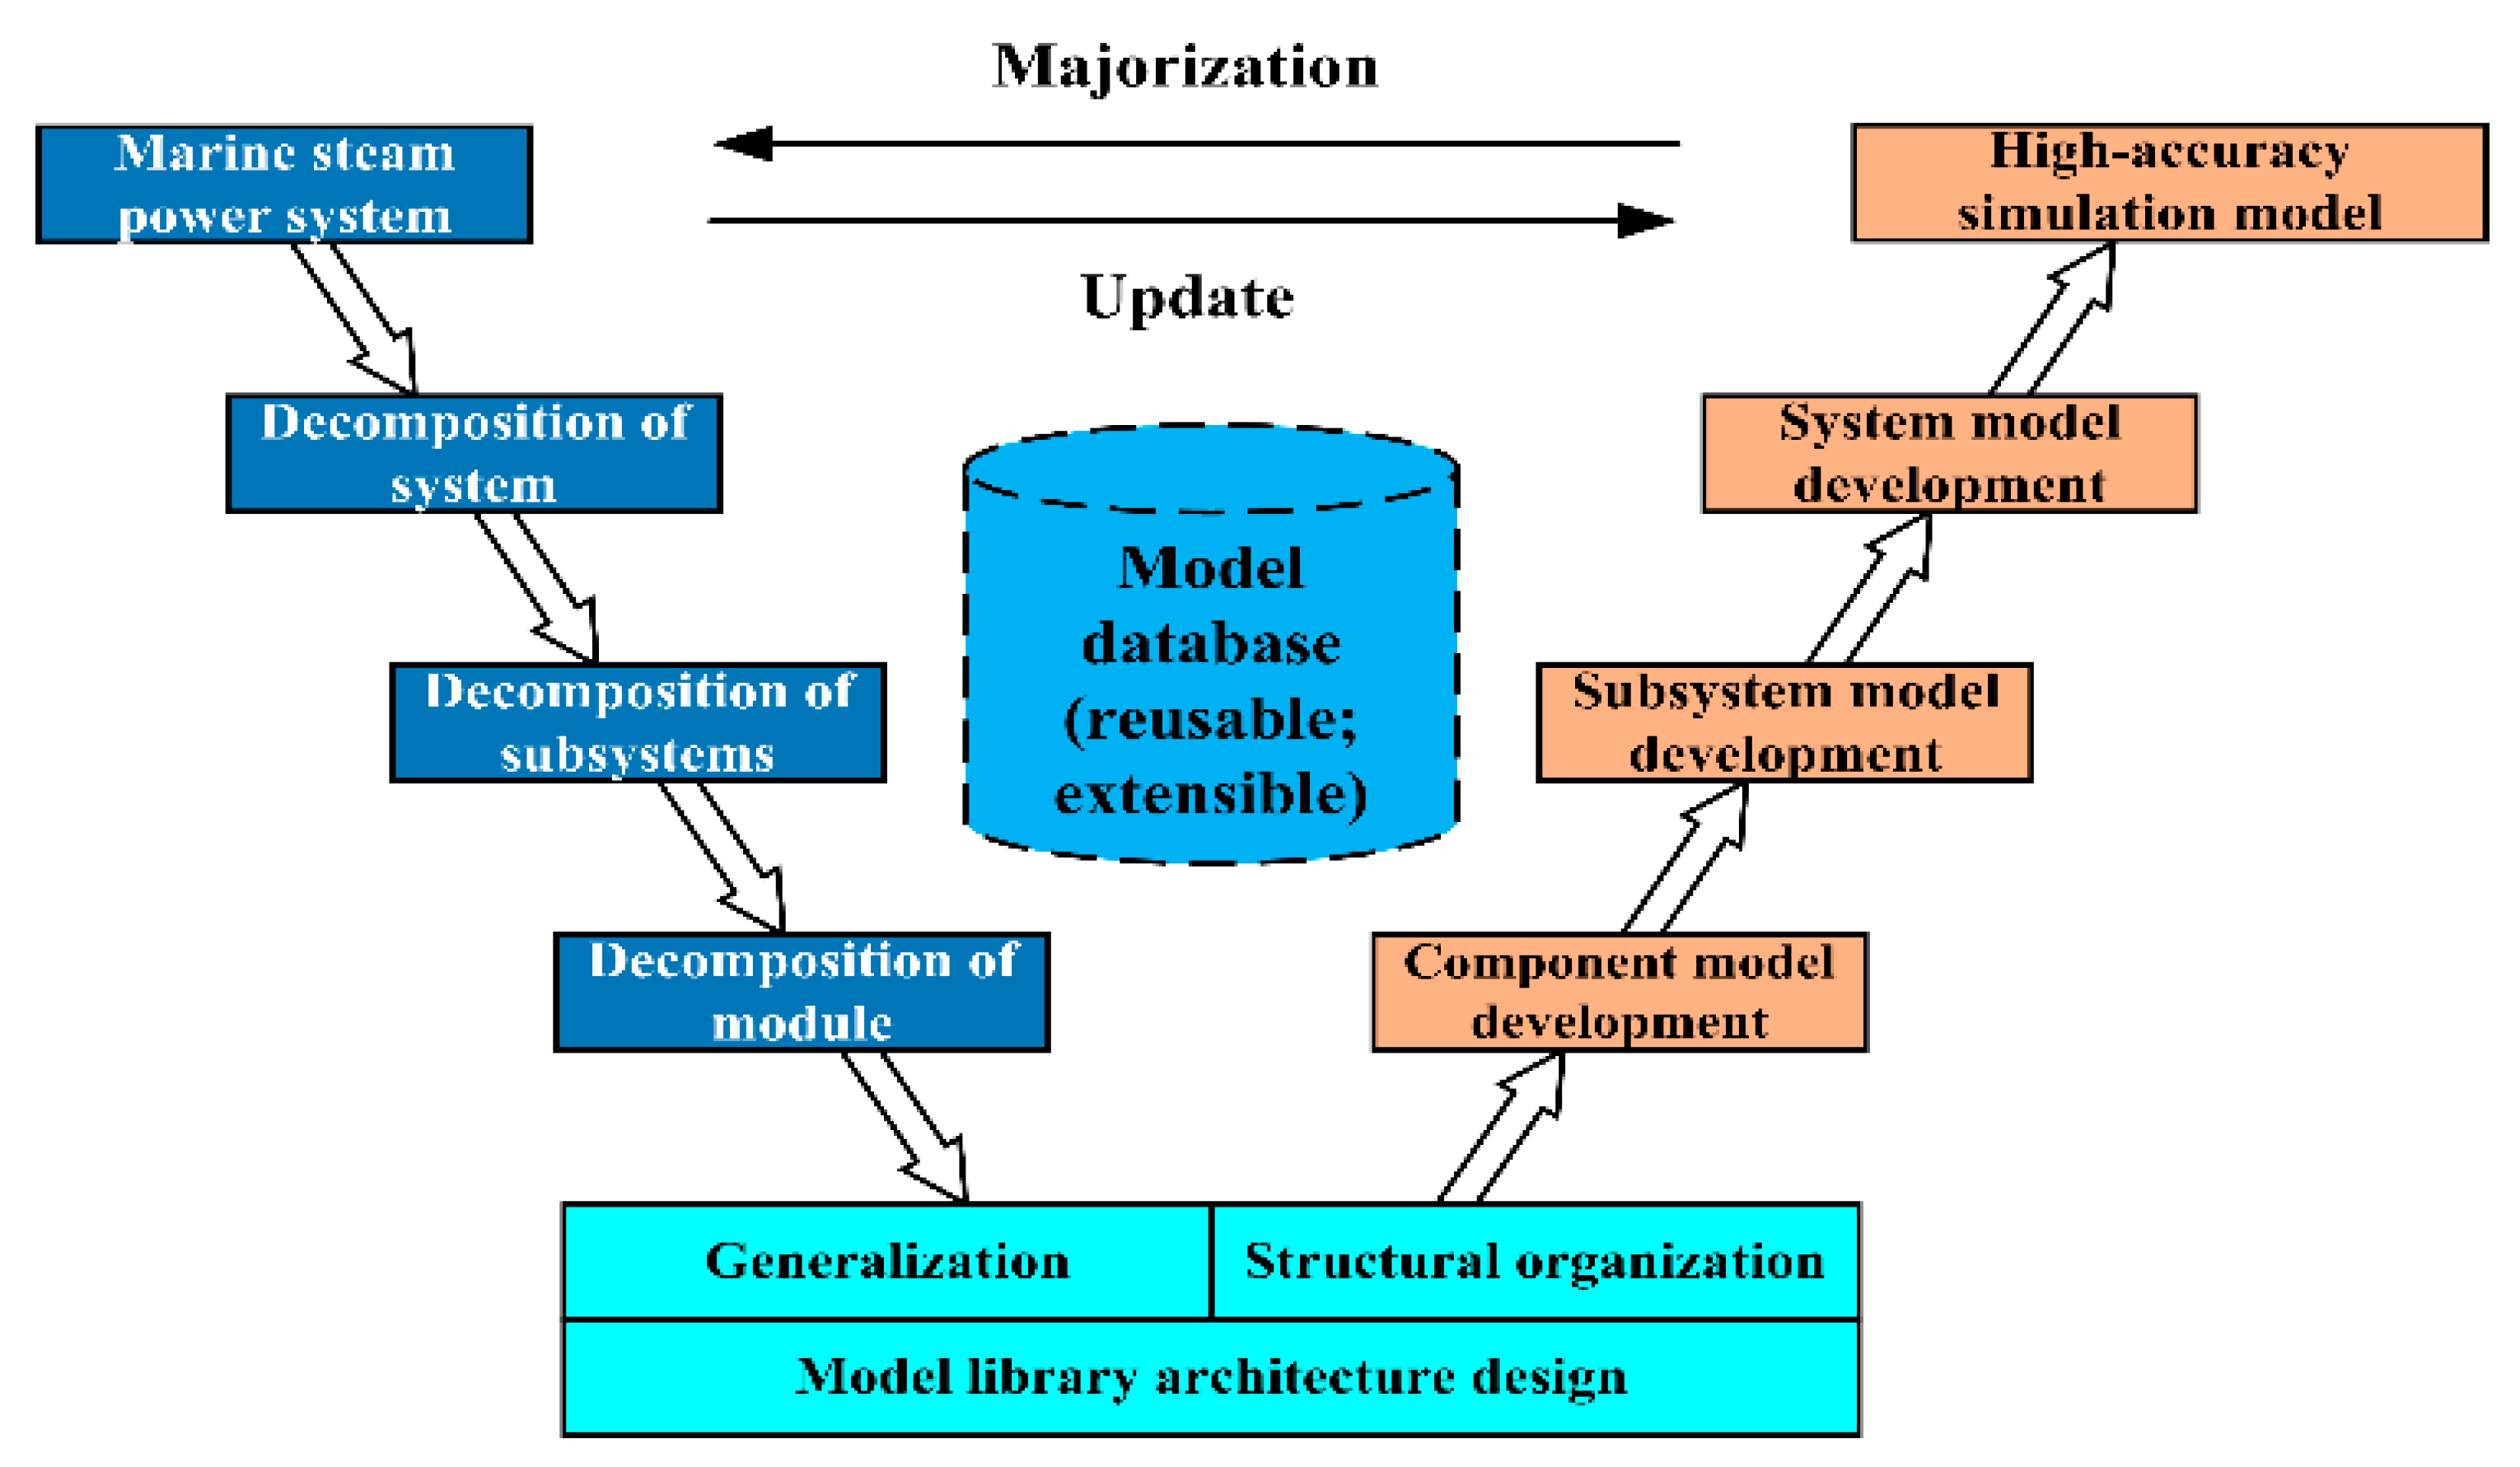
For each piece of thermal equipment involved in the marine steam power system, including the boilers, main steam turbines, condensers, deaerators, air ejectors, valves, pipes, pumps, etc., according to its mathematical operating characteristics combined with the principle of modular modeling, the corresponding component model and system model library are developed using the MWorks system simulation platform based on the Modelica language, and the digital model of the marine steam power system is integrated. The model development principle is shown in
Figure 2.
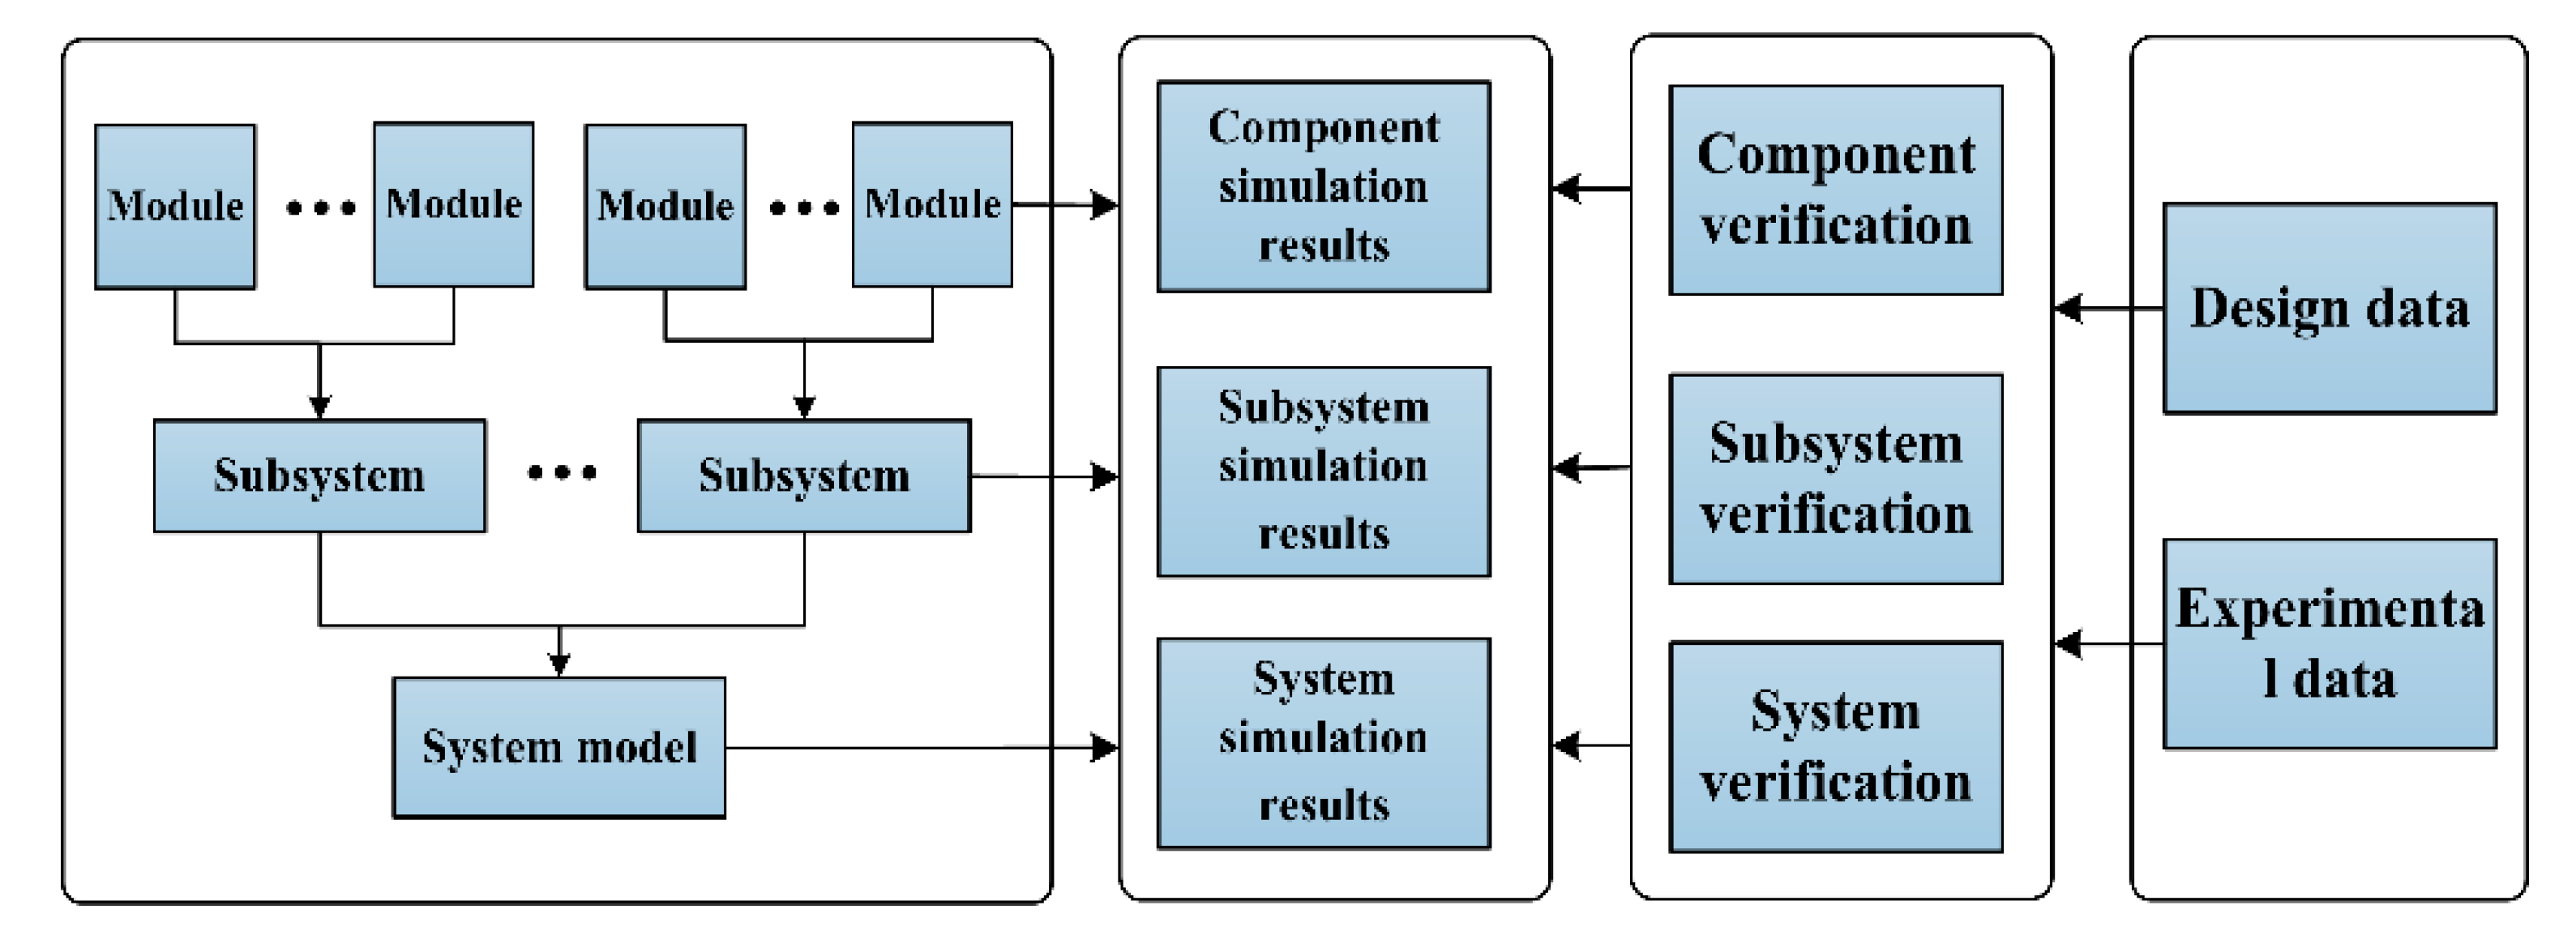
After the corresponding component models have been developed on the MWorks simulation platform, in order to ensure the accuracy of the established digital model and the high stability of the digital simulation model of the complete steam power system, and to ensure that the model operating state parameters can accurately reflect the actual marine operating data, it is necessary to conduct a parameter sensitivity analysis, model modification, a confidence evaluation, etc. on the model. The test data and historical operation data of real marine systems are used to verify and check the model.
The closer the operation data of the digital model are to the actual marine operation data, the higher the accuracy of the model, which can ensure the accuracy of the subsequent dynamic characteristics analysis, realize the online monitoring and status evaluation of the physical model by the digital model, so as to accurately provide an operation strategy for the actual marine thermal equipment, and realize the virtual–real mapping of the digital model to the physical equipment. The debugging process for the model characteristic parameters is shown in
Figure 3.
At the same time, in debugging the parameters of the system model, we should focus on whether the data interaction of each component model and subsystem model is normal, whether the model connection mechanism and interface are correct, whether the parameter setting for the model characteristic is reasonable, and whether a dynamic characteristic analysis of the system by the digital model can be realized. Through the debugging of the characteristic parameters of the system model, a complete digital model of the marine steam power system is built. The digital model of the marine steam power system is shown in
Figure 4.
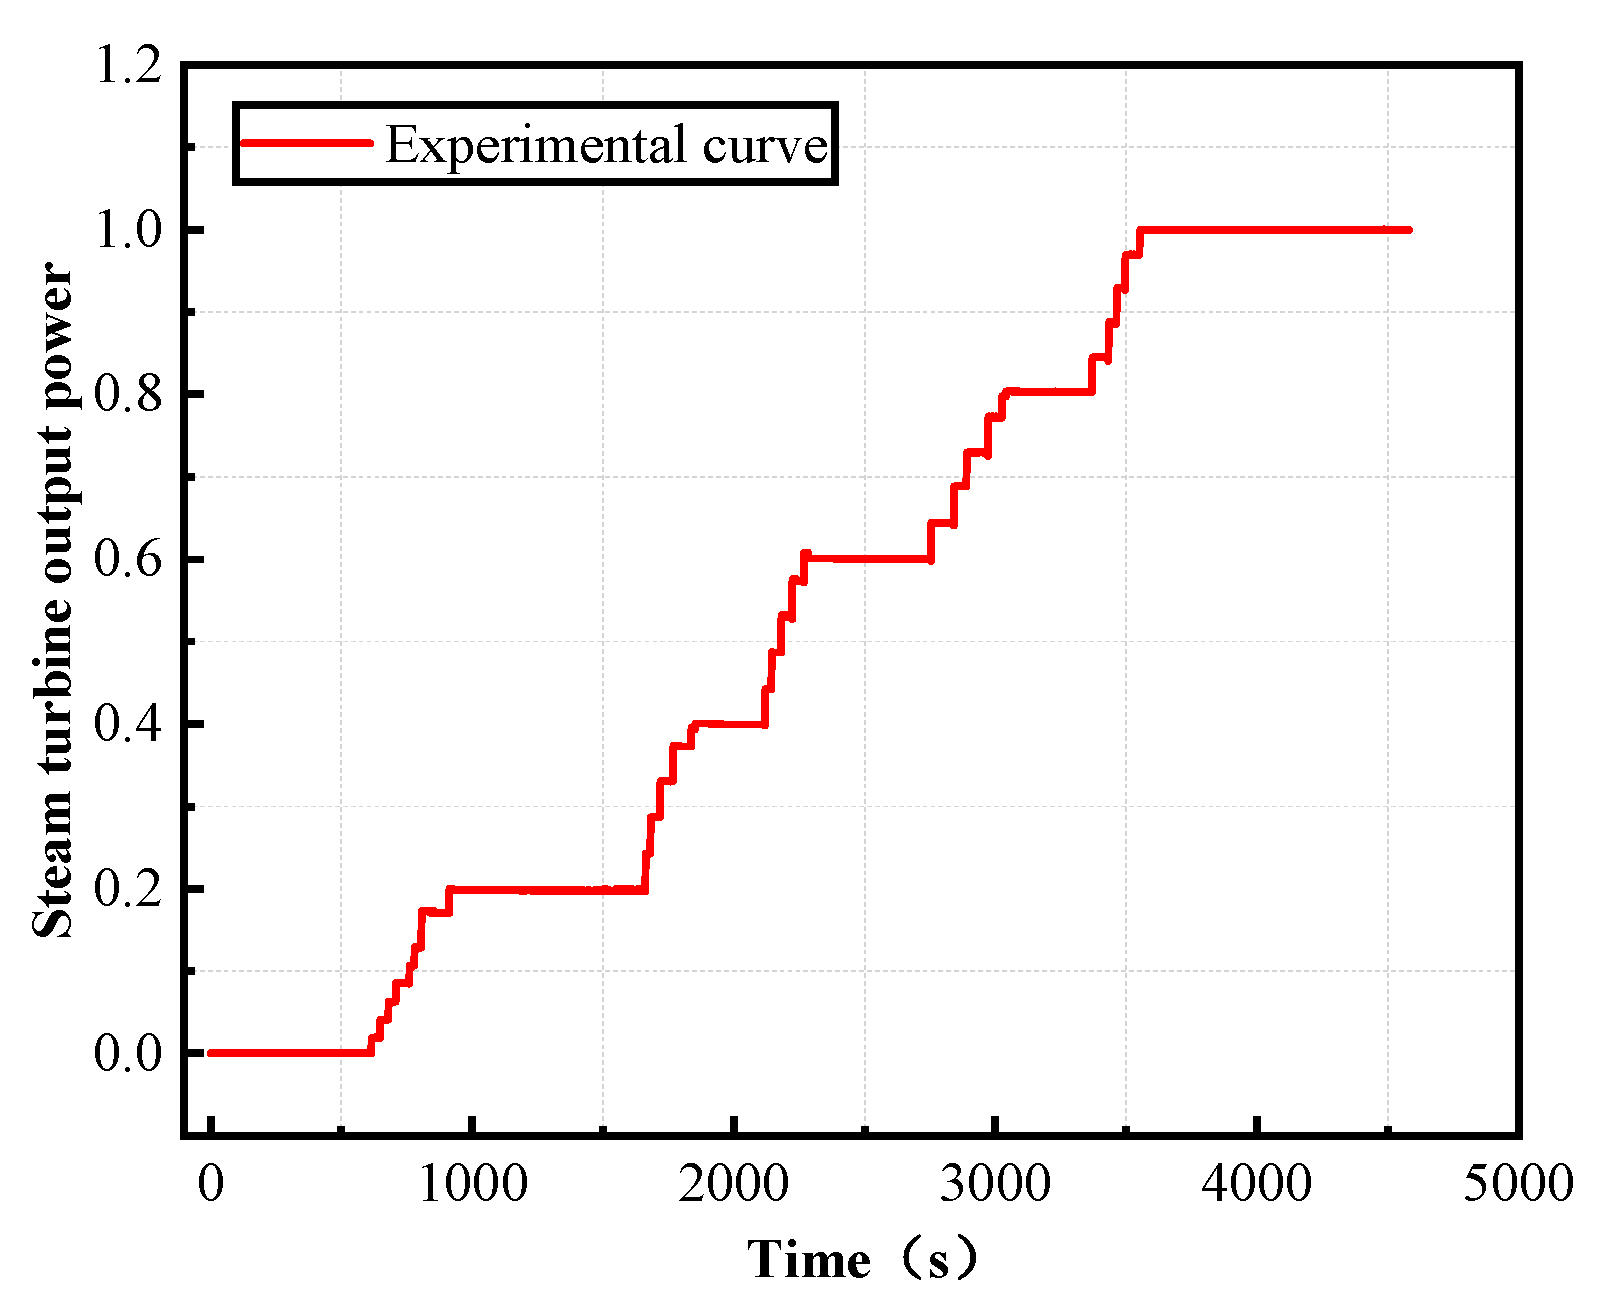
Through debugging the design parameters and state parameters in the characteristic parameters of the digital model of the marine steam power system, a more accurate digital model has been obtained. In order to verify the accuracy of the digital model of the marine steam power system, this paper uses a type of steam turbine unit to carry out load up test verification. By controlling the opening of the steam valve, it simulated the processes of acceleration and analyzed their dynamic characteristics. An operating state parameter curve for the marine steam turbine from start-up to a 100% working condition is obtained. All state parameters are dimensionless according to their design data. The dimensionless formula is shown in Formula (18).
where:
—The dimensionless parameter;
—The simulation or experimental parameter;
—The design parameter.
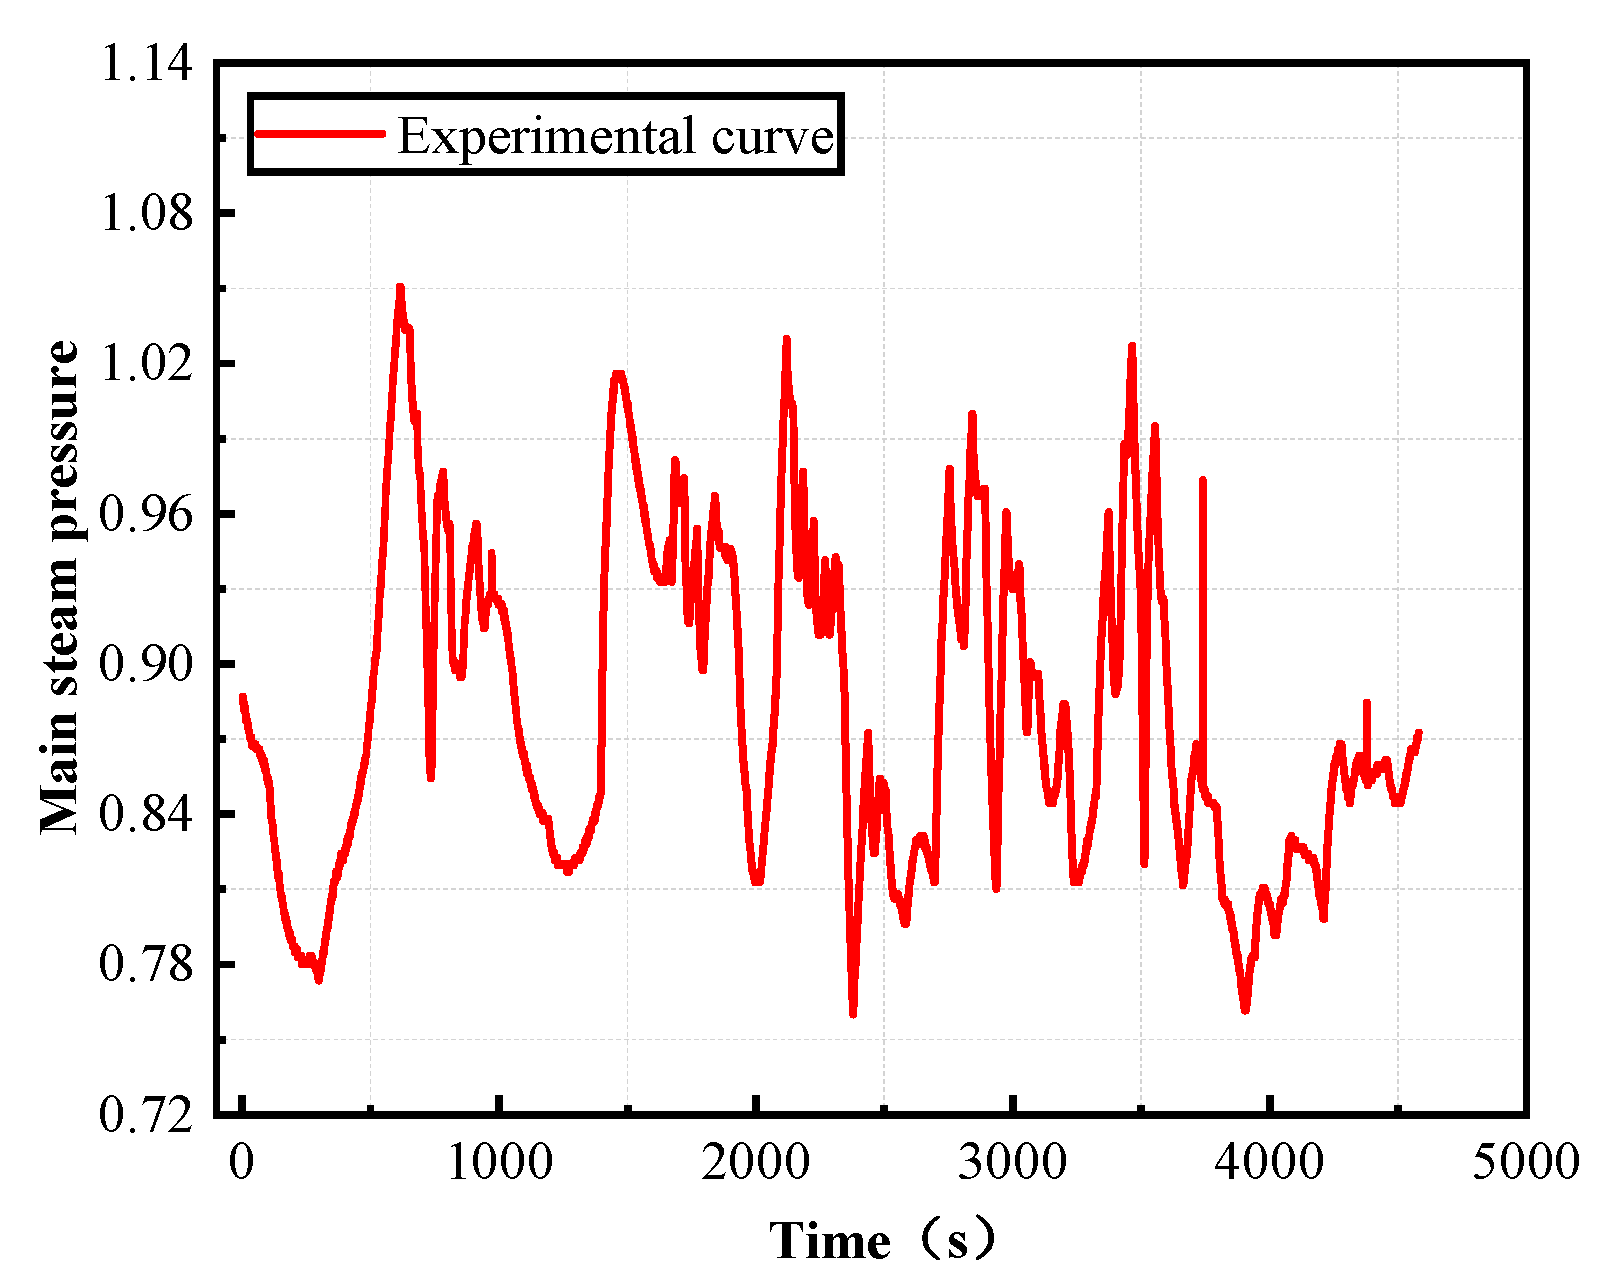
It can be seen from the load increase test data for the marine steam turbine that the steam turbine reached a 100% working condition in five steps after starting up. After the system warmed up for 650 s, the flow of steam through steam valve was gradually increased, and after 270 s, the load was increased to about 20% of the working condition, and then the system operated stably for 740 s. Subsequently, the steam flow was increased again. After 190 s, the system rose to about 40% of the working condition and ran stably for 270 s under the 40% working condition. Then, an additional increase of the steam flow followed. After 180 s, the system rose to about 60% of the working condition. When the system had operated for 450 s under the 60% working condition, the steam flow was increased. After 300 s, the system rose to about 80% of the working condition, and then the system operated stably for 320 s. A final increase of the steam flow followed. After 200 s, the system rose to a 100% working condition. Under the condition that the main steam temperature, pressure and cooling water flow are kept under full working condition parameters, the load of the steam turbine unit can be increased by adjusting the main steam flow. The main steam temperature and pressure fluctuate due to various factors during operation. However, the state of fluctuation is controllable and safe.
The measured boundary parameters of the turbine inlet are substituted into the established digital model of the marine steam power system, and a simulation curve for the turbine under 100% load rise conditions after start-up is obtained. The operation state parameters for key pieces of thermal equipment are compared with the digital simulation model for verification. The comparison diagram for steam turbine output power and the dynamic characteristic curve for the increasing temperature of the cooling water are shown in
Figure 11,
Figure 12 and
Figure 13.
It can be seen from
Figure 11 that the simulation data for the main steam flow are consistent with the experimental data, but that, with the increase of the steam flow, the parameters fluctuate greatly as the load increases. Therefore, four operating points from the experimental and simulation data are selected for error analysis, as shown in
Table 1.
It can be seen from the
Table 1 that, among the four selected operating points, the one with the largest error, −4.9%, is T = 1800 s. This is because, in the process of lifting the load, the steam flow fluctuates easily. The error at the other operating points does not exceed ±5%.
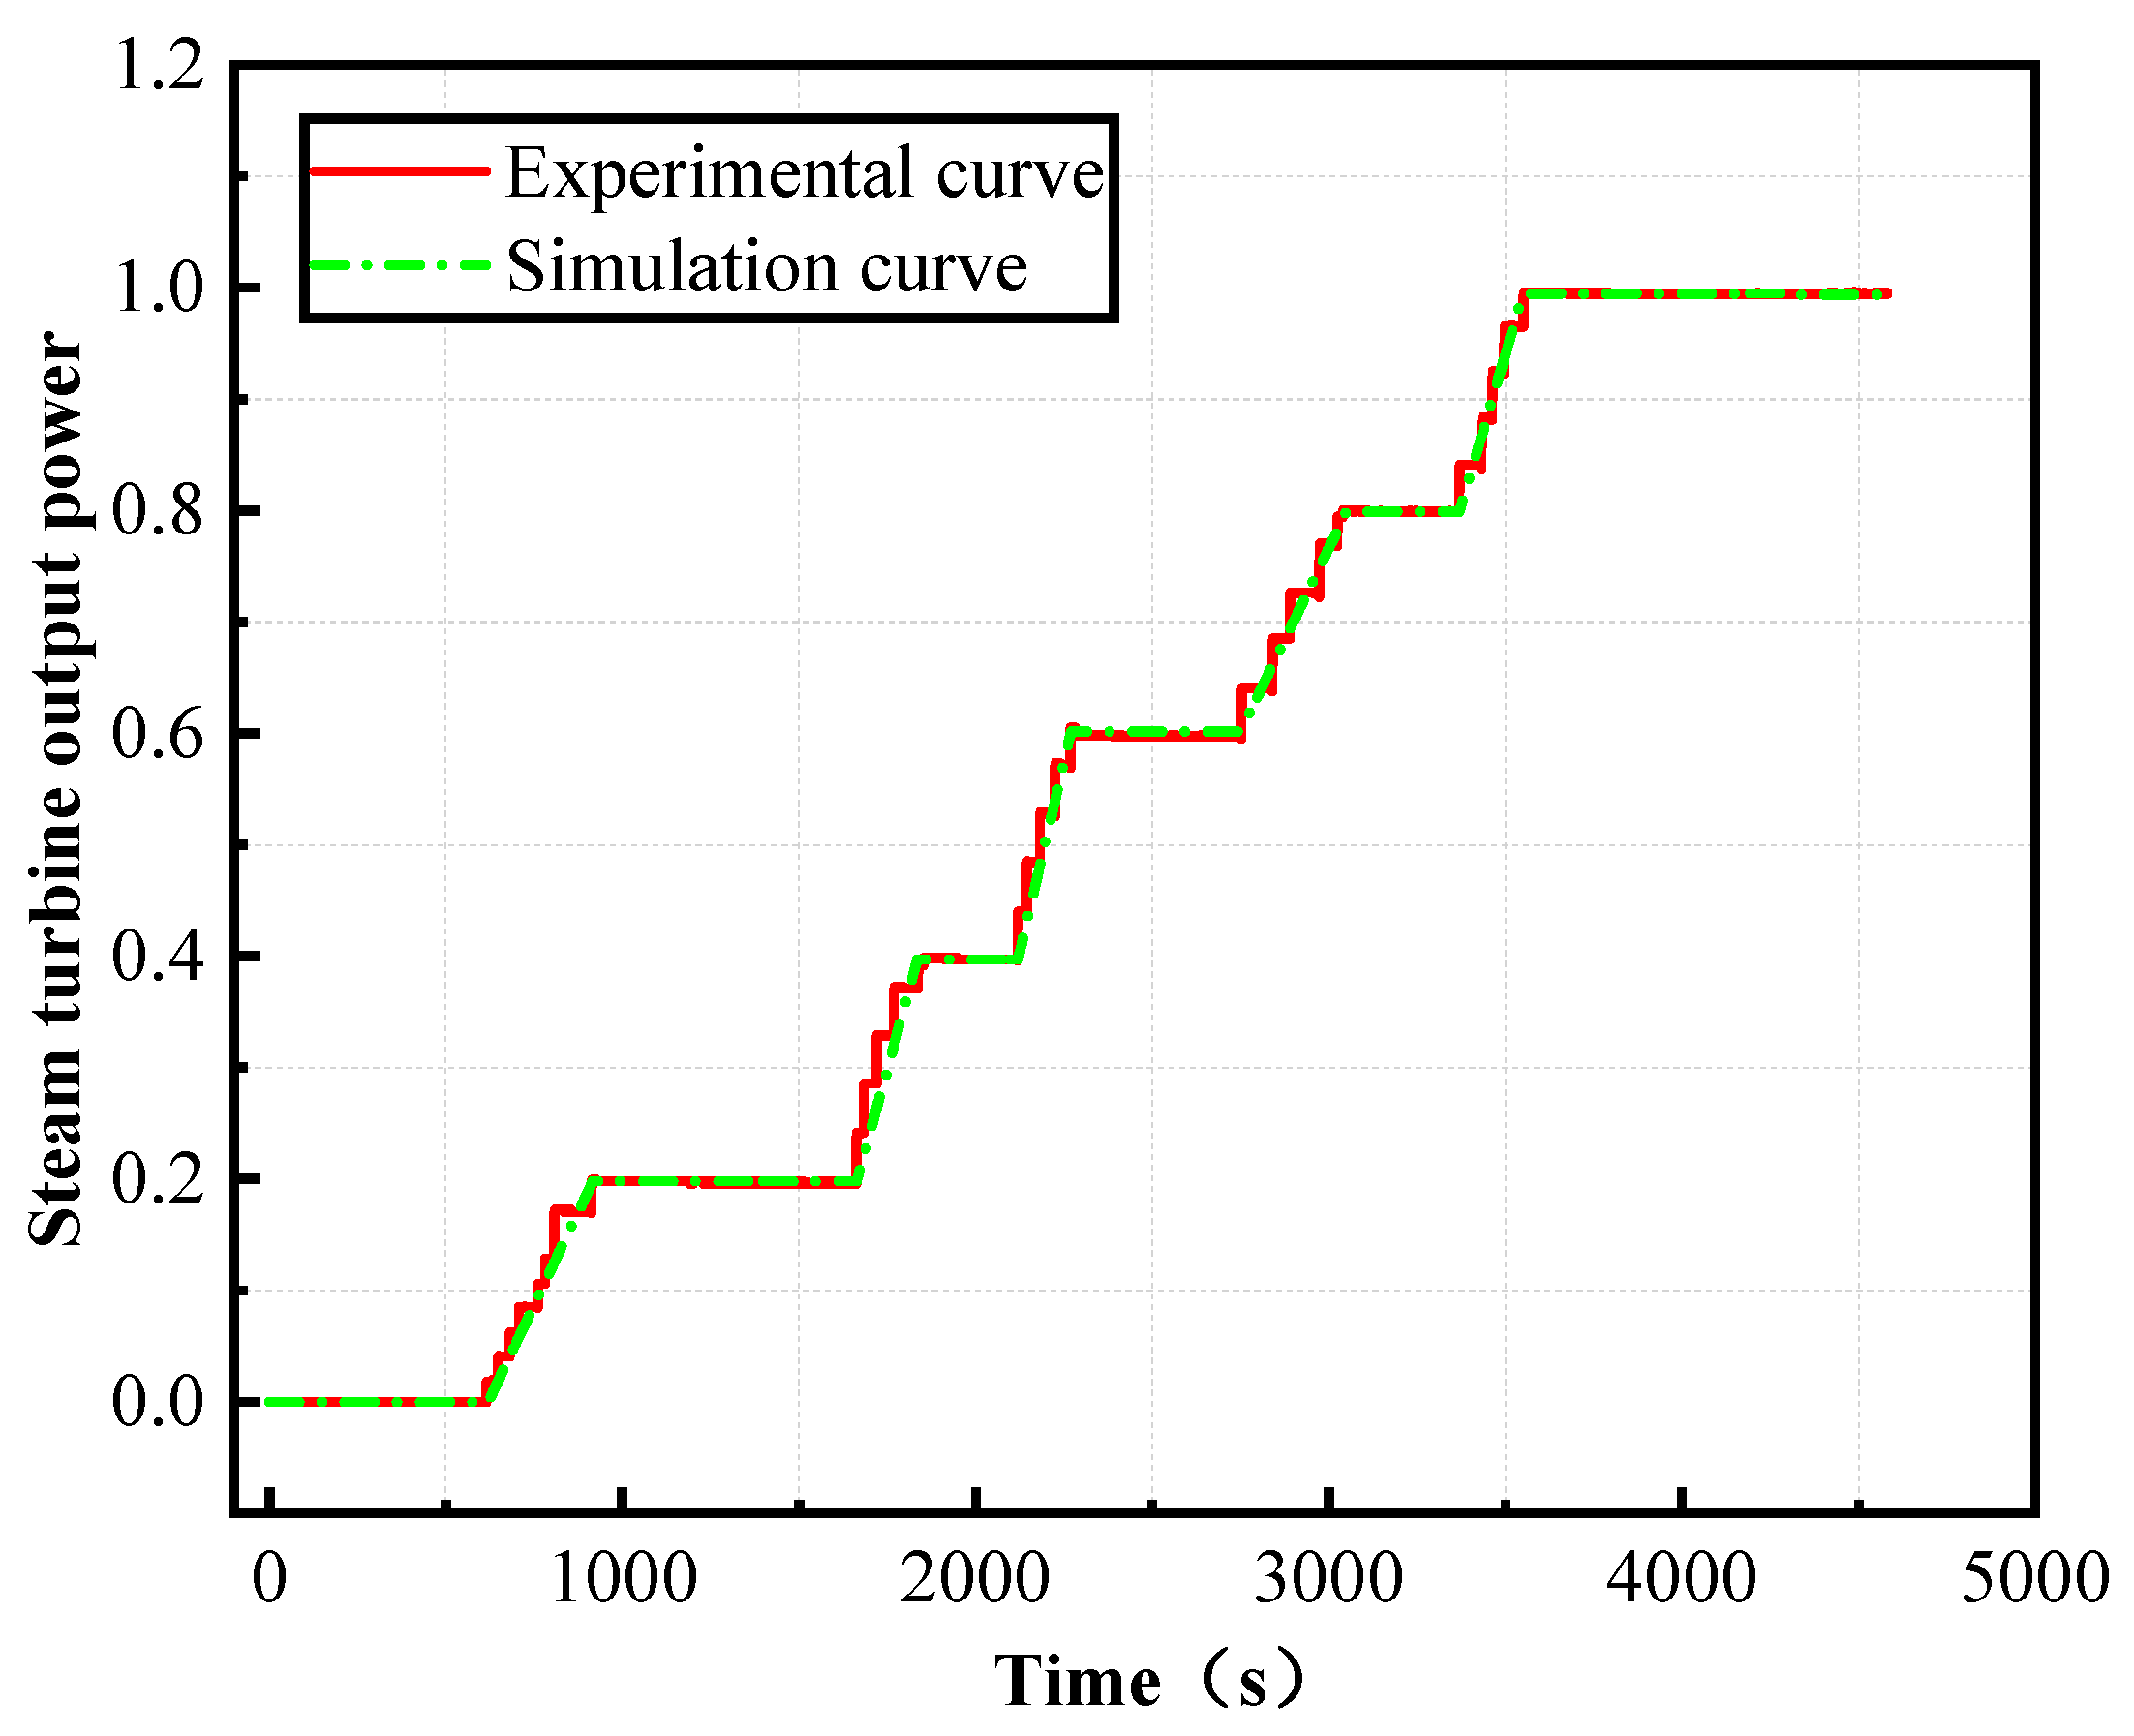
Figure 12.
Comparison between experimental and simulation data of steam turbine output power.
Figure 12.
Comparison between experimental and simulation data of steam turbine output power.
It can be seen from
Figure 12 that the simulation data for the steam turbine output power are consistent with the experimental data, but that, with the increase of the steam flow, the parameters fluctuate greatly during load increase. Therefore, four operating points from the experimental and simulation data are selected for error analysis, as shown in
Table 2.
It can be seen from the
Table 2 that, among the four selected operating points, the one with the largest error, −4.3%, is T = 1800 s, and that the error at other operating points does not exceed ±5%.
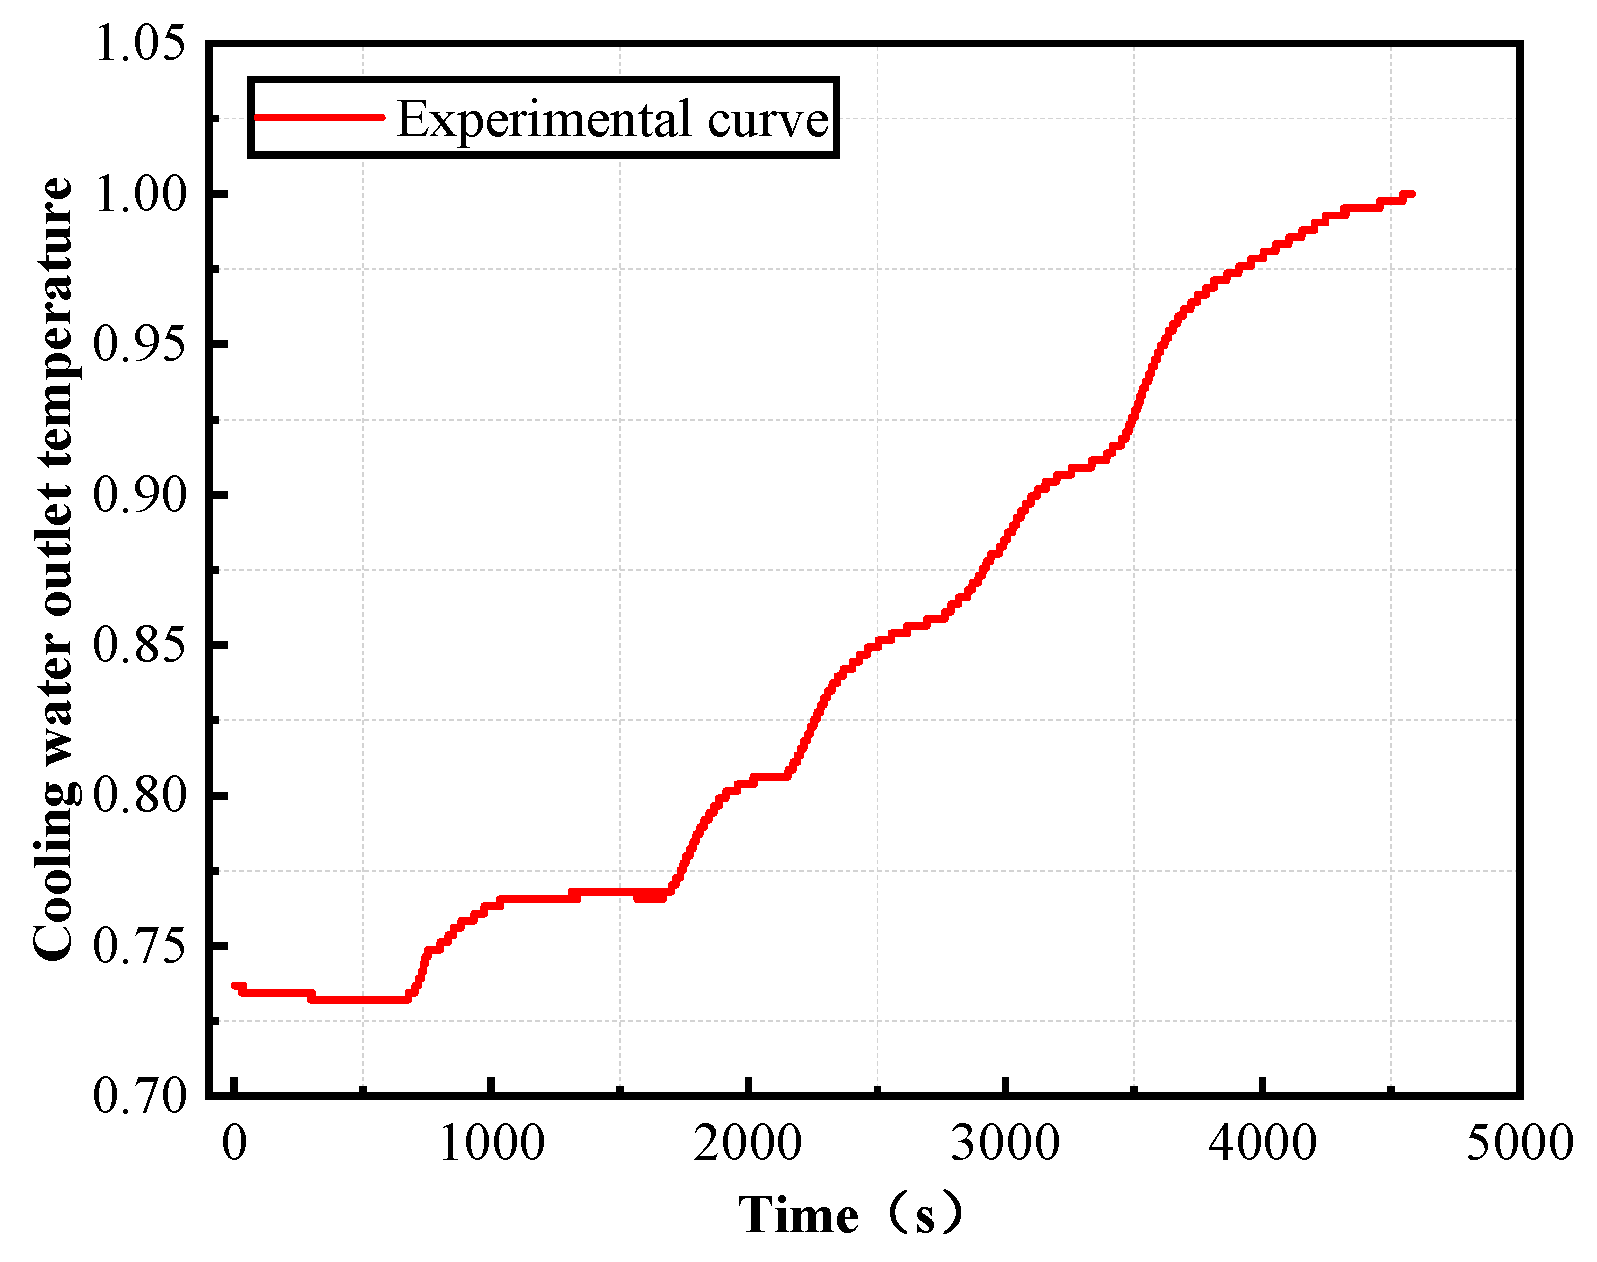
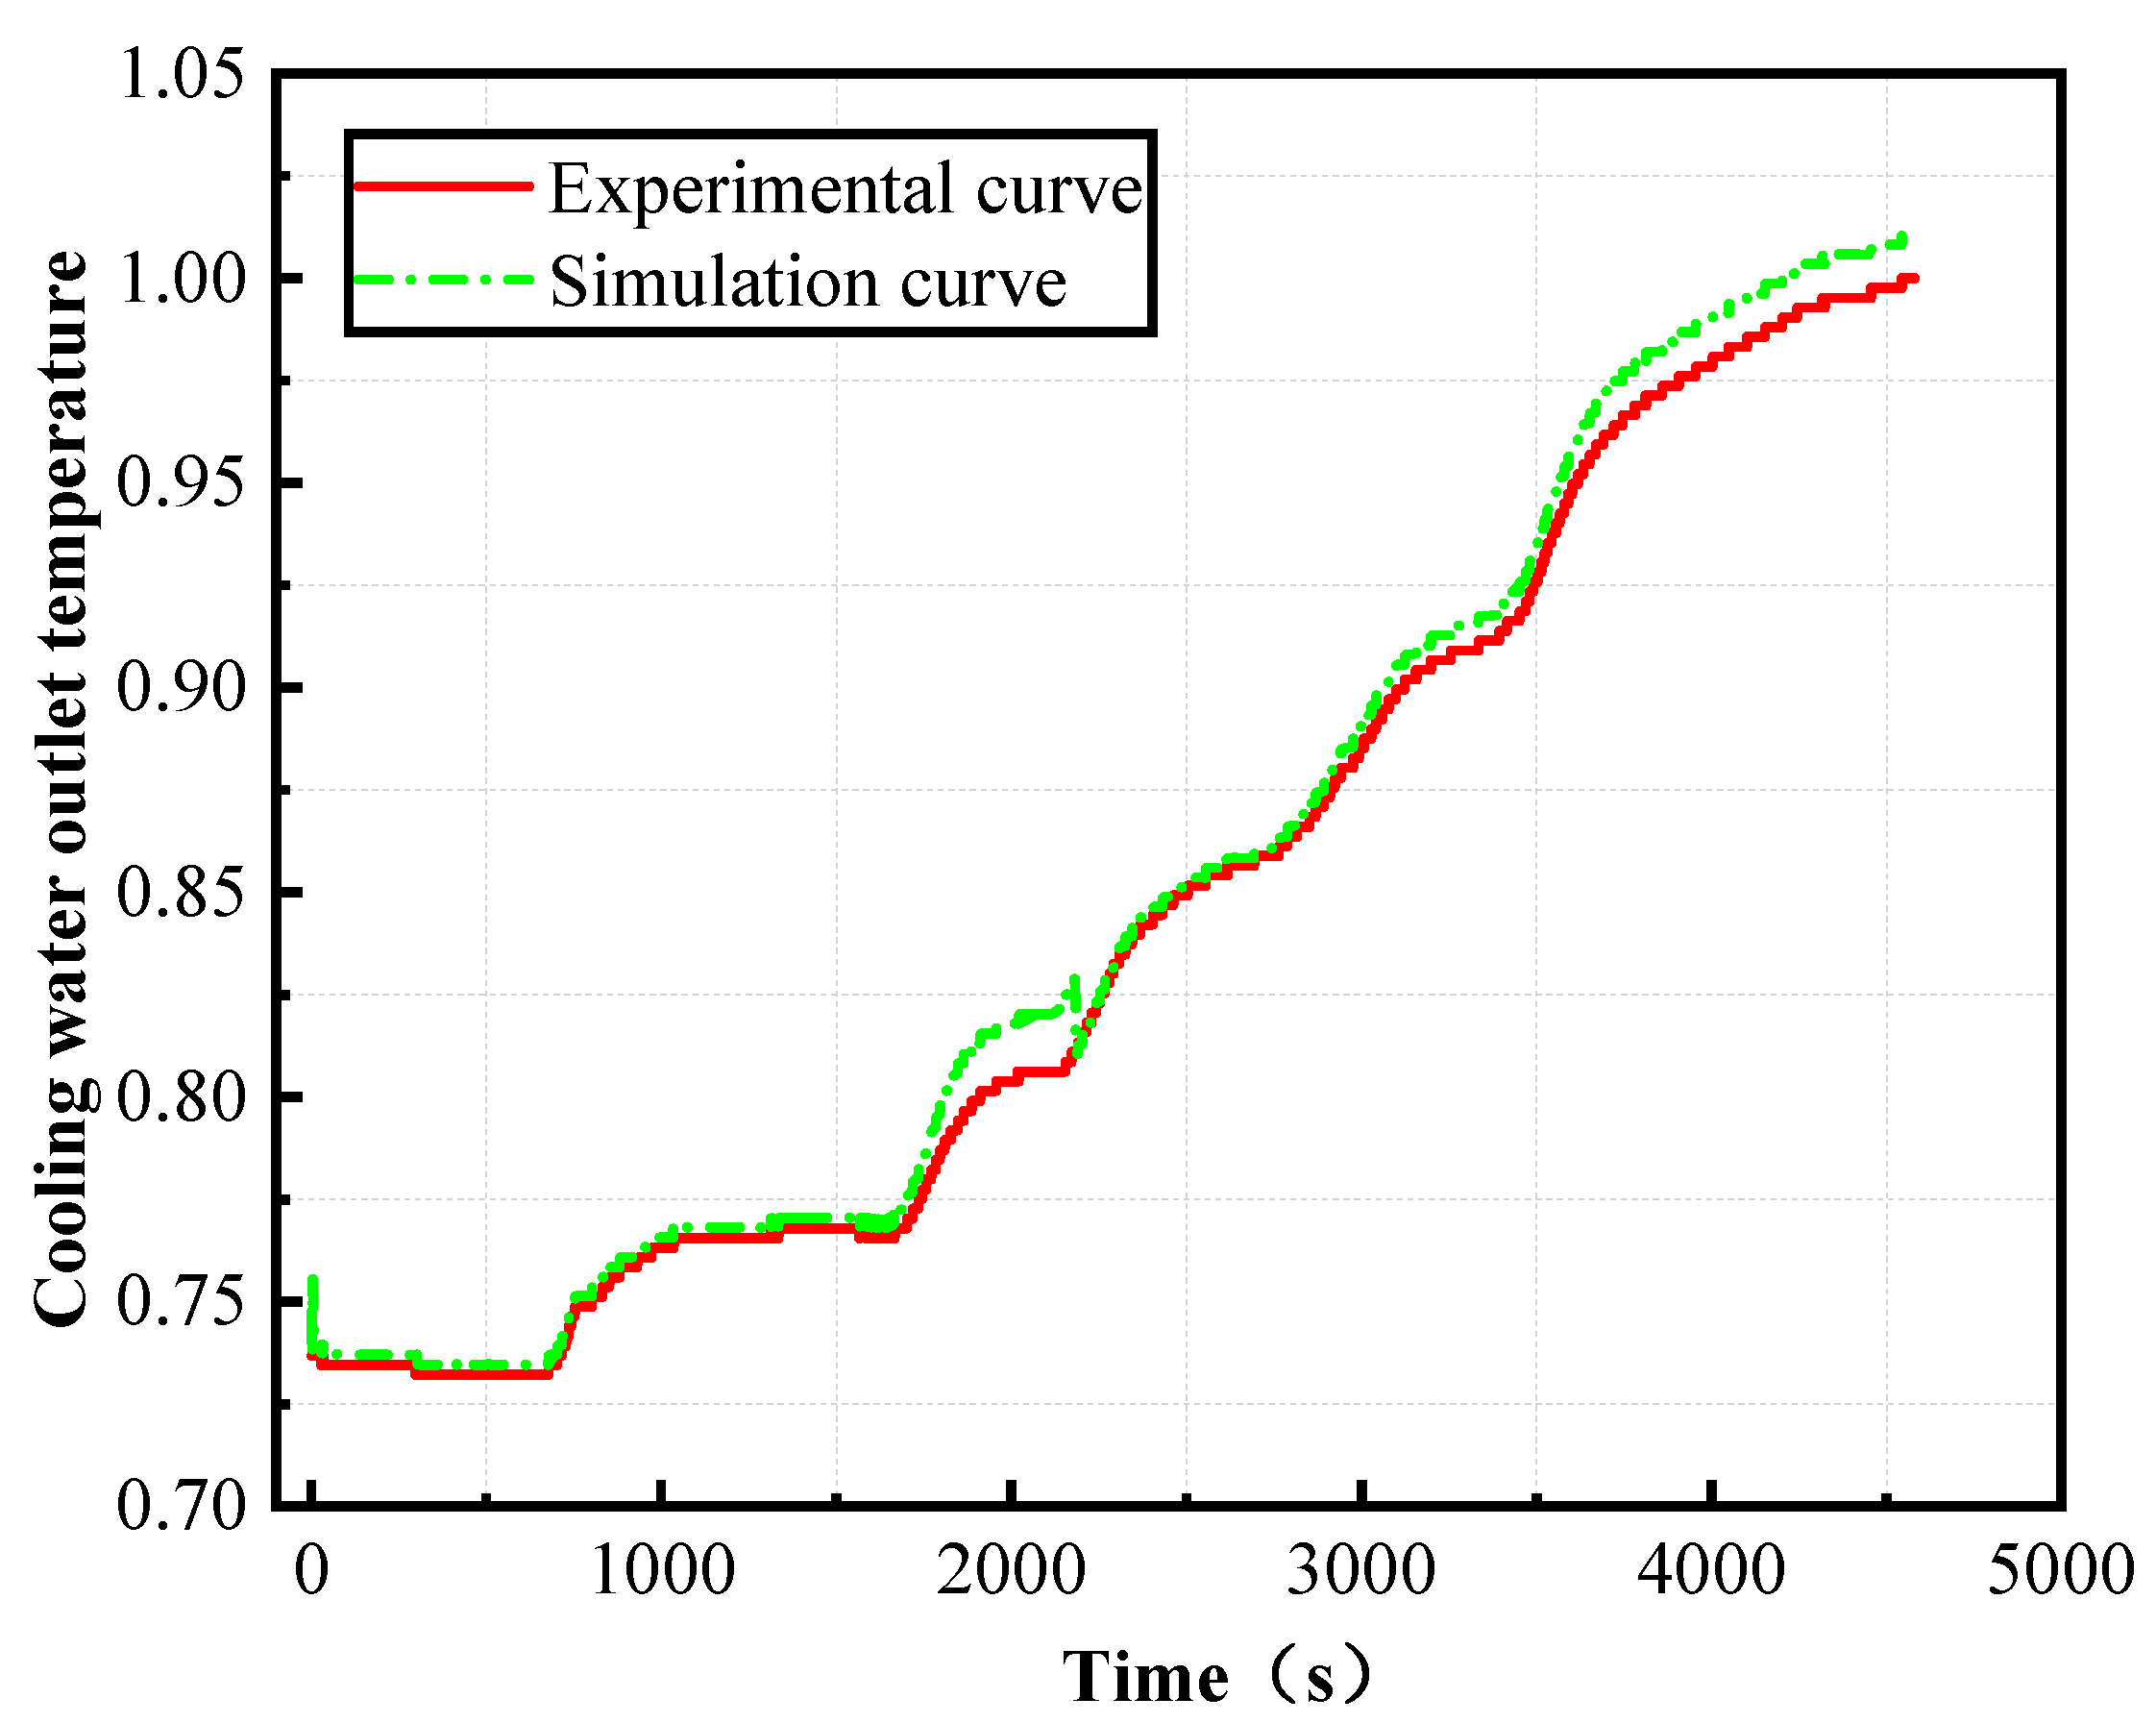
Figure 13.
Comparison between experimental and simulation data of cooling water outlet temperature.
Figure 13.
Comparison between experimental and simulation data of cooling water outlet temperature.
It can be seen from
Figure 13 that the simulation data for the cooling water outlet temperature are consistent with the experimental data, but that, with the increase of the steam flow, the parameters fluctuate greatly as the load increases. Therefore, four operating points from the experimental and simulation data are selected for error analysis, as shown in
Table 3.
It can be seen from
Table 3 that, among the four selected operating points, the one with the largest error, 1.5%, is T = 1800 s, and that the error of other operating points does not exceed ±5%.
Through the comparison and error analysis of the simulation curve and the experimental curve, it can be concluded that the main steam flow, the steam turbine output power and the cooling water outlet temperatures, etc. calculated by the digital model are close to the experimental curve, the dynamic operation trend is consistent, and the maximum error does not exceed ±5%, which indicates a good simulation of the dynamic change process of the steam turbine. The digital model established in this paper has high accuracy and can realize virtual reality mapping between the model and the actual equipment. It can be used for the dynamic analysis of marine steam power systems and is conducive to promoting the further application of digital twin technology.
4. Dynamic Characteristics Analysis of Marine Power System Based on Digital Model
Maneuverability is an important performance indicator for marine technology. In the process of changing the marine vessel’s navigational maneuverability, the power system will rapidly increase or reduce the load, and the boiler, main steam turbine and steam water circulation system will coordinate to control the load change, which is very likely to cause a mismatch in turbine–boiler coordinated control, an imbalance in the steam water system, large fluctuations in the auxiliary system parameters and other phenomena [
16].
However, the fast load changing capability of the marine steam power system is an important factor in determine the maneuverability of the marine vessel, and its dynamic response performance will directly affect the operational stability of the marine power system. While mastering the dynamic characteristics of its operation can provide guidance for the vessel’s operation strategy, this section uses the high-precision digital model of the marine steam power system after the steady-state verification to analyze its dynamic characteristics, focusing on the dynamic response of the system under different cooling conditions and the dynamic characteristics under lifting and lowering loads.
4.1. Analysis of Dynamic Characteristics of System under Lifting and Lowering Loads
In order to accurately grasp the dynamic characteristics of the operation of the marine steam power system, this section analyzes the dynamic characteristics of the digital model of the system under variable working conditions and simulates the operating characteristics of the system under variable working conditions at 1500 s.
4.1.1. Dynamic Characteristic Analysis of Marine Power System Load Decrease
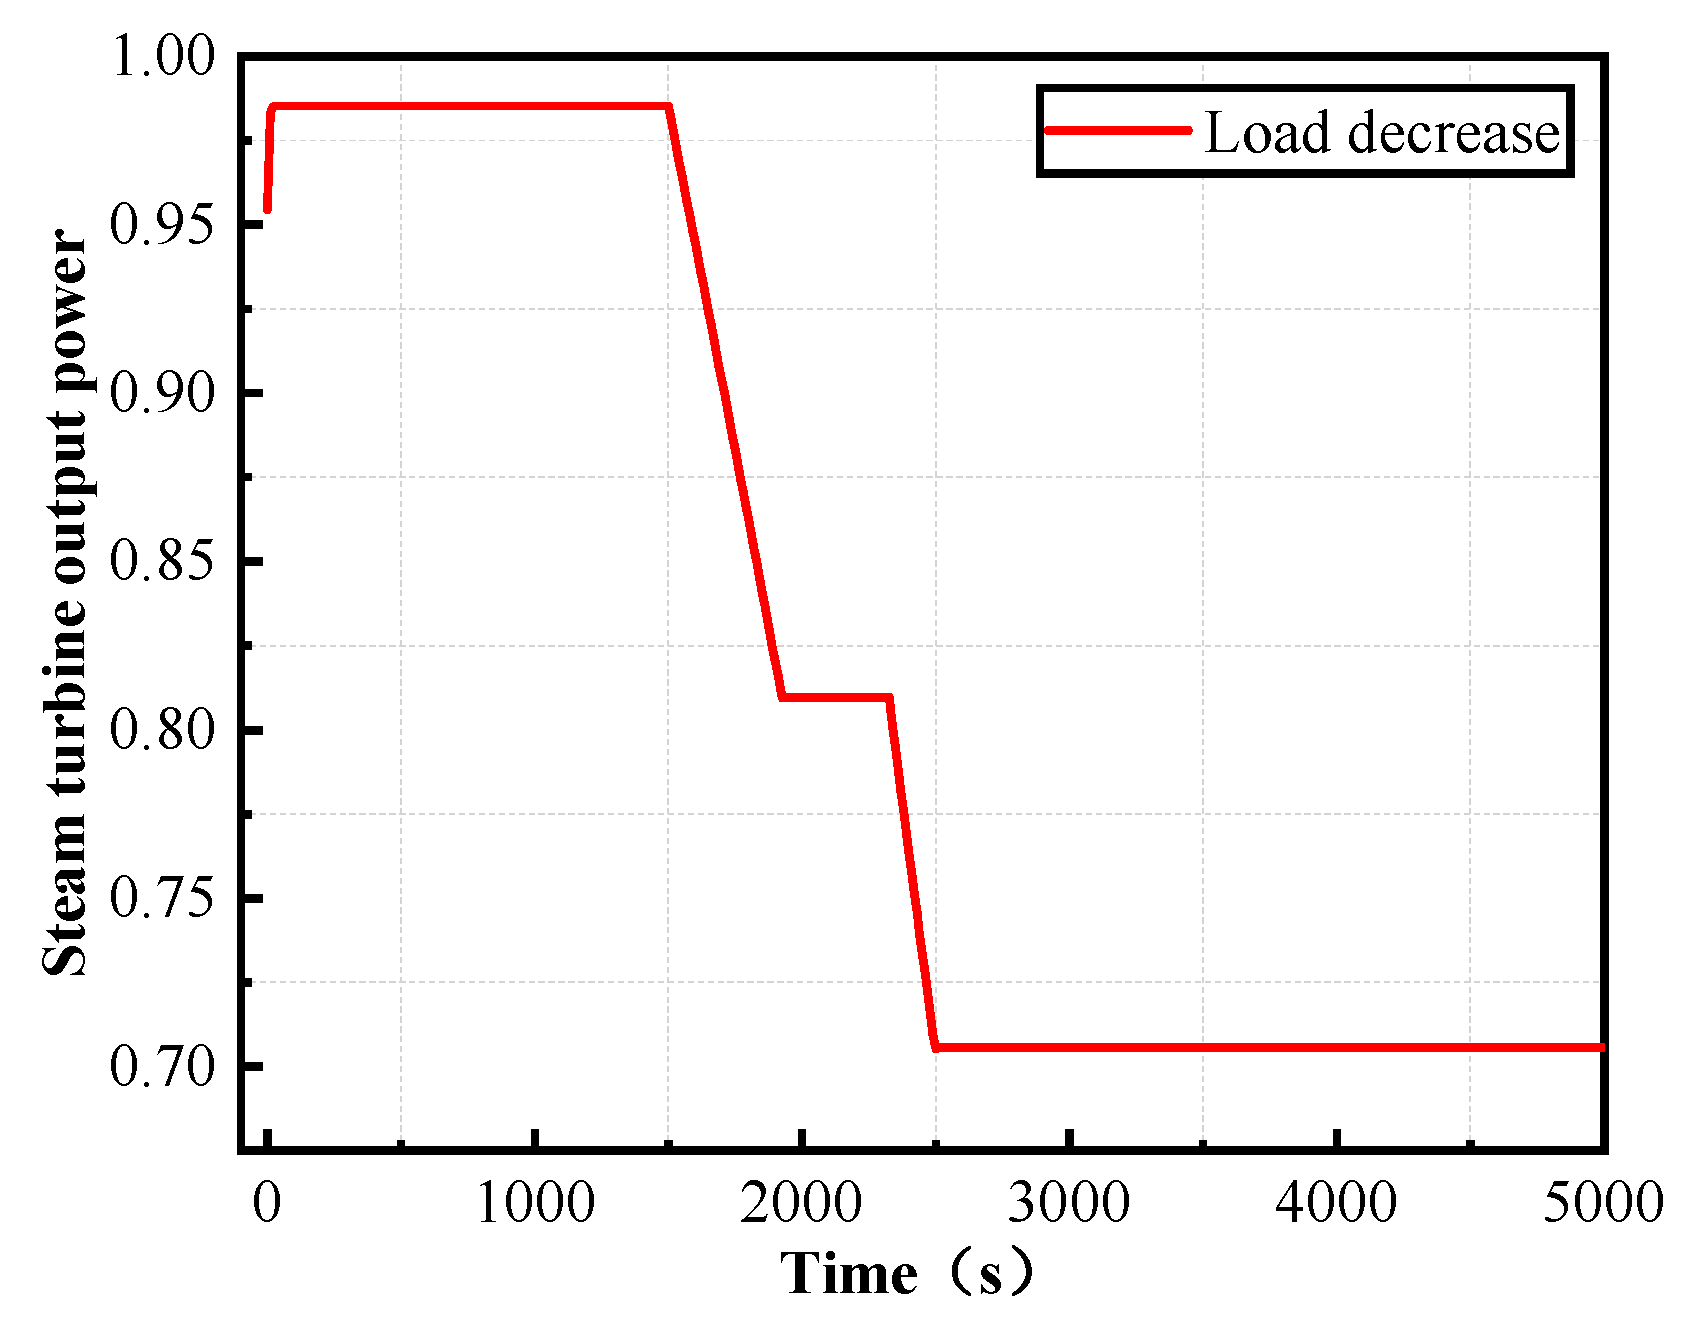
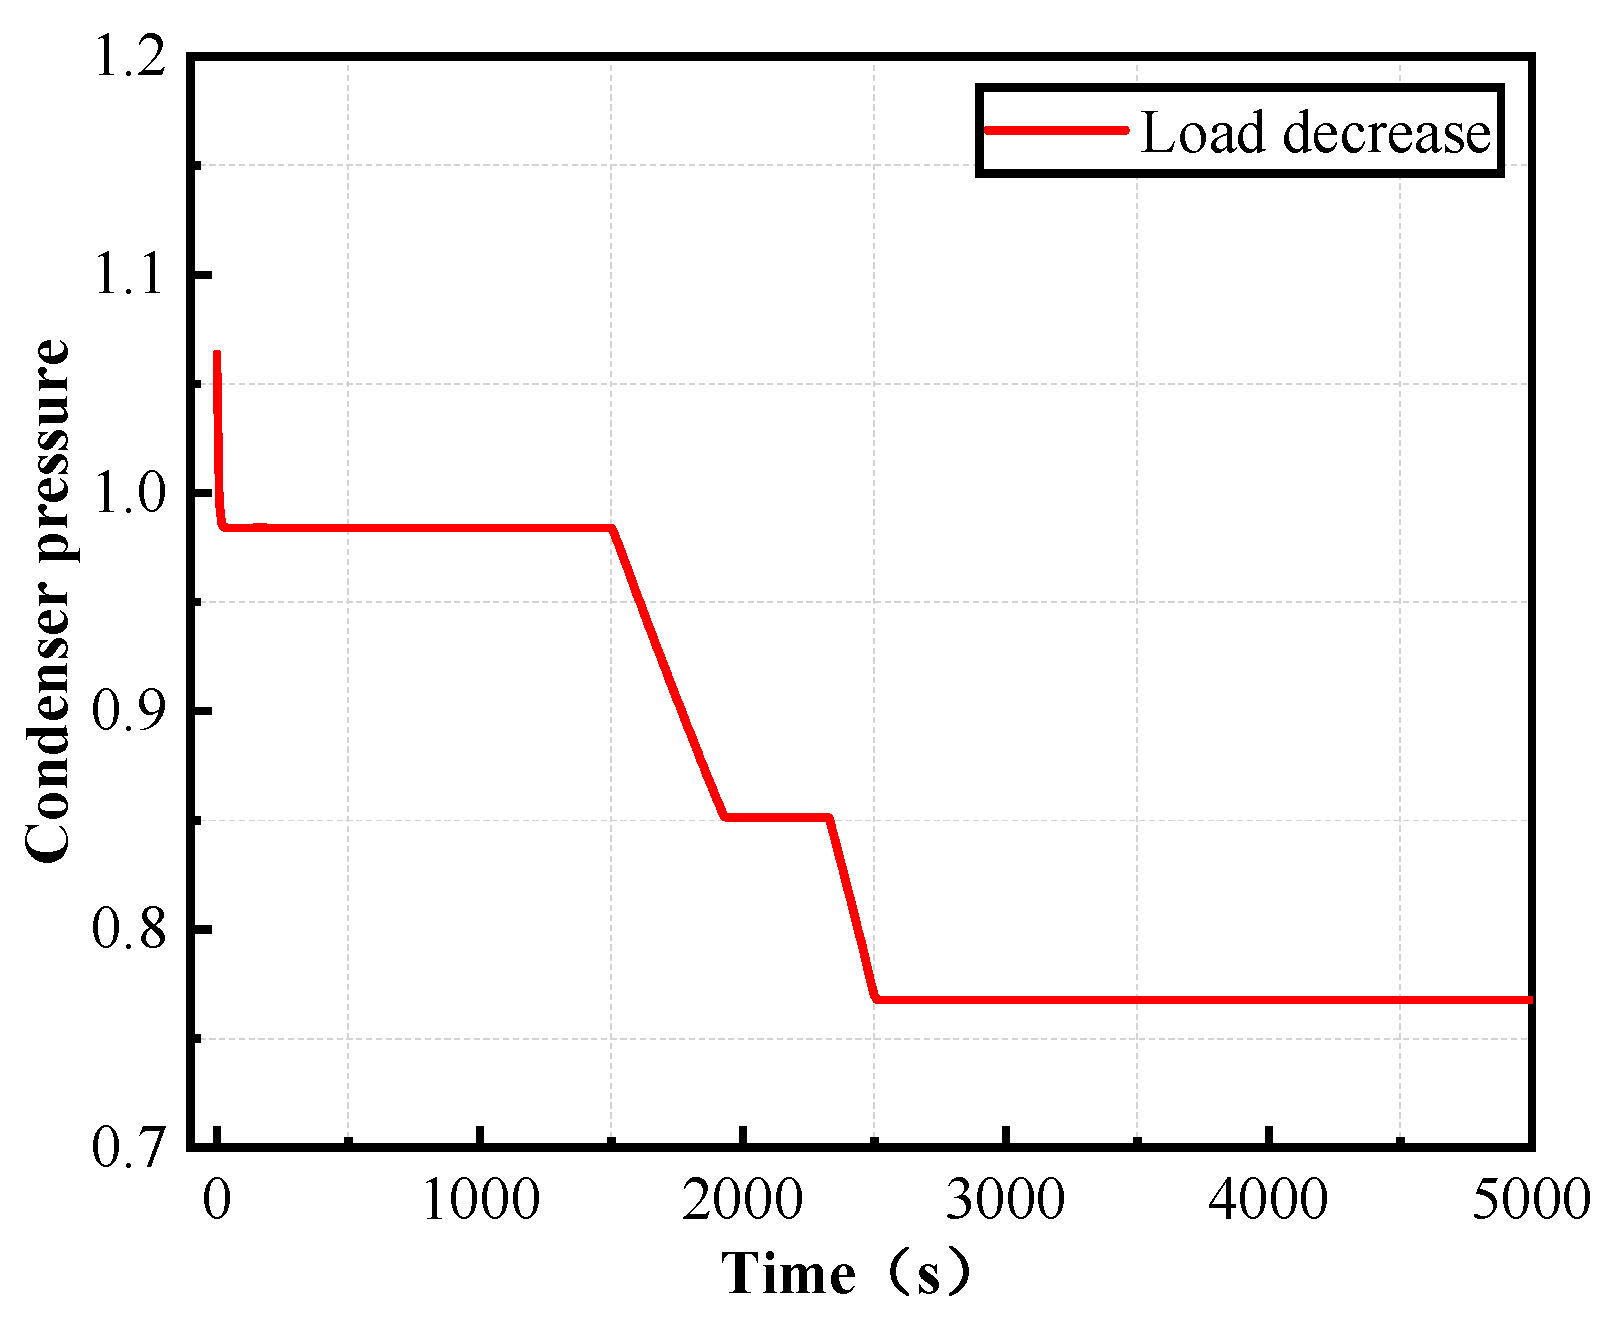
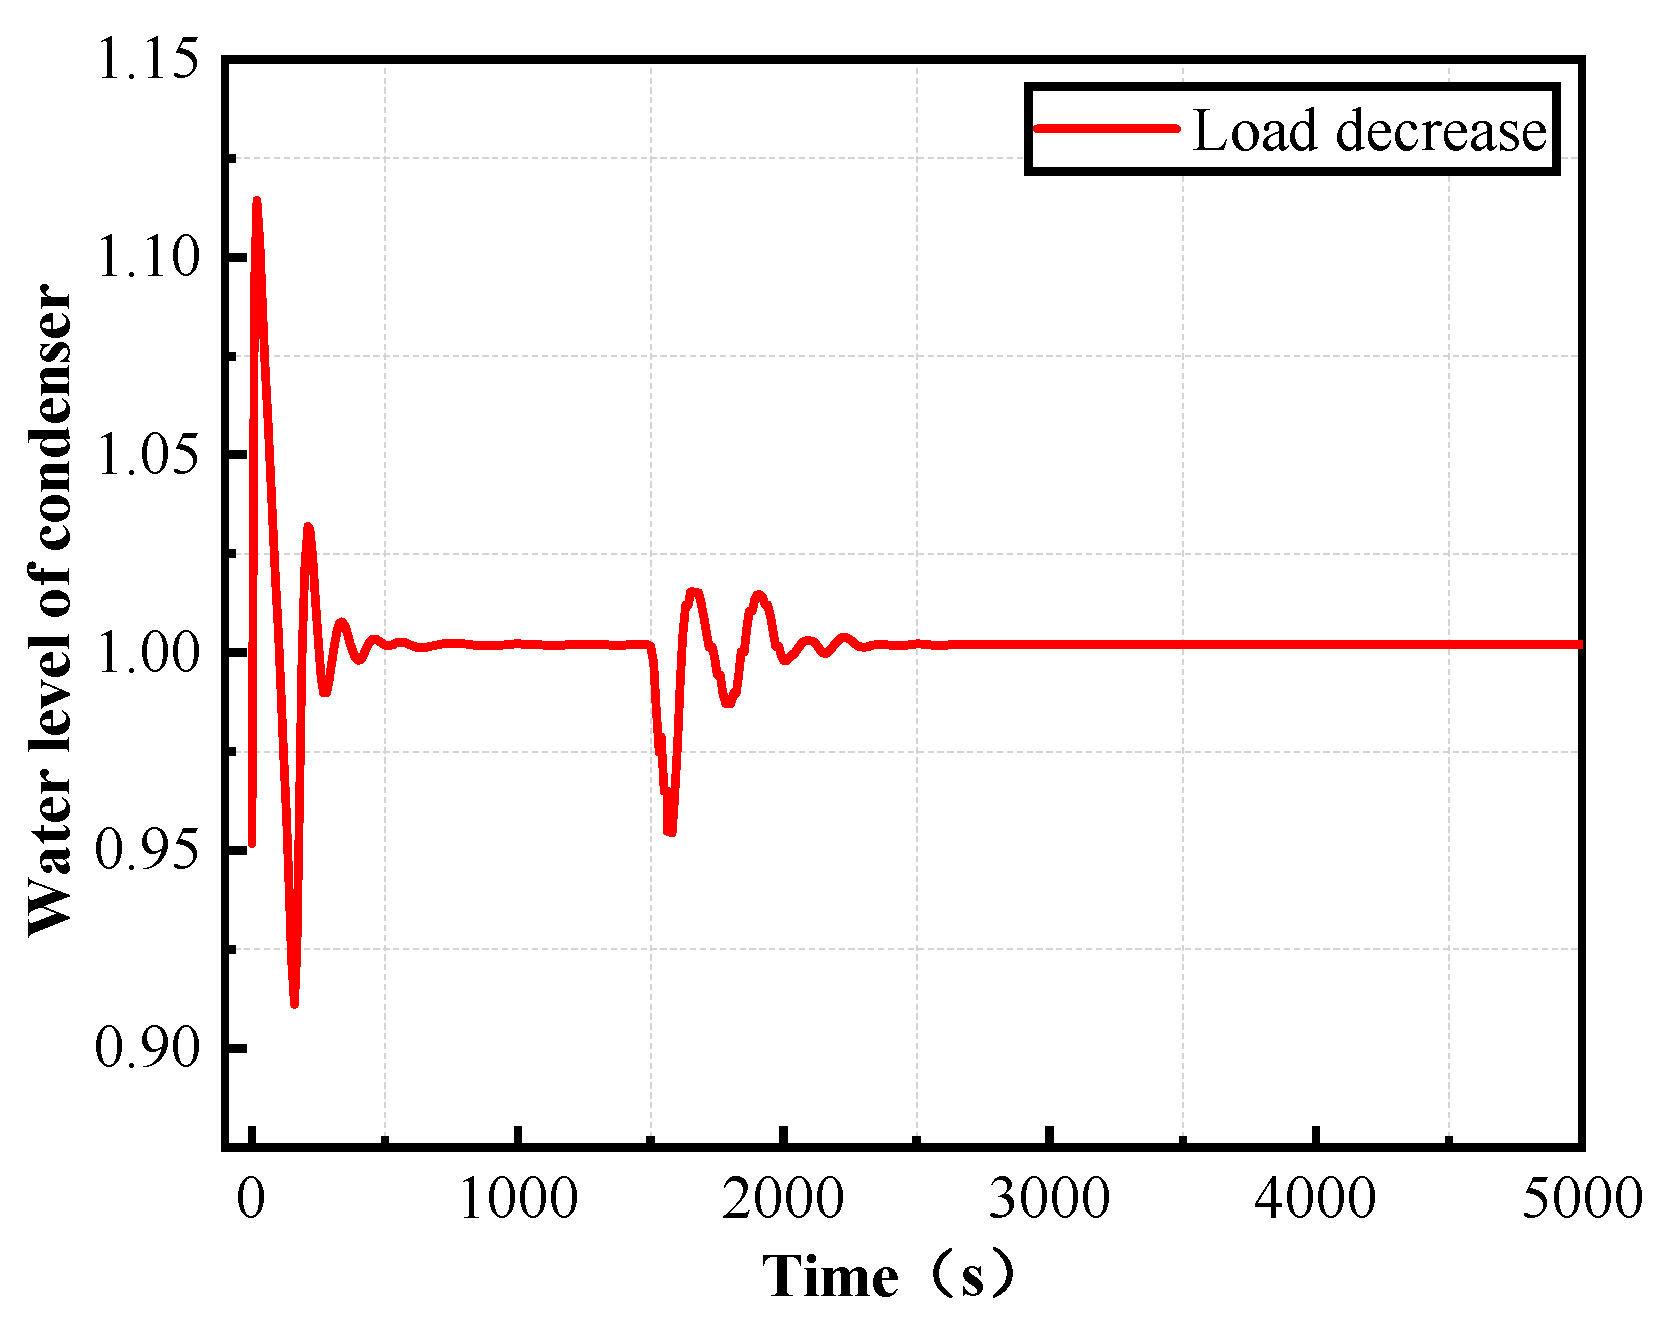
As can be seen in
Figure 14,
Figure 15,
Figure 16 and
Figure 17, when the working condition of the steam turbine changes from 100% to 70%, the turbine’s steam consumption is reduced due to the reduction of the load of the steam turbine. The reduction in steam flow will result in a significant reduction in the amount steam in the condenser, thus reducing the water level in the condenser. As the flow of cooling water is sufficient, the pressure in the condenser will also be reduced, so the vacuum degree of the condenser will rise rapidly in a short time. As the amount of superheated steam decreases, the water level in the boiler will rise. As a result, the flow of feed water passing through the deaerator into the boiler will be reduced, leading to the increase in the water level inside of the deaerator.
4.1.2. Dynamic Characteristic Analysis of Marine Power System Load Increase
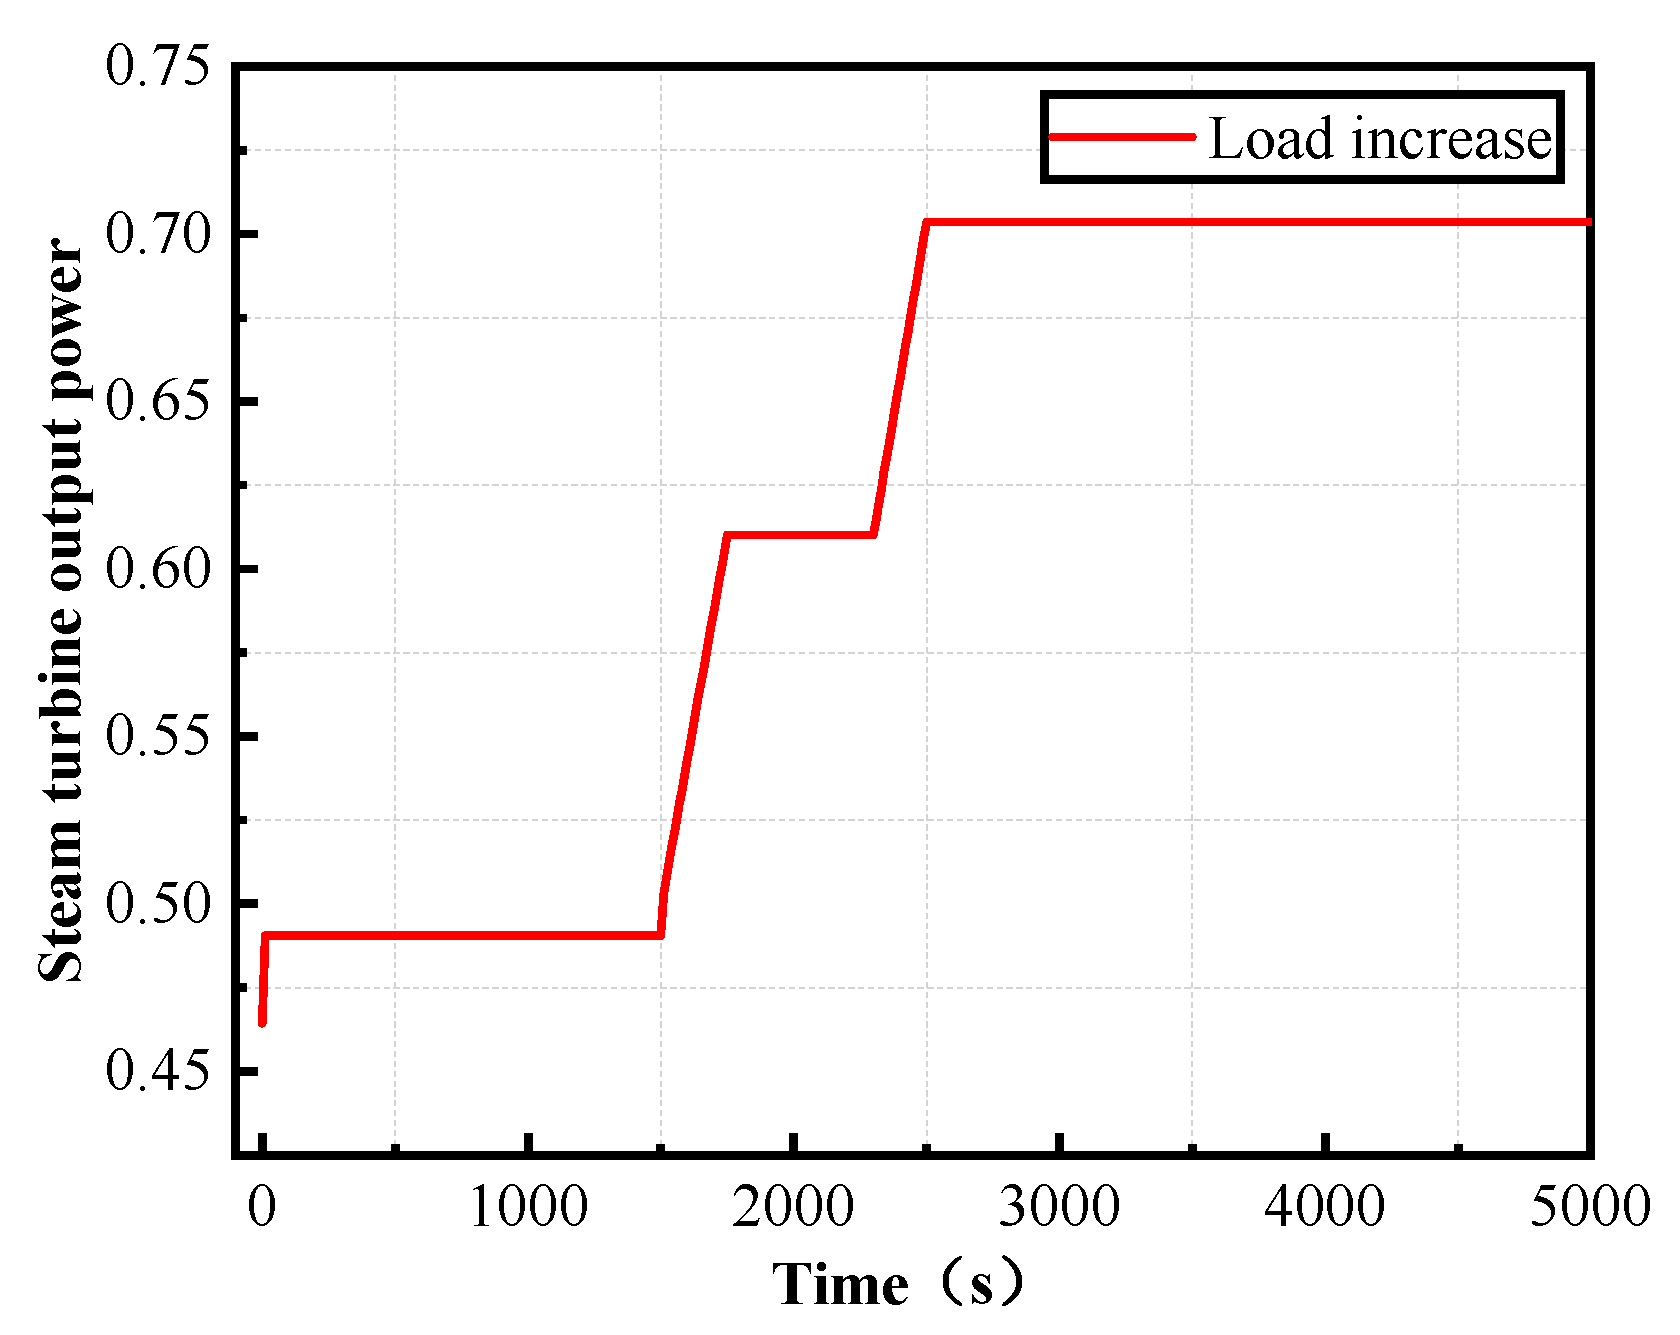
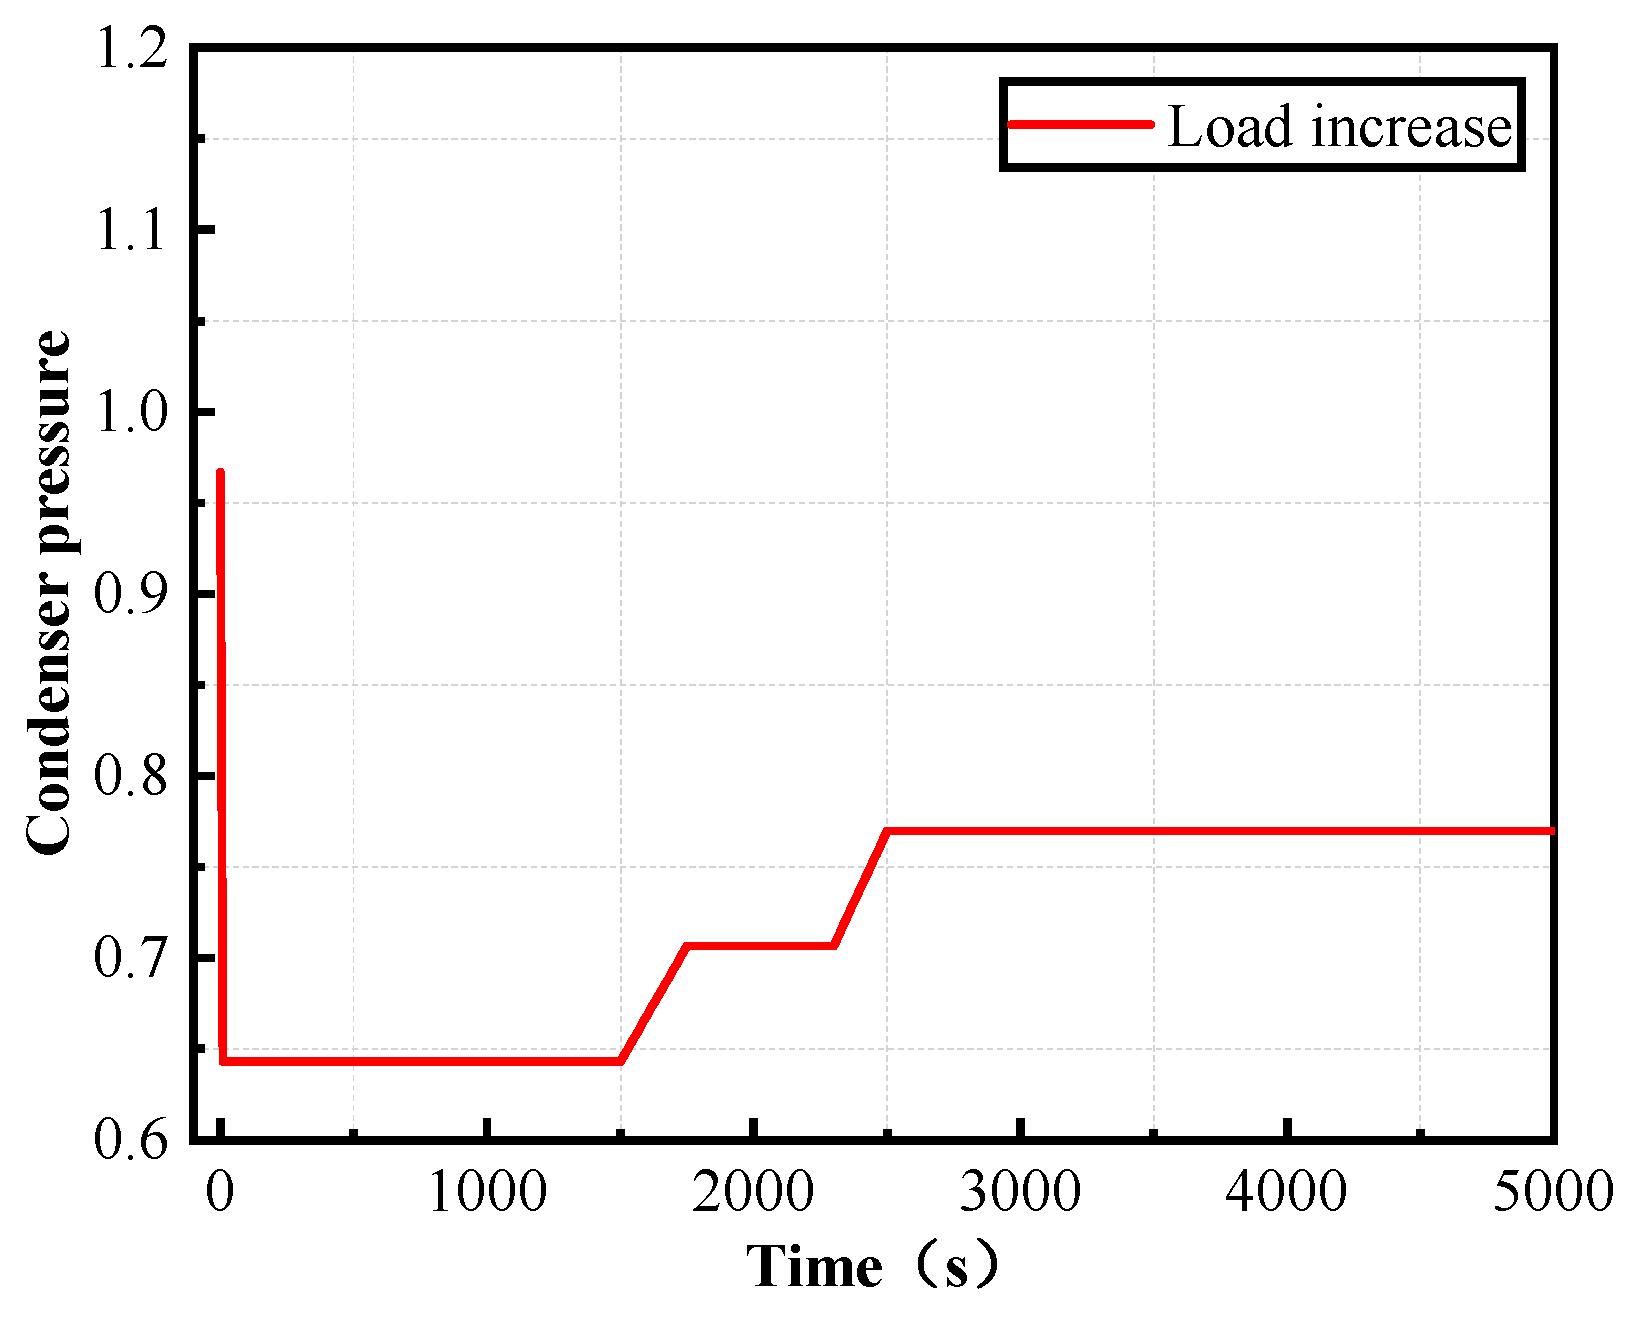
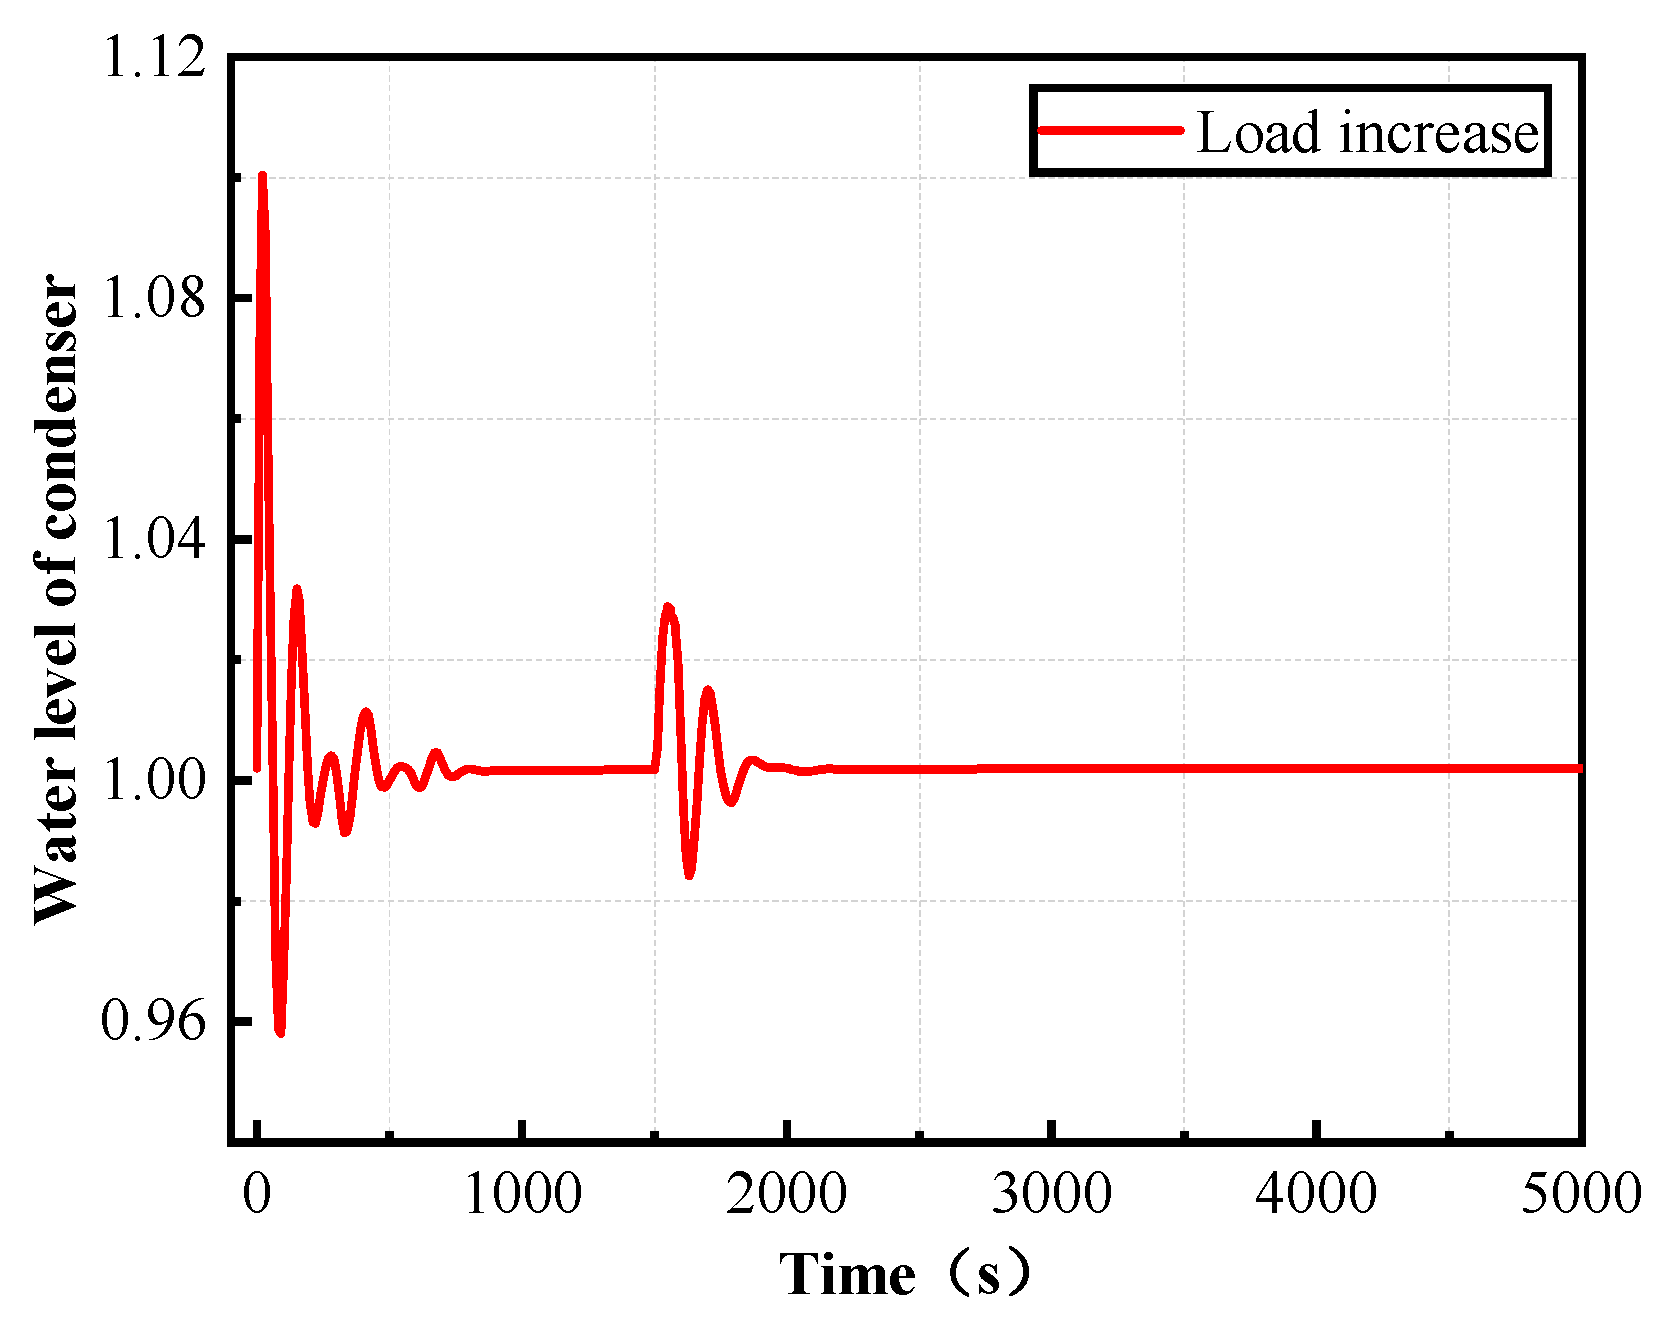
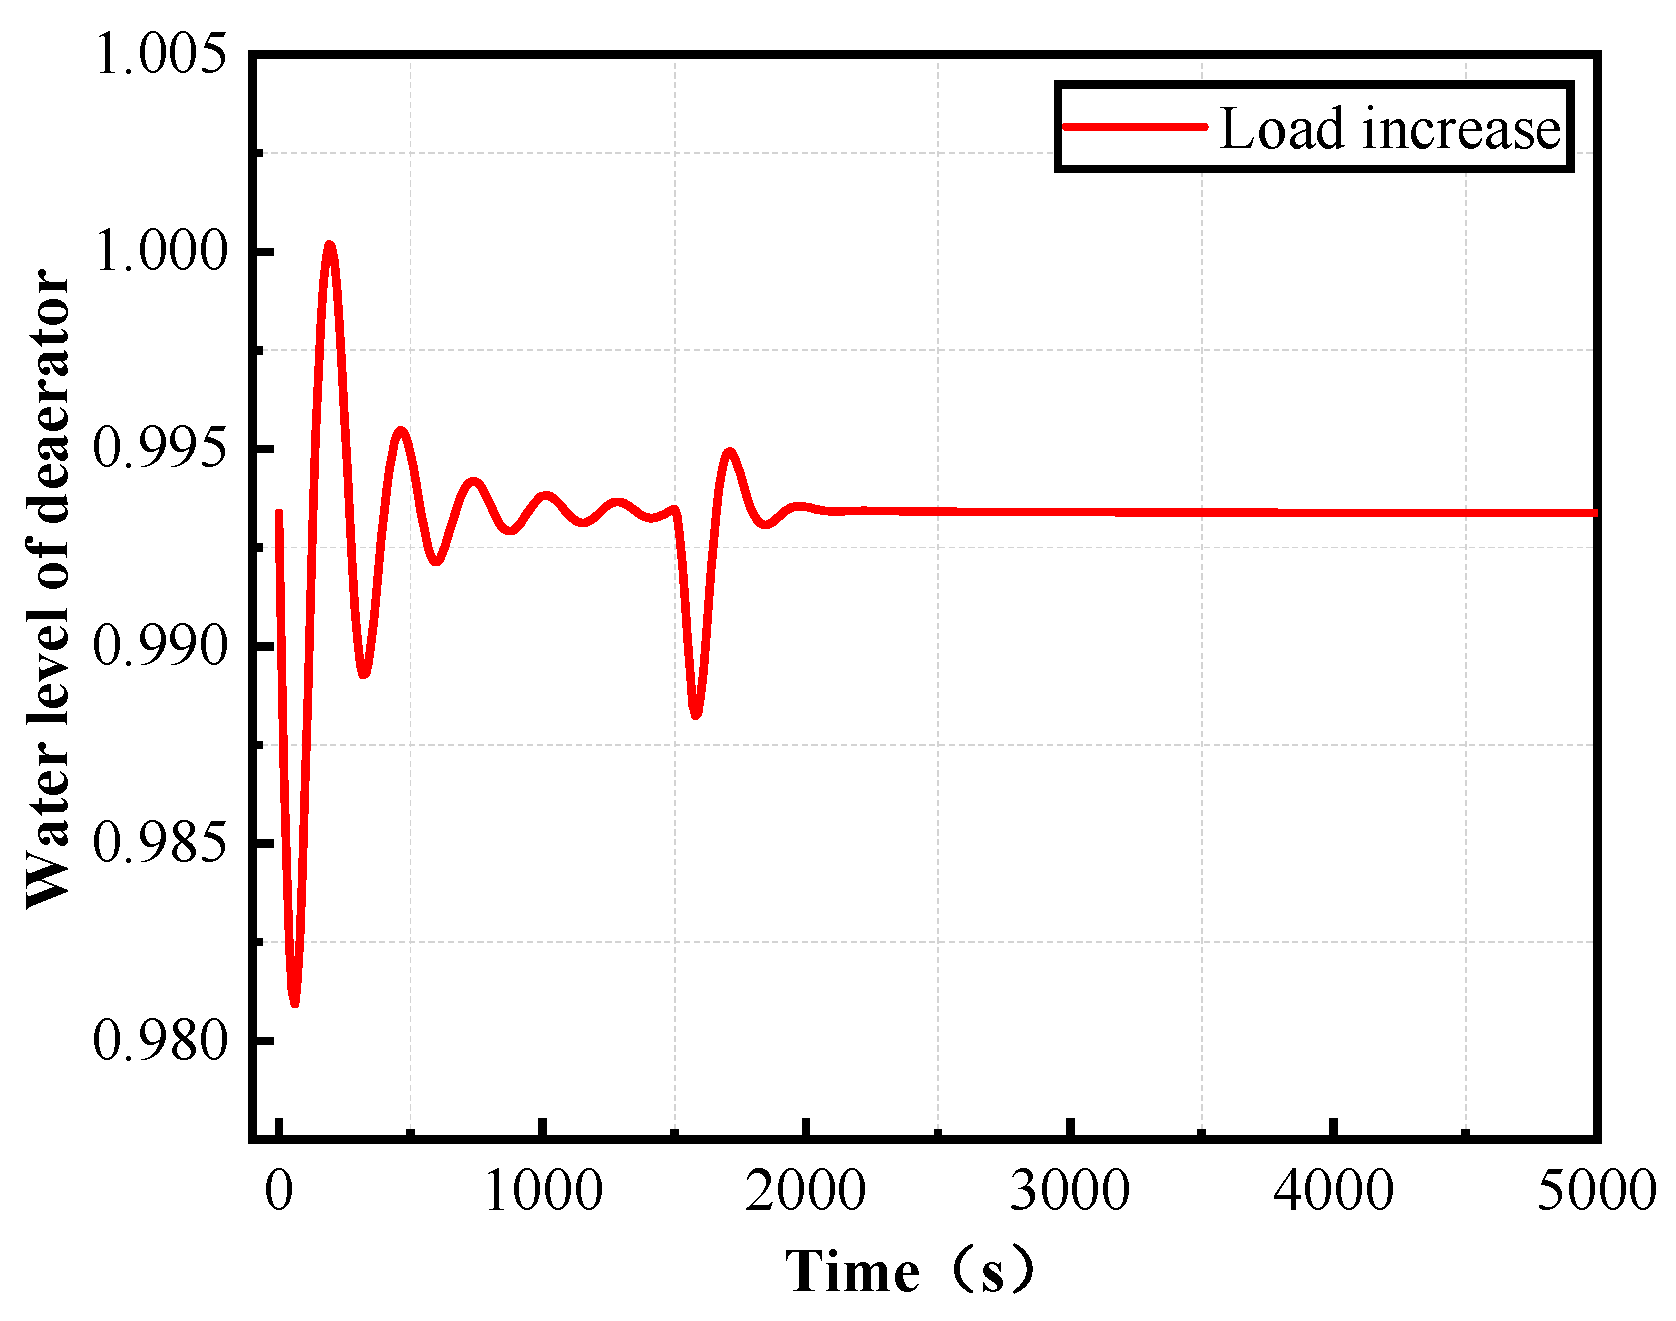
As can be seen from
Figure 18,
Figure 19,
Figure 20 and
Figure 21, when the working condition of the steam turbine changes from 50% to 70%, the steam consumption of the turbine increases and the flow of cooling water sufficient to absorb the heat from the steam turbine exhaust, so the pressure in the condenser increases, and the water level in the condenser will also rise with the increase of the condensed steam. The increasing amount the superheated steam will also lead to the decrease in the water level in the boiler. As a result, the flow of feed water from the deaerator into the boiler will increase, leading to a decrease in the water level in the deaerator.
4.2. Dynamic Response of the System under Different Cooling Conditions
(1) Increase or decrease of cooling water flow
In order to master the influence of different cooling water flows on the steam power system, the digital model of the marine steam power system is used to analyze the changes in its parameters for different flow rates of the cooling water. The changes in the parameters are shown in
Table 4.
It can be seen from
Table 4 that, when the inlet temperature of the cooling water is constant, the condenser pressure decreases with the increase of the cooling water flow and increases with the decrease of the cooling water flow. The power increment of the steam turbine increases with the increase of the cooling water flow and decreases with the decrease of the cooling water flow.
(2) Increase or decrease in cooling water temperature
In order to master the influence of different cooling water temperatures on the steam power system, the digital model of the marine steam power system is used to analyze the changes in the parameters at different inlet temperature of the cooling water. The changes in the parameters are shown in the
Table 5.
It can be seen from
Table 5 that, when the relative flow of cooling water is constant, the condenser pressure increases with the increase of the cooling water inlet temperature and decreases with the decrease of the cooling water inlet temperature. The power increment of steam turbine decreases with the increase of cooling water inlet temperature, and increases with the decrease of cooling water inlet temperature.
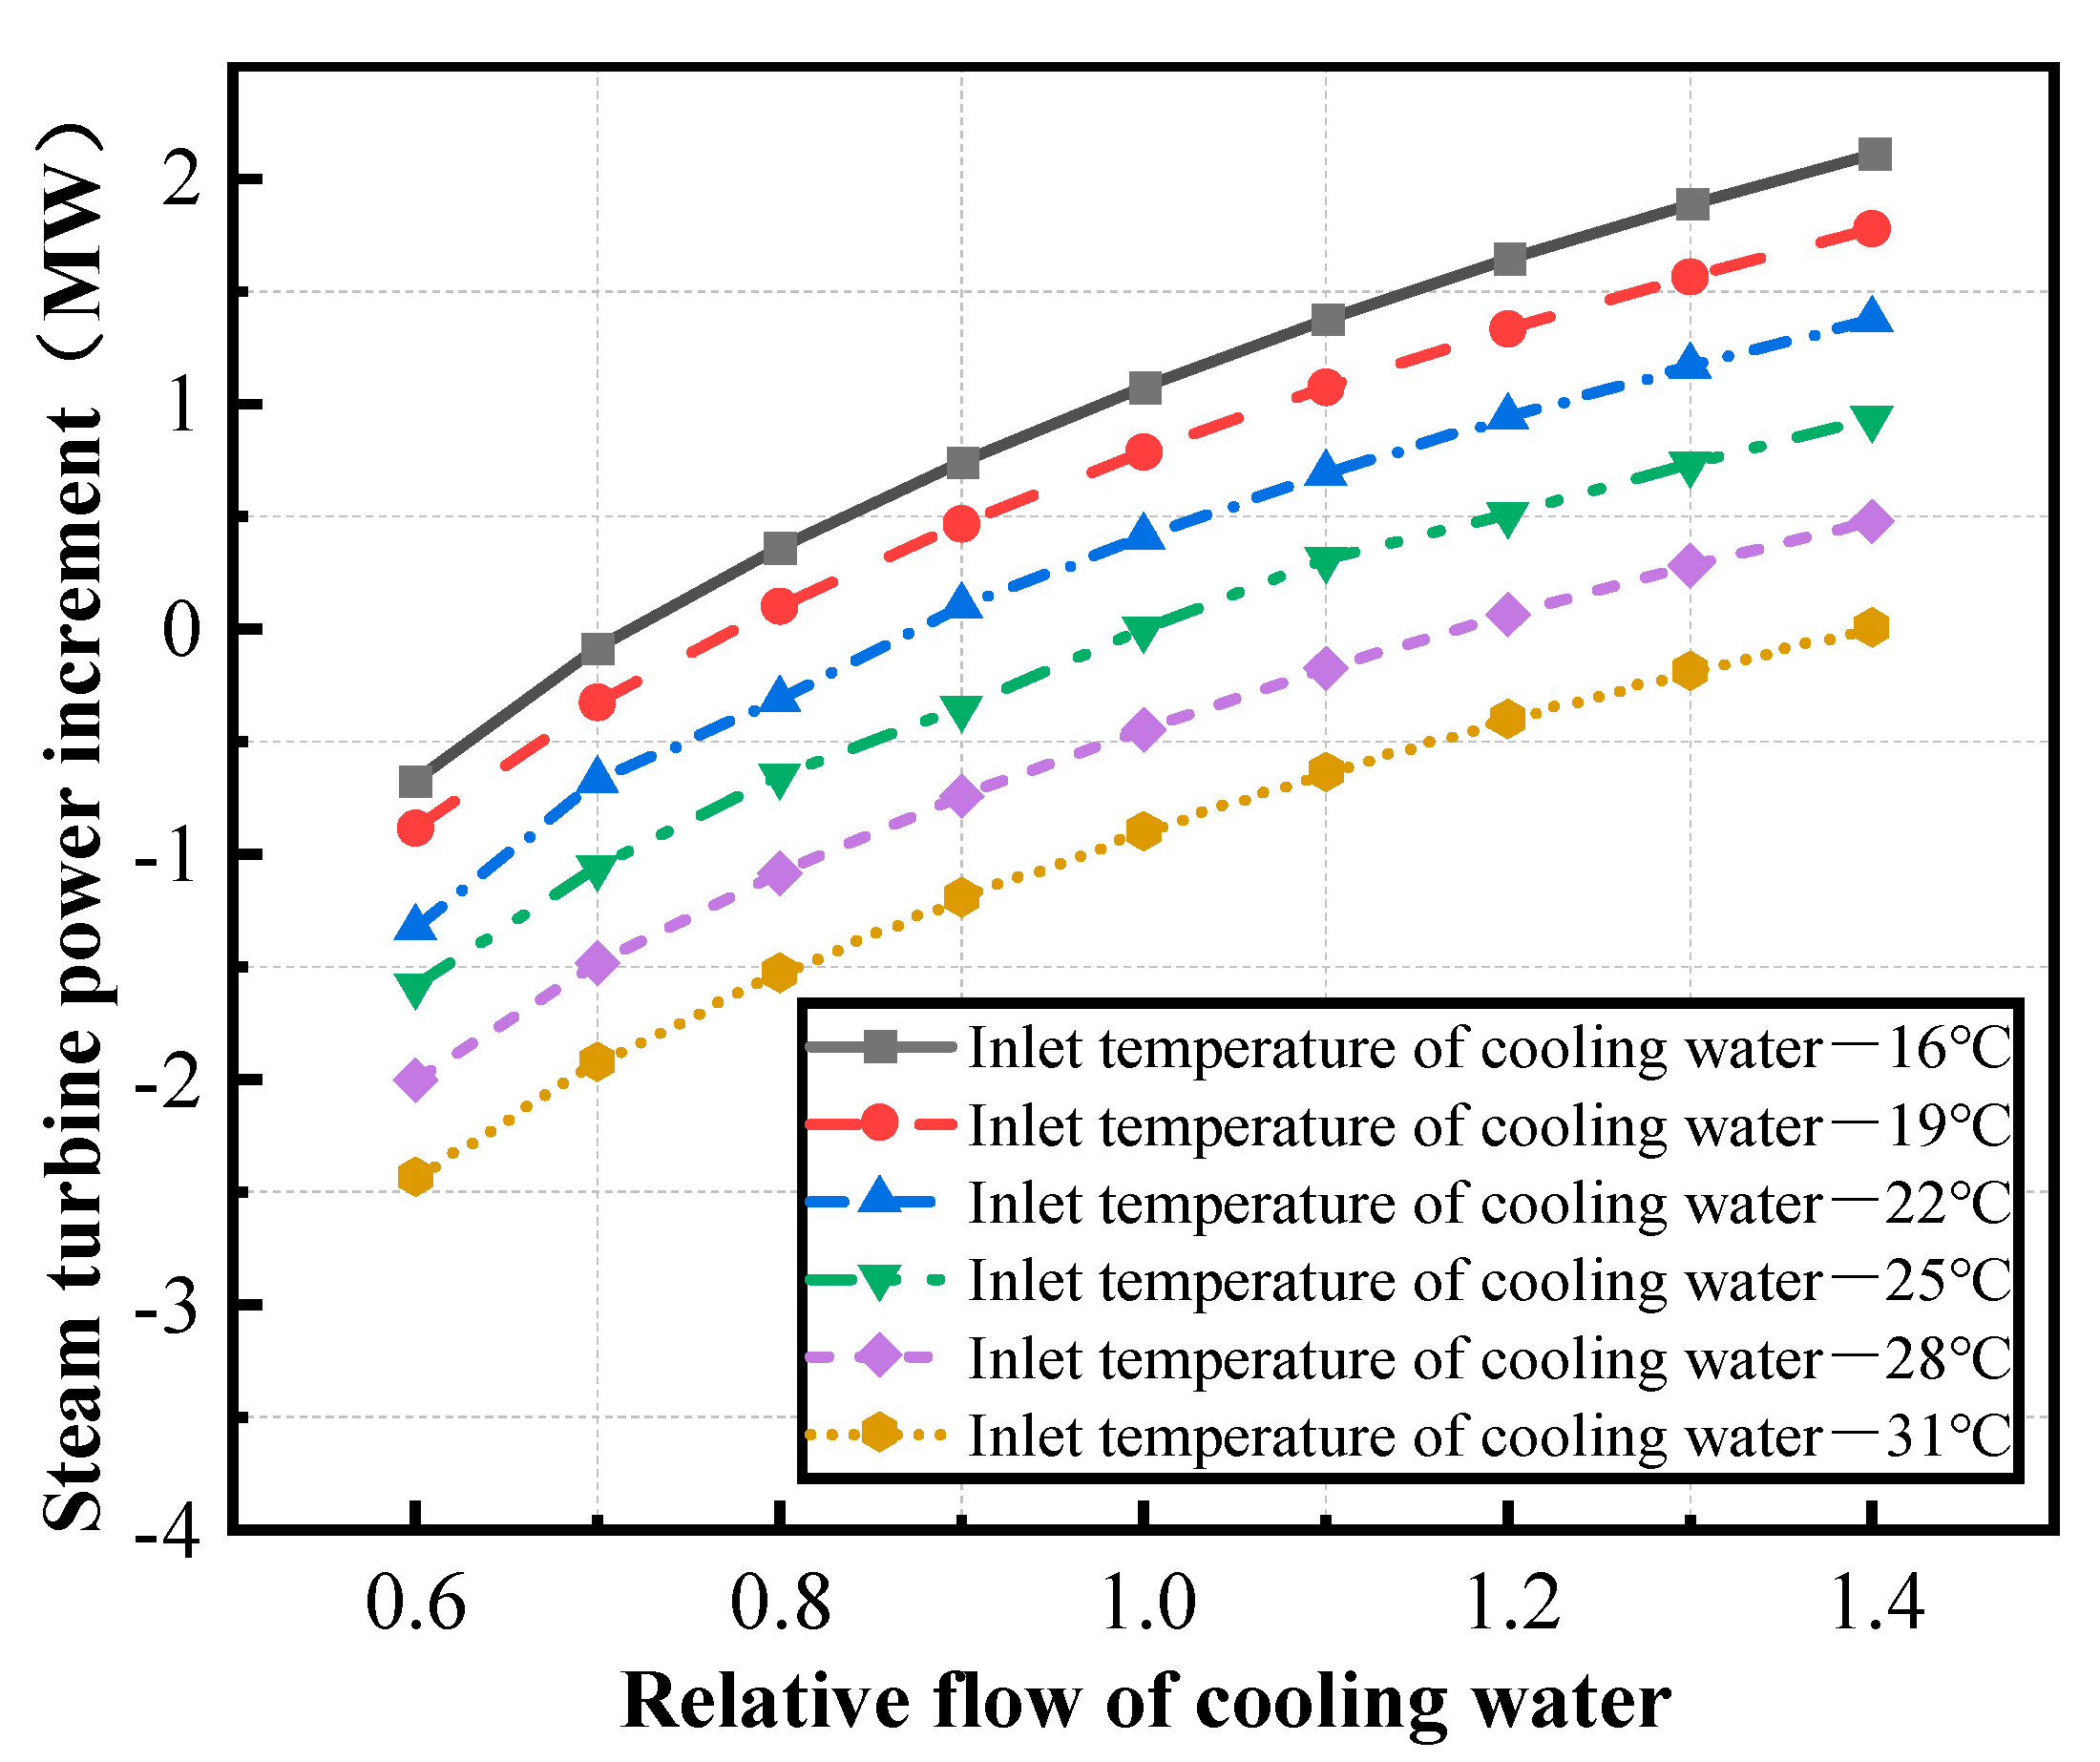
According to the state parameters of each piece of thermal equipment, the relationship curves between the cooling water flow, the temperature and the power increment of the steam turbine, and the relationship curves between the cooling water flow, the temperature and the condenser pressure are drawn as shown in
Figure 22 and
Figure 23.
It can be seen from
Figure 22 that the relation between the cooling water flow and the condenser pressure increment is as follows:
- (1)
When the relative flow of cooling water gradually increases, it can be seen from the heat transfer calculation formula that the total heat transfer coefficient of the condenser will increase, the heat transfer end difference will decrease, and the heat transfer performance of the condenser will improve, so that the condenser pressure will decrease, the vacuum degree will increase, and the heat cycle efficiency will increase, thus increasing the power of the main turbine. However, with the increase of the flow, the change range of the condenser pressure will gradually slow down [
17];
- (2)
When the relative flow of the circulating cooling water decreases gradually, the cooling water flow rate also decreases, the total heat transfer coefficient of the condenser decreases, the heat transfer end difference increases, the heat transfer performance of the condenser decreases, the condenser pressure increases gradually, the vacuum degree decreases, the thermal cycle efficiency decreases, and the steam turbine power decreases.
It can be seen from
Figure 23 that the relation between cooling water inlet temperature and condenser pressure increment is as follows:
- (1)
When the inlet temperature of the circulating cooling water increases gradually, the heat exchange capacity of the cooling water decreases, the pressure in the condenser increases gradually, the vacuum degree decreases, the thermal cycle efficiency decreases, and the power of steam turbine decreases accordingly;
- (2)
When the inlet temperature of the circulating cooling water decreases gradually, the heat exchange capacity of the cooling water increases, the pressure in the condenser decreases gradually, the vacuum degree increases, the thermal cycle efficiency increases, and the power of the steam turbine increases accordingly.
Through the dynamic response of the digital model under different cooling conditions, it can be concluded that increasing the flow of the circulating cooling water can improve the heat transfer performance of the condenser, thereby reducing the condenser pressure, improving the condenser vacuum degree and the steam power cycle efficiency, and thus increasing the power of the main turbine. With the gradual increase of the cooling water flow, the condenser pressure and the power of the main turbine are still limited, and increasing the cooling water flow will also increase the output power of the circulating water pump. If the horsepower of the water pump increases, the power consumed is greater than the increment of the power of the main turbine, which is often not worth the loss. Therefore, when the marine vessel is performing tasks, the flow of the circulating cooling water should be dynamically adjusted according to the sea water temperature to ensure that the condenser maintains the best vacuum degree and maximizes the efficiency of the turbine.
In conclusion, the dynamic response of the system under different cooling conditions is analyzed using the digital model of the marine steam power system. The results show that the model can accurately reflect changes in the system’s state parameters, realize the virtual reality mapping between the digital model and the physical equipment, and provide guidance for the safe and stable operation of the marine steam power system under different cooling conditions.
5. Fault Simulation Analysis of Marine Steam Power System Based on Digital Model
A large number of data signals, such as flow, temperature, pressure, power and speed, are generated during the operation of the marine steam power system. These data signals reflect the operating characteristics and performance degradation laws of the thermal equipment. Nonetheless, it is still difficult to obtain data for each fault sample in the whole life cycle of the equipment. Especially for the multi-domain coupled marine system, due to the lack of fault sample data, it is not possible to accurately analyze the degradation law of equipment performance, nor to accurately achieve fault diagnosis and prediction.
However, fault simulation and prediction under the framework of digital twin technology can overcome the problem of obtaining fault sample data. It builds a high-precision digital simulation model of physical entities, optimizes and solves the simulation model by relying on online monitoring, data analysis, fault prediction, life-cycle management, etc., and feeds back the simulation results to physical objects, so as to optimize and make decisions for physical objects. Relying on digital twin technology, fault simulation and prediction based on high-precision digital models can effectively realize the reverse mapping of digital models to physical equipment. The digital model can train the model using the fault sample data to lay the foundation for subsequent fault diagnoses. It can also inject fault points, and, through the dynamic analysis of fault behavior, grasp the law of performance degradation. The fault diagnosis process is shown in
Figure 24.
As can be seen from
Figure 24, which shows the fault diagnosis process for the marine steam power system based on a digital model, using the digital model to simulate equipment faults and extract fault data is the most important step in establishing a fault database and is also the basis for realizing fault diagnoses. Therefore, this section takes the marine condensate feed water system as an example, and, making full use of the advantages of its digital model, inserts fault points on the basis of the digital model, conducts a quantitative analysis of the main fault types of the thermal equipment in the condensate feed water system, and uses the model to accurately describe the actual fault status, so as to realize the monitoring and early warning of faults by the digital model. On the one hand, this provides targeted measures to guide the safe and stable operation of marine vessel; on the other hand, it realizes the reverse mapping of digital models to physical equipment, which is also one of the important components of digital twin technology.
As an important auxiliary system in the marine steam power system, the condensate feed water system and its operational reliability directly affect the whole power system. Influenced by complexity, randomness, dynamics and other factors, the condensate feed water system will also encounter various abnormal conditions in its operation. For each type of thermal equipment failure, accurate and effective measures need to be taken to regulate it. If this is not handled properly, frequent accidents will occur, causing equipment damage or unit shutdown. According to thermal calculations and on-site operating experience, the main causes of the failure of the condensate feed water system are water level regulation failure, the vacuum system not being tight, abnormal operation of the steam jet ejector, failure of the circulating water pump, reduction of the circulating water flow, a rise in the temperature of the cooling water, blockage of a cooling pipe, excessive steam exhaust in the steam turbine, etc. [
18]. The main faults of the condensate feed water system are systematically analyzed below.
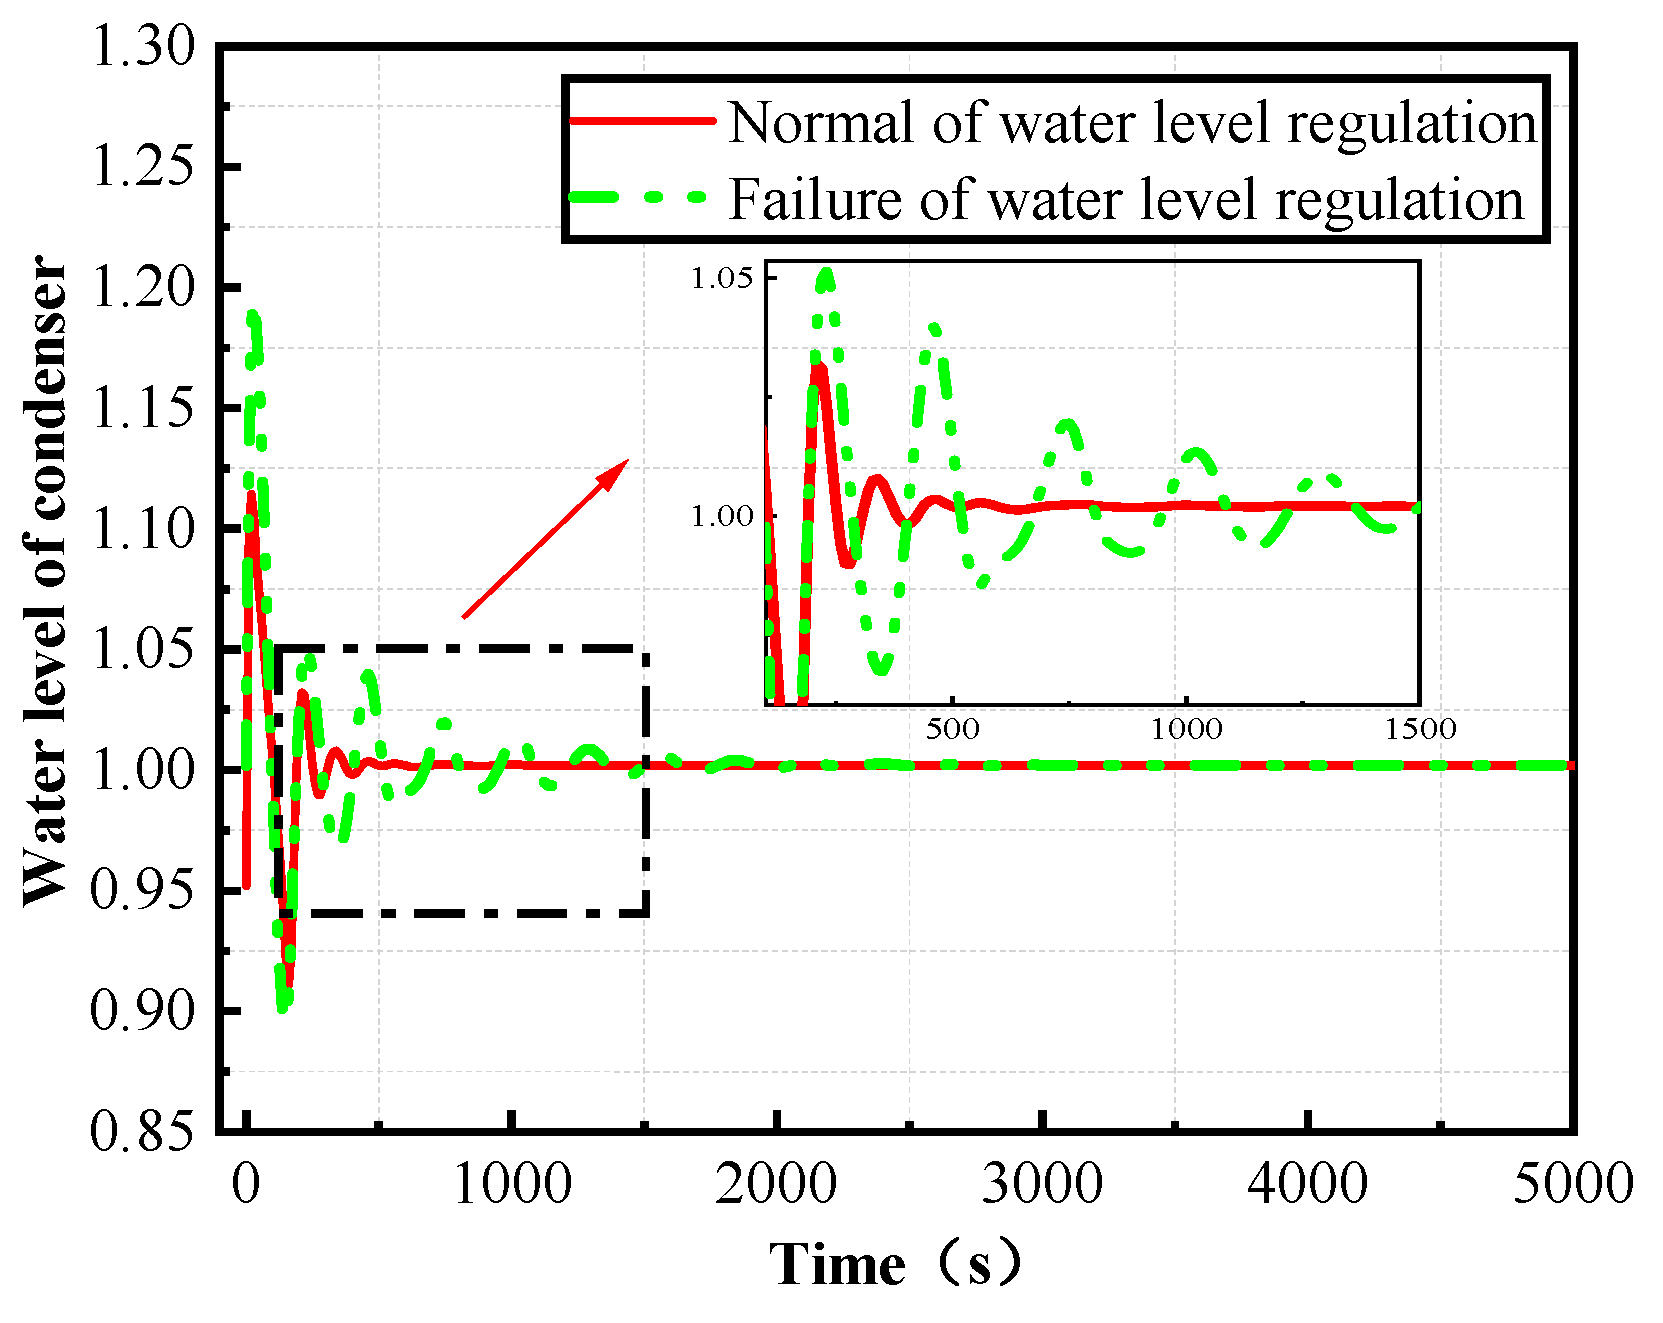
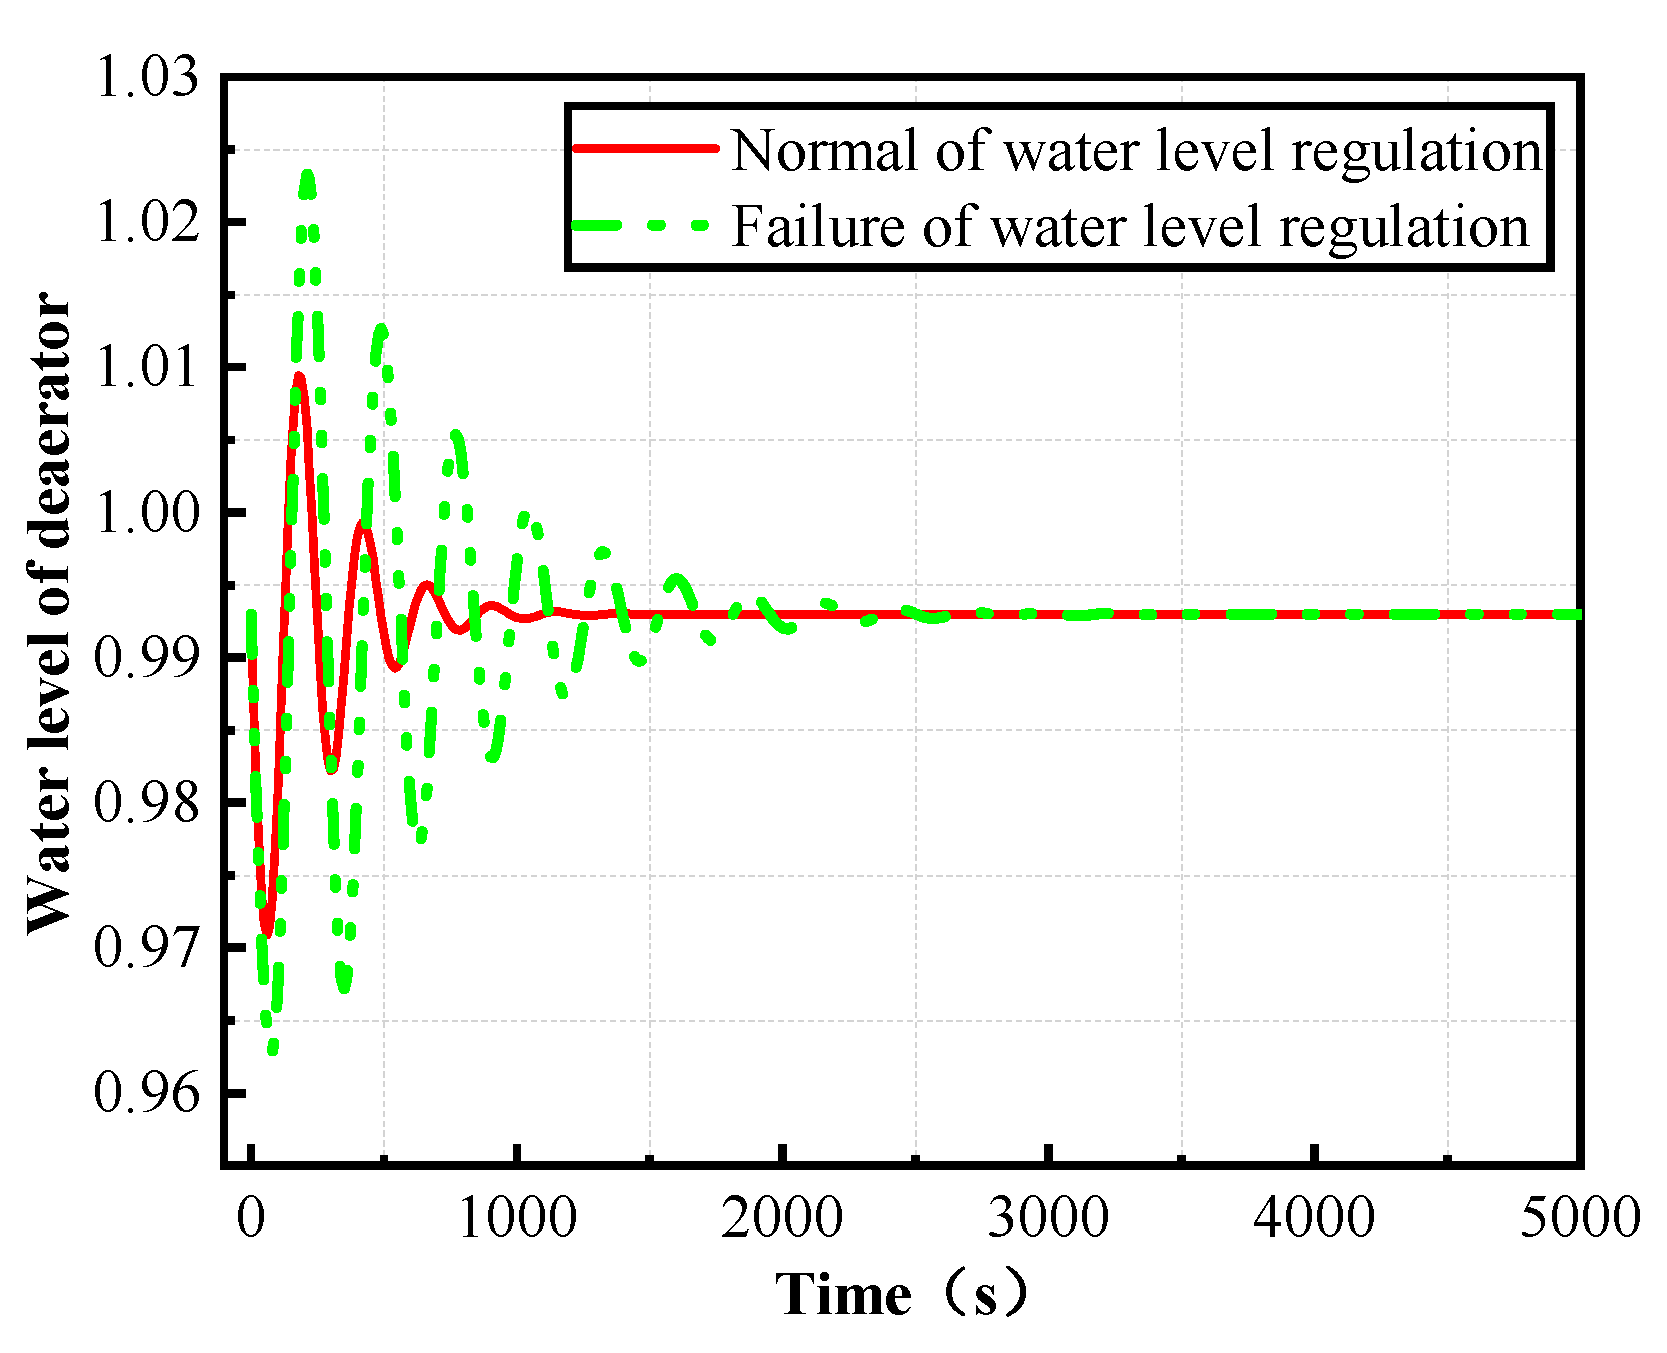
(1) Failure of water level regulation
The regulation of the water levels in the condenser and deaerator, which plays an important role in the safe and stable operation of the condensate feed water system, mainly involves the marine condensate feed water system. If the water level in the condenser is too high, the cooling effect will be weakened and the vacuum degree of the unit will drop, and, if the water level is too low, cavitation of the condensate pump will occur, affecting the safety of the unit. Too high a water level in the deaerator will cause unstable pressure in the deaerator and affect the deaerating effect. Too low a water level will reduce the inlet pressure of the feed pump and cause cavitation of the pump, which will damage the feed pump in serious cases.
Therefore, based on the digital model, a fault simulation study is carried out on the water level regulation failure of the condensate feed water system, and a quantitative analysis is made on the change rule of the main parameters of the system caused by the water level regulation failure. The influence of water level regulation failure on the main state parameters of the condensate feed water system is shown in
Figure 25,
Figure 26,
Figure 27 and
Figure 28.
Through a quantitative simulation study of the failure of water level regulation in the condensate feed water system, it can be seen that, when the water level regulation is sluggish, the water level in the condenser and deaerator fluctuates continuously, thus causing the fluctuation of the condenser pressure and the turbine output power. If the water level regulation is sluggish for a longer time, or even fails, the safety and stability of the condensate feed water system will be greatly affected. Therefore, attention must be paid to water level regulation during steam turbine operation to avoid failure.
(2) Air leakage of the condenser vacuum system
During the operation of the condenser, air will inevitably leak in. It is precisely because the air extractor can draw out non-condensable gas from the condenser that the condenser can maintain a good vacuum. When the working state of the air extractor remains unchanged and the amount of air leaking in increases, the proportion of air in the condenser will increase.
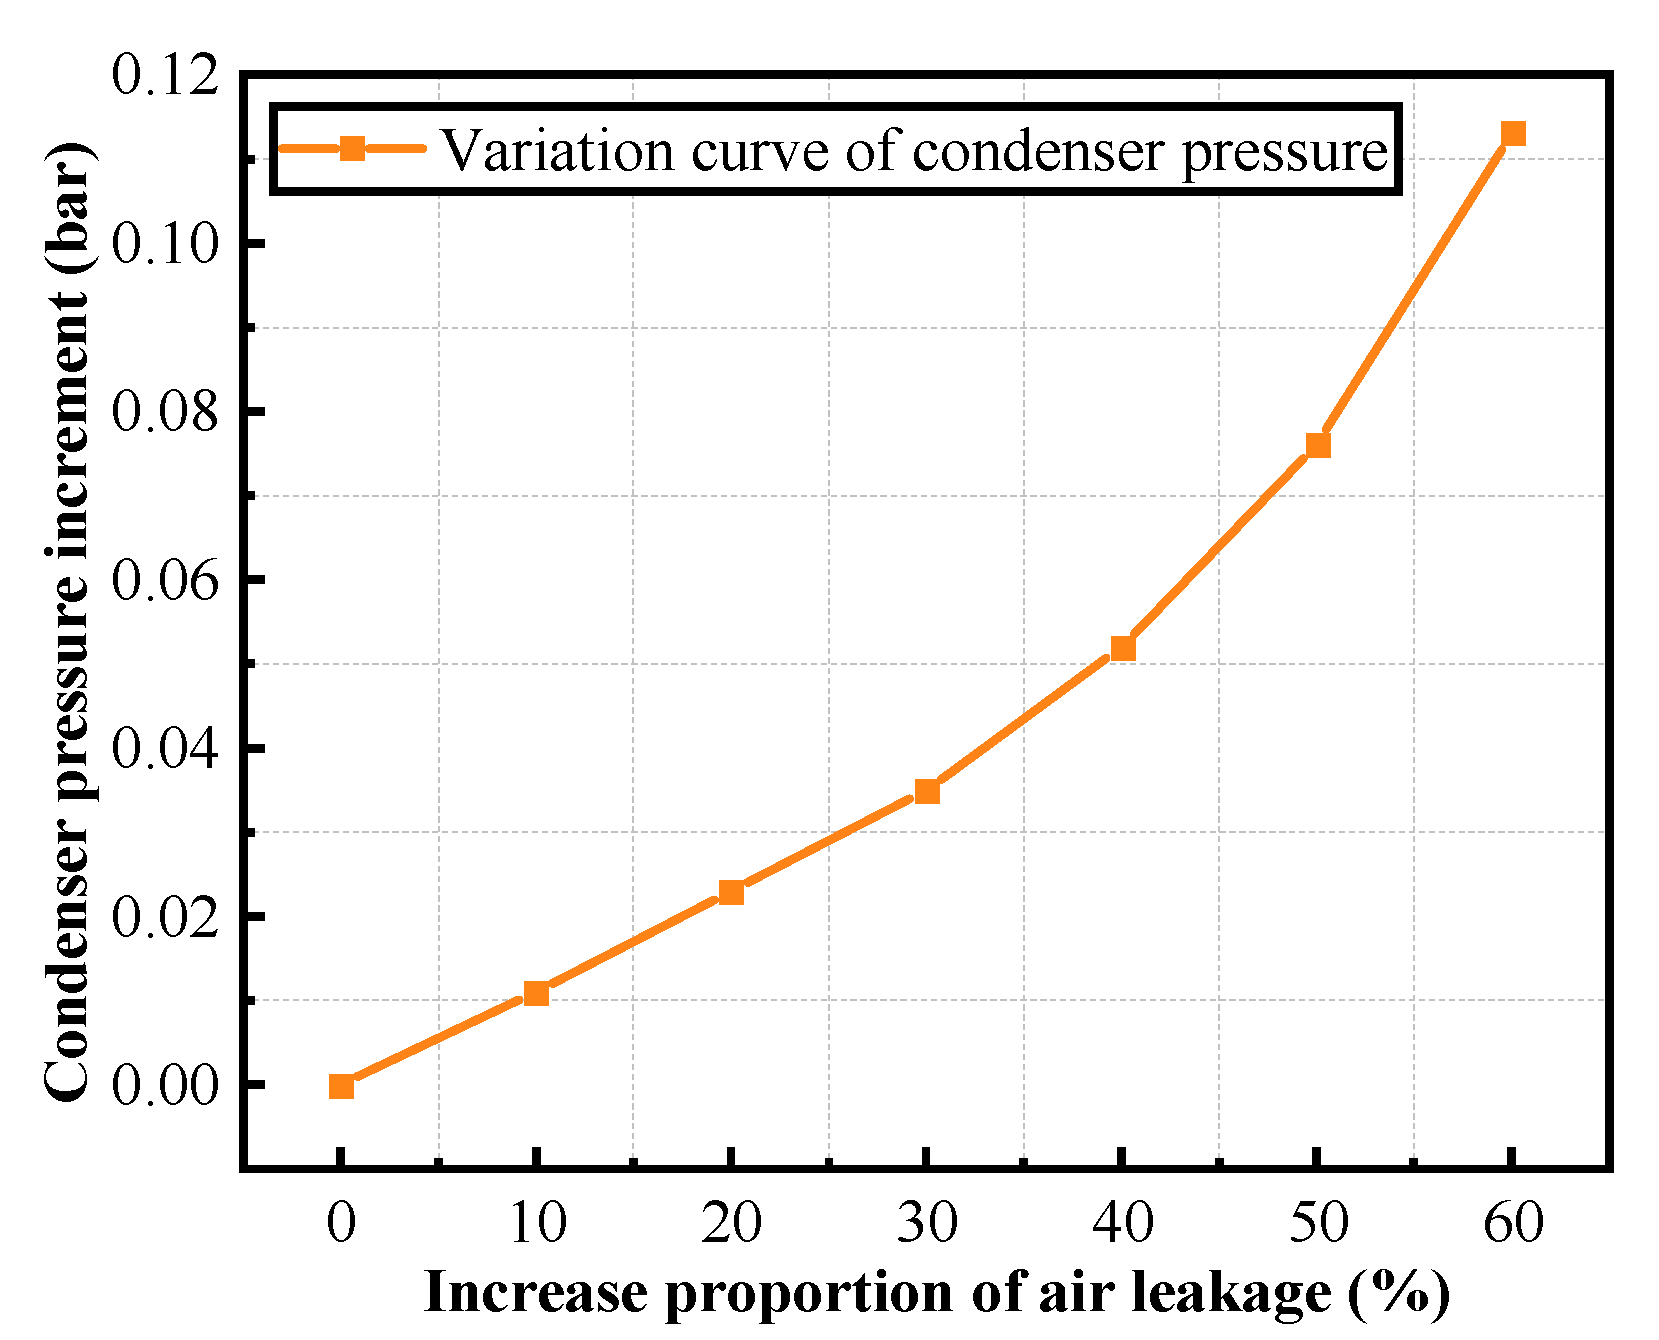
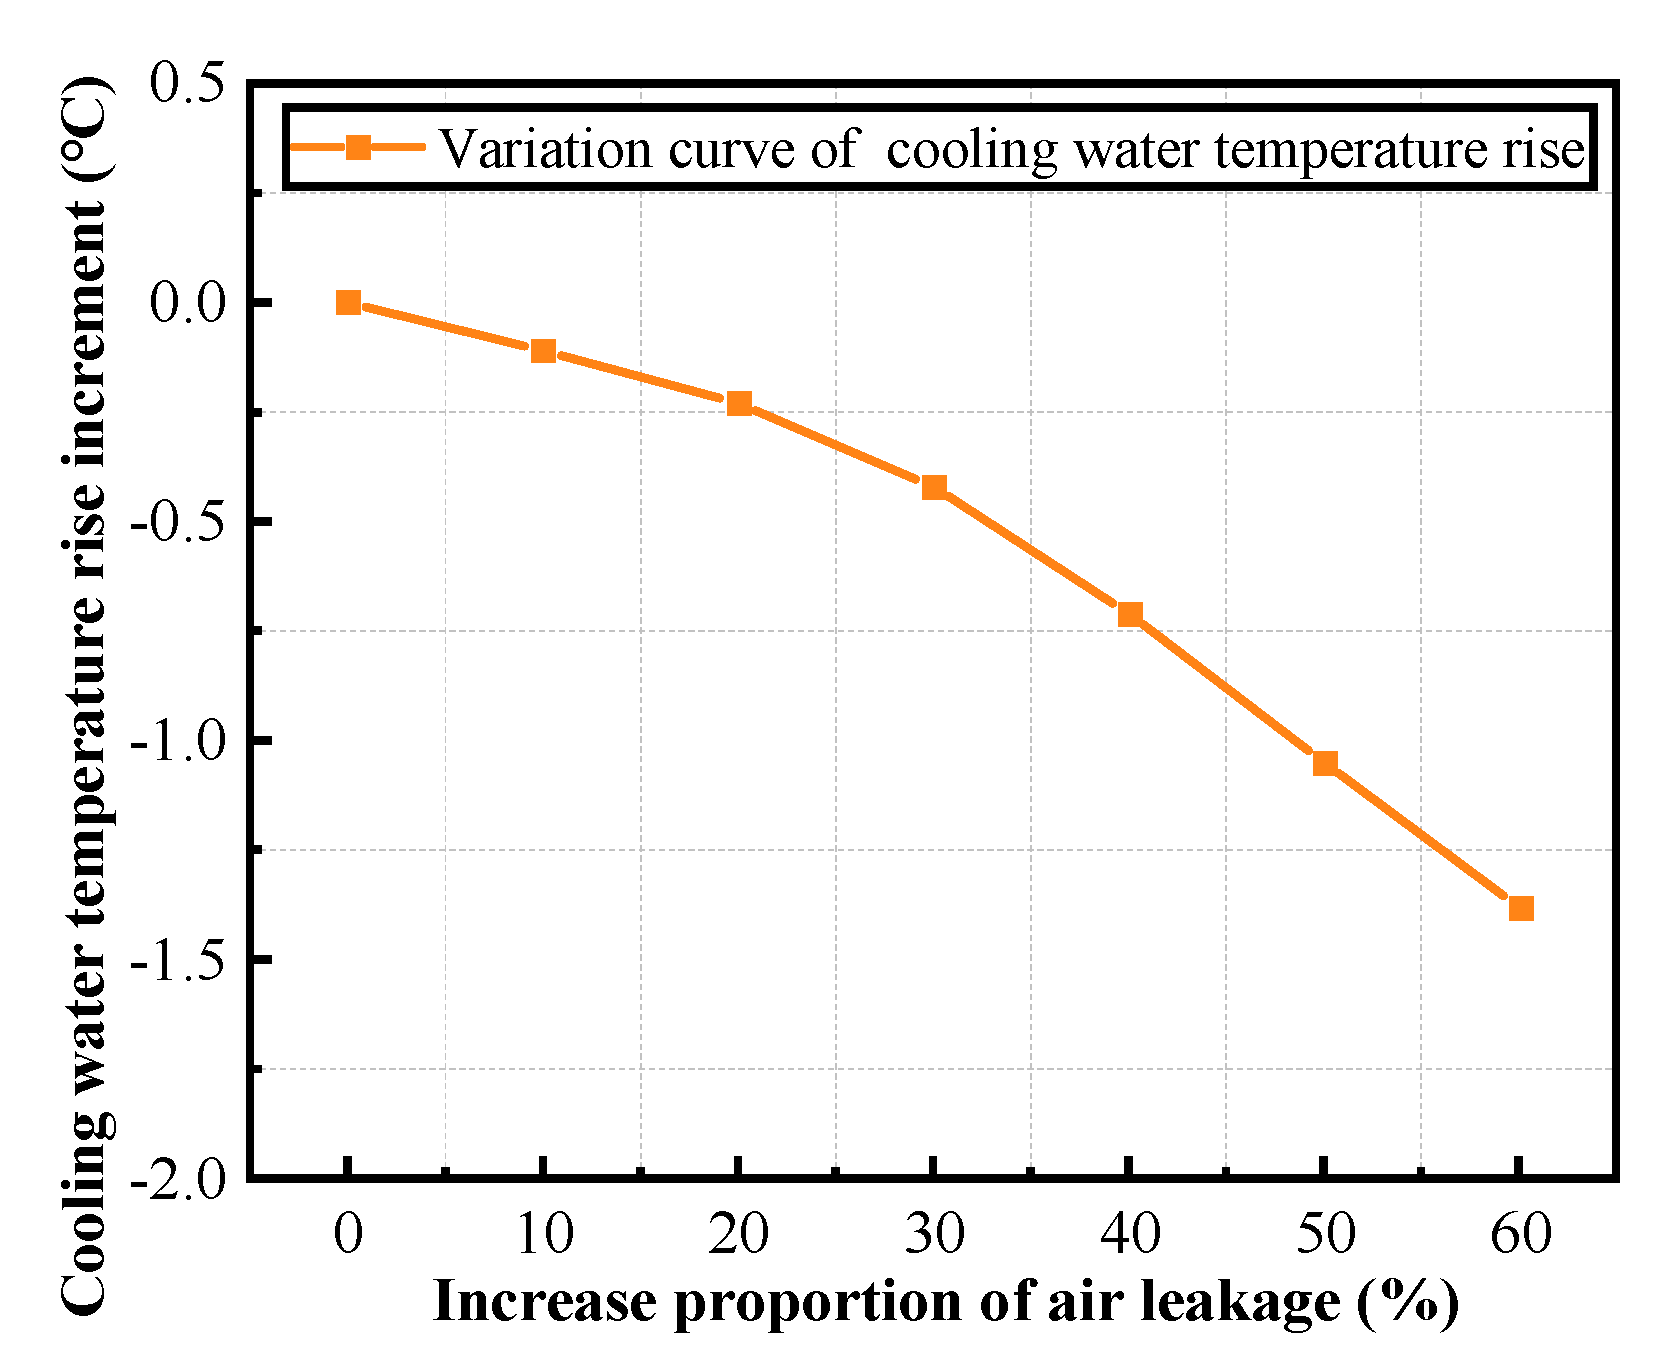
In order to analyze the influence of different amounts of air leakage into the condenser on the condenser, take a 70% working condition as an example, assume that other input and output variables of the system remain unchanged, and simulate and analyze the changes of the main operating state parameters of the condenser when the air leakage increases from 10% to 60%. The influence of the increased air leakage on the main state parameters of the condenser is shown in
Table 6.
According to the state parameters of the condenser, the relationship curves between the pressure increment of the condenser, the temperature increment of the circulating cooling water and the increase proportion of the air leakage are drawn as shown in
Figure 29 and
Figure 30.
It can be seen from
Figure 29 and
Figure 30 that, with the increase of air leakage into the condenser, the proportion of the air volume inside the condenser increases. According to Dalton’s partial pressure law, the pressure in the condenser will also increase, reducing the thermal cycle efficiency of the turbine. In addition, the air film formed will reduce the heat transfer coefficient, and the heat transfer end difference of the condenser will also increase.
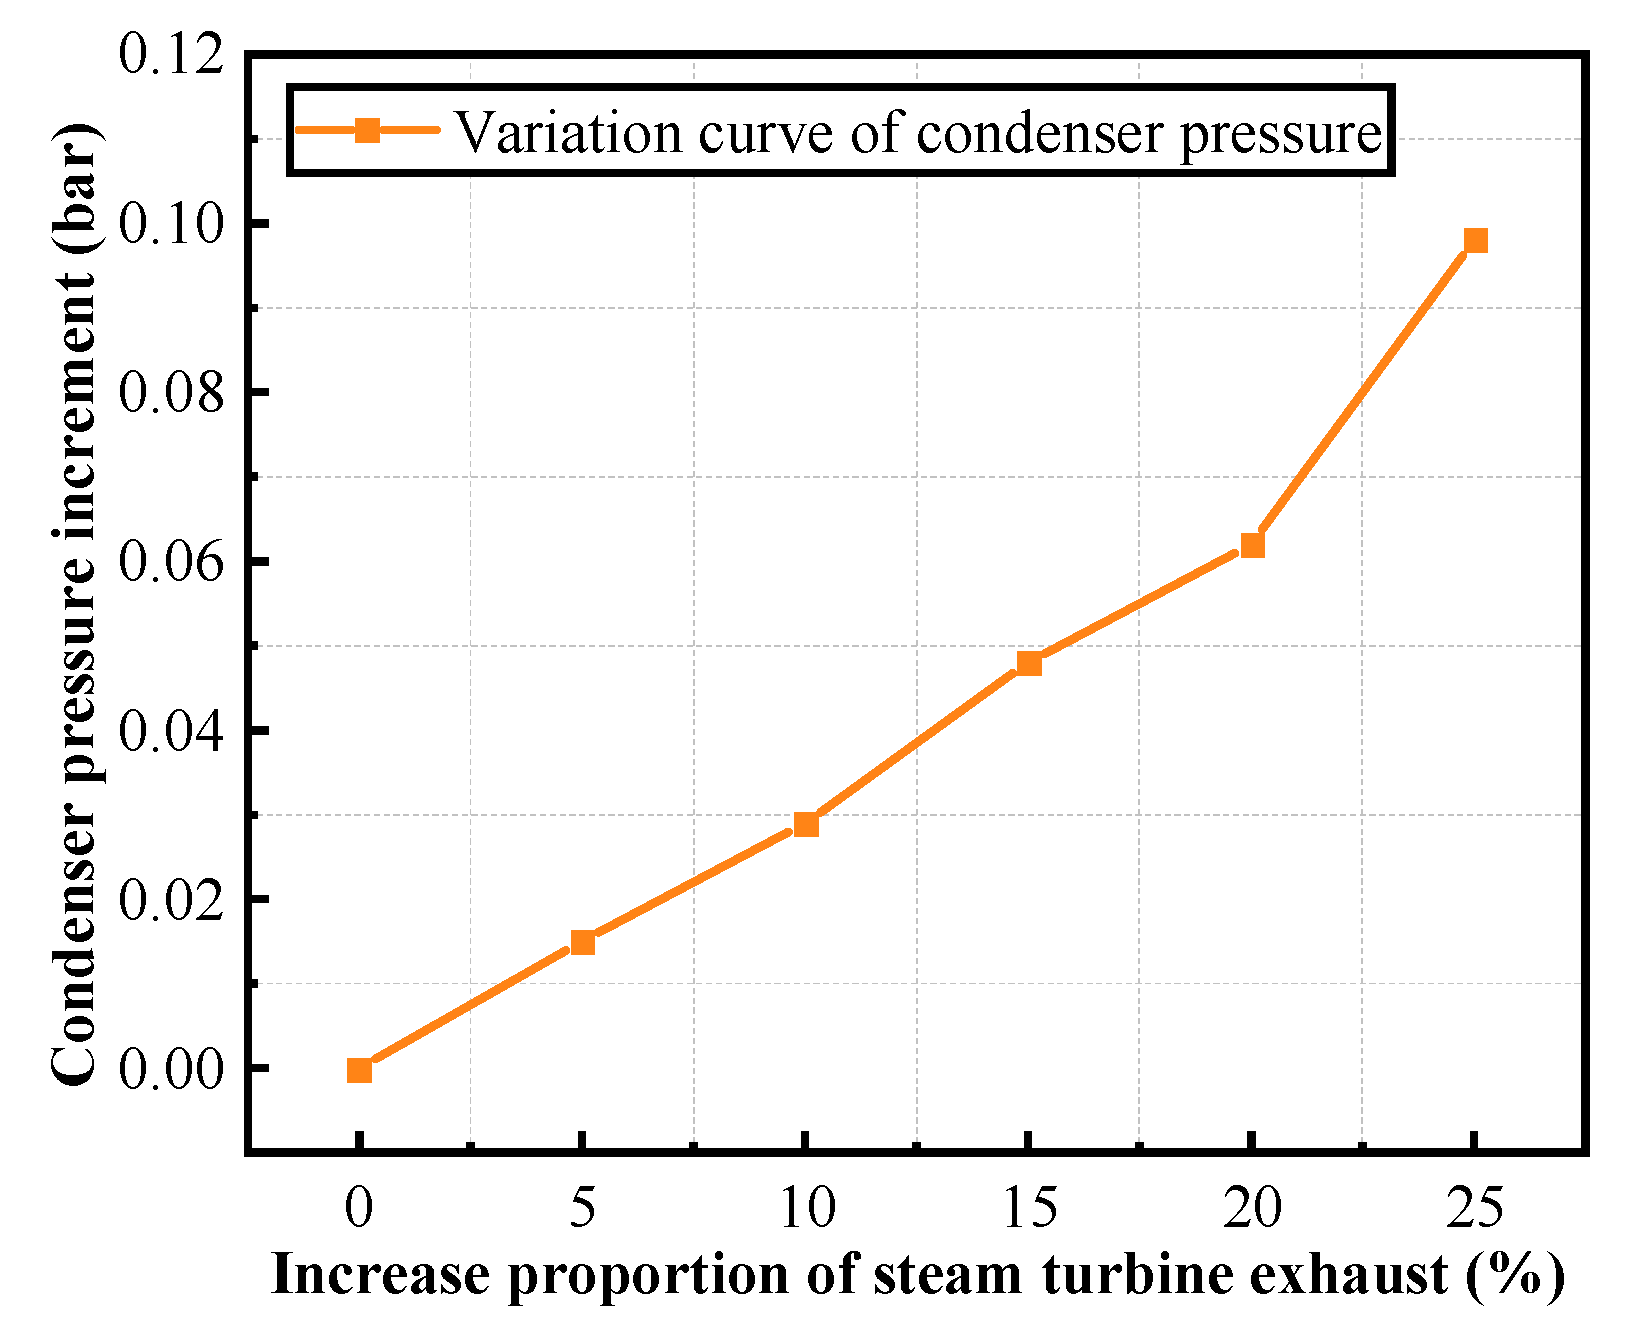
(3) Increase of steam turbine exhaust
During the steady-state operation of the steam turbine unit, the cooling conditions of condenser also remain unchanged. When the exhaust steam in the steam turbine increases, the steam quantity inside the condenser will change. In order to study the rule of the influence of steam turbine exhaust on the condenser, assuming that other input and output variables of the system remain unchanged. The change in the main operating state parameters of the condenser due to the increase of steam turbine exhaust is analyzed according to the established digital model. The main performance parameters of the condenser are shown in
Table 7.
According to the state parameters of the condenser, the relationship curves between the pressure increment of the condenser, the temperature increment of the circulating cooling water and the increased proportion of the steam turbine exhaust are drawn as shown in
Figure 31 and
Figure 32.
It can be seen from
Figure 31 and
Figure 32 that, if the cooling conditions of the condenser remain unchanged, when the steam exhaust volume of the turbine gradually increases, the proportion of steam in the condenser increases, the pressure of the condenser rises, the vacuum degree drops, the cooling water temperature rises, and the heat transfer end difference of the condenser also increases, which is consistent with the mechanism model analysis.
In a word, through the fault simulation research on the condensate feed water system based on the high-precision digital model, it can be seen from the fault simulation results that the digital model can accurately simulate the change law for each fault parameter, accurately describe the actual fault state, realize the quantitative analysis of the fault using the digital model, and build the fault database of the digital twin model according to the parameter change laws for these faults. When the actual digital twin model is running, it can be compared in time through the real-time mapping of online data to extract typical faults, which can speed up online diagnosis and fault prediction and provide guidance for the safe and stable operation of the marine steam power system.


