Article

A Study on Grid-Cell-Type Maritime Traffic Distribution Analysis Based on AIS Data for Establishing a Coastal Maritime Transportation Network

1
SafeTechResearch, Daejeon 34050, Republic of Korea
2
Department of Computer Engineering, Chungnam National University, Daejeon 34134, Republic of Korea
3
Department of Coast Guards Studies, Korea Maritime & Ocean University, Busan 49112, Republic of Korea
*
Author to whom correspondence should be addressed.
J. Mar. Sci. Eng. 2023, 11(2), 354; https://doi.org/10.3390/jmse11020354
Submission received: 11 January 2023 / Revised: 26 January 2023 / Accepted: 30 January 2023 / Published: 5 February 2023
(This article belongs to the Special Issue Marine Navigation and Safety at Sea)

Abstract

:
Recently, marine development plans such as offshore wind farms and marina port facilities have been established to use Korean coastal waters, and research on the development of operational ships such as autonomous ships and water-surface flying ships is being rapidly promoted. Since the marine traffic in Korean coastal waters is expected to increase, the government intends to construct a coastal maritime transportation network that connects Korean coastal waters to guarantee safe ship navigation. Therefore, this study used automatic-identification-system data analysis to obtain quantitative evaluation results on maritime traffic distribution characteristics and utilization levels for the entire Korean coastal waters in grid cell for greater consistency and compatibility. The characteristics of marine traffic distribution at a certain site in coastal Korean waters can be quantitatively examined using the findings of this study, and they may be used as grid-cell-type data-based information. Moreover, the vessel traffic index allows for extensive research while quickly understanding the present level of use of the passing ships by the sea area. In this regard, the findings of this study are expected to be useful for the future development of maritime transportation networks in Korean coastal waters.

1. Introduction

Recently, research on marine development planning and the development of different types of operational ships for use in Korean coastal waters in a variety of ways has accelerated. The establishment of offshore wind farms in line with the Green New Deal policy and Renewable Energy 3020 implementation plan, as well as the establishment of marine port facilities to encourage marine leisure, are major maritime development plans [1,2]. Moreover, different types of navigation technologies from existing vessels are being developed, such as autonomous ship technology, which allows the system to control the ship and operate it without human interference by converging information communication, sensors, and smart technologies with existing ship technology, including water-surface flying ships, which operate at a height close to the surface of the water [3,4].
Globally, each country’s marine spatial plan considers scientific data as well as social and economic factors, and promotes the introduction of systems for efficient use and resolution of conflicts among stakeholders [5,6].
Accordingly, the government has established nine marine-use zones (fishery-activity-protection zone, aggregate/mineral-resource-development zone, energy-development zone, marine-tourism zone, environment/ecosystem-management zone, research/education-conservation zone, port/navigation zone, military-activity zone, and safety-management zone) according to the 2019 Marine Spatial Planning to restrict the indiscriminate use and development of all the sea areas of Korea and to integrate the marine-ecosystem value and marine-development potential so that they can be used and developed according to the characteristics of marine space [7]. In addition, the government has designated and managed port/navigation zones to ensure the safe operation of ships. However, most designated and managed port/navigation zones are currently notified routes or are limited to the inner-sea areas of port boundaries.
Customary maritime traffic flows in Korean coastal waters have existed for a long time and are based on major port facilities located on the east, west, and south coasts of Korea. Depending on whether the passing ships use the route, this flow is primarily separated into two types. The first type is vessel traffic flow beyond the port boundary, such as traffic safety-specified sea areas, traffic separation methods applied to water areas, and sea routes designated by the Regional Office of Maritime Affairs and Fisheries. The second type is vessel traffic flow, in which the ship operator uses navigable waters instead of the designated route after considering the operating environment (e.g., weather and sea conditions and maritime traffic status).
Given the current status of the port/navigation zone designation among marine use zones and the customary maritime traffic flow status, the maritime traffic environment in Korean coastal waters is expected to become more complex. This is a result of offshore development plans, such as future offshore wind farms and marina port facilities, as well as new modes of operation, such as autonomous ships and water-floating ships. In other words, if we do not preemptively respond to changes in the operating environment of ships in the coastal areas, several challenges can be expected in securing the space for maritime traffic and managing the water area, making the safe navigation of vessels impossible, and the likelihood of maritime accidents to be expected to increase.
Thus, the South Korean government is promoting a plan to establish a coastal maritime transportation network (CMTN) and enact related laws to secure maritime traffic by type, such as wide areas, branch lines, and port of entry to and exit from Korean coastal waters, and to respond to the future maritime traffic environment. To construct a CMTN that ensures ship safety in relation to these government policies, it is necessary to first identify the maritime traffic characteristics of each sea area by examining the current state of maritime traffic distribution in Korean coastal waters and the operational environmental conditions [8,9]. There are cases of evaluation of the risk of maritime traffic in ports by calculating the nautical-port risk index [10], and cases of preemptive response to the future maritime traffic environment by analyzing the causes of marine accidents in the Singapore Strait through spatial and statistical analysis [11]. In addition, there is a case of quantitative analysis of the navigation risk in Arctic waters using dynamic BN [12].
Therefore, this study aimed to identify the characteristics of the maritime traffic distribution and utilization levels by sea area by presenting the results of quantitative reviews, such as maritime traffic distribution for all Korean coastal waters, in the form of grid-type data with improved consistency and compatibility based on the analysis of automatic-identification-system (AIS) data.
When constructing a CMTN in the future, the results of this study are expected to provide practical assistance for designing more efficient and safer CMTNs rather than uniformly applying the design criteria for route width (one-way: 0.5–1.0 L/two-way: 1.0–2.0 L) according to the type of vessel traffic in compliance with the domestic harbor and fishery design standards [13].

2. Literature Review

The International Maritime Organization (IMO) stipulates that AIS must be installed on international voyage ships with a gross tonnage of 300 tons or more, domestic cargo ships with a gross tonnage of 500 tons or more, and all passenger ships regardless of size, in accordance with the International Convention for the Safety of Life at Sea (SOLAS). The AIS data transmitted and received through the ship AIS equipment consist of static information, including ship name, call sign, IMO number, MMSI number, and type of ship; dynamic information, including ship position (longitude/latitude), speed, and course; and voyage information, including ship draft and cargo information [14]. Consequently, studies using AIS data are being conducted domestically and internationally, and several papers on the topic have been published.
One study compared and assessed the risk change of operators due to the rise in maritime traffic and route breadth in Korea using the environmental stress (ES) model, a risk-assessment model based on AIS data for the waters near Gunsan Port [15]. In addition, the AIS data of ships in the vicinity of Busan New Port were analyzed using the density-based spatial clustering of applications with noise (DBSCAN) algorithm, a machine-learning clustering method, to analyze the traffic patterns of ships and to derive and present the degree of change in ship location, speed, and course based on the specified time series [16]. Using AIS data from the waters surrounding Mokpo Port, another study compared and analyzed the geographical flow of maritime traffic and traffic network by traffic time [17]. Moreover, another study conducted simulations to evaluate the operation performance of a liquefied natural gas carrier (LNGC) based on the design information and model test information of ships, and replaced the navigation route and operation status that shipping firms were unable to supply with AIS data [18].
In other countries, the complexity and geographical distribution of target waters were explored using AIS data from China (e.g., Shenzhen and Zhangzhou) and Singapore, and a maritime-traffic complexity model was developed by considering ship characteristics [19]. Furthermore, studies have proposed solutions to enable the implementation of efficient search algorithms via the quantitative assessment of new-route search scenarios [20,21,22].
A study [23] designed and verified the spatial risk function and safety area based on AIS data to assess the risk of collision and stranding between multiple ships in a variety of sea areas to support decision making. Another study analyzed AIS data together with maritime environment data to assess container-ship operations based on the correlation between ship fuel-oil consumption and operation patterns [24].
As discussed above, vessel AIS data have been used for several research purposes. However, since the quantity of AIS data to be evaluated was substantial and preprocessing required a great deal of time, the target sea area and data collection period of the application were limited.
Because of the characteristics of AIS data, the maritime traffic distribution may vary depending on how the range of the target sea area and the collection period are selected. Thus, the analysis scope and time must be appropriately configured based on the goals of the study [25,26,27]. Therefore, this study targeted the entire Korean coastline rather than just a single maritime region. Moreover, AIS data for three days from each 2020 season (12 days total) were used for analysis to compare and analyze the characteristics of maritime traffic distribution according to the AIS data collection period.
Meanwhile, much spatial data in the form of points, lines, and planes already exist, but research using grid systems is absolutely necessary for utilization, for example promoting related research and establishing policies, such as identifying accuracy, characteristics, and trends based on a certain scale [28,29].
A previous study evaluated vessel traffic safety by considering the burden on ship operators by sea area by dividing the Korean coastal waters into eight categories, setting major metrics (average number of fog days, route complexity, maritime traffic volume, and hazardous-cargo handling volume), and calculating vessel traffic using fuzzy logic and Choquet integration methods [30]. A traffic-risk-index model was proposed in another study that calculated a risk index by gridding the sea area close to Busan Port at 6′ intervals (latitude and longitude) and combining risk scales, assessment criteria, and weights for each index [31].
In addition, a marine information system based on grid-type data is being operated in Korea. The Korea Hydrographic and Oceanographic Agency (KHOA) provides the Ocean Data in Grid Framework (Badanuri Marine Information Service), which has been built as a spatial database through six grid sizes (the size of each grid is, approximately, from 100 m2 to 100 km2) for marine observation and forecasting information. The Ministry of Oceans and Fisheries provides grid-based (MSP grid, 3′/15′, small sea map) ocean and fishery information through a comprehensive marine spatial map service.
Therefore, this study aimed to grid the Korean coastal waters according to the grid system of the Korea Hydrographic and Oceanographic Agency’s Ocean Data in Grid Framework (Badanuri Marine Information Service) to quantify the characteristics of traffic length overall (LOA), speed over ground (SOG), and frequency, thereby linking them with CMTN-construction research in the future.

3. Methodology

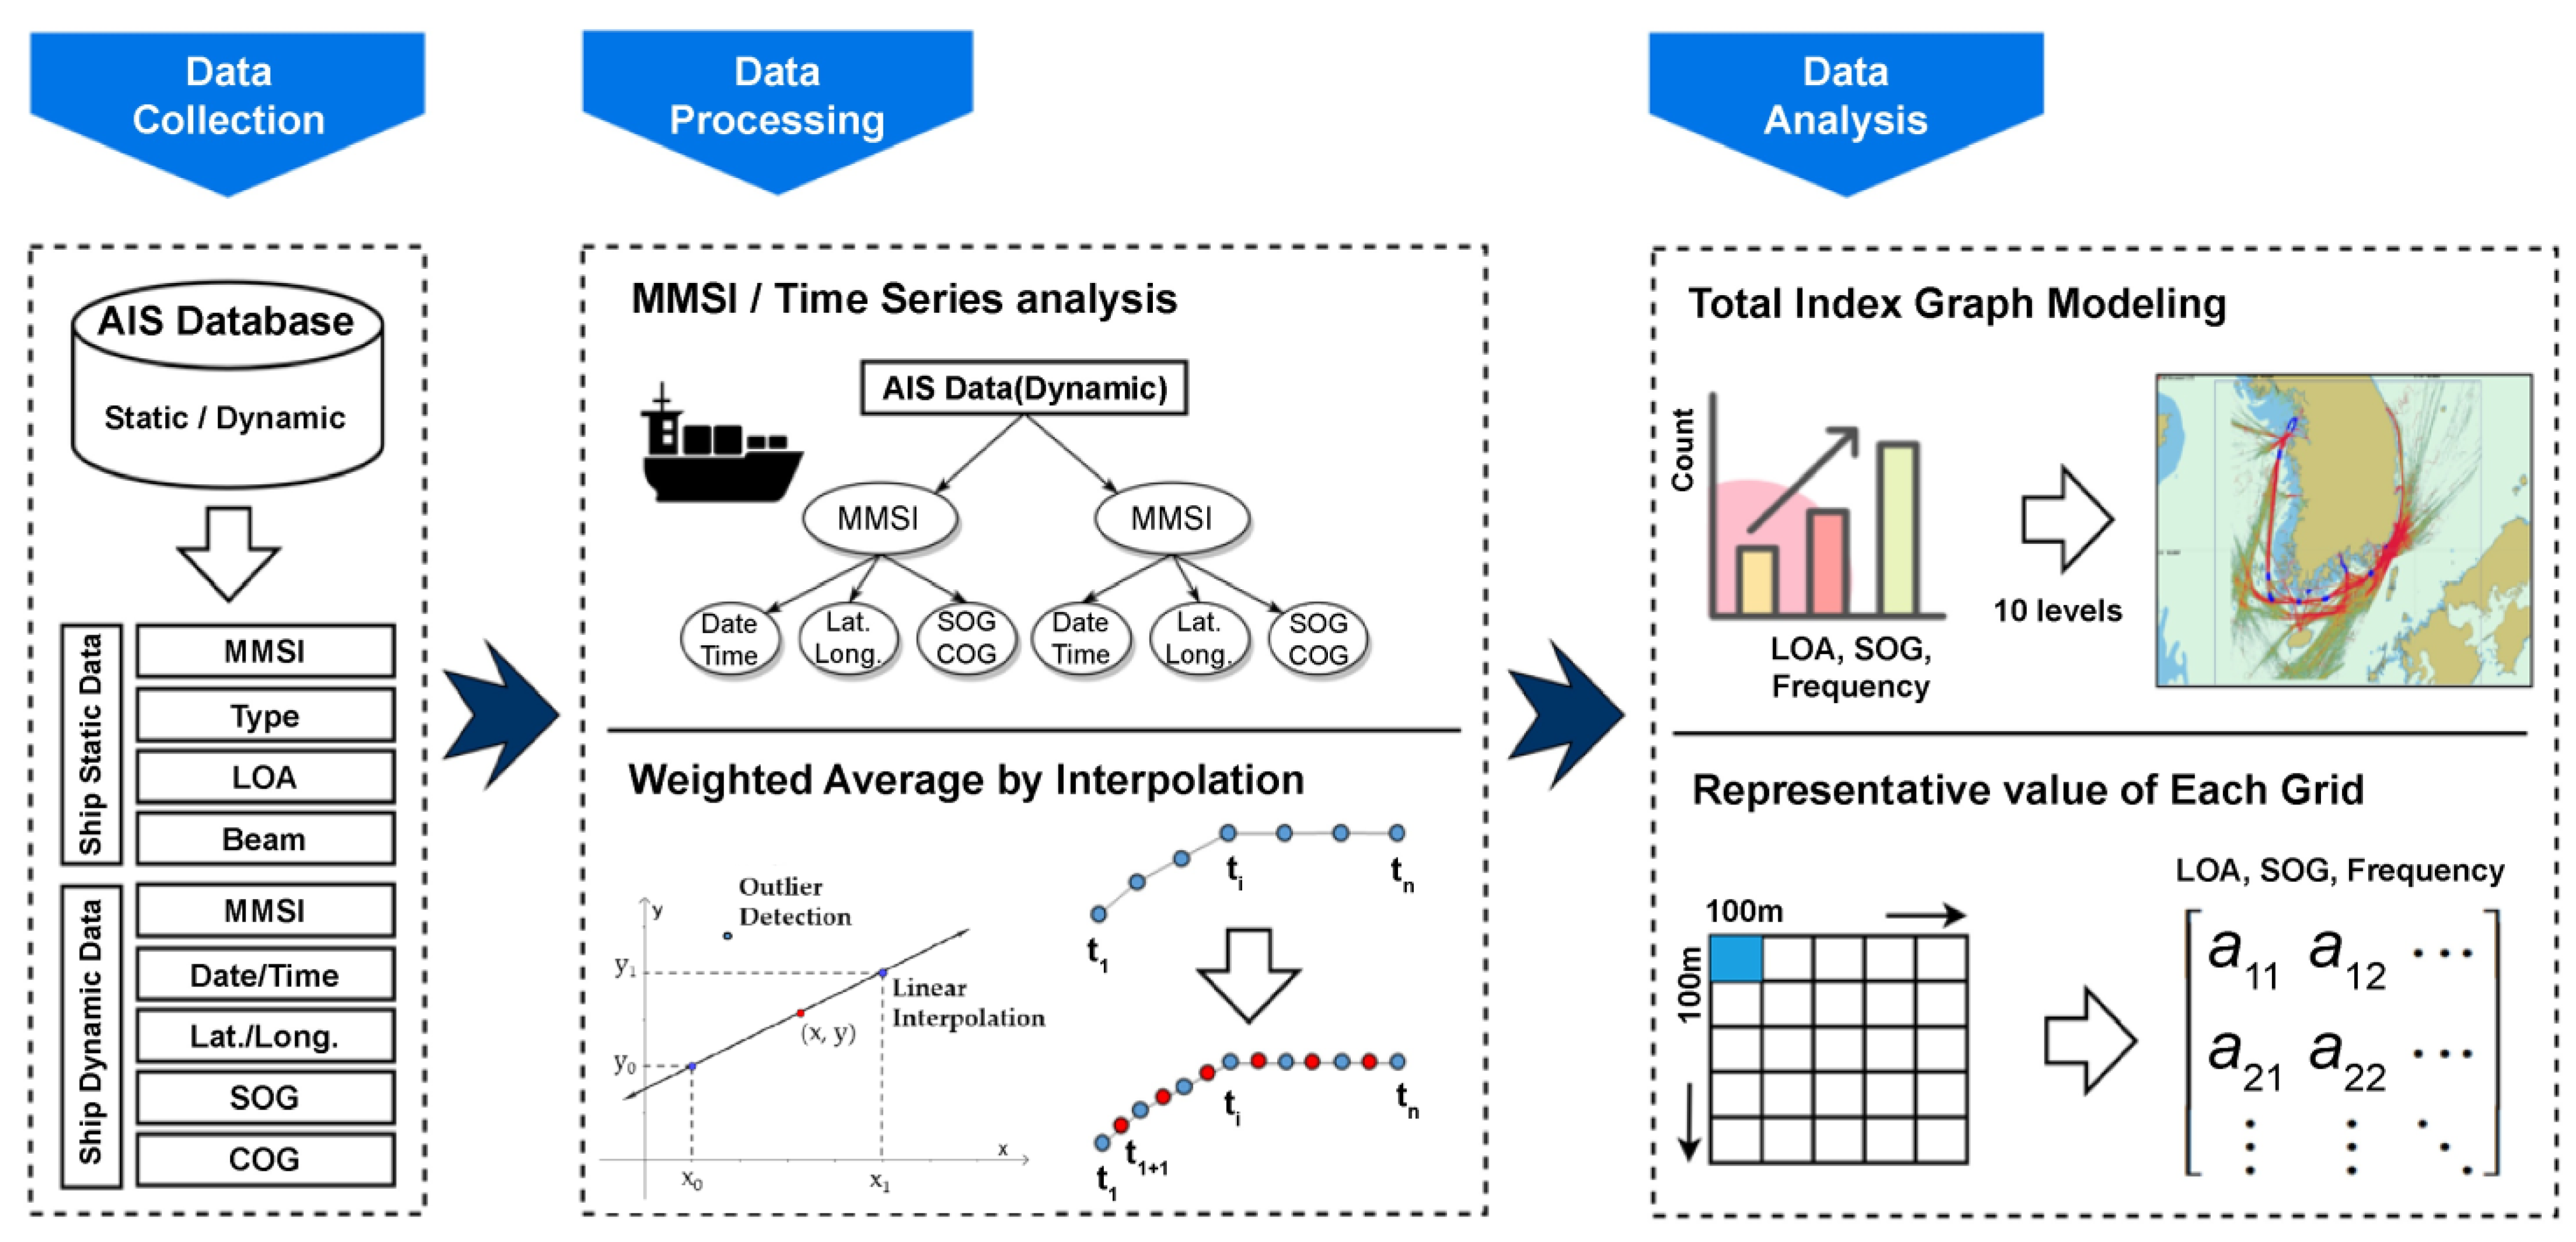
3.1. Analysis Overview

This study conducted analyses using AIS data from all vessels passing through the Korean coastal waters. The SOG and course are shown as continuous numbers based on the reception time, and the AIS data are in the longitude and latitude coordinates of the WGS-84 geodetic system. However, it is necessary to use the same unit time for every vessel because the receiving cycles for dynamic information change depending on the vessel speed from 2 s to 3 min. To compensate for this, it is necessary to handle missing values. Hence, during the preprocessing stage of the AIS data, missing values were treated for important data, including LOA, SOG, and frequency, based on the Maritime Mobile Service Identification (MMSI), among the dynamic data. Linear interpolation was used for processing missing values, as shown in Equation (1) [32]:
D t + I t v = l 1 l D t l 2 l D t + α ,
where   D t = data   at   time   t ;
D t + α = data   after   time   α   next   data   of   D t ;
D t + I t v = data   after   interval   to   be   interpolated ;
l ,   l 1 ,   l 2 = difference   between   D t   and   D t + α ,   D t   and   D t + I t v ,   and   D t + I t v   and   D t + α , respectively;
Here, the prerequisite is α > I t v .
Outliers were eliminated because the AIS data contained erroneous values that were far out of the normal range. The pretreated AIS data were classified into 10 groups by LOA, SOG, and frequency, and the entire scope of the Korean coastal waters was gridded at regular intervals. The average length, speed, and frequency of the passing ships were combined to determine each representative value, and the representative index for each grid was calculated.
The AIS data utilization flowchart, including the collection, pre-treatment, and analysis of the AIS data, is shown in Figure 1.

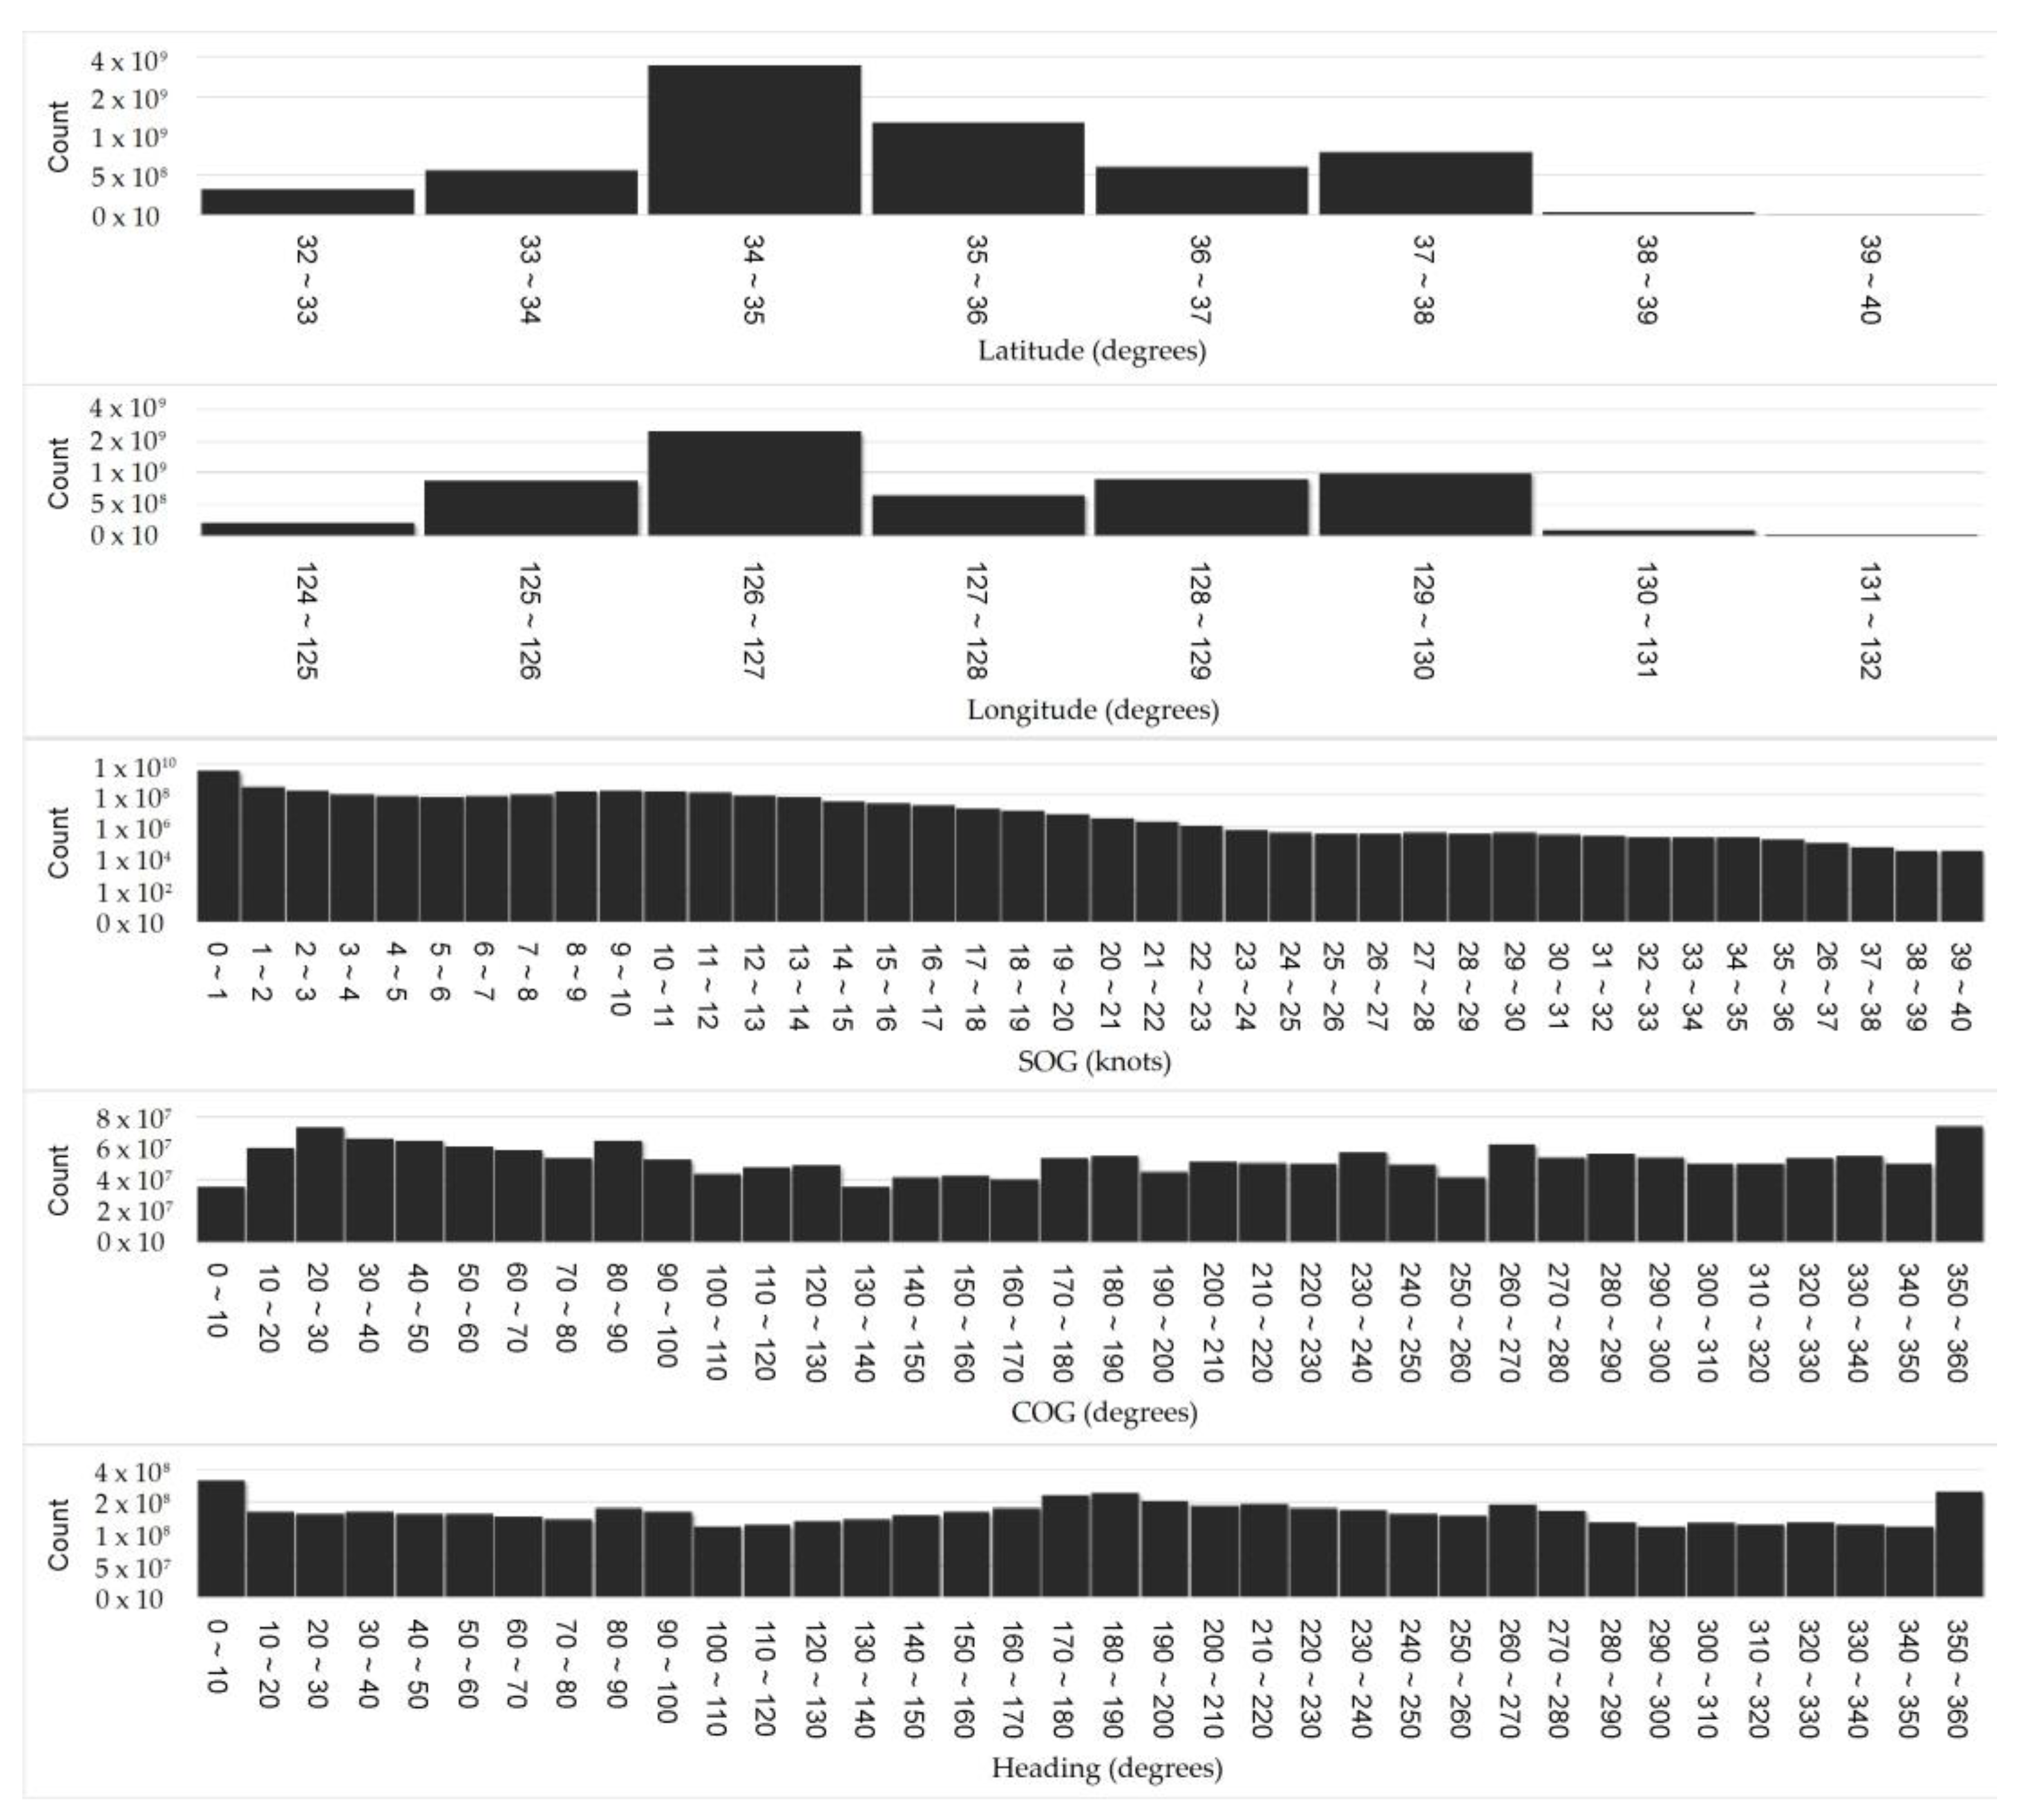
3.2. Data Collection

3.2.1. Data Overview

Table 1 shows the time and analytical range of the AIS data used in this study. The analysis period encompassed three consecutive days in 2020 when no special weather warning was issued, and the analysis range was designed to include the entirety of the Korean coastal waters.
The results of the comparative analysis of the maritime traffic status by season in Korean coastal waters, based on AIS data, are shown in Figure 2. In the case of vessel distribution by season, the majority were recognized to have similar tendencies. However, there were some variances in the state of the vessel density and the traffic patterns depending on the analysis period. In particular, the fall/winter maritime traffic distribution in coastal waters was considerably higher than that of the spring/summer period. The vessel location data also revealed approximately 71 to 74 million points in the fall/winter season, which was deemed quite high when compared to the approximately 60 to 65 million points in the spring/summer season, as shown in Table 2. In particular, it was observed that Korean coastal waters had seasonal changes in maritime traffic distribution characteristics (e.g., latitude, longitude, SOG, COG—course over ground, and HDG—heading), which also influenced the vessel usage status by sea area. Thus, when using the AIS data, we used data for a total of 12 days (3 days per season) rather than a specified period.

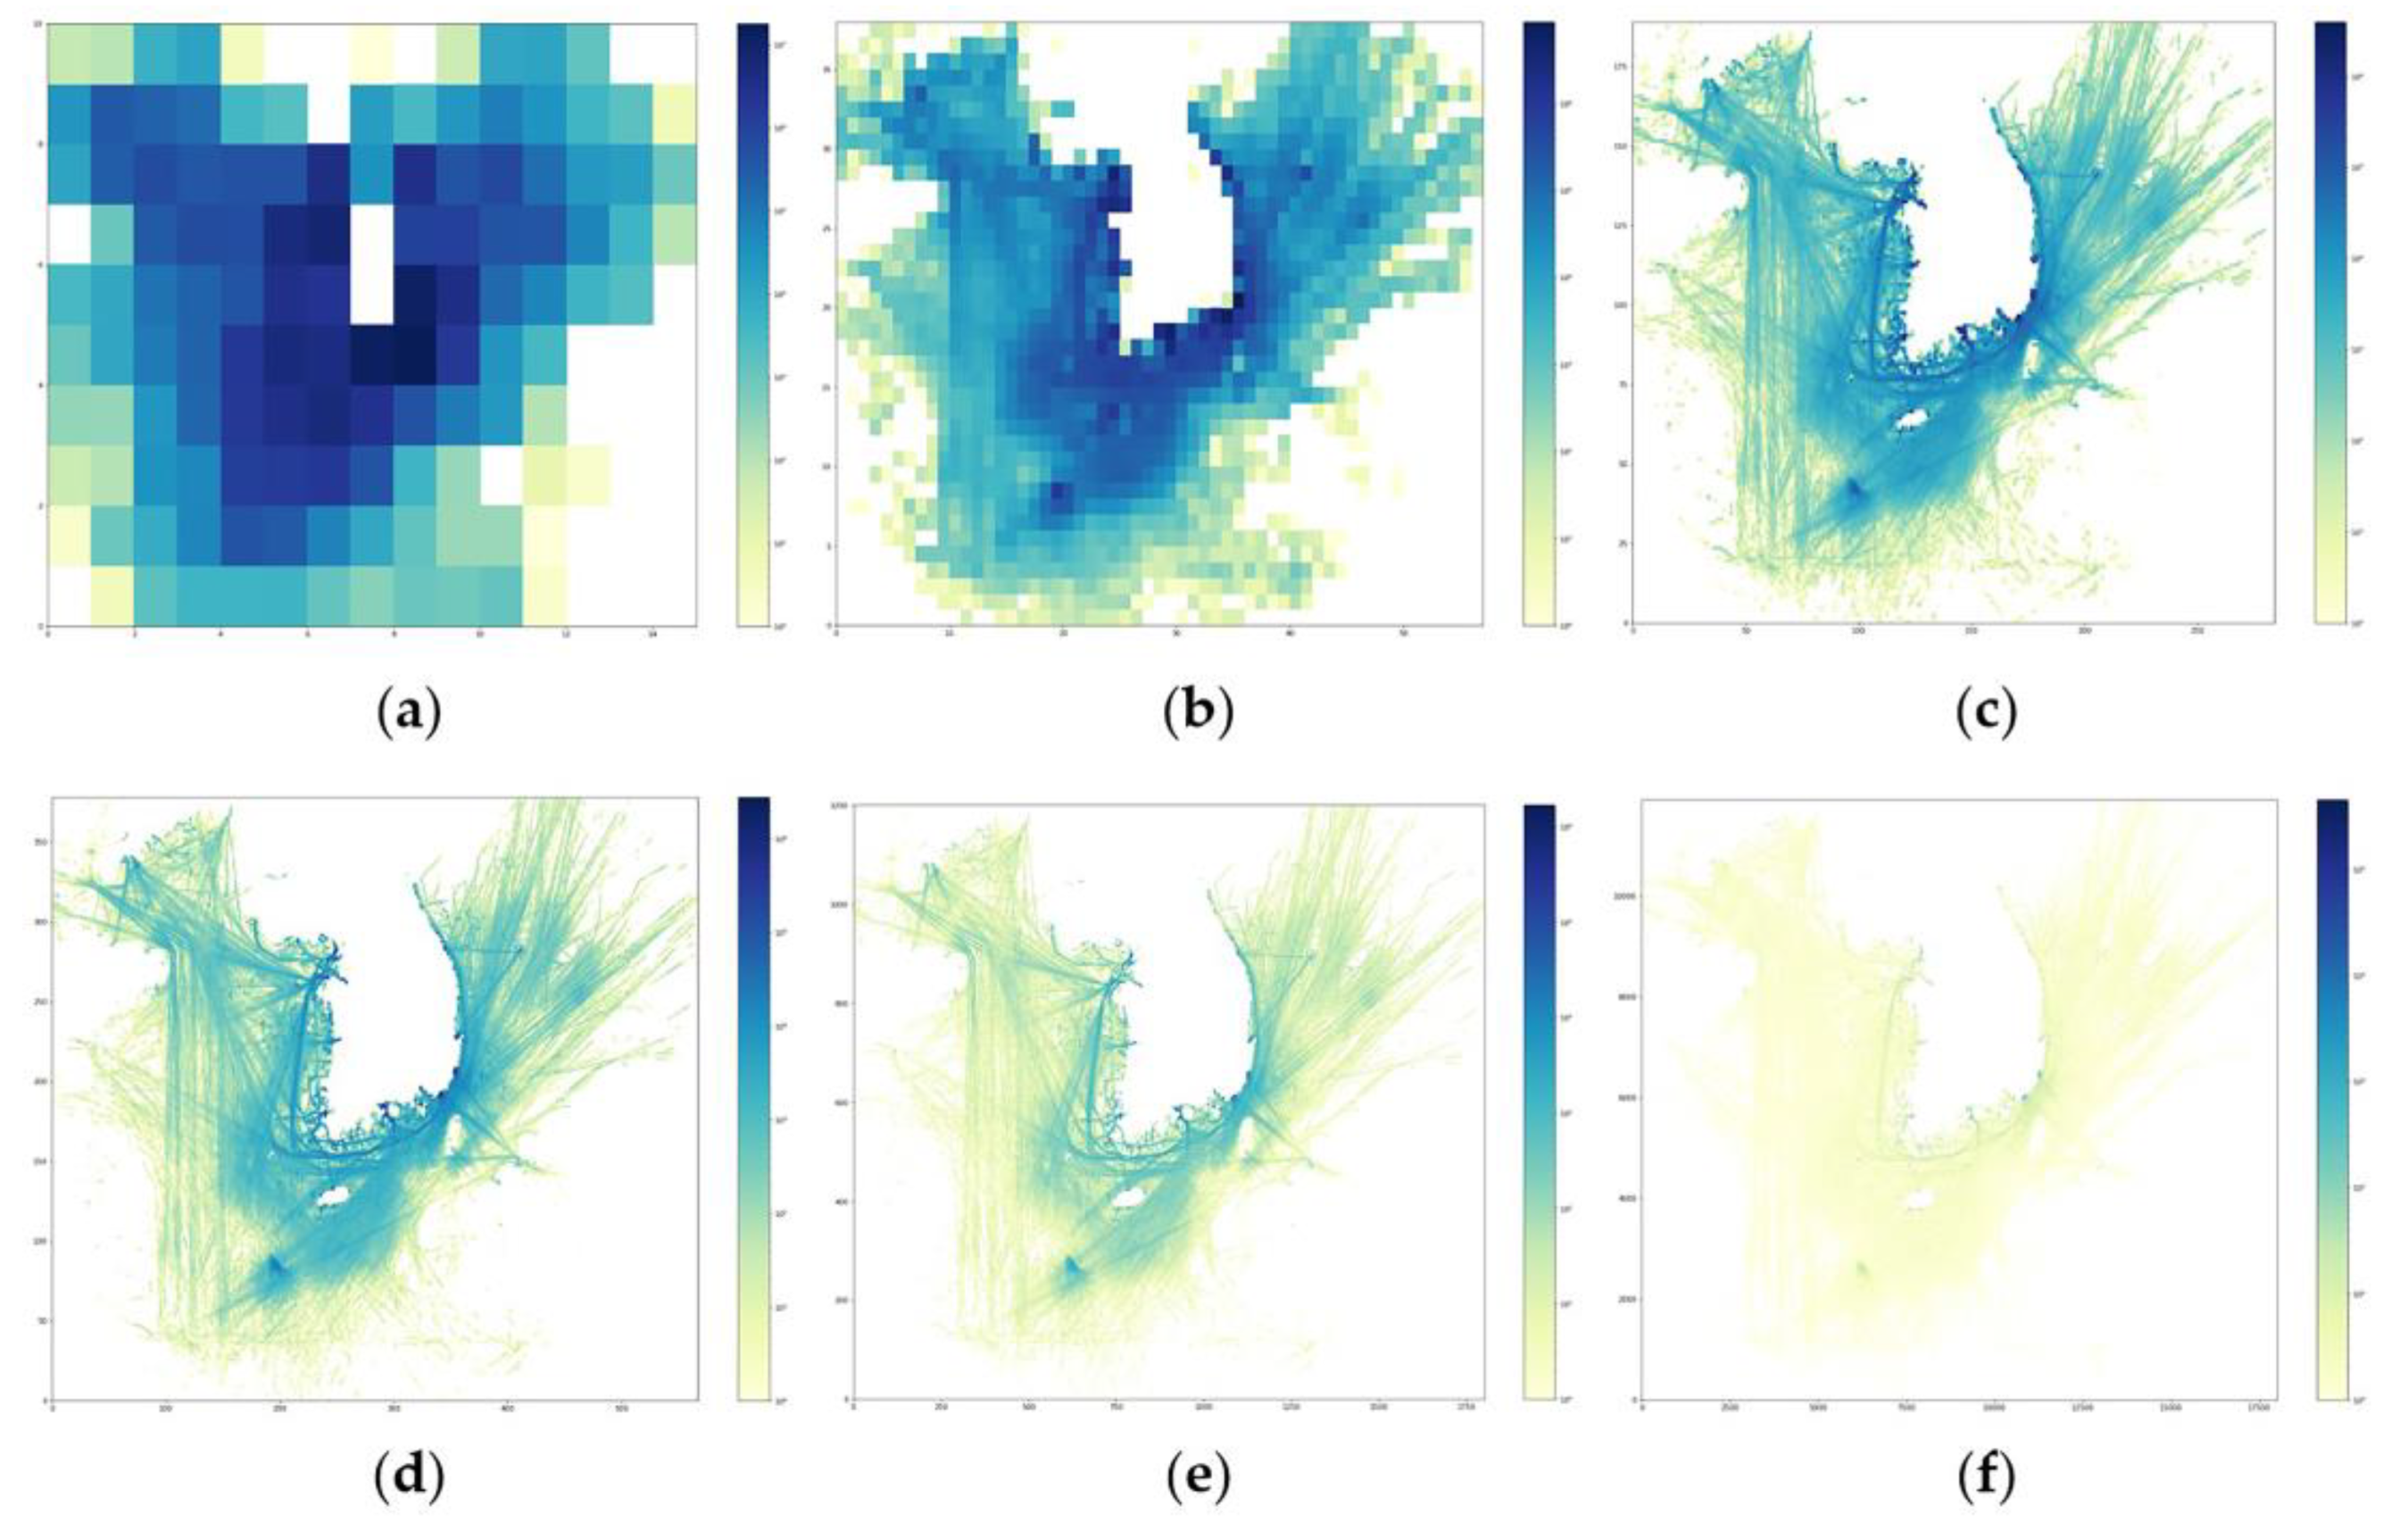
3.2.2. Grid Modeling of Coastal Waters

To differentiate the characteristics of maritime traffic distribution by sea area, such as ship size, speed, and frequency, when constructing a maritime transportation network in Korean coastal waters, it is necessary to grid and analyze the entire scope of the Korean coastal waters at regular intervals according to the Ocean Data in Grid Framework (Badanuri Marine Information Service) of the grid system of the KHOA.
The KHOA operates a grid-type marine information management system in Korean coastal waters to offer marine information services such as real-time marine-observation data and seawater-circulation forecast data. According to the grid size, it was split into six grid levels, as listed in Table 3. Users of the sea area, related organizations, and research institutions may choose and use the grid size based on the purpose of the data. As a result, the system is quite effective for sharing vital information based on the provided geographical information and conducting various related studies.
The maritime traffic distribution characteristics at a specific site may be quantitatively identified when the analysis range in Korean coastal waters is gridded using the grid-type marine information management system of the KHOA. Moreover, the system can be efficiently applied to related studies, such as securing compatibility with chart-size variations, by employing data based on grid-type data.
Figure 3 shows the maritime traffic distribution in Korean coastal waters reflecting the KHOA’s Horizontal Grid System (six levels) based on seasonal AIS data (12 days) in 2020. Using grid levels 1–2, it is difficult to analyze the traffic distribution in the coastal waters in detail because the grid interval is relatively wide, ranging from a minimum of 25 km to a maximum of 100 km. For grid levels 3–5, as the grid interval is at least 1 km and at most 5 km, it is possible to analyze the traffic distribution within coastal waters and determine whether the sea area can be used. However, applying 3″ (approximately 100 m) for the interval of the grid-type data is considered to be the most efficient, considering the length (approximately 400 m) of the largest ship (24,000 TEU container ship) currently in operation in the world and linkages, such as research on setting the route width according to the track of the ship when establishing a maritime transportation network of Korean coastal waters in the future. Therefore, grid level 6 is used in this study.

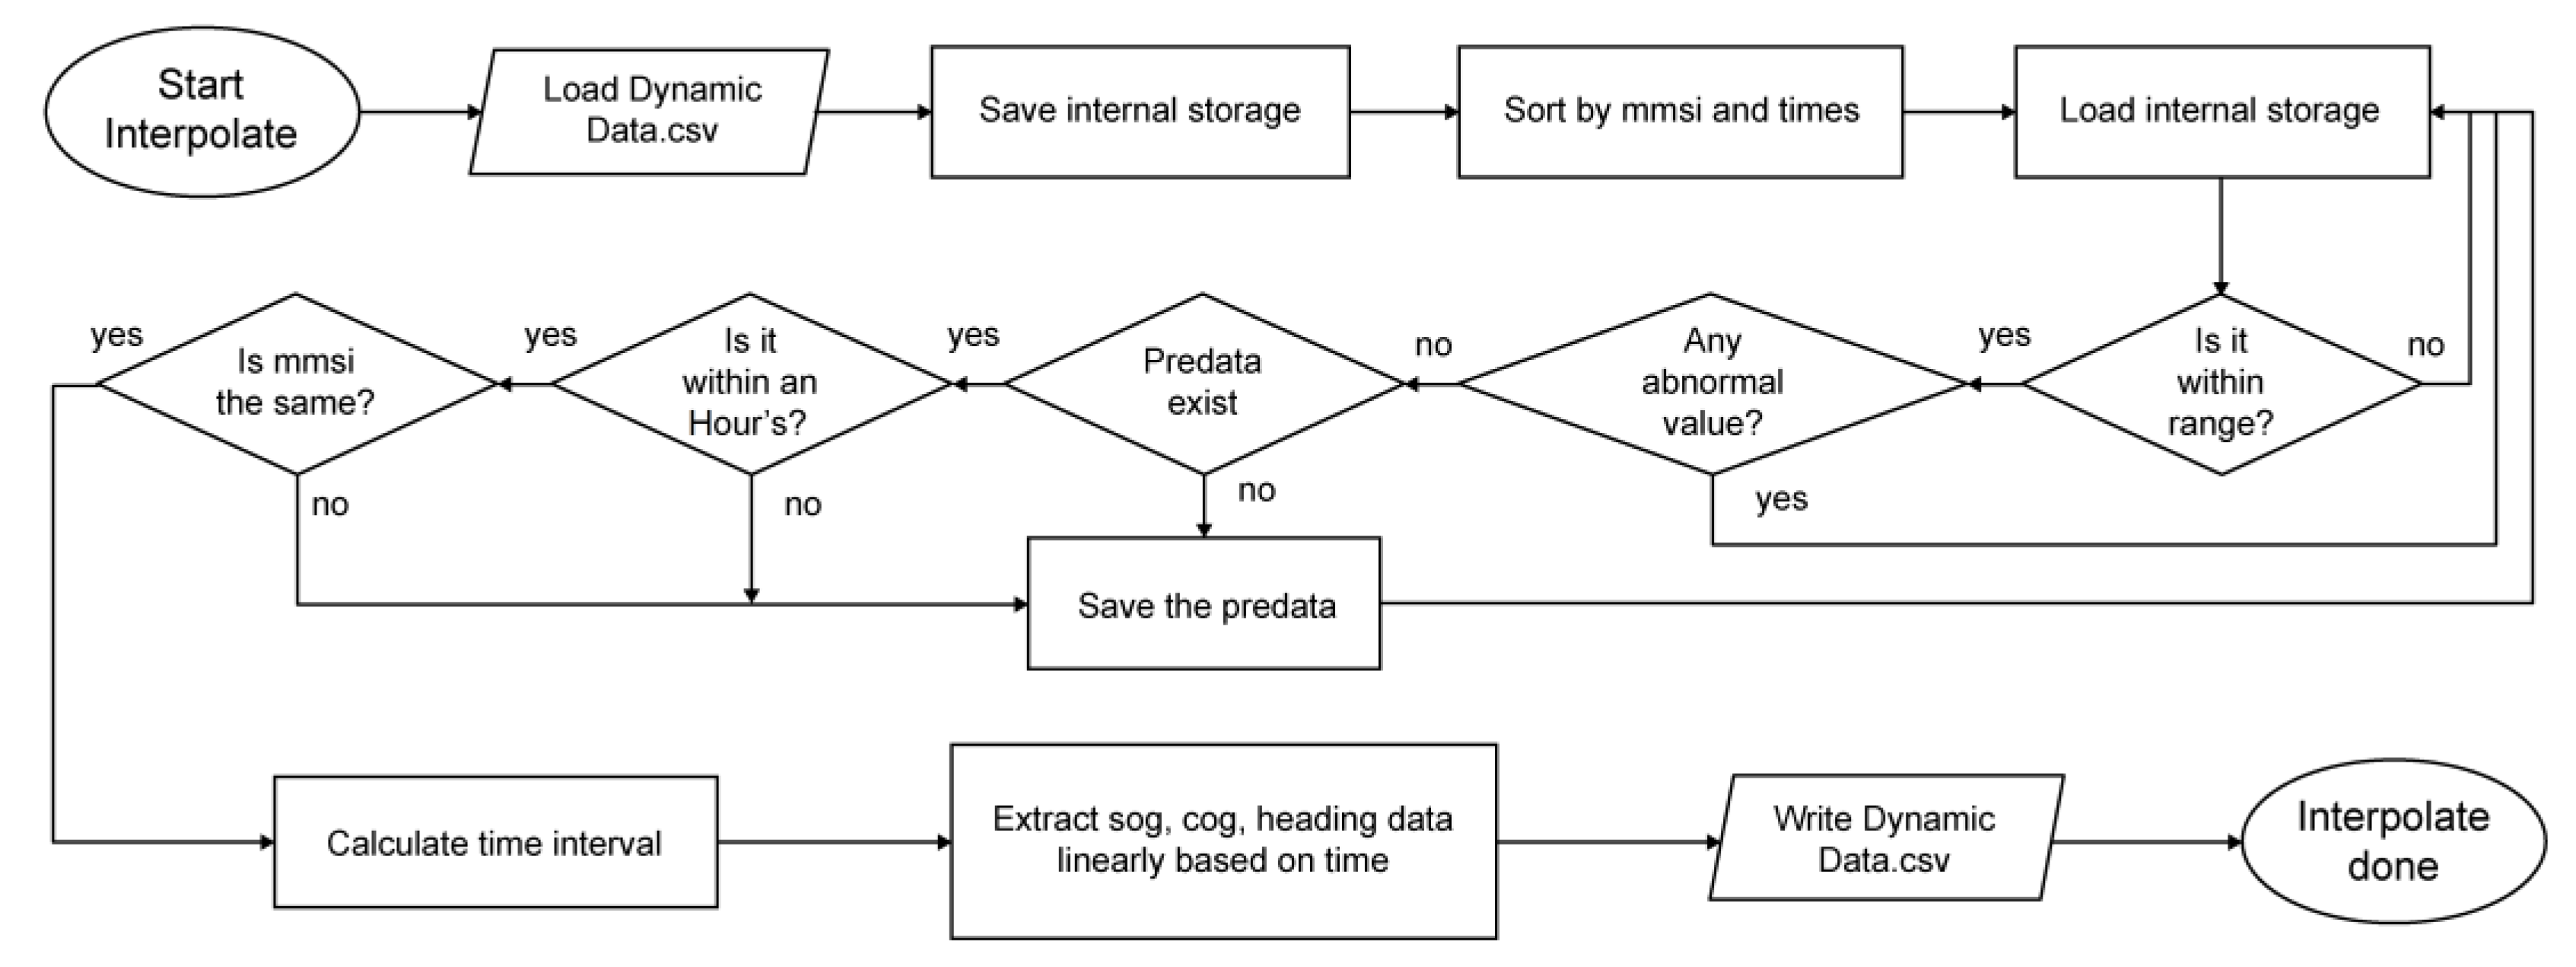
3.3. Data Preprocessing

The missing values of ship location (latitude and longitude), ship speed, and course were processed, and outliers were removed as part of the AIS data preprocessing. A linear interpolation approach was applied to handle missing values in a 1 s unit. If the time gap between two data points exceeded 3600 s or the latitude and longitude differed by more than 0.1°, the data were considered different and excluded from the missing value handling. Outliers were determined by excluding latitude 32–40 N, longitude 122–140 E, SOG of 40 knots or lower, COG of lower than 360°, and heading (HDG) of less than 360°, which subsequently were removed.
The AIS data preprocessing flowchart is presented in Figure 4. The visualization and statistics of the AIS data are presented in Figure 5 and Figure 6 and Table 4.

3.4. Data Analysis

For data analysis, LOA, SOG, and the frequency of passing ships were set as the main analysis items to quantitatively analyze the number of passing ships in Korean coastal waters. The range for each item was divided into 10 groups. The static and dynamic AIS data that had missing values or errors in LOA, SOG, or other information were excluded from the total count of the analysis results.

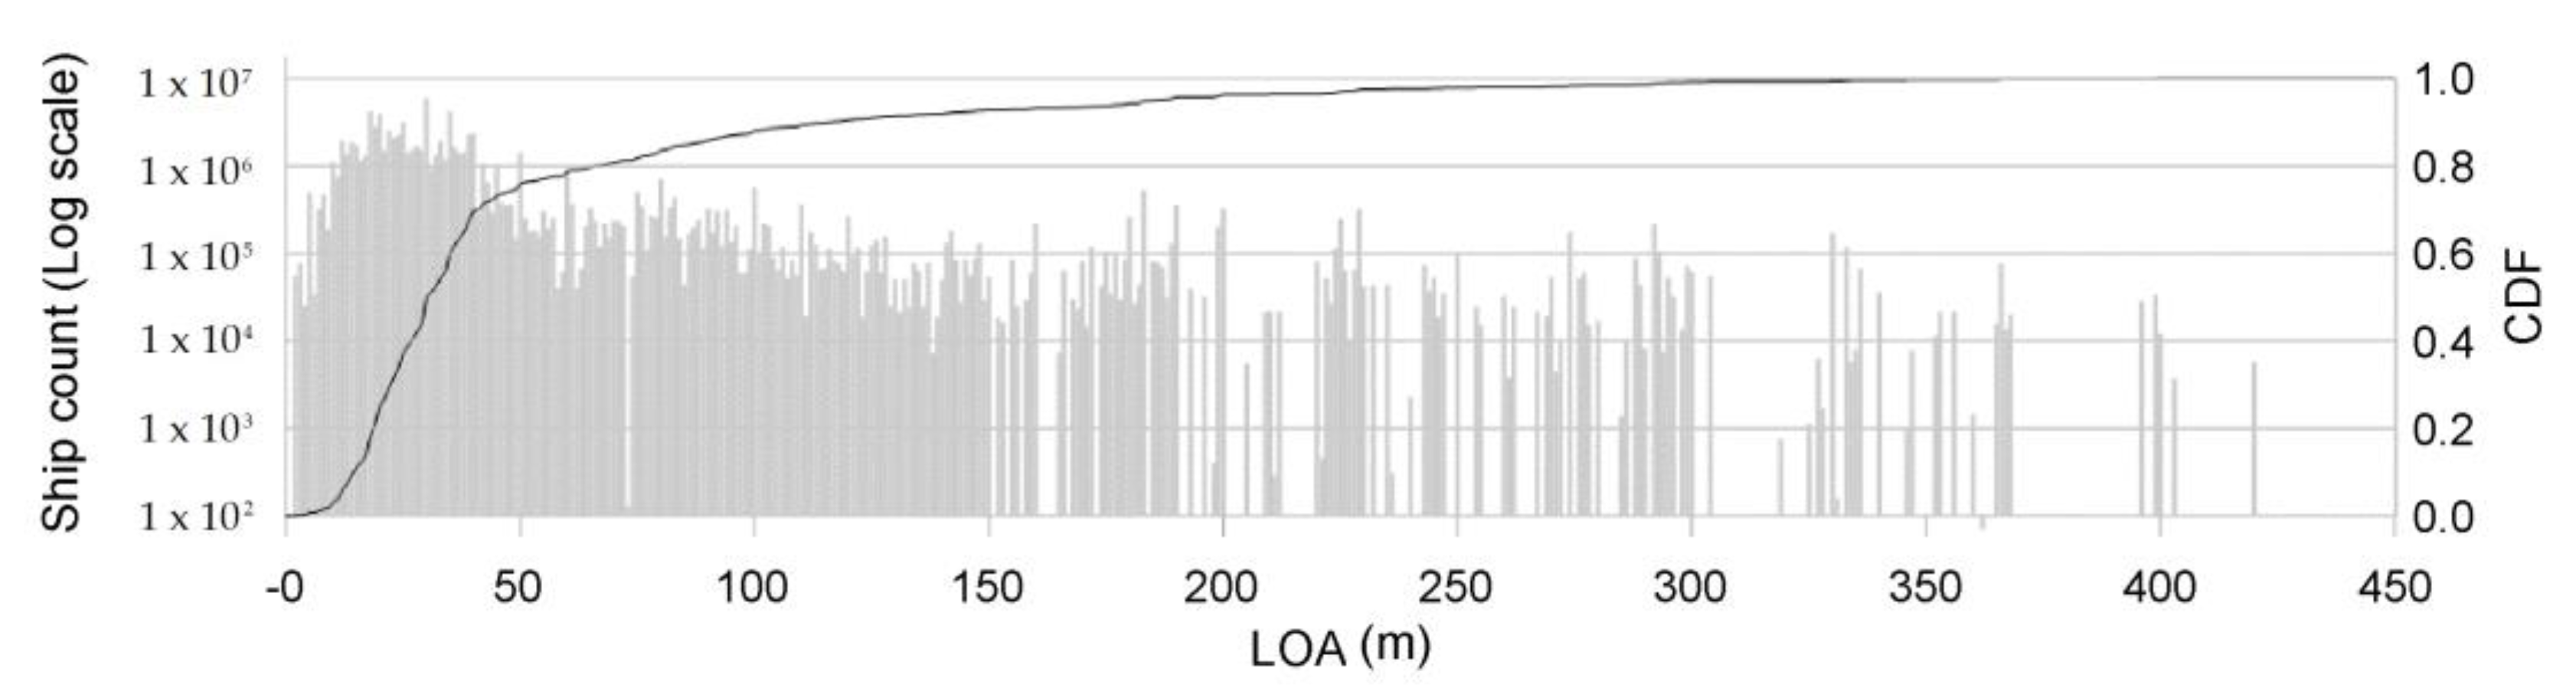
3.4.1. LOA (Length Overall)

Figure 7 shows the distribution status of the LOA of the passing ships within Korean coastal waters. Small ships with a length of less than 50 m accounted for approximately 74% of the total ships in Korean coastal waters, the highest proportion. Next, medium and large ships with a length greater than 50 m but less than 200 m accounted for approximately 22%, and giant ships with a length of 200 m or more accounted for approximately 4%.
The results of classifying the total ship count into 10 groups according to the LOA of the passing ships in Korean coastal waters are shown in Table 5. In Group 1, which had the smallest number of ships among the 10 groups, the LOA was 15 m or less. In Group 10, which had the largest ships, the LOA was 127 m or more.

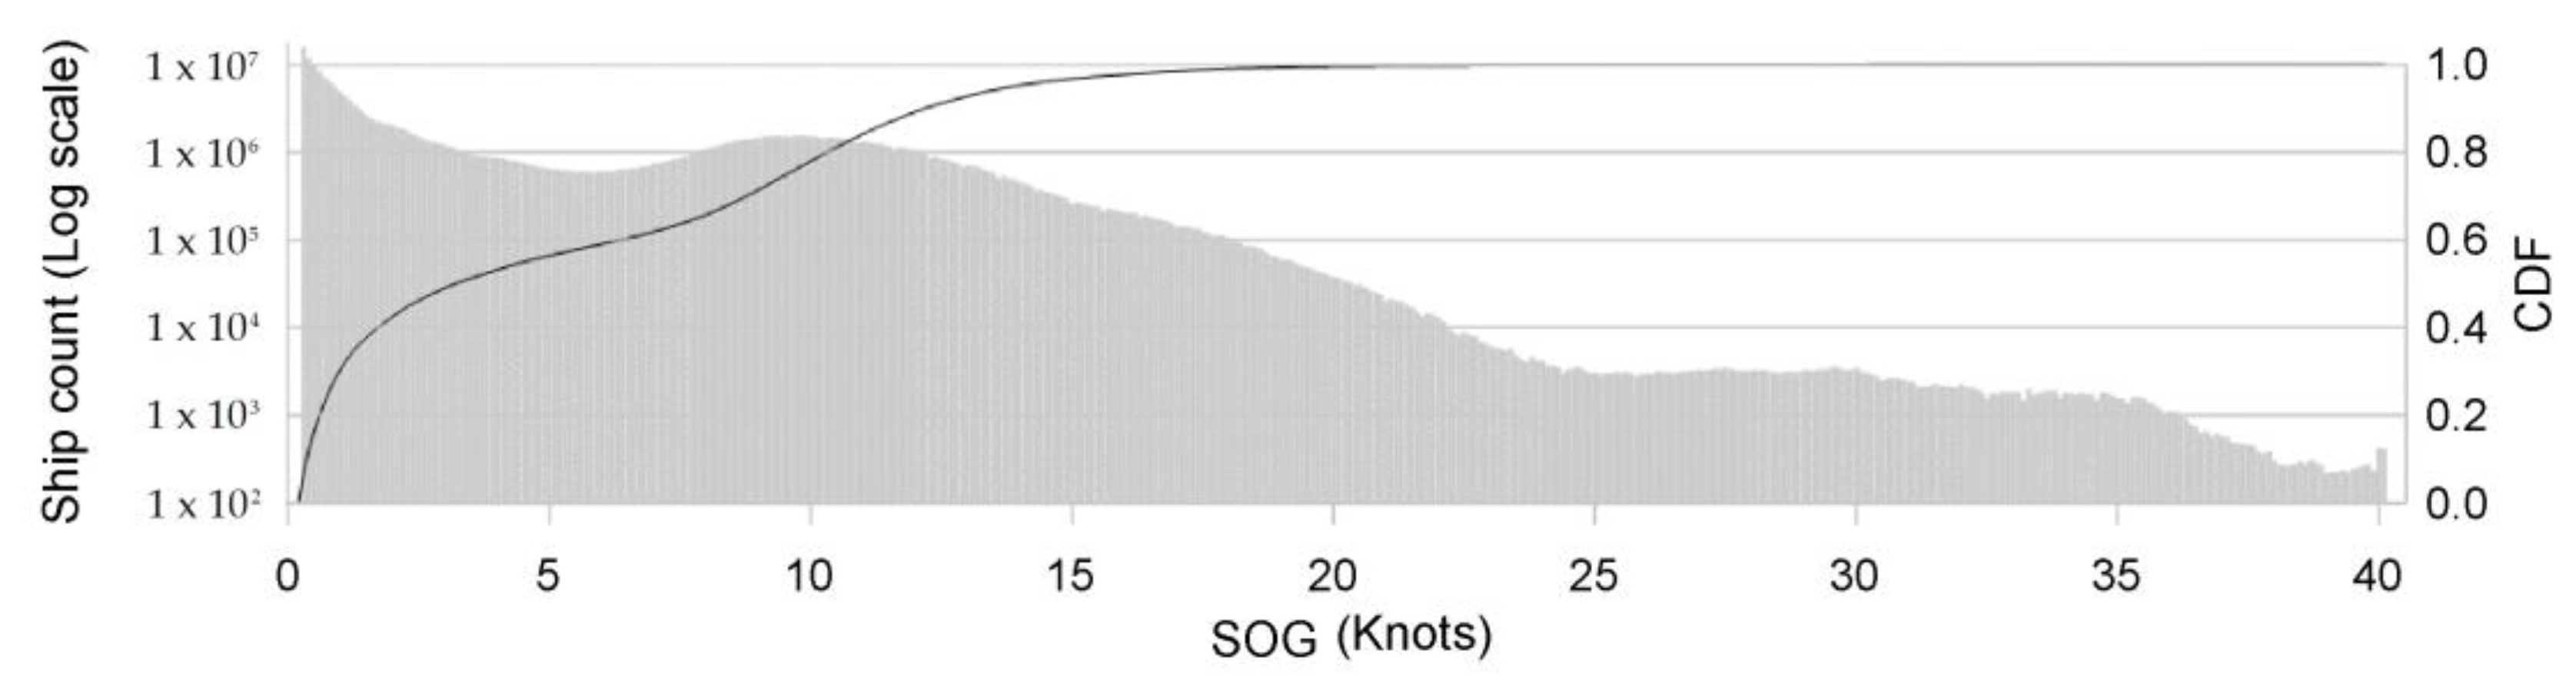
3.4.2. Speed of Ground (SOG)
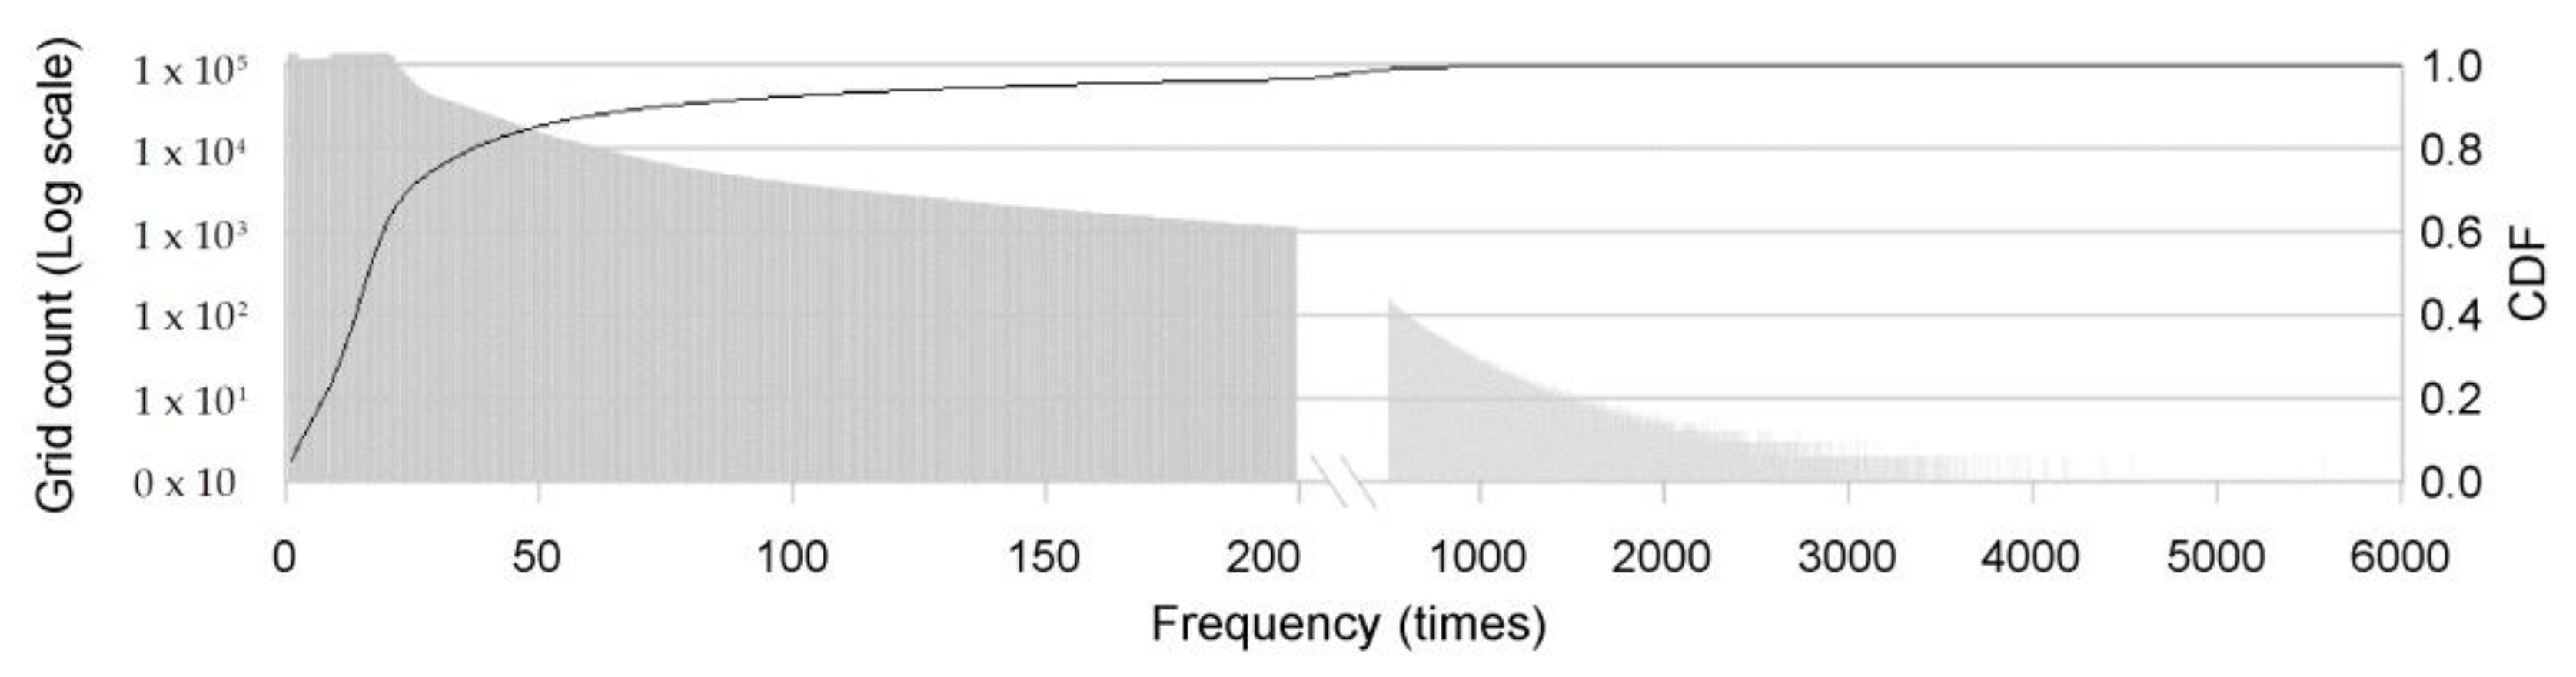
Figure 8 shows the distribution of the passing ships in Korean coastal waters by the SOG. Ships with an SOG of less than 5 knots accounted for approximately 56% of the total ship count in Korean coastal waters, the highest proportion. Next, ships with an SOG greater than 5 knots but less than 10 knots accounted for approximately 21%; ships with an SOG greater than 10 knots but less than 15 knots accounted for approximately 19%; and ships with an SOG of 15 knots or more accounted for approximately 3%.
Table 6 shows the total ship count by SOG of the passing ships in Korean coastal waters divided into 10 groups. Among the 10 groups, Group 1, which had the lowest SOG, had an SOG range of 0.4 knots or less, and Group 10, which had the highest SOG, had an SOG range of 12.3 knots or more.

3.4.3. Frequency

Figure 9 shows the distribution of the passing ships by frequency in Korean coastal waters. For the analysis of the distribution status by the frequency of ships, grids with a range of approximately 100 m were set for the entire scope of the Korean coastal waters, and the number of grids was calculated by the frequency of the passing ships.
Grids with a frequency of less than 20 times accounted for approximately 60% of the total grid count in Korean coastal waters, the highest proportion. Grids with a frequency greater than 20 times but less than 50 times accounted for approximately 25%, and grids with a frequency of 50 times or more accounted for approximately 15%.
Table 7 shows the results of dividing the total grid count for the frequency of the passing ships in Korean coastal waters into 10 groups. In the case of Group 1, which had the lowest frequency among the 10 groups, the frequency was 4 times or less, and in the case of Group 10, which had the highest frequency, the frequency was 74 times or more.

4. Results

This study comprehensively analyzed the maritime traffic distribution characteristics of ships in sea areas within Korean coastal waters in terms of LOA, SOG, and frequency. The analysis results were provided as grid-type data, allowing for the maritime traffic distribution characteristics to be effectively related to each sea area in the basic design stage for future maritime transportation network development in Korean coastal waters. Moreover, to comprehend the degree of usage based on vessel traffic in gridded sea areas, representative values of the average LOA, average SOG, and average frequency of the passing ships were calculated for each grid, and the vessel traffic index (VTI) was determined.

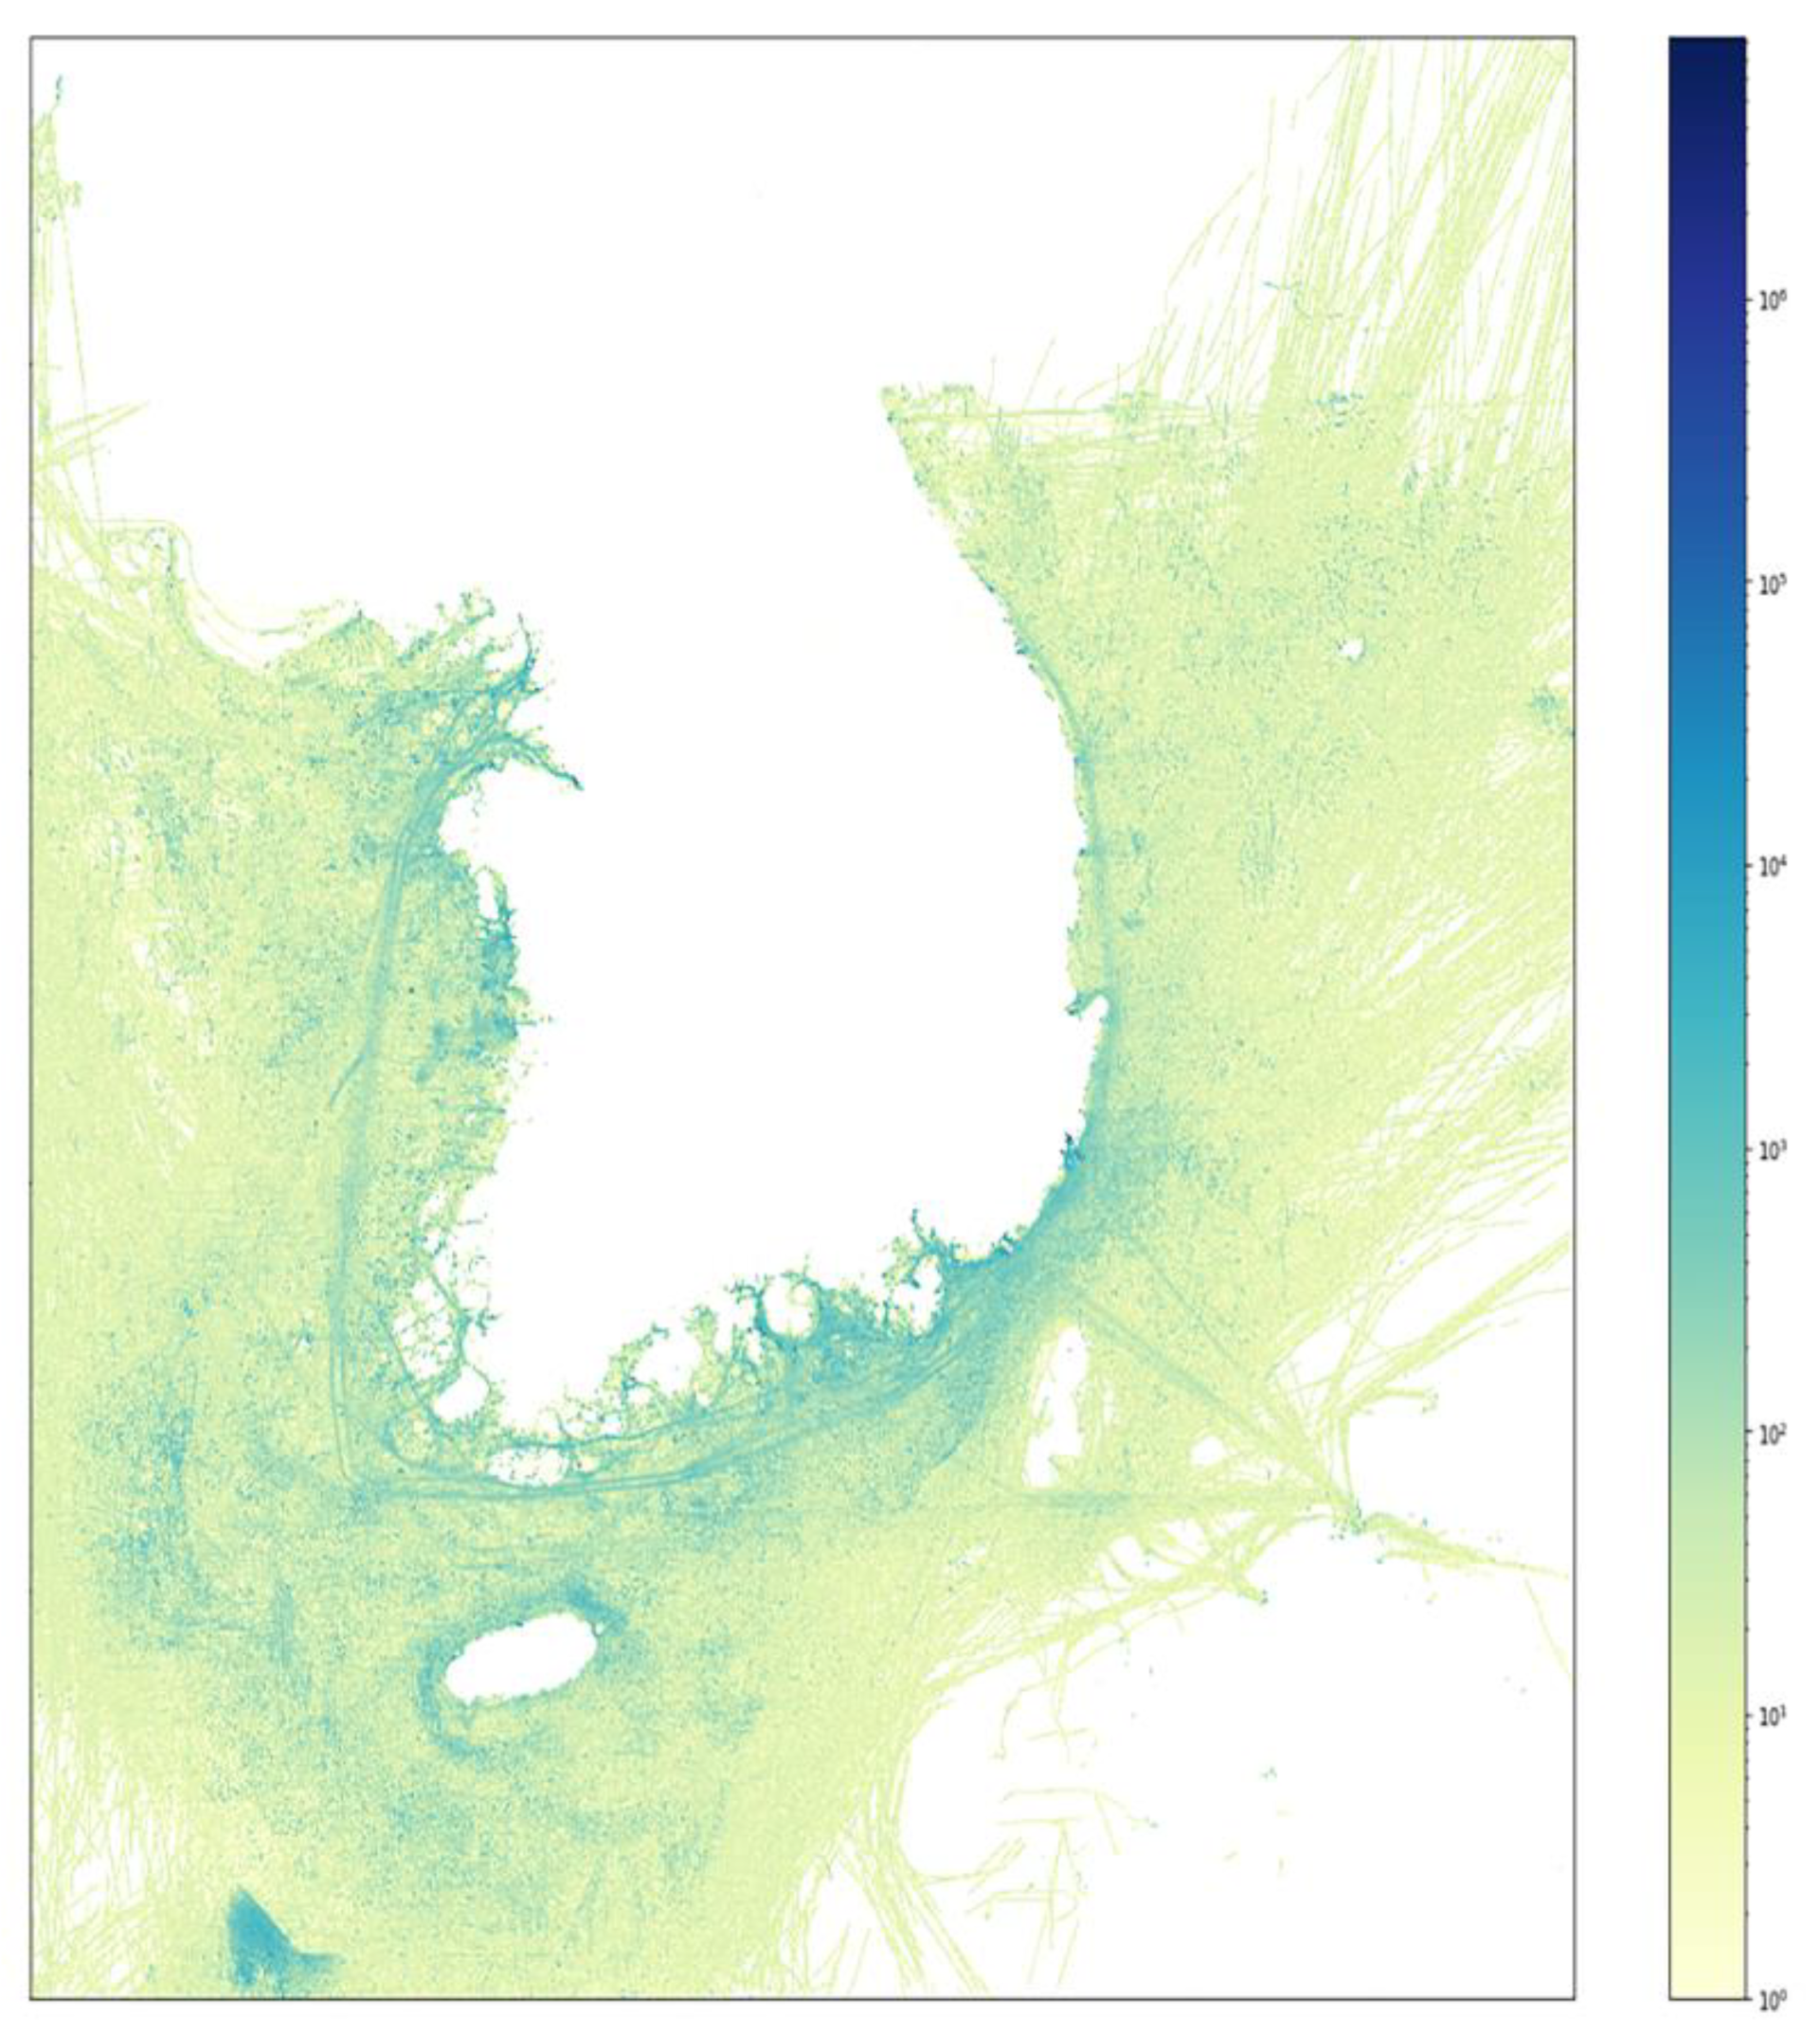
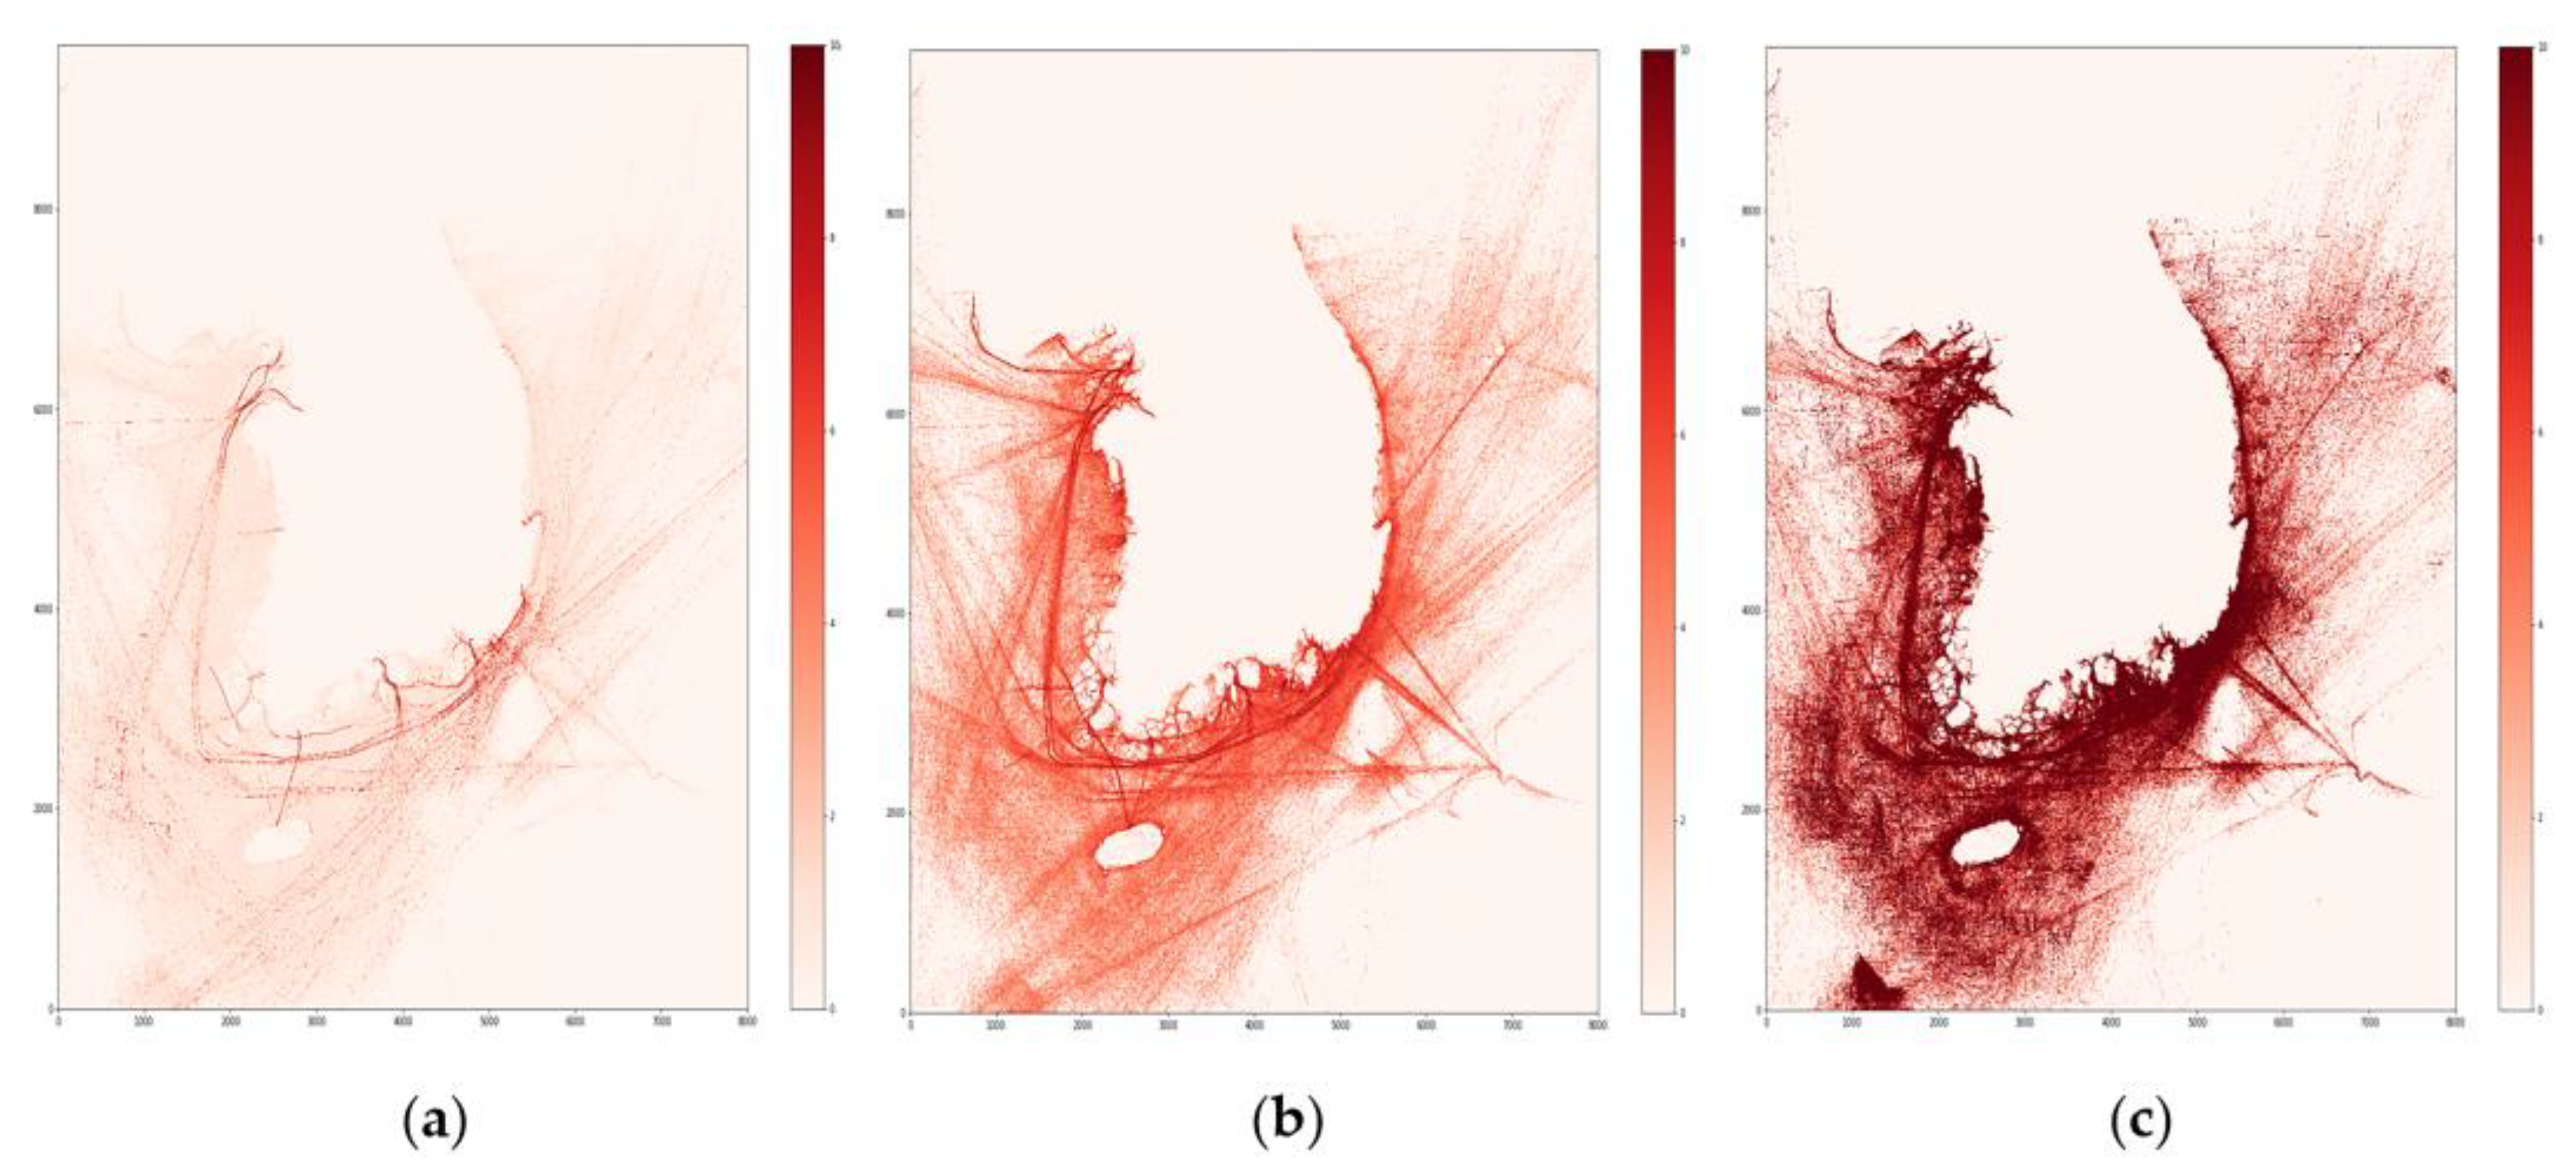
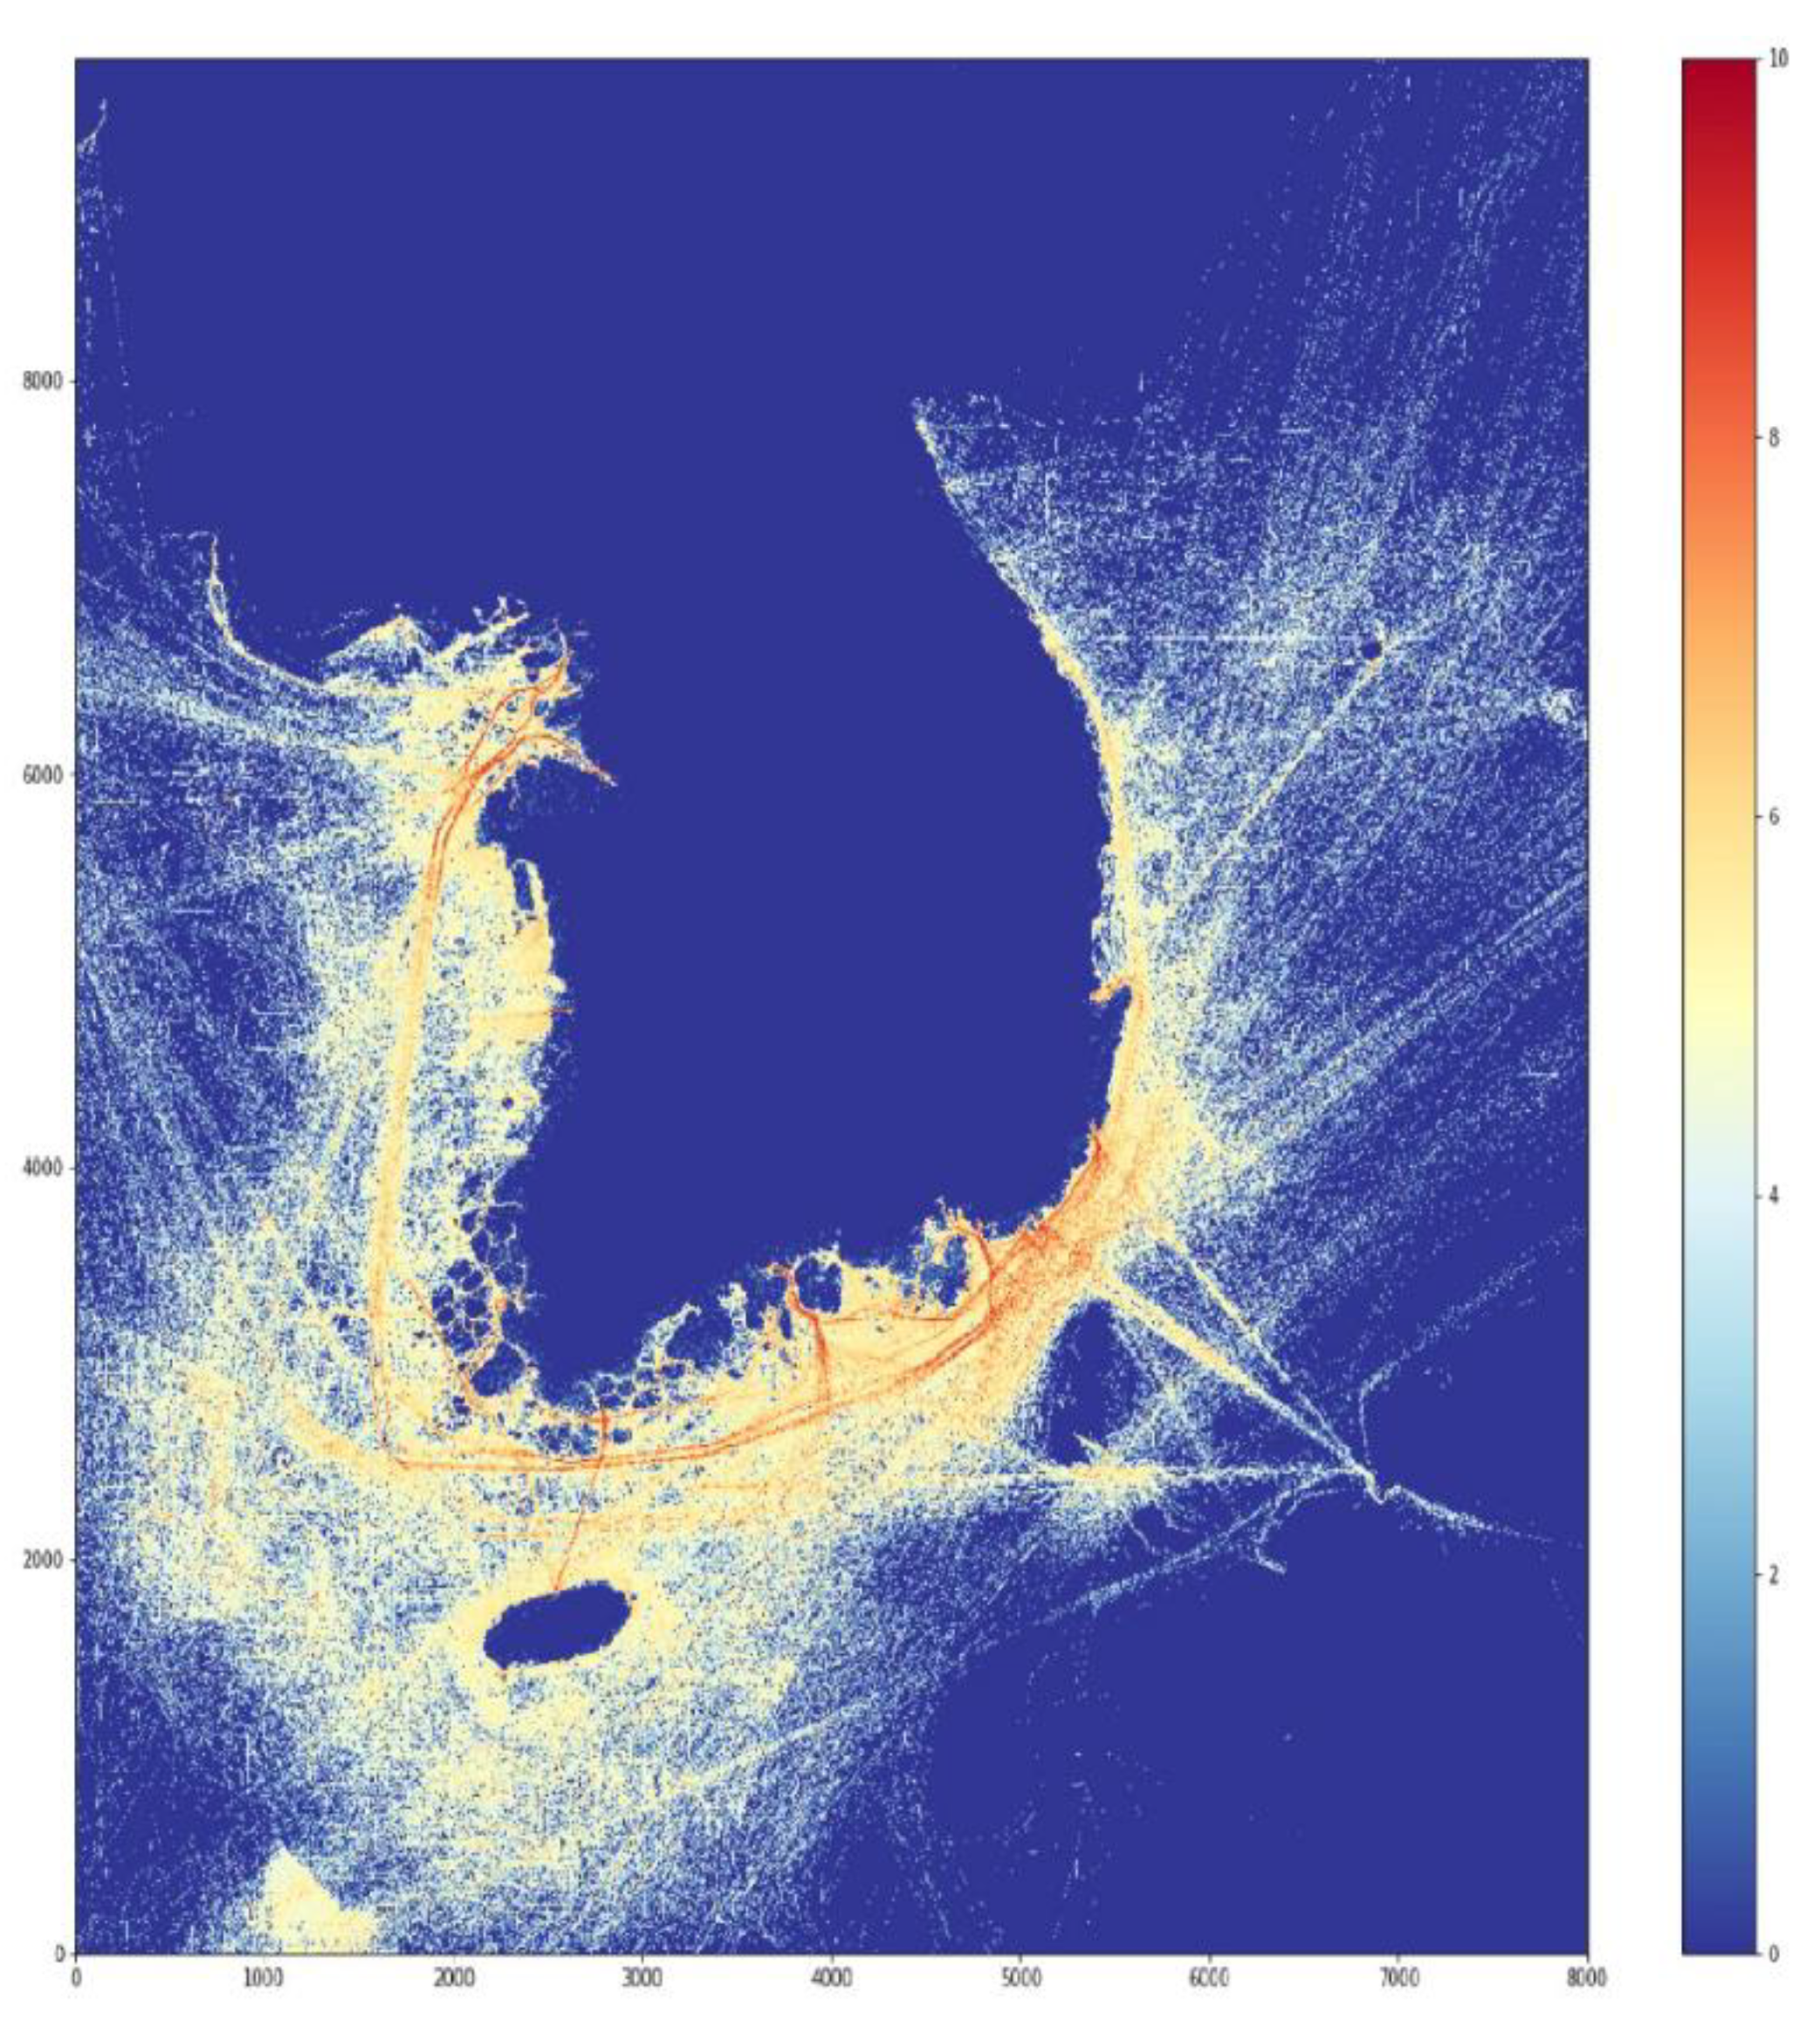
4.1. Visualization and Analysis of Marine Traffic Distribution

The marine traffic distribution status of the LOA, SOG, and frequency over the entire scope of the Korean coastal waters was examined using AIS data. In this section, typical data for the average LOA, average SOG, and average frequency of the passing ships for the sea areas gridded at approximately 100 m intervals were analyzed, and the maritime traffic status was visualized based on each distribution characteristic, as Figure 10 shows.
(a)
Maritime traffic status based on the LOA characteristics:
  • Most grids in Korean coastal waters were identified as Groups 1–3.
  • The port entry and exit routes, the designated routes within coastal waters, and the grids of navigable waters connecting each route were identified as Group 3 or higher.
(b)
Maritime traffic status based on the SOG characteristics:
  • Most grids in Korean coastal waters were identified as Groups 3–5.
  • The port entry and exit routes, the designated routes within coastal waters, and the grids of navigable waters connecting each route were identified as Group 5 or higher.
(c)
Maritime traffic status based on frequency characteristics:
  • Most grids in Korean coastal waters were identified as Groups 6–8.
  • The port entry and exit routes, the designated routes within coastal waters, and the grids of navigable waters connecting each route were identified as Group 8 or higher.

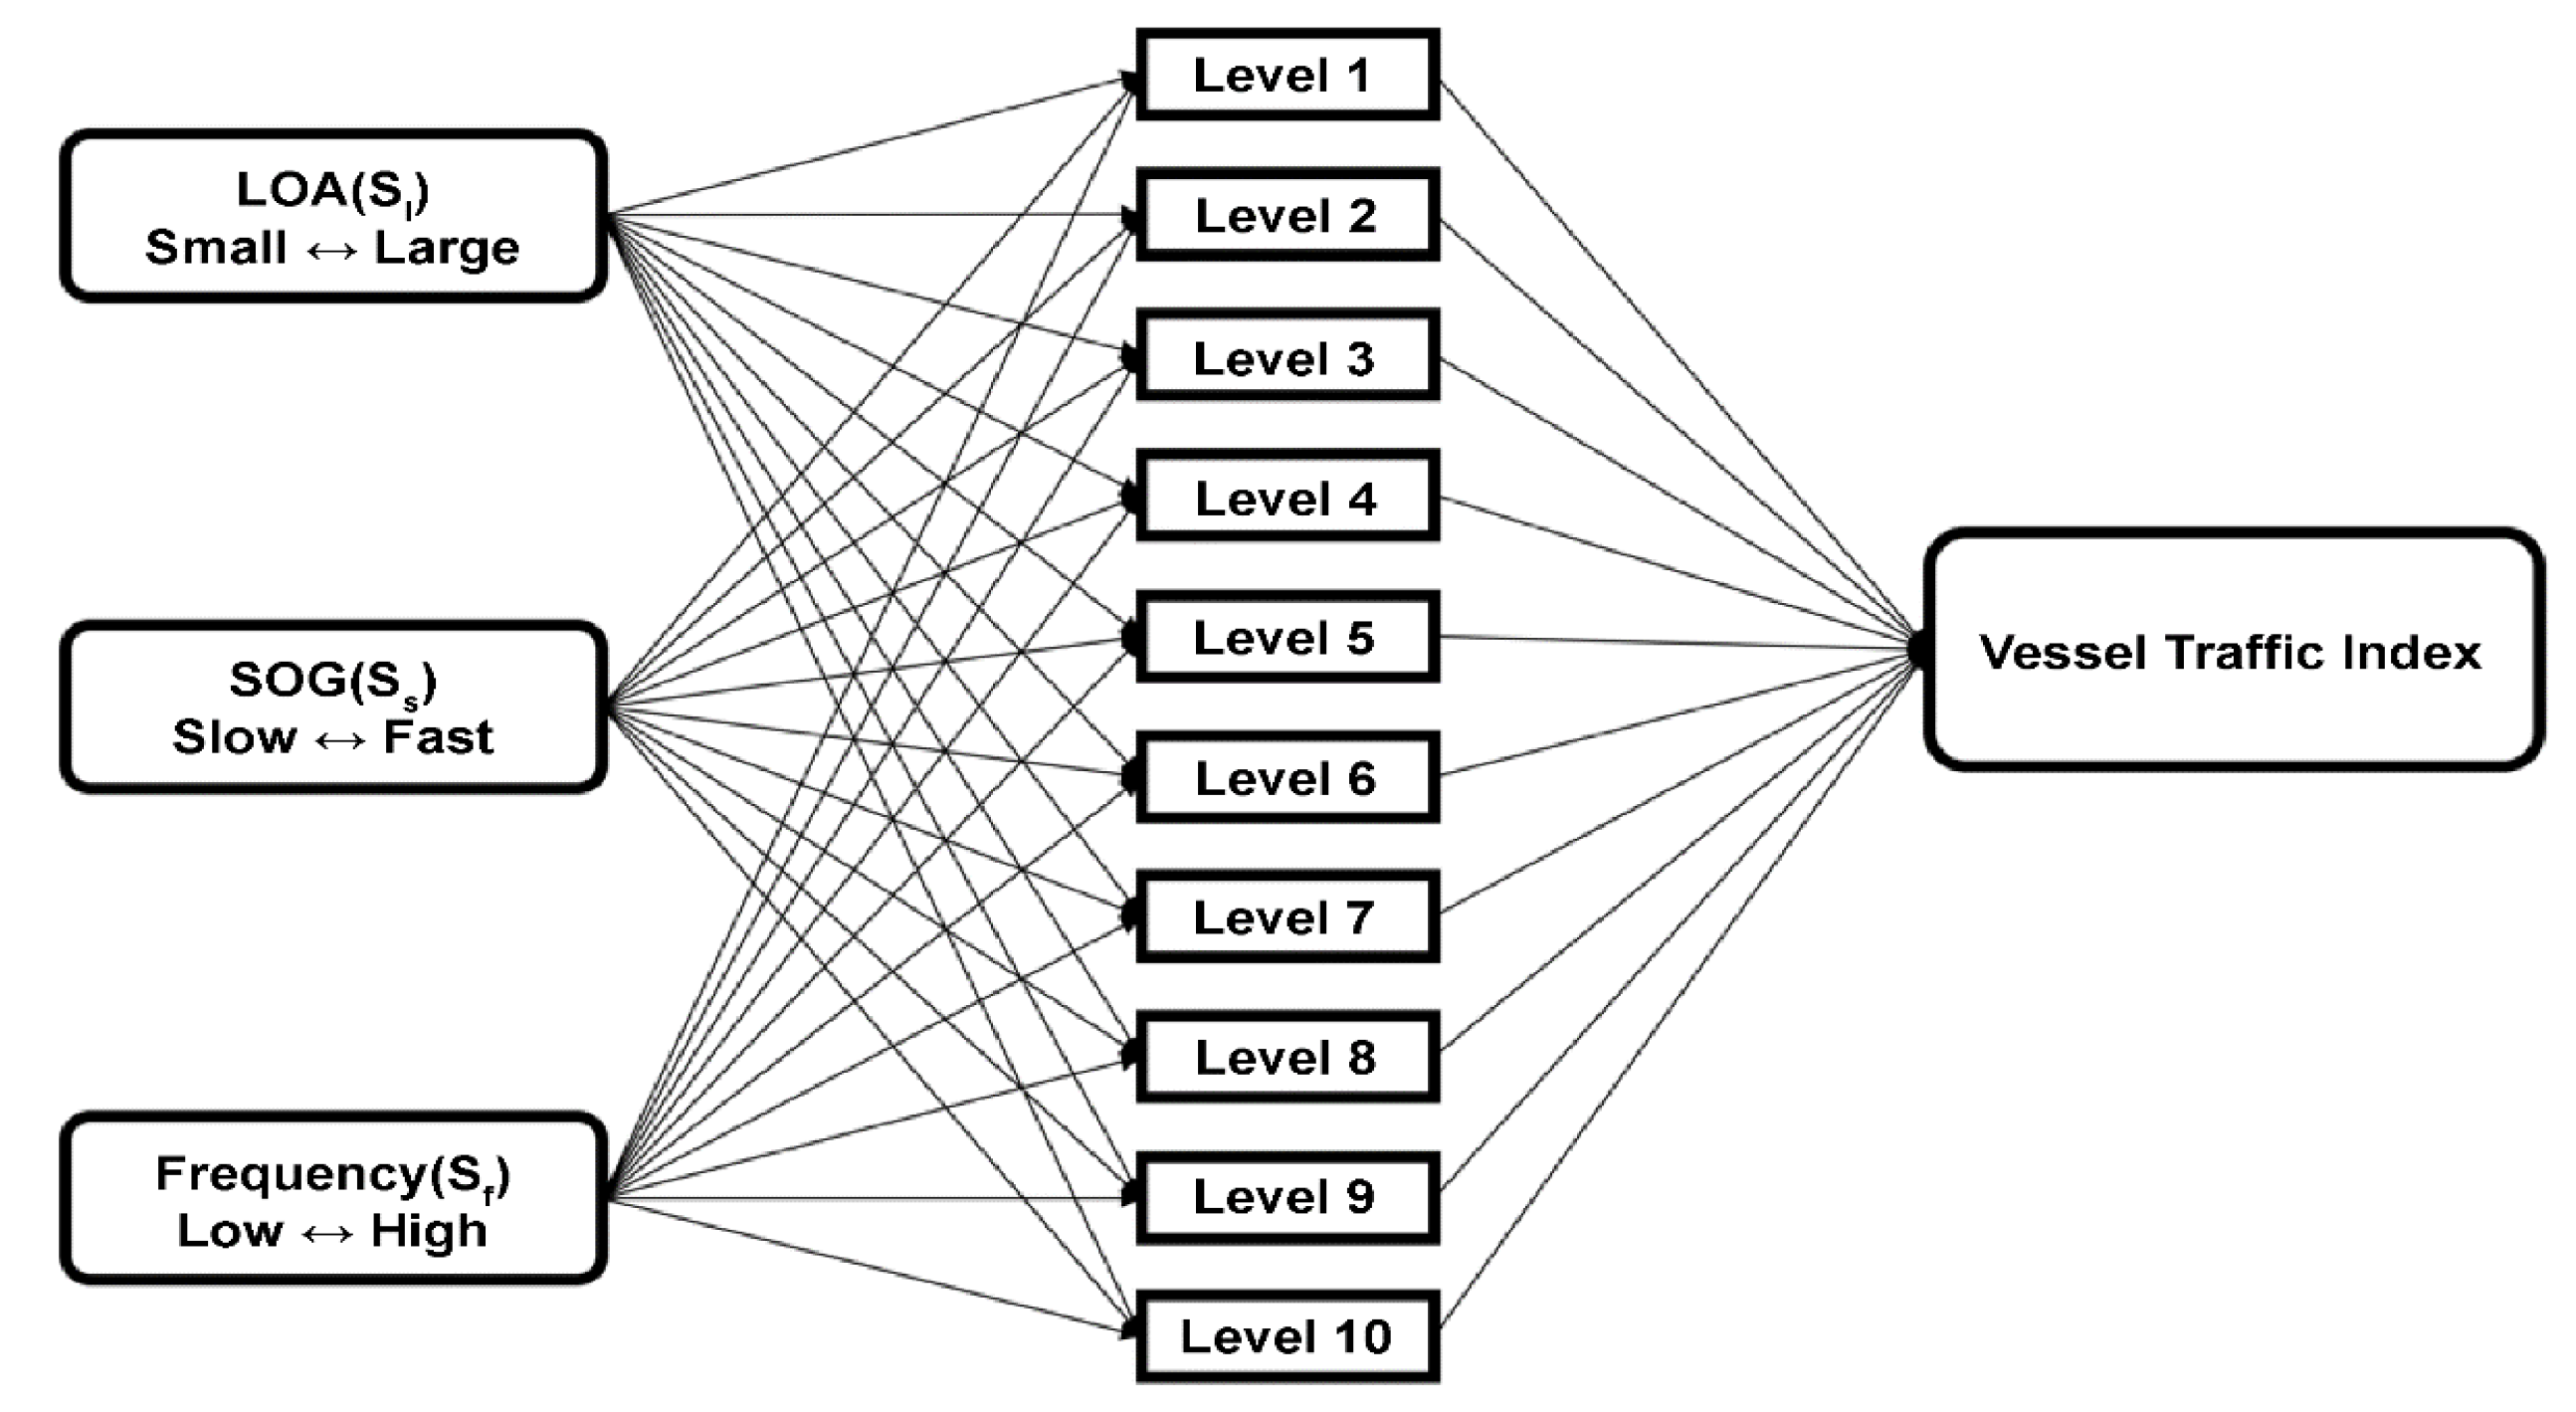
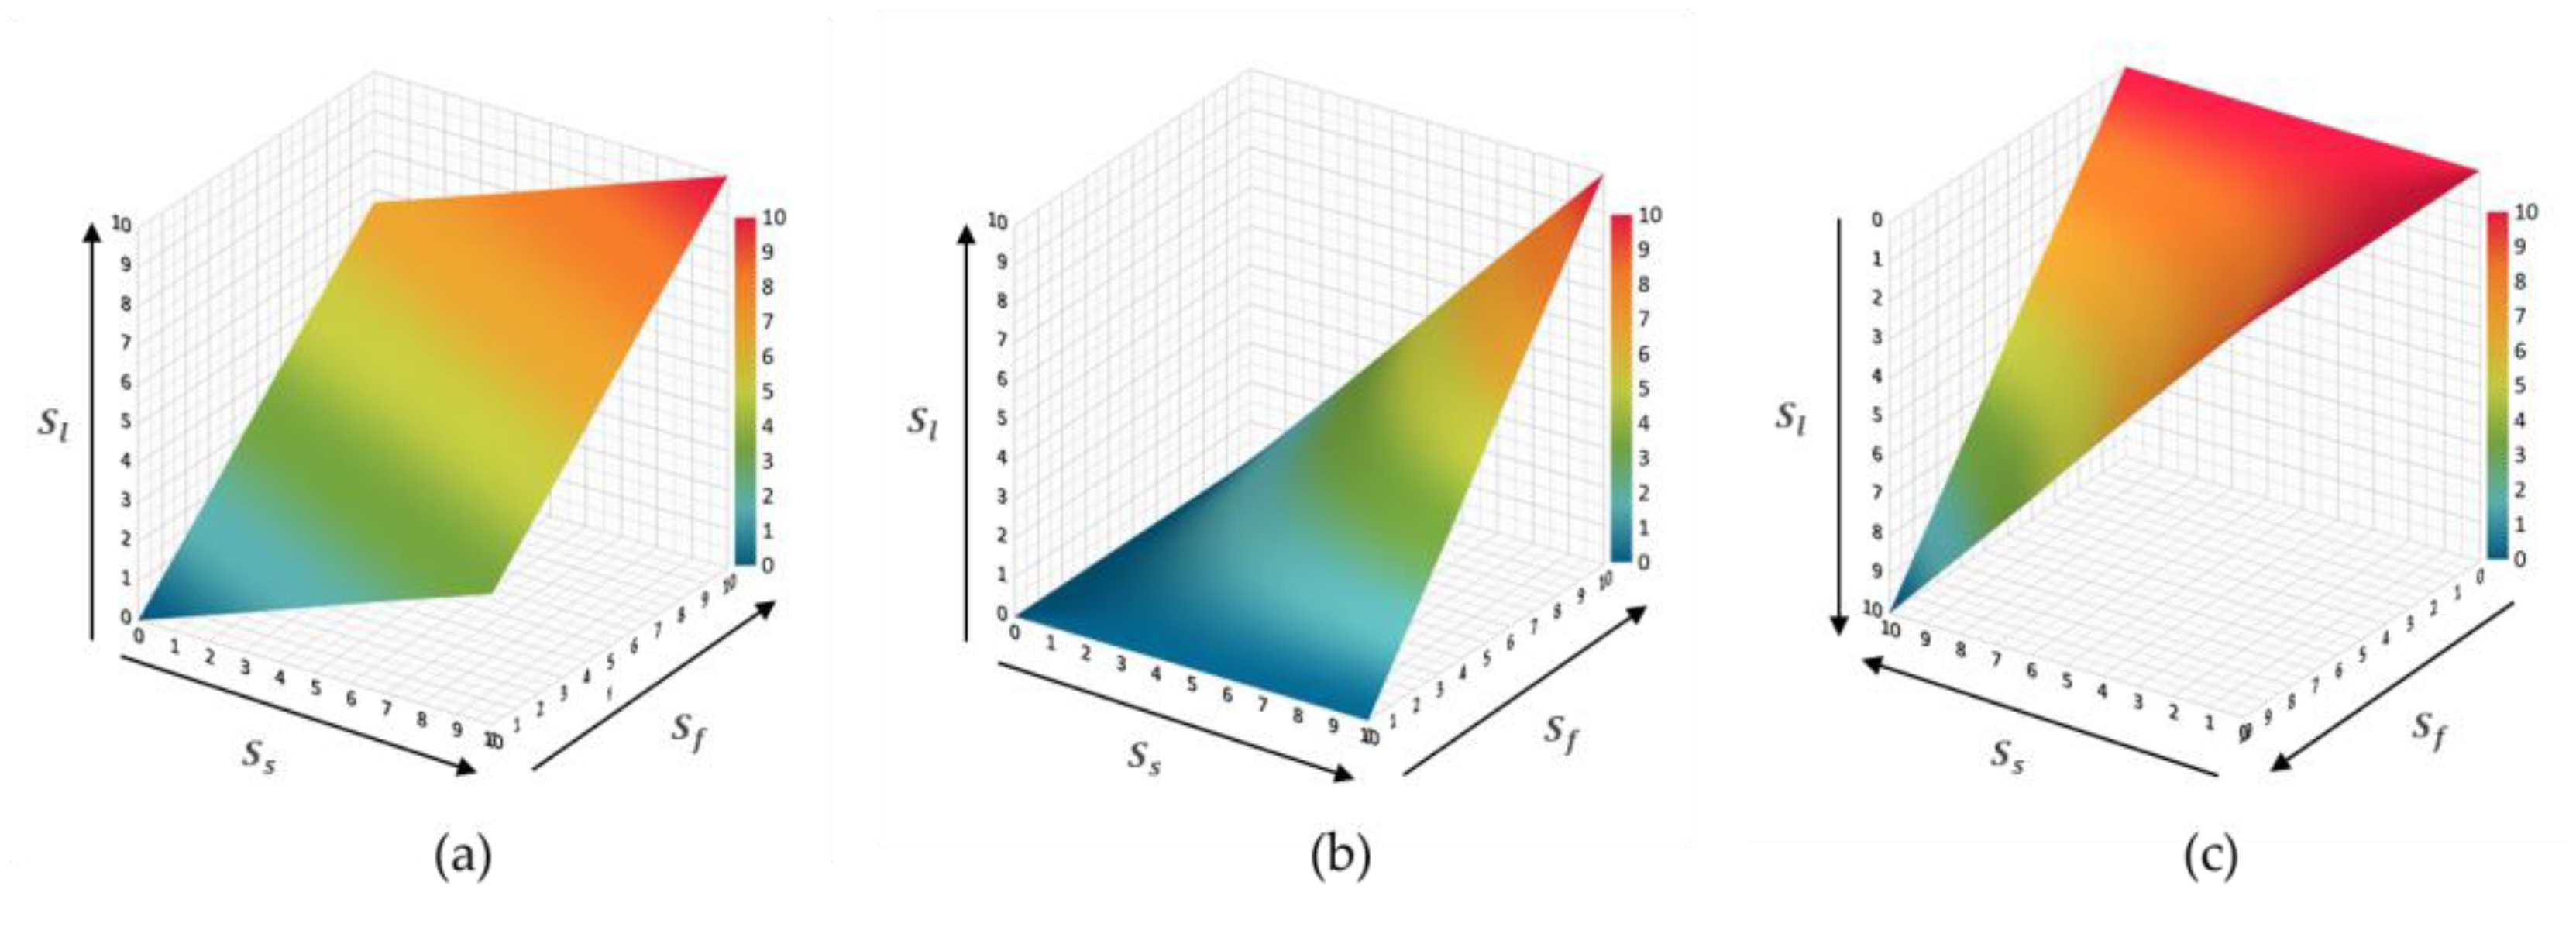
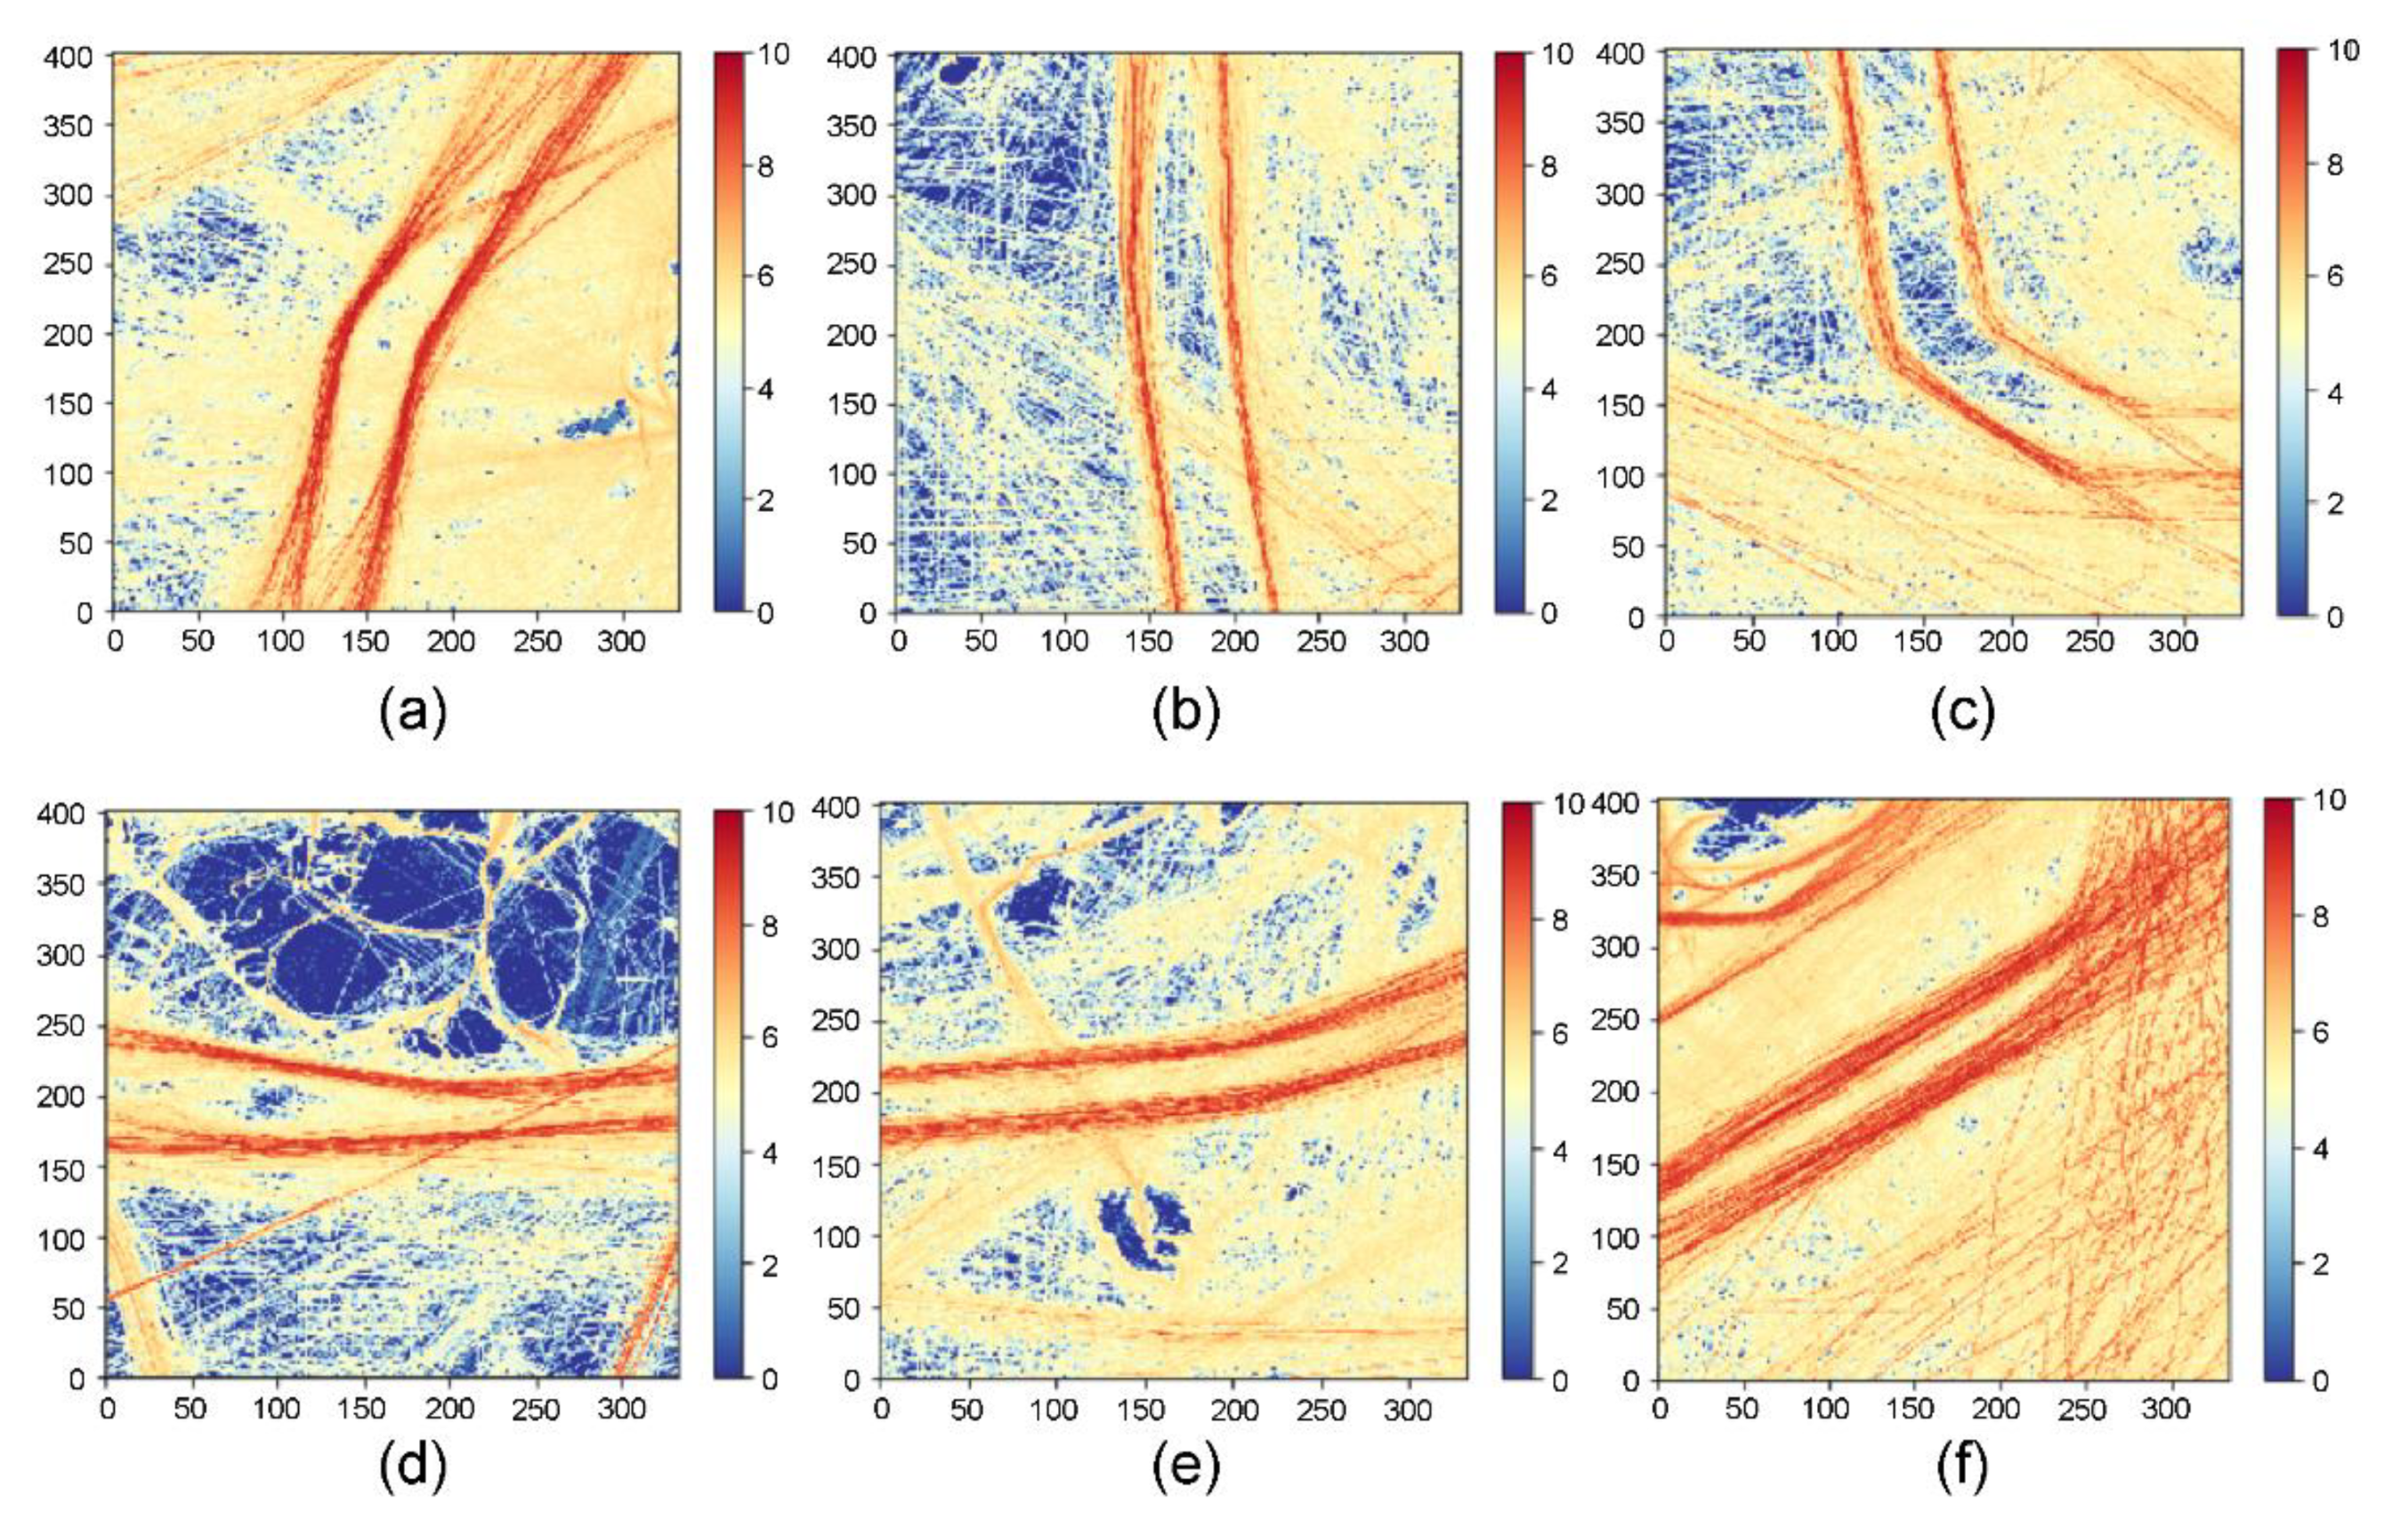
4.2. Design and Application of Vessel Traffic Index

An auxiliary indicator is required to determine the relative level by comparing the utilization level of each grid area to the total level based on the LOA, SOG, and frequency distributions in Korean coastal waters. From the perspective of a specific sea area, the utilization level for each sea area may be grouped into phases based on traffic distribution parameters, such as LOA, SOG, and frequency. As a result, the VTI was determined by calculating the representative values of LOA, SOG, and frequency for each grid throughout the gridded sea areas. The VTI, which can be used as an auxiliary index to determine the vessel traffic utilization in each sea area by grid in comparison with the total scope of the Korean coastal waters, is defined as follows:
VTI   f   S l ,   S s ,   S f ,
where S l is the average LOA by grid; S s is the average SOG by grid; and S f is the average frequency by grid.
The level settings for VTI using the average LOA ( S l ), SOG ( S s ), and frequency ( S f ) of the passing ships are illustrated in Figure 11. Based on the review results of the distribution characteristics of the passing ships in Korean coastal waters, Level 1 was applied if the average LOA was short, the average SOG was slow, and the average frequency was low. In contrast, Level 10 was applied if the average LOA was long, the average SOG was fast, and the average frequency was high.
The average operation, the product operation, or the product of the reciprocal operation can be used to derive the VTI using the representative values of the average LOA, average SOG, and average frequency of the passing ships in each grid, as shown in Figure 12. The average operation method is generally used for the indicator expression, and the degree of influence can be adjusted using the product operation or the product of the reciprocal operation, depending on the purpose of the indicator. In this study, the average operation method was used because the average LOA ( S l ), average SOG ( S s ), and average frequency ( S f ) for the VTI were considered to be of equal importance.
The conceptual expressions of the average operation, the product operation, and the product of the reciprocal operation for the VTI can be defined as follows:
Average operation: Average S l ,   S s ,   S f ;
Product operation: S l × S s × S f / C p ;
Product of the reciprocal operation: 1 S l × 1 S s × 1 S f / C pr ,
Where C p   and   C pr are the coefficients for the product operation and the product of the reciprocal operation, respectively.
Table 8 shows the results of classifying the VTI into 10 levels, considering the characteristics of the average LOA, average SOG, and average frequency of the passing ships in Korean coastal waters.
Figure 13 shows the results of visualizing the representative VTI values from levels 1 to 10 for each grid and applying them to the entire scope of the Korean coastal waters. The major flow linking the east, south, and west coasts appears according to the VTI for each grid. Secondary flows linked to the main flow were also examined for the ocean and coastal waters. Moreover, the sea-area utilization status for each grid in navigable waters, excluding the specified routes, can be observed.
VTI levels of eight or more were identified, which were relatively high for the passages to and from major ports in Korea (e.g., Incheon Port, Mokpo Port, Yeosu Port, Busan Port, Ulsan Port), the designated routes within coastal waters (e.g., Ongdo passage, Bukmaemulsudo passage, Nammaemulsudo passage, Bogildo passage, Geomundo passage, Hongdo Namhae passage), and in the range of navigable waters connecting each route. Next, VTI levels of five to seven were identified in the range of navigable waters connected to the port entry and exit routes in the ocean and coastal waters, and the designated routes in coastal waters.
To compare the designated routes in Korean coastal waters and the utilization status of sea areas in nearby waters using VTI, six designated routes (Ongdo passage, Bukmaemulsudo passage, Nammaemulsudo passage, Bogildo passage, Geomundo passage, and Hongdo Namhae passage) were selected, and the range of each target sea area was set as a square area of 20 miles [33]. These sea areas have several islands in the Korean coastal waters, complicated coastlines, many large, medium, and small ships, and fishing boats.
All six designated routes (a–e) in the grid range within the target sea area showed VTIs of eight or higher, indicating that the sea-area utilization level was considerably higher than that of the nearby sea areas. Table 9 shows the results of quantitatively presenting the comparison of the usage status by sea area.
Figure 14 shows the results of visualizing and presenting the comparison of the usage status by sea area. The X and Y axes of the graph represent the number of grids.
Using the VTI in this manner offers the benefit of quickly identifying the main/secondary flows of the Korean coastal waters. Furthermore, although the VTI is lower than the main/secondary flows in the target sea area, it may be used effectively as basic data for building a coastal marine network, because it can identify the points where vessel traffic joins or exits.

5. Discussion

AIS data-based analysis of static, dynamic, and navigational information is required to statistically define the characteristics of maritime traffic distribution throughout the entirety of the Korean coastal waters. However, since geographical and temporal variables have a significant impact on AIS data, vessel traffic and traffic flow may differ depending on the range and time period of analysis. Moreover, the analysis results may differ depending on the number of AIS data receiving cycles and the existence of erroneous data. This study considered the following two points regarding the use of AIS data to complement these aspects:
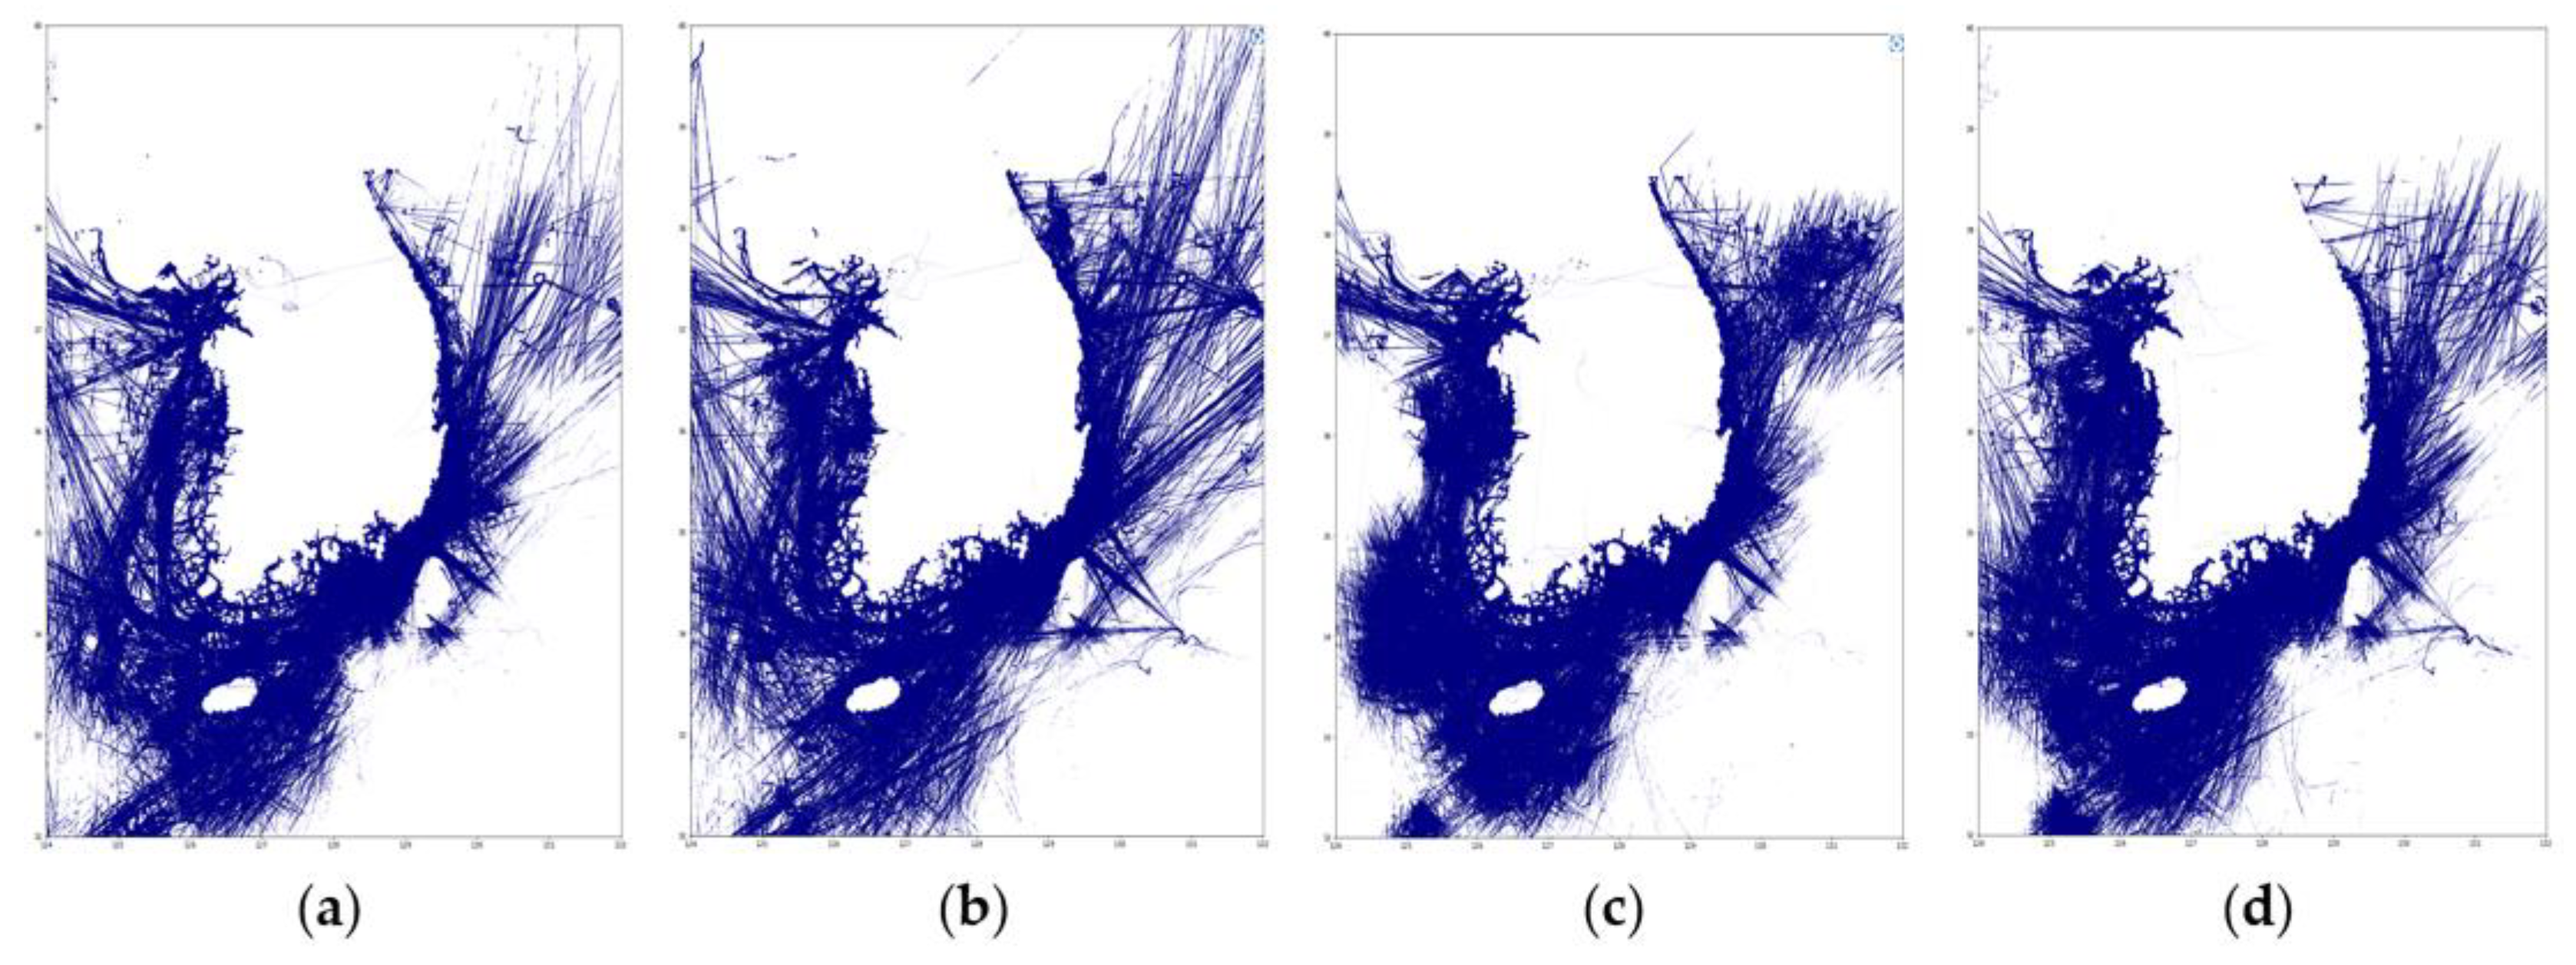
  • To minimize the impact of changes in spatial and temporal factors in this study, as well as to understand the average traffic volume and customary traffic flows of the passing ships, AIS data analysis was performed for a total of 12 days while considering seasonal characteristics for the entire scope of the Korean coastal waters.
  • Data preprocessing, including treatment for missing values and outliers, was undertaken to improve the reliability of the AIS data and eliminate the identified error values.
In addition, this study attempted to represent the maritime traffic distribution characteristics in the form of grid-type data with compatibility and connectivity, so that future research on the development of maritime transportation networks of the Korean coastal waters may be undertaken efficiently. As a result, the entire scope of the Korean coastal waters was gridded at 100 m intervals, and the LOA, SOG, and frequency of the passing ships were quantified. Moreover, VTI was used to detect the amount of vessel traffic usage in each grid area compared to the entire scope of the Korean coastal waters by calculating representative values for each grid based on the average LOA, average SOG, and average frequency of the passing ships.
However, this study has the following limitations: First, only ship factors such as LOA, SOG, and frequency among AIS data were considered and presented in this study to identify the maritime traffic distribution characteristics and sea-area utilization level for the spatial scope of the Korean coastal waters. However, it is necessary to comprehensively consider various factors in order to design a traffic route for the safe navigation of ships, such as ship factors (e.g., size and maneuverability of target vessels that are currently using or will be using the passage, and speed of passage), environmental factors (e.g., wind, current, waves), geographical factors (e.g., position, length, shape of the route, and water depth), navigational-aid factors (e.g., layout and performance of navigational aids), and human factors (e.g., experience and judgment of captains and pilots) [34]. Second, when presenting the VTI, the average LOA, average SOG, and average frequency of the passing ships were all considered equal. Each of these factors was classified into ten levels, and the vessel-traffic utilization level in each grid was displayed. However, the impacts of LOA, SOG, and frequency on sea-area utilization may differ for each factor. Therefore, it is necessary to perform a survey/convergence of views aimed at sea-area users or navigation specialists, and then reflect the weights based on the findings.

6. Conclusions and Future Work

Offshore wind farms and marina ports have recently been constructed to exploit Korean coastal waters in various ways. Research is being conducted on the development of new modes of ship operations, such as autonomous ships and water-surface flying ships. As a result, the marine traffic environment in Korean coastal waters is expected to become more complex. To guarantee the safe navigation of ships, it is vital to respond preemptively to changes in the ship’s operating environment.
Consequently, the Korean government advocates a plan to construct a coastal maritime transportation network and the implementation of relevant regulations to ensure maritime transportation space in the Korean coastal seas via the formation of a maritime transportation network. In relation to these government policies, it is necessary to first identify the maritime traffic characteristics of each sea area by reviewing the maritime traffic distribution status and operating environment conditions in Korean coastal waters to establish a CMTN that guarantees the safe navigation of ships.
Thus, this study used AIS data analysis to present quantitative evaluation results on marine traffic distribution characteristics and utilization levels for the entire Korean coastal waters in grid form for greater consistency and compatibility.
The findings from the AIS data analysis of the Korean coastal marine traffic distribution are shown in Table 10.
To comprehend the utilization level of each grid in relation to marine traffic distribution, the average LOA, SOG, and frequency of the passing ships were computed, and the VTI was given on a scale of one to ten. The following is the outcome of an analysis of sea-area utilization levels according to VTI for the entire scope of the Korean coastline waters, the six designated passages presently in operation, and the neighboring sea areas:
  • VTIs of eight or higher were identified for the routes to and from major domestic ports (e.g., Incheon Port, Mokpo Port, Yeosu Port, Busan Port, and Ulsan Port), the designated routes within Korean coastal waters (e.g., Ongdo passage, Bukmaemulsudo passage, Nammaemulsudo passage, Bogildo passage, Geomundo passage, and Hongdo Namhae passage), and the range of navigable waters linking each route. VTI levels were identified as 5–7 in the range of navigable waters connected to the designated routes in coastal waters, and the port entry and exit passages in the ocean and coastal waters.
  • All six designated routes (Ongdo, Bukmaemulsudo, Nammaemulsudo, Bogildo, Geomundo, and Hongdo Namhae passages) had a VTI of eight or higher. Thus, the level of sea-area utilization was considerably higher than that of the nearby sea areas. In the case of the sea area near the designated passage, most of the VTI values were in the range of five to six. Although the utilization level of the sea area is lower than that of the designated passages, various types of traffic flow exist, such as connecting to or departing from the existing flows, depending on the location of each passage.
It was partially expected before the study that the VTI would be considered relatively high due to the heavy traffic at major ports in the Republic of Korea. However, the point of this study can be suggested to be suitable for quantitatively and relatively comparing the distribution and utilization of vessels by grid-type VTI based on AIS data on all coastal waters, including major ports, in the Republic of Korea. Moreover, since the data can be used as grid data, they are efficient in terms of compatibility and connectivity with related research. The VTI enables a detailed analysis while allowing a relatively simple understanding of the usage conditions of ships by sea area. In this regard, the findings of this study are expected to provide practical assistance for future research on the development of maritime transportation networks in the coastal Korean waters. However, follow-up research incorporating the following factors as well as the limitations mentioned in this study is required:
  • It is necessary to portray these characteristics according to the type of vessel traffic by sea area. In this study, an assessment of vessel traffic was performed based on grid-type data. In the future, while developing the CMTN, the data may be separated into basic and connection sections based on the type of vessel traffic (head-on situation, overtaking, and crossing situation). Thus, detailed results based on the reflection of weights according to the vessel traffic type by sea area are required.
  • A CMTN should be configured according to the purpose of each type. Based on the AIS data, a fundamental analysis of the maritime traffic distribution in Korean coastal waters was conducted in this study. Based on the findings of this study, it is necessary to develop sub-concepts for each type of CMTN, such as open-sea passages, coastal passages, access passages, and port entry/exit passages, as well as suitable passage design criteria.

Author Contributions

Conceptualization, H.-S.K. and Y.-S.L.; methodology, H.-S.K., Y.-S.L. and E.L.; validation, H.-S.K., Y.-S.L. and K.K.; investigation, H.-S.K.; resources, E.L. and J.-W.H.; writing—original draft preparation, H.-S.K.; writing—review and editing, E.L., E.-J.L. and J.-W.H.; supervision, I.-Y.G., Y.-S.L. and K.K. All authors have read and agreed to the published version of the manuscript.

Funding

This study was partly supported by the Institute of Information & communications Technology Planning & Evaluation(IITP) grant funded by the Korea government(MSIT)(No.2020-0-01441, Artificial Intelligence Convergence Research Center(Chungnam National University)) and “Regional Innovation Strategy (RIS)” through the National Research Foundation of Korea(NRF) funded by the Ministry of Education(MOE)(2021RIS-004).

Institutional Review Board Statement

Not applicable.

Informed Consent Statement

Not applicable.

Data Availability Statement

The data are available on request owing to privacy restrictions. The data presented in this study are partially available upon request from the corresponding author.

Conflicts of Interest

The authors declare no conflict of interest. The funders had no role in the design of the study; in the collection, analyses, or interpretation of data; in the writing of the manuscript; or in the decision to publish the results.

References

  1. MOTIE (Ministry of Trade, Industry and Energy). Renewable Energy 3020 Implementation Plan Announced. Available online: http://www.motie.go.kr/motie/ne/presse/press2/bbs/bbsView.do?bbs_cd_n=81&bbs_seq_n=159996 (accessed on 20 December 2022).
  2. Park, M.; Park, S.G.; Seong, B.C.; Choi, Y.J.; Jung, S.H. Current status and prospective of offshore wind power to achieve Korean renewable energy 3020 plan. J. Korean Soc. Environ. Eng. 2021, 43, 196–205. [Google Scholar] [CrossRef]
  3. Im, I.K.; Shin, D.R.; Jeong, J.P. Components for Smart Autonomous Ship Architecture Based on Intelligent Information Technology. Procedia Comput. Sci. 2018, 134, 91–98, ISSN 1877-0509. [Google Scholar] [CrossRef]
  4. Yun, G.-H. A Study on the Navigation Rules of Wing-In-Ground Effect Craft. J. Korean Soc. Mar. Environ. Saf. 2013, 19, 491–496. [Google Scholar] [CrossRef]
  5. Patera, A.; Pataki, Z.; Kitsiou, D. Development of a webGIS Application to Assess Conflicting Activities in the Framework of Marine Spatial Planning. J. Mar. Sci. Eng. 2022, 10, 389. [Google Scholar] [CrossRef]
  6. Retzlaff, R.; LeBleu, C. Marine Spatial Planning: Exploring the role of planning practice and research. J. Plan. Liter. 2018, 33, 466–491. [Google Scholar] [CrossRef]
  7. Chae, D.R. A study on the necessity of introducing marine spatial planning in Korea. J. Korean Soc. Mar. Environ. Saf. 2009, 15, 237–242. [Google Scholar]
  8. Kim, J.K. Semi-Continuous Spatial Statistical Analysis Using AIS Data for Vessel Traffic Flow Characteristics in Fairway. J. Mar. Sci. Eng. 2021, 9, 378. [Google Scholar] [CrossRef]
  9. Yoo, Y.; Kim, T.-G. An Improved Ship Collision Risk Evaluation Method for Korea Maritime Safety Audit Considering Traffic Flow Characteristics. J. Mar. Sci. Eng. 2019, 7, 448. [Google Scholar] [CrossRef]
  10. Bellsolà Olba, X.; Daamen, W.; Vellinga, T.; Hoogendoorn, S.P. Risk Assessment Methodology for Vessel Traffic in Ports by Defining the Nautical Port Risk Index. J. Mar. Sci. Eng. 2020, 8, 10. [Google Scholar] [CrossRef]
  11. Yildiz, S.; Tonoğlu, F.; Uğurlu, Ö.; Loughney, S.; Wang, J. Spatial and Statistical Analysis of Operational Conditions Contributing to Marine Accidents in the Singapore Strait. J. Mar. Sci. Eng. 2022, 10, 2001. [Google Scholar] [CrossRef]
  12. Li, Z.; Yao, C.; Zhu, X.; Gao, G.; Hu, S. A decision support model for ship navigation in Arctic waters based on dynamic risk assessment. J. Ocean Eng. 2022, 244, 110427, ISSN 0029-8018. [Google Scholar] [CrossRef]
  13. MOF (Ministry of Oceans and Fisheries). Harbour and Fishery Design Criteria; Ministry of Oceans and Fisheries: Sejong City, Republic of Korea, 2020. [Google Scholar]
  14. Hwang, H.K.; Kim, B.S.; Shin, I.S.; Song, S.K.; Nam, K.T. Development of analysis system for vessel traffic display and statistics based on maritime-bigdata. J. Korean Inst. Inf. Commun. Eng. 2016, 20, 1195–1202. [Google Scholar] [CrossRef]
  15. Kang, W.-S.; Park, Y.-S. A study on the design of coastal fairway width based on a risk assessment model in Korean waterways. Appl. Sci. 2022, 12, 1535. [Google Scholar] [CrossRef]
  16. Lee, H.-T.; Lee, J.-S.; Yang, H.; Cho, I.-S. An AIS data-driven approach to analyze the pattern of ship trajectories in ports using the DBSCAN algorithm. Appl. Sci. 2021, 11, 799. [Google Scholar] [CrossRef]
  17. Oh, J.Y.; Kim, H.J. Spatiotemporal Analysis of vessel trajectory data using network analysis. J. Korean Soc. Mar. Environ. Saf. 2020, 26, 759–766. [Google Scholar] [CrossRef]
  18. You, Y.J.; Kim, J.H.; Seo, M.K. A study on the prediction of sailing performance for a LNGC based on the AIS data. J. Soc. Nav. Arc Publications: Republic of Korea. 2017, 54, 275–285. [Google Scholar] [CrossRef]
  19. Wen, Y.; Huang, Y.; Zhou, C.; Yang, J.; Xiao, C.; Wu, X. Modelling of marine traffic flow complexity. Ocean Eng. 2015, 104, 500–510. [Google Scholar] [CrossRef]
  20. Suo, Y.; Chen, W.; Claramunt, C.; Yang, S. A ship trajectory prediction framework based on a recurrent neural network. Sensors 2020, 20, 5133. [Google Scholar] [CrossRef]
  21. Xiao, Z.; Fu, X.; Zhang, L.; Zhang, W.; Liu, R.W.; Liu, Z.; Goh, R.S.M. Big data driven vessel trajectory and navigating state prediction with adaptive learning, motion modeling and particle filtering techniques. IEEE Trans. Intell. Transp. Syst. 2022, 23, 3696–3709. [Google Scholar] [CrossRef]
  22. Shi, Y.; Long, C.; Yang, X.; Deng, M. Abnormal ship behavior detection based on AIS data. Appl. Sci. 2022, 12, 4635. [Google Scholar] [CrossRef]
  23. Bakdi, A.; Glad, I.K.; Vanem, E.; Engelhardtsen, Ø. AIS-based multiple vessel collision and grounding risk identification based on adaptive safety domain. J. Mar. Sci. Eng. 2020, 8, 5. [Google Scholar] [CrossRef] [Green Version]
  24. Oh, M.J.; Roh, M.I.; Park, S.W.; Chun, D.H.; Son, M.J.; Lee, J.Y. Operational analysis of container ships by using maritime big data. J. Mar. Sci. Eng. 2021, 9, 438. [Google Scholar] [CrossRef]
  25. Park, Y.S.; Kim, J.K.; Kim, J.S.; Kim, J.S.; Lee, Y.S.; Park, S.W. A basic study on establishment of sea trial prohibition waterway based on marine traffic survey. J. Korean Soc. Mar. Eng. 2015, 39, 318–325. [Google Scholar] [CrossRef]
  26. Kang, W.S.; Song, T.H.; Kim, Y.D.; Park, Y.S. A study on seasonal variation in marine traffic congestion on major port and coastal routes. J. Korean Soc. Mar. Environ. Saf. 2017, 23, 1–8. [Google Scholar] [CrossRef]
  27. Jung, C.Y.; Yoo, S.L. Analysis on the navigation risk factors in Gunsan coastal area (1). J. Korean Soc. Fish. Technol. 2017, 53, 286–292. [Google Scholar] [CrossRef]
  28. Kim, D.H.; Kim, J.M.; Yoon, B.C.; Chang, E.M.; Choi, Y.S. Development plan of grid system utilizing spatial information. J. Korea Inf. Soc. 2015, 23, 43–55. [Google Scholar] [CrossRef]
  29. KRIHS. The Use of Spatial Big Data for Planning Policy Support, S. Korea; Korea Research Institute for Human Settlements: Sejong City, Republic of Korea, 2014. [Google Scholar]
  30. Keum, J.S.; Jang, W.J. Evaluation of the navigational risk level in coastal waterway using fuzzy logic. J. Korean Soc. Mar. Environ. Saf. 2006, 12, 53–59. [Google Scholar]
  31. Park, M.J. A Basic Study on the Development of the Marine Traffic Risk Index Model. MPil Dissertation, Korea Maritime and Ocean University, Busan, Republic of Korea, 2021. [Google Scholar]
  32. Lee, M.K.; Park, Y.S.; Park, S.; Lee, E.; Park, M.; Kim, N.E. Application of collision warning algorithm alarm in fishing vessel’s waterway. Appl. Sci. 2021, 11, 4479. [Google Scholar] [CrossRef]
  33. Kim, I.C. A Study on Developing a Model for Maritime Traffic Risk Assessment of Coastal Waters. Doctoral Dissertation, Mokpo National Maritime University, Mokpo, Republic of Korea, 2016. [Google Scholar]
  34. Kim, H.S.; Lee, Y.S. A study on decision of minimum required channel width considering ship types by fast time simulation. J. Korean Soc. Mar. Environ. Saf. 2020, 26, 309–316. [Google Scholar] [CrossRef]
Figure 1. Conceptual diagram of the AIS data application plan.
Jmse 11 00354 g001
Figure 2. Maritime traffic status based on AIS raw data by season: (a) spring; (b) summer; (c) fall; and (d) winter.
Jmse 11 00354 g002
Figure 3. Maritime traffic status by grid level: (a) level 1 (1°/abt. 100 km); (b) level 2 (15′/abt. 25 km); (c) level 3 (3′/abt. 5 km); (d) level 4 (1′30″/abt. 2.5 km); (e) level 5 (30″/abt. 1 km); (f) level 6 (3″/abt. 100 m).
Jmse 11 00354 g003
Figure 4. AIS data preprocessing method.
Jmse 11 00354 g004
Figure 5. Results of AIS data after preprocessing: Maritime traffic status based on seasonal AIS data (12 days).
Jmse 11 00354 g005
Figure 6. Ship dynamic-data distribution characteristics.
Jmse 11 00354 g006
Figure 7. Distribution by LOA in Korean coastal waters.
Jmse 11 00354 g007
Figure 8. Distribution by SOG in Korean coastal waters.
Jmse 11 00354 g008
Figure 9. Distribution by ship frequency in Korean coastal waters.
Jmse 11 00354 g009
Figure 10. Results of visualization of marine traffic distribution by AIS data: (a) maritime traffic status based on LOA characteristics; (b) maritime traffic status based on SOG characteristics; (c) maritime traffic status based on frequency characteristics.
Jmse 11 00354 g010
Figure 11. Level settings for major review items of the vessel traffic index.
Jmse 11 00354 g011
Figure 12. Vessel traffic index expression methods: (a) average operation, (b) product operation, and (c) product of reciprocal operation.
Jmse 11 00354 g012
Figure 13. Vessel traffic status in Korean coastal waters reflecting the vessel traffic index.
Jmse 11 00354 g013
Figure 14. Comparison of vessel traffic indices among designated routes in Korean coastal waters: (a) Ongdo area, (b) Bukmaemulsudo area, (c) Nammaemulsudo area, (d) Bogildo area, (e) Geomundo area, and (f) Hongdo Namhae area.
Jmse 11 00354 g014
Table 1. Analysis period and range of AIS data.
AIS DataContent
Analysis PeriodSpring2020.03.08–2020.03.10 (3 days)
Summer2020.07.05–2020.07.07 (3 days)
Fall2020.09.12–2020.09.14 (3 days)
Winter2020.12.08–2020.12.10 (3 days)
Analysis RangeUpper Left(Lat.) N 40°00′00.00″/(Long.) E 124°00′00.00″
Lower Right(Lat.) N 32°00′00.00″/(Long.) E 132°00′00.00″
Table 2. Statistical analysis results using raw AIS data.
ClassificationData Set (Points)MeanStd.Min.25%50%75%Max.
SpringLat (N)60,169,83936.538.61−111.8534.8335.4837.5111.27
Long (E)128.668.54−210.26126.61128.5129.46211.65
SOG (knots)6.2815.7800.13.414.1102.3
COG (°)170.11116.78092.6198310.6409.5
HDG (°)355.1183.780275511511511
SummerLat (N)65,185,87336.638.14−111.8534.935.53992.91
Long (E)128.578.16−221.72126.61128.47129.89222.78
SOG (knots)6.6715.2600.16.514.3102.3
COG (°)167.46115.93099192.7304.5409.5
HDG (°)356.39182.140274511511511
FallLat (N)74,870,95136.3310.14−111.8534.7435.3937.45107.89
Long (E)127.7517.51−223.57126.38127.73129.55219.62
SOG (knots)6.6916.7700.2514.1102.3
COG (°)173.78115.010111.1201.7320409.5
HDG (°)369.21182.160312511511511
WinterLat (N)71,308,25836.279.81−111.8534.7335.3537.49103.01
Long (E)127.7417.55−223.57126.54127.76130.68222.63
SOG (knots)6.4516.1700.24.714.4102.3
COG (°)171.97116.09090.5197.8311409.5
HDG (°)384.66175.960357511511511
Table 3. Size of the Korea Hydrographic and Oceanographic Agency by grid level.
ItemLevelIntervalReference
Horizontal
Grid System
(6 levels)
1abt. 100 kmJmse 11 00354 i001
215′abt. 25 km
33′abt. 5 km
41′30″abt. 2.5 km
530″abt. 1 km
63″abt. 100 m
Table 4. Statistical analysis results of AIS data after preprocessing.
ClassificationData Set (Points)MeanStd.Min.Max.
AIS data after preprocessingLat (N)5,379,110,27835.191.3532.0040.00
Long (E)127.381.51124.00132.00
SOG (knots)2.84.50.040.0
COG (°)64.09106.92000.0359.0
HDG (°)158.18112.39000359
Table 5. LOA classification among the 10 groups.
LOA (m)
Group12345678910
Range∼1515∼1919∼2323∼2828∼3131∼3636∼4343∼7172∼127127∼
Total ship count: 95,422,281
Table 6. SOG classification among the the 10 groups.
SOG (knots)
Group12345678910
Range∼0.40.4∼0.70.7∼1.11.1∼1.91.9∼3.83.8∼6.56.5∼8.98.9∼10.410.4∼12.312.3∼
Total ship count: 236,725,800
Table 7. Ship frequency classification among the 10 groups.
Frequency (Times)
Group12345678910
Range∼44∼88∼1111∼1414∼1717∼2020∼2525∼3737∼7474∼
Total grid count: 5,060,808
Table 8. VTI level settings considering LOA, SOG, and frequency of passing ships in Korean coastal waters.
VTI S l S s S f
Level1n ≤ 15n ≤ 0.4n ≤ 4
215 < n ≤ 190.4 < n ≤ 0.74 < n ≤ 8
319 < n ≤ 230.7 < n ≤ 1.18 < n ≤ 11
423 < n ≤ 281.1 < n ≤ 1.911 < n ≤ 14
528 < n ≤ 311.9 < n ≤ 3.814 < n ≤ 17
631 < n ≤ 363.8 < n ≤ 6.517 < n ≤ 20
736 < n ≤ 436.5 < n ≤ 8.920 < n ≤ 25
843 < n ≤ 718.9 < n ≤ 10.425 < n ≤ 37
971 < n ≤ 12710.4 < n ≤ 12.337 < n ≤ 74
10127 < n12.3 < n74 < n
Table 9. Comparison of utilization status by sea area according to VTI.
Sea AreaVTIRemarks
(a)Ongdo passage8Northwest: Incheon Port to Yellow Sea flow (6 to 7)
East side: Omnidirectional spread Sea flow (5 to 6)
(b)Bukmaemulsudo passage8Southeast: Maenggolgundo to Yellow Sea flow (6 to 7)
(c)Nammaemulsudo passage8South side: Gageodo to Bogildo Sea flow (6 to 7)
Northeast: Maenggolsudo Sea flow (5 to 6)
(d)Bogildo passage8East Side: Jeju Island Sea flow (6 to 7)
West Side: Cross Sea flow (5 to 6)
(e)Geomundo passage8South side: Chujado to Busan Sea flow (6 to 7),
Goheung to Geomundo Sea flow (5 to 6)
(f)Hongdo Namhae passage8Northwest: Geoje to Samcheonpo Sea flow (7 to 8),
Masan to Jeju Island Sea flow (6 to 7)
Table 10. Distribution analysis of vessel traffic in Korean coastal waters using AIS data.
ClassificationMarine Traffic Distribution
LOA
(by Total Ship)
n < 50 m74%
50 m ≤ n < 200 m22%
200 m ≤ n4%
SOG
(by Total Ship)
n < 5 knots56%
5 knots ≤ n < 10 knots21%
10 knots ≤ n < 15 knots19%
15 knots ≤ n4%
Frequency
(by Total Grid)
n < 20 counts60%
20 counts ≤ n < 50 counts25%
50 counts ≤ n15%
Disclaimer/Publisher’s Note: The statements, opinions and data contained in all publications are solely those of the individual author(s) and contributor(s) and not of MDPI and/or the editor(s). MDPI and/or the editor(s) disclaim responsibility for any injury to people or property resulting from any ideas, methods, instructions or products referred to in the content.

