Article

Influence of Wave–Current Interaction on a Cyclone-Induced Storm-Surge Event in the Ganges-Brahmaputra-Meghna Delta: Part 2—Effects on Wave

The Sino-Australian Research Consortium for Coastal Management, School of Science, University of New South Wales Canberra, Canberra, ACT 2600, Australia
*
Author to whom correspondence should be addressed.
J. Mar. Sci. Eng. 2023, 11(2), 298; https://doi.org/10.3390/jmse11020298
Submission received: 28 December 2022 / Revised: 18 January 2023 / Accepted: 19 January 2023 / Published: 1 February 2023
(This article belongs to the Special Issue Numerical Modelling of Atmospheres and Oceans)

Abstract

:
The Ganges-Brahmaputra-Meghna delta, located in the southern part of Bangladesh, is periodically exposed to severe tropical cyclones. It is estimated that two-fifths of the world’s total impact from tropical-cyclone-induced storm surges occur in this region, and these cause fatalities and economic losses every year. A barotropic numerical 3D model is used to investigate wave dynamics during a cyclone-induced storm-surge event. The model is calibrated and validated for Cyclone Sidr (2007) and applied to ten idealized cyclonic scenarios. Numerical experiments with different coupling configurations are performed to understand wave–current interactions on significant wave heights. Results show that the water level is the dominant factor in significant wave height modulation when the wave propagates into shallower regions from the deeper ocean, whereas the current modulates the deep ocean wave height. The WCI causes higher significant wave heights in shallower waters close to the coast compared with the deep ocean. Wave energy dissipation related to whitecapping processes plays a greater role in reducing the wave height nearshore than the dissipation due to depth-induced breaking and bottom friction in the GBMD during a cyclone-induced storm-surge event.

1. Introduction

Wind waves, storm surges, and the ocean circulation all play important roles in producing variations in coastal waters. Several nonlinear interaction processes including tide–surge interaction and wave–current interaction modulate surface water elevation in both shallow and deep ocean regions. Water levels and currents have a complex influence on wave height through distinct physical processes. The wave–current interaction mechanisms generally consist of wave–current bottom stress, wave radiation stress, wave dissipation, vertical transfer to the mean moment equation (known as form drag), Stokes drift velocities, current advection, and refraction of wave energy [1,2,3]. A numerical study on the Irish sea demonstrates that considering the wave–current interactions in model simulations generates 20% larger high-water wave heights in some regions [4]. Significant wave height in shallow regions is strongly modulated by time-varying water depth [5,6,7,8]. However, other groups of researchers attributed the modulation to the current variation [9,10,11,12]. Furthermore, ocean currents accelerate or decelerate the energy transfer from surface winds to surface waves outside the estuary based on the orientation of the current and the waves [11,13,14]. Song et al. [15] applied a Delft3D wave–current coupled model to the southwestern Bohai Bay, China, to estimate the local wave–current interactions during extreme weathers. The results indicate that both tidally varying depth and current are able to modulate significant wave height (SWH), and their modulating abilities are increased and decreased onshore, respectively.
The physical environment of the coastal regions is modulated by the mutual interaction between physical processes, such as tides, waves, and currents [16]. The wave–current interactions during extreme weather conditions (e.g., tropical cyclones and storm surges) have attracted significant interest within the ocean modeling community in recent years [8,17,18,19,20]. It is concluded that the storm surge, tides, and currents will have a significant effect on the wavefield when their strengths are sufficient to interact [20]. The current can influence the wave by modifying the wave characteristics through refraction, bottom friction, and blocking [21]. The depth felt by the waves also changes with variations in water level in the coastal region, thereby modifying the shallow-water effects on the waves [22].
The Ganges-Brahmaputra-Meghna delta (GBMD, Figure 1), located in the southern part of Bangladesh, is periodically exposed to severe tropical cyclones. It is estimated that two-fifths of the world’s total impact from tropical-cyclone-induced storm surges occur in this region, and these cause fatalities and economic losses every year. The current study aims to address the role of the wave–current interaction in the modulation of wave fields at the GBMD during cyclonic conditions. The rest of the paper is organized as follows: The model and methodology are described in Section 2. Results are presented and discussed in Section 3, and a summary and conclusion from the study are provided in Section 4.

2. Methodology

A numerical model based on Delft3D with the Delft3D-Wave (based on third generation spectral wave model SWAN) model is used to simulate the cyclone-induced storm-surge event in the GBMD [21,23]. The Delft3D-Wave model is termed as the WAVE model hereafter. The model is calibrated and validated based on available data during Cyclone Sidr. Several idealized scenarios are then designed and analyzed to investigate the effects of the wave–current interaction on wave dynamics, including wave heights and dissipations. Details of the model setup, model validation, and wave–current interaction processes are discussed in Part 1 of this paper [24]. The model domain and study area with field stations are shown in Figure 1.

2.1. Numerical Model Delft3D-Wave

2.1.1. Wave Kinematics

The WAVE model uses the linear wave theory and the conversion of wave crests to estimate wave kinematics. This linear theory for uniform surface gravity waves is valid provided that the waves are propagating over slowly varying current and water depth [25,26]. The WAVE model estimates the wave propagation velocities of wave energy in geographical (cx, cy) and spectral space (cσ, cθ) from the kinematics of wave trains by the following equations [26]:
d x d t = ( c x , c y ) = c g + u = 1 2 ( 1 + 2 | k | d s i n h ( 2 | k | d ) ) σ k | k | 2 + u  
d σ d t = c σ = σ d ( d t + u · x d ) c g k · u s
d θ d t = c θ = 1 k ( σ d d m + k · u m )
where c g denotes the group velocity, k is the wave number vector, d is the water depth, s is the space coordinate in the wave propagation direction of θ, and m is a coordinate normal to s. Here, u represents the current vector and is assumed to be uniform in the vertical direction; consequently, the depth-averaged current is used in this study.
It is important to point out that the temporal and spatial gradient of the water depth and current can influence the wave propagation velocities (cx, cy, cσ, cθ). The presence of current flow results in Doppler shifting of the relative radian frequency σ (in a frame of reference moving with current) and become the absolute radian frequency ω (i.e., the observed frequency, in a frame of reference fixed on ground) based on Equation (4) [15]. Thus, the resulting absolute frequency ω modifies the wave number k via the dispersion relation of Equation (5) (achieved by replacing the relative frequency σ in Equation (5) with the absolute frequency ω), leading to a change in the wave energy flux [11]. A change of water depth, in contrast, does not modify the wave frequency, i.e., the absolute frequency ω equals to the relative frequency σ.
ω = σ + k · u  
σ 2 = g k t a n h ( k d )

2.1.2. Spectral Action Balance Equation

The WAVE model considers the action density spectrum N(σ, θ) (= E(σ, θ)/σ), which may vary in time and space. The evolution of the wave spectrum by following the spectral balance equation for Cartesian coordinates is described as [27,28,29]:
N t + c x N x + c y N y + c σ N σ + c θ N θ = S t o t σ
S t o t = S i n + S n l 3 + S n l 4 + S d s , w + S d s , b + S d s , b k  
The first term on the left-hand side of Equation (6) represents the local change rate of wave action density in time. In the same equation, the second and third terms express the propagation of action in geographical space (x, y), including depth- and current-induced straining, also known as shoaling, and mean current advection (or current-induced convergence), respectively. The shifting of the relative frequency σ and the refraction during propagation θ in spectral space (σ, θ) are represented by the fourth and fifth terms, respectively, which jointly reflect the redistribution of energy density over the spectrum [9,15,30]. Equations (1)–(7) are concurrently solved in the WAVE model.
The variable Stot on the right-hand side of the Equation (6) represents the sum of source–sink (see Equation (7)) resulting from the interaction of physical process such as wind–wave generation Sin, the nonlinear transfer of wave energy through wave–wave interactions (triads Snl3 and quadruplets Snl4), and the energy dissipation caused by whitecapping Sds,w, bottom friction Sds,b, and depth-induced breaking Sds,bk.

2.1.3. Depth-Induced Wave Breaking

Sea level determines the maximum wave height beyond which the waves start to break [6]. In the WAVE model, the process of energy dissipation caused by depth-induced wave breaking mimics the breaking of a bore applied to random waves [31]:
S d s , b k ( σ , θ ) = D t o t E t o t E ( σ , θ )
where D t o t = α B J Q b   σ m e a n H m a x 2   ( 8 π ) 1 represents the mean rate of energy dissipation per unit horizontal area due to wave breaking, α B J = 1, σ m e a n = mean frequency, Qb = fraction of breaking waves, and H m a x = γ d is the maximum wave height that can exist at the given depth d where γ is the breaker parameter (set to 0.73). E t o t is the total wave energy integrated over all directions and frequencies.
It is important to note that, during a surge event, the water depth increases while the fraction of breaking waves is reduced. This results in moving the breaking zone towards the coast and increasing the wave heights in coastal areas [6].

2.1.4. Whitecapping

Energy dissipation due to whitecapping in the WAVE model is represented by the pulse-based model of Hasselmann (1974):
S d s , w ( σ , θ ) = T   σ m e a n k k m e a n E ( σ , θ )
where k m e a n = mean wave number and T = coefficient depending on the overall wave steepness [32]. When currents and waves are in opposite directions, the waves experience enhanced whitecapping because the wave number and wave steepness increase with the opposing current.

2.1.5. Bottom Friction

The energy dissipation due to bottom friction in the WAVE model is expressed by means of the JONSWAP empirical model [27].
S d s , b ( σ , θ ) = C b σ 2 g 2 s i n h 2 ( k d ) E ( σ , θ )
where Cb = 0.038 m2 s−3 is the bottom friction coefficient [32].
As the surface currents affect the spectral wave energy, the bottom friction will also change. Bottom friction will increase with increasing wave energy, for example, in the case of an opposing current [6].

2.2. Description of Scenarios

Scenarios to investigate different physical processes related to cyclone-induced storm-surge events are designed by modifying the model setup and boundary forcings. Ten sensitivity scenarios are designed to address the role of different factors, including wave–current interactions, in the generation of storm surge height during a cyclonic event. To reduce the computational time, the sensitivity simulations (except the control run, Run 1) are run for just the last four days of the Cyclone Sidr period (13–16 November 2007). The simulation period covers the time from two days prior to landfall until the cyclone dissipated at 0000 UTC 16 November 2007.
Two scenarios, including the control run, are designed to assess the effects of wave–current interaction in wave generation during Cyclone Sidr (Table 1). A two-way coupled model considering all the boundary forcings, including tide, wind, atmospheric pressure, wave, and river discharge, is calibrated and validated to produce the most realistic recreation of Cyclone Sidr (Run 1). Run 2 is uncoupled and considers only the wave. The remaining 9 scenarios are introduced in the related sections later.

3. Result and Discussions

3.1. Effects of Wave–Current Interaction on Significant Wave Height

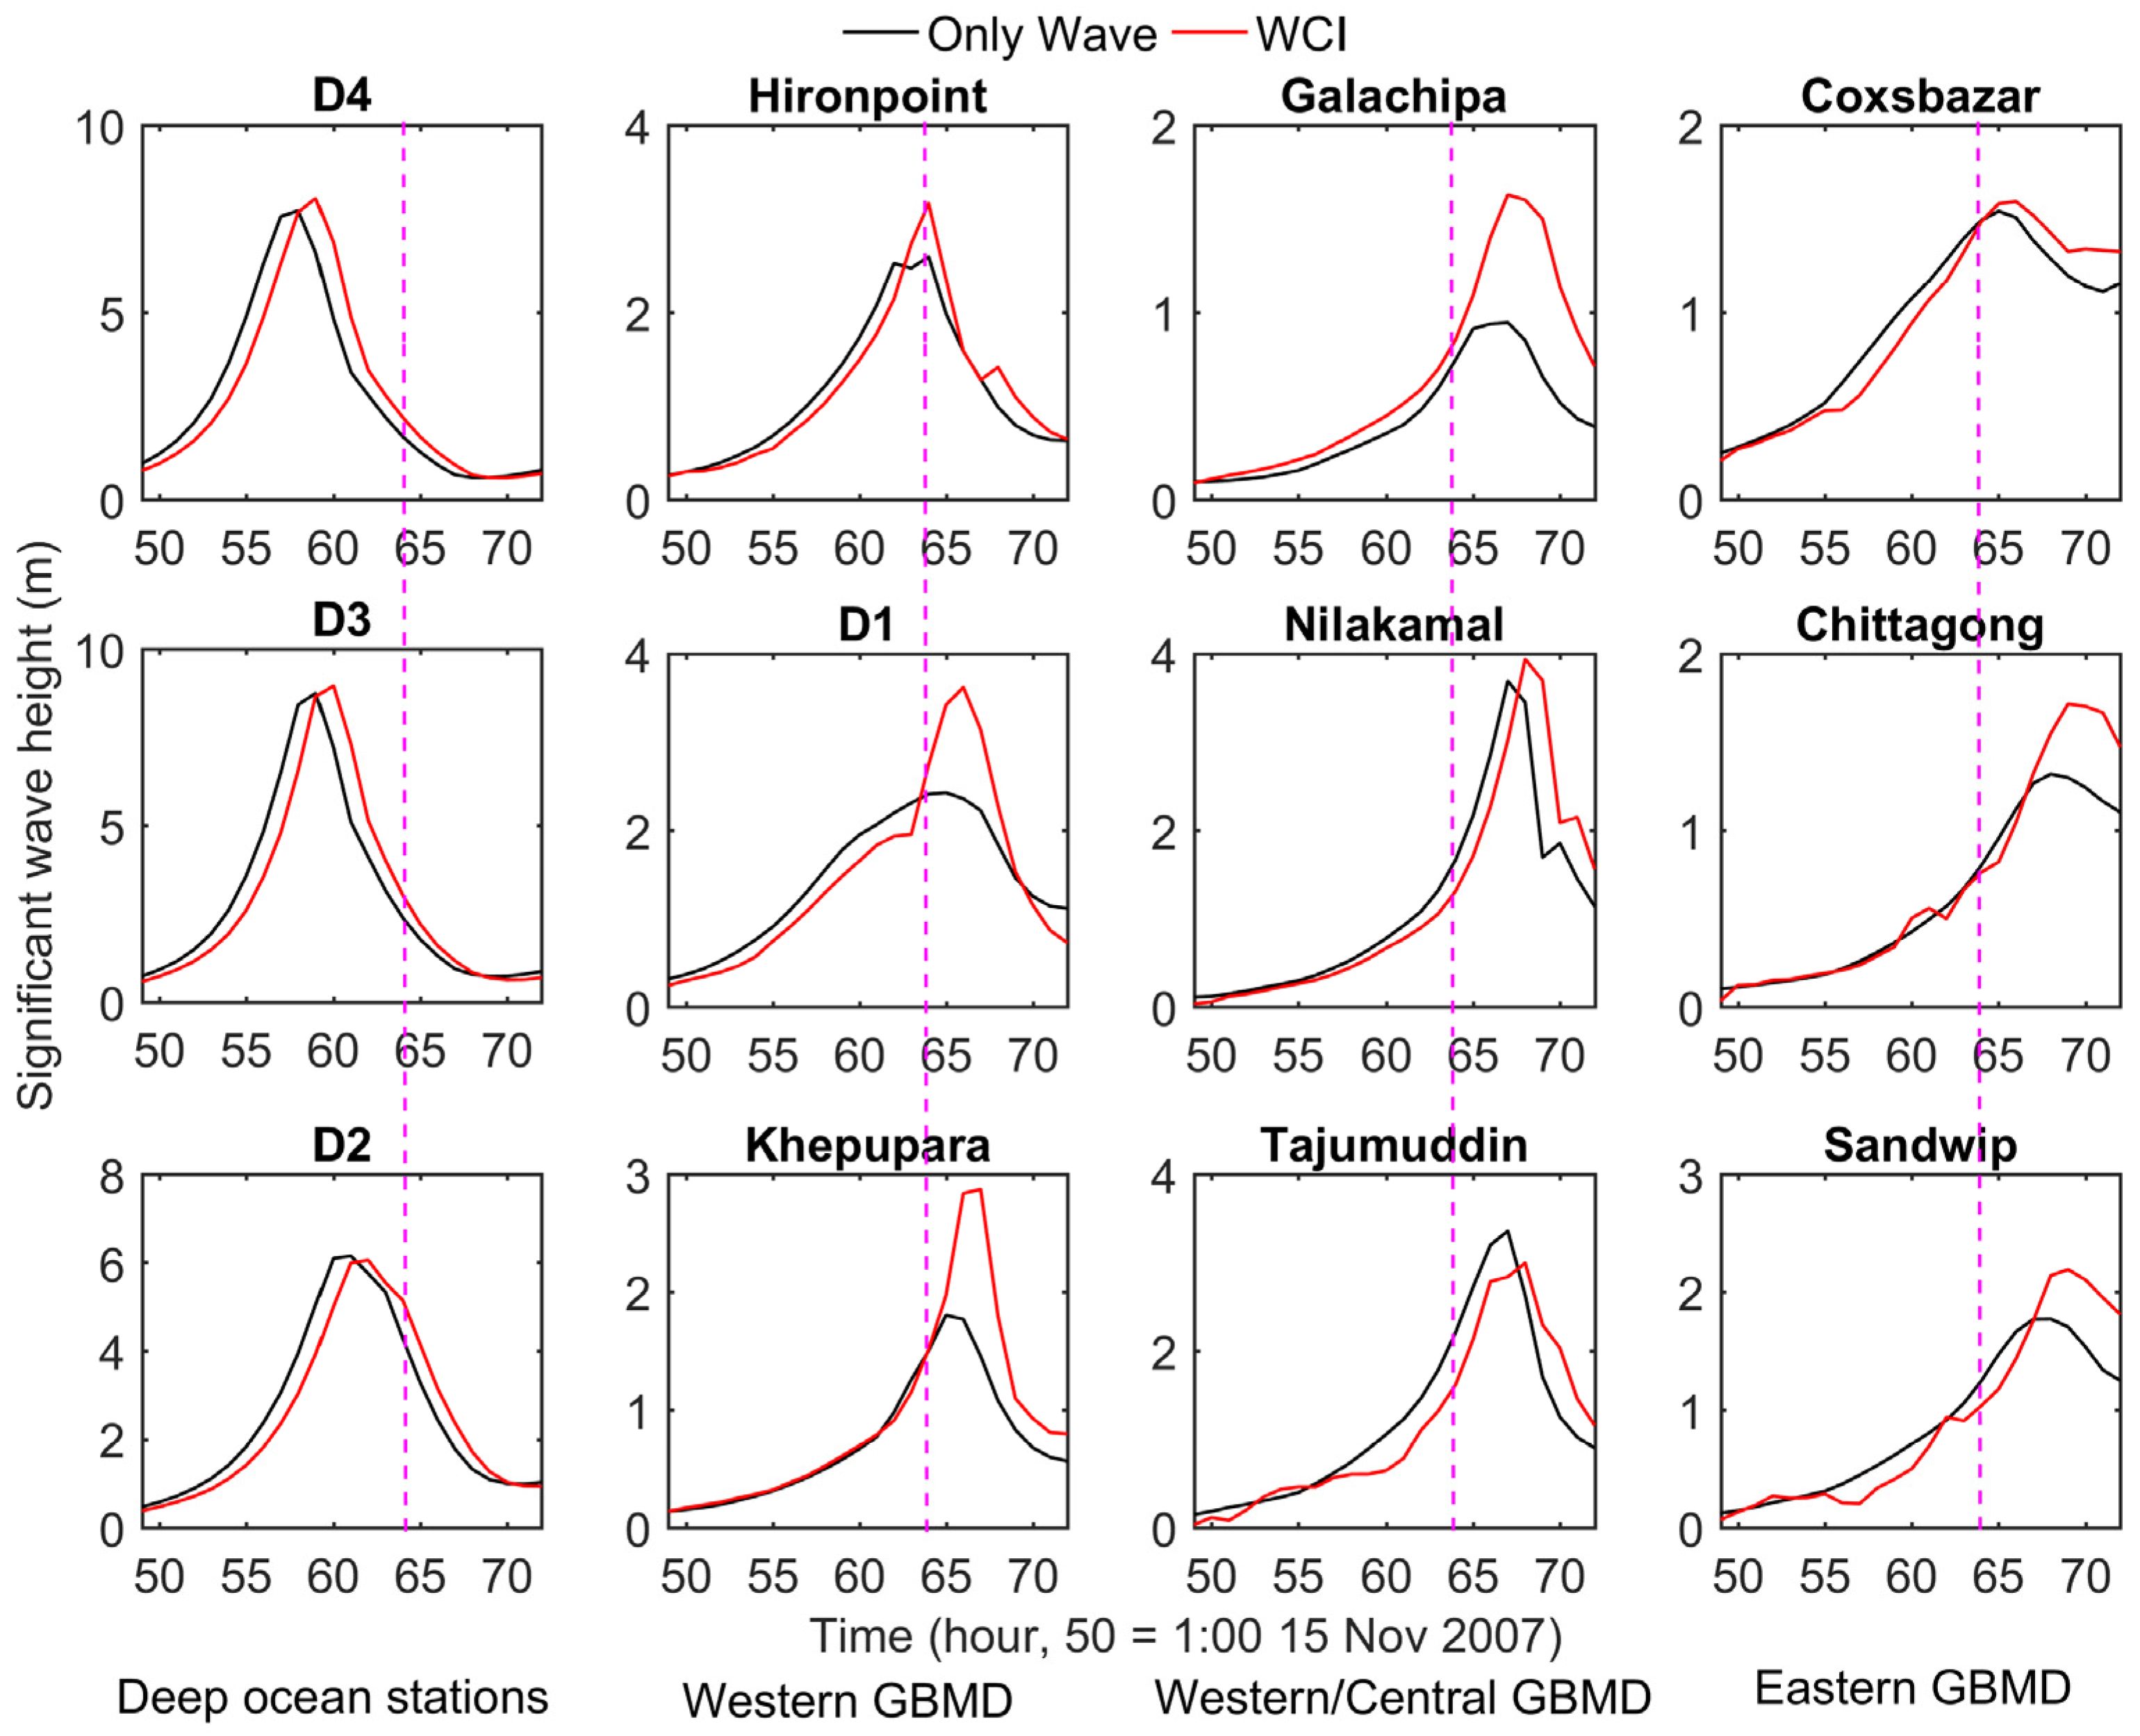
During cyclonic events, waves create significant impacts over the whole continental shelf and Bangladesh coast [33]. Cyclonic events generate higher wave height variations in the shallow compared with deep ocean regions due to the strong wind field. During the propagation of the wind-driven waves from the deep ocean to shallower areas, the magnitude of the wave height is modified through wave–current interactions, wave dissipation by bottom friction, whitecapping, and depth-induced breaking. The results of the ‘WCI’ (Run 1) and ‘Only Wave’ (Run 2) scenarios at stations across the GBMD are presented in Figure 2 to investigate the effects of the wave–current interactions on the waves. Including the effect of the wave–current interactions on waves produces a comparatively higher SWH than including only wind-driven waves at all the stations except Tajumuddin. The highest increase of SWH (1.19 m) is observed at D1, and the highest decrease of SWH is observed at Tajumuddin (−0.36 m) due to the wave–current interaction. Near to the landfall location (Khepupara), the SWH is increased by 59% (1.07 m) due to the wave–current interaction. The stations located on the right side of the track within the highest winds in the inner core at landfall (Khepupara, Galachipa and D1) have the highest percentages of change (more than 40%) in SWH from the wave–current interaction. Neglecting the mutual influence of waves and current on each other can cause an underestimation of the SWH by 1.2 m during a Sidr-like storm-surge event in the GBMD.

3.2. Influence of Effective Wind Stress on SWH

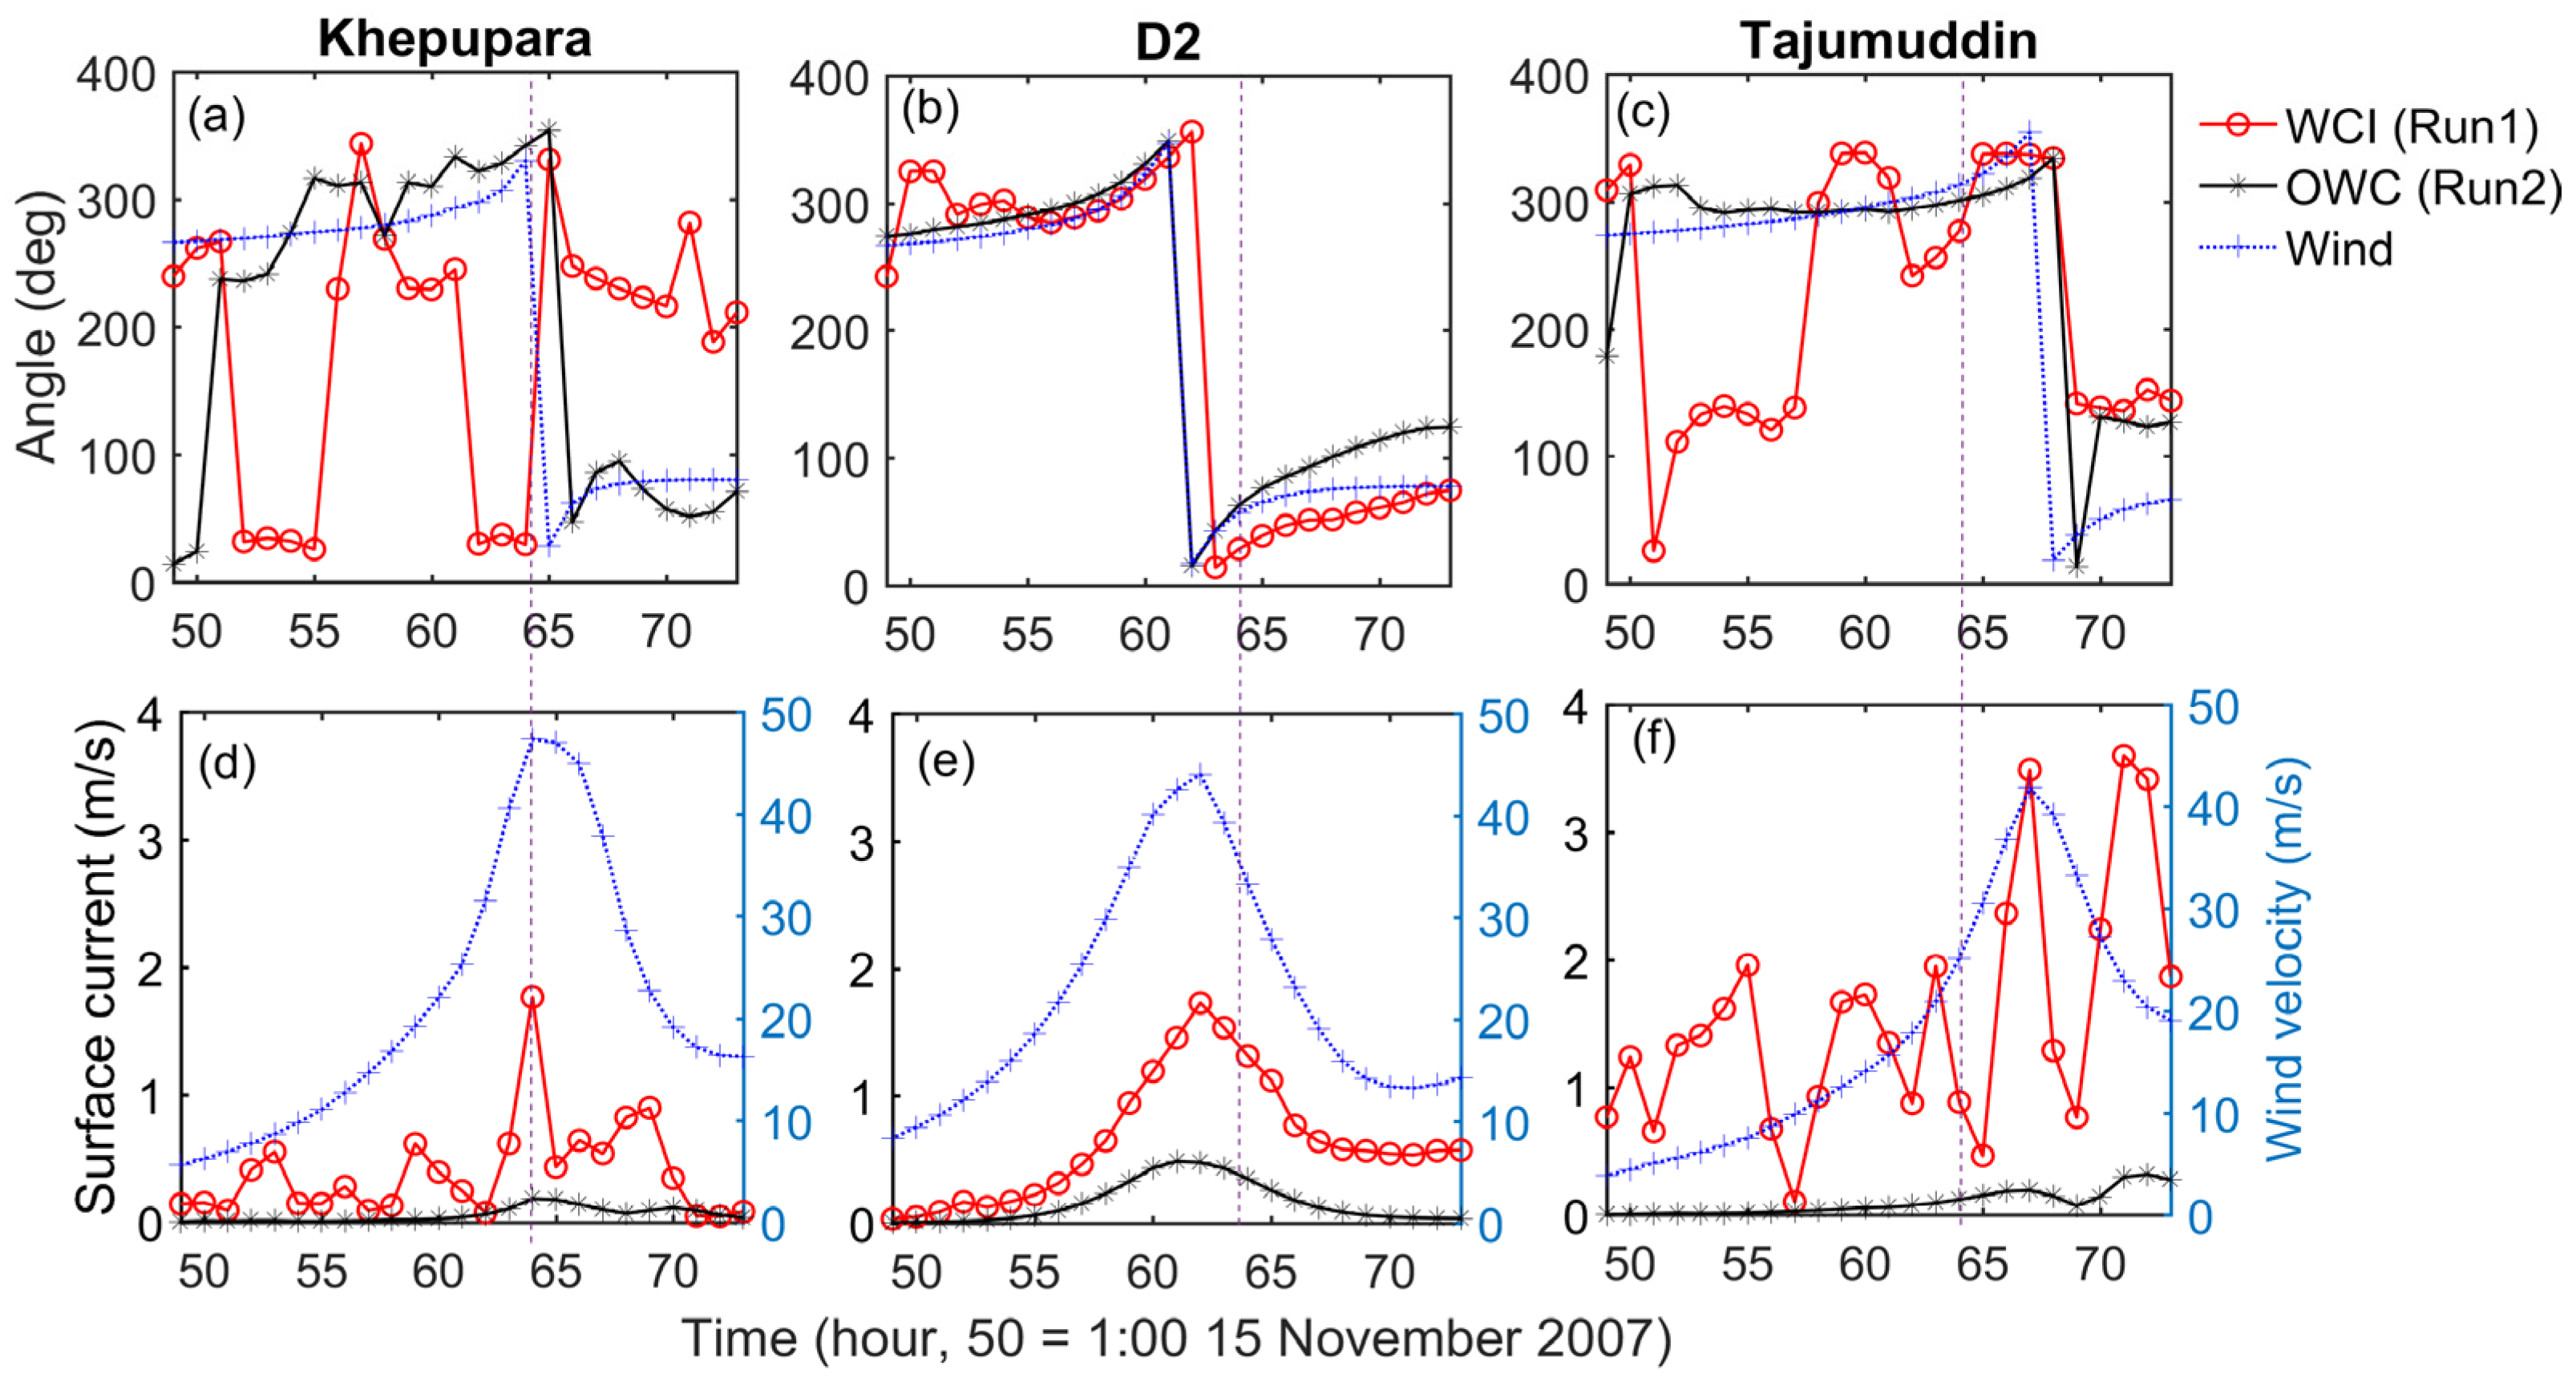
The ‘WCI’ (Run 1) scenario produces a higher SWH compared to the ‘Only Wave’ (Run 2 in Table 1) scenario. Both the scenarios are conducted by applying the same wind field and considered all the wave dissipation processes. The only difference concerns the influence of the current and water level variations in the ‘WCI’ (Run 1) scenario. The results show that the generation of the wind–wave is increased in the ‘WCI’ scenario for all stations. The effective wind determines the wind–wave growth, i.e., the relative wind effect (defined as the vectorial difference between the wind vector and current vector [30]). To investigate the increase in the SWH in the ‘WCI’ (Run 1) scenario further, the amplitude and direction of the current and wind are examined at three different stations: Khepupara, D2, and Tajumuddin (Figure 3). The wave-driven current is computed from the ‘OWC’ (Only Wave-driven, Run 2 in Table 1) scenario. The same wind field as the ‘WCI’ (Run 1 in Table 1) scenario is used to produce the wind–wave. Figure 3a shows that the current direction is in the opposite direction to the wind direction in the ‘WCI’ (Run 1) scenario at Khepupara, whereas both the current and wind are in the same direction in the ‘OWC’ (Run 2) scenario. The ‘WCI’ (Run 1) scenario produces a 1.6 m s−1 higher magnitude of surface current than the ‘OWC’ scenario (Figure 3d) with a correspondingly higher effective wind stress at Khepupara. This higher effective wind stress produced by the wind–current interaction produces a higher SWH than the ‘Only Wave’ (Run 2) in Figure 2. Conversely, the ‘WCI’ (Run 1) scenario generates a higher magnitude of surface current at D2, but both the current and wind direction are almost in the same direction (Figure 3b,e). The current and wind direction are also in the same direction at Tajumuddin for both the scenarios during the strong-wind period (>20 m s−1). Similar directions of the current and the wind reduce the effective wind stress magnitude, which causes a lower generation of wind-driven waves [30]. When the current and winds are in opposite directions, it produces a higher effective wind stress, which increases wind–wave generation (Sin in Equation (7)). This illustrates that the WCI can generate higher amplitude waves by modifying the effective wind stress by changing the current direction with respect to the wind direction. Therefore, the ‘WCI’ (Run 1) scenario generates a higher SWH than the ‘Only Wave’ (Run 2) scenario at Khepupara. Further influence of the current and wave direction on the SWH is discussed in the next section.

3.3. Influence of Water Level, Current, and Wave Direction on SWH

Three additional one-way model experiments (Run 3–5 in Table 1) are conducted to investigate the sensitivity of the SWH variations with the water level and current variations. To study the combined influence of the water level and current variations, the ‘WL + Cu to Wv’ (Run 3) scenario is conducted, where the water level and current variations can influence waves using one-way coupling. Similarly, the individual influence of the water level and the current is investigated by running ‘WL to Wv’ (Run 4) and ‘Cu to Wv’ (Run 5 in Table 1), respectively. The variations of the SWH under different forcings are presented in Figure 4. The ‘WCI’ (Run 1) scenario generates the highest amplitude of SWH at Khepupara, whereas the highest SWH at Tajumuddin is observed in the ‘WL to Wv’ (Run 4). Minimum amplitudes of SWH at all stations are observed in ‘Cu to Wv’ (Run 5), except at station D2. In ‘Cu to Wv’ (Run 5), the cyclone-induced storm surge height and tidal water level variations are ignored. Therefore, the wave dissipation in ‘Cu to Wv’ (Run 5) should be more affected by depth-induced breaking and bottom friction compared to the other experiments due to water depth changes. When the depth is the greatest (at D2), ‘Cu to Wv’ (Run 5) produces approximately the same magnitude of SWH compared to all other experiments. Thus, depth-induced breaking and bed friction do not affect the waves at D2. Stations that are located in shallow waters (Khepupara (<10 m), Tajumuddin (<25 m) and D1 (<15 m)) compared to D2, have a higher SWH produced by the ‘WL to Wv’ (Run 4) compared with the ‘Only wave’ (Run 2, which is the only wind-driven wave) because the effect of bed friction and depth-induced breaking on the wave is reduced.
However, there are other differences among these three stations. At Tajumuddin, ‘WL + Cu to Wv’ (Run 3), ‘Cu to Wv’ (Run 5 in Table 1), and ‘WCI’ (Run 1 in Table 1) generate the same maximum SWH, with Run 3 and Run 5 being almost exactly the same. This indicates that the current plays a dominant role over the water level in the modulation of the SWH at Tajumuddin if the wave–current interaction is included. Conversely, the ‘WL to Wv’ (Run 4) produces a similar SWH variation with ‘WL + Cu to Wv’ (Run 3) at Khepupara, suggesting that the water level plays a dominant role in the wave–current interaction.
The high and low magnitudes of the SWH are found in the WCI scenario compared to other scenarios at Khepupara and Tajumuddin, respectively. As discussed in the previous section, the increased/decreased effective wind stress from the opposite/same direction of wind and current causes these high and low magnitudes of the SWH at Khepupara and Tajumuddin, respectively. Moreover, from the kinematics in spatial and spectral space (Equations (1)–(3)), it is evident that the second and third left-side terms will be smaller in Equation (6) when the waves and currents are propagating in opposite directions. This will result in an increase in the wave energy and, therefore, also in the wave height. With waves and currents propagating in the same direction, the effect is reversed [6]. At Khepupara, the wave and current are in opposite directions in the WCI, whereas both are in the same directions at Tajumuddin. Thus, the wave–current interaction at Khepupara generates a higher SWH than the other scenarios. As the current and the wave are propagating more or less in the same direction (Figure 3c), this results in a decrease of the SWH (0.4 m) at Tajumuddin in the wave–current interaction scenario compared to the only-wave scenario. The similar variations of the SWH are also observed at D2. The order of influence of the current, water level, and wave–current interaction on the SWH modulation is the same at Khepupara and D1. Finally, the results illustrate that the current plays a dominant role in the modulation of the SWH over the water level in the deep ocean and deeper areas such as Tajumuddin (<25 m). The water level becomes the dominant factor when the wave propagates towards the shallower region from the deeper ocean. The influence of the wave–current interaction on the SWH modulation depends not only on the current and wind direction but also on the wave and current direction and water level.

3.4. Wave Dissipation

The presence of a shallow continental shelf and the ‘Swatch of no ground’ (a submerged canyon < 1500 m) causes wave energy dissipation 60–80 km from the coastline. The strong dissipation of the wave energy results in a lower magnitude of wave height (<2 m) at the coast. The tidal water level variations will also modulate the wave height in the shallow region near the coast. To study the wave dissipation processes with and without the wave–current interaction conditions, six additional model experiments (Run 6–11) are conducted by considering the individual dissipation term of Equation (7) in the WAVE model. The experiment details are described in Table 2.
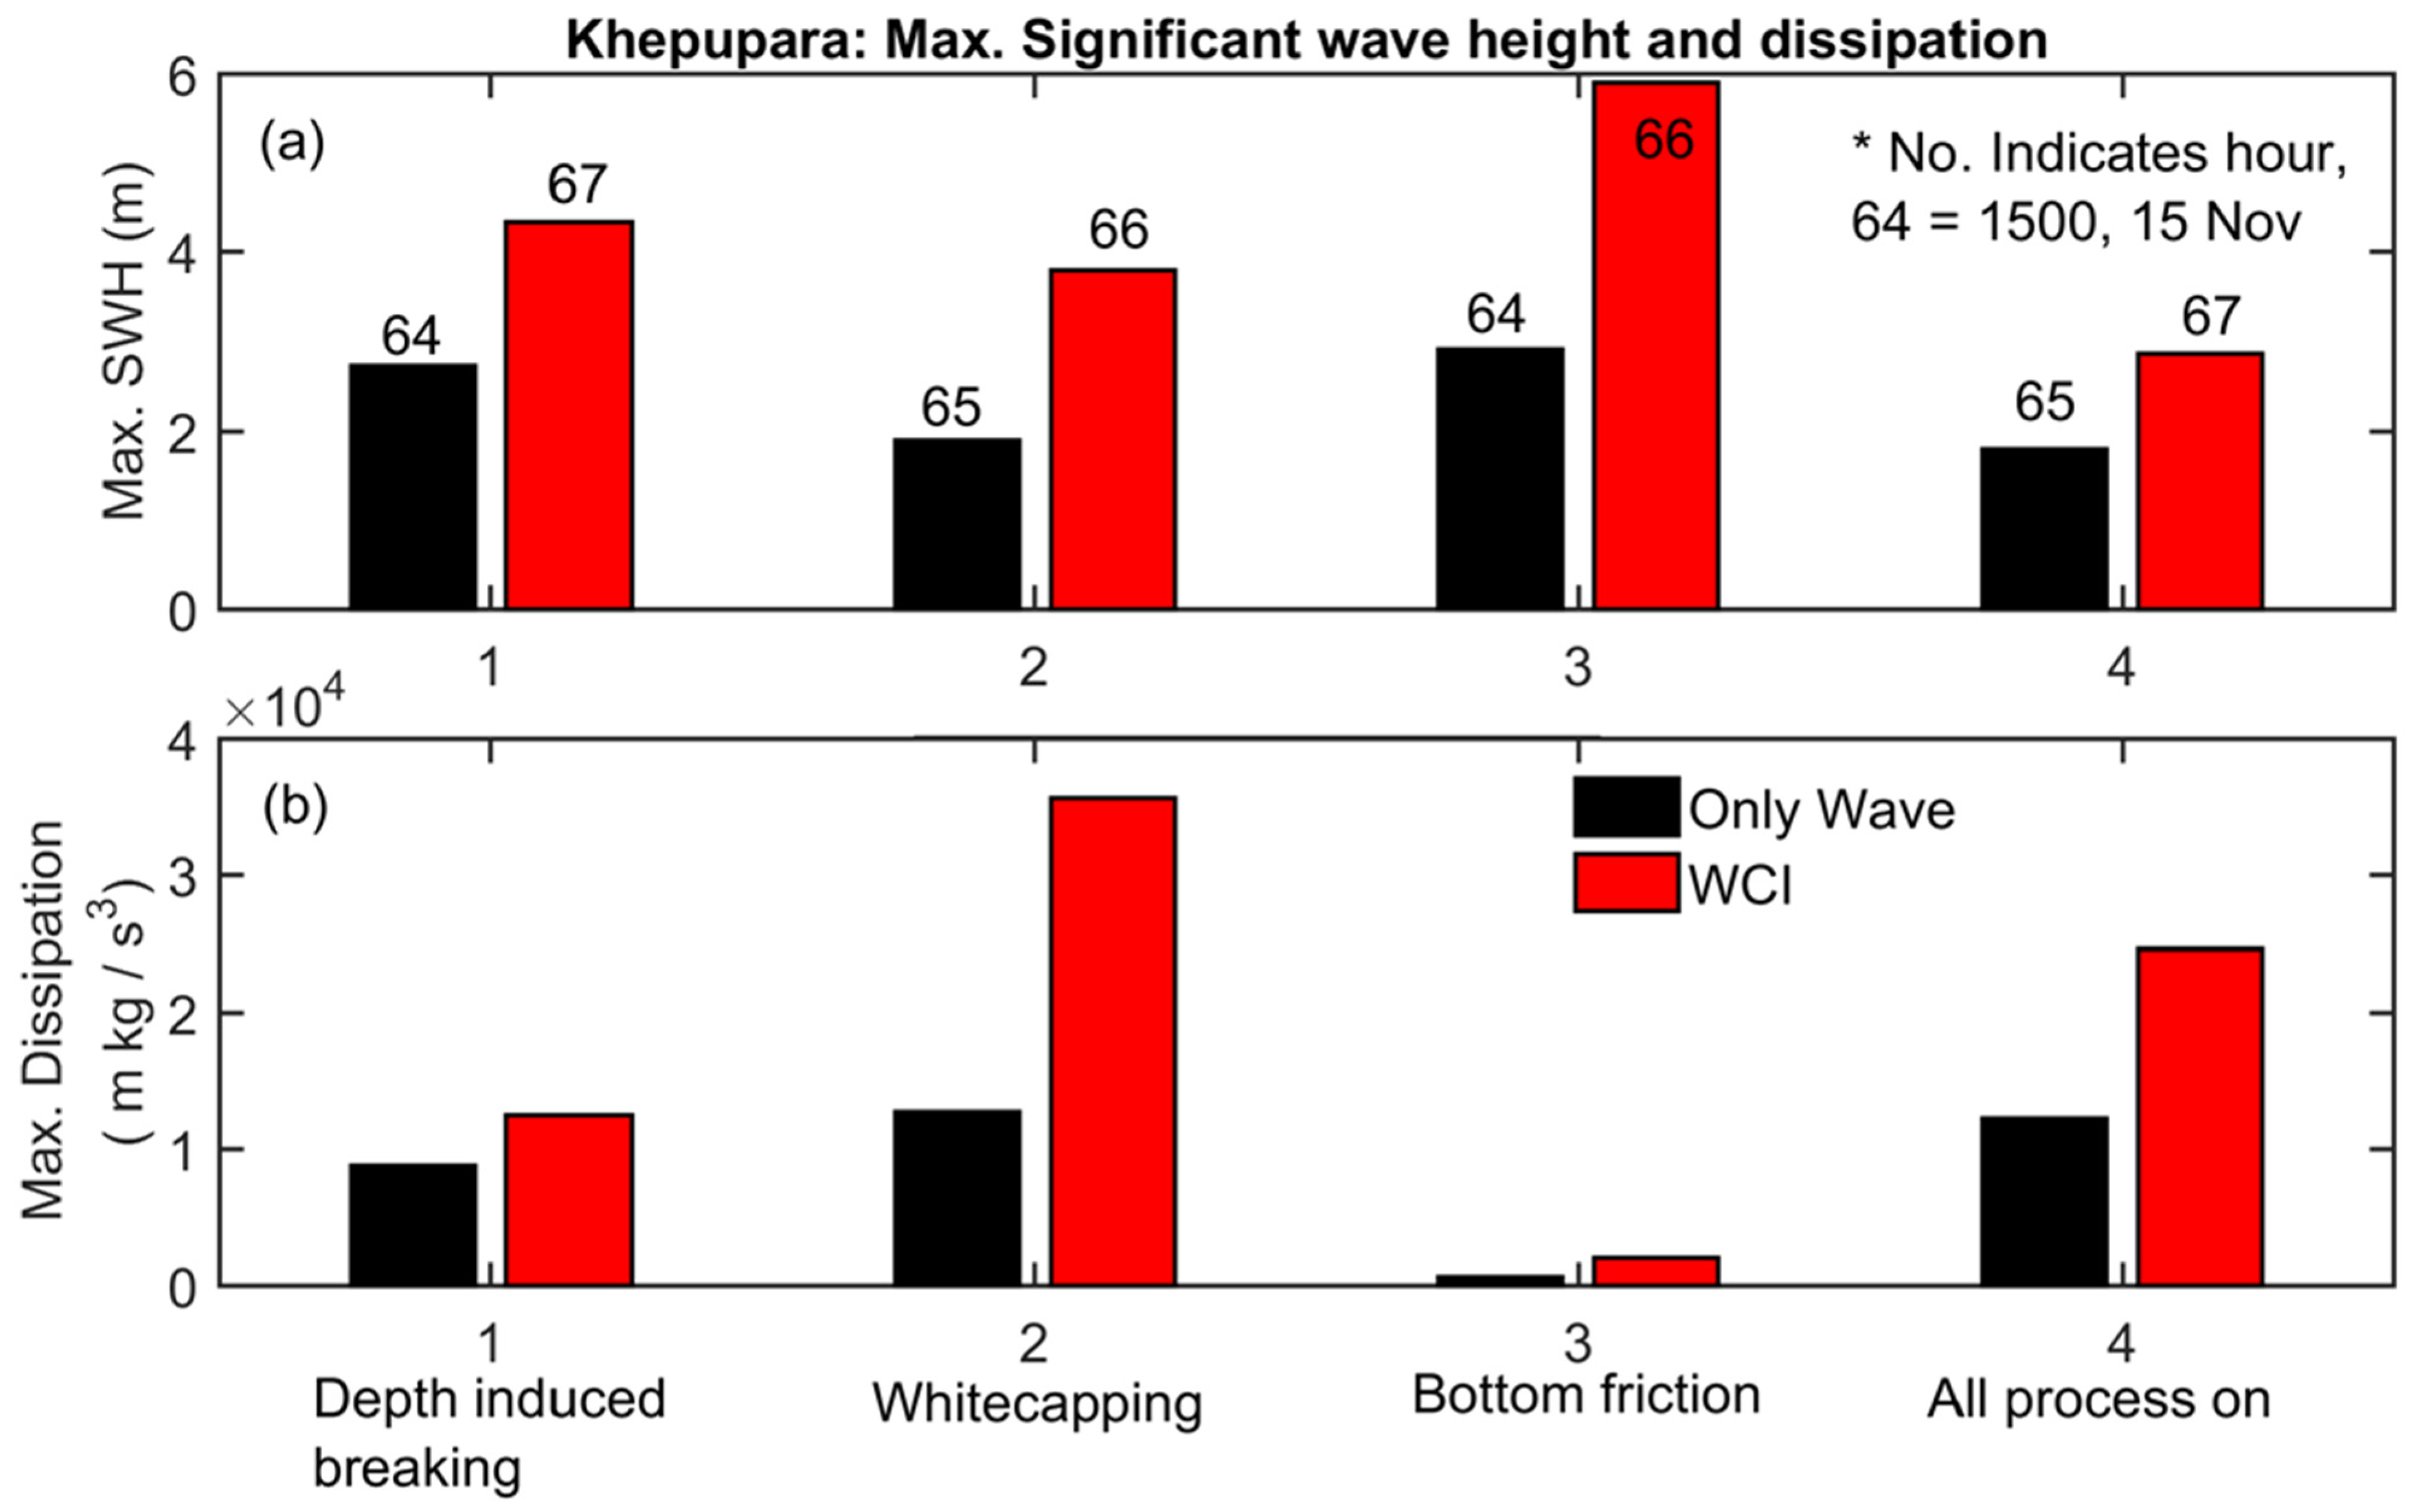
The maximum amplitudes of the SWH and wave energy dissipation at Khepupara are presented in Figure 5 without the wave–current interaction (‘Only wave’ (Run 2) in Figure 5) and with the wave–current interaction (‘WCI’ (Run 1) in Figure 5). The timing of the maximum amplitudes of the SWH varies based on wave energy input and dissipation factors such as the timing of the maximum wind and current direction and the total water level (see next section). Results show that the whitecapping process is dominant among all the wave dissipation terms for both conditions at Khepupara. The whitecapping term is represented by the pulse-based model of Hasselmann [28] in the WAVE model, which is directly proportional to the wave steepness [33]. During the opposing current, there is increased whitecapping of the waves because the wave number and wave steepness increase due to the opposing current. Consequently, the opposite directions of current and wave increase the wave height by increasing the wave energy, as discussed in Section 3.3. In the ‘WCI’ (Run 1) simulation, the current and the wind are in opposite directions at Khepupara. As the wind–wave follows the wind direction, the wave propagates in the opposite direction to the current at Khepupara. Therefore, the maximum wave dissipation related to whitecapping is more than doubled when the wave–current interaction is included. The dissipation due to bottom friction is small for both scenarios because, with higher water levels, bottom friction is reduced, resulting in the highest SWH when only this term is considered.
Thus, the higher amplitudes of the maximum SWH and wave energy dissipation at Khepupara result from increased effective wind stress and increased wave steepness, respectively. The opposite directions of current and wind increase the effective wind stress, which results in higher generation of wind-driven waves. Conversely, the opposite directions of waves and current increase the wave energy and also result in increased wave steepness. Higher wave energy causes a higher magnitude of wave energy dissipation (due to the wave energy term in all the dissipation equations, Equation (10)). Finally, the dissipation related to the whitecapping term in Equation (7) is more sensitive than the dissipations related to the depth-induced breaking and the bottom friction during a cyclone-induced storm-surge event at Khepupara. The wave–current interaction plays a significant role in estimating wave energy dissipation and significant wave height.
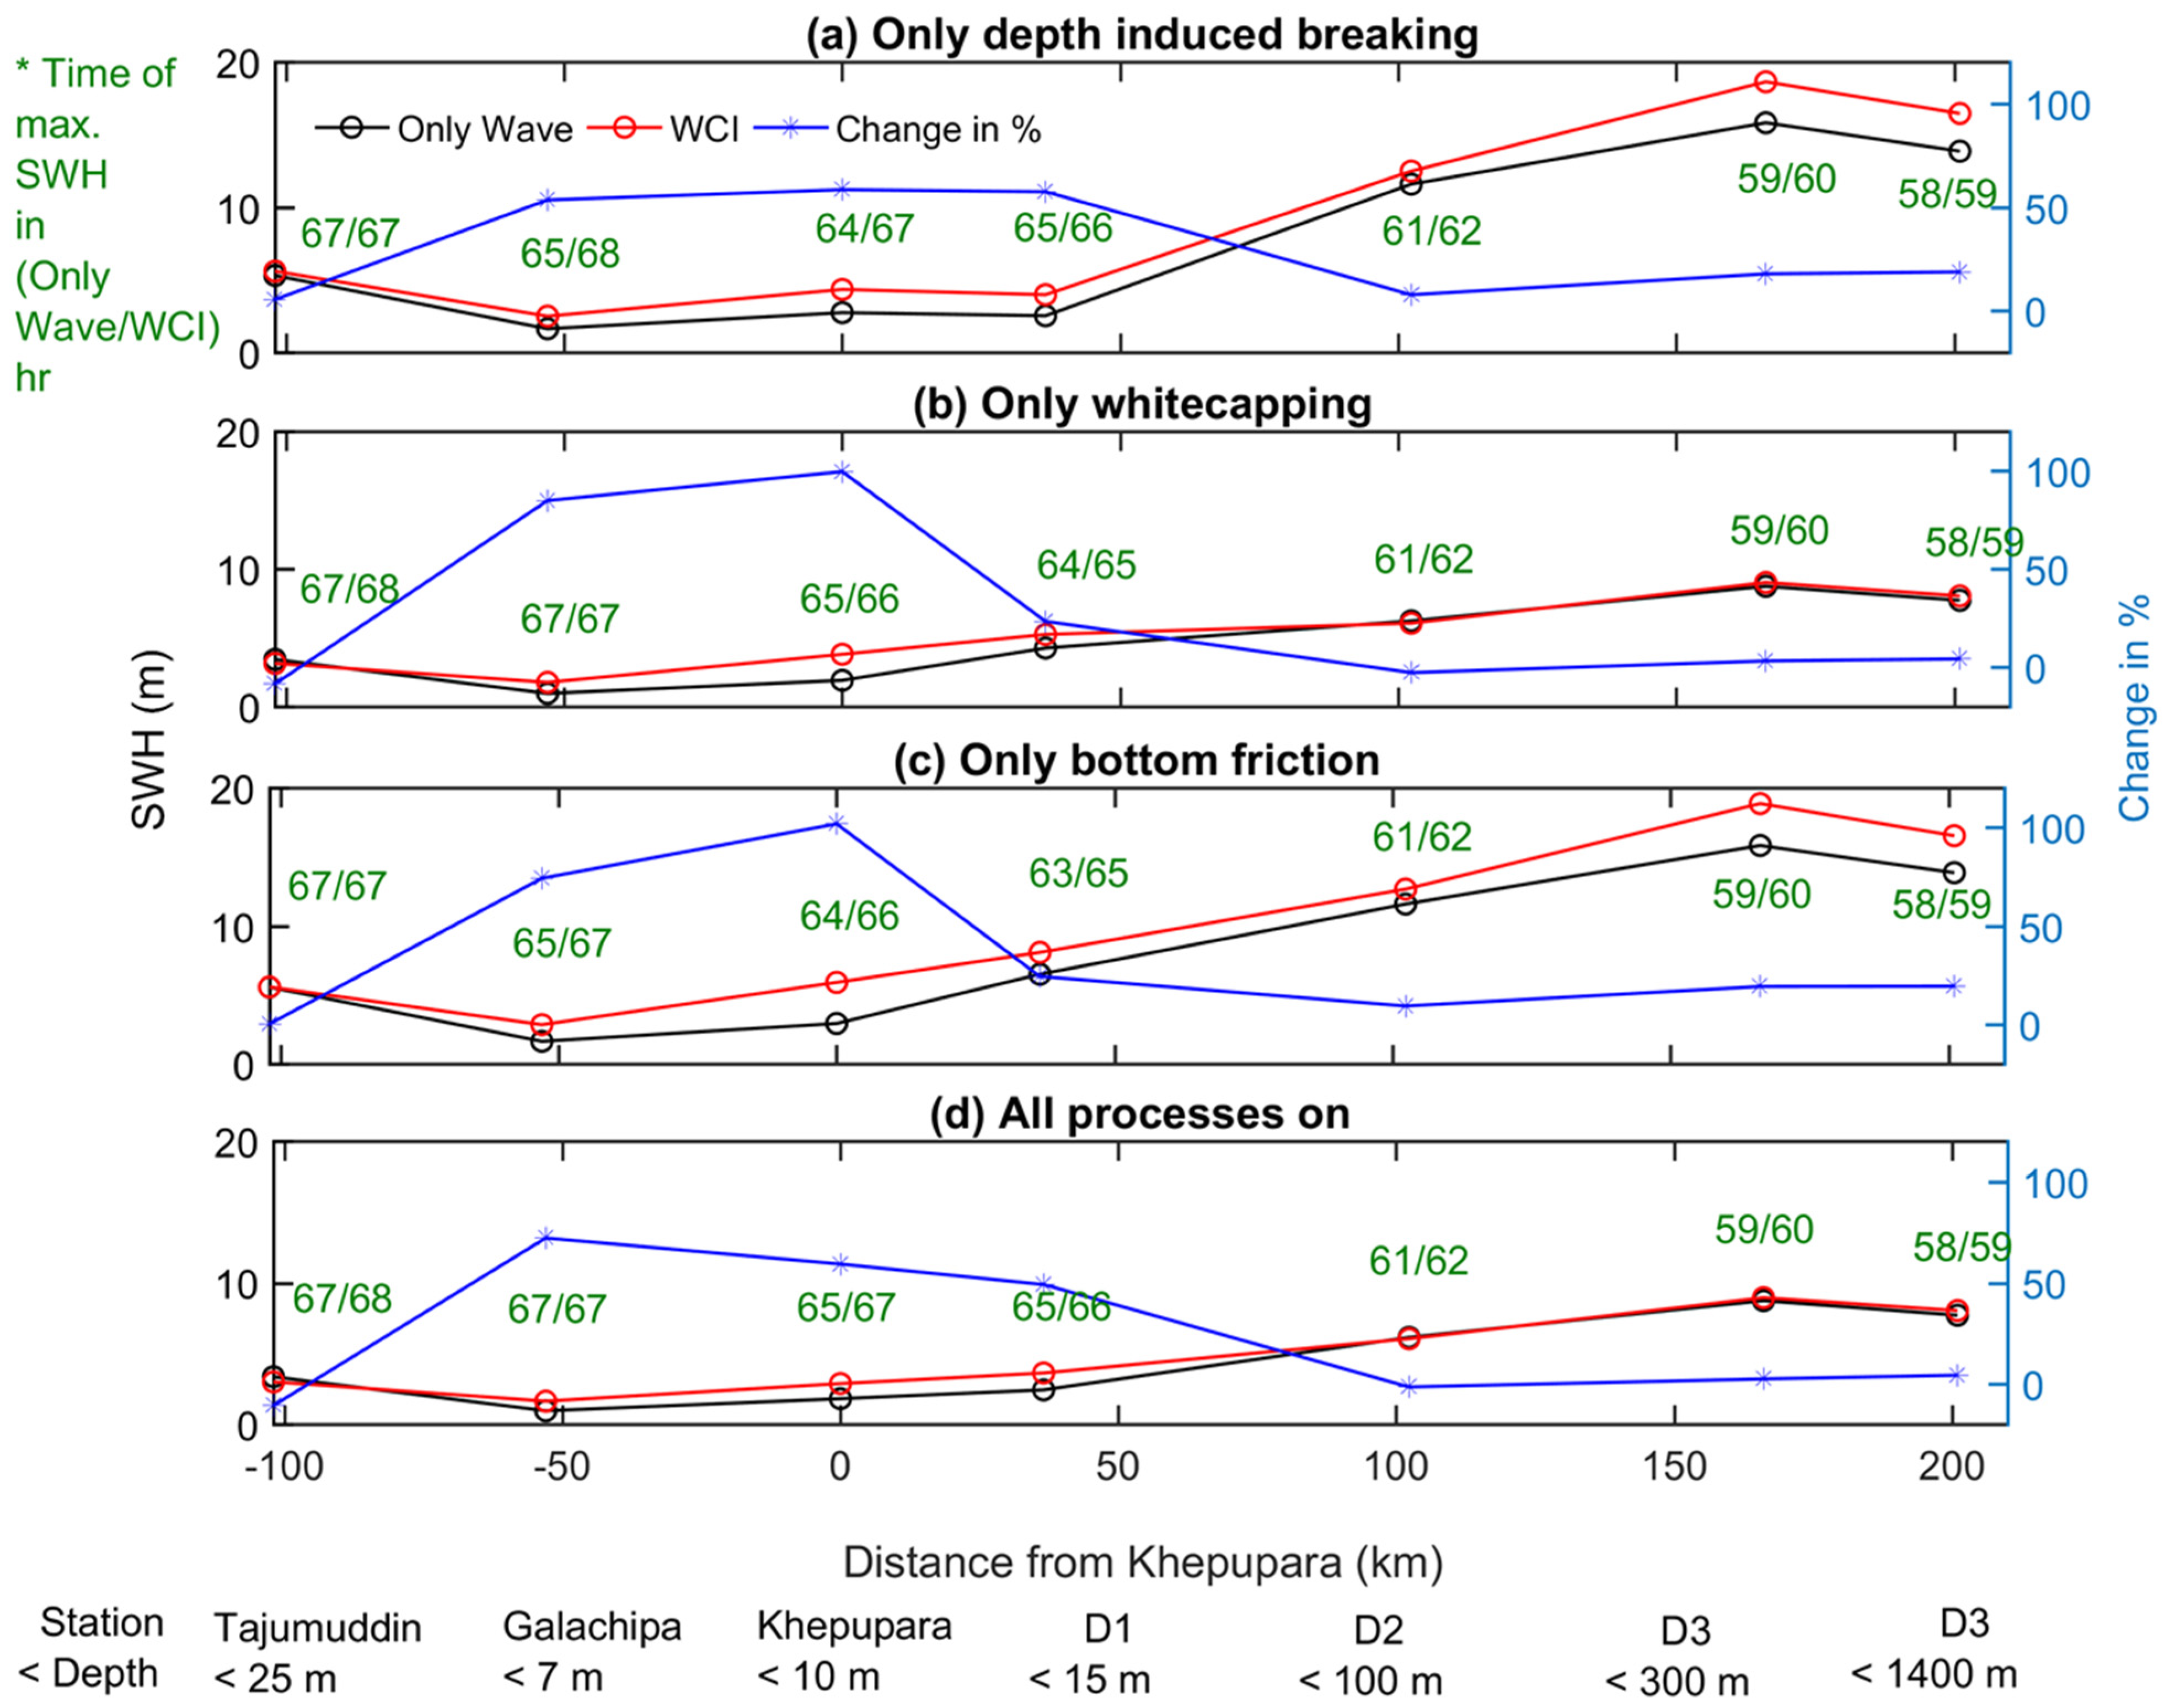
To further quantify the WCI influence on the SWH modulation, the maximum SWH variations along the GBMD are plotted for different wave dissipation conditions for the ‘Only Wave’ and ‘WCI’ scenarios (Run 6–11 in Table 2) in Figure 6. Results demonstrate that the WCI increases the SWH magnitude at all stations except Tajumuddin and D2. When only the depth-induced breaking is included (Run 6 and Run 9), the SWH magnitudes are increased up to 50% in the shallow regions in the WCI condition compared to the ‘Only Wave’ condition (Figure 6a). It indicates that the depth-induced wave breaking in shallow regions might be reduced due to the higher water level and variations in currents relative to the “Only Wave”, except at Khepupara, where the effective wind stress resulting from opposite direction of wind and current causes higher wave height in the WCI than the Only Wave scenario. When only whitecapping dissipation is allowed (Run 7 and Run 10), then the WCI causes a maximum change in the SWH in shallow regions where the current and wind are in opposite directions (Figure 6b). When only bottom friction dissipation is allowed (Run 8 and Run 11), then WCI also produces a higher change in the SWH in shallow regions compared to the ‘Only Wave’ condition (Figure 6c). The ‘whitecapping’ dissipation produces the closest maximum SWH variations to the realistic case (Figure 6d). This suggests that dissipation related to whitecapping plays a dominant role among the three dissipation terms during the cyclone-induced storm-surge event. Furthermore, the wave–current interaction causes a higher SWH modulation in shallow regions (−50 to 50 km from Khepupara) compared with in the deep ocean (beyond 50 km from the coast), and the wave energy dissipation is one of the key factors affecting the SWH variations in those deep-ocean regions. As a result, the increase of the wave energy dissipation in the WCI runs reduced the SWH growth rate, as in Equations (6) and (7), and the timing of the maximum SWH is delayed by 1 h at all the stations except Galachipa (Figure 6d). At Tajumuddin, the time delay of the maximum SWH is probably caused by a reduced wave energy input due to a reduced effective wind stress and a decreased SWH, as discussed in Section 3.3.

3.5. Model Limitations and Uncertainties

One of the major challenges in studying complex nonlinear hydrodynamic processes in the GBMD, including the wave–current interaction, is the lack of field observations. There is no wave buoy station near the Bangladesh coast. Moreover, all the water level monitoring stations in the coastal area are in the shallow regions. Some of these stations are automated, and some require manual reading. During Cyclone Sidr, the Khepupara and Hironpoint stations stopped working and clearly missed the peak of the surge height. The availability of field data, including uncertainty during cyclones in the GBMD, is discussed in detail by Chiu and Small [34]. Due to the lack of high-quality water level records during cyclones, it is very common that trade-offs between parameters do exist in storm-surge models. For example, the maximum water level at one tide-gauge station could be reasonably produced by a model in which there is no wave setup, because the wind surge is overestimated by an artificial increase of maximum wind speed or cyclone size or increasing other parameters such as bathymetry, roughness, and drag coefficient in the numerical model setup. In addition, the model setups do not resolve the tide gauges located in rivers due to lack of bathymetry. Hence, the model validations often only consist in checking the maximum magnitude of the water level in the nearest model grid point, which is sometimes 10 km away or more from the actual tide station location. All these uncertainties related to the numerical modeling studies in the GBMD are discussed by Krien et al. [33]. In the current study, the model setup resolves the coastal river networks, including 200 km inland river networks, based on the bathymetry measurements. However, the period of field measurements is 2007–2014, as mentioned in Part 1 of this study. The discrepancies in bathymetry may also contribute further errors to the model result. Furthermore, the cyclonic wind speed and atmospheric pressure drop during the cyclone period are estimated from the JTWC best track archive by applying a parametric relationship. Inconsistencies in cyclonic features, such as the location of the cyclonic eye, the radius of the maximum wind, the pressure drop between the JTWC track record, and the real case, may also contribute further errors to the model result.
To provide confidence in the model quality assessment, the model errors may be estimated by the following. The model-simulated water level (from Run 1) variations during Cyclone Sidr are compared with observations at Hironpoint, Khepupara, and Chittagong (see Part 1 of this study, [24]). According to Table 2 in Part 1 of this study, the RMSE of the water level at these stations is 0.27 m, 0.68 m, and 0.86 m, respectively. There are few available observations of wave height in the GBMD delta, and so the model results are compared with the ERA5 reanalysis dataset. According to Figure 3e in Part 1 of this study, the RMSE of the SWH in the model domain reaches 1.12 m during Cyclone Sidr.
The influence of waves has been ignored in many studies [35,36,37] by assuming a negligible influence of the wave in the Bangladesh coast, as the GBMD is a strongly tide-dominated. Many factors theoretically support the assumption, such as the shallow bathymetry of the coastal area (just above 1.5 m from the mean sea level), the presence of a wide shallow coastal shelf in the shoreline, and the deep submerged canyon, the Bengal canyon, located 200 km from the coastline. All these geographical features were discussed as the main reasons to dissipate waves far from the coastline in previous studies. Hence, the waves from the deep ocean have less influence on the Bangladesh coast. The aim of the current study to emphasize the potential influence of the wind–wave on the cyclone-induced storm surge events in the GBMD. The uncertainties discussed in the previous paragraph definitely attribute errors in the model results in terms of the magnitude and timing of the maximum surge height. Furthermore, the current study does not consider air–sea consideration in terms of heat, mass flux exchange, density-driven current, sea temperature variations, and Kelvin waves, which may affect the model results [35]. However, the present study demonstrates the importance of considering the wave–current interactions in a coupled way to represent real scenarios, and the model setup produced a better result compared to recent studies (See Table 4 in Part 1 of this study, [24]). The findings of the current study indicate that the strong cyclonic wind generated the local wind–wave has potential to influence the magnitude and timing of the peak of the cyclone-induced storm-surge event during extreme weather conditions such as tropical cyclones. Similar findings are also observed in the Indian coast by different recent studies [20,38].

4. Summary and Conclusions

The findings of the current study show that including wind–wave can result in higher significant wave heights (1.1 m higher at the Cyclone Sidr landfall location of Khepupara) compared with only wind-driven wave model results. During Cyclone Sidr landfall, all stations except those located in the central GBMD were in the flood phase. Therefore, the varying wind speed and direction during Cyclone Sidr with different tidal characteristics result in different WCI effects on the wave height variations across the GBMD. Considering the WCI in the model simulation shows an increase (e.g., 1.07 m at Khepupara) and decrease (e.g., 0.36 at Tajumuddin) of wave heights compared to the without-WCI model simulation. The increase/decrease of wave heights result from the opposite/same directions of the current and wave. In addition, the effective wind stress (vectorial difference between the wind and current magnitude) is influenced by the WCI, which also causes the varying wind setup across the GBMD. In addition, different current directions and magnitudes with tidal phase variations, along with wind, also influence the wave height variation.
The present study clearly demonstrates the importance of considering the wave–current interactions in the study of wave dynamics during cyclone-induced storm-surge events in the GBMD. Results illustrate that the current plays a dominant role in the modulation of the SWH compared with the water level in both the deep-ocean and deeper coastal waters (e.g., Tajumuddin < 25 m). However, the water level becomes the dominant factor when the waves propagate into shallower regions (e.g., Khepupara < 10 m) from the deeper ocean. The SWH variations are strongly influenced by the wave–current interactions in the shallower region between 50 km landward to 50 km offshore. Whitecapping dissipation dominates the wave dissipation processes.
Finally, the results presented in this study, particularly the influence of the wave–current interaction on waves, are essential for understanding, modeling, and managing a vulnerable estuarine system such as the Ganges-Brahmaputra-Meghna delta that is impacted by cyclones. The established model setup can be further applied to improve disaster management plans, particularly in hazard and risk mapping, embankment height design, and further investigating the cyclone-induced storm-surge events in the GBMD.

Author Contributions

Conceptualization, X.H.W. and M.W.E.E.; methodology, M.W.E.E.; validation, X.H.W. and M.W.E.E.; formal analysis, X.H.W. and M.W.E.E.; investigation, X.H.W. and M.W.E.E.; resources X.H.W.; data curation, M.W.E.E.; writing—original draft preparation, X.H.W. and M.W.E.E.; writing—review and editing, X.H.W. and M.W.E.E.; visualization, M.W.E.E.; supervision, X.H.W.; project administration, X.H.W. All authors have read and agreed to the published version of the manuscript.

Funding

This research received no external funding.

Data Availability Statement

The bathymetric survey data are accessible for research purpose only via contacting the Institute of Water and Flood Management, BUET, Bangladesh (iwfm.buet.ac.bd). The water level data can be found on the website of the Bangladesh Inland Water Transport Authority: biwtahydrographicdata.gov.bd.

Acknowledgments

This is publication no. 90 of the Sino-Australian Research Consortium for Coastal Management (previously the Sino-Australian Research Centre for Coastal Management). The authors acknowledge the continuous support from Munsur Rahman, Institute of Water of Flood Management, BUET by sharing the bathymetric survey data, the water level data from the Bangladesh Water Development Board and Bangladesh Inland Water Transport Authority, and from E. A. Ritchie of UNSW Canberra who provided workstation for computation. The comments from three anonymous reviewers improved the manuscript. The cross-sections shared by the following two consortium projects are also gratefully acknowledged: (1) Assessing health, livelihoods, ecosystem services and poverty alleviation in populous deltas’, project number NE-J002755-1, was funded with support from the Ecosystem Services for Poverty Alleviation (ESPA) program. The ESPA program is funded by the Department for International Development (DFID), the Economic and Social Research Council (ESRC), and the Natural Environment Research Council (NERC). (2) Deltas, Vulnerability and Climate Change: Migration and Adaptation project (IDRC 107642) under the Collaborative Adaptation Research Initiative in Africa and Asia (CARIAA) program with financial support from the Department for International Development, UK Government (DFID), and the International Development Research Centre (IDRC), Canada.

Conflicts of Interest

The authors declare no conflict of interest.

References

  1. Mellor, G.L. The Three-Dimensional Current and Surface Wave Equations. J. Phys. Oceanogr. 2003, 33, 1978–1989. [Google Scholar] [CrossRef]
  2. Mellor, G.L.; Donelan, M.A.; Oey, L.-Y. A Surface Wave Model for Coupling with Numerical Ocean Circulation Models. J. Atmos. Ocean. Technol. 2008, 25, 1785–1807. [Google Scholar] [CrossRef]
  3. Mellor, G.L. A Combined Derivation of the Integrated and Vertically Resolved, Coupled Wave–Current Equations. J. Phys. Oceanogr. 2015, 45, 1453–1463. [Google Scholar] [CrossRef]
  4. Lewis, M.J.; Palmer, T.; Hashemi, R.; Robins, P.; Saulter, A.; Brown, J.; Lewis, H.; Neill, S. Wave-Tide Interaction Modulates Nearshore Wave Height. Ocean Dyn. 2019, 69, 367–384. [Google Scholar] [CrossRef]
  5. Liu, H.; Xie, L. A Numerical Study on the Effects of Wave–Current–Surge Interactions on the Height and Propagation of Sea Surface Waves in Charleston Harbor during Hurricane Hugo 1989. Cont. Shelf Res. 2009, 29, 1454–1463. [Google Scholar] [CrossRef]
  6. Viitak, M.; Maljutenko, I.; Alari, V.; Suursaar, Ü.; Rikka, S.; Lagemaa, P. The impact of surface currents and sea level on the wave field evolution during St. Jude storm in the eastern Baltic Sea. Oceanologia 2016, 58, 176–186. [Google Scholar] [CrossRef]
  7. Yu, X.; Pan, W.; Zheng, X.; Zhou, S.; Tao, X. Effects of Wave-Current Interaction on Storm Surge in the Taiwan Strait: Insights from Typhoon Morakot. Cont. Shelf Res. 2017, 146, 47–57. [Google Scholar] [CrossRef]
  8. Kang, K.; Kim, S. Wave–Tide Interactions during a Strong Storm Event in Kyunggi Bay, Korea. Ocean Eng. 2015, 108, 10–20. [Google Scholar] [CrossRef]
  9. Tolman, H.L. A Third-Generation Model for Wind Waves on Slowly Varying, Unsteady, and Inhomogeneous Depths and Currents. J. Phys. Oceanogr. 1991, 21, 782–797. [Google Scholar] [CrossRef]
  10. Rusu, L.C.; Bernardino, M.; Soares, C.G. Modelling the Influence of Currents on Wave Propagation at the Entrance of the Tagus Estuary. Ocean Eng. 2011, 38, 1174–1183. [Google Scholar] [CrossRef]
  11. Hopkins, J.; Elgar, S.; Raubenheimer, B. Observations and model simulations of wave-current interaction on the inner shelf. J. Geophys. Res. Ocean. 2016, 121, 198–208. [Google Scholar] [CrossRef]
  12. Rybalko, A.; Myslenkov, S. Analysis of Current Influence on the Wind Wave Parameters in the Black Sea Based on SWAN Simulations. J. Ocean Eng. Mar. Energy 2022. [Google Scholar] [CrossRef]
  13. Gonazález, F.I. A Case Study of Wave–Current–Bathymetry Interactions at the Columbia River Entrance. J. Phys. Oceanogr. 1984, 14, 1065–1078. [Google Scholar] [CrossRef]
  14. Wolf, J.; Prandle, D. Some observations of wave–current interaction. Coast. Eng. 1999, 37, 471–485. [Google Scholar] [CrossRef]
  15. Song, H.; Kuang, C.; Hua, X.; Ma, Z. Wave-current interactions during extreme weather conditions in southwest of Bohai Bay, China. Ocean Eng. 2020, 216, 108068. [Google Scholar] [CrossRef]
  16. Murty, P.L.N.; Sandhya, K.G.; Bhaskaran, P.K.; Jose, F.; Gayathri, R.; Balakrishnan Nair, T.M.; Srinivasa Kumar, T.; Shenoi, S.S.C. A coupled hydrodynamic modeling system for PHAILIN cyclone in the Bay of Bengal. Coast. Eng. 2014, 93, 71–81. [Google Scholar] [CrossRef]
  17. Brown, J.; Bolaños, R.; Wolf, J. The Depth-Varying Response of Coastal Circulation and Water Levels to 2D Radiation Stress When Applied in a Coupled Wave-Tide-Surge Modelling System during an Extreme Storm. Coast. Eng. 2013, 82, 102–113. [Google Scholar] [CrossRef]
  18. Fan, Y.; Ginis, I.; Hara, T. The Effect of Wind-Wave-Current Interaction on Air-Sea Momentum Fluxes and Ocean Response in Tropical Cyclones. J. Phys. Oceanogr. 2009, 39, 1019–1034. [Google Scholar] [CrossRef]
  19. Hu, K.; Ding, P.; Wang, Z.; Yang, S. A 2D/3D Hydrodynamic and Sediment Transport Model for the Yangtze Estuary, China. J. Mar. Syst. 2009, 77, 114–136. [Google Scholar] [CrossRef]
  20. Samiksha, V.; Vethamony, P.; Antony, C.; Bhaskaran, P.; Nair, B. Wave-current interaction during Hudhud cyclone in the Bay of Bengal. Nat. Hazards Earth Syst. Sci. 2017, 17, 2059–2074. [Google Scholar] [CrossRef] [Green Version]
  21. Ris, R.C.; Holthuijsen, L.H.; Booij, N. A third-generation wave model for coastal regions: 2. Verification. J. Geophys. Res. Ocean. 1999, 104, 7667–7681. [Google Scholar] [CrossRef]
  22. Pleskachevsky, A.; Eppel, D.P.; Kapitza, H. Interaction of waves, currents and tides, and wave-energy impact on the beach area of Sylt Island. Ocean Dyn. 2009, 59, 451–461. [Google Scholar] [CrossRef]
  23. Booij, N.; Ris, R.C.; Holthuijsen, L.H. A third-generation wave model for coastal regions 1. Model description and validation. J. Geophys. Res. Ocean. 1999, 104, 7649–7666. [Google Scholar] [CrossRef]
  24. Elahi, M.W.E.; Wang, X.H.; Salcedo-Castro, J.; Ritchie, E.A. Influence of wave-current interaction on a cyclone-induced storm surge event in the Ganges-Brahmaputra-Meghna Delta: Part 1. Effects on water level. J. Mar. Sci. Eng. 2023; submitted. [Google Scholar]
  25. Phillips, O.M. The Dynamics of the Upper Ocean; CUP Archive: Cambridge, UK, 1966. [Google Scholar]
  26. Whitham, G.B. Linear and Nonlinear Waves; John Wiley & Sons: Hoboken, NJ, USA, 2011. [Google Scholar]
  27. Hasselmann, K.; Barnett, T.P.; Bouws, E.; Carlson, H.; Cartwright, D.E.; Enke, K.; Ewing, J.A.; Gienapp, H.; Hasselmann, D.E.; Kruseman, P.; et al. Measurements of Wind-Wave Growth and Swell Decay during the Joint North Sea Wave Project (JONSWAP); Deutches Hydrographisches Institut: Hamburg, Germany, 1973; p. 95. [Google Scholar]
  28. Mei, C.C. The Applied Dynamics of Ocean Surface Waves; World Scientific: Singapore, 1989. [Google Scholar]
  29. Komen, G.J.; Hasselmann, S.; Hasselmann, K. On the existence of a fully developed wind-sea spectrum. J. Phys. Ocean. 1984, 14, 1271–1285. [Google Scholar] [CrossRef]
  30. Deltares. Simulation of Short-Creseted Waves with SWAN: Deflt3D-WAVE, User Manual; Deltares: Delft, The Netherlands, 2018. [Google Scholar]
  31. Battjes, J.A.; Janssen, J.P.F.M. Energy Loss and Set-Up Due to Breaking of Random Waves. In Coastal Engineering 1978; ASCE: Reston, VA, USA, 1978; pp. 569–587. [Google Scholar] [CrossRef]
  32. SWAN Team. SWAN User Manual, SWAN Cycle III version 40.91; Delft University of Technology: Delft, The Netherlands, 2014; p. 123. [Google Scholar]
  33. Krien, Y.; Testut, L.; Islam, A.K.M.S.; Bertin, X.; Durand, F.; Mayet, C.; Tazkia, A.R.; Becker, M.; Calmant, S.; Papa, F.; et al. Towards improved storm surge models in the northern Bay of Bengal. Cont. Shelf Res. 2017, 135, 58–73. [Google Scholar] [CrossRef]
  34. Chiu, S.; Small, C. Observations of Cyclone-Induced Storm Surge in Coastal Bangladesh. J. Coast. Res. 2016, 321, 1149–1161. [Google Scholar] [CrossRef]
  35. Mamnun, N.; Bricheno, L.M.; Rashed-Un-Nabi, M. Forcing ocean model with atmospheric model outputs to simulate storm surge in the Bangladesh coast. Trop. Cyclone Res. Rev. 2020, 9, 117–134. [Google Scholar] [CrossRef]
  36. Hussain, M.; Tajima, Y.; Hossain, M.; Das, P. Impact of Cyclone Track Features and Tidal Phase Shift upon Surge Characteristics in the Bay of Bengal along the Bangladesh Coast. J. Mar. Sci. Eng. 2017, 5, 52. [Google Scholar] [CrossRef]
  37. Lewis, M.; Bates, P.; Horsburgh, K.; Neal, J.; Schumann, G. A Storm Surge Inundation Model of the Northern Bay of Bengal Using Publicly Available Data. Q. J. R. Meteorol. Soc. 2013, 139, 358–369. [Google Scholar] [CrossRef]
  38. Prakash, K.R.; Pant, V. On the wave-current interaction during the passage of a tropical cyclone in the Bay of Bengal. Deep. Res. Part II Top. Stud. Oceanogr. 2020, 172, 104658. [Google Scholar] [CrossRef]
Figure 1. The study area along with Cyclone Sidr and discharge boundary. Different color boxes represent different regions of the GBMD. Red arrow denotes, Khepupara, the nearest station to the landfall location.
Jmse 11 00298 g001
Figure 2. Significant wave height variations for the ‘Only wave’ (Run 2) and ‘Wave-current interaction’ (Run 1 in Table 1) scenarios during the landfall of Cyclone Sidr. The purple dashed line denotes the landfall time at 64 h, 15:00 UTC 15 November 2007.
Jmse 11 00298 g002
Figure 3. Direction and amplitude variations of the surface current and wind at (a,d) Khepupara, (b,e) D2, and (c,f) Tajumuddin for ‘WCI’ (Run 1 in Table 1) and ‘OWC’ (Run 2 in Table 1) scenarios. The purple dotted line represents the cyclone landfall time 1500 UTC 15 November 2007.
Jmse 11 00298 g003
Figure 4. Influence of different parameters on significant wave height variations during Cyclone Sidr for different scenarios at (a) Khepupara, (b) Tajumuddin, (c) D1, and (d) D2. The purple dashed line denotes the landfall time 15:00 15 November 2007 (64 h).
Jmse 11 00298 g004
Figure 5. Maximum (a) significant wave height and (b) wave energy variations with and without wave–current interaction at Khepupara for Cyclone Sidr for different wave dissipation processes (Run 6–11 in Table 2). Maximum amplitudes of SWH and dissipation are observed at different times of the cyclone passage for different scenarios.
Jmse 11 00298 g005
Figure 6. Maximum significant wave height variations along the Bay of Bengal for “Only Wave” and “Wave-Current interaction” conditions under (a) Only depth-induced breaking, (b) Only whitecapping, (c) Only bottom friction, and (d) All wave dissipation processes. Maximum amplitudes of the SWH are observed at different times of the cyclone for different scenarios. A positive distance represents the oceanward direction. Change in % = (WCI-Only Wave)/Only Wave %.
Jmse 11 00298 g006
Table 1. Scenario details to investigate influence of wave–current interaction in cyclone-induced storm surge height. * Note: Run 2 also represents WAVE one-way coupled to FLOW to simulate the wave-driven current.
Run NameSimulationDescriptionCoupling Method
Run 1Control run
(WCI)
FLOW and WAVE simulation Two-way
Run 2 *Wave only
(Only wave, OWC)
WAVE simulationOne-way
(WAVE to FLOW)
Run 3Wave only
(WL + Cu to Wv)
WAVE simulation using water level and current from Run 5
Run 4Wave only
(WL to Wv)
WAVE simulation using water level from Run 5One-way
(FLOW to WAVE)
Run 5Wave only
(Cu to Wv)
WAVE simulation using current from Run 5
Table 2. Scenario details to investigate different wave dissipation processes.
Model
Setup
Run NameDescription
With WCIRun 6Control run (Run 1) considering only depth-induced breaking
Run 7Control run (Run 1) considering only whitecapping
Run 8Control run (Run 1) considering only bottom friction
Only WaveRun 9WAVE simulation (Run 2) considering only depth-induced breaking
Run 10WAVE simulation (Run 2) considering only whitecapping
Run 11WAVE simulation (Run 2) considering only bottom friction
Disclaimer/Publisher’s Note: The statements, opinions and data contained in all publications are solely those of the individual author(s) and contributor(s) and not of MDPI and/or the editor(s). MDPI and/or the editor(s) disclaim responsibility for any injury to people or property resulting from any ideas, methods, instructions or products referred to in the content.