Abstract
Arctic rivers bring litter from their basins to the sea, but accurate data for the Arctic do not exist yet. This study presents the first assessment of floating macro litter input (>2.5 cm) from the Northern Dvina and Onega rivers to the White Sea. The observations were performed based on the European Marine Strategy Framework Directive (MSFD) methodology and using the mobile application of the Joint Research Centre (Ispra, Italy). The results of observations from May 2021 to November 2021 show that 77% of floating objects were of natural origin (mainly leaves, wood and bird feathers). Of the particles of anthropogenic origin, 59.6% were represented by various types of plastics, 27.7% were processed wood, 8.5% paper/cardboard, 2.7% metal, 1.1% were rubber and <1% textiles. The average monthly input of anthropogenic macro litter by the Northern Dvina varies from 250 to 1700 items/hour, and by Onega from 520 to 2350 items/hour. The level of pollution of the studied rivers was found to be higher than in some Europeans rivers but lower than in China. The mass discharge of macroplastics in the Northern Dvina River was compared with the estimates of the discharge of meso- and microplastics; that allowed us to show that the discharge of macroplastics in mass units is much higher than of micro- and mesoplastics.
1. Introduction
The pollution of the world’s oceans with anthropogenic, especially plastic, litter is one of the most pressing problems. The accumulation density of macroplastics in the northern hemisphere, especially near large cities, is very high [1]. Between 5 and 13 million tons of plastic litter enter the marine environment from land every year, of which almost 2 million tons are garbage coming from various marine sources [2]. Plastic garbage is distributed extremely heterogeneously in the sea. The reasons for this are primarily local wind, current conditions, the shape of the coastline and points of discharge into the water, for example, sewage, coastal urban areas and shipping routes [3]. Macroplastics transfer depends on the hydrodynamics of the river [4] and the types of aquatic vegetation [5]. A comparison of the processes of organic and plastic litter entering the World Ocean shows the difference between these processes. While the input of organic waste mainly depends only on natural processes (storms, landslides, coastal erosion, etc.), the plastics supply depends on both natural (wind, coastal runoff) and anthropogenic factors (waste disposal, population density, urbanization) [6]. Indicators of the accumulation rates of plastic garbage vary unevenly, and there are fairly stable trends of both increase and decrease [1].
Many plastics do not have natural sedimentary analogues due to their lightness, durability and flexibility; therefore, they can be considered as a new type of sediment particles and, consequently, as a new type of load on river sediments [7]. Assessment of the amount and composition of macro litter is important not only in the sea but also in various drains, including rivers. The study of freshwater river systems is necessary to understand the future fate of floating macro debris in the ocean. According to recent estimates, global riverine plastic emissions are 0.5–3.2 million tons of plastic waste [8,9].
The large rivers of the Arctic region—the Pechora, Onega, Northern Dvina, Yenisei, Ob, Kolyma and Lena—take out all the garbage that gets into their pools to the sea and the coastal zone. A significant source of various household waste to the Arctic coasts is the mainland runoff. Household waste is characterised by the presence of a significant amount of plastic. Therefore, the rivers are the main way of transporting this waste to the Arctic Ocean from land.
According to the studies in the Arctic Ocean, the western part of the Barents Sea is more polluted than the Siberian Arctic [10,11]. One of the important factors for Siberian rivers is the fact that only the areas located upstream of these rivers are inhabited, which can be a source of environmental pollution [12]. However, the plastic litter produced in the upstream regions can be lost along the river coasts in the downstream regions with low population, and as a result these rivers bring low-polluted water to the seas. On the other hand, the basins of the European Arctic rivers flowing to the White Sea and the Barents Sea are populated both in upstream and downstream regions, and can be a significant source of anthropogenic litter.
The main objective of this work was to study the input of plastic litter with the largest rivers of the European North—the Northern Dvina and Onega, which flow through the populated regions into the White Sea. We aimed at estimating of the value of the inflowing plastic litter, and its potential seasonal variability in comparison with the other rivers.
2. Materials and Methods
Two large Arctic rivers, the Northern Dvina and the Onega, were selected to analyse the floating macro litter flux into the White Sea (Figure 1). These 2 rivers are the only Arctic rivers flowing through the populated regions in their downstreams and, therefore, can be a significant source of the plastic going to the Arctic. The Northern Dvina is the largest of the analysed rivers, with a length of 744 km, the basin area is about 357,000 km2, and average annual water flow at the mouth is 3420 m3/s, which is higher from April to June. The length of the Onega is 416 km, the basin area is about 56,900 km2, and the average annual water flow at the mouth is 535 m3/s, which is higher from April to June. Nourishment of the river is mixed, and is mainly snow-derived [13].
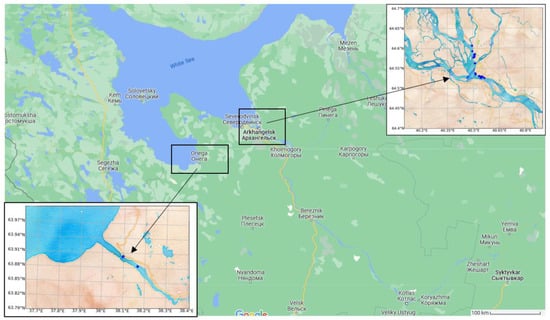
Figure 1.
Observation sites in the basins of the Northern Dvina and Onega rivers. Blue dots show positions of the observations.
Observations were carried out in the delta of the Northern Dvina and Onega rivers (Figure 1) from 5 May to 5 November 2021 by trained observers from the P. P. Shirshov Institute of Oceanology (RAS) and the Center for Collective Use of Scientific Equipment “Arctic” (M. V. Lomonosov NARFU). The MSFD riverine litter monitoring methodology which is described in “Guidance on Monitoring of Marine Litter in European Seas” was used in order to receive harmonized data. Observations were carried out several times a month from the observation positions on the right coast of the rivers. The observers conducted observation sessions with a duration of 30–50 min, with an average interval of about 7 days in the Northern Dvina River and with an average interval of a month in the Onega River. In different locations, the height of the observation position above the water level varied from 2 to 5 m. The observation width was selected depending on the observing conditions and height, in order to identify floating objects larger than 2.5 cm according to the methodology [14]. During the surveys, the observation width varied from 2 to 20 m. The rivers’ widths at the observation points were 785 m for the Northern Dvina River and 1000 m for the Onega River. The results of the observations were normalized to the widths of the river.
In this study, the Floating Macro Litter mobile application developed by the Joint Research Centre (JRC, Ispra, Italy) [14] was for the first time applied for Arctic rivers. The application allows the registering of GPS position, time, marine item category according to the “Guidance on Monitoring of Marine Litter in European Seas” [14] and a range of item sizes. The categorization list includes 42 items. The items are divided into 7 types: not litter, processed/worked wood, artificial polymers (including plastic/polystyrene), paper/cardboard, metal, rubber, clothing/textiles. The following size ranges are considered: 2.5–5 cm; 5–10 cm; 10–20 cm; 20–30 cm; 30–50 cm; >50 cm. In this study, we included cigarette butts, which could be slightly less than 2.5 cm, in the category 2.5–5 cm. In the category of Plastic bottles 2.5–5 cm, bottle caps were registered. The resulting riverine litter flux was calculated as items per hour.
The calculated discharge was adjusted by linearly scaling the amount of surface macro litter by the widths of the rivers mentioned above. In this work, we used statistical analysis based on Spearman’s rank correlation and Kendall’s rank correlation [15] to assess the correlations between the size of objects with the frequency of occurrence.
3. Results
3.1. Litter Categories
A total of 1713 particles were registered during the observations in both rivers during the period of observations in 2021. Most of the observed macro litter >2.5 cm, about 77%, are objects of natural origin (leaves, bird feathers, etc.). Particles of anthropogenic origin were represented by artificial polymers (59.6%), processed/worked wood (27.7%), paper/cardboard (8.5%), metal (2.7%), rubber (1.1%) and textiles (<1%) (Figure 2).
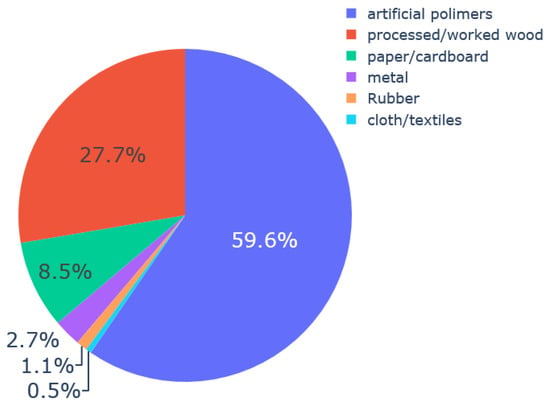
Figure 2.
Ratio of anthropogenic litter categories.
Table 1 demonstrates the percentages of the most common categories of anthropogenic items divided by size. These categories account for 72 percent of all recorded anthropogenic particles. The most abundant type of plastic litter was plastic pieces, with absolute dominance of the smallest objects, 2.5–5 cm. Among the plastic bottles (and corks) prevailed the size class 20–30 cm. In the Other plastic/polystyrene items 2.5–5 cm category, 74% were the cigarette butts. Bags sized 10–30 cm were registered relatively rarely (about 3% of total).

Table 1.
The most common types of anthropogenic items and their percentages from the total amount.
The frequency of occurrence of the various sizes classes is shown in Figure 3. This figure demonstrates that the number of records decreases with the increasing size of objects. Statistical analysis also showed a strong negative correlation between the size and frequency of occurrence (Spearman’s rank correlation p = −1.0, P = 0; Kendall’s rank correlation τ = −1.0, P < 0.028).
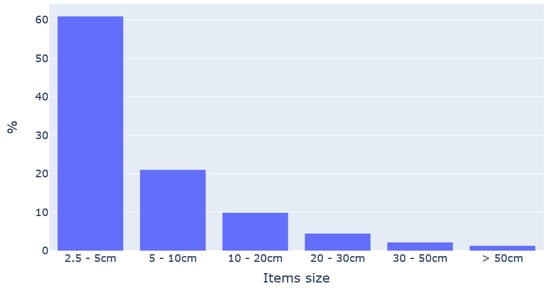
Figure 3.
Percentage of recorded number of items in the different size classes.
3.2. Litter Discharge Estimates
3.2.1. Northern Dvina
The average amount of floating anthropogenic litter in the Northern Dvina River was 250–1720 (±54) items/hour. The calculated discharges of floating garbage for each observation session in different seasons are shown in Figure 4. This figure shows higher values in June and July than in other months. The recorded highs in September and October could not be explained either by natural phenomena (wind, rain) or anthropogenic activities (shipping, holidays, etc.).
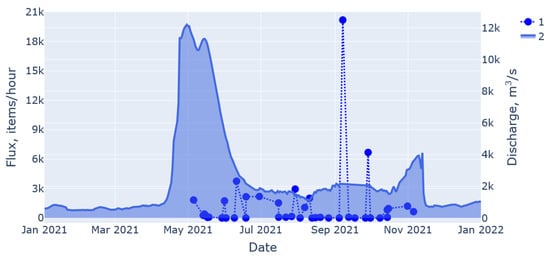
Figure 4.
1. The discharge of anthropogenic particles normalized to items per hour extrapolated to the width of the Northern Dvina River (left axis). 2. Water discharge recorded during 1 year at Ust’-Penega hydrological post (right axis).
For statistical analysis, the correlation of the anthropogenic particles discharge (Figure 4) with the average water discharge was calculated. We used data collected in a hydrological post near the Ust’-Penega, 137 km from the mouth [16]. Figure 4 shows water discharge during 2021 from January to December.
A weak correlation between the monthly average items discharge and the monthly average water discharge was observed (Spearman’s rank correlation p = 0.3, P < 0.5; Kendall’s rank correlation τ = 0.23, P < 0.56). This is perhaps due to the fact that the mouth of the river delta is riddled with many channels and branches, and there is a large distance between the observation site and the flow measurement site. The correlation of the average daily discharge of anthropogenic items with the average water discharge for the same days by day was also calculated (Spearman’s rank correlation p = 0, P < 1; Kendall’s rank correlation τ = 0, P < 1). These correlations are not statistically significant. Most likely, the difference between the correlations of monthly average values and correlations by day is due to the fact that the flow rate changed quite smoothly, so the averaging better reflects the convergence with the macro litter flow.
3.2.2. Onega
The average amount of floating litter in the Onega River was 520–2350 (±150) items/hour. The calculated flux of floating litter for each observation session in different seasons is shown in Figure 5. The figure shows that higher values were recorded in June than in other months.
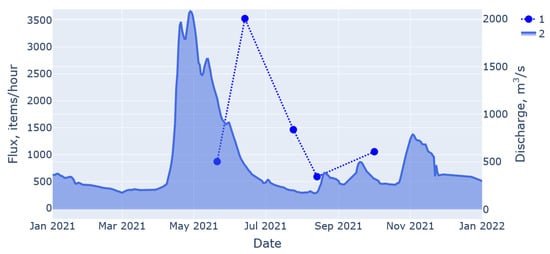
Figure 5.
1. The discharge of anthropogenic particles normalized to items per hour extrapolated to the width of the Onega (left axis). 2. Water discharge recorded during 1 year at Porog (right axis).
For statistical analysis, the correlation of the average monthly discharge of anthropogenic items with the average water discharge was calculated. Measurements were made at a hydrological post near the Porog, 30 km from the Onega River mouth [16]. Figure 5 shows the water flow during 2021 from January to December.
No correlation between the monthly average items discharge and the monthly average water discharge was found (Spearman’s rank correlation p = 0, P < 1; Kendall’s rank correlation τ = 0, P < 1). The correlation of the average discharge of anthropogenic items with the average water discharge by day was also calculated (Spearman’s rank correlation p = 0.3, P < 0.6; Kendall’s rank correlation τ = 0.2, P < 0.8). These correlations are not statistically significant. Most likely, the difference between the correlations of monthly average values and correlations by day is due to the fact that the flow rate changed dramatically from day to day, and has many maxima, so convergence by day is better.
3.3. Calculation of the Mass Discharge of Macro Plastic
The mass discharge of plastic can be approximately estimated using the formula [17]:
Mp = p × mp
- Mp—calculated mass discharge
- p—particle flux/hour
- mp—average weight of one plastic product
This formula was used by Vriend et al. [17] to determine the discharge of floating macroplastics in the Rhine River.
In our case, the total flow of the plastic garbage pieces amount carried out by the Northern Dvina varies from 250 to 1720 items/hour, and the Onega from 520 to 2350 items/hour. If we take the average mass of plastic objects > 5 cm mp=5.38 g [17], then the estimated mass removal of the Northern Dvina will be 373.8– 2570.6 (±80) mg/s, Onega 776.6–3511.6 (±214) mg/s. If we estimate the average mass mp = 3.2 g [18], then the estimated mass removal of the Northern Dvina will be 222.2–1528.9 (±48) mg/s and the Onega 461.8–2089.1 (±133) mg/s. The calculated with average mass of plastic objects > 5 cm mp=5.38 g [17] mass removal for each observation session in different seasons for both rivers is shown in Figure 6.
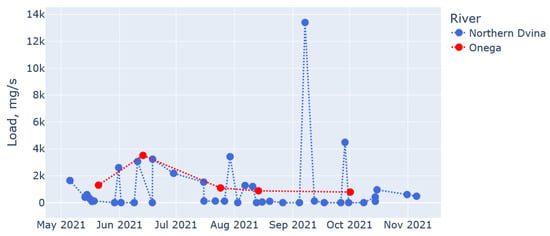
Figure 6.
The mass discharge of plastic items from the Northern Dvina and Onega. The average weight of one plastic product is taken from [17].
3.4. Macroplastics Composition Estimation
Here, we assume that all registered particles of plastic debris, such as Other plastic/polystyrene items or Plastic pieces, consist of polystyrene (PS), all bottles encountered are made of polyethylene terephthalate (PET), and various bags are made of polyethylene (PE). With such assumptions, we show the distribution of the chemical composition of plastic macro litter by month on the Northern Dvina in Figure 7.
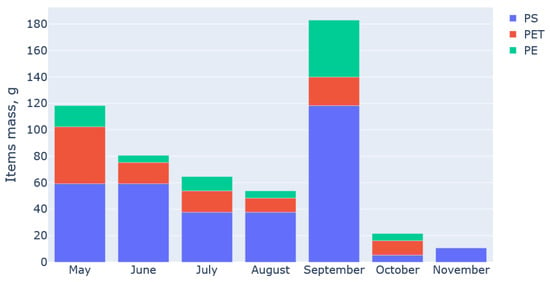
Figure 7.
Chemical composition of macroplastics debris registered on the Northern Dvina River in an assumption described in the text.
We compared our data with data on the chemical composition of micro- and mesoplastics collected in 2019–2020 on the Northern Dvina River [19]. In their study, the predominant was PE, followed by PP and others. The chemical composition of macro-, micro- and mesoplastics was generally similar, but as can be seen from Figure 8 most of the macroplastic particles collected were PS, but not PE, which dominated among micro- and mesoplastics [19]. Depending on application, the PS density can be higher or lower (i.e., EPS) than that of PP and PE; therefore, PS is more abundant directly on the water surface as macroplastics, and also in the sediments, as was recently shown for the Northern Dvina [20].
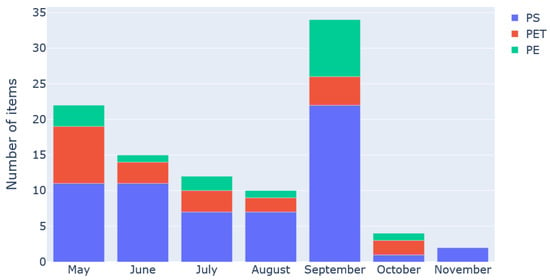
Figure 8.
Chemical composition of macroplastics debris registered on the Northern Dvina River in an assumption described in the text in mass units. The average weight of one plastic product is taken from [17].
4. Discussion
Table 2 compares the macro litter flux in the current research with fluxes in other rivers measured with the same methodology. Our estimates are on average an order of magnitude higher than the flow in Europe, but lower than the average flow in Asia.

Table 2.
Comparison of riverine litter flux in different rivers.
The average number of plastic products per hour for Southeast Asia is approximately 7100 items/hour; the average number of plastic items/hour in Europe is 250 items/hour [23]. Of course, we understand that the accuracy of the measurements is very bad, and different methods were applied in different regions, but the general tendency of higher plastic flux in the Asian rivers compared with the Arctic ones seems logical, due to a much higher density of population in Asia and connected plastic pollution. On the other hand, the smaller values in some European rivers can be explained (leaving alone a difference in the methods) by better cleaning of the waste. Another reason is that the studied Arctic rivers are covered with ice, making surface plastic discharge impossible in the winter period. That means that the flux in summer should be higher than the year-average, because all the garbage accumulated in the snow and ice will be discharged in the Spring–Summer period. To confirm this, we need more observations.
In Figure 9, we summarize together mass discharges of macro-, meso- and microplastics to the Northern Dvina River. In the research [19], the input of meso- and microplastics was calculated as a multiplication of the water discharge on the particles’ concentration. In their work, they found no significant seasonal changes in the concentration and the seasonal changes of the meso- and microplastics discharge are explained by the water discharge changes. Our estimates of the macroplastics discharge are independent from the water discharge, and we found no correlation between them, but we also can mark out an increased discharge in June–July (Figure 6). The mass discharge of micro- and mesoplastics (10–800 mg/s), as expected, is much less than the discharge of macroplastics (600–2500 mg/s). Comparable values of discharges of these to plastic sources are observed only during the flood period in May, but in the rest of the ice-free period macroplastics discharge is absolutely dominant.
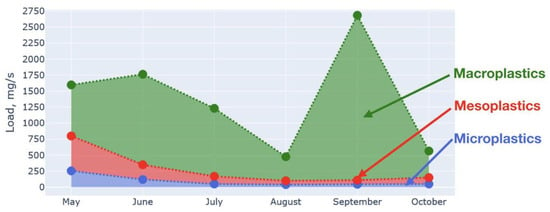
Figure 9.
Seasonal variability of total plastics discharge and shares of microplastics (blue), mezoplastics (red) and macroplastics (green). The data about micro- and mesoplastics are taken from [19].
In the study by [19], microplastics are represented by primary microplastics and secondary microplastics formed during decomposition of the larger pieces of mezo- and macroplastics. Here, we show that the mass concentration of macroplastics is dominant and, being transported to the sea, it will apparently become a source of secondary microplastics. This source is significant enough and should not be ignored in the studies of the microplastics’ fate in the sea water. First of all, this form of plastic pollution should be taken into account in the numerical models of plastics transport.
5. Conclusions
In this work, we have evaluated pollution with macroplastics from the two main rivers, Northern Dvina and Onega, flowing to the White Sea. These rivers are the only Arctic rivers flowing through populated regions in their downstream. The observations were performed based on the MSFD methodology using the mobile application of the Joint Research Centre (Ispra, Italy). The results of observations from May 2021 to November 2021 show that 77% of floating objects were of natural origin (mainly leaves, wood and bird feathers). Among the particles of anthropogenic origin, 59.6% were represented by various types of plastics, 27.7% were processed wood, 8.5% paper/cardboard, 2.7% metal, 1.1% were rubber and <1% textiles. The average monthly discharge of anthropogenic macro litter by the Northern Dvina varies from 250 to 1700 items/hour, and by Onega from 520 to 2350 items/hour. The level of pollution of the studied rivers was found to be higher than in some Europeans rivers but lower than in China. Therefore, flowing through the populated regions, rivers of the White Sea basin can be considered as a detectable source of the plastic pollution of the Arctic. How important this source is compared with the other potential sources, such as transport with currents from the Atlantic and Pacific Oceans, and discharges of Siberian rivers flowing through non-populated regions, remains an open question that should be studied.
The mass discharge of macroplastics in the Northern Dvina River was compared with the estimates of the discharge of meso- and microplastics; that allowed us to show that the discharge of macro-plastics in mass units is much higher than that of micro- and mesoplastics This can be important information for parameterizing the coastal discharge of plastic in mathematical models.
Author Contributions
Conceptualization, M.M. and E.Y.; methodology, M.P. and A.B.; software, M.M. and A.B.; validation, M.M.; formal analysis, M.M.; investigation, E.K., A.K. and E.D.; resources, A.K.; data curation, M.M.; writing—original draft preparation, M.M., M.P. and E.Y.; writing—review and editing, M.M., E.Y., M.P., A.B., A.K., E.D. and E.K.; visualization, M.M. and A.B.; supervision, E.Y.; project administration, A.K.; funding acquisition, E.Y. and A.B. All authors have read and agreed to the published version of the manuscript.
Funding
This work was partly funded by the Norwegian Ministry of Climate and Environment project RUS-19/0001 “Establish regional capacity to measure and model the distribution and input of microplastics to the Barents Sea from rivers and currents (ESCIMO)”, Tomsk State University Development Programme (Priority2030). A.B. and E.Y. were funded by the Ministry of Science and Higher Education of Russia, theme 0128-2021-0001; E.Y. was funded by the Russian Science Foundation Grant 21-77-30001 and the Russian Foundation for Basic Research according to the research projects 20-35-90056.
Institutional Review Board Statement
Not applicable.
Informed Consent Statement
Not applicable.
Data Availability Statement
The data are available upon request.
Acknowledgments
We are grateful for support from the students of the Northern (Arctic) Federal University named after M.V. Lomonosov (Arkhangelsk) and colleagues from Shirshov Institute of Oceanology (Arkhangelsk) for the help with this work.
Conflicts of Interest
The authors declare no conflict of interest. The funders had no role in the design of the study; in the collection, analyses, or interpretation of data; in the writing of the manuscript; or in the decision to publish the results.
References
- Barnes, D.K.A.; Galgani, F.; Thompson, R.C.; Barlaz, M. Accumulation and fragmentation of plastic debris in global environments. Philos. Trans. R. Soc. B Biol. Sci. 2009, 364, 1985–1998. [Google Scholar] [CrossRef] [PubMed]
- Jambeck, J.R.; Geyer, R.; Wilcox, C.; Siegler, T.R.; Perryman, M.; Andrady, A.; Narayan, R.; Law, K.L. Plastic waste inputs from land into the ocean. Science 2015, 347, 768–771. [Google Scholar] [CrossRef] [PubMed]
- Kapp, K.J.; Yeatman, E. Microplastic hotspots in the Snake and Lower Columbia rivers: A journey from the Greater Yellowstone Ecosystem to the Pacific Ocean. Environ. Pollut. 2018, 241, 1082–1090. [Google Scholar] [CrossRef] [PubMed]
- van Emmerik, T.; Tramoy, R.; van Calcar, C.; Alligant, S.; Treilles, R.; Tassin, B.; Gasperi, J. Seine Plastic Debris Transport Tenfolded During Increased River Discharge. Front. Mar. Sci. 2019, 6, 642. [Google Scholar] [CrossRef]
- van Emmerik, T.; Strady, E.; Kieu-Le, T.C.; Nguyen, L.; Gratiot, N. Seasonality of riverine macroplastic transport. Sci. Rep. 2019, 9, 1–9. [Google Scholar] [CrossRef]
- Liro, M.; van Emmerik, T.; Wyzga, B.; Liro, J.; Mikuś, P. Macroplastic storage and remobilization in rivers. Water 2020, 12, 2055. [Google Scholar] [CrossRef]
- Gabbott, S.; Key, S.; Russell, C.; Yonan, Y.; Zalasiewicz, J. The geography and geology of plastics. In Plastic Waste and Recycling; Elsevier: Amsterdam, The Netherlands, 2020; pp. 33–63. [Google Scholar]
- Lebreton, L.C.M.; van der Zwet, J.; Damsteeg, J.W.; Slat, B.; Andrady, A.; Reisser, J. River plastic emissions to the world’s oceans. Nat. Commun. 2017, 8, 1–10. [Google Scholar] [CrossRef]
- Schmidt, C.; Krauth, T.; Wagner, S. Export of Plastic Debris by Rivers into the Sea. Environ. Sci. Technol. 2017, 51, 12246–12253. [Google Scholar] [CrossRef]
- Pogojeva, M.; Zhdanov, I.; Berezina, A.; Lapenkov, A.; Kosmach, D.; Osadchiev, A.; Hanke, G.; Semiletov, I.; Yakushev, E. Distribution of floating marine macro-litter in relation to oceanographic characteristics in the Russian Arctic Seas. Mar. Pollut. Bull. 2021, 166, 112201. [Google Scholar] [CrossRef]
- Yakushev, E.; Gebruk, A.; Osadchiev, A.; Pakhomova, S.; Lusher, A.; Berezina, A.; van Bavel, B.; Vorozheikina, E.; Chernykh, D.; Kolbasova, G.; et al. Microplastics distribution in the Eurasian Arctic is affected by Atlantic waters and Siberian rivers. Commun. Earth Environ. 2021, 2, 23. [Google Scholar] [CrossRef]
- Pakhomova, S.; Berezina, A.; Lusher, A.L.; Zhdanov, I.; Silvestrova, K.; Zavialov, P.; van Bavel, B.; Yakushev, E. Microplastic variability in subsurface water from the Arctic to Antarctica. Environ. Pollut. 2022, 298, 118808. [Google Scholar] [CrossRef] [PubMed]
- Brittain, J.E.; Gíslason, G.A.M.; Ponomarev, V.I.; Bogen, J.; Brørs, S.; Jensen, A.J.; Khokhlova, L.G.; Kochanov, S.K.; Kokovkin, A.V.; Melvold, K.; et al. Arctic Rivers. In Rivers of Europe; Elsevier Ltd.: Amsterdam, The Netherlands, 2009; pp. 337–379. [Google Scholar]
- González-Fernández, D.; Hanke, G. Toward a Harmonized Approach for Monitoring of Riverine Floating Macro Litter Inputs to the Marine Environment. Front. Mar. Sci. 2017, 4, 86. [Google Scholar] [CrossRef]
- Rosenblad, A. The Concise Encyclopedia of Statistics. J. Appl. Stat. 2011, 38, 867–868. [Google Scholar] [CrossRef]
- Discharge-Data-Interctive-Plots-Knit. Available online: https://arcticgreatrivers.org/discharge/> (accessed on 26 January 2023).
- Vriend, P.; van Calcar, C.; Kooi, M.; Landman, H.; Pikaar, R.; van Emmerik, T. Rapid Assessment of Floating Macroplastic Transport in the Rhine. Front. Mar. Sci. 2020, 7, 10. [Google Scholar] [CrossRef]
- van Emmerik, T.; Kieu-Le, T.-C.; Loozen, M.; van Oeveren, K.; Strady, E.; Bui, X.-T.; Egger, M.; Gasperi, J.; Lebreton, L.; Nguyen, P.-D.; et al. A Methodology to Characterize Riverine Macroplastic Emission Into the Ocean. Front. Mar. Sci. 2018, 5, 372. [Google Scholar] [CrossRef]
- Zhdanov, I.; Lokhov, A.; Belesov, A.; Kozhevnikov, A.; Pakhomova, S.; Berezina, A.; Frolova, N.; Kotova, E.; Leshchev, A.; Wang, X.; et al. Assessment of seasonal variability of input of microplastics from the Northern Dvina River to the Arctic Ocean. Mar. Pollut. Bull. 2022, 175, 113370. [Google Scholar] [CrossRef]
- Belesov, A.V.; Rezviy, T.V.; Pokryshkin, S.A.; Lakhmanov, D.E.; Chukhchin, D.G.; Kozhevnikov, A.Y. Impact of Coastal Sediments of the Northern Dvina River on Microplastics Inputs to the White and Barents Seas. J. Mar. Sci. Eng. 2022, 10, 1485. [Google Scholar] [CrossRef]
- Crosti, R.; Arcangeli, A.; Campana, I.; Paraboschi, M.; González-Fernández, D. ‘Down to the river’: Amount, composition, and economic sector of litter entering the marine compartment, through the Tiber river in the Western Mediterranean Sea. Rend. Lincei 2018, 29, 859–866. [Google Scholar] [CrossRef]
- van Emmerik, T.; Loozen, M.; van Oeveren, K.; Buschman, F.; Prinsen, G. Riverine plastic emission from Jakarta into the ocean. Environ. Res. Lett. 2019, 14, 084033. [Google Scholar] [CrossRef]
- van Calcar, C.J.; van Emmerik, T.H.M. Abundance of plastic debris across European and Asian rivers. Environ. Res. Lett. 2019, 14, 124051. [Google Scholar] [CrossRef]
- Castro-Jiménez, J.; González-Fernández, D.; Fornier, M.; Schmidt, N.; Sempéré, R. Macro-litter in surface waters from the Rhone River: Plastic pollution and loading to the NW Mediterranean Sea. Mar. Pollut. Bull. 2019, 146, 60–66. [Google Scholar] [CrossRef] [PubMed]
- Pogojeva, M.; Korshenko, E.; Osadchiev, A. Riverine Litter Flux to the Northeastern Part of the Black Sea. J. Mar. Sci. Eng. 2023, 11, 105. [Google Scholar] [CrossRef]
Disclaimer/Publisher’s Note: The statements, opinions and data contained in all publications are solely those of the individual author(s) and contributor(s) and not of MDPI and/or the editor(s). MDPI and/or the editor(s) disclaim responsibility for any injury to people or property resulting from any ideas, methods, instructions or products referred to in the content. |
© 2023 by the authors. Licensee MDPI, Basel, Switzerland. This article is an open access article distributed under the terms and conditions of the Creative Commons Attribution (CC BY) license (https://creativecommons.org/licenses/by/4.0/).