Article

Air Quality and Atmospheric Emissions from the Operation of the Main Mexican Port in the Gulf of Mexico from 2019 to 2020

by
Ana Isabel González Rivera
1,
Violeta Mugica-Álvarez
1,
Rodolfo Sosa Echeverría
2,*,
Pablo Sánchez Álvarez
2,
Víctor Magaña Rueda
3,
Gustavo Vázquez Cruz
3 and
Armando Retama
4
1
Posgrado de la División de Ciencias Básicas e Ingeniería, Doctorado en Ciencias e Ingeniería (Ambiental), Unidad Azcapotzalco, Universidad Autónoma Metropolitana, Av. San Pablo No. 180, Col. Reynosa Tamaulipas, Azcapotzalco, Mexico City 02200, Mexico
2
Instituto de Ciencias de la Atmósfera y Cambio Climático, Universidad Nacional Autónoma de México, Ciudad Universitaria, Mexico City 04510, Mexico
3
Instituto de Geografía, Universidad Nacional Autónoma de México, Ciudad Universitaria, México City 04510, Mexico
4
Independent Consultant, Mexico City 11800, Mexico
*
Author to whom correspondence should be addressed.
J. Mar. Sci. Eng. 2023, 11(2), 265; https://doi.org/10.3390/jmse11020265
Submission received: 10 December 2022 / Revised: 30 December 2022 / Accepted: 9 January 2023 / Published: 24 January 2023
(This article belongs to the Section Marine Environmental Science)

Abstract

:
Pollutant emissions into the atmosphere derived from port activities can be transported to surrounding regions and cities depending on wind speed and direction, having an impact on air quality. In this research, emissions of atmospheric pollutants (NOx, CO, NMHCs, CO2, SO2, TSP, PM2.5 and PM10) were estimated for: tanks, container, roll-on/roll-off (RO-RO), bulk carriers and general cargo ships, using emission factors in the hoteling and maneuvering stage in the port area of Veracruz, Mexico, during 2019 and 2020 despite the suspension period of activities due to the SARS-CoV-2/COVID-19 pandemic. Among the total estimated emissions, CO2 presented the highest values for 2019 (31,177 kg/year) and 2020 (29,003 kg/year), whereas CH4 presented the lowest values with 0.294 kg/year for 2019 and 0.273 kg/year for 2020. The highest estimated emissions for CO2, NOx and SO2 occurred in the maneuvering stage in 2019 for bulk carriers, tanks and container ships. Likewise, the highest estimated emissions were during the hoteling stage of the container ships in 2020. This study will provide an updated ship emissions inventory for the Gulf of Mexico region where the Port of Veracruz is located. In addition, SO2 and PM2.5 measurements were performed from October 2019 to December 2020. PM2.5 concentrations exceeded the Mexican Ambient Air Quality Standard (MAAQS) value of 45 µg m−3 for the 24-h average concentration several times, on the opposite, SO2 exhibited concentrations up to 20 times lower than the 24-h MAAQS value of 40 ppb. Results showed that pollutant emissions in the port of Veracruz exhibited a seasonal variability, modifying their dispersion and the possible effects. Our main conclusion is that current port area is the major source of pollutant emissions (SO2 and PM2.5) throughout the year, whereas the expansion area of the port of Veracruz does not represent still a significant rise of pollutant emissions, but it is expected that the growth of port activity will directly increase the concentrations of pollutants emitted.

1. Introduction

Several studies have reported that pollutant emissions from ships and port areas modify the air quality of the areas where they are located as well as other regions or nearby cities due to the emissions transport, and are important contributors to global air pollution [1,2,3,4] The increase in these emissions is directly related to international port activity, in which the use of larger vessels, high capacity and consequently greater fuel consumption, is intended to satisfy commercial needs [5,6,7,8].
Emissions from ships are dominated by nitrogen oxides (NOx), sulfur dioxide (SO2), carbon monoxide (CO), carbon dioxide (CO2), volatile organic compounds (COV), black carbon (BC) and particulate matter (PM). Several studies have been carried out to develop emissions inventories applying emission factors (EF), to report the amount of total atmospheric pollutants emitted by different types of ships (container ships, tankers, for RO-RO rolling cargo, ships for petroleum derivatives and general cargo) in a given period of time and the percentage contribution of each pollutant [9,10].
Currently, several calculation methods are available for estimating emissions from ships, which are classified into two groups [7]. On the one hand, “top-down” approach, in which very specific data such as fuel consumption of ships are used as well as emission factors based on the chemical properties of the fuel. On the other hand, the methods with a “bottom-up” approach employ an Automatic Identification System (AIS) for its accuracy in obtaining data, in addition to detailed information on the different ships [11] that dock in the port, including: ship speed, ship activity (maneuvering, cruising or hoteling), route, engine workload, location [12,13,14], among others. Emission estimation is the method commonly adopted by various researchers [15,16,17,18,19] where different assumptions are used [20].
Among the results reported, several authors using EF agree that the greatest contributions, considering the different types of ships, come from the so-called container ships followed by the RO-RO [12,21,22,23]. Nevertheless, the type and amount of fuel used by ships, the activity performed (cruise, maneuvering or hoteling) and the speed of the ships are directly related to the total emissions in a port region [1,24].
Air quality monitoring is very important to protect the population health; it has been documented that the cities close to the port and the port itself, depict a greater contribution to environmental pollution [23,25,26,27,28,29,30]. For instance, ships in operation produce an estimated 1.2 to 1.6 million tons of PM10 per year and represent an important source of air pollution for coastal communities [31,32,33]. Several cities have proposed strategies to reduce the production of pollutants from port traffic [34,35,36,37].
In Mexico, the development of emission inventories and the evaluation of the impacts of port-related and good movements emission on local and regional air quality are activities that are outside the focus of environmental authorities and are poorly studied [38,39,40]. A recent study shows that the port of Veracruz is one of the ports with the highest atmospheric emissions from ships [41], so the participation and contribution of multidisciplinary groups from research institutions should be considered, Universidad Autónoma Metropolitana, Unidad Azcapotzalco (UAM-AZC), Instituto de Ciencias de la Atmósfera y Cambio Climático de la Universidad Nacional Autónoma de México (ICAyCC-UNAM) to evaluate air quality and produce a clearer trend for the short and long terms.
Therefore, the main aim of this research was the Veracruz port air quality assessment from October 2019 to December 2020, considering the emission estimations from ships during maneuvering and hoteling activities, the development of an emissions inventory and the diagnostic analysis of the area through application of meteorological measurements in order to analyze the seasonal and temporal variation of pollutants at the study site. This research begins in March 2020 when activities were reduced and even suspended in different areas around the world due to the COVID-19 pandemic period, resulting in the closure of markets. Although different studies were developed during the pandemic period, few refer to the maritime activity that was affected between the months of January and April of the same year; presenting a recovery between the months of May and June [42].

2. Materials and Methods

2.1. Study Area

Mexico is currently connected with more than 300 ports of the world through its port system. Figure 1 shows the Port of Veracruz with more than 170 foreign shipping lines.
The Integral Administration of the Veracruz Port (APIVER) area is surrounded by the metropolitan area of Veracruz City and some important tourist attractions such as the San Juan de Ulúa Fortress. Due to its strategic location the Port of Veracruz is one of the most important commercial ports in the country, with many commercial routes established to the Atlantic, and an expansion project in the North began since 2014. The operations carried out in the Port of Veracruz have been coordinated and supervised by APIVER; the associated activities with this expansion project include the construction and operation of new terminals, trebling the current infrastructure capacity of the Port Area, as well as the loading and unloading of assorted ships, storage of merchandise, ships repair, administrative services, and port management. For these activities, the Port Area is structured with the participation of assignees, service providers, carriers, customs agencies, port authorities, and different institutions that also participate.
The port has 8 docks distributed over 3.5 km in length, 71,325 m2 of covered storage, 18,707 m2 of storage yards and 116 ha of north expansion for the port development. During the realization of the study they had 18 docking positions for commercial cargo handling. Maritime traffic in the Port of Veracruz has gradually increased due to the surge in the tonnage of import and export merchandise handled in the country. During 2019, a total cargo movement of 28,273.284 tons was registered and 1861 ships were attended (tanks 362, bulk carriers 331, general cargo 264, RO-RO 297 and container carrier 627); while in 2020 a total cargo movement of 26,199.305 tons was registered for 1374 ships (tanks 282, bulk carrier 273, general cargo 181, RO-RO 159, container carrier 478), probably due to the pandemic, this was 7.3% lower than in 2019.

2.2. Estimations and Measurements

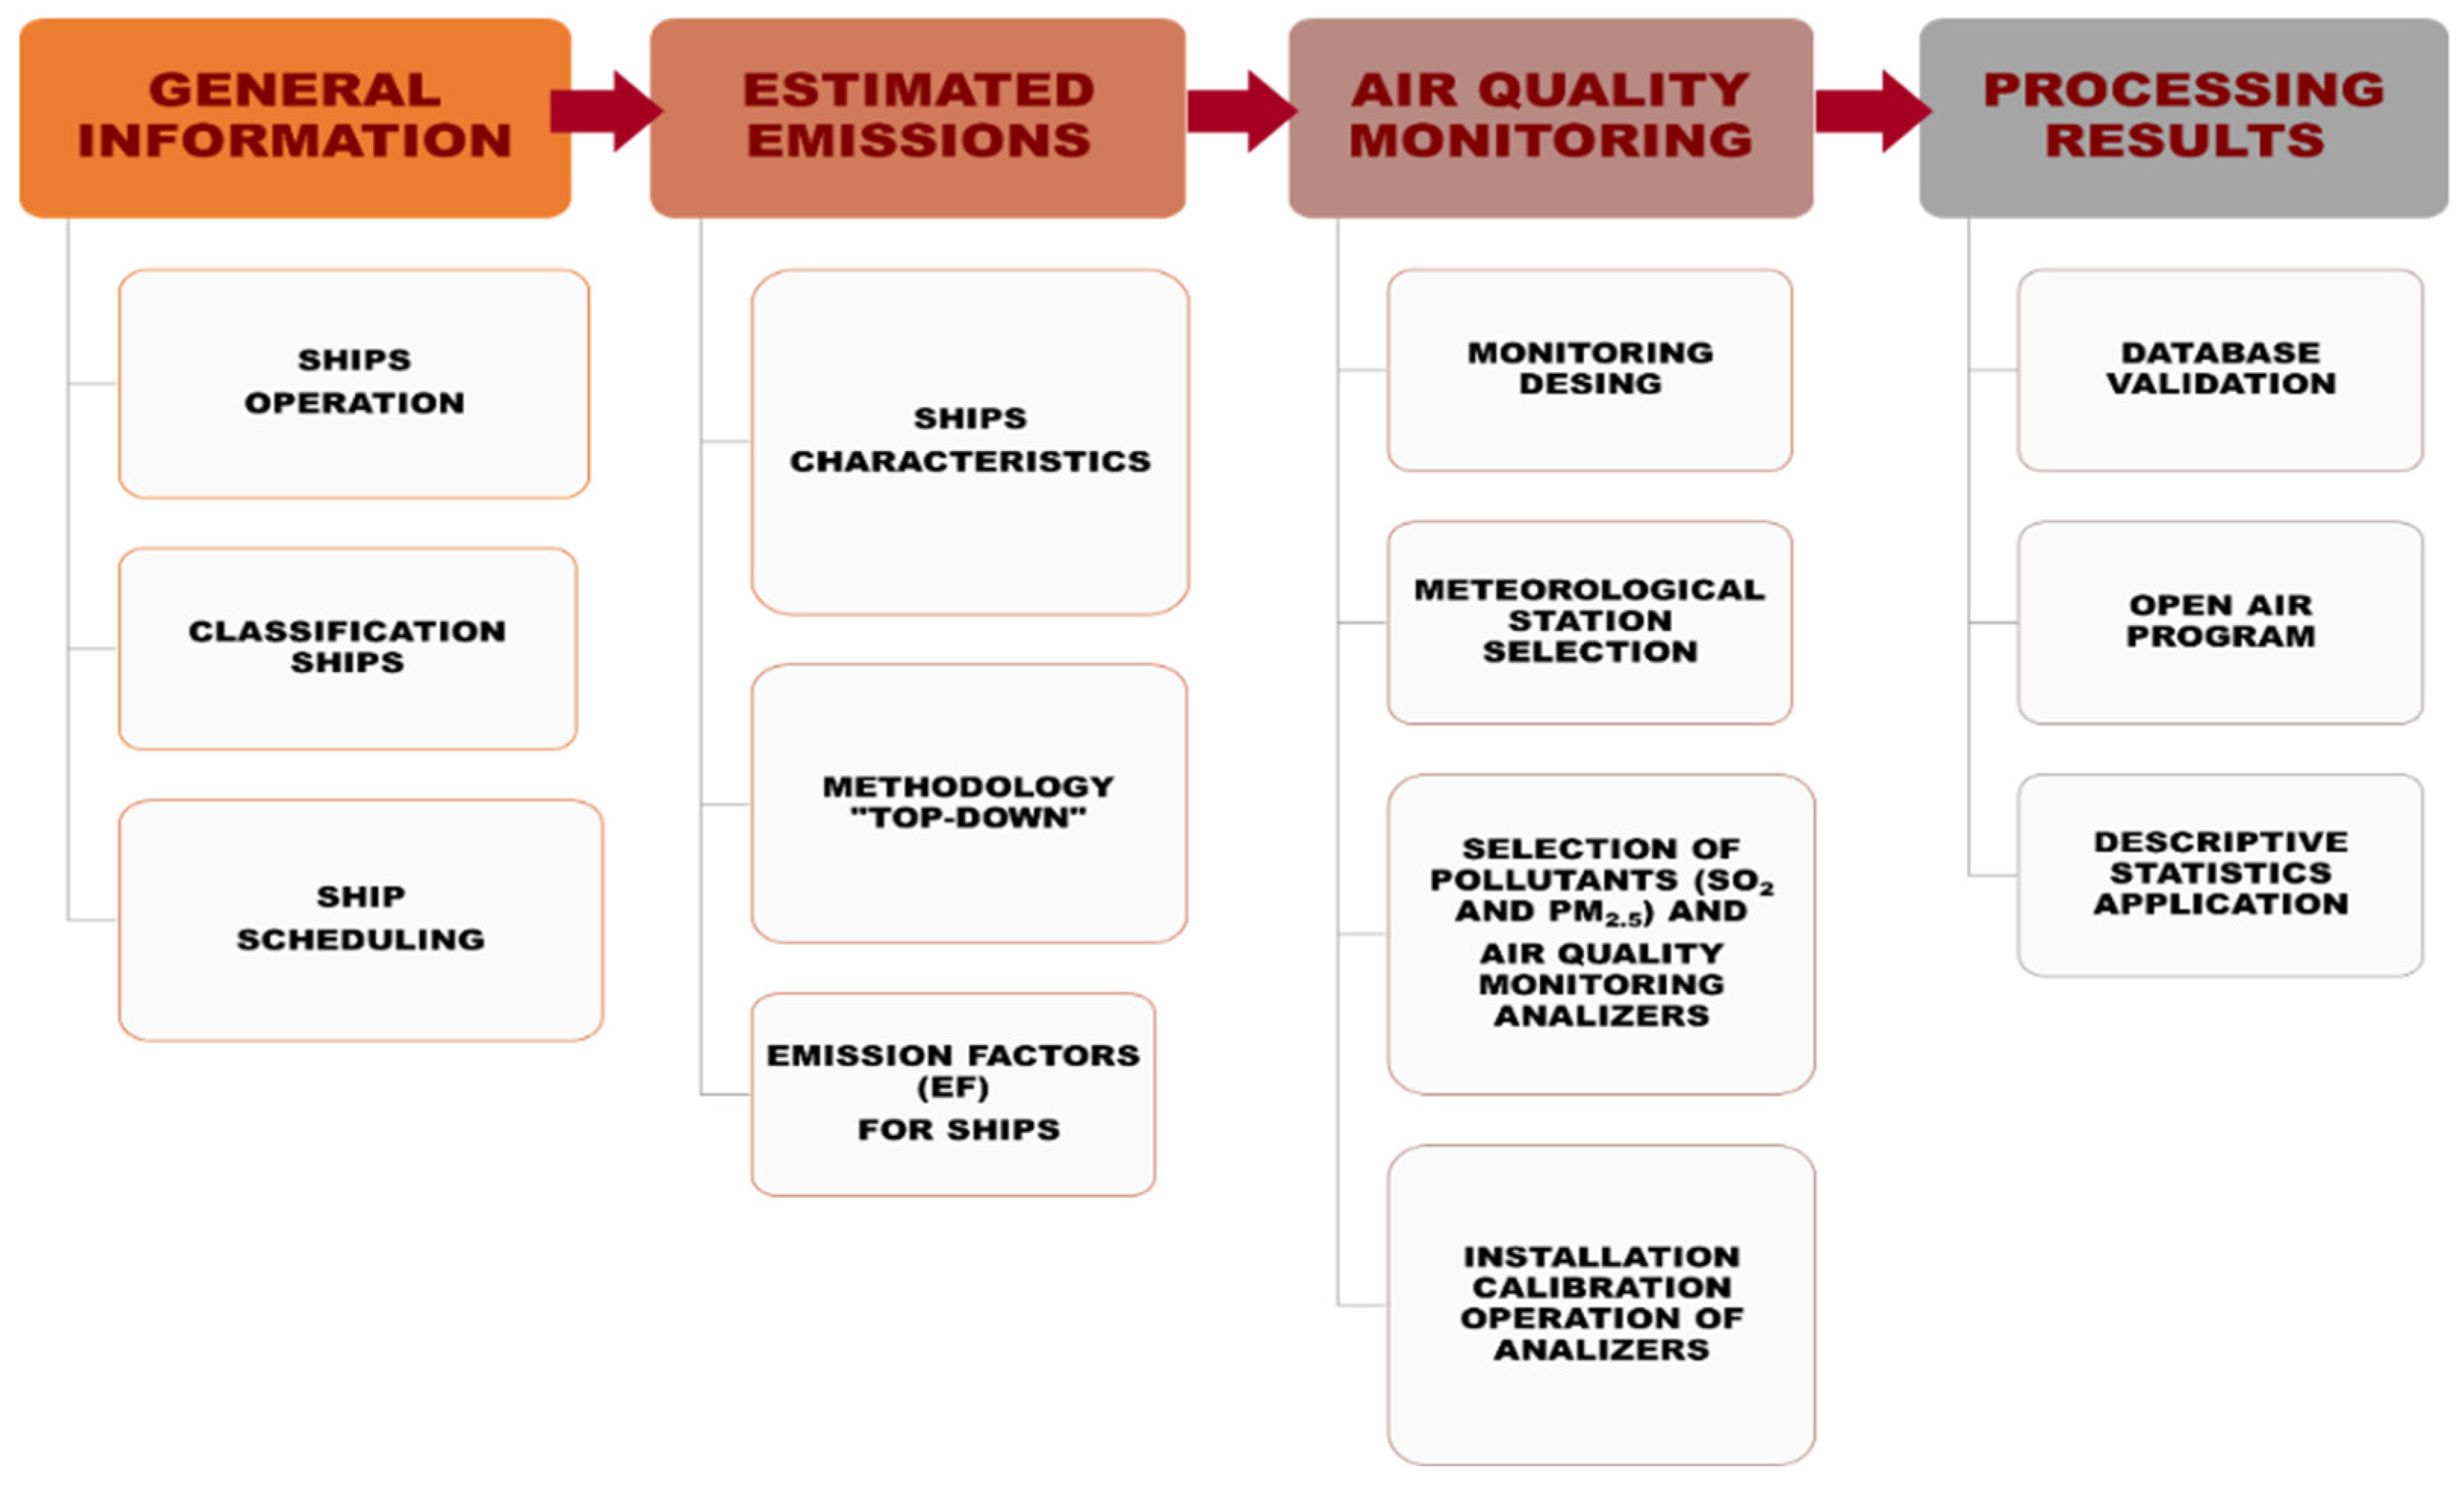
To determine the air quality impacts due to emissions to the atmosphere from ships, EF were used, as well as SO2 and PM2.5 air quality monitoring. Despite the pandemic period during 2020 due to the SARS-CoV-2 virus, the aforementioned information was collected. Figure 2 shows the flow chart of the followed methodology in this research.
The main pollutant emissions produced by the maritime sector are a consequence of fuel combustion. During the development of the emission inventory, the two phases of operations carried out by a ship were considered: maneuver, that is the distance travelled by a ship between the breakwater of the port and the pier assigned to docking and hoteling, that is the stage where the ship remains at the dock for cargo loading and unloading activities and fuel supply, among others.

2.2.1. Estimated Emissions

Traffic of ships in the maneuver and hoteling phase were considered and they were classified according to the type of cargo as shown Appendix A. To know the type of engine used, information was required for each type of ship. Usually the main engine (ME) that is responsible for ship propulsion, remains turned off within the port, but it is used for loading and unloading maneuvers; the auxiliary engine (AE) generates the electrical energy to operate the lighting, ventilation, heating, information systems, computer systems and the possible pumps or cranes incorporated in the ship. The procedure used by Guevara [18], was applied (see Appendix B).

2.2.2. Air Quality and Meteorology Monitoring

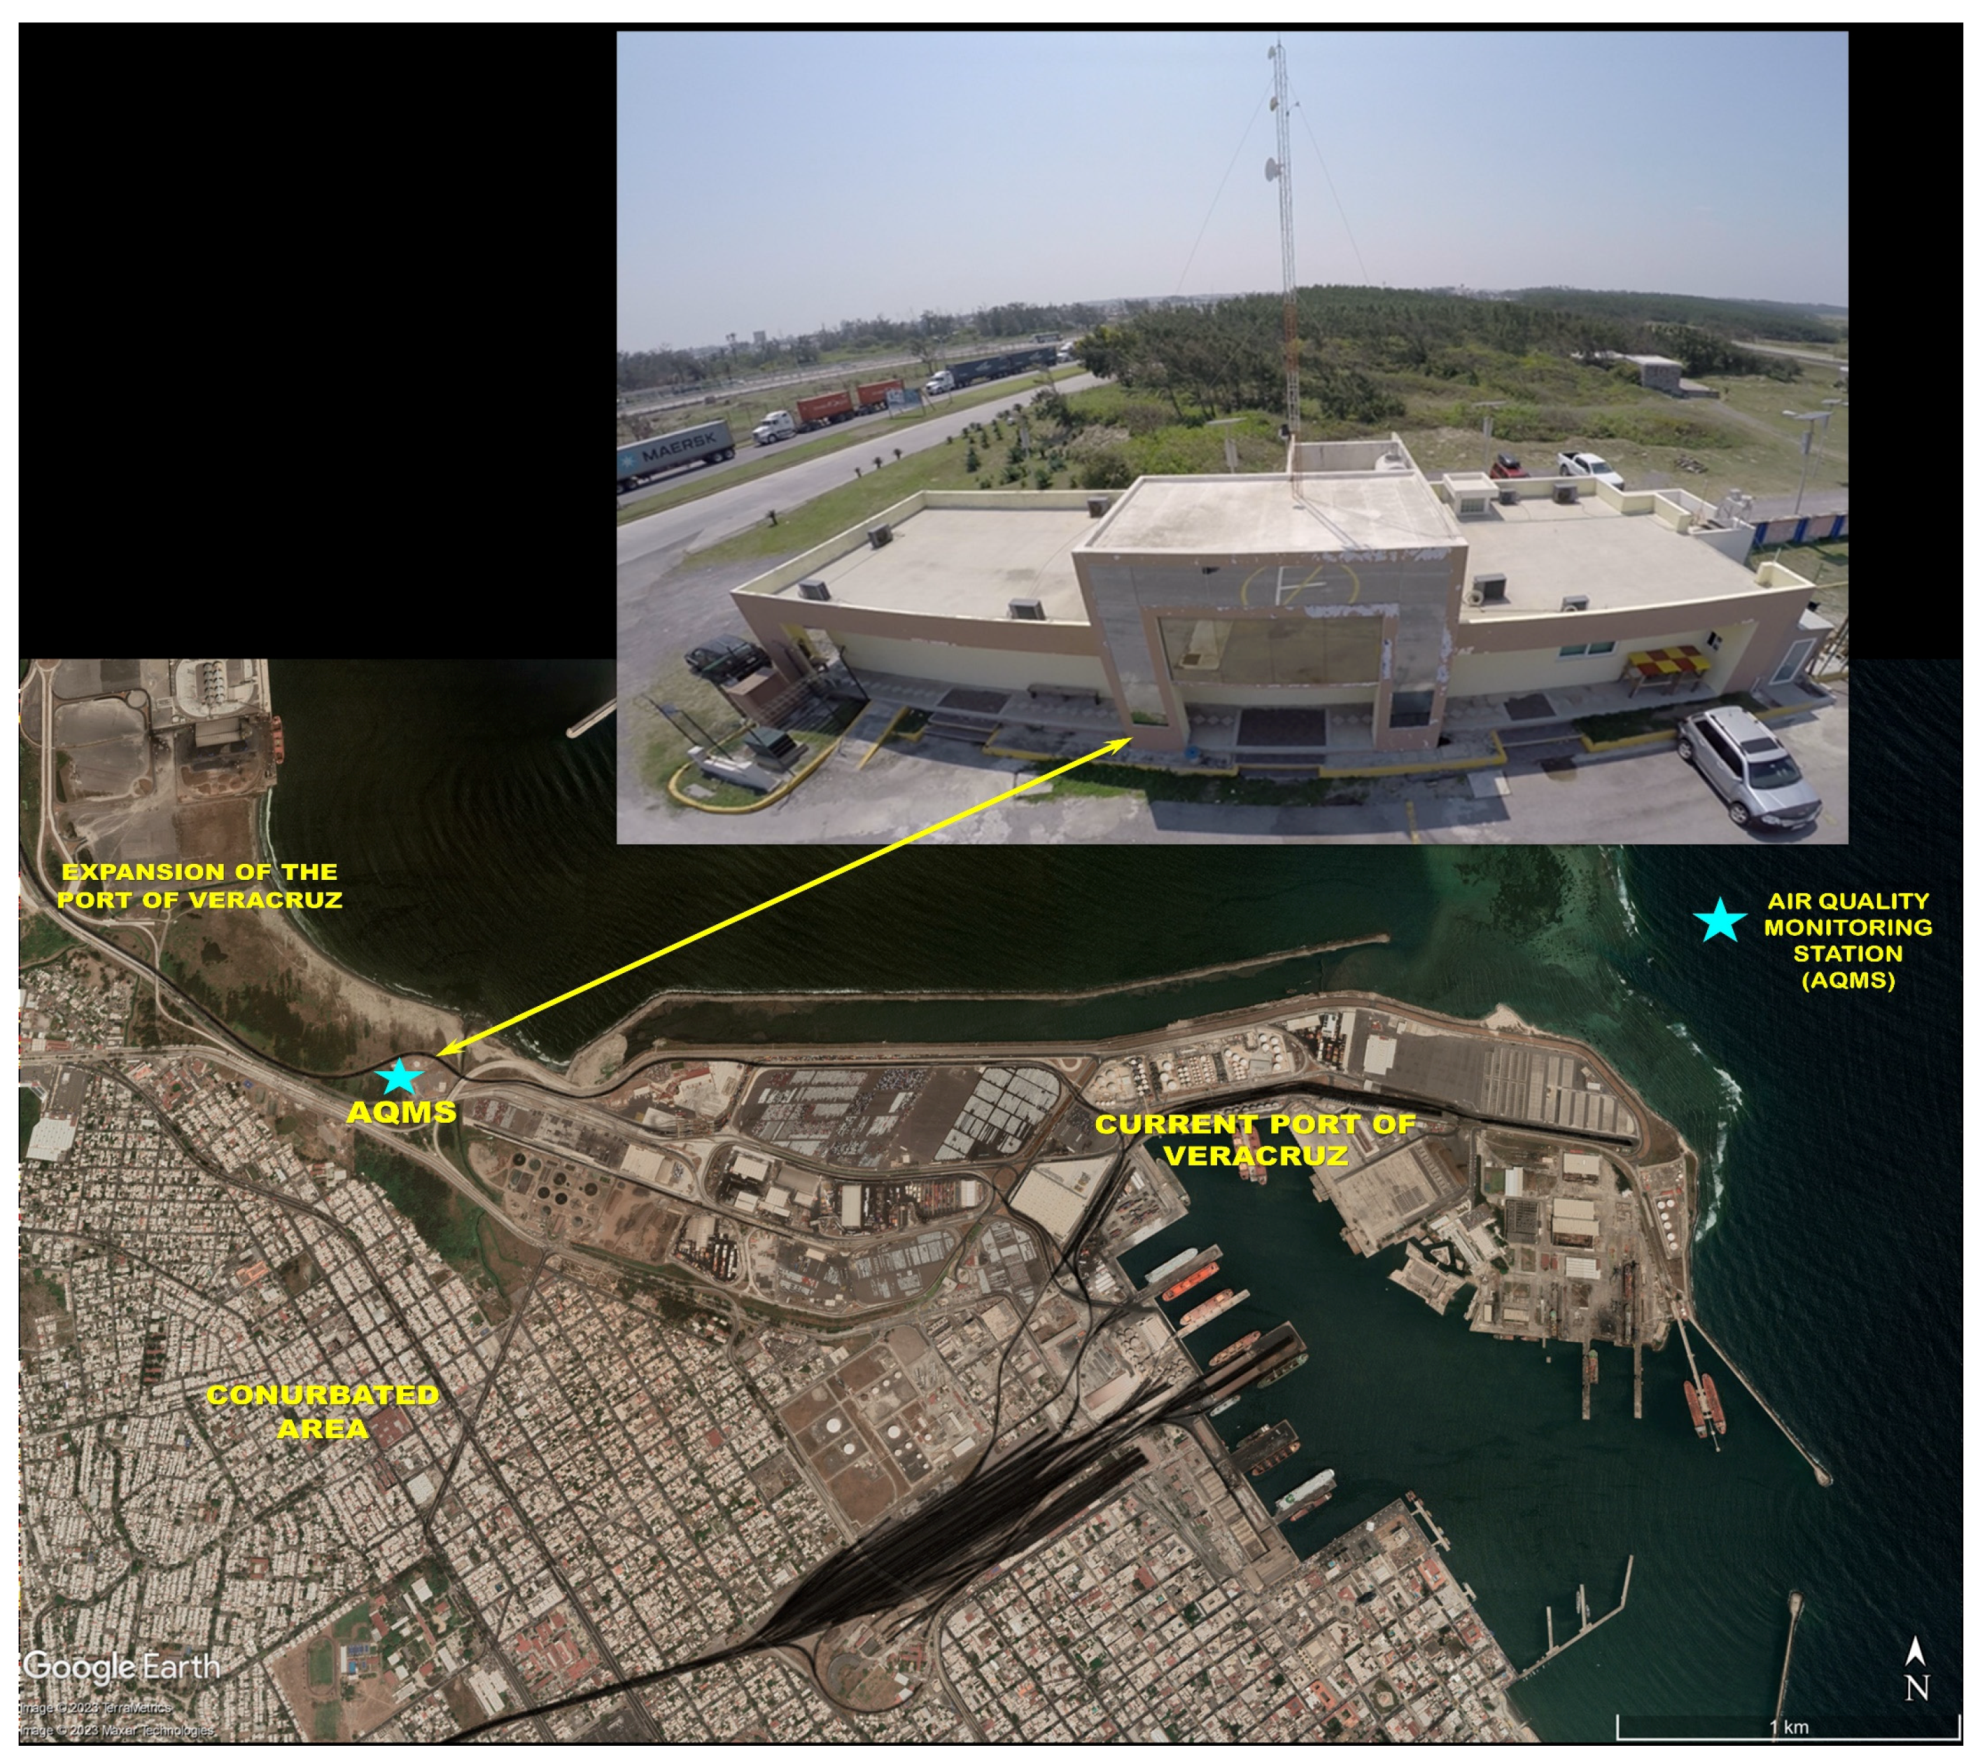
An Air Quality Monitoring Station (AQMS) was deployed within the APIVER facilities at the southwest of the expansion area and 2.5 km away from the current port area at the northwest (Figure 3). Hourly concentrations of SO2 and particles with a diameter less than 2.5 µm (PM2.5) were measured during 15 consecutive months covering October 2019 to December 2020. Sulfur dioxide measurements were conducted using a continuous ultraviolet (UV) fluorescence analyzer model T100 (Teledyne-API). The SO2 analyzer response was verified weekly with reference gas and zero air, calibrations were conducted bimonthly. The PM2.5 was determined by mean of a BAM-1020 (Met-One) monitor, which was verified quarterly using calibrated flowmeter.
Meteorological measurements were done using a wireless transmitter Davis Vantage Pro2 (Davis Instruments), 10-min averages were collected with the Weather Link software. Wind sensors were located 10 m above the roof level. The 10-min averages were processed for calculating hourly averages for periods with ≥75% of valid data. Pollutants data were validated using the results of the periodical verifications calibrations, extreme values were verified against ancillary data.

3. Results and Discussion

3.1. Estimated Emissions from Ships

The estimated pollutants were (kg/month): NOx, CO, NMHC, SO2, TPS, PM10, PM2.5, CO2 and CH4, results are shown in Table 1 for the years 2019 and 2020. The 2019 pollutant emissions exhibited higher values than those of 2020. The CO2 emission from port activities were 31,177 kg/year and 29,003 kg/year for 2019 and 2020, respectively. Methane was the pollutant with the lowest estimated emission with 0.294 kg/year and 0.273 kg/year for 2019 and 2020, respectively (Appendix C, Table A2 and Table A3).
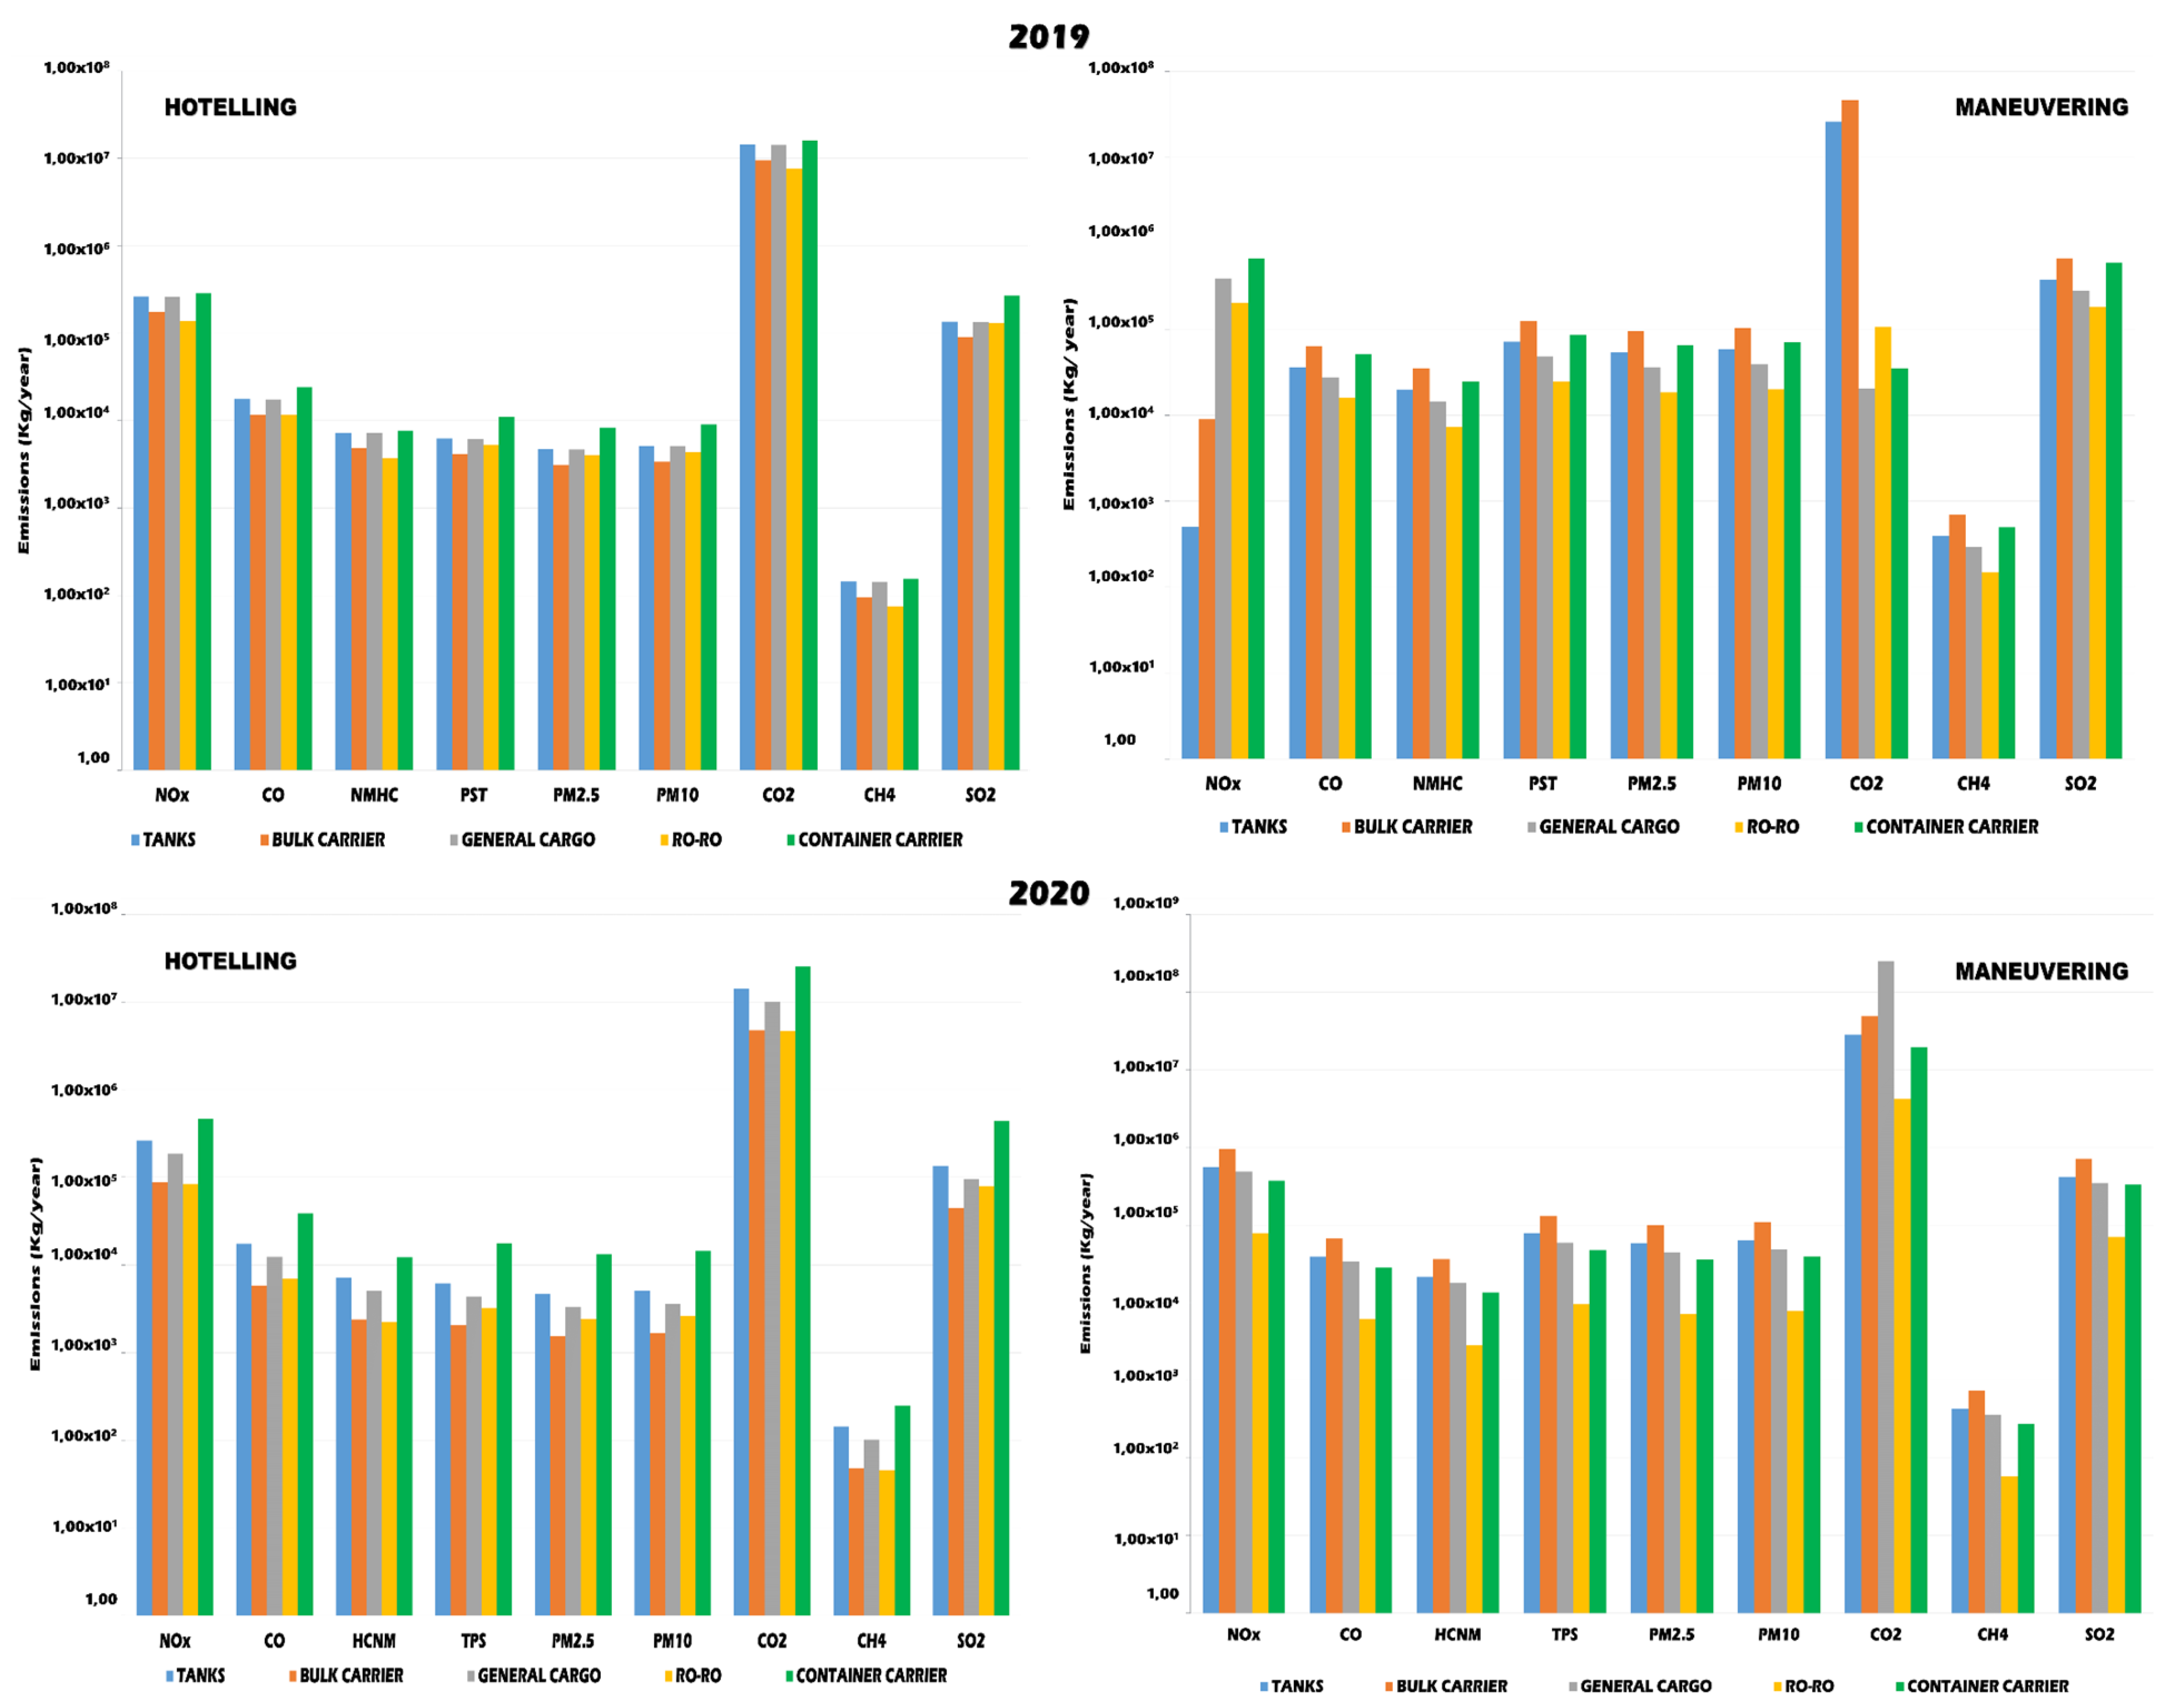
Figure 4 presents the log-graph for estimated emissions in the maneuvering and hoteling stage during 2019 and 2020, in addition to the contributions by type of ships. The highest values were obtained for bulk carriers in the maneuvering stage, followed by container ships in 2019; while in 2020 there was an increase in estimated emissions in both stages specifically for bulk carriers followed by tanker ships. The increase recorded in estimated emissions was related to port activity since the number of ships in APIVER during 2020 increased to resume commercial activities that had been suspended due to the pandemic.
Regarding the hoteling activity during the study period, container ships had the highest values in the estimated emissions followed by tankers. Estimates for PM10 and PM2.5 should also be highlighted for their effects on air quality and human health [43,44,45] since it has been observed that on some occasions, they present high estimated emissions attributed to the activities of loading and unloading, mainly in bulk carriers or during the so called “Nortes” time since wind speeds increase and resuspension of soil particles can occur.
Considering the total emissions obtained in 2019 during the hoteling stage, CO2 displayed the highest values of the estimates, followed by NOx and SO2. While the minimum values corresponded to CH4 for container ships, tankers, and general cargo. On the other hand, in the maneuvering stage the highest emissions maintained the trend for CO2, NOX and SO2 coming from bulk carriers followed by container ships and tankers. In 2020 during the hoteling stage, container ships depicted the highest results, followed by tankers and general cargo vessels; the order of pollutants remains as in 2019 (CO2, NOX and SO2) for bulk carriers, tankers and general cargo vessels. The calculation of ship emission estimates is related to the phase in which the fuel is consumed: hoteling or maneuver, among other specific aspects.
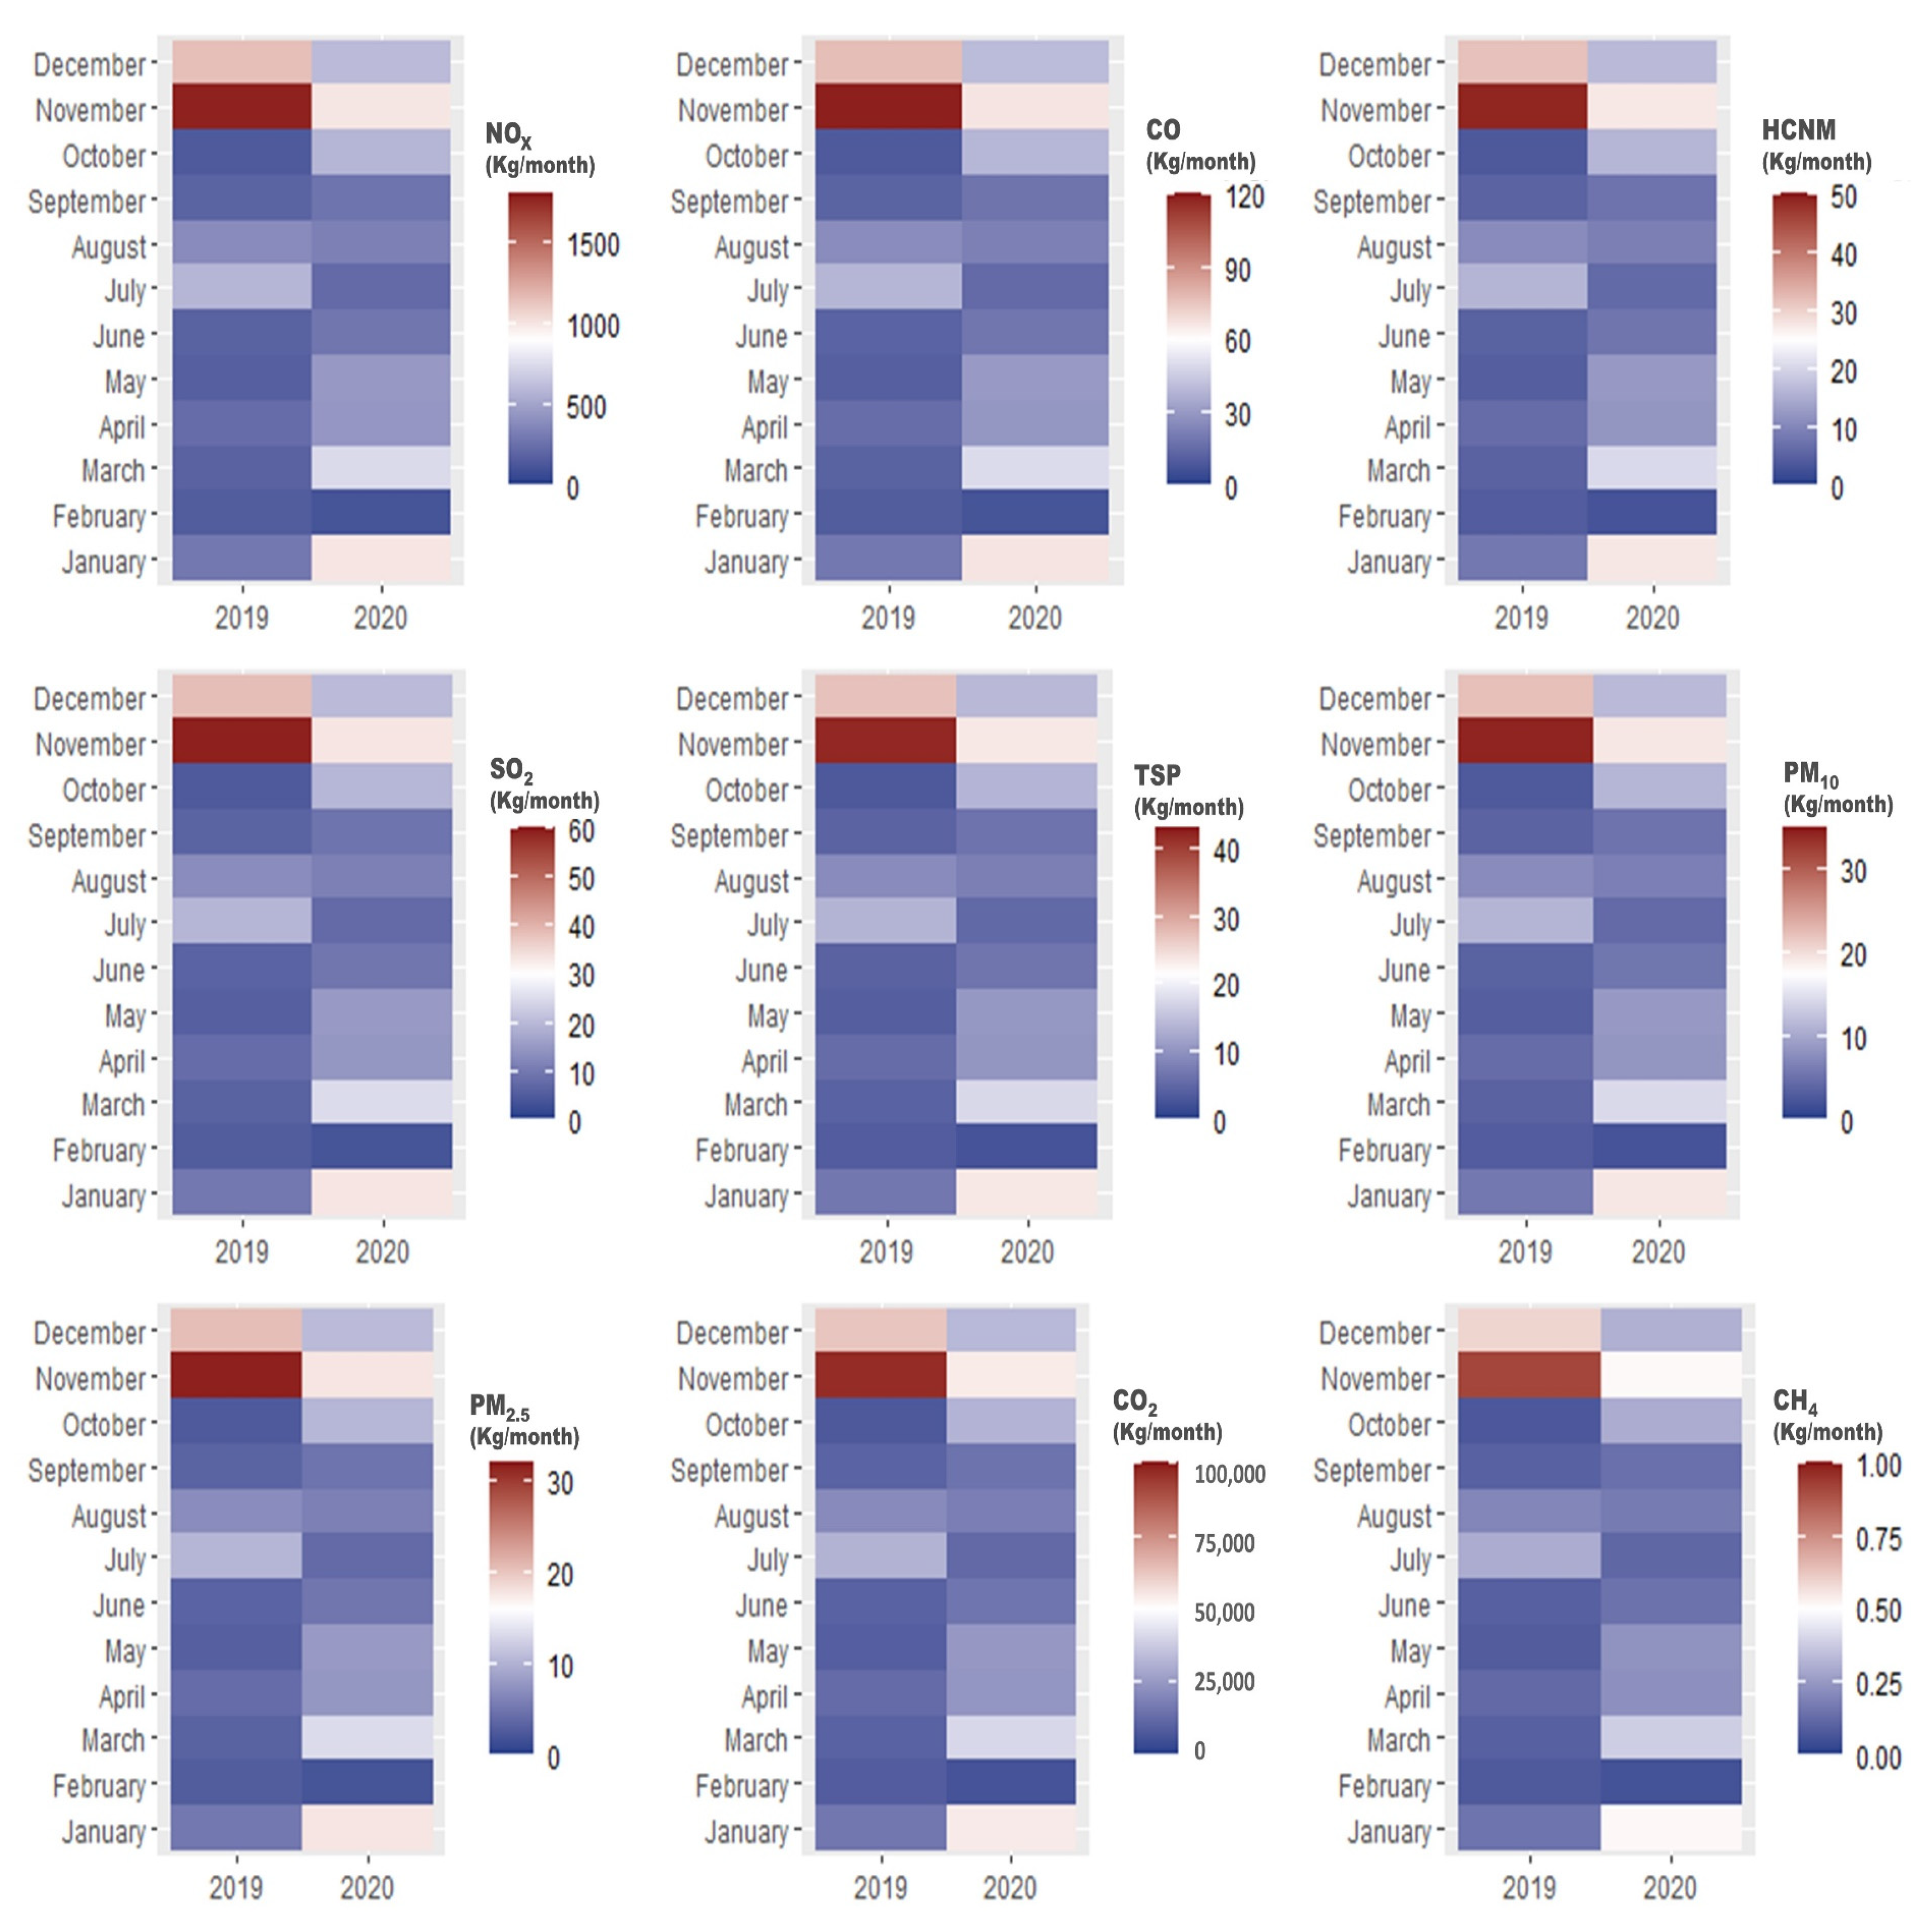
Graphs of total emissions from docked ships show that November and December 2019 had the highest emissions of all pollutants and the same trend is presented for 2020 (Figure 5). Estimates by type of ships with oil-derived cargoes (tankers) showed the highest pollutant emissions in 2019, specifically for the months of January, June and October, for 2020 in the months of April, October and December.
As for container ships, bulk carriers had the highest pollutant emissions during the months of July, August and October 2020. For RO-RO ships, the highest emissions of NOx, CO, NMHC, CO2, PM10, PM2.5 and CH4 were estimated in June, while those of SO2 were estimated in January and November (Appendix C, Table A2 and Table A3).
Emission comparisons between 2019 and 2020 showed statistically significant differences (p < 0.05) for all pollutants (Table 1). Comparing the results of the estimates by yearly seasons, Table 2 presents the results as a function of medians and are compared with the Mann–Whitney U test; the pairs of variables in which significant differences were found (p < 0.05) are marked (*). During 2019, NOx and CO2 showed higher estimated emissions than the other pollutants in all seasons, especially in the autumn. Comparing by seasons, statistically significant differences were found for CO (p = 0.039) TPS (p = 0.031 kg/year), PM10 (p = 0.031 kg/year) and PM2.5 (p = 2.5 kg/year), between summer and autumn in 2019 (Table 3).
In 2020, NOx and CO2 presented also higher emissions than the other pollutants in all seasons, and the highest were during the autumn. Statistically significant differences were found for all pollutants, between the spring and autumn, however, SO2 (p = 0.028) was found between spring and winter (Table 3) the data are presented as a function of medians accompanied by quartiles 1 and 3 (Q1–Q3).

3.2. Meteorology

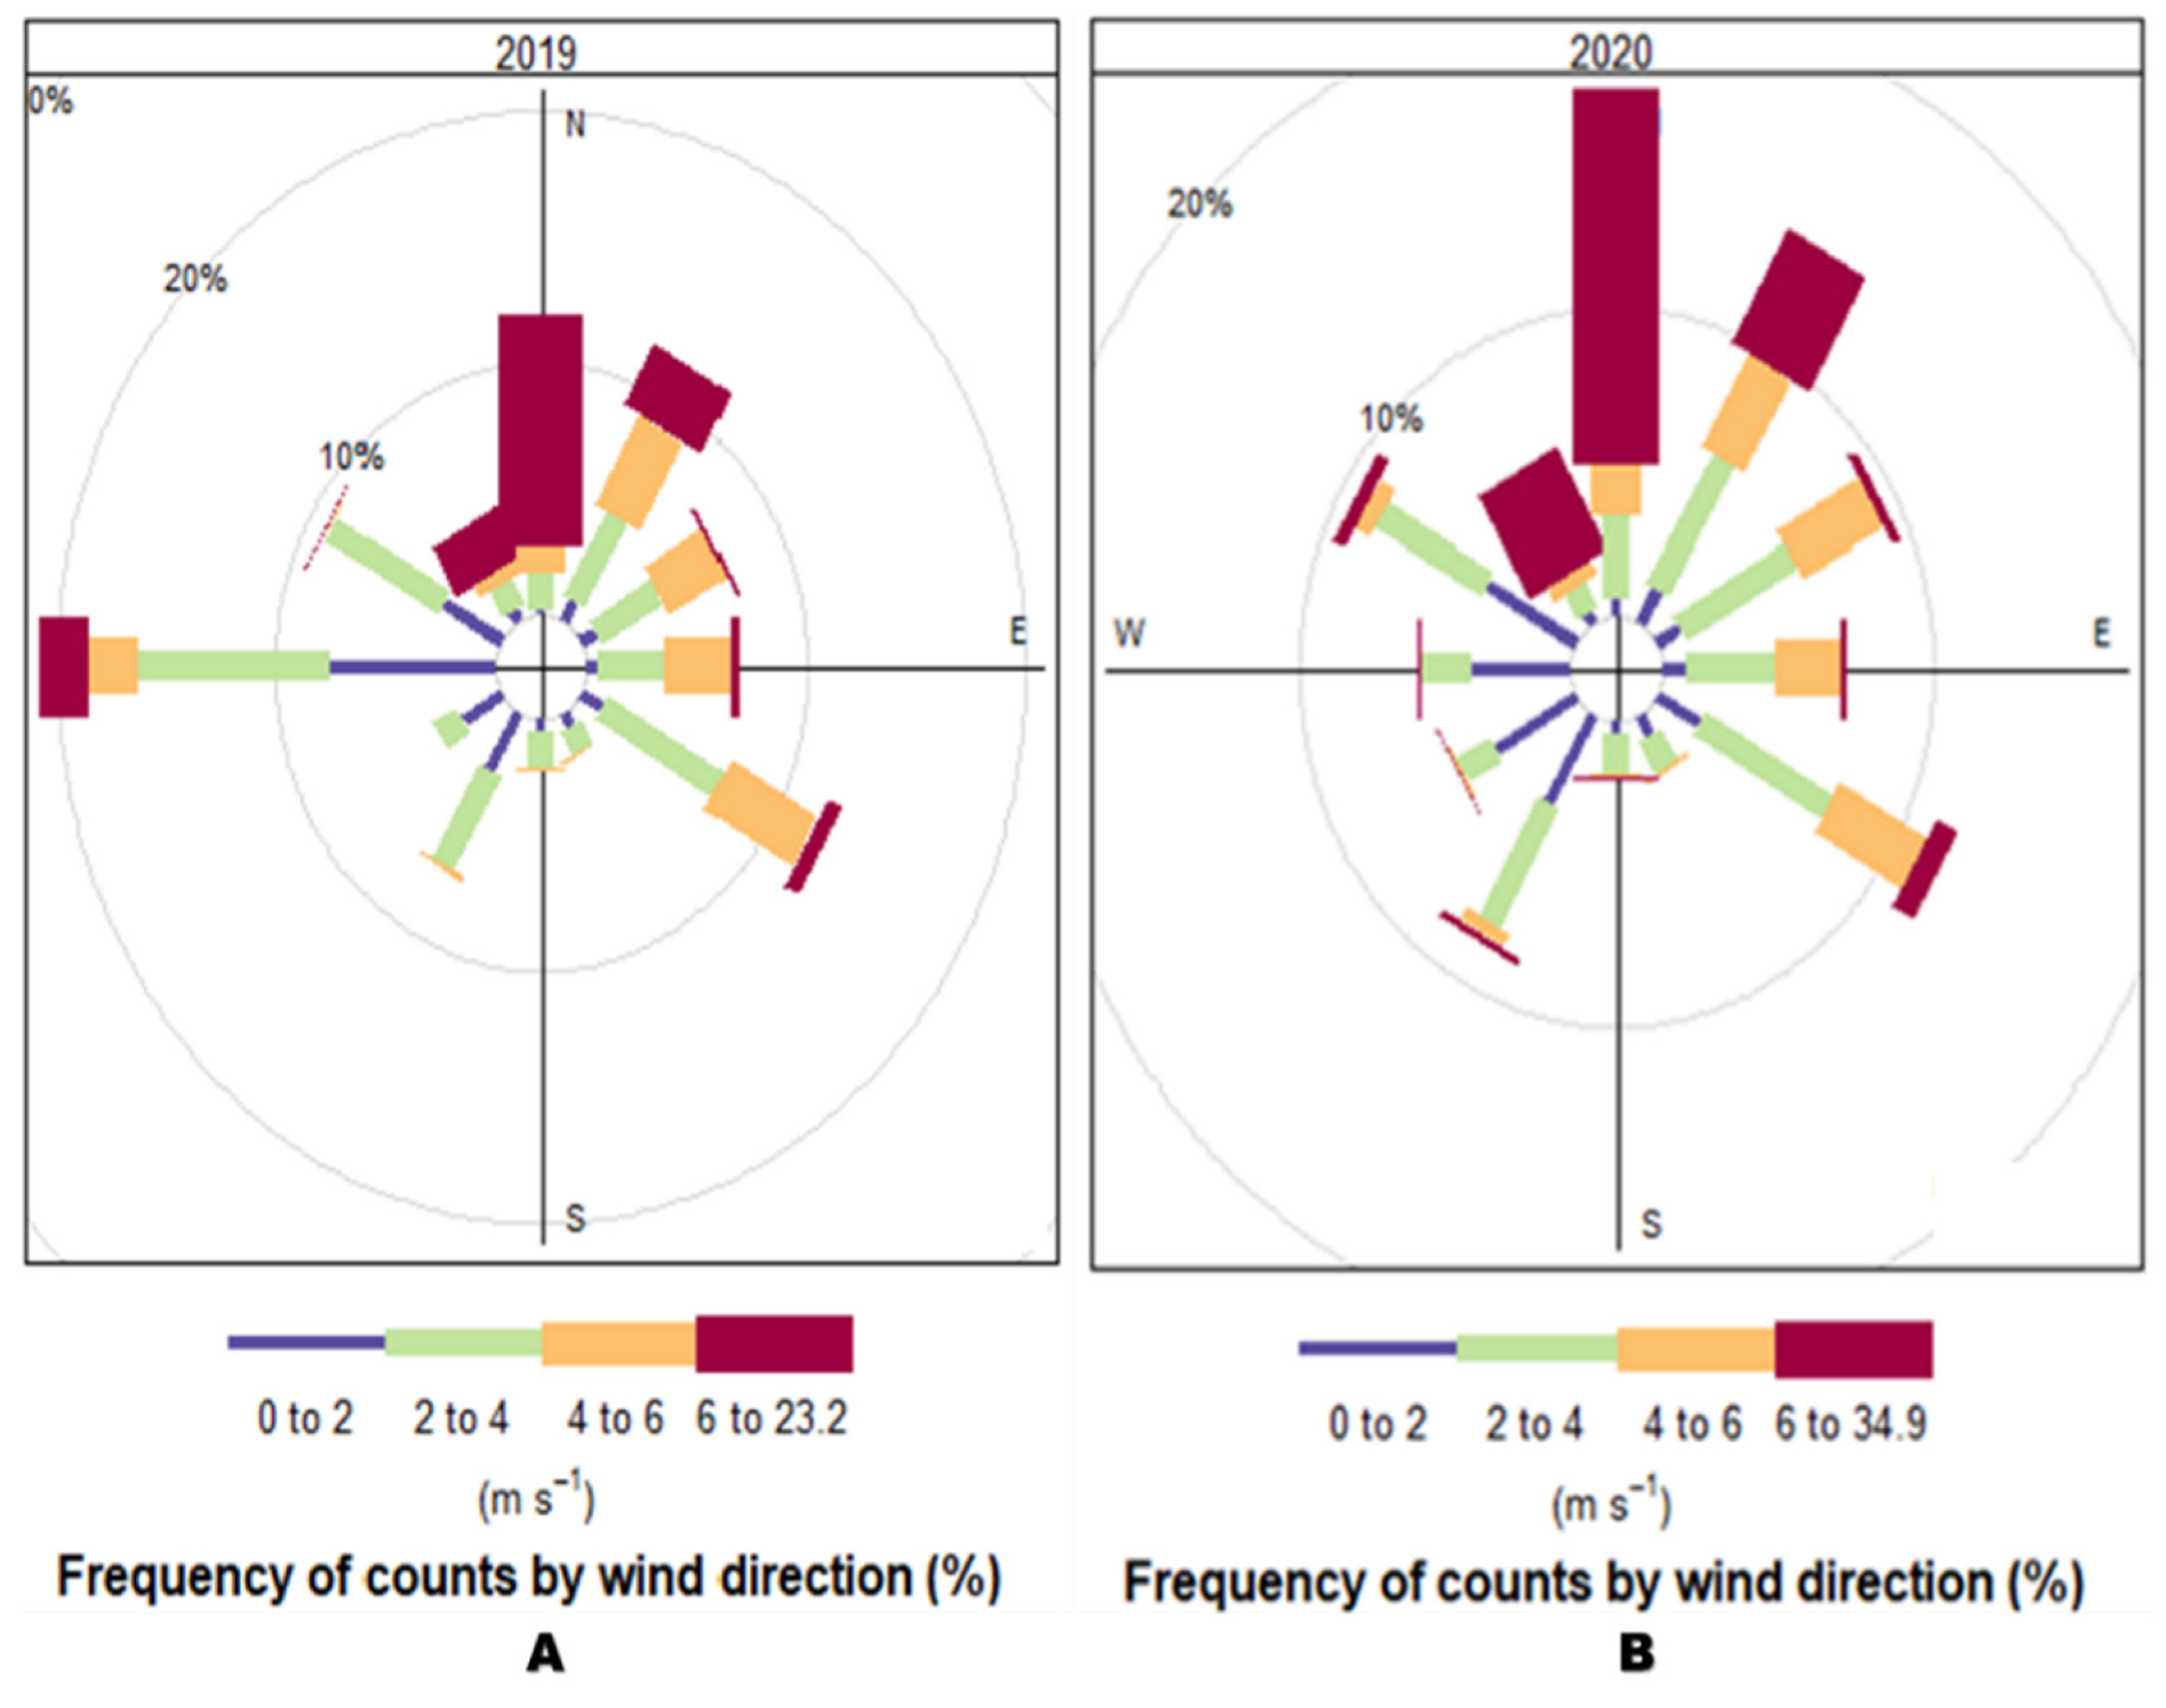
Northern wind flows dominated during winter, while eastern during summer (Figure 6) As observed in the wind rose, the distribution of velocity predominates by northwestern winds with an occurrence of 10% at a speed ranging between 4 to 39.4 m s−1 and North (~20% occurrence) with a speed that predominates from 6 to 34.9 m s−1. Among the winds registered from the northwest to the southeast, the speeds oscillated between 4–6 and 6–34.9 m s−1 (orange and cherry) in 2020. For 2019, winds with higher speeds predominated in the east direction (20% frequency of occurrence), north (<10% frequency of occurrence) with a speed of between 4–6 and 6–34.9 m s−1.
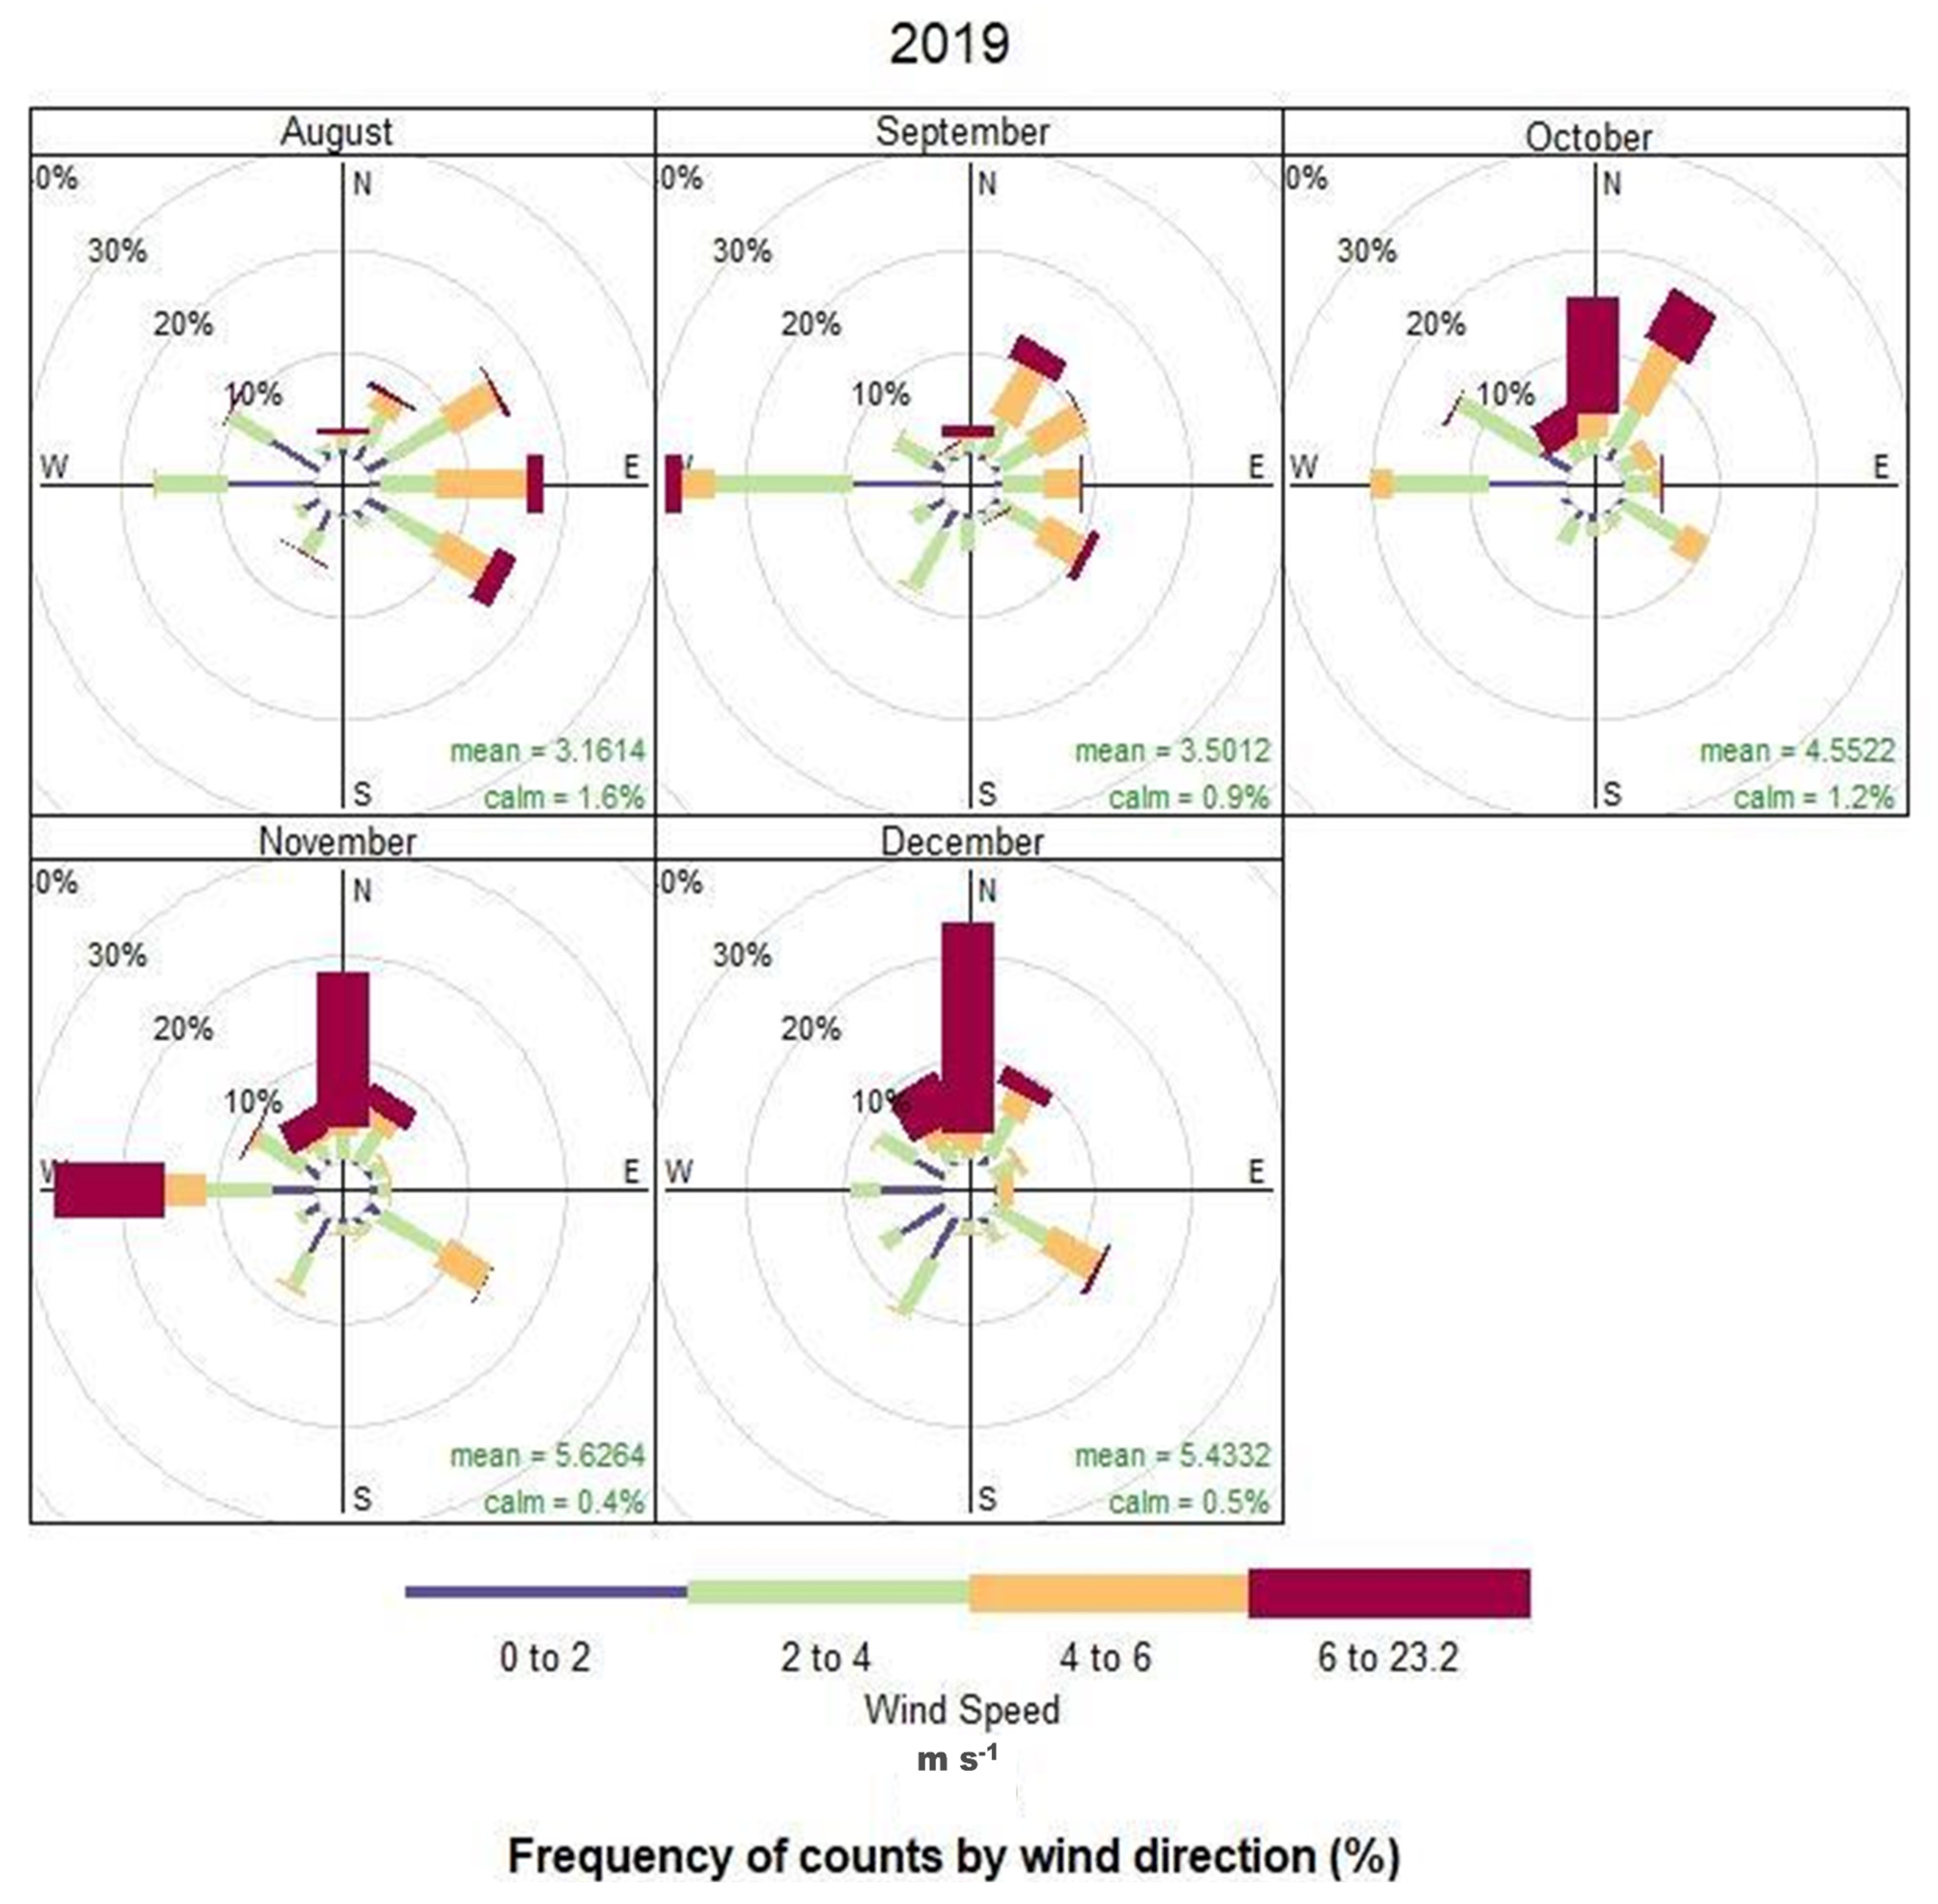
Appendix D, (Figure A1 Wind roses for August–December 2019) shows that for 2019 from October to December, the northwest winds showed a higher speed of up to 40 m s−1 with an occurrence of 10 to 30%. In 2020 (Appendix D, Figure A2) between January–June and September–October, the northwest winds of 6 to 34.9 m s−1 predominated with an occurrence of 10–20%, whereas from July to September the winds decrease with a velocity of 4 to 6 m s−1 with a maximum occurrence of 10%.

3.3. Air Quality

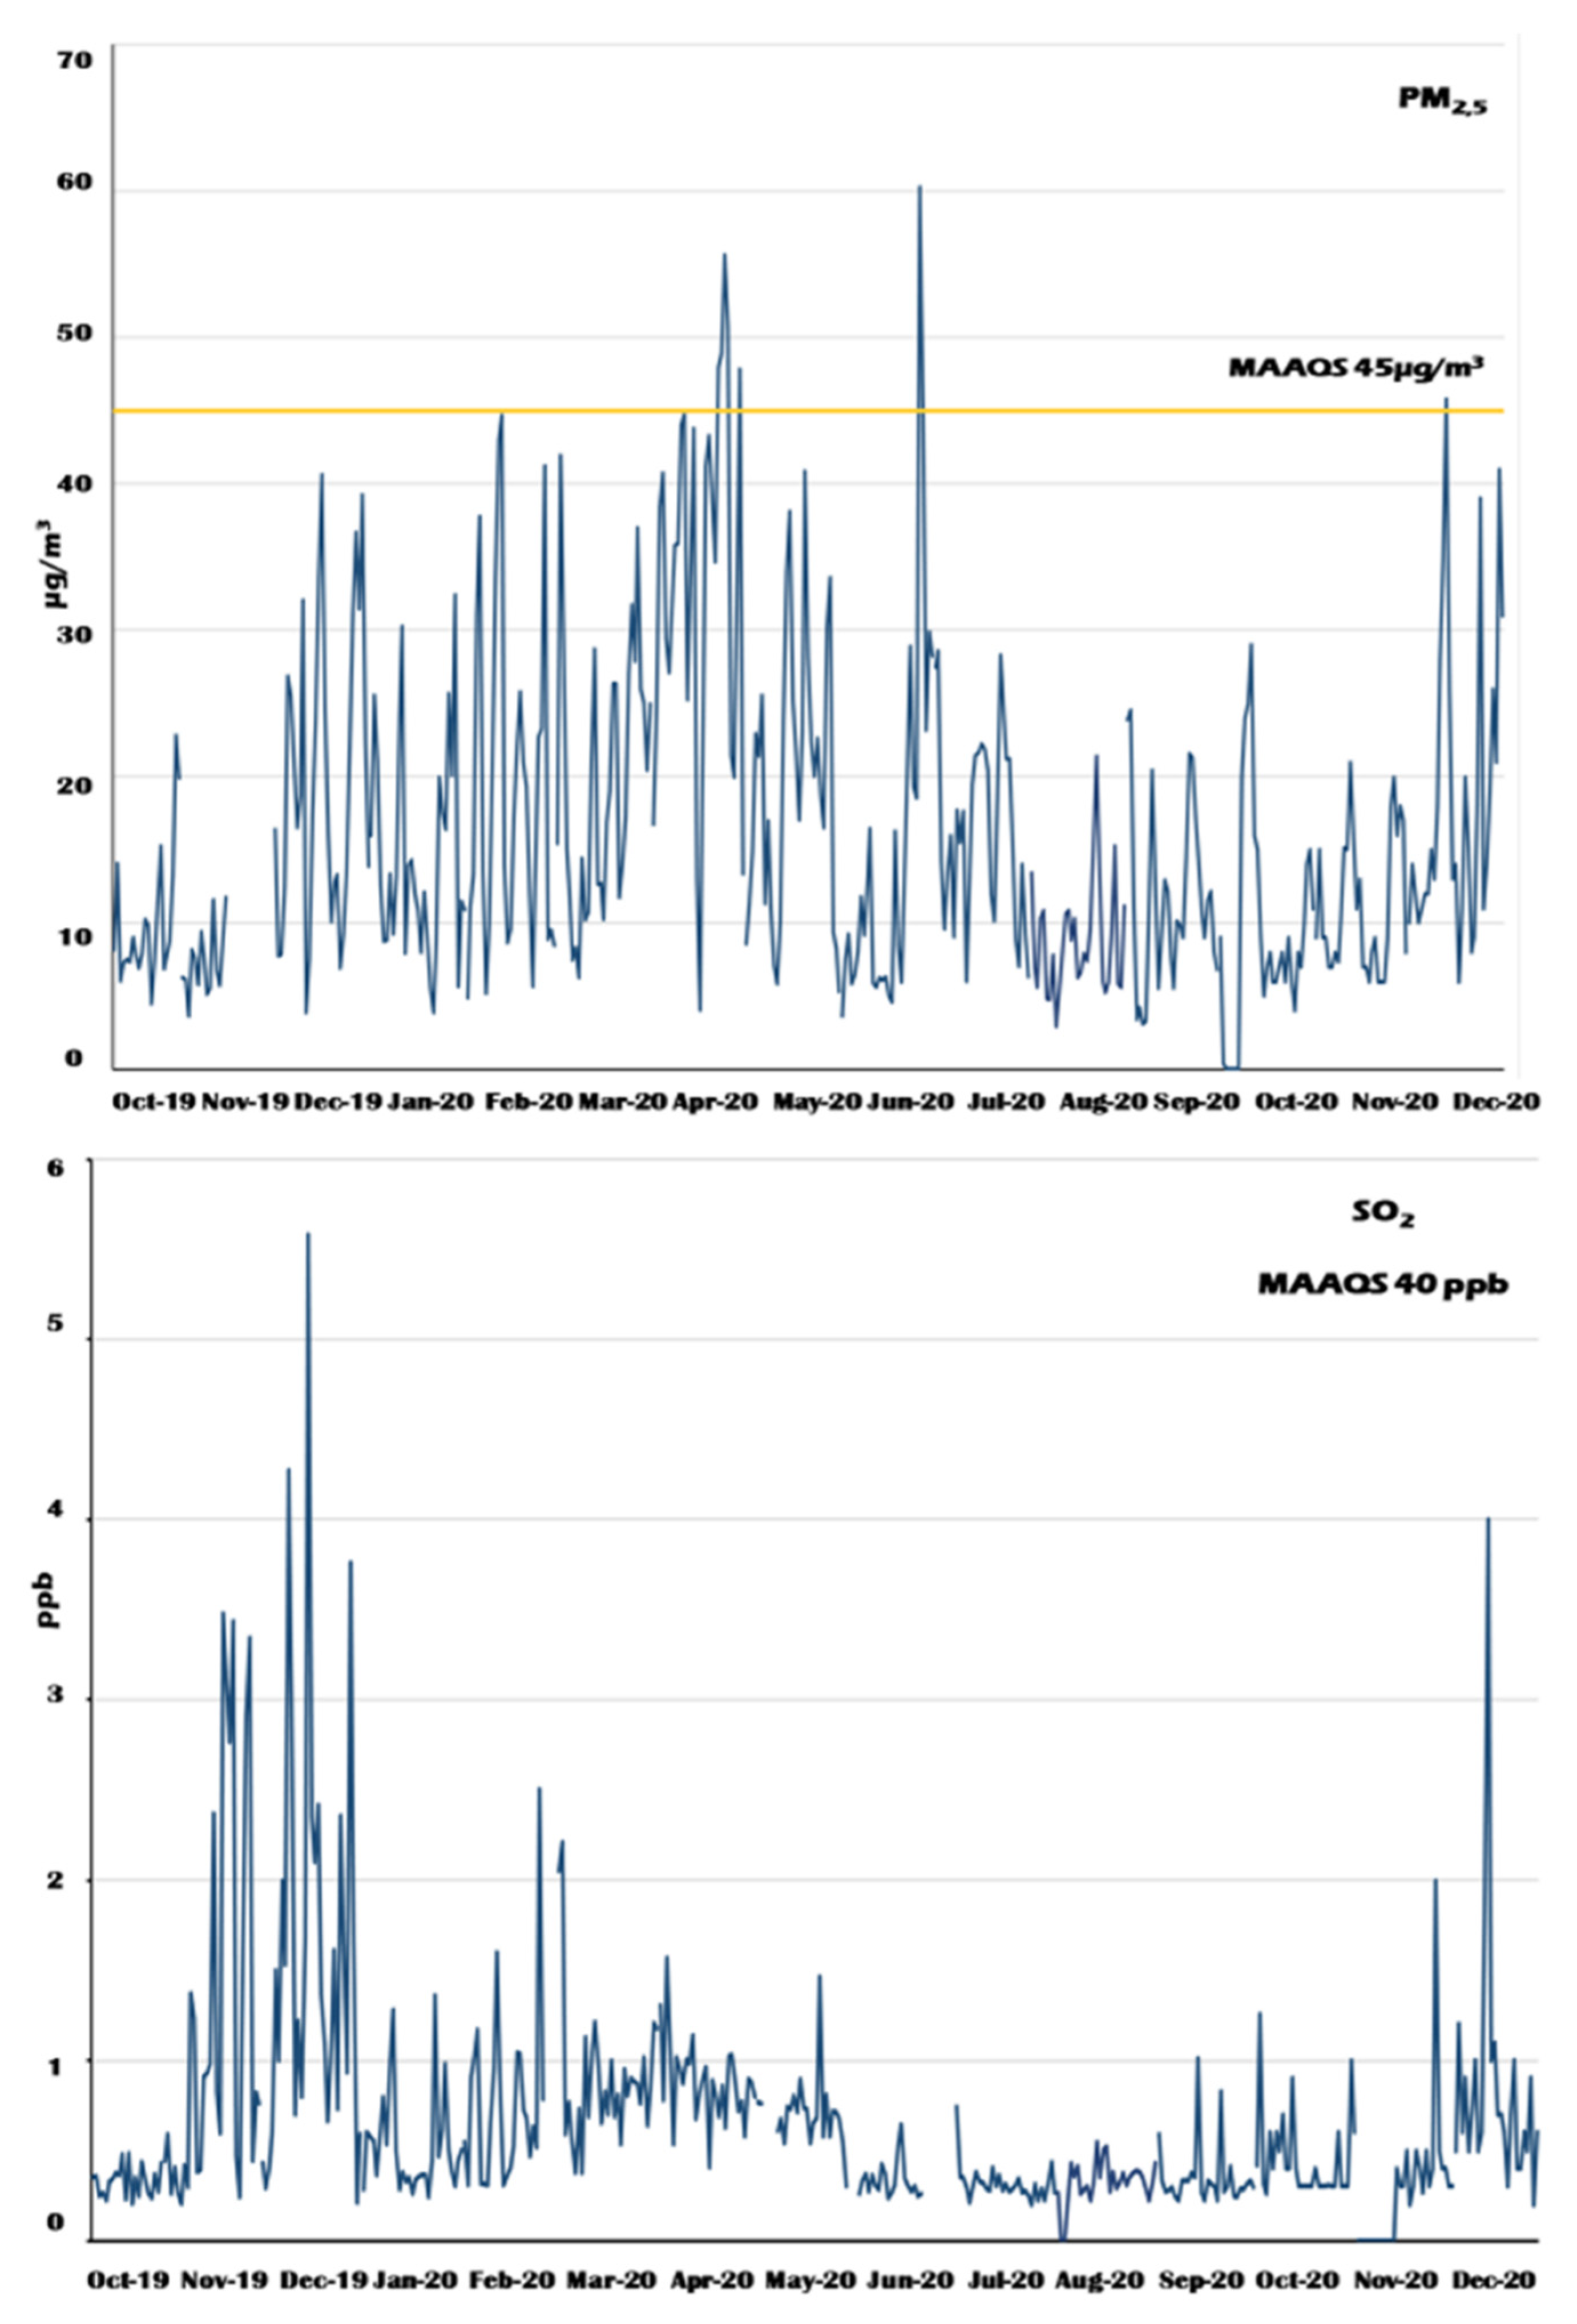
The pollutant concentrations are presented in time series based on 24-h daily averages (Figure 7). PM2.5 concentrations in the study period were highest in January, April, June and December, exceeding several times the Mexican Standard for Ambient Air Quality (MAAQS 45 µg m−3) considering 24-h averages. For SO2, the highest concentrations occurred in November and December in 2019 and 2020, although the averages obtained in 24 h were much smaller than the environmental regulation (MAAQS 40 ppb).
The recorded meteorological conditions are characterized by a marked period of transition between seasons. During winter the “Nortes” recurrently occur, being a coastal zone these events that last between 2 and 6 days are presented; it is characteristic that they occur in the autumn and winter months (October to March); which are related to cold air masses that decrease the temperature as well as intense winds [46] and the dispersion of pollutants in Veracruz; on the contrary, in spring the frequency of wind speeds (less than 1 m s−1) inhibit the dispersion of pollutants and during the rainy season in summer, the dominant wind direction is from the east.
The reports generated at the weather station are characteristic of a coastal region, since most often the wind direction during the evening blow with components from east and south, while, during the early morning and at night, the winds bear east and north components in the months of January to April 2020.
Table 4 presents the results of the basic statistics of hourly pollutants averages. The high concentration values can be attributed to the transport of pollutants from areas where fossil fuel combustion processes are carried out, since the monitoring station was installed wind-tight to the southeast of the area of port expansion and northeast of the current port.
Considering the results of the wind roses for the study period, in general, ventilation was better during the winter months (December–February) than in the spring months when the dispersion of pollutant emissions could be considered poor.
The SO2 concentrations decreased from May to October, since the rainy season occurs in Veracruz during these months, which benefits air quality. Winter begins in November and lasts until February, an increase in wind speeds is typical of the region, favoring the presence of climatic events called “Norte”, implying that the main component of the wind comes from that direction.
Considering the wind direction during the winter season in the study region, with north and northwest components, where the new port was built, the concentrations of SO2 and PM2.5 increased, coincident with the main sources being located in this area; for instance, since July 2019, the concessionaire ICAVE, dedicated to the transport and storage of containers, began its activities, thereby increasing the number of ships docked in the so-called “North Bay”.
PM2.5 measurements exceeded the annual MAAQS (12 µg m−3) and 24-h periods (45 µg m−3) in March, June and December; the first two months correspond to period where “calm” prevails, causing little dispersion of pollutants. December corresponds to winter in which wind speeds are increased by frequent weather events stated above, that cause resuspension of materials. This confirms the direct correlation among port activity, air quality and seasonal weather occurring in the port of Veracruz. The simultaneous increase of SO2 and PM2.5 is attributed to combustion processes that can be taking place, some of which came from ships in the hoteling stage. To improve the air quality management, it may well be considered the increase of monitoring sites, including the urban area, and modelling the air quality, since the air quality monitoring station is located inside the port area (Figure 3) where the operation and expansion of the port area is carried out.
From the pollution roses prepared from the meteorological information, a seasonal variability can be established during the year, which could directly modify the behavior of the pollutants, their dispersion and the possible areas of impact. According to the graph (Figure 8A), an important contribution to PM2.5 concentrations can be observed from the north in winter, where the construction area of the new port is located. During 2019, PM2.5 concentrations values in autumn were between 5 and 25 µg m−3 with a frequency of ~30% in a western direction, while for winter, the concentration between 25 and 72 µg m−3 occurred in the northern and southwest directions with a frequency of ~30% and 15%, respectively.
In autumn, SO2 concentrations ranged from 1 to 3 ppb in the eastern direction with a frequency greater than 10% and in the western direction with a frequency of approximately 30%. In winter the concentration of pollutants is present in the north (30%), east-south (~10%) and southwest with a frequency of 10% and with intervals between 1 and 5 ppb with a maximum concentration of between 6 and 18.5 ppb (Figure 8B). According to this Figure 8A, the highest PM2.5 emissions come from the expansion area of the port of Veracruz and part of the urban area during the autumn and winter of 2019.
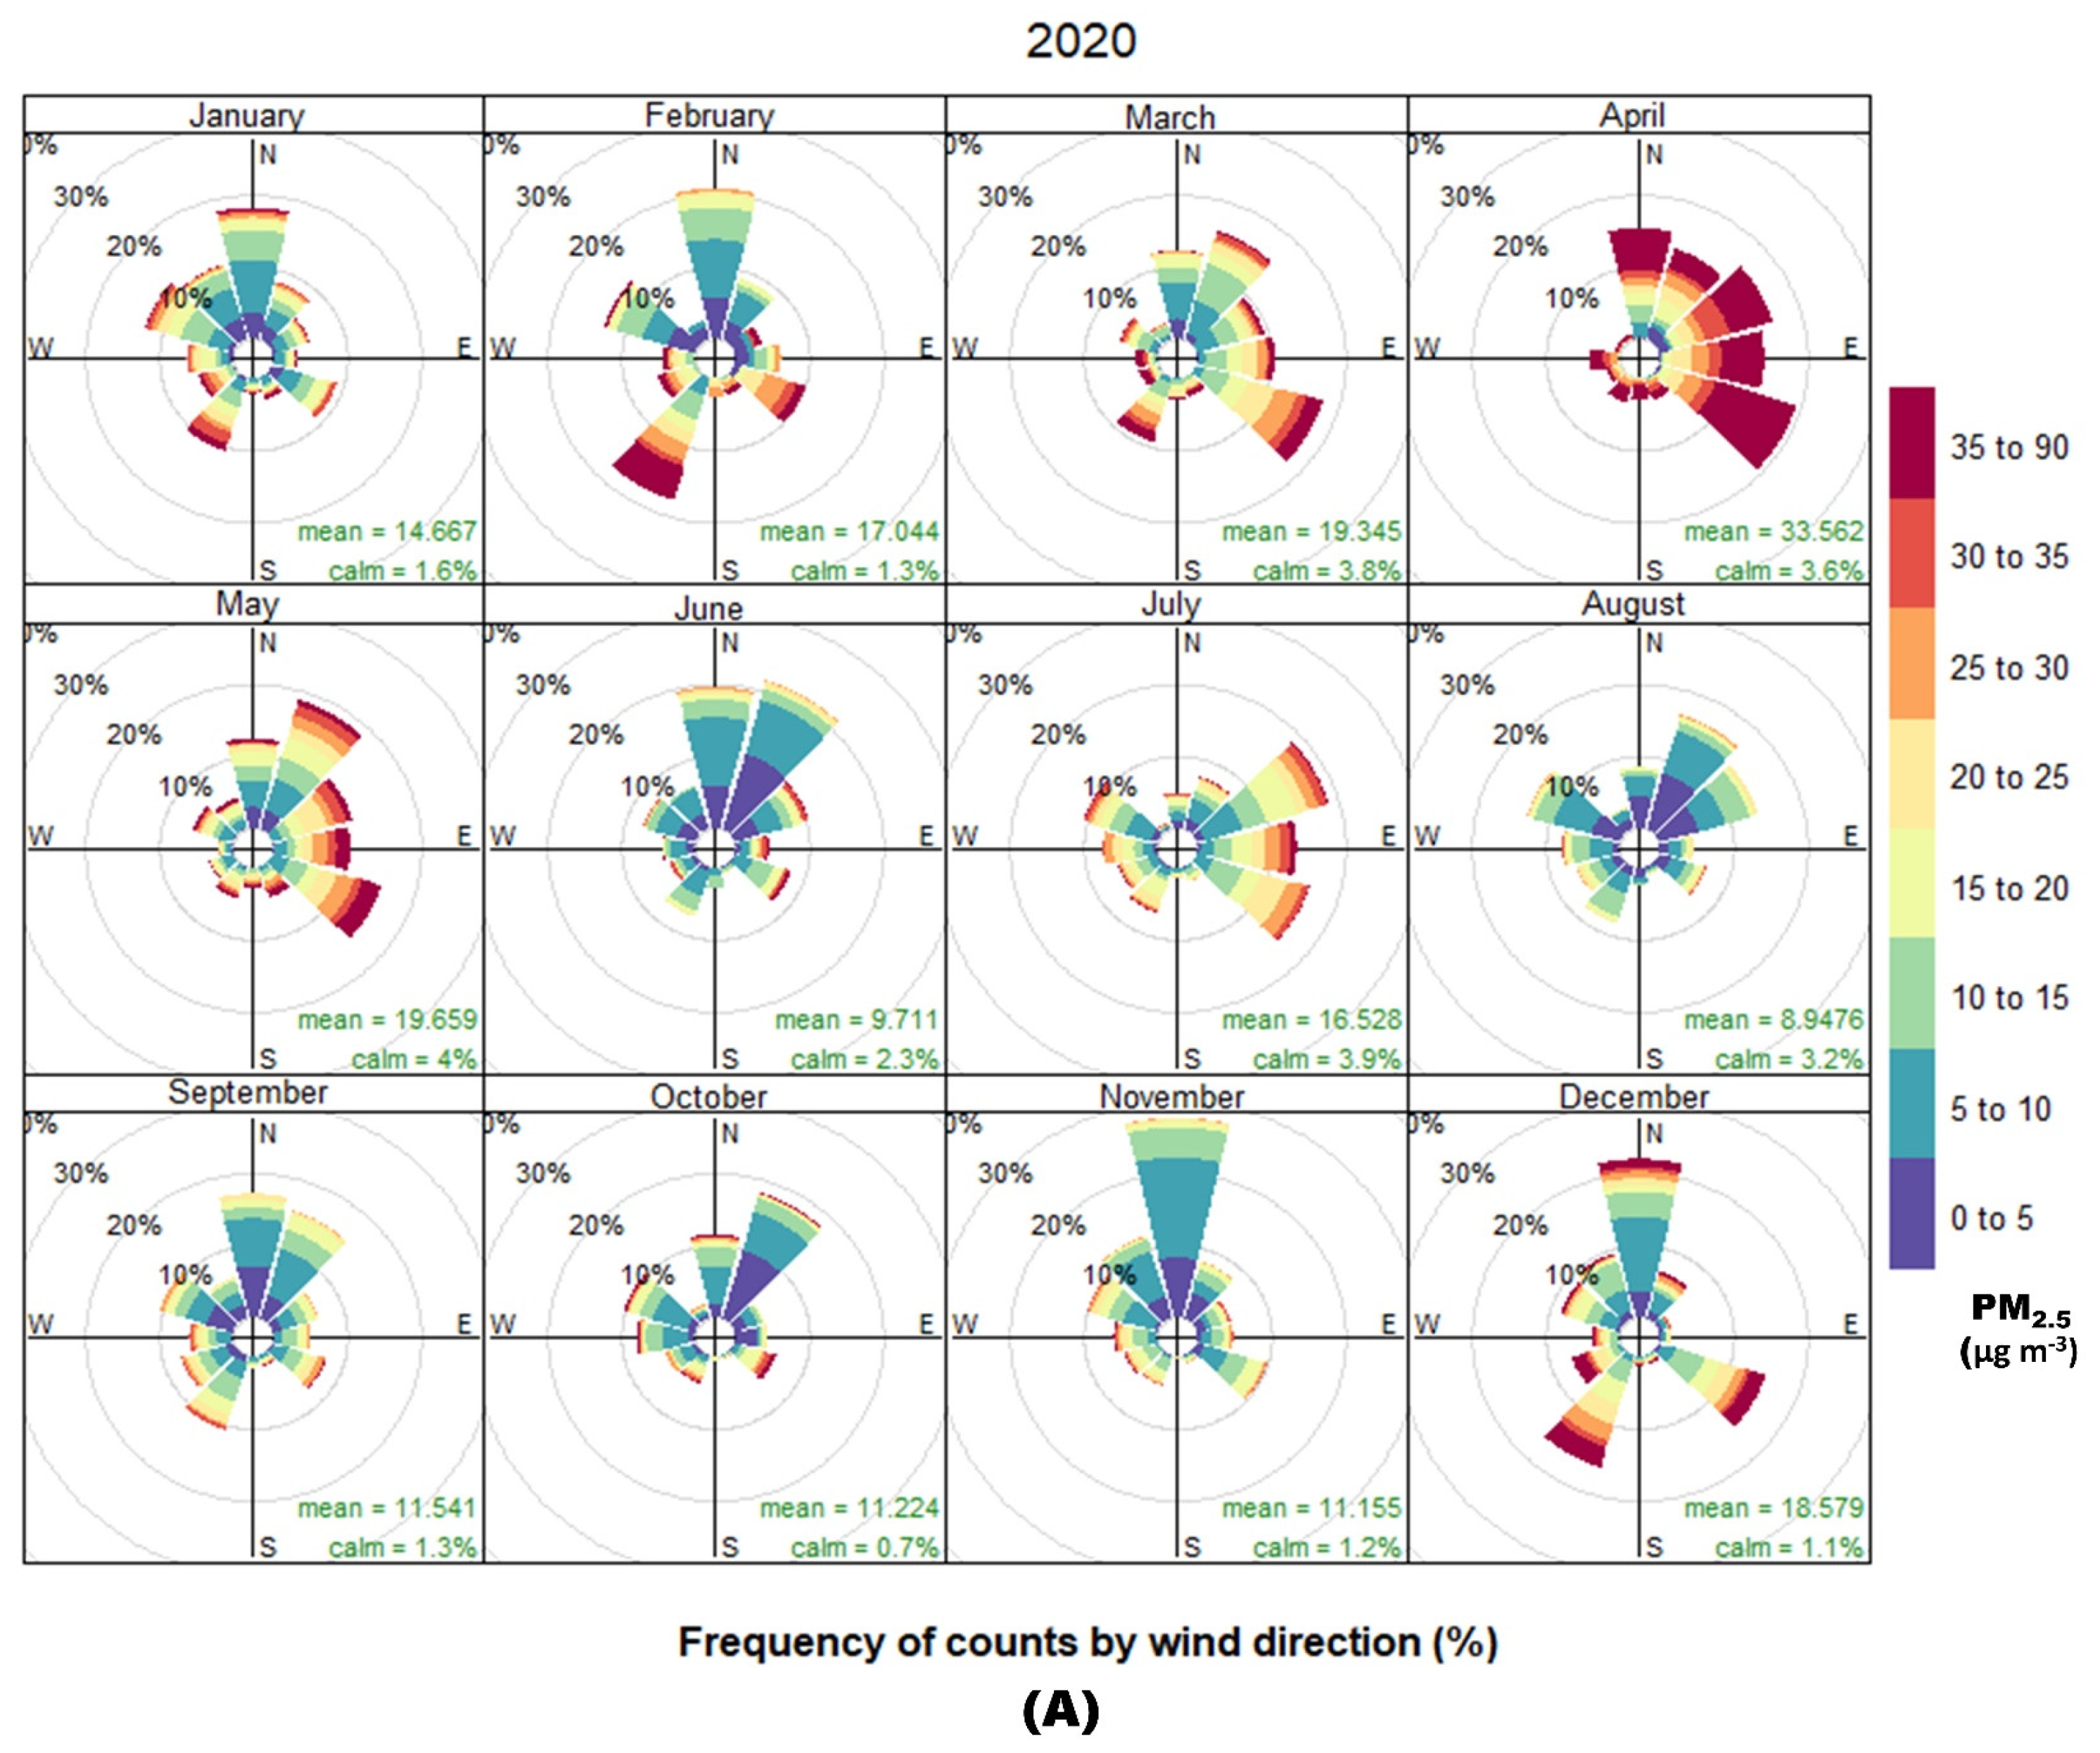
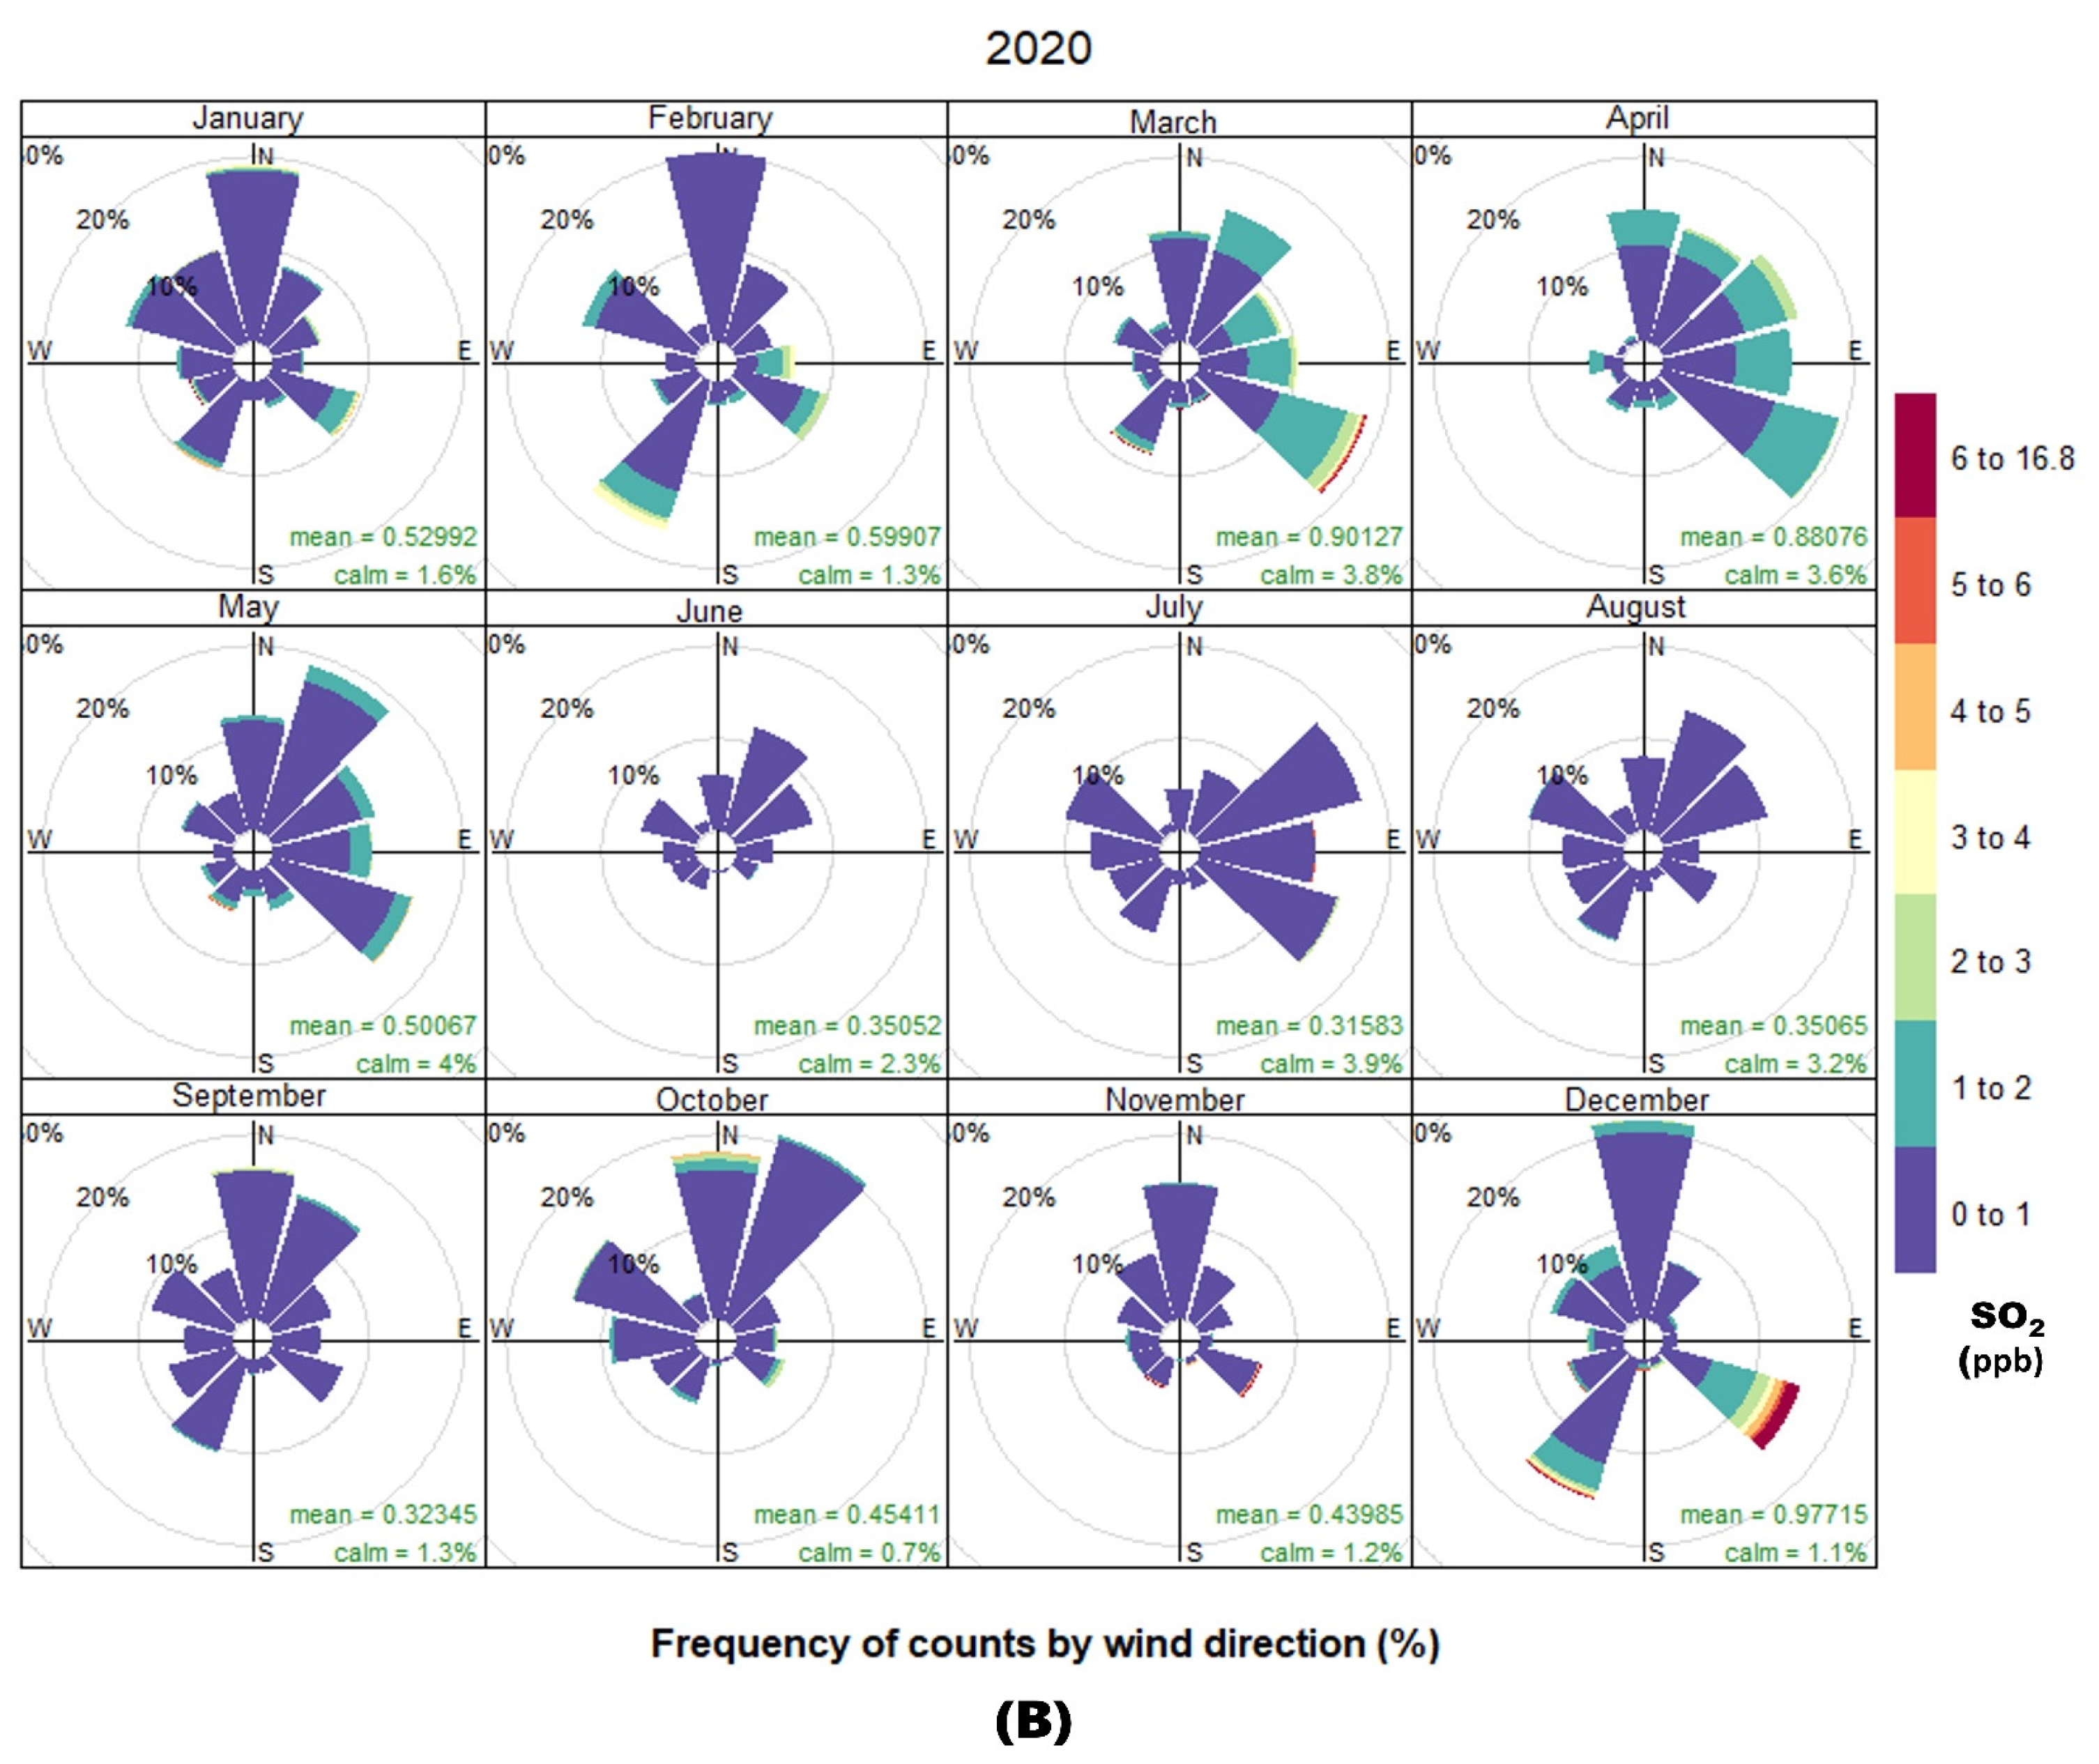
Figure 9 represents the seasonal pollution roses in 2020 (A) for PM2.5 and (B) for SO2. PM2.5 concentrations in the range of 25 to 90 µg m−3 present frequencies of approximately 30% to the northeast and north in spring, while in winter, a concentration between 5 and 26 µg m−3 is observed from the north and southwest with frequencies of almost 30%. For SO2 Figure 9B, in winter the highest concentration is presented with maximum values of 6 to 16.8 ppb, with a frequency greater than 20% and with a northwest and south direction. During the rest of the year, concentrations did not exceed 2 ppb. Low concentrations of SO2 coincide with those of PM2.5 in summer (June-September 2022) and part of autumn.
Considering the direction obtained in the rose of PM2.5 (Figure 9A) indicates that the main source of emission in spring and winter comes from the current port of Veracruz, although there is a component from the expansion of the port in the north, possible due to the construction activities. While the highest concentrations for SO2 (Figure 9B) are observed in winter; in both cases the main sources of emission are located in the current port area and ship areas. With this information, it can be partially concluded that the current port area is a main source contributing to pollutant emissions (SO2 and PM2.5) throughout the year, this behavior suggests the contribution of combustion sources from the current port and the urbanized area.
Appendix E (Figure A3 and Figure A4), presents the monthly pollutant roses for 2019 and 2020. In 2019 the PM2.5 average was 15.2 µg m−3 having the highest percentage of occurrence (20%) with a maximum concentration of 72 µg m−3 for the winds from the west in October and November; for SO2 the direction from west to north had a maximum occurrence of 20% with a predominant concentration of 0 to 1 ppb and 1 to 2 ppb; when winds were from east to south the concentration was higher, from 6 to 18.5 ppb with a maximum occurrence of ~15%. During 2020, winds heading northeast and southeast presented an occurrence of 10 to 20% and the highest concentrations of PM2.5 ranged from 25 to 50 µg m−3; winds that go from the southwest and southwest occur with a maximum occurrence of 10% with a predominant maximum concentration of 33 to 50 µg m−3. For SO2, concentrations of 0 to 1 ppb predominate with a maximum occurrence of ~15% with winds from the south, west and east; for the winds that blow to the southeast, the concentrations occurring ranged higher, with an occurrence <15%.
Appendix E, Figure A4A, shows that in the months of January–December, PM2.5 concentrations ranged from 35 to 90 µg m−3 with a maximum occurrence of 30%; in the months of April, June and December 2020. The maximum concentration values were in April (25 to 90 µg m−3), with a maximum occurrence of 20%.

3.4. Discussion

The pollutant emissions estimated in this study coincide with those of other ports since an increase in port activities would also present an increase in pollutant estimated values [15,18,47,48]. This behavior was similar in this research, since in 2019, 1881 ships were attended and in 2020, 1374 ships. Considering the types of vessels used in this research, the estimated emissions for container ships, mineral bulk and agricultural bulk presented the highest values during April, July and October 2020, period in which activities resumed during the pandemic. In several studies, they determined that the increase in estimates of NOX, CO2 and SO2 correlated with periods of increased port activity.
Regarding the temporal variability in the study area in 2019, CO2 was the pollutant that presented the highest estimates in the four seasons of the year (spring, summer, autumn and winter) with mean values of 31 777, 29,832, 35,335 and 30,783 while the mean values of CH4 were lower in the four seasons of the year 0.29, 0.28, 0.33, 0.290. Comparing with 2020, although there was a decrease in the values of the estimations, the tendency is maintained for CO2 with the highest mean values in the seasons (28,196, 26,776, 31,470, 29,031) and for CH4 with mean values of 0.26, 0.25, 0.297, 0.27 in each season. Our results can be compared with those studies presented in Table 5. We found that the highest estimates correspond to NOX, CO2 and SO2. The results of the estimates made in this study and for the afore mentioned pollutants, compared with the studies presented in Table 5, are the second highest values after those obtained in Korea in 2014 [49]. It is important to consider that the values of the other studies mentioned [50,51,52,53] even in the most recent study [54]; they are less than those shown in this research; attributed directly to the port activity and the time in which such investigations were carried out.
According to the results obtained in Figure 4, it can be observed that bulk carriers and tankers for petroleum derivatives have the highest emission of pollutants estimated in the maneuvering stage during the study period; while in hoteling the container ships exhibited the highest emission values of all pollutants [23,33,53,55,56]; this is attributed to the time spent at each stage and the number of vessels registered at APIVER. During the period evaluated in this research there is an increasing trend in the number of ships, even in the second half of 2020 during the pandemic. The values of the estimates for CO2, NOX and SO2 are attributed to combustion processes, and SO2, which is directly related to the sulfur content in the fuel used by the different types of ships.
Considering the reports of the concentrations that were generated in situ, the wind roses as well as the pollutant roses displayed concentrations values that exceeded the permissible limit (averages of 24 h of PM2.5), which are related to the periods of greater port activity and the characteristic meteorology of a port region. This was recorded in a similar way in the research carried out by other studies [2,17,57,58], showing the importance of port emissions. The coincidence of the SO2 and PM2.5 highest concentrations presented in Figure 7, suggests that the fossil fuel combustion is the main source of pollutants during November and December 2019 and maybe February 2020, whereas during the other months, the PM2.5 high values are due mainly to construction activities as well as dust resuspension. Thus, it would be advisable to continue monitoring air quality since health effects have been recorded it can induce greater morbidity and mortality from respiratory [21,59,60,61,62].
One of the activities carried out in this research has been monitoring the weather conditions and air quality despite the suspension of activities due to the pandemic period, as well as the validation of the information generated in the study area. This is obviously of great importance, given its direct relationship to the dispersion of pollutants and, consequently, to the quality of the air produced in the region.
Veracruz’s own meteorology is characteristic of a coastal region; there are cycles in some parameters such as temperature, wind direction and rainfall during the year, with monthly and seasonal variability; during most of the year, to a large extent, a northwest component is present [39,40].
The concentrations of PM2.5 and SO2 recorded in this research are higher in November and December 2020; specifically, for PM2.5 in January, April, July and October 2020. For SO2, high concentrations appear in November and December 2019. The mean concentrations of PM2.5 were 16.4 µg m−3 with the highest percentage of occurrence (20%) from north and west; in the case of SO2 it was 0.6 ppb from West to North, with a maximum occurrence of 20%. Comparing our weather and air quality results; against those presented in [62,63], they agree in presenting a relationship between the dispersion of atmospheric pollutants and meteorological conditions even when the conditions of speed and wind direction are slightly stable in Veracruz the most critical situation for dispersion is presented. Another study in Europe concluded that strong and frequent winds contribute even more to the rapid dispersion of emitted pollutants [64].
In our study, wind speeds and the prevailing direction from the northwest with an occurrence of 10% to 30% and a speed between 6 and 34.9 m s−1. As can be seen from the results obtained in this research and in some other ports around the world, pollutant emissions mainly affect the air quality in the area, which has an impact on the quality of life of the population. Several port cities have implemented various programs to control emissions in ports due to port traffic [65] and it is hoped that in Veracruz they can also be applied.

4. Conclusions and Recommendations

The results of this study underline the importance of implementing a methodology that is successfully applied to various ports of the country, considering that monitoring discloses the important sources of emission of pollutants that operate in the ports, known to negatively affect the air quality of the port area and adjacent cities. Interestingly, the highest emission rates of pollutants were estimated during the major port activity; that is to say, to the increase in the number of ships that dock in the port of Veracruz. Increases in estimated emission can be attributed to the transport of pollutants from areas where activities involving combustion processes using fossil fuels are carried out.
The estimated emissions for CO2, over the other pollutants emitted are the highest by several orders of magnitude; the total in (T Y−1) 2019 and 2020 were 199,900 and 185,383 respectively.
Analyzing the pollutants emitted with the meteorological information, a seasonal variability can be established during the year, which could directly modify the behavior of the pollutants, their dispersion and the possible zones of affectation. This information shows that the current port area is a major source contributing to pollutant emissions (SO2 and PM2.5) throughout the year, which was observed in the pollutant roses when dominant winds came from the East—Southeast, suggesting combustion sources, although in 2020 PM2.5 had also a contribution maybe from the construction activities.
SO2 levels never exceeded MAAQS of 40 ppb for 24 h. In autumn, SO2 concentrations ranged from 1 to 3 ppb in the eastern direction with a frequency greater than 10% and in the western direction with a frequency of approximately 30%. In winter the ambient air concentration was influenced from the north (30%), east-south (~10%) and southwest with a frequency of 10% and with intervals between 1 and 5 ppb.
PM2.5 measurements exceeded the annual MAAQS (12 µg m−3) and 24-h periods (45 µg m−3) in March, June and December; the first two months correspond to period where “calm” prevails, causing unfavorable dispersion of pollutants.
The findings of this research can provide useful information for policy development on the importance of pollution sources and their impact on air quality in areas nearby ports.
In the different Mexican port areas, there is no monitoring network to follow up on air quality, so it should be considered to establish one, considering inside and outside locations of port facilities; generating real-time information on the concentrations of different types of air pollutants and assessing the potential impact on air quality in the region in general.
Once port activities are resumed after the pandemic period, it is expected that estimates of pollutants will be made to include other mobile sources, which will increase as world ports have resumed their commercial activities.
It is recommended that future work in Mexican port regions include emissions inventory for sources outside the port areas, such as industries, services and mobile vehicles, among others.
It is necessary to make a comparison with other emission inventories carried out in different ports, in order to determine the level of emission generation related to port activity before and after the pandemic.

Author Contributions

Conceptualization, A.I.G.R., V.M.-Á., R.S.E. and P.S.Á.; methodology, A.I.G.R., V.M.-Á., R.S.E. and P.S.Á.; software, A.I.G.R., V.M.R., G.V.C. and A.R.; validation, V.M.R., G.V.C. and A.R., formal analysis, A.I.G.R., V.M.-Á., R.S.E. and P.S.Á.; investigation, A.I.G.R., V.M.-Á., R.S.E. and P.S.Á.; resources, R.S.E.; data curation, A.I.G.R., V.M.R., G.V.C. and A.R.; writing—original draft preparation, A.I.G.R., V.M.-Á., R.S.E. and P.S.Á.; writing—review and editing, A.I.G.R., V.M.-Á., R.S.E. and P.S.Á., visualization, A.I.G.R.; supervision, V.M.-Á. and R.S.E.; project administration, R.S.E.; funding acquisition, R.S.E. All authors have read and agreed to the published version of the manuscript.

Funding

This research received no external funding.

Institutional Review Board Statement

Not applicable.

Informed Consent Statement

Not applicable.

Data Availability Statement

Not applicable.

Acknowledgments

Authors appreciate the support for the realization of this research work from the Postgraduate program of Environmental Science and Engineering at the Metropolitan Autonomous University (UAM), Azcapotzalco Campus. AIGR thanks CONACYT for her Ph.D. scholarship (2019-000002-01NACF-01350) and the support in the English edition of Mario Romero from UAM. We thank to Francisco Liaño Carrera, Jorge Baños Illana, Socaris de la L. Aranda, David A. de la O Nava, personnel of “Administración Portuaria Integral de Veracruz (APIVER)”. To APIVER for the agreement with CCA-UNAM “Evaluación de la calidad del aire, depósito atmosférico y meteorología para desarrollar el programa para la prevención y minimización del posible deterioro ambiental significativo en el Recinto Portuario de Veracruz y en las zonas de interés”. Thanks to Francisco Javier Fuentes Quiñones from the legal department of APIVER that kindly provided information of interest. Thanks to the SCA-ICAyCC-UNAM personal: Gilberto Fuentes García, Eduardo Zamora Vargas, José Hernández Téllez, Humberto Bravo Witt and Rafael Esteban Antonio Durán.

Conflicts of Interest

The authors declare no conflict of interest.

Appendix A

Table A1. Classification of ships docked in the Port of Veracruz, by type of cargo.
Type of VesselClassLoad It TransportsRatio
Liquid or tankTANKShip intended for the transport of liquid goods, but different from fuels or petroleum derivatives.0.35
Bulk carrierBCARRUsed for the transport of agricultural or mineral bulk products.0.39
General cargoGRALCARGShips for goods that do not require special care.0.35
Ro-Ro merchandiseRO-RORoll-on/roll-off ships (cars) and off-road equipment, trailers or auto parts, is named for the acronym RO-RO for “roll-on/roll off”.0.39
Container carrierCONTShips that carry goods inside containers.0.27
FluidsFLUIDShips in which various fluids that are not derived from oil are transported.0.35

Appendix B

The ME and AE power for each type of ship was determined using equations (Equations (1)–(5)), where the ME (kW) of the ship is related to the GT for the different categories mentioned above. To obtain the power of the different AE (kW), it is obtained by multiplying the ratios (Appendix A), that is, the proportion of the total power of ME and AE for each type of ships, by the power of ME (kW).
Tank type ship
ME (kW) = 14.602 GT 0.6278
Bulk Carrier Ships
ME (kW) = 47.115 GT 0.504
General Cargo Ships
ME (kW) = 1.2763 GT 0.9154
Ro-Ro merchandise (vehicle transport ships)
ME (kW) = 45.7 GT 0.5237
Container ships
ME (kW) =1.0839 GT 0.9617
Subsequently, with the obtained information from different ships docked during 2019 and 2020 in the port of Veracruz, Equations (6) and (7) were applied for ships [47]. The pollutants reported in this research work were: CO2, CH4, CO, SO2, PM10, PM2.5, TPS, NOX, HCNM.
E i p M E m a n ( a n u a l ) = b P b p M E ( G T b p * ) N b p F C b o M E C C c t o T b o F E i c t o
E i p A E m a n / h o t ( a n u a l ) = b P b p M E ( G T b p * ) R b A E N b p F C b o A E C C c t o T b o F E i c t o
where
E i p M E m a n (annual)Annual Emissions of Pollutant i for Port p Due to ME during the Maneuver Phase (kg/Year)
E i p A E m a n / h o t ( a n u a l ) Annual emissions of pollutant i for port p due to AE during the Maneuver or Hoteling phase (kg/year)
P b p M E ( G T b p * ) Maximum power of MEs by type of ship by port p (kW) based on the average GT (GT) by type of ship by port p
R b A E Ratio to calculate the power of the AE from that of the ME by type of ship b
N b p Number of operations (In/Out) by type of ship by port p
F C b o M E ME load factor by type of vessel by operation or (Maneuver or Hoteling)
F C b o A E AE load factor by type of vessel by operation or (Maneuver or Hoteling)
C C c t o Fuel consumption by type of fuel used c (RO or MD)
T b o Time spent by type of vessel by operation o (h)
F E i c t o Emission factor by type of pollutant i, fuel c, engine t and operation o (g/kg fuel consumed)

Appendix C

Table A2. Total estimated emissions in 2019 by ship type in medium (maximum and minimum).
Kg/YearRO-ROGENERAL CARGOTANKSFLUIDSBULK CARRIERS (AGR)BULK CARRIERS (MIN)CONTAINER CARRIERAnnual 2019
NOX542.5527.6 11602051072562507.8567.7
(250–829)(326–963)(532–2072)(147–360)(792–1431.5)(381–769)(270–709)(304–937)
CO45.83577.813.771.937.742.643.5
(21–70)(22–64.6)(35.7–139)(10–24)(53–96)(25.5–51.6)(22.7–59.5)(22.8–71)
NMHC14.614.5325.729.615.51315
(6.7–22)(9–26.6)(14.7–57)(4–9.9)(21.9–39.6)(10.5–21)(7–18.6)(8–25)
SO227817.638.86.935.818.826070
(128–424.8)(11–32)(17.8–69)(5–12)(26.5–48)(12.7–25.7)(138–363)(21–261)
TSP20.812.5274.8251319.518
(9.6–32)(7.7–22.8)(12.6–49)(3.5–8.5)(18.8–34)(9–18)(10–27)(9–28.7)
PM10171022.5420.7111614.8
(8–26)(6–18.7)(10–40)(3–7)(15–27.7)(7–15)(8.5–22)(7–23.5)
PM2.515.7920.7 3.6191015 13.8
(7–24)(5.8–17)(9.5–37)(2.6–6)(14–25.5)(6.8–13.7)(8–21)(7–22)
CO230,15028,76163,24711,19958,43230,63528,22031,177
(13,917–46,053)(17,787–52,521)(28,994–11,298)(8026–1965)(43,194–78,042)(20,769–41,927)(15,003–39,396)(16,786–51,628)
CH40.30.270.60.1060.550.30.260.29
(0.13–0.4)(0.168–0.5)(0.27–1.06)(0.01–0.19)(0.4–0.7)(0.19–0.4)(0.14–0.37)(0.16–0.49)
Table A3. Total estimated emissions in 2020 by ship type in medium (maximum and minimum).
Kg/YearRO-ROGENERAL CARGOTANKSFLUIDSBULK CARRIERS (AGR)BULK CARRIERS (MIN)CONTAINER CARRIERAnnual 2020
NOX50652310752031138562402524
(293–701)(297–910.5)(437–2348)(152–483)(760–1530.6)(354–809)(222.7–652.7)(263.6–907.8)
CO42.7357213.67637.733.739
(24.8–59)(20–61)(29–157)(10–32)(51–102.6)(23.8–54)(18.7–54.8)(20–67)
NMHC13.614.529.75.63115.510.5514
(8–19)(8–25)(12–64.8)(4–13)(21–42)(9.8–22)(5.8–17)(7–24.6)
SO2259.517.5366.838.0618.820658
(150–359)(10–30.5)(14.6–78.5)(5–16)(25–51)(12–27)(114–334)(19–199)
TSP1912254.826.9131515.5
(11–27)(7–21.6)(10–55.6)(3.6–11)(18–36)(8–19)(8.6–25)(8–27)
PM10161020.833.9221112.612.7
(9–22)(5.8–17.7)(8.5–45.5)(3–9)(14.7–29.7)(7–15.7)(7–20.5)(6–22)
PM2.514.79193.6201011.911.8
(8.5–20)(5–16)(8–42)(2.7–8.6)(13.6–27)(6–14)(6.6–19)(6–20.7)
CO228,13728,53058,608.511,08862,05230,651.522,35929,003
(16,289–38,972)(16,200–49,641)(23,841–127,992)(8272–2634)(41,447–83,448)(19,321–44,112)(12,375–36,277)(14,606–50,176)
CH40.260.270.550.1050.5860.2890.20.27
(0.15–0.37)(0.15–0.47)(0.22–1.208)(0.078–0.25)(0.4–0.78)(0.18–0.42)(0.12–0.3)(0.14–0.47)

Appendix D

Figure A1. Wind roses for August–December 2019.
Jmse 11 00265 g0a1
Figure A2. Wind roses for January–December 2020.
Jmse 11 00265 g0a2

Appendix E

Figure A3. Pollutant roses for (A) PM2.5 and (B) SO2 in October–December 2019.
Jmse 11 00265 g0a3
Figure A4. Pollutant roses for the year 2020 in the January–December period stratified by months for: (A) PM2.5 and (B) SO2.
Jmse 11 00265 g0a4aJmse 11 00265 g0a4b

References

  1. Westerlund, J.; Hallquist, M.; Jallquist, A.M. Characterization of fleet emissions from ships through multi-individual determination of size-resolved particle emissions in a coastal area. Atmos. Environ. 2015, 112, 159–166. [Google Scholar] [CrossRef] [Green Version]
  2. Monteiro, A.; Russo, M.; Gama, C.; Borrego, C. How important are maritime emissions for the air quality: At European and national scale. Environ. Pollut. 2018, 242 Pt A, 565–575. [Google Scholar] [CrossRef] [PubMed]
  3. Zhao, J.; Zhang, Y.; Patton, P.A.; Ma, W.; Kan, H.; Wu, L.; Fung, F.; Wang, S.; Ding, D.; Walker, K. Projection of ship emissions and their impact on air quality in 2030 in Yangtze River delta, China. Environ. Pollut. 2020, 263 Pt A, 114643. [Google Scholar] [CrossRef] [PubMed]
  4. Murcia, G.J.C. Analysis and Measurement of SOx, CO2, PM and NOx emissions in port auxiliary vessels. Environ. Monit. Assess. 2021, 193, 374. [Google Scholar] [CrossRef]
  5. Bailey, D.; Solomon, G. Pollution prevention at ports: Clearing the air. Environ. Impact Assess. Rev. 2004, 24, 749–774. [Google Scholar] [CrossRef]
  6. Carr, E.W.; Corbett, J.J. Ship Compliance in Emission Control Areas: Technology Costs and Policy Instruments. Environ. Sci. Technol. 2015, 49, 9584–9591. [Google Scholar] [CrossRef]
  7. Formentin, G.; Forrest, J. A Critical Review of Emissions Estimation Techniques for Four International Shipping Port Studies. Air Qual. Clim. Change 2020, 54, 25–30. Available online: https://ebsco.uam.elogim.com/login.aspx?direct=true&db=eih&AN=144878119&lang=es&site=eds-live&scope=site (accessed on 6 October 2022).
  8. Tokuslu, A. Assessment of Environmental Costs of Ship Emissions: Case Study on the Samsun Port. Environ. Eng. Manag. J. 2021, 20, 739–747. [Google Scholar] [CrossRef]
  9. Yang, Z.L.; Zhang, O.; Caglayan, I.D.; Jenkinson, S.; Bonsall, J.; Wang, J.; Huang, M.; Yan, X.P. Selection of techniques for reducing shipping NOx and SOx emissions. Transp. Res. Part D Transp. Environ. 2012, 17, 478–486. [Google Scholar] [CrossRef]
  10. Kuzu, S.L.; Bilgili, L.; Kiliç, A. Estimation and dispersion analysis of shipping emissions in Bandirma Port, Turkey. Environ. Dev. Sustain. 2020, 23, 10288–10308. [Google Scholar] [CrossRef]
  11. Trozzi, C. Emission Estimate Methodology for Maritime Navigation. In Proceedings of the US EPA 19th International Emissions Inventory Conference, San Antonio, TX, USA, 27–30 September 2010. Techne Consulting Report ETC.EF.10 DD, May 2010. [Google Scholar]
  12. Chen, D.; Zhao, Y.; Nelson, P.; Li, Y.; Wang, X.; Zhou, Y.; Lang, J.; Guo, X. Estimating Ship Emissions Based on AIS Data for Port of Tianjin, China. Atmos. Environ. 2016, 145, 10–18. [Google Scholar] [CrossRef]
  13. Miola, A.; Ciuffo, B. Estimating air emissions from ships: Meta-analysis of modeling approaches and available data sources. Atmos. Environ. 2011, 45, 2242–2251. [Google Scholar] [CrossRef]
  14. Murena, F.; Mocerino, L.; Quaranta, F.; Toscano, D. Impact on air quality of cruise ship emissions in Naples, Italy. Atmos. Environ. 2018, 187, 70–83. [Google Scholar] [CrossRef]
  15. Tichavska, M.; Tovar, B.; Gritsenko, D.; Johansson, L.; Pekka, J.J. Air emissions from ships in port: Does regulation make a difference? Transp. Policy 2019, 75, 128–140. [Google Scholar] [CrossRef]
  16. Chen, D.; Wang, X.; Li, Y.; Lang, J.; Zhou, Y.; Guo, X.; Zhao, Y. High-spatiotemporal-resolution ship emission inventory of China based on AIS data in 2014. Sci. Total Environ. 2017, 609, 776–787. [Google Scholar] [CrossRef]
  17. Zhang, Y.; Peng, Y.Q.; Wang, W.; Gu, J.; Wu, X.J.; Feng, X. Air emission inventory of container ports'cargo handling equipment with activity-based “bottom-up” method. Adv. Mech. Eng. 2017, 9, 1–9. [Google Scholar] [CrossRef] [Green Version]
  18. Guevara, M.; Martinez, F.; Arevalo, G.; Gassó, S.; Baldasano, J.M. An improved system for modeling Spanish emissions: HERMESv2.0. Atmos. Environ. 2013, 81, 209–221. [Google Scholar] [CrossRef]
  19. Baldasano, J.M.; Güereca, L.P.; López, E.; Gassó, S.; Jimenez-Guerrero, P. Development of a high-resolution (1 km × 1 km, 1 h) emission model for Spain: The High-Elective Resolution Modeling Emission System (HERMES). Atmos. Environ. 2008, 42, 7215–7233. [Google Scholar] [CrossRef]
  20. Ekmekçioğlu, A.; Kuzu, S.L.; Ünlügençoğlu, K.; Çelebi, U.B. Assessment of shipping emission factors through monitoring and modelling studies. Sci. Total Environ. 2020, 743, 140742. [Google Scholar] [CrossRef]
  21. Zhanmin, L.; Xiaohui, L.; Junlan, F.; Qianzhu, F.; Yan, Z.; Xin, Y. Influence of Ship Emissions on Urban Air Quality: A Comprehensive Study Using Highly Time-Resolved Online Measurements and Numerical Simulation in Shanghai. Environ. Sci. Technol. 2017, 51, 202–211. [Google Scholar] [CrossRef]
  22. Corbett, J.J.; Winebrake, J.J.; Green, E.H.; Kasibhatla, P.; Eyring, V.; Lauer, A. Mortality from Ship Emissions: A Global Assessment. Environ. Sci. Technol. 2007, 41, 8512–8518. [Google Scholar] [CrossRef] [PubMed]
  23. Kwon, Y.; Lim, H.; Lim, Y.; Lee, H. Implication of activity-based vessel emission to improve regional air inventory in a port area. Atmos. Environ. 2019, 203, 262–270. [Google Scholar] [CrossRef]
  24. Zetterdahl, M.; Moldanová, J.; Pei, X.; Pathak, R.K.; Demirdjian, B. Impact of the 0.1% fuel sulfur content limit in SECA on particle and gaseous emissions from marine vessels. Atmos. Environ. 2016, 145, 338–345. [Google Scholar] [CrossRef]
  25. Senlin, L.; Zhenkun, Y.; Xiaohui, C.; Minghong, W.; Guoying, S.; Jiamo, F.; Paul, D. The relationship between physicochemical characterization and the potential toxicity of fine particulates (PM2.5) in Shanghai atmosphere. Atmos. Environ. 2008, 42, 7205–7214. [Google Scholar] [CrossRef]
  26. Ledoux, F.; Roche, C.; Cazier, F.; Beaugard, C.; Courcot, D. Influence of ship emissions on NOx, SO2, O3 and PM concentrations in a North-Sea harbor in France. J. Environ. Sci. 2018, 71, 56–66. [Google Scholar] [CrossRef]
  27. Castro, M.; Pires, J.C.M. Decision support tool to improve the spatial distribution of air quality monitoring sites. Atmos. Pollut. Res. 2019, 10, 827–834. [Google Scholar] [CrossRef]
  28. Martínez-Moya, J.; Vazquez-Paja, B.; Gimenez, M.J.A. Energy efficiency and CO2 emissions of port container terminal equipment: Evidence from the Port of Valencia. Energy Policy 2019, 131, 312–319. [Google Scholar] [CrossRef]
  29. Mousavi, A.; Sowlat, M.H.; Hasheminassab, S.; Pikelnaya, O.; Polidori, A.; Ban-Weiss, G.; Sioutas, C. Impact of particulate matter (PM) emission from ships, locomotives, and freeways in the communities near the ports of Los Angeles (POLA) and Long Beach (POLB) on the air quality in the Los Angeles county. Atmos. Environ. 2018, 195, 159–169. [Google Scholar] [CrossRef]
  30. Fameli, K.M.; Kotrikla, A.M.; Psanis, C.; Biskos, G.; Polydoropoulou, A. Estimation of the emissions by transport in two port cities of the Northeastern Mediterranean, Greece. Environ. Pollut. 2020, 257, 113598. [Google Scholar] [CrossRef]
  31. Ault, A.P.; Moore, M.J.; Furutani, H.; Prather, K.A. Impact of emissions from the Los Angeles Port region on San Diego air quality during regional transport events. Environ. Sci. Technol. 2009, 43, 3500–3506. [Google Scholar] [CrossRef]
  32. Zhao, M.; Zhang, Y.; Ma, W.; Fu, Q.; Yang, X.; Li, C.; Zhou, B.; Yu, Q.; Chen, L. Characteristics and ship traffic source identification of air pollutants in China's largest port. Atmos. Environ. 2013, 64, 277–286. [Google Scholar] [CrossRef]
  33. Wiacek, A.; Li, L.; Tobin, K.; Mitchell, M. Characterization of trace gas emissions at an intermediate port. Atmos. Chem. Phys. 2018, 18, 13787–13812. [Google Scholar] [CrossRef] [Green Version]
  34. Agrawal, H.; Eden, R.; Zhang, X.; Fine, P.M.; Katzenstein, A.; Miller, W.J.; Ospital, J.; Teffera, S.; Cocker, R.D. Primary particulate matter from ocean-going engines in the Southern California Air Basin. Environ. Sci. Technol. 2009, 43, 5398–5402. [Google Scholar] [CrossRef]
  35. Monios, J.; Bergqvist, R.; Woxenius, J. Port-centric cities: The role of freight distribution in defining the port-city relationship. J. Transp. Geogr. 2018, 66, 53–64. [Google Scholar] [CrossRef]
  36. Li, Z.; Feng, C.; Duan, Y. Air Pollution and Control of Cargo Handling Equipments in Ports. E3S Web Conf. 2019, 93, 02001. [Google Scholar] [CrossRef]
  37. Di Vaio, A.; Varriale, L.; Alvino, F. Key performance indicators for developing environmentally sustainable and energy efficient ports: Evidence from Italy. Energy Policy 2018, 122, 229–240. [Google Scholar] [CrossRef]
  38. Bravo, A.H.; Sosa, E.R.; Sánchez, A.P.; Fuentes, G.G.; Tami, P.L. Green Port in Mexico: Development of Combustion Emission Inventory in the Port of Veracruz, Mexico. In Proceedings of the Air and Waste Management Association’s Annual Conference and Exhibition, Long Beach, CA, USA, 14–17 June 2014; Available online: https://www.scopus.com/record/display.uri?eid=2-s2.0-84941281910&origin=inward&txGid=324b70f7b7136e808af480c88de953dd (accessed on 16 January 2023).
  39. Sosa, E.R.; Retama, H.A.; Sánchez, A.P. Sulphur Dioxide and Particles (PM10) Air Quality in a Port Located on the Gulf of Mexico. 2020. Available online: https://www.eventscribe.com/2020/ACEVIRTUAL/fsPopup.asp?Mode=presInfo&PresentationID=739115 (accessed on 25 November 2021).
  40. González, R.A.I.; Mugica, Á.V.; Sosa, E.R.; Sánchez, Á.P. Air Quality in the Port of Veracruz. Air and Waste Management Association’s Annual Conference and Exhibition, A&WMA’s 114th Annual Conference & Exhibition Paper # 983701. 2021. Available online: https://www.eventscribe.net/2021/ACE2021/fsPopup.asp?efp=Q1VMVk1YT04xMzk0Nw&PresentationID=901109&rnd=0.7607236&mode=presinfo (accessed on 25 November 2021).
  41. Fuentes, G.G.; Baldasano, R.J.M.; Sosa, E.R.; Granados, H.E.; Zamora, V.E.; Antonio, D.R.; Kahl, W.J. Estimation of Atmospheric Emissions from Maritime Activity in the Veracruz Port, Mexico. J. Air Waste Manag. Assoc. 2021, 71, 934–948. [Google Scholar] [CrossRef]
  42. Lang, X.; Shumiao, Y.; Jihong, C.; Jia, S. The Effect of COVID-19 Pandemic on Port Performance: Evidence from China. Ocean. Coast. Manag. 2021, 209, 105660. [Google Scholar] [CrossRef]
  43. Guevara, M.V. Inventario de emisiones atmosféricas de puertos y aeropuertos de España para el año 2008. In Projecte/Treball Final de Carrera, UPC, Escola Técnica Superior d'Enginyeria Industrial de Barcelona; Departament de Projectes d'Enginyeria: Barcelona, España, 2010; Available online: http://hdl.handle.net/2099.1/10640 (accessed on 9 December 2022).
  44. Brook, R.J.; Wiebe, H.A.; Woodhouse, A.S.; Audette, V.C.; Dannt, F.T.; Callaghan, S.; Piechowski, M.; Zlotorzynska, D.E.; Dloughyt, F.J. Temporal and spatial relationships in fine particle strong acidity, sulphate, PM10 and PM2.5 across multiple Canadian locations. Atmos. Environ. 1997, 31, 4223–4236. [Google Scholar] [CrossRef]
  45. Ruiz-Guerra, I.; Molina-Moreno, V.; Cortes-García, F.J.; Núñez-Cacho, P. Prediction of the impact on air quality of the cities receiving cruise tourism: The case of the Port of Barcelona. Heliyon 2019, 5, e01280. [Google Scholar] [CrossRef] [Green Version]
  46. Pérez, P.E.; Magaña, V.; Caetano, E.; Kusunoki, S. Cold surge activity over the Gulf of Mexico in a warmer climate. Frontiers in Earth Science. Atmos. Sci. 2014, 2, 1–10. [Google Scholar] [CrossRef]
  47. Pozo, D.; Marín, J.C.; Raga, G.B.; Arévalo, J.; Baumgardner, D.; Córdova, A.M.; Mora, J. Synoptic and local circulations associated with events of high particulate pollution in Valparaiso, Chile. Atmos. Environ. 2017, 196, 164–178. [Google Scholar] [CrossRef]
  48. Tichavska, M.; Tovar, B. Environmental cost and eco-efficiency from vessel emissions in Las Palmas Port. Transp. Res. Part E Logist. Transp. Rev. 2015, 83, 126–140. [Google Scholar] [CrossRef]
  49. Song, S.K.; Shon, Z.H. Current and future emission estimates of exhaust gases and particles from shipping at the largest port in Korea. Environ. Sci. Pollut. Res. Int. 2014, 21, 6612–6622. [Google Scholar] [CrossRef]
  50. Wahlström, J.; Karvosenoja, N.; Porvari, P. Reports of Finnish Environment Institute (FEI). Research Program for Global Change. In Ship Emissions and Technical Emission Reduction Potential in the Northern Baltic Sea; FEI: Helsinki, Finland, 2006; Volume 8, p. 73. ISBN 952-11-2277-3. [Google Scholar]
  51. Environ International Corporation (EIC). Port of Oakland, Seaport Air Emissions Inventory; EIC: Novato, CA, USA, 2013. [Google Scholar]
  52. Lopez-Aparicio, S.; Tønnesen, D.; Thanh, T.N.; Neilson, H. Shipping emissions in a Nordic port: Assessment of mitigation strategies. Transp. Res. Part D Transp. Environ. 2017, 53, 205–216. [Google Scholar] [CrossRef]
  53. Sun, X.; Tian, Z.; Malekian, R.; Li, Z. Estimation of vessel emissions inventory in Qingdao Port based on big data analysis. Symmetry 2018, 10, 452. Available online: https://www.mdpi.com/2073-8994/10/10/452 (accessed on 9 December 2022). [CrossRef] [Green Version]
  54. Progiou, A.G.; Bakeas, E.; Evangelidou, E.; Kontogiorgi Ch Lagkadinou, E.; Sebos, I. Air pollutant emissions from Piraeus port: External costs and air quality levels. Transp. Res. Part D Transp. Environ. 2021, 91, 102586. [Google Scholar] [CrossRef]
  55. Tovar, B.; Tichavska, M. Environmental cost and eco-efficiency from vessel emissions under diverse SOx regulatory frameworks: A special focus on passenger port hubs. Transp. Res. Part D Transp. Environ. 2019, 69, 1–12. [Google Scholar] [CrossRef]
  56. Gibbs, D.; Rigot-Muller, P.; Mangan, J.; Lalwani, C. The role of sea ports in end-to-end maritime transport chain emissions. Energy Policy 2014, 64, 337–348. [Google Scholar] [CrossRef] [Green Version]
  57. Xiao, Y.; Wang, G.; Lin, K.-C.; Qi, G.y.; Li, K.X. The effectiveness of the New Inspection Regime for Port State Control: Application of the Tokyo MoU. Mar. Policy 2020, 115, 103857. [Google Scholar] [CrossRef]
  58. Donateo, A.; Gregoris, E.; Gambaro, A.; Merico, E.; Giua, R.; Nocioni, A.Y.; Contini, D. Contribution of harbor activities and ship traffic to PM2.5, particle number concentrations and PAHs in a port city of the Mediterranean Sea (Italy). Environ. Sci. Pollut. Res. 2014, 21, 9415–9429. [Google Scholar] [CrossRef] [PubMed]
  59. Wu, R.; Dai, H.; Geng, Y.; Xie, Y.; Masui, T.; Liu, Z.; Qian, Y. Economic Impacts from PM2.5 Pollution-Related Health Effects: A Case Study in Shanghai. Environ. Sci. Technol. 2017, 51, 5035–5042. [Google Scholar] [CrossRef] [PubMed]
  60. Lin, H.; Tao, J.; Qian, Z.M.; Ruan, Z.; Xu, Y.; Hang, J.; Xu, X.; Liu, T.; Guo, Y.; Zeng, W.; et al. Shipping pollution emission associated with increased cardiovascular mortality: A time series study in Guangzhou, China. Environ. Pollut. 2018, 241, 862–868. [Google Scholar] [CrossRef] [PubMed]
  61. Berger, C.S.; Berger, L.; Skerratt, L.F. Airborne lead dust concentration in Townsville, Queensland is associated with port activity and may contribute to estuarine Sediment contamination. Estuar. Coast. Shelf Sci. 2019, 225, 106257. [Google Scholar] [CrossRef]
  62. Sorte, S.; Arunachalam, S.; Naess, B.; Seppanen, C.; Rodrigues, V.; Valencia, A.; Borrego, C.; Monteiro, A. Assessment of source contribution to air quality in a urban area close to a harbor: Case-study in Porto, Portugal. Sci. Total Environ. 2019, 662, 347–360. [Google Scholar] [CrossRef]
  63. Abdul-Wahab, S.A.; Charabi, Y.; Osman, S.; Yetilmezsoy, K.; Osman, I.I. Prediction of optimum sampling rates of air quality monitoring stations using hierarchical fuzzy logic control system. Atmos. Pollut. 2019, 10, 1931–1943. [Google Scholar] [CrossRef]
  64. Sarigiannis, D.A.; Handakas, E.J.; Kermenidou, M.; Zarkadas, I.; Gotti, A.; Charisiadis, P.; Makris, K.; Manousakas, M.; Eleftheriadis, K.; Karakitsios, S.P. Monitoring of air pollution levels related to Charilaos Trikoupis Bridge. Sci. Total Environ. 2017, 609, 1451–1463. [Google Scholar] [CrossRef]
  65. Pérez-Martínez, P.J.; Andrade, M.d.F.; De Miranda, R.M. Heavy truck restrictions and air quality implications in São Paulo, Brazil. J. Environ. Manag. 2017, 202 Pt 1, 55–68. [Google Scholar] [CrossRef]
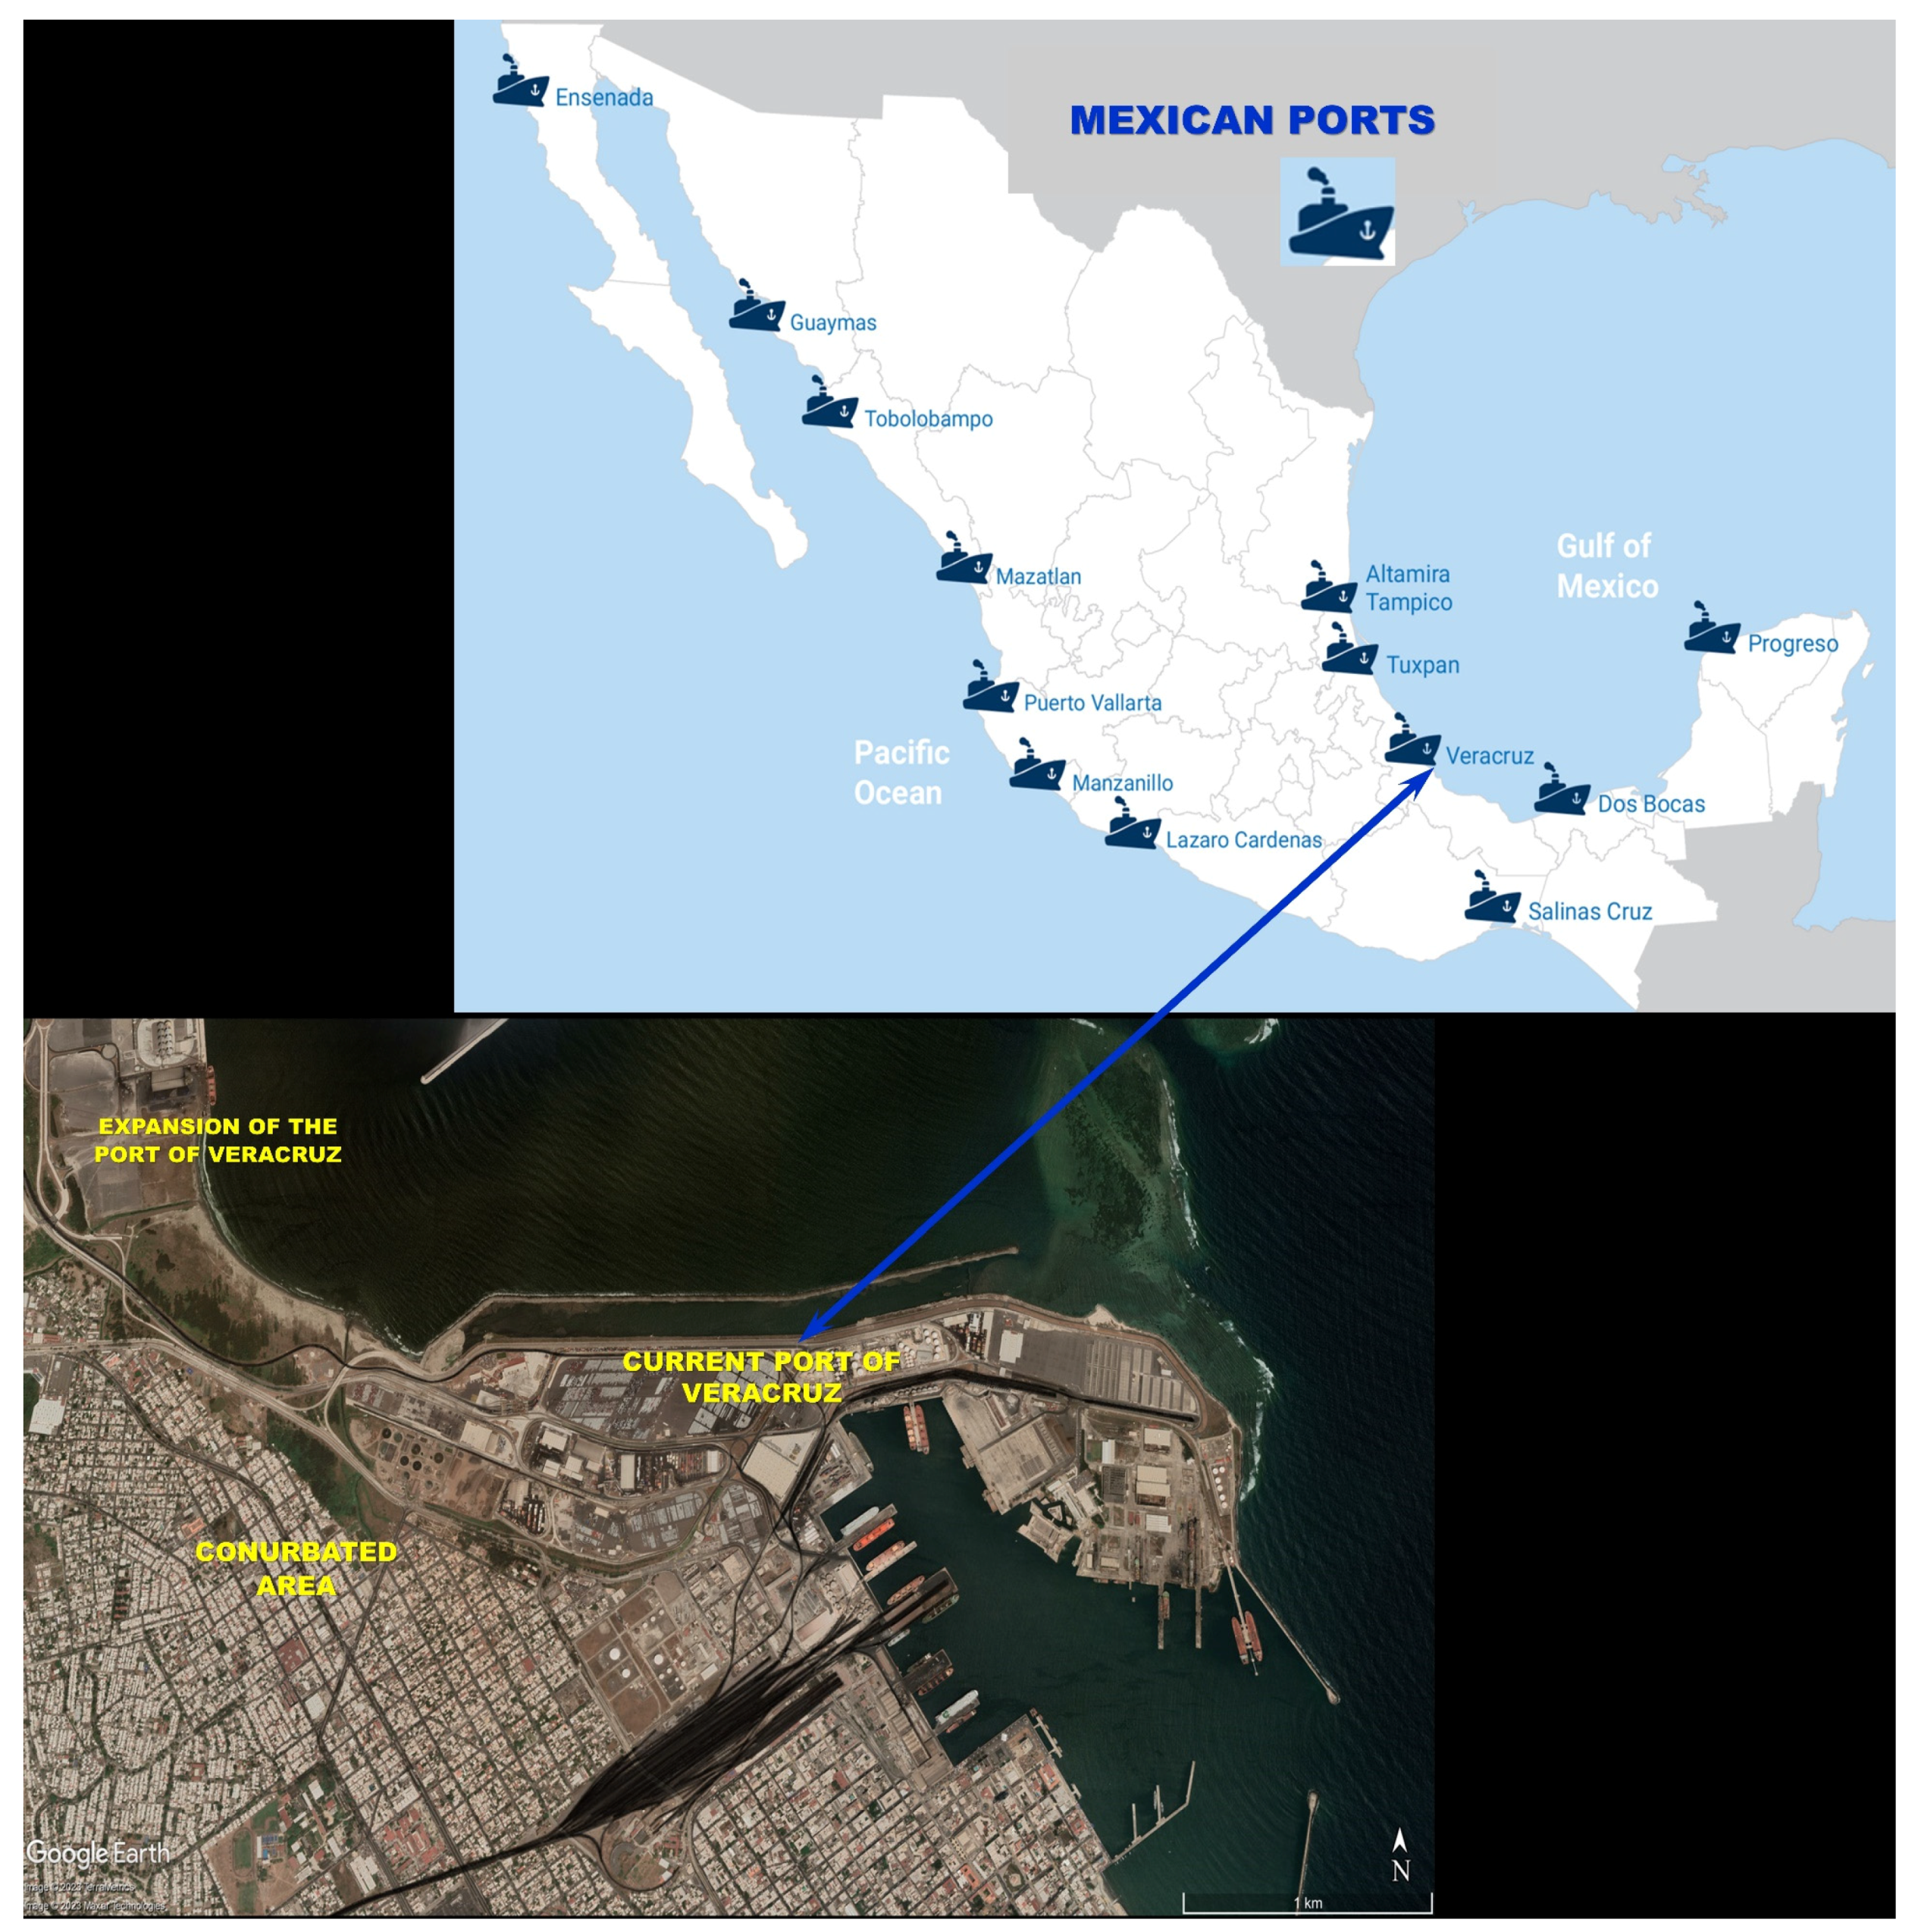
Figure 1. Port of Veracruz. Source: Google Earth Pro, 2020.
Jmse 11 00265 g001
Figure 2. Diagram of the methodology.
Jmse 11 00265 g002
Figure 3. Location of the Air Quality Monitoring Station (AQMS).
Jmse 11 00265 g003
Figure 4. Log-graph of estimated emissions in 2019 and 2020 by ship type.
Jmse 11 00265 g004
Figure 5. Estimated emissions in 2019 and 2020.
Jmse 11 00265 g005
Figure 6. Average wind roses in 2019 and 2020.
Jmse 11 00265 g006
Figure 7. Daily averages of concentrations recorded in Veracruz in 2019 and 2020.
Jmse 11 00265 g007
Figure 8. Pollution roses by season: (A) PM2.5, (B) SO2 in 2019.
Jmse 11 00265 g008
Figure 9. Pollution roses by season: (A) PM2.5, (B) SO2 in 2020.
Jmse 11 00265 g009
Table 1. Total annual estimated median emissions (minimum and maximum) in 2019 and 2020.
(Kg/Year)20192020p
NOX568 (304–937)524 (264–908)0.0016
CO44 (23–71)39 (20–67)0.0006
NMHC15 (8–25)14 (7–25)0.0018
SO270 (21–261)58 (19–199)0.0002
TSP18 (9–29)15.5 (8–27)0.0003
PM1015(7–24)12.7 (6–22)0.0003
PM2.514 (7–22)12 (6–21)0.0003
CO231,17729,0030.0014
(16,786–51,628)(14,606–50,176)
CH40.29 (0.16–0.49)0.27 (0.13–0.47)0.0014
Table 2. Seasonal variation of port emissions, medians (minimum and maximum) in 2019. * Values that have a significant difference.
(kg/Year)SpringSummerAutumnWinterp
NOx576 (328–878)537 (273–902)637 (287–1161)557 (326–864)0.056
CO44 (26–67)41(20–65) *48 (21–85.8) *43 (24–66)0.039
NMHC15 (9–24)15 (7–24)17 (8–31)15 (9–24)0.062
SO274 (22–264)63 (20–244)75 (23–296)69 (21–258)0.258
TSP18 (10–28)17 (8–27) *19 (9–34) *18 (10–27)0.031
PM1015 (9–23)14 (7–22) *16 (7–28) *15 (8–22)0.031
PM2.514 (8–21)13(6–21) *15 (7–26) *14 (7–20.8)0.029
CO231,77729,83235,33530,783
(18,221–48,358)(14,883–49,290)(15,758–63,490)(17,779–47,188)0.054
CH40.29 (0.17–0.46)0.28 (0.14–0.47)0.33 (0.15–0.6)0.290 (0.167–0.445)0.054
Table 3. Seasonal variation of port emissions, medians (minimum and maximum) in 2020. * Values that have a significant difference.
(kg/Year)SpringSummerAutumn Winterp
NOx507 (244–832) *485.9 (255.8–858.5)571 (306–1027) *524 (255–921)0.016
CO37 (19–61) *36.6 (20–62.8)42 (23–74.6) *39 (20–67)0.016
NMHC13.5 (6.6–22.6) *13 (6.7–23)15.7 (8–27) *14 (7–25)0.016
SO245 (18–158.5) *63 (21.5–194.8)57 (19–193)63 (19–228) *0.028
TSP14 (7–25) *15 (8–26)16 (8.9–29.6) *15.7 (8–28)0.016
PM1012 (5.8–20) *12.5 (6.6–21)13 (7–24) *13 (6–23)0.016
PM2.511 (5–19) *11.7 (6–20)12 (6.8–22.5) *12 (6–22)0.016
CO228,19626,77631,47029,0310.016
(13,423–45,722) *(14,035–47,025)(16,867–56,303) *(14,131–50,517)
CH40.26 (0.126–0.4) *0.25 (0.13–0.4)0.297 (0.16–0.5) *0.27 (0.13–0.47)0.016
Table 4. Basic statistics for SO2 and PM2.5 in Veracruz.
SO2 (ppb)PM2.5 (µg m−3)
Maximum Concentration 460.3
Average Concentration0.616.4
Standard Deviation0.410.9
Median0.413.2
Table 5. Comparison between the estimated emissions in the Port of Veracruz and the emissions in other ports.
PortReferenceYear of StudyPollutant
T Y−1
KoreaSong and Shon (2014)2006, 2008 and 2009NOX = 11,700
CO2 = 560,000
PM = 1200
SO2 = 9600
COV = 374
Western Gulf of FinlandWahlström, et al. (2006)2006NOX = 40,326
PM = 1049
SO2 = 13,456
Candarli Gulf, TurkeyDeniz, et al., 20102007NOX = 632
CO2 = 33,849
PM = 57
SO2 = 574
Port of Oakland, USAEnviron International Corporation (EIC) 20132012NOX = 2591
CO2 = 133,005
PM = 67
SO2 = 289
The Port of Oslo, NorwayLopez-Aparicio, et al. (2017)2013NOX = 759
CO2 = 56,289
PM = 18
SO2 = 260
Port of las Palmas, SpainTichavska and Tovar (2015)2011NOX = 4237
CO2 = 208,697
PM = 338
SO2 = 1420
QingdaoSun, et al. (2018)2016NOX = 30,031.5
CO2 = 2,347,879
PM = 1747.14
SO2 = 21,711.32
Port of Piraeus, GreeceProgiou, et al. (2021)2018NOX = 218.73
PM10 = 15.09
SO2 = 81.99
Veracruz, MexicoTHIS STUDY2019

2020
NOX = 3789
CO2 = 199,900
PM = 614
SO2 = 2869
NOX = 3514
CO2 = 185,383
PM = 570
SO2 = 2662.4
Disclaimer/Publisher’s Note: The statements, opinions and data contained in all publications are solely those of the individual author(s) and contributor(s) and not of MDPI and/or the editor(s). MDPI and/or the editor(s) disclaim responsibility for any injury to people or property resulting from any ideas, methods, instructions or products referred to in the content.