Abstract
To achieve uniform spatial coverage characteristics in optical signals in an underwater wireless optical communication (UWOC) system, and therefore reduce the requirement of the alignment between the receiver and the transmitter, we propose an optimized scheme of optical signal coverage based on a light-emitting diode (LED) array in this paper. For high-efficiency coverage of the optical signals, the pitch angle of the LED light source is first optimized on the basis of the light beam geometry. Then, the layout of the LED array and the horizontal deflection angle of the light source are jointly optimized by an improved particle swarm optimization (PSO) algorithm. Taking a 16-LED array as an example, the performances of the spatial coverage characteristics with three different LED array layouts are analyzed in detail under four typical seawater environments. The results show that the LED array with the PSO-optimized layout can achieve better uniformity in the power distribution for the received optical signals, and enhance the robustness of the UWOC system in complex seawater environments.
1. Introduction
Underwater wireless communication (UWC) technology plays a vital role in marine resource exploration, oceanographic research, and tactical surveillance []. Moreover, UWC technology is indispensable as an essential relay communication link in a real-time ocean observing system []. With the increasing number of human underwater activities, more application scenarios are emerging for underwater sensor networks and robot swarms. The regional high-speed and high-dynamic communication technology between underwater multi-agents and sensing nodes is of great significance for enhancing the efficiency of underwater activities, such as data collection, backhaul transmission, and information exchange [,]. Although the underwater acoustic technique is relatively mature and has been successfully applied in UWC systems, the underwater acoustic communication system is still limited by narrow bandwidth, low data transmission rates, and high link delays. Moreover, the broadcast acoustic signals are at risk of eavesdropping []. The underwater wireless optical communication (UWOC) technology, which shows more advantages during short- and medium-range wireless communication scenarios than acoustic technology in terms of data rate, security, link latency, and system power consumption, has attracted more attention and research in recent years [,].
In 1963, Duntley et al. proposed a low attenuation transmission window for underwater optical signals with wavelengths from 450 nm to 550 nm [], and Gilbert et al. experimentally demonstrated the possibility of underwater optical signal transmission, which provides a theoretical study and application basis for the UWOC system []. However, the transmission performance of the submarine optical signal is seriously affected by complex seawater environments, which brings significant challenges to guaranteeing the reliability of the UWOC system. The research on the spatial coverage characteristics of underwater wireless optical signals in marine environments is crucial to constructing a high-speed, dynamic, and regional communication mechanism for underwater multi-agents based on the UWOC system.
An LED light source can realize adequate spatial area coverage because of its large divergence angle, which can significantly reduce the alignment requirement of the transceivers and further enhance the mobility of the UWOC system []. Ding et al. proposed an optimized scheme based on an evolutionary algorithm that effectively reduces the signal power fluctuating range by 26.5% through modifying the luminous intensity of the LED []. An improved genetic annealing algorithm is proposed to search optimal power factors without changing LED layouts to optimize optical communication signal coverage performance []. The power allocation for uniform illumination with LEDs is analyzed in detail, wherein the random geometries are considered for the arrangement of the LED array. The numerical results show that optimized LED geometries can also effectively reduce the cost of the system [,]. Liu et al. proposed a genetic density genetic algorithm (GDGA) for adjusting the horizontal position of the LED light source []. Compared with the traditional circular layout, the layout optimized by the GDGA reduced the deviation by 55.4%. Wang et al. proposed an improved artificial fish swarm algorithm (IAFSA) for adjusting the horizontal layout of the LED array []. The mean square deviation of the received power of the system after the optimization is reduced by 39.8%, 54.4%, and 40.1% compared to the square, rectangular and circular layouts, respectively. A hybrid LED array layout is further employed to reduce the number of LEDs for the sake of a lower power consumption of the system []. To further improve the irradiation characteristics, the half-power angle and horizontal layout are optimized by an improved BAT algorithm, which can effectively reduce the illumination fluctuation under different LED array layouts []. An improved firefly algorithm was proposed to optimize the horizontal structure, power distribution, and irradiation direction in the LED array. The uniformity of the signal-to-noise ratio (SNR) was improved by a factor of 4.18 []. In all the above, the irradiation characteristics of the LED light signal are effectively enhanced by optimizing different parameters of the LED light source. However, most optimization methods focus on a fixed receiving plane under a definite transmission distance. The UWOC system with high dynamic spatial coverage characteristics is more effective when used during underwater operations.
In this paper, we propose an optimized scheme to enhance the spatial coverage characteristics of the LED array in different seawater environments. Firstly, the UWOC system model with an LED array as the transmitter is established. Then, the optimal pitch angle of the LED light source is optimized to achieve effective optical signal coverage based on the light beam geometry. Moreover, an improved PSO algorithm is proposed to realize the joint optimization of the layout distribution and the horizontal deflection angle in the LED array. Finally, taking a 16-LED array as an example, we compare the spatial coverage characteristics of the received optical power with different LED array layouts and analyze the performance of the layout optimized by the improved PSO algorithm under four typical seawater environments.
2. System Model
The LED UWOC system model with dimensions L × W × H is shown in Figure 1. Assuming that the number of LED light sources in this model is N and the coordinate of the LED is (Xi, Yi, hi), the spatial region required to be covered by the LED signal is L × W × h, and the received power of Pr for the detector can be expressed as
where Pt(φ) is the transmission power of one LED and φ is the divergence angle of the LED. H(0) represents the gain between the LED transmitter and the receiver. L(λ, d) is the underwater attenuation coefficient, where λ is the wavelength of the light, and d is the transmission distance.
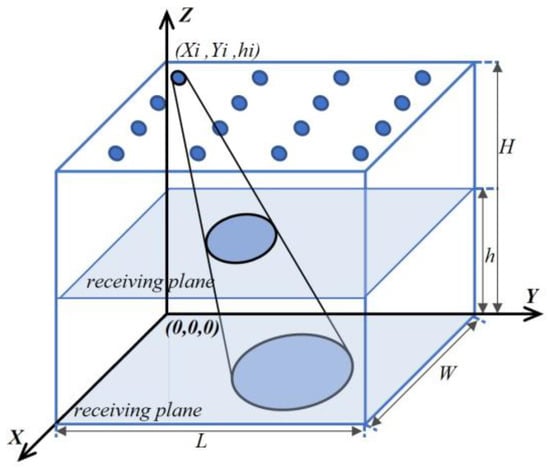
Figure 1.
UWOC system model with the LED array.
The light distribution characteristics of each LED light source follow the Lambertian pattern, which can be written as []
where φc is the maximum divergence angle of the LED.
The system gain H(0) can be given by []
where A is the physical area of the photodetector, and m represents the Lambertian illumination order, which is given by m = ln(2)/ln(cos(φ1/2)), where φ1/2 is the semi-angle at half-power of the LED. Ts(ψ) represents the optical filter gain of the receiver, ψ is the incident angle of the optical signal at the receiver, and ψc is the field of view (FOV) of the photodetector. g(ψ) is the optical concentrator gain of the receiver, which can be calculated as follows:
where n denotes the internal refractive index of the optical concentrator. The rectangular function rect(x) is expressed as
The transmission characteristics of the underwater LED system are mainly influenced by factors such as absorption, scattering, and turbulence []. The turbulence effect can be ignored because underwater LED systems are usually applied in short- and medium-range circumstances. The total attenuation coefficient of c(λ) mainly consists of the absorption and scattering effects, which can be expressed as
where a(λ) is the absorption coefficient, b(λ) is the scattering coefficient, and the units of all the coefficients are m−1.
Beer–Lambert’s law is widely used to describe the propagation loss factor as a function of wavelength λ and distance d in the underwater environment []. The L(λ, d) can be expressed as
Here, we select four typical seawater environments, including pure seawater, clean seawater, coastal seawater, and turbid harbor water, to verify the coverage performance of different LED array layouts. The typical values of absorption a(λ), scattering b(λ), and total attenuation c(λ) for wavelength λ = 532 nm are given in Table 1 [].

Table 1.
Attenuation coefficient of different seawater environments.
All the system simulation parameters are listed in Table 2.

Table 2.
System simulation parameters.
3. System Parameters Optimization
3.1. Optimal Pitch Angle
In this section, a geometric model of the emitted beam is employed to optimize the pitch angle of the LED light source. We assume that the initial position of the LED is P = (Xi, Yi, hi), and P′ is the projection of P on the X-0-Y plane. Taking point P as the center and the maximum signal transmission distance in the coverage area as the radius, an optical signal coverage model can be established, as shown in Figure 2. γ is the pitch angle, which is defined as the angle between the line PP′ and the central line of the divergence angle of the LED light source. B1B2B3B4 represents the top area of the spatial coverage area of a single LED light source, and the bottom coverage area is denoted by A1A2A3A4. h is the depth of the underwater region to be covered by the LED light source.
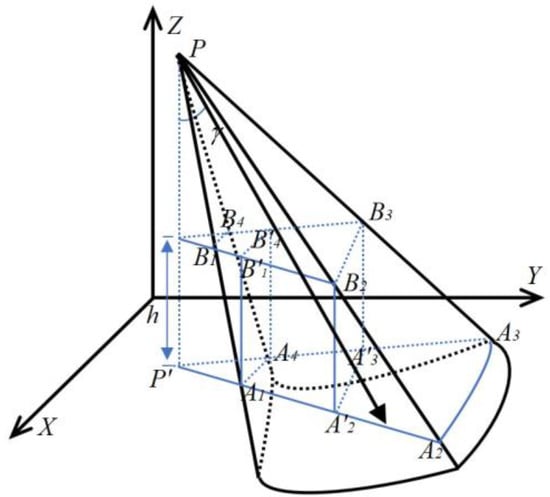
Figure 2.
LED light beam geometry.
The underwater propagation of the optical signal is affected by the transmission distance. To achieve better uniformity of the spatial coverage characteristics for the received optical signals, we define the optimized target as the effective coverage region composed by A1A4A3′A2′ and B2B3B4′B1′ planes. The plane of the horizontal deflection angle of the LED is perpendicular to the plane of the pitch angle. Thus, the size of the horizontal deflection angle is not related to the size of the effective coverage space. When the distance between the LED light source and the coverage area is determined, the main factor affecting the effective coverage area is the pitch angle. The cutaway view of the LED beam geometry is given in Figure 3.
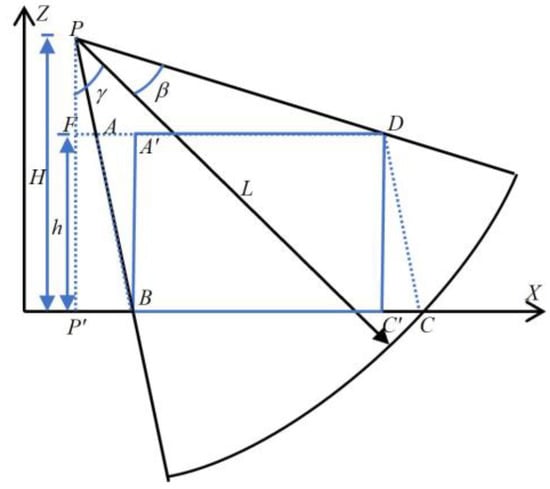
Figure 3.
Cutaway view of the LED beam geometry.
β is the half-power angle of the LED, H is the height of the spatial model, and L represents the maximum transmission distance. Assuming that the length of line AD is S, it can be calculated by
The derivative function of S′ can be expressed as
The sum of the half-power angle β and the pitch angle γ of the LED is larger than 70°. sec2(β + γ) is approximately equal to 8. The difference between the pitch angle γ and the half-power angle β is relatively small, and sec2(γ − β) ≈ 3. In summary, S′ increases monotonically with the pitch angle. S is the maximum value when point C′ coincides with point C. The pitch angle γ is the optimal pitch angle for the LED, expressed as
After optimization for the pitch angle of the LED, the horizontal layout of the LED array and the horizontal deflection angle of the LED are required to be optimized for further improvement of the signal coverage in the UWOC system.
3.2. Improved PSO Algorithm
The PSO algorithm is a heuristic algorithm with simple implementation and high efficiency, and is an effective optimization method for the LED array layout []. By improving the fitness function of the PSO algorithm, the horizontal layout and the horizontal deflection angle of the LED light source in the array can be jointly optimized for different environments. Assuming the particle represents a solution of the LED array layout structure, each particle can move towards any other particle with a higher value of fitness function, and the distance depends on its current state. The value of the fitness function increases as the particle motion progresses. The particle with the highest fitness function value among all particles is the best solution at the end of the iteration. The flowchart of the improved PSO algorithm is shown in Figure 4.

Figure 4.
Flowchart of the improved PSO algorithm.
The optimization process of the improved PSO algorithm is shown in Table 3. The joint optimization algorithm is based on the optimal pitch angle of the LED light source. The initialization parameter setting of the improved algorithm needs to take into account the influence of different seawater environments on the coverage characteristics of the LED light beam geometry to improve the robustness of the system. The fitness function is initialized in step 1. To accommodate the effects of different seawater properties on the optical signal propagation process, the fitness function is associated with the maximum effective area of the beam geometry to obtain the optical signal coverage. The fitness function of particle i is expressed as
where η represents the spatial coverage, and is determined by the LED array layout. Num is the number of iterations. The maximum spatial coverage of all particles is defined as fmax.

Table 3.
Improved PSO algorithm optimization process.
In step 2, the first generation of the uniformly distributed particle swarm is established by the random initialization of the particle states. The fitness function values of the first-generation particle swarm are calculated and recorded. The state of the LED in the particle can be expressed as Qd (xd, yd, θd), where (xd, yd) is the horizontal position of the LED. θd is the horizontal deflection angle of the LED with a range of [0, 2π].
In steps 3 to 5, the historical best particles are generated by the value of the fitness function. When the particles move to a higher fitness function value, the motion state is decided by
where pid is the best particle position parameter or horizontal deflection angle. gad is the position parameter or horizontal deflection angle of the best particle of the current particle swarm. aid(t) is the position parameter or horizontal deflection angle of particle i in the tth iteration. vid(t) is the parameter change of the position parameter or horizontal deflection angle of particle i in the tth iteration. ω is the inertia factor, and r1 and r2 are random numbers between [0, 1]. c1 and c2 are the learning factors. The current particle with the highest fitness function value is recorded as the best particle. Selective updates are performed during the iterative process compared to the historical best particles.
In step 6, the iteration is terminated or not, based on the number of iterations.
The particle node size N denotes the algorithm’s ability to search for optimum results and generally increases with the complexity of the problem. Niter determines the number of times the particle explores the optimization result. Through several optimization experiments, it is concluded that when N is 15, Niter is 4000, and this can achieve the optimization target. The learning factors c1 and c2 represent the acceleration weights of the particle’s motion toward the current particle’s pole and the global pole, respectively. Their values are set to 2, indicating that the weights of the self-polarity and the global polarity are the same. The flight speed vi indicates the maximum limit of each movement of the particle, which constrains the ability of the particle to explore and exploit the optimization results. To ensure the global search capability of the algorithm, the value range of vi is set to [−2, 2]. The particle size n indicates the length of the particle solution. The particle position boundary and the particle angle boundary limit the range of particle solutions, all of which are determined by the optimization problem itself. Moreover, the algorithm’s parameters should be adjusted within a controlled range to ensure the convergence of the optimization results. For example, the inertia factor should be associated with the number of iterations to expand the scope of the particle state changes and improve the global search capability. Thus, the local search ability of particles can be improved by narrowing the scope of motion state changes in the later stages of particle iterations []. Table 4 lists all the parameter settings in the improved PSO algorithm.

Table 4.
Parameter settings in the improved PSO algorithm.
4. Results and Discussion
In this section, the spatial coverage characteristics of the LED lighting sources are investigated in detail under four major seawater types. Three different layouts with a 16-LED array are shown in Figure 5. Figure 5a,b demonstrate a rectangular layout and a hybrid circle–square layout at the transmitter, respectively. The default pitch angle β in both traditional layouts is 0°. In the PSO-optimized layout of the LED array, the optimal pitch angle γ of the LED is calculated to be 12.24°, based on (10). The horizontal deflection angle for each LED in the array is calculated by the improved PSO algorithm, shown in Figure 5c. The underwater spatial coverage characteristics of three LED array layouts are evaluated at different transmission distances, and the results are shown in Figure 6.

Figure 5.
LED array layouts. (a) Rectangular layout; (b) hybrid layout; (c) PSO-optimized layout.
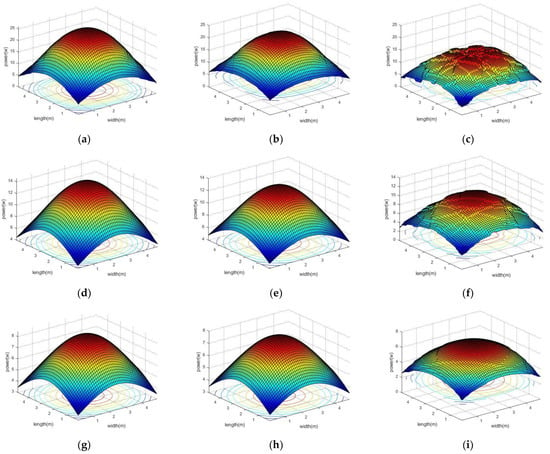
Figure 6.
Power distribution of the received optical signal at different depths. (a) Rectangular layout at 2 m; (b) hybrid layout at 2 m; (c) PSO-optimized layout at 2 m; (d) rectangular layout at 3 m; (e) hybrid layout at 3 m; (f) PSO-optimized layout at 3 m; (g) rectangular layout at 4 m; (h) hybrid layout at 4 m; (i) PSO-optimized layout at 4 m.
It can be seen from Figure 6 that at the same seawater depth, the PSO-optimized LED array improves the uniformity of the received optical signal power. Taking the water depth of 2 m as an example, the performances of the optical signals at the receiving plane are compared in detail, as shown in Table 5. The power variance of the received optical signal is employed to evaluate the irradiation characteristics. The power variances under the rectangular layout and hybrid layout are calculated as 2.78 dBm and 1.89 dBm, respectively. In comparison, the PSO-optimized layout with the power variance of 1.44 dBm at the receiving terminal leads to a more minor fluctuation in the received optical power. However, the average power of the PSO-optimized layout is only 10.82 W, which is lower than the 16.16 W of the rectangular layout and 15.03 W of the hybrid circle–square, respectively. One of the reasons is that the optimization of the LED pitch angle makes the transmission distance of the signal much longer than that of the traditional vertical emission layouts. Moreover, to obtain effective signal coverage at the edge of the spatial area, some parts of the optical signals escape outside the detection area, and cannot be received correctly. The above problems can be solved by decreasing the pitch angle to reduce the link distance, and expanding the FOV of the receiver to improve its detection ability.

Table 5.
Receiving power effect indicators.
With the increase in optical signal transmission distance, the influence of the LED light source layout on power distribution gradually declines. Using the optimized pitch angle and horizontal deflection angle of the LED array at the transmitter, the received optical power after the transmission distance of 2 m fluctuates seriously, as shown in Figure 6c. Due to the large divergence of the LED light source, with the increase in the transmission distance, the influence of the dispersion effect on the photon movement becomes significant, making the power distribution of the received signal power more uniform. Therefore, the LED light source is more suitable for providing short- and medium-range flexible coverage. Furthermore, at the same underwater depth of 2 m, the performance of the power distribution for the received optical signal with the PSO-optimized layout is analyzed for four major seawater types. The results are shown in Figure 7.
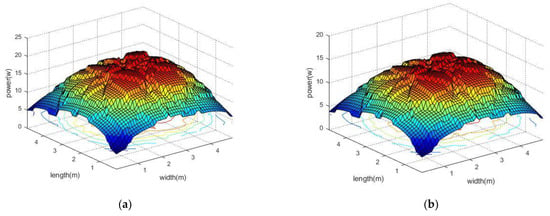
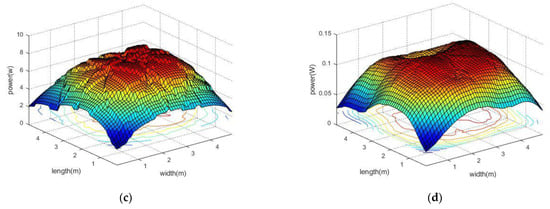
Figure 7.
Power distribution with PSO-optimized layout under different seawater types. (a) Pure seawater; (b) clear seawater; (c) coastal seawater; (d) turbid harbor seawater.
As the turbidity of the seawater increases, the average value of the signal power at the receiver decreases from 13.94 W in clear seawater to 0.1 W in turbid harbor seawater. It can be seen that the average value of the optical power declines with the deterioration of the seawater turbidity. However, compared with traditional LED layouts, the optimized LED layout can still ensure the uniformity of the spatial coverage characteristics at the receiving terminal in the case of high turbidity, which effectively improves the adaptability of the LED light source array to different seawater environments.
Figure 8 shows the power variance curves for three LED array layouts at different depths. It can be seen that the traditional LED array layouts are sensitive to the seawater environment. The uniformity of the power distribution for the received optical signal is affected by different seawater environments, which seriously affects the communication stability of the UWOC system. The PSO-optimized layout can effectively improve the distribution uniformity of the received signals under different seawater types, especially for turbid harbor seawater. When the underwater depth is 2 m, the power variance of the received optical signal is reduced from 5.09 dBm for the rectangular layout and 2.77 dBm for the hybrid layout to 1.26 dBm for the PSO-optimized layout. The influence of the LED array layout on the power distribution of the received optical signal declines as the underwater depth increase. However, the PSO-optimized layout can still induce improvements in the uniformity of signal power distribution. Taking turbid harbor seawater as an example, the received signal powers for the rectangular and hybrid layouts fluctuate from 2.38 dBm to 5.09 dBm and from 1.73 dBm to 2.77 dBm, respectively. In comparison, the power variance of the received optical signal for the PSO-optimized layout varies between 1.16 dBm and 1.28 dBm at different seawater depths. After the optimization, the UWOC system based on the LED light sources realizes more uniform spatial coverage characteristics, which provides the UWOC system with high dynamic mobility and greater robustness in complex seawater environments.
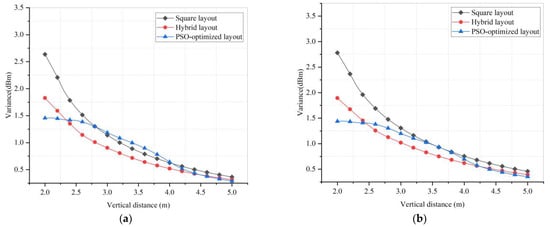
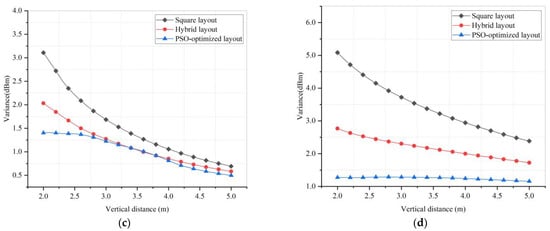
Figure 8.
Power variance curves for three LED array layouts at different underwater depths. (a) Pure seawater; (b) clear seawater; (c) coastal seawater; (d) turbid harbor seawater.
5. Conclusions
In this paper, an optimized scheme based on an LED array is proposed for achieving spatial uniform coverage of the received optical signals in the UWOC system. According to the size of the underwater spatial coverage area, the pitch angle of the LED light source is first optimized by its beam geometry to enhance the irradiance uniformity of the received optical signal. Moreover, the adaptation function of the PSO algorithm is improved to realize the joint optimization of the array layout and the horizontal deflection angle of the LED. Finally, taking a 16-LED array as an example, the spatial coverage performance of the PSO-optimized layout is analyzed in detail. Compared with the traditional layouts of the LED array, the power variance of the received optical signal at different underwater depths is significantly improved, which effectively guarantees the uniformity of the underwater optical signal’s coverage in short- and medium-range communication. For the spatial coverage characteristics in the context of different seawater types, the analysis results demonstrate that the PSO-optimized layout can reduce the power variance fluctuation of the received optical signal and improve the robustness of the system, which is of great significance in the application of UWOC technology to provide a highly dynamic and regional communication mechanism for underwater multi-agents. Considering the complexity of the underwater channel environments, further experimental verification systems should be established, and the impact of dynamic changes in underwater channels such as bubbles and disturbances on the coverage characteristics of the light sources can also be investigated.
Author Contributions
Conceptualization, A.L. and Y.Y.; formal analysis, A.L., Y.Y. and H.Z.; methodology, A.L.; software, A.L. and Y.Y.; validation, A.L., H.Y. and X.F.; writing—original draft, A.L. and Y.Y.; writing—review and editing, H.Y. and X.F.; visualization, A.L. and Y.Y.; supervision, A.L.; project administration, A.L. and X.F.; funding acquisition, A.L. and X.F. All authors have read and agreed to the published version of the manuscript.
Funding
This work is supported in part by the China Postdoctoral Science Foundation under Grant 2019M651095 and the National Natural Science Foundation of China under Grant 62176037.
Data Availability Statement
The data presented in this paper are available from the corresponding author.
Acknowledgments
The authors would like to thank the anonymous reviewers for their careful reading and valuable comments.
Conflicts of Interest
The authors declare no conflict of interest.
References
- Ali, M.F.; Jayakody, N.K.D.; Chursin, Y.; Affes, S.; Dmitry, S. Recent advances and future directions on underwater wireless communications. Arch. Comput. Methods Eng. 2020, 27, 1379–1412. [Google Scholar] [CrossRef]
- Alexakis, C.; Tsabaris, C. Design of an interactive cellular system for the remote operation of ocean sensors: A pilot study integrating radioactivity sensors. J. Mar. Sci. Eng. 2021, 9, 910. [Google Scholar] [CrossRef]
- Liu, A.; Zhang, R.; Lin, B.; Yin, H. Multi-degree-of-freedom for underwater optical wireless communication with improved transmission performance. J. Mar. Sci. Eng. 2023, 11, 48. [Google Scholar] [CrossRef]
- Connor, J.; Champion, B.; Joordens, M.A. Current algorithms, communication methods and designs for underwater swarm robotics: A review. IEEE Sens. J. 2020, 21, 153–169. [Google Scholar] [CrossRef]
- Wang, C.-N.; Yang, F.-C.; Vo, N.T.M.; Nguyen, V.T.T. Wireless communications for data security: Efficiency assessment of cybersecurity industry—A promising application for UAVs. Drones 2022, 6, 363. [Google Scholar] [CrossRef]
- Zhu, S.; Chen, X.; Liu, X.; Zhang, G.; Tian, P. Recent progress in and perspectives of underwater wireless optical communication. Prog. Quantum Electron. 2020, 73, 100274. [Google Scholar] [CrossRef]
- Li, S.; Qu, W.; Liu, C.; Qiu, T.; Zhao, Z. Survey on high reliability wireless communication for underwater sensor networks. J. Netw. Comput. Appl. 2019, 148, 102446. [Google Scholar] [CrossRef]
- Duntley, S.Q. Light in the sea. J. Opt. Soc. Am. 1963, 53, 214–234. [Google Scholar] [CrossRef]
- Gilbert, G.D.; Stoner, T.R.; Jernigan, J.L. Underwater experiments on the polarization, coherence and scattering properties of a Pulsed Blue-Green Laser. In Underwater Photo Optics I; SPIE: Bellingham, WA, USA, 1966; Volume 7, pp. 8–14. [Google Scholar]
- Zeng, Z.; Fu, S.; Zhang, H.; Dong, Y.; Cheng, J. A survey of underwater optical wireless communications. IEEE Commun. Surv. Tutor. 2017, 19, 204–238. [Google Scholar] [CrossRef]
- Ding, J.; Huang, Z.; Ji, Y. Evolutionary algorithm based power coverage optimization for visible light communications. IEEE Commun. Lett. 2012, 16, 439–441. [Google Scholar] [CrossRef]
- Liu, H.; Lin, Z.; Xu, Y.; Chen, Y.; Pu, X. Coverage uniformity with improved genetic simulated annealing algorithm for indoor Visible Light Communications. Opt. Commun. 2019, 439, 156–163. [Google Scholar] [CrossRef]
- Varma, G.P.; Sushma, R.; Sharma, V.; Kumar, A.; Sharma, G.V.V. Power allocation for uniform illumination with stochastic LED arrays. Opt. Express 2017, 25, 8659–8669. [Google Scholar] [CrossRef] [PubMed]
- Varma, G.P. Optimum power allocation for uniform illuminance in indoor visible light communication. Opt. Express 2018, 26, 8679–8689. [Google Scholar] [CrossRef] [PubMed]
- Liu, H.; Wang, X.; Chen, Y.; Kong, D.; Xia, P. Optimization lighting layout based on gene density improved genetic algorithm for indoor visible light communications. Opt. Commun. 2017, 390, 76–81. [Google Scholar] [CrossRef]
- Wang, J.; Xu, A.; Ju, J.; Guo, L. Optimization lighting layout of indoor visible light communication system based on improved artificial fish swarm algorithm. J. Opt. 2020, 22, 035701. [Google Scholar]
- Chen, Q.; Zhang, T.; Zheng, W. Optimization of LED layout to improve uniformity of illumination and SNR for indoor visible light communication. In Proceedings of the 2018 28th International Telecommunication Networks and Applications Conference (ITNAC), Sydney, Australia, 21–23 November 2018; pp. 1–3. [Google Scholar]
- Huang, L.; Wang, P.; Wang, J.; Chi, S.; Niu, S.; Nan, X.; Che, H. Optimized design of the light source for an indoor visible light communication system based on an improved bat algorithm. Appl. Opt. 2020, 59, 10638–10644. [Google Scholar] [CrossRef]
- Wei, Z.; Hu, H.; Huang, H. Optimization of location, power allocation and orientation for lighting lamps in a visible light communication system using the firefly algorithm. Opt. Express 2021, 29, 8796–8808. [Google Scholar] [CrossRef]
- Johnson, L.; Green, R.; Leeson, M. A survey of channel models for underwater optical wireless communication. In Proceedings of the 2013 2nd International Workshop on Optical Wireless Communications (IWOW), Newcastle Upon Tyne, UK, 21 October 2013; pp. 1–5. [Google Scholar]
- Uddin, M.S.; Cha, J.S.; Kim, J.Y.; Jang, Y.M. Mitigation technique for receiver performance variation of multi-color channels in visible light communication. Sensors 2011, 11, 6131–6144. [Google Scholar] [CrossRef]
- Kong, M.; Wang, J.; Chen, Y.; Ali, T.; Sarwar, R.; Qiu, Y.; Wang, S.; Han, J.; Xu, J. Security weaknesses of underwater wireless optical communication. Opt. Express 2017, 25, 21509–21518. [Google Scholar] [CrossRef]
- Kaushal, H.; Kaddoum, G. Underwater optical wireless communication. IEEE Access 2016, 4, 1518–1547. [Google Scholar] [CrossRef]
- Gabriel, C.; Khalighi, M.; Bourennane, S.; Léon, P.; Rigaud, V. Monte-Carlo-based channel characterization for underwater optical communication systems. J. Opt. Commun. Netw. 2013, 5, 1–12. [Google Scholar] [CrossRef]
- Engelbrecht, A.P. Computational Intelligence: An Introduction; Wiley: Hoboken, NJ, USA, 2007. [Google Scholar]
- Shi, Y.; Eberhart, R.C. Empirical study of particle swarm optimization. In Proceedings of the Congress on Evolutionary Computation, CEC ‘99, Washington, DC, USA, 6–9 July 1999; pp. 1945–1950. [Google Scholar]
Disclaimer/Publisher’s Note: The statements, opinions and data contained in all publications are solely those of the individual author(s) and contributor(s) and not of MDPI and/or the editor(s). MDPI and/or the editor(s) disclaim responsibility for any injury to people or property resulting from any ideas, methods, instructions or products referred to in the content. |
© 2023 by the authors. Licensee MDPI, Basel, Switzerland. This article is an open access article distributed under the terms and conditions of the Creative Commons Attribution (CC BY) license (https://creativecommons.org/licenses/by/4.0/).