
Selecting Appropriate Energy Source Options for an Arctic Research Ship

 , , and
Abstract
1. Introduction
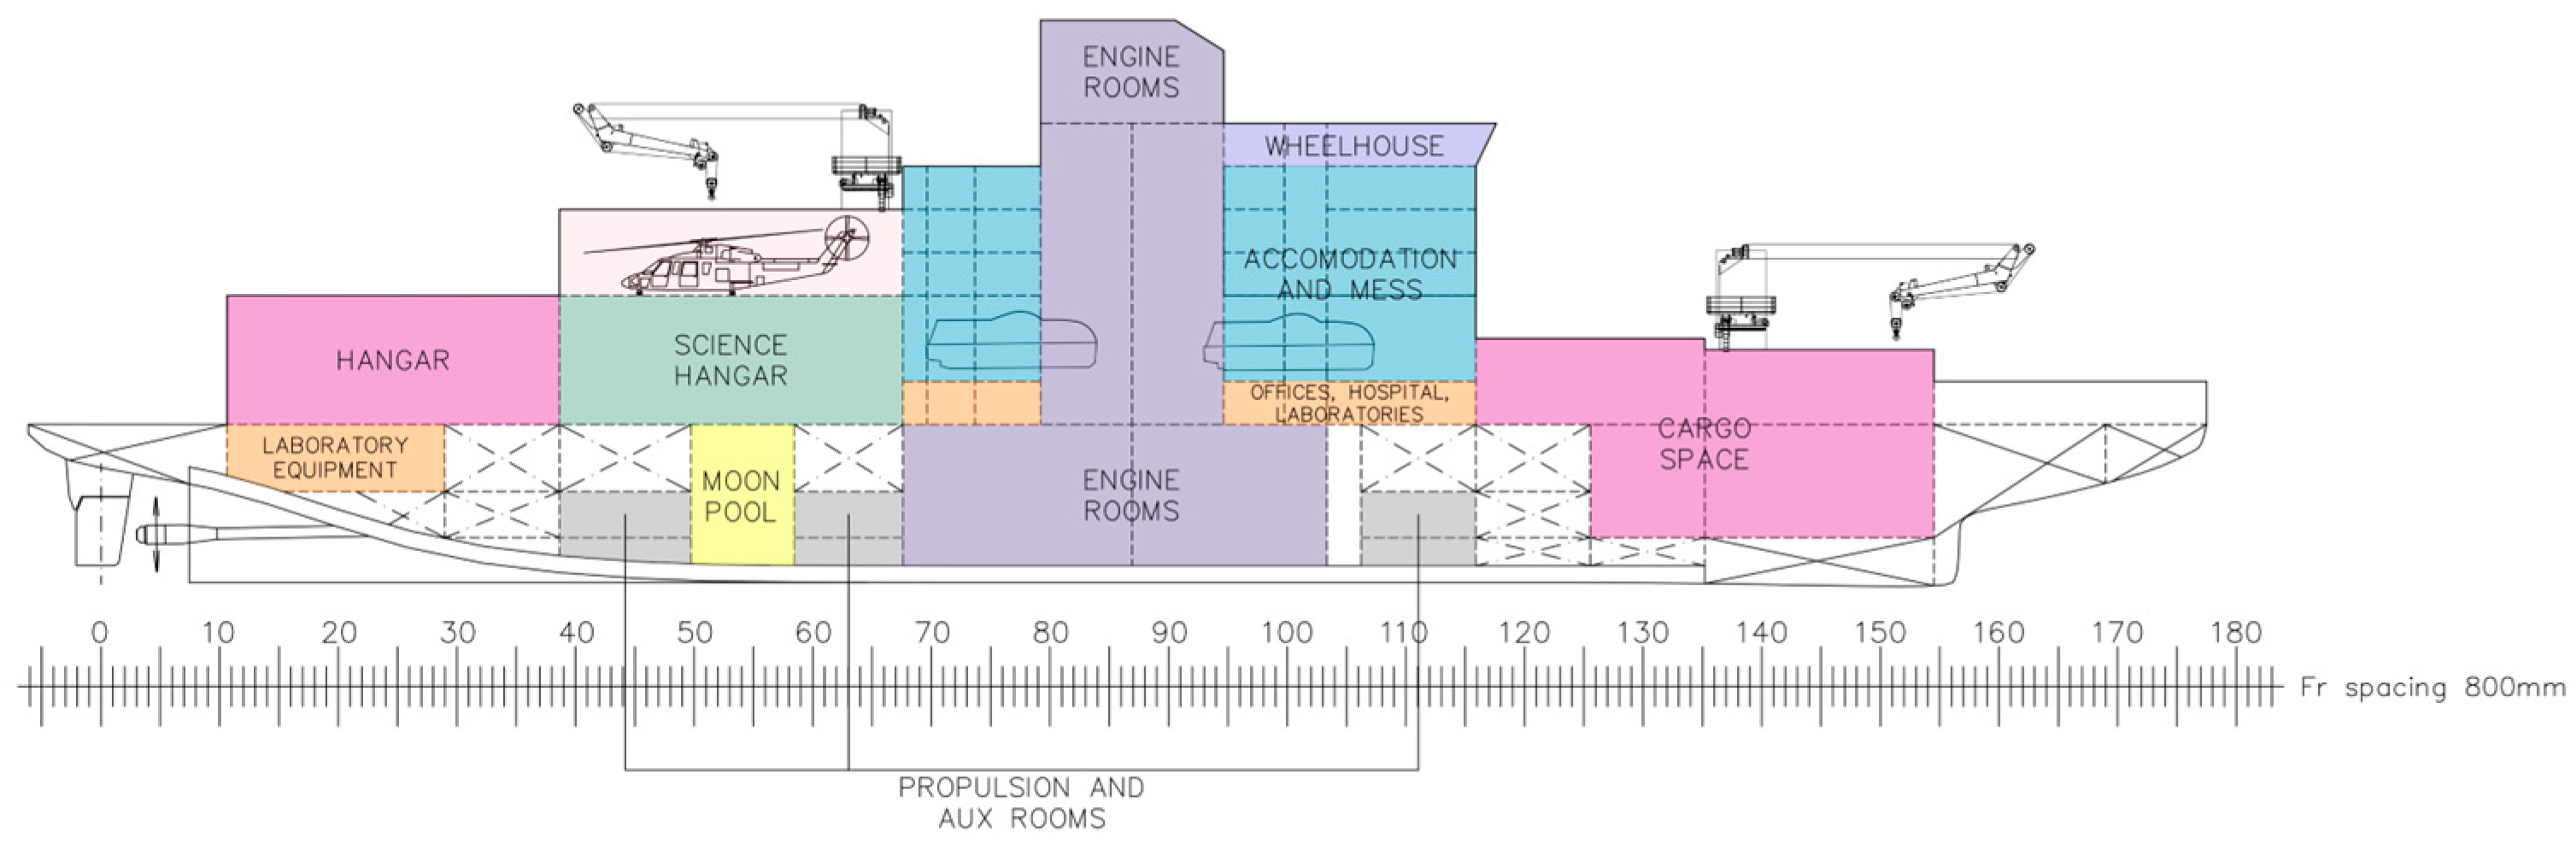
2. The Considered Ship
2.1. Ship Characteristics and Operational Profile
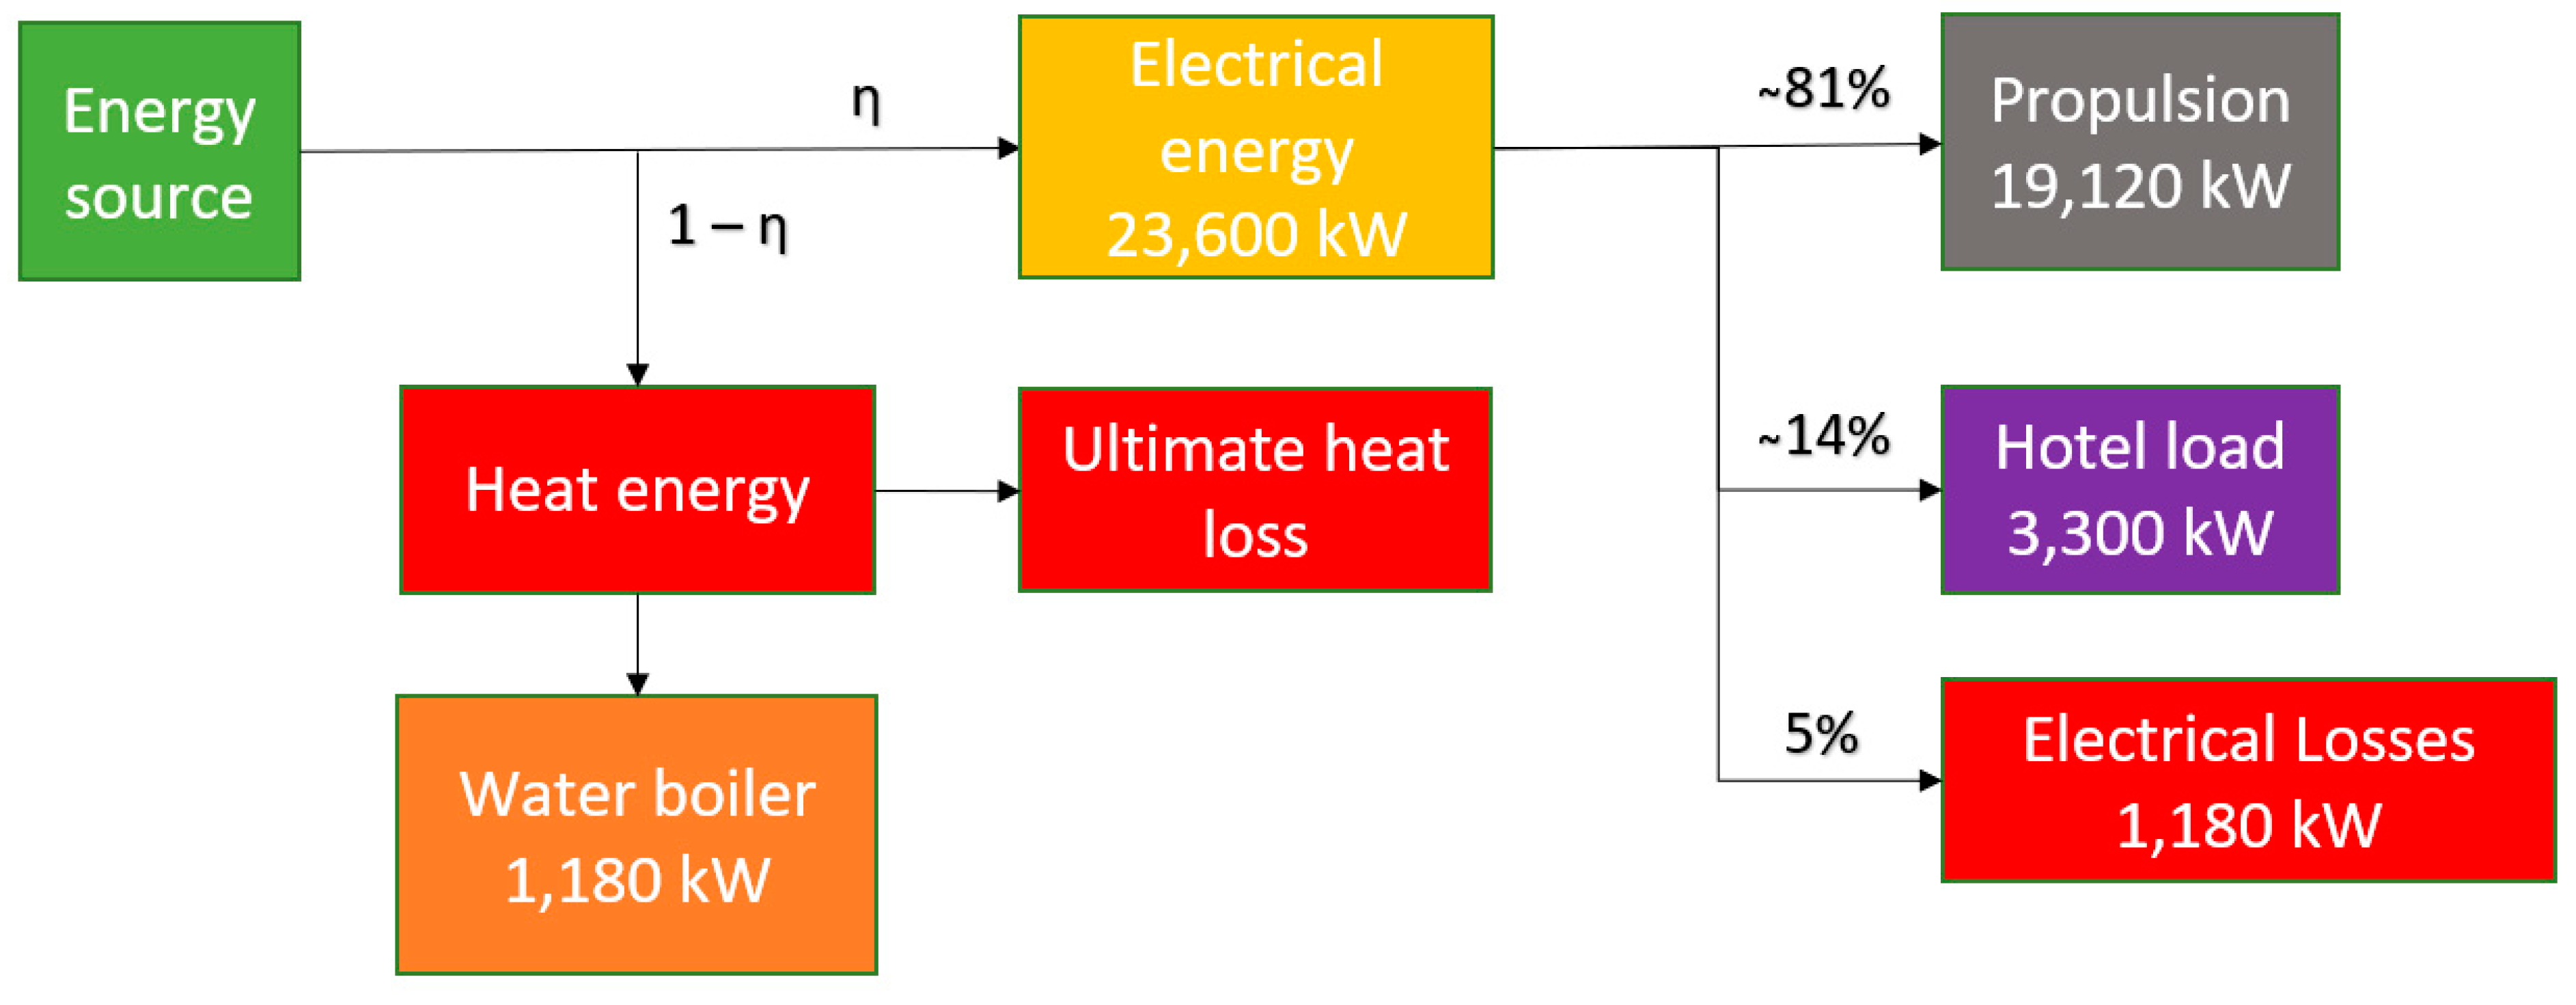
2.2. Considered Propulsion Options and Power Flow
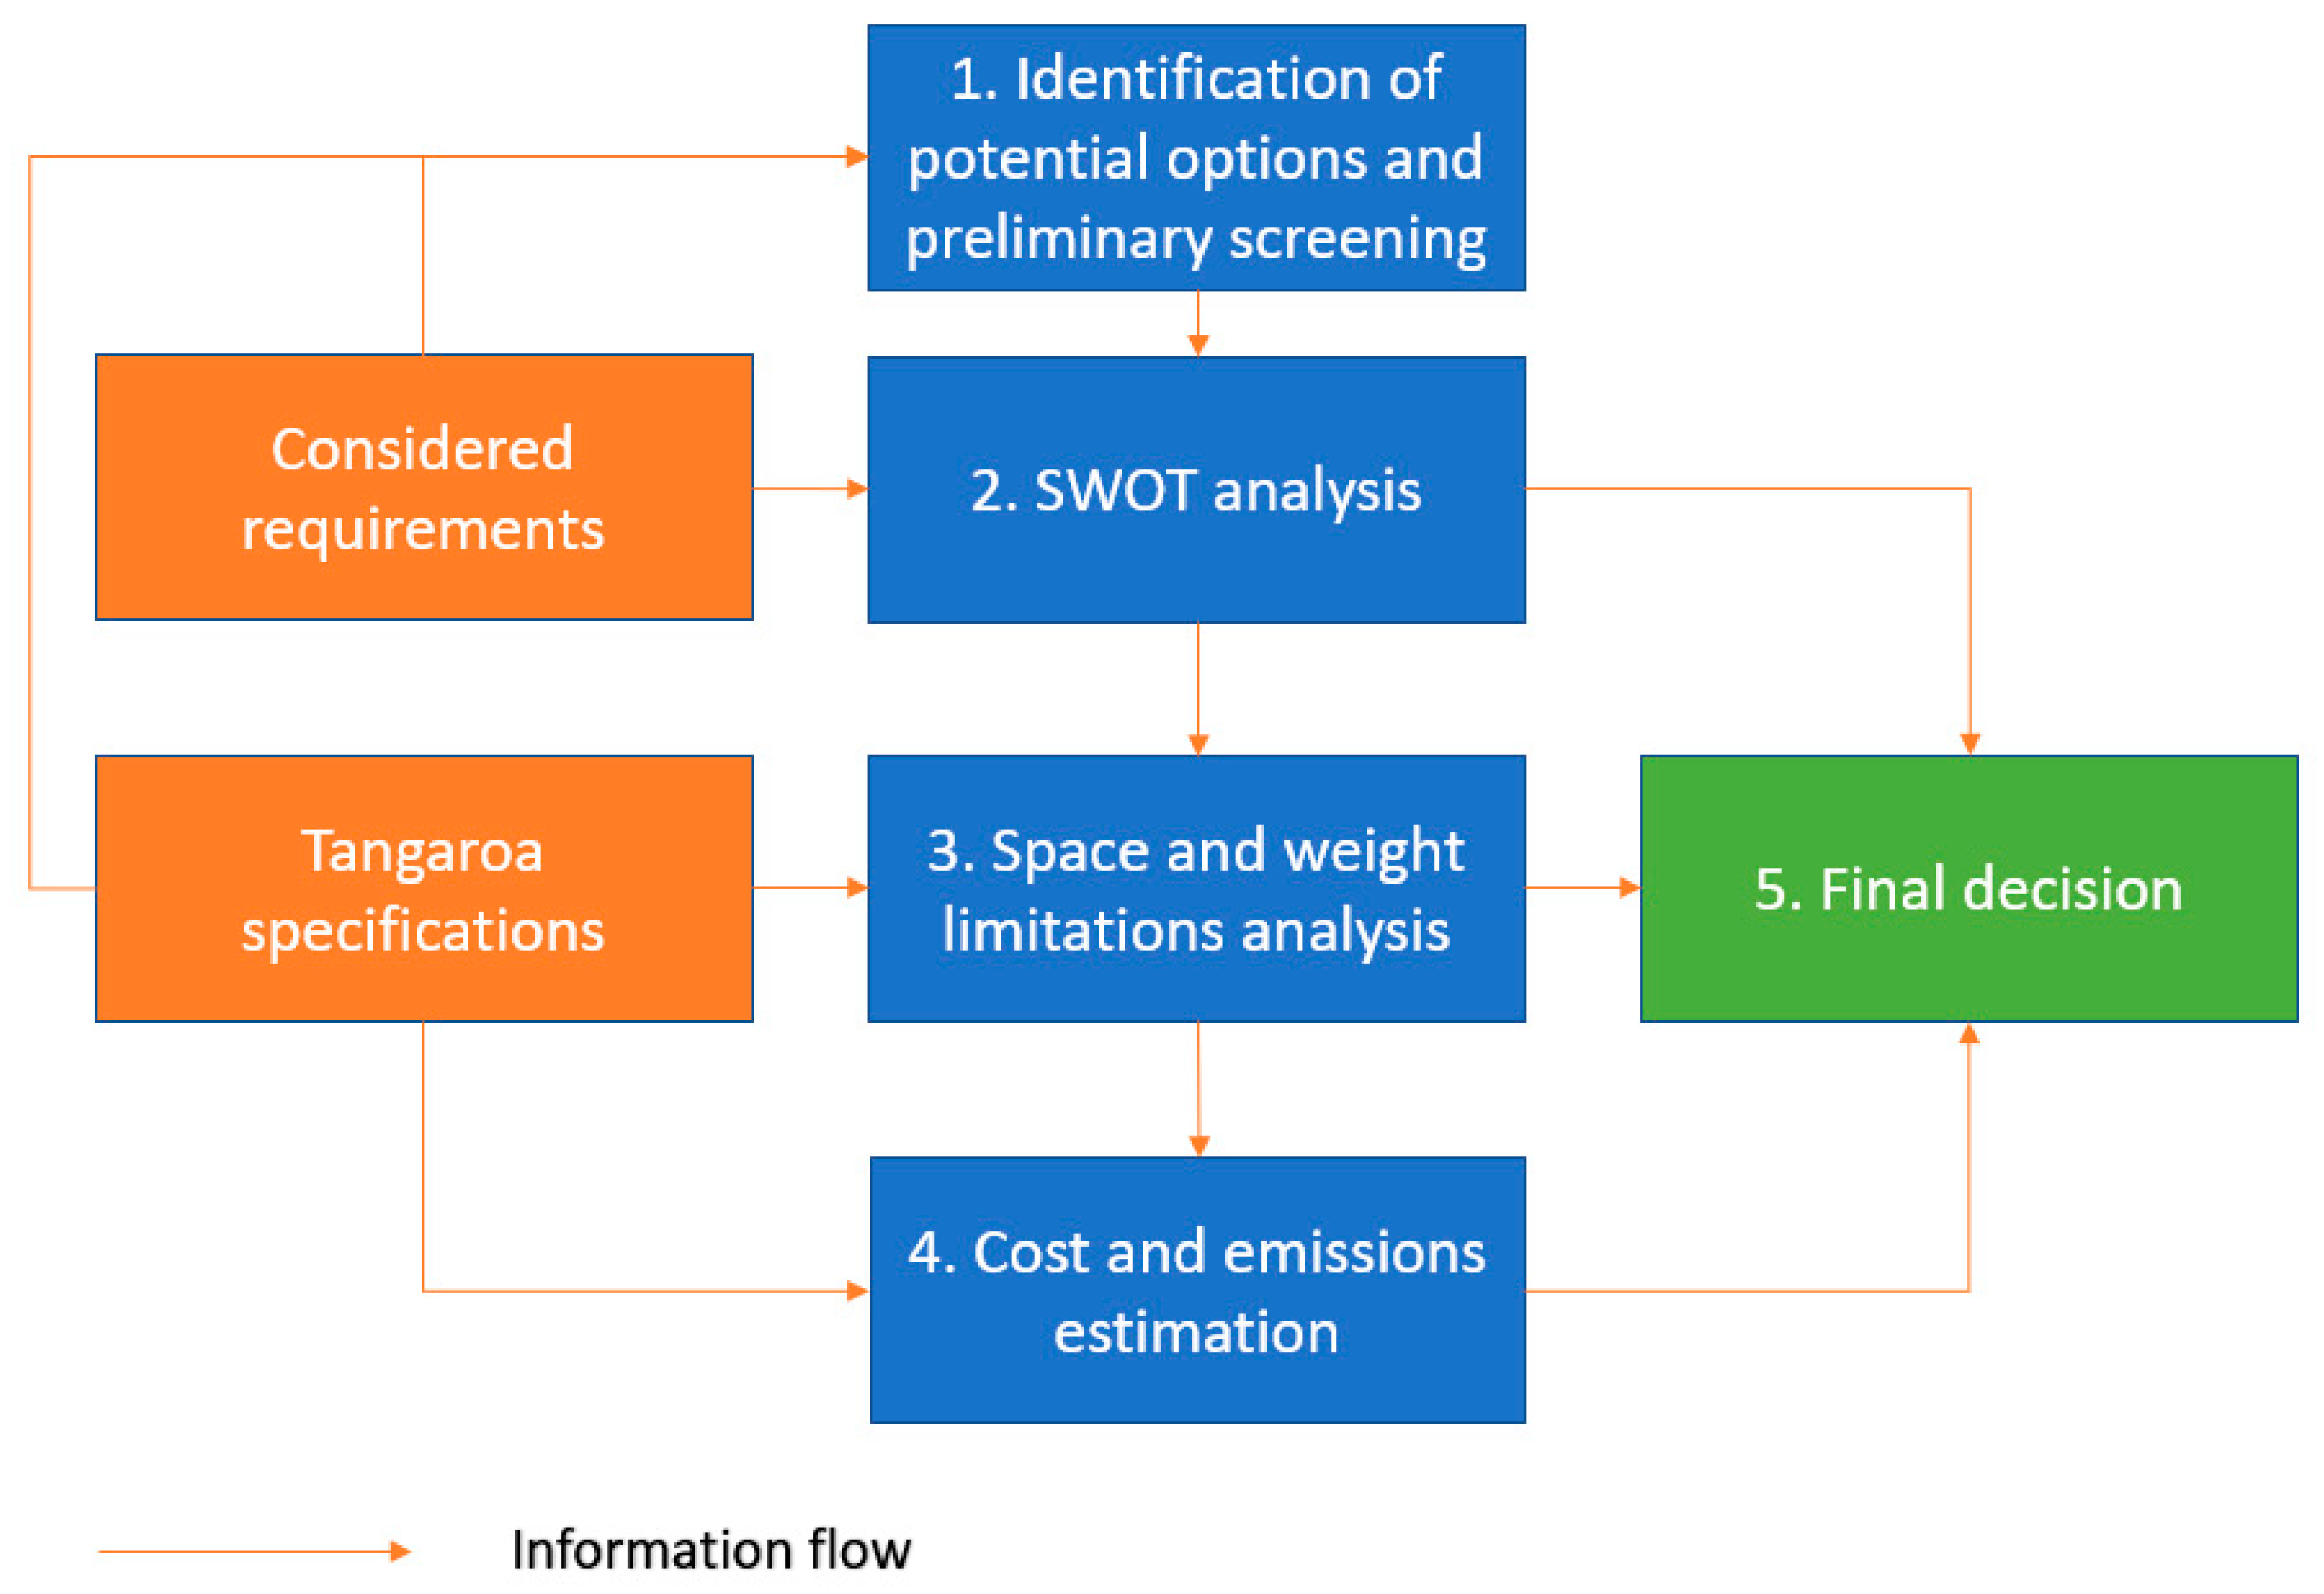
3. Research Methodology
- Endurance and energy capacity for operations.
- The technology maturity and regulatory readiness for technology acceptance.
- Infrastructure readiness and fuel availability.
- Security of fuel supply.
- The capital, operational, and life cycle costs.
- Reliability, maintainability, availability, and safety aspects (RAMS).
- Emission of toxic and greenhouse gases.
- Potential external threats and opportunities.
- Impact on company reputation.
- Other aspects affecting wellbeing and ergonomics such as vibrations and automation.
- Weight and space limitations.
- Impact on ship stability and ship manoeuvrability.
3.1. Step 1: Identification of Potential Energy Sources and Elimination of the Unrealistic Ones
3.2. Step 2: SWOT Analysis Considering Operation in the Arctic
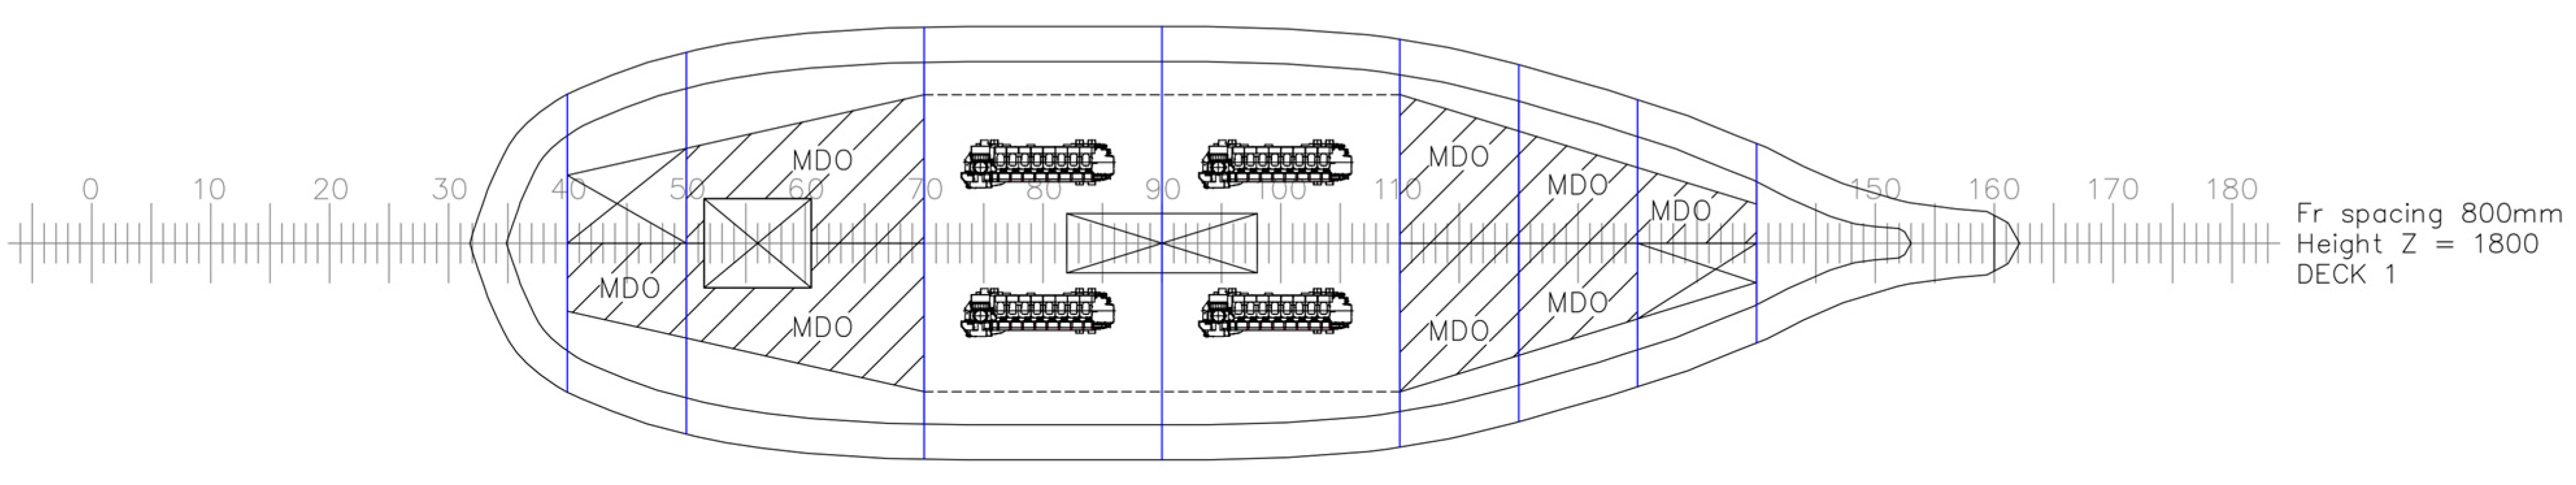
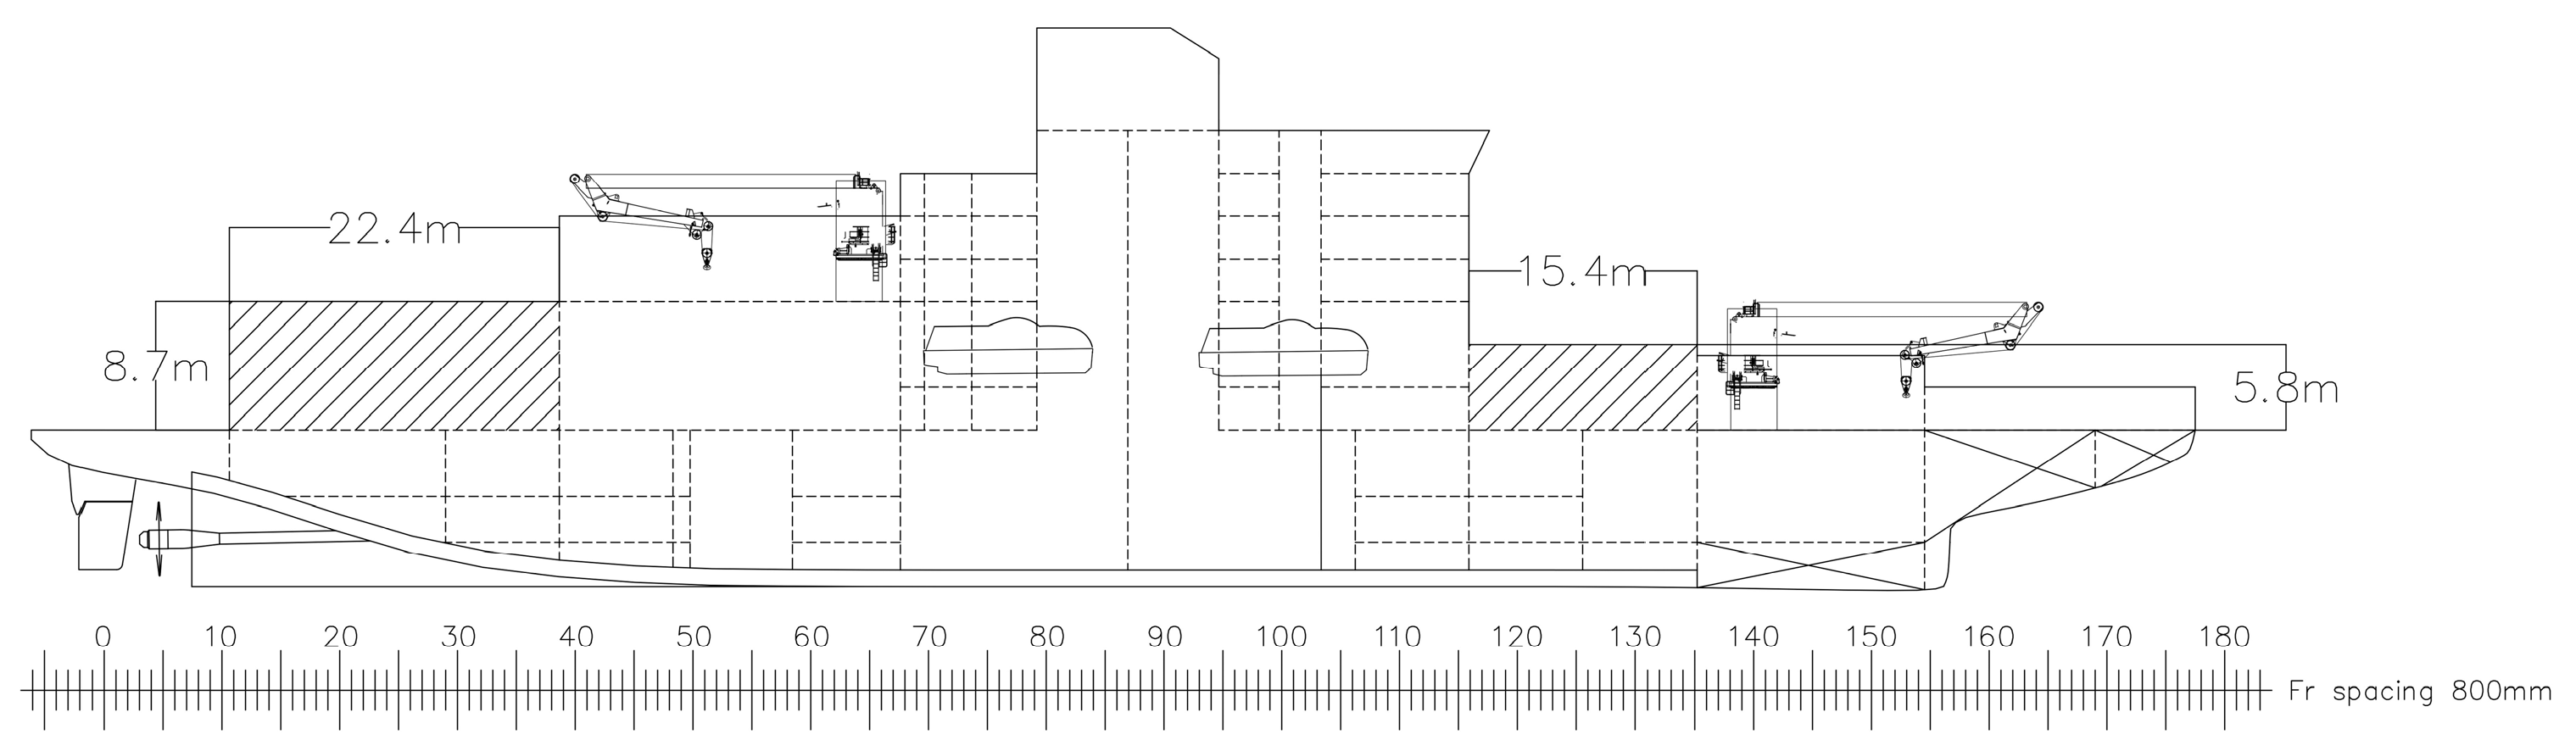
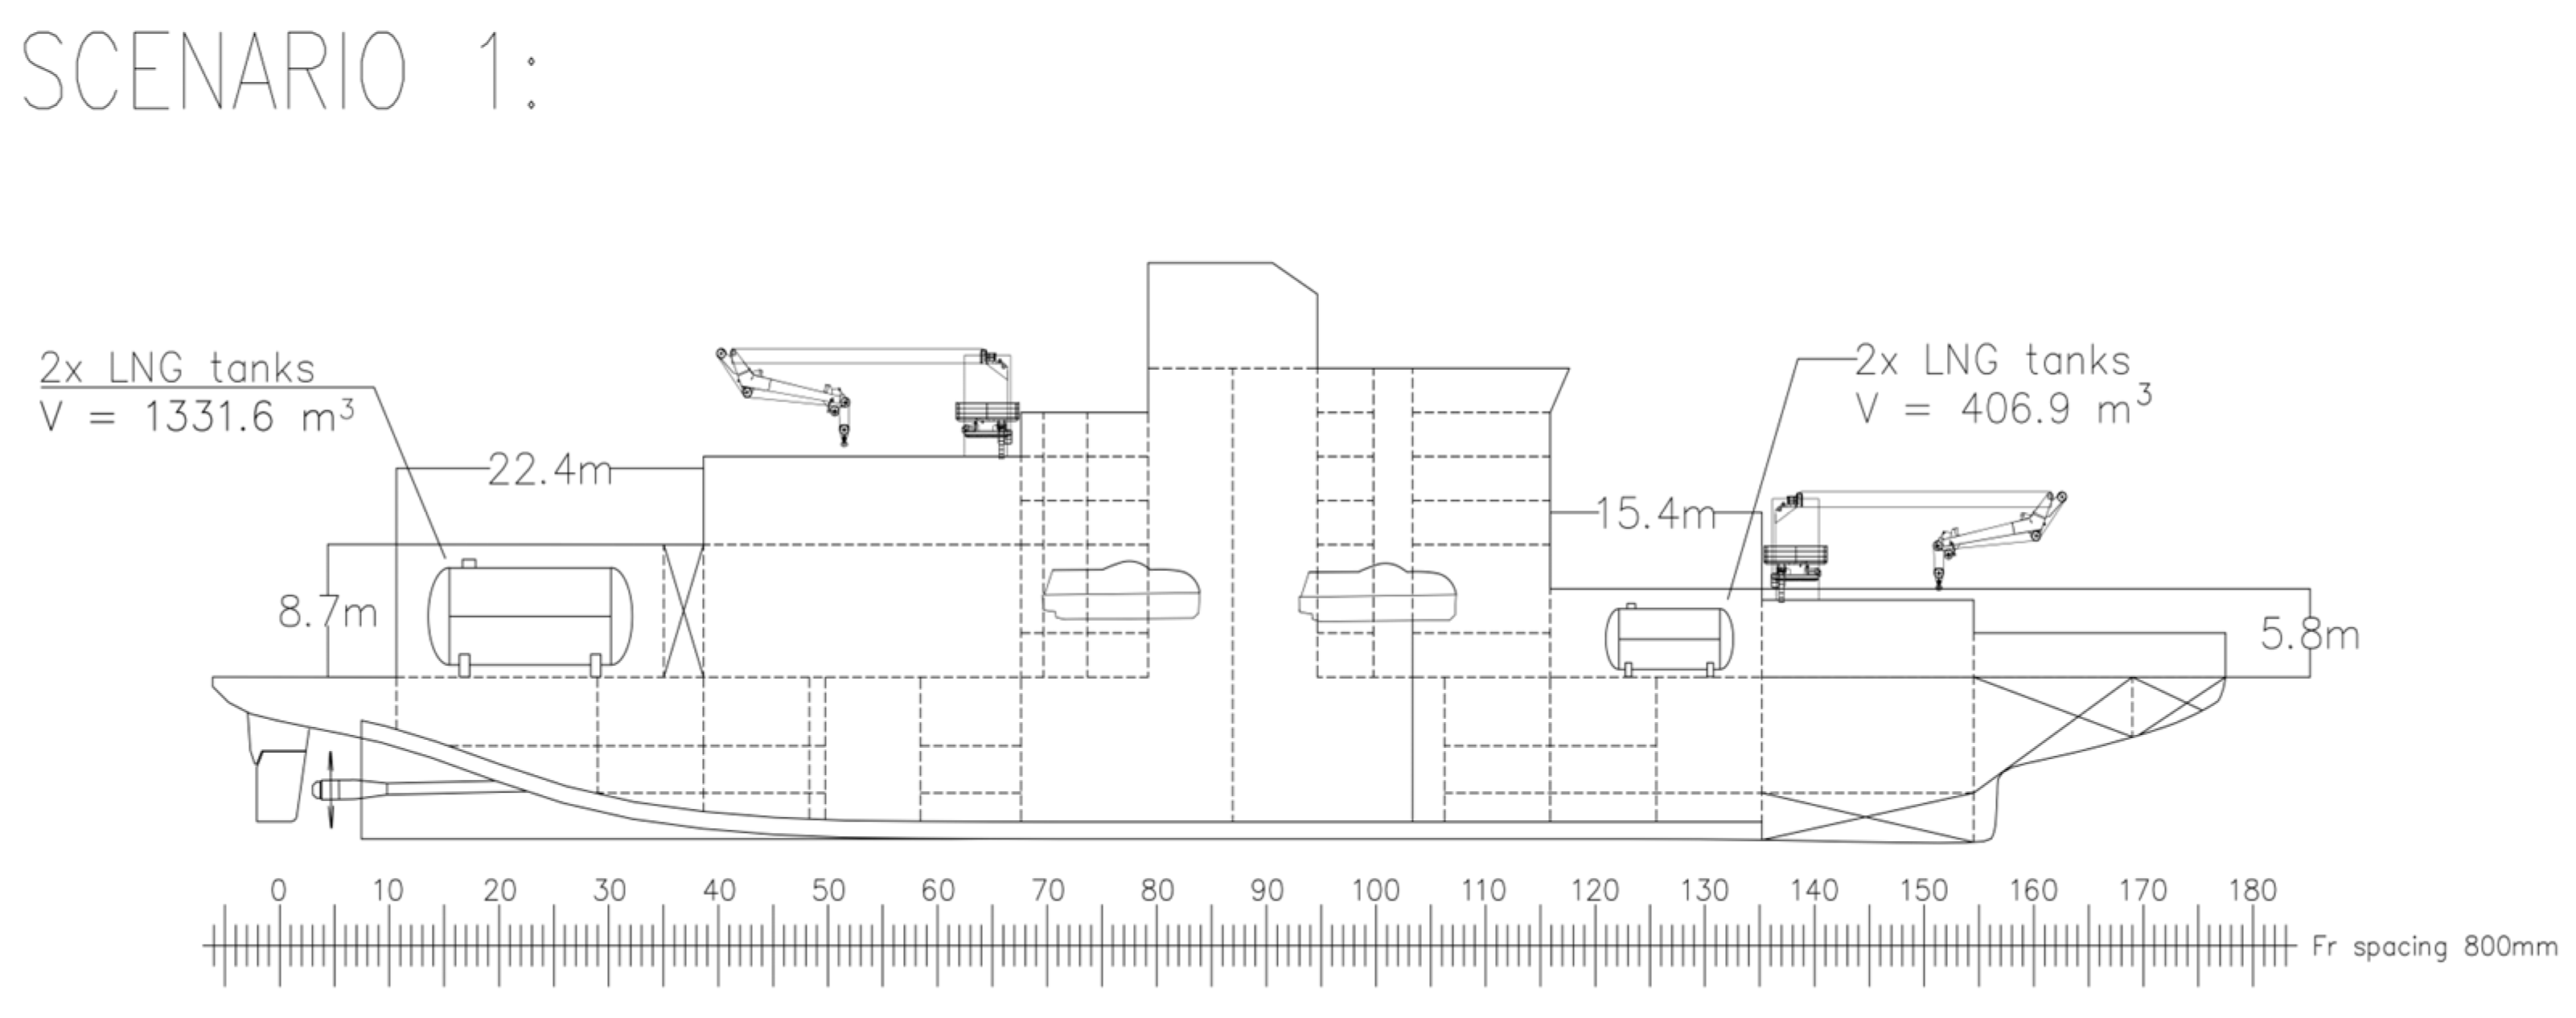
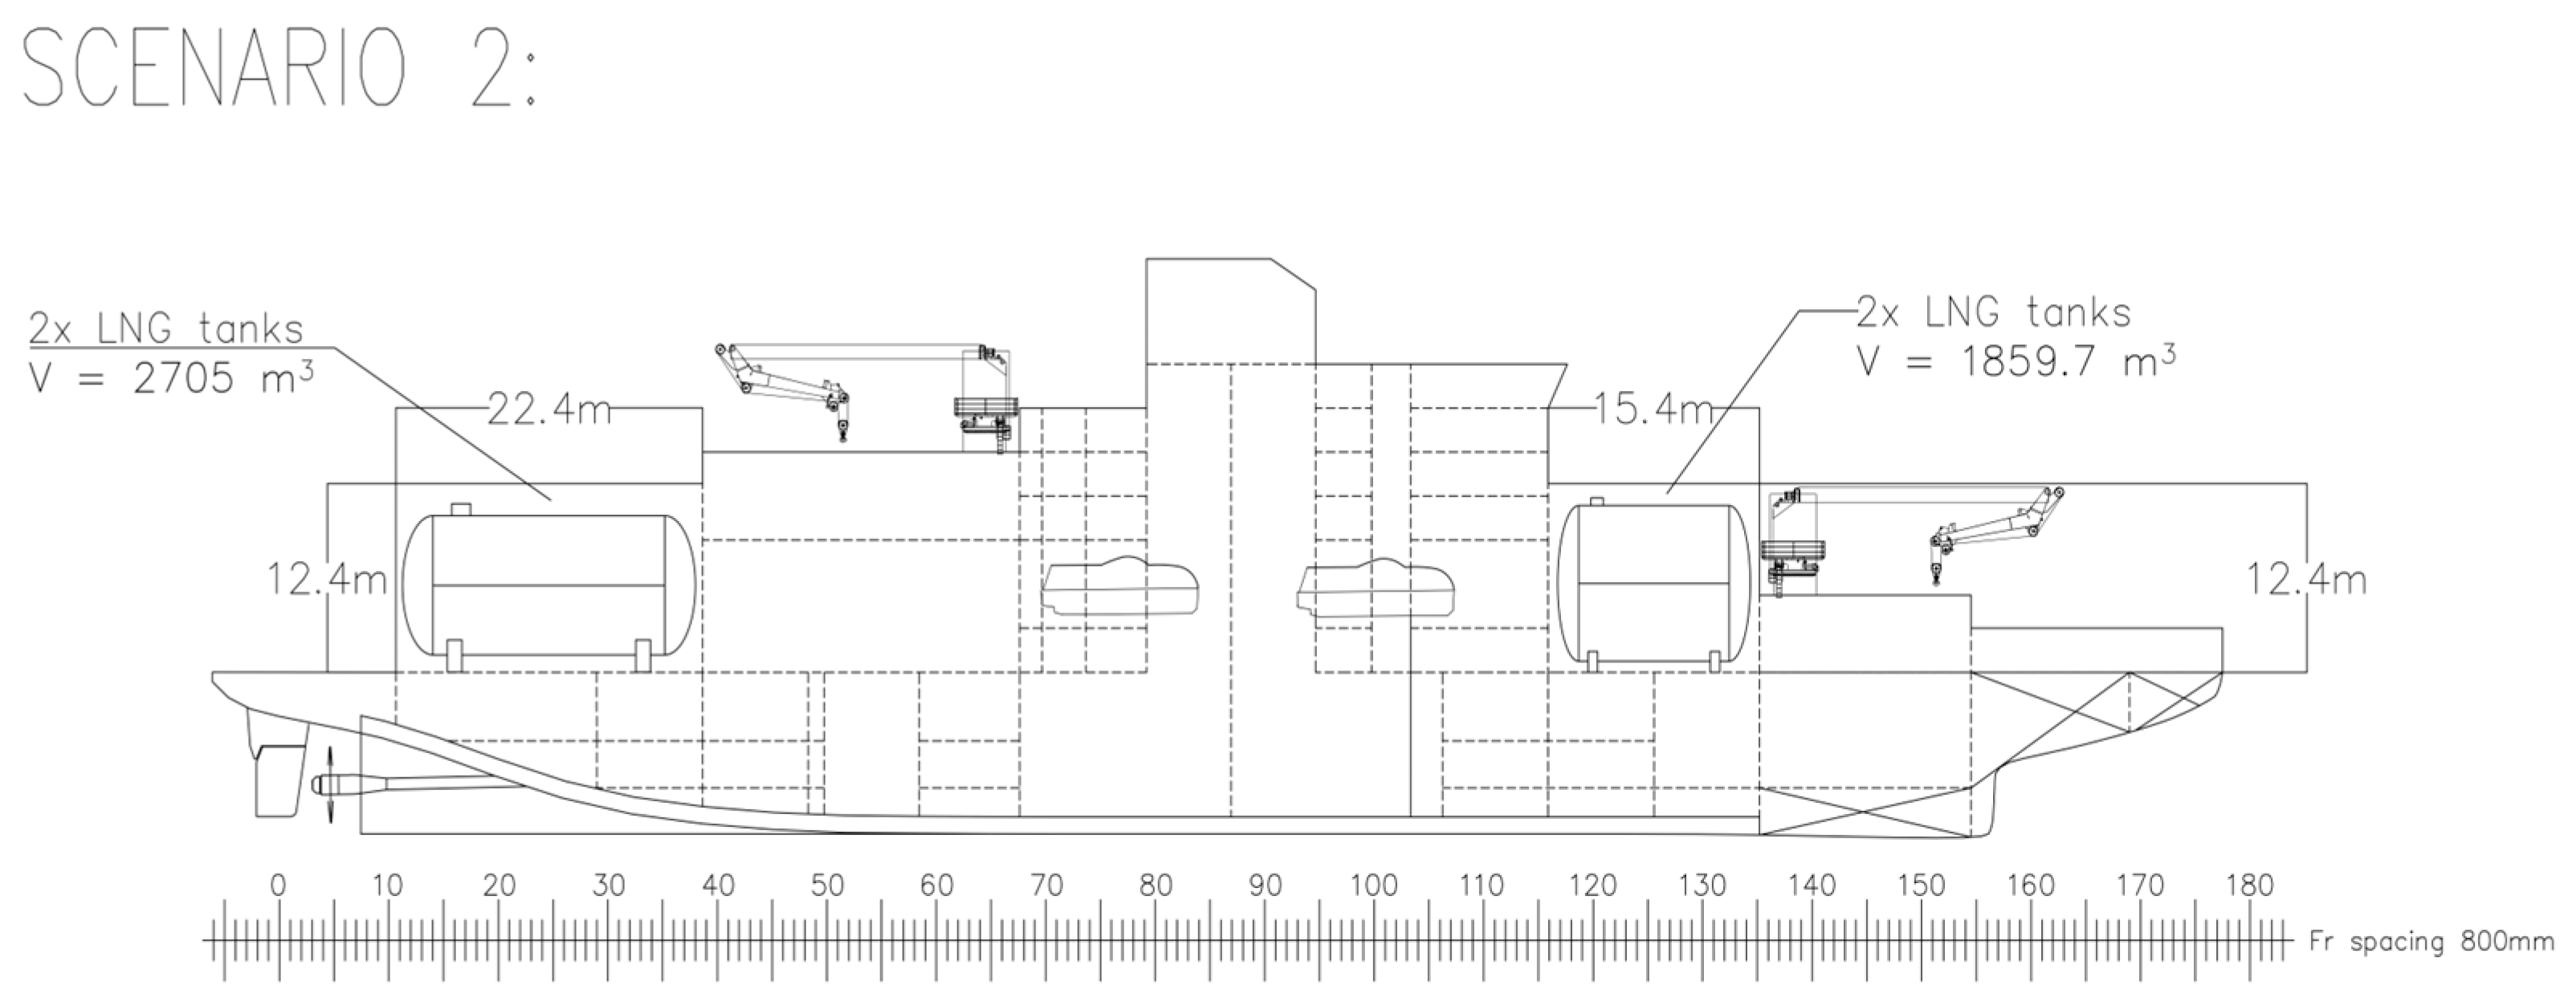
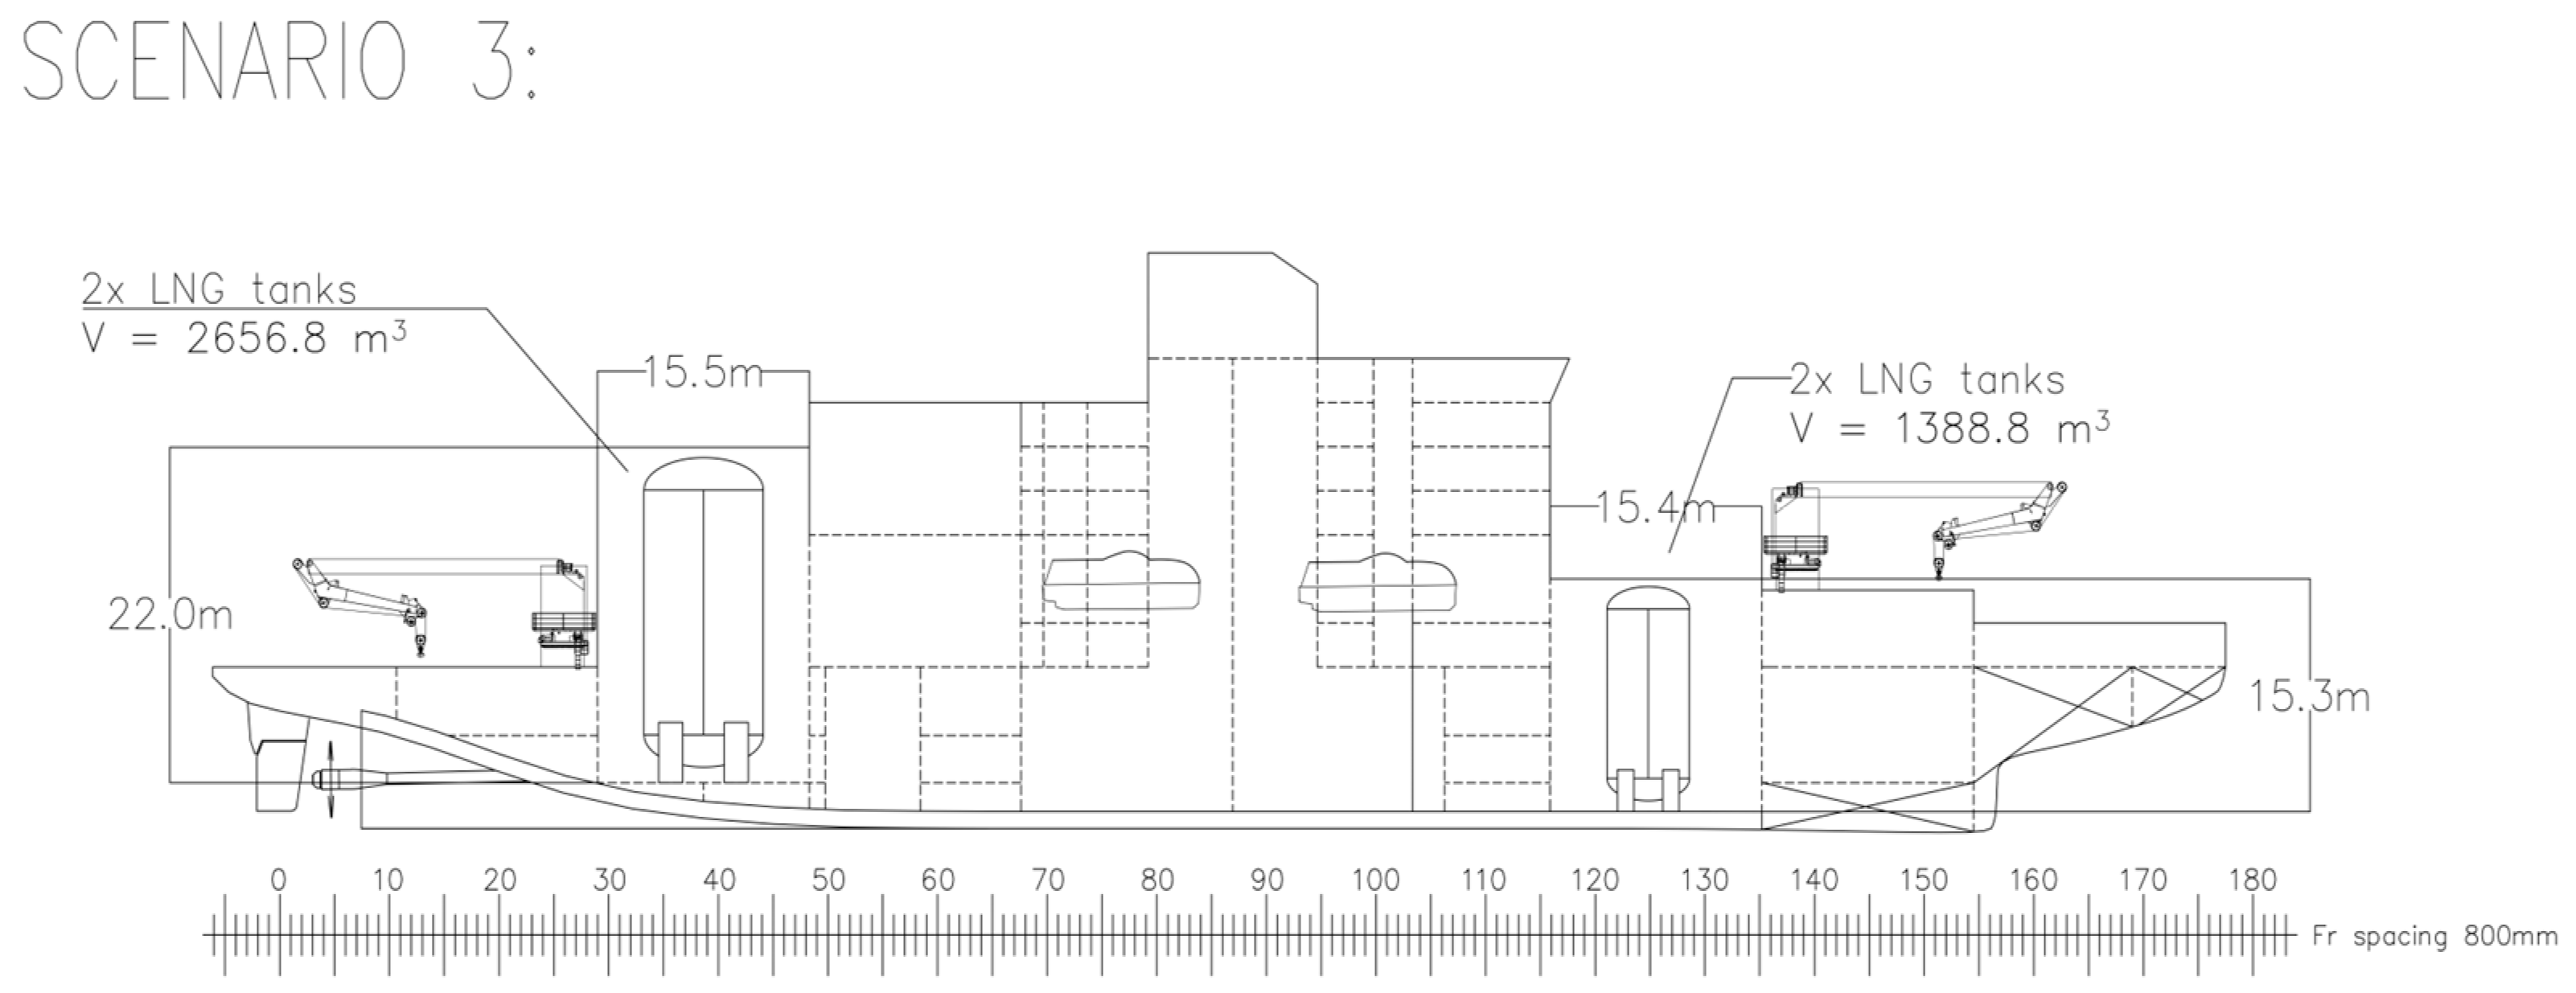
3.3. Step 3: Energy Storage Weight and Volume Analysis
3.4. Step 4: Calculation of Life Cycle Costs and CO2 Emissions
3.5. Step 5: Selection of the Energy Source
4. Results
4.1. Step 1: Identification of Potential Energy Sources and Their Properties
4.2. Step 2: SWOT Analysis
4.3. Step 3: Energy Storage Weight and Volume Analysis
4.4. Step 4: Calculation of Life Cycle Costs and CO2 Emissions
4.5. Step 5: Selection of the Energy Source
4.6. Discussion and Limitations
5. Conclusions
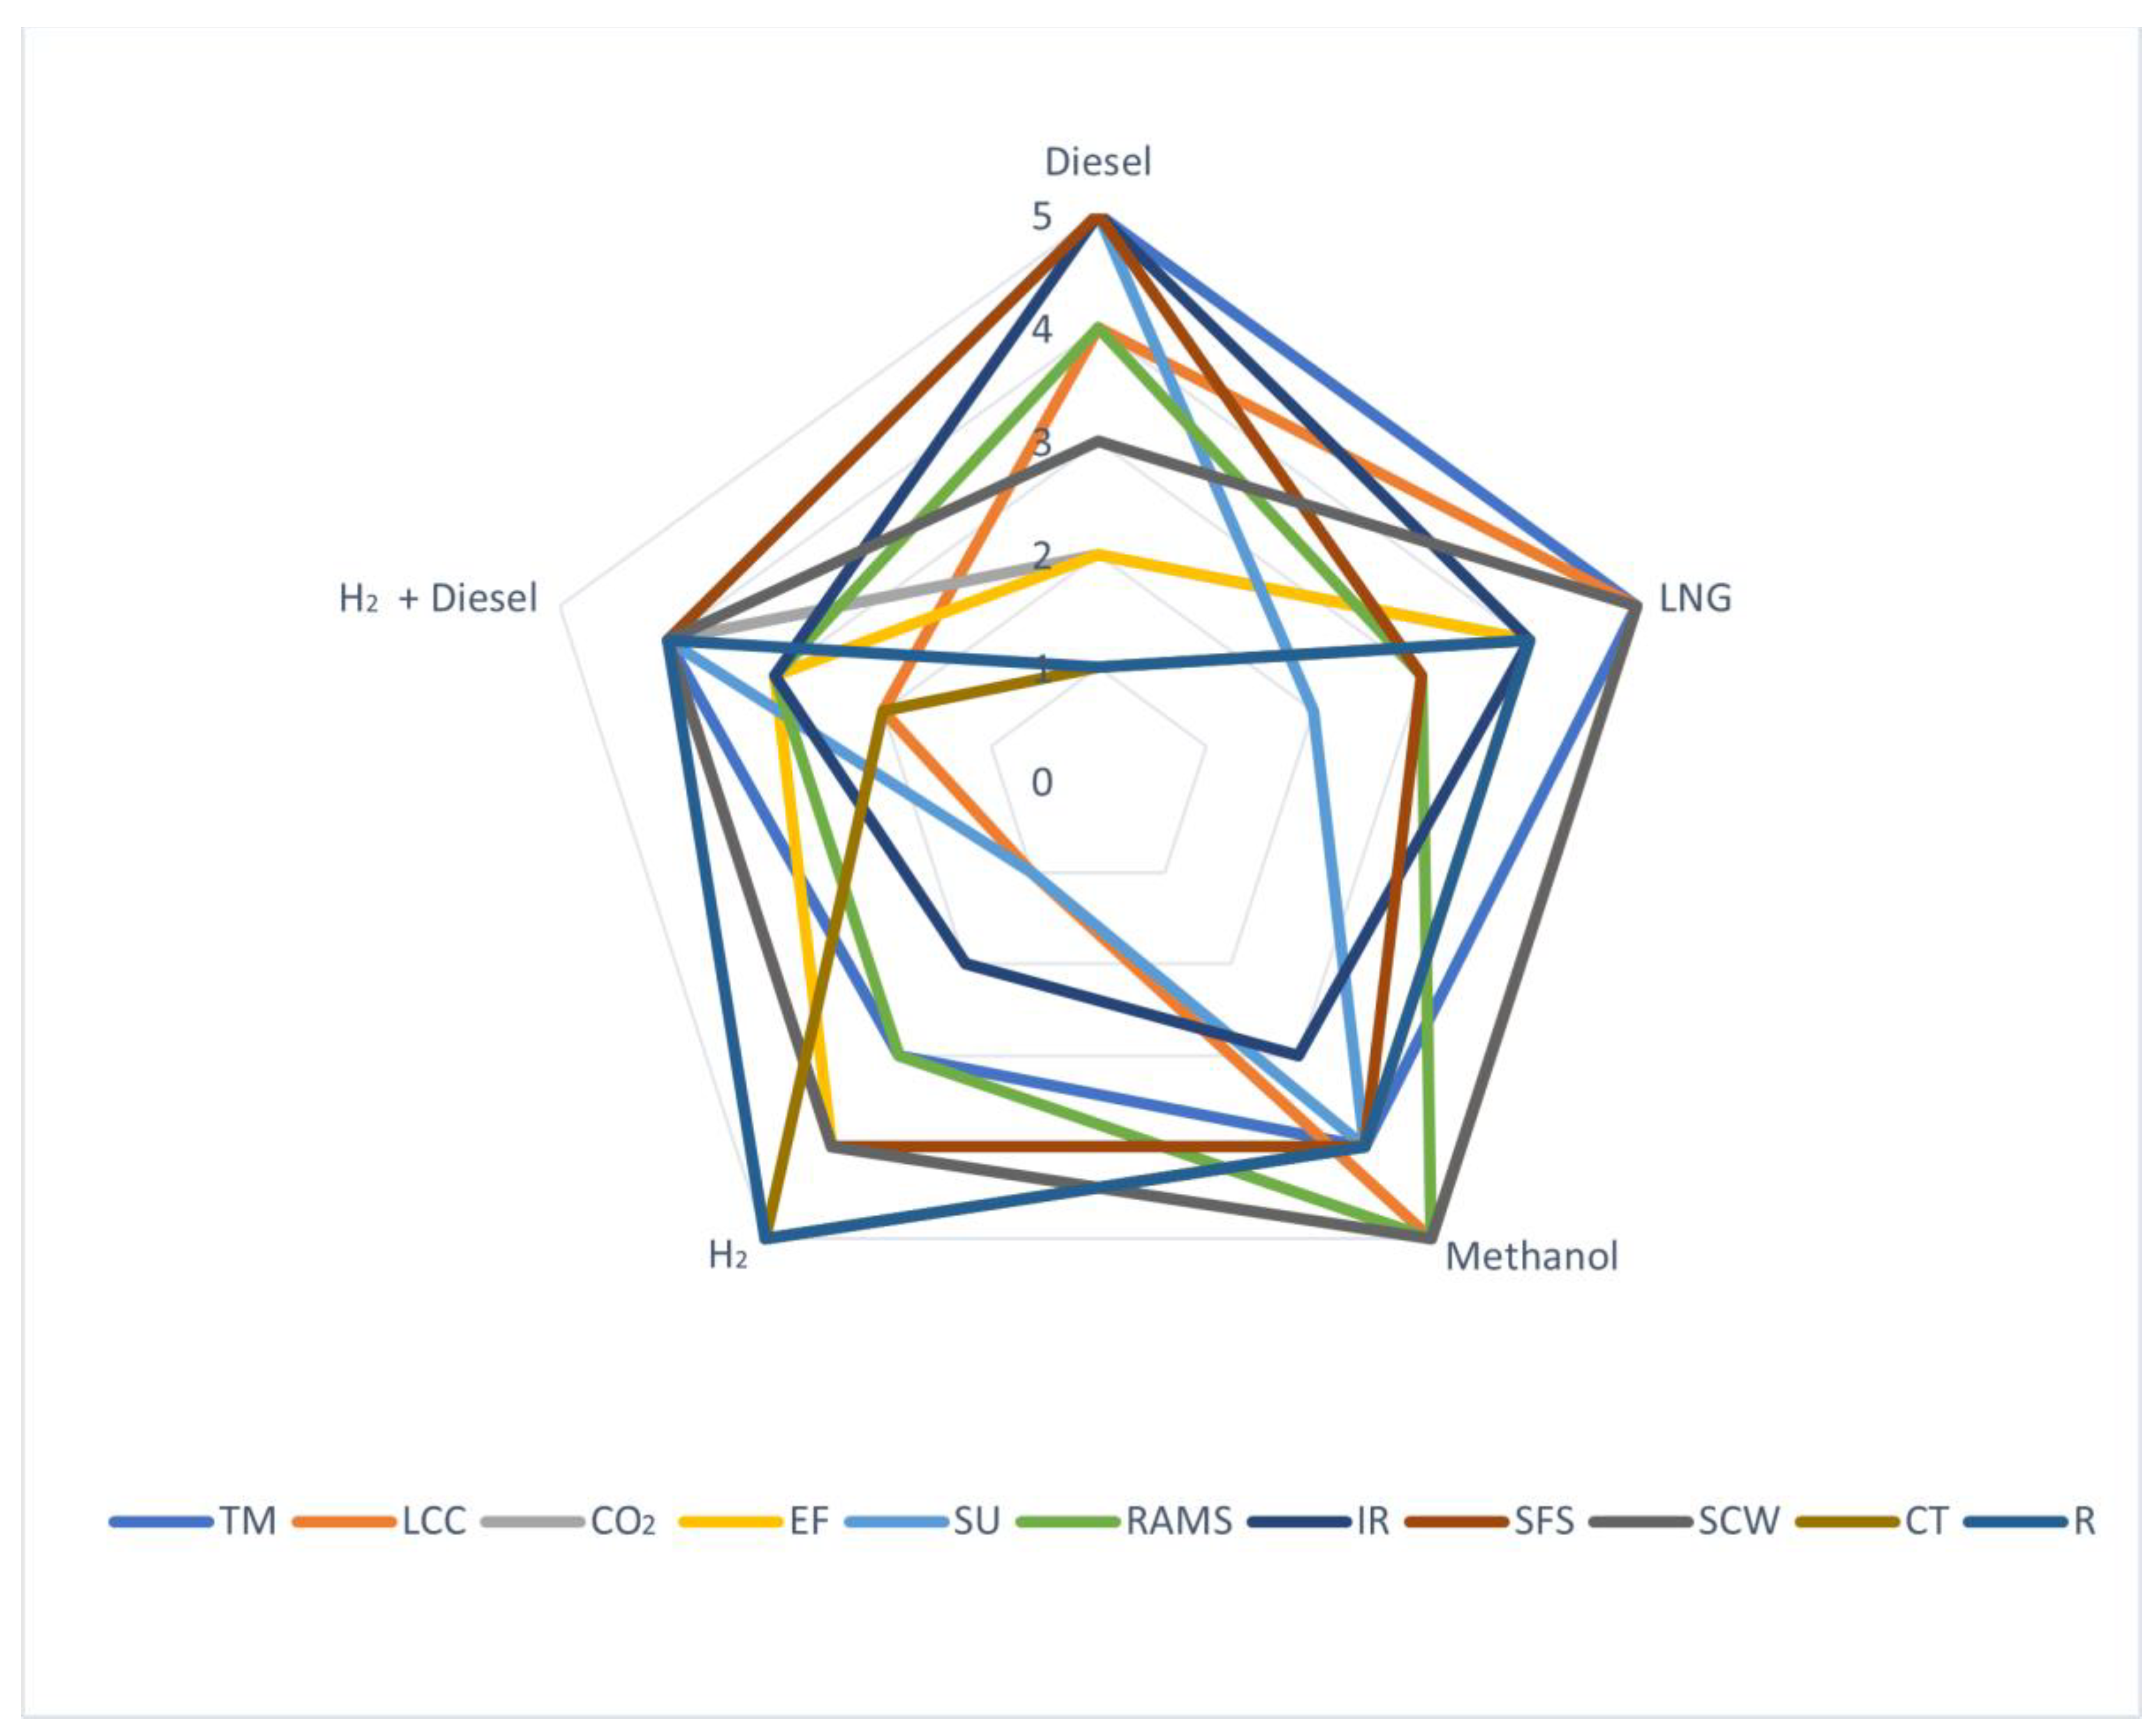
- Despite the existence of multiple alternative fuels, their availability, and regulatory and infrastructure readiness, constitute significant obstacles to their adoption for the considered research vessel at the current stage of development. This renders MDO, LNG, LH2, and methanol the currently feasible options for an Arctic research vessel, with methanol having the best score in most of the considered attributes. However, this is rapidly changing and should be constantly reassessed.
- The harsh environmental conditions, long operational range and endurance requirements, and a varying operational profile are factors that are decreasing the feasibility of the alternative fuels, namely LNG, methanol, and LH2, for the considered research ship, unless radical ship arrangement changes are implemented.
- MDO is the most convenient option considering its maturity, arrangement requirements, and energy density compared to LNG, methanol, and LH2. Yet it is the least environmentally friendly and less cost-efficient than methanol and LNG. A ship with MDO can be made retrofit-ready to be able to tackle the more stringent environmental requirements during the ship’s lifetime once they arise.
- With radical ship arrangement redesign, operations using solely LNG and methanol seem feasible and more cost-efficient than diesel for the Arctic-going research ship, with 25% and 9% lifecycle cost reductions, respectively. Yet operations using only LH2 are considered unrealistic and overwhelmingly expensive (cost increase from 50% to 175%), and the use of MDO together with LH2 is the only realistic way of involving LH2, but still with 22% to 42% higher lifecycle costs.
- Whilst it is anticipated that operational CO2 emissions will be reduced compared to diesel when using LNG (24%), methanol (13%), and LH2 (100%) they need to be produced in a green fashion if full sustainability of the supply chain (well-to-propeller) needs to be ensured.
- The space limitations require special consideration when selecting alternative fuels in Arctic vessels, and the difference in ship type should be given due consideration before planning recommendations for alternative fuels.
- By applying first principle approaches and calculations, it is possible to recursively eliminate those energy source alternatives which are not feasible and consider design factors in a more holistic fashion.
Author Contributions
Funding
Informed Consent Statement
Data Availability Statement
Acknowledgments
Conflicts of Interest
Appendix A

| Energy Source | Specific Energy or (Gravimetric) Energy Density at Environmental Conditions (MJ/kg) | Density at Environmental Conditions (kg/m3) | Volumetric Energy Density at Environmental Conditions (MJ/m3) |
|---|---|---|---|
| Nuclear | 75,000,000–85,000 000 | 19,000,000–20,000,000 | - |
| Solar | - | - | 200–400 (W/m2) |
| Battery (electrical) | 0.95 | 800–2000 | 1.6 |
| Ethanol | 26.8 | 793 | 21,252 |
| Dimethyl ether | 28.3 | 735 (liquid, −25 °C) | 20,800 |
| Compressed Natural Gas (CNG) | 48.6 | 225 (at 200 bar) | 10,935 (at 200 bar) |
| Liquified Natural Gas (LNG) | 48.6 | 450 (liquid, −160 °C) | 21,870 |
| Liquefied Petroleum Gas (LPG) | 46.4–51 | 530 | 27,030 |
| Liquid methanol | 19.9–22.9 | 792 | 18,137 |
| Ammonia (at 10.3 bar, 25 °C) | 18.5–18.8 | 602.8 | 11,333 |
| MDO/Biodiesel | 42.6 | 820–845 | 33,000–35,000 |
| Liquid hydrogen (at 1 bar, −253 °C) | 120 | 70.85–71.1 | 8532 |
Appendix B
| Strengths | Weaknesses | |
| Technological | MDO employs tested and proven technology with a highly competitive market and developed products, which can comply with the current regulations [95,96]. Well-established fuel standards [97]. Good and mature engines are in place for LNG [98]. Hydrogen can be produced in different ways and utilised in different forms/transferred using various energy carriers depending on the requirements [99,100]. Multiple engines on the market today can process high content of hydrogen [94,101]. Methanol is a versatile chemical with different available applications and an established production chain [64,102]. Methanol is compatible with most marine engines and can be used in DF engines [94,101]. Combustion characteristics of methanol are similar to diesel fuel [15]. IMO has already drafted the IGF code for methanol in addition to updated class rules [102,103]. Several vessels operating on methanol are already in operation, and bunkering is available in some ports in Sweden [19,30,64,104]. | Requires extensive optimization and/or the use of additional subsystems in order to comply with the stringiest regulations [105]. LNG engines are usually difficult to retrofit to other fuels [8,12,33]. LNG use results in the additional need to handle Boil-off vapours created in tanks due to thermal losses of thermal insulation [106]. The application of H2 is still not as mature as other technologies in shipping [102,107]. Boil-off is very rapid which might reduce the operational range when using LH2 [108]. Due to the high air-to-fuel ratio, very strong blowers are required [109]. |
| Financial considerations | MDO has lower Capex and potentially lower Opex cost than LNG or Hydrogen in some cases [110]. LNG has low additional operating costs, including spare parts and lubrication oil [12]. It is widely considered as a cost-effective solution [111]. Low installation costs for methanol systems [102,112]. Methanol engines are most cost-competitive for deep-sea [94,113]. Based on projected fuel prices, the payback period for methanol is lower than that for MDO [110,113]. | Increased Capex costs [8,12,33]. Additional costs due to crew training might be required for LNG handling [114]. The LH2 is significantly more costly than the other fuels and green LH2 is also very expensive [30,101]. Safety considerations can lead to a higher price for the methanol system [115]. |
| Environmental considerations | Low-carbon and particulate matter emissions during the operation with LNG [11,36] render it suitable for transition to more sustainable fuels [11,12]. H2 is a zero-emission concept in line with IMO and EU goals [17]. No black carbon emissions [116]. Methanol does not contain sulphur or nitrogen, which leads to a high reduction in SOx and NOx emissions [64,94]. Almost no black carbon [116]. | MDO has the highest overall (well-to-propeller) CO2 emissions of the compared fuels [111], also higher NOx emissions and black carbon emissions than LNG and Hydrogen [11,116]. MDO is a harmful substance to the environment, and cleaning possible oil spills in the Arctic areas is very expensive [8,117]. Fossil LNG is not low carbon or low greenhouse gas fuel when taking into consideration the whole life cycle of the fuel and methane slips [11,36]. High methane slips can be produced during the production and combustion of LNG [8,33,36]. Fossil fuels are usually involved in hydrogen production as alternative green production is expensive [30,101]. Methanol contains carbon which leads to CO2 and GHG emissions [94,102]. The use of methanol increases CO and HC emissions in comparison to other fuels [112]. Fossil-based methanol has one of the highest life cycle emissions [10,15,57,104,118] with carbon emissions comparable to that of LNG [10,12,64,94,118]. |
| Energy density | MDO is the most energy-dense fuel per volume [11] and is thus good for long-range applications. LNG has a high energy density in comparison to other alternative green fuels [64]. In combination with fuel cells methanol-powered missions longer than 7 days offer better suitability than LH2 for medium-sized ships [94,113,119]. | The energy density of LNG is lower than that of MDO and HFO [8], which significantly affects the ability to perform longer voyages if storage space is limited. H2 energy content per litre is significantly lower than other fuels [30,101]. Too large required tank capacity generally [101] and for remote Polar operations specifically [69]. The energy density of methanol is twice as much as that of MDO [15,64]. |
| Reliability Availability, Maintainability, Safety | MDO is a relatively non-flammable fuel to store onboard with well-known risks [8,12]. Hydrogen is non-toxic [120]. Methanol can be stored in liquid at ambient temperature and pressure [15]. Methanol is biodegradable if it is released into the environment [30,102,121]. | Additional safety risks during the storage and bunkering of LNG related to its higher flammability [8,12]. Additional risks due to the LNG low temperature, the fire and explosion risks from potential leakages, and the feeding system components failure risks [79,122]. Explosivity and highly flammable nature of H2 [12]. Very low temperature for LH2 storage [9]. H2 can pass through many materials leading to metal embrittlement [15]. Methanol has a higher explosion range than LNG, HFO and ammonia [64] which requires operational safety modifications in SOLAS and class rules [15]. Methanol is toxic to humans and has corrosive properties [15,104,118]. Methanol requires extensive monitoring systems to limit the occurrence of accidental leakages [121]. |
| Infrastructure requirements | MDO can use the same infrastructure as HFO, which has been the most popular marine fuel for decades and thus the infrastructure is the best among all options in the considered area [123]. Mature solutions for storing and transferring LNG are in place in the operational area and in general [36]. | Reduced LNG bunkering infrastructure, especially in the Arctic region compared to MDO [12,41,60,124]. Lack of infrastructure and wide availability in remote regions [69] for H2. The bunkering capability of methanol is still not established well enough and there are limited plans to extend that network in Northern Europe [12,63,104,125]. |
| Security of supply | The current production of MDO exceeds the needs of the marine sector and thus the availability is ensured [126]. Increased global LNG availability [12,60]. | |
| Suitability for cold weather | Good cold weather performance [8]. | Using hydrogen in the Arctic constitutes a novel concept in extreme environments [101]. |
| Reputational aspects | First-mover advantage in the use of hydrogen (funding, media exposure...) also for other sectors [102]. A high percentage of ship owners are still insecure about adopting methanol as marine fuel [127] so using can be a reputational asset. | Use of MDO might result in negative public image in terms of environmental impact, due to comparatively high emissions and risk of spills in a vulnerable Arctic environment. |
| Opportunities | Threats | |
| Financial | Significantly lower Capex costs anticipated at least until the year 2040 [110]. The cost of crude oil is not expected to increase dramatically from 2030 to 2040 [110] and thus the costs of operating with MDO will not increase significantly during ship life cycle. Lower emission-related fees, such as carbon tax if LNG is used [128]. | If a carbon tax is introduced for the maritime industry, the feasibility of MDO decreases most of the assessed fuel options as it has the largest GHG emissions compared to LNG and Hydrogen [128]. High and uncertain fuel prices. The price of LNG is historically tied to crude oil prices [9,32]. Russian natural gas is at risk of increasing sanctions. (Russia accounted for more than 40% of Europe’s gas imports) [129]. Regulations considering overall GHG emissions and methane slip of the LNG can limit the capability to keep up with the IMO regulations in the future [8]. Prices of green hydrogen stay high due to emerging alternative technologies [101]. Policies have to be developed in time to be able to utilize hydrogen in marine operations [69]. |
| Environmental | If MDO is employed, the power plant will be compatible with more sustainable and low-emission forms of diesel (e.g., biodiesel), which have low life cycle GHG emissions (well-to-propeller) if produced sustainably, and can exploit the same infrastructure as MDO [130]. Potential use of bio and synthetic LNG [11]. LNG can be compatible with hydrogen for reducing emissions [131,132,133]. Cleaner environment with minimal/zero emissions (when using hydrogen) [30,47]. Enables “green transition” in the shipping industry per IMO requirements for GHG emissions [134] when using green methanol or carbon capture [10,64]. | |
| Technological and infrastructure | Possibility to future-proof or retrofit with a dual-fuel (DF) engine, which can run on both MDO and LNG, MDO and methanol, or MDO and hydrogen and compensate some of the drawbacks of each fuel [10,103,104,112,130,135]. Increased interest in LNG for new-build ships, which leads to increased maturity and development [12,36]. Further development and increase in bunkering infrastructure and capacity for LNG [36,60]. Increasing demand for decarbonisation of marine transportation calls for product innovation, i.e., clearly differentiated product and value proposition [94,107]. Potentially high-efficiency combustion process in hydrogen fuel cells [108]. A high percentage of hydrogen can be found in methanol, so it can be used as a hydrogen carrier [64,103,104,118,120]. Current bunkering infrastructure requires minor modifications to handle methanol [15,19]. For internal combustion engines, alcohol fuels are the most promising alternative fuels [117]. | Limited availability of diesel engine subsystems, such as efficient carbon capture systems, might result in incompliant MDO engines [8] if a carbon tax is applied. |
References
- NASA. Global Warming vs. Climate Change|Facts—Climate Change: Vital Signs of the Planet. Available online: https://climate.nasa.gov/global-warming-vs-climate-change/ (accessed on 9 May 2023).
- IMO. Fourth IMO Greenhouse Gas Study 2020; IMO: London, UK, 2020. [Google Scholar]
- IMO Greenhouse Gas Emissions. Available online: https://www.imo.org/en/ourwork/environment/pages/ghg-emissions.aspx (accessed on 21 June 2023).
- IMO. Energy Efficiency Measures. Available online: https://www.imo.org/en/ourwork/environment/pages/technical-and-operational-measures.aspx (accessed on 21 June 2023).
- IMO. Nitrogen Oxides (NOx)—Regulation 13. Available online: https://www.imo.org/en/OurWork/Environment/Pages/Nitrogen-oxides-(NOx)-%E2%80%93-Regulation-13.aspx (accessed on 21 June 2023).
- Barreiro, J.; Zaragoza, S.; Diaz-Casas, V. Review of Ship Energy Efficiency. Ocean Eng. 2022, 257, 111594. [Google Scholar] [CrossRef]
- Jimenez, V.J.; Kim, H.; Munim, Z.H. A Review of Ship Energy Efficiency Research and Directions towards Emission Reduction in the Maritime Industry. J. Clean. Prod. 2022, 366, 132888. [Google Scholar] [CrossRef]
- Foretich, A.; Zaimes, G.G.; Hawkins, T.R.; Newes, E. Challenges and Opportunities for Alternative Fuels in the Maritime Sector. Marit. Transp. Res. 2021, 2, 100033. [Google Scholar] [CrossRef]
- Al-Enazi, A.; Okonkwo, E.C.; Bicer, Y.; Al-Ansari, T. A Review of Cleaner Alternative Fuels for Maritime Transportation. Energy Rep. 2021, 7, 1962–1985. [Google Scholar] [CrossRef]
- Law, L.; Foscoli, B.; Mastorakos, E.; Evans, S. A Comparison of Alternative Fuels for Shipping in Terms of Lifecycle Energy and Cost. Energies 2021, 14, 8502. [Google Scholar] [CrossRef]
- Gilbert, P.; Walsh, C.; Traut, M.; Kesieme, U.; Pazouki, K.; Murphy, A. Assessment of Full Life-Cycle Air Emissions of Alternative Shipping Fuels. J. Clean. Prod. 2018, 172, 855–866. [Google Scholar] [CrossRef]
- Deniz, C.; Zincir, B. Environmental and Economical Assessment of Alternative Marine Fuels. J. Clean. Prod. 2016, 113, 438–449. [Google Scholar] [CrossRef]
- Hansson, J.; Brynolf, S.; Fridell, E.; Lehtveer, M. The Potential Role of Ammonia as Marine Fuel—Based on Energy Systems Modeling and Multi-Criteria Decision Analysis. Sustainability 2020, 12, 3265. [Google Scholar] [CrossRef]
- Atilhan, S.; Park, S.; El-Halwagi, M.M.; Atilhan, M.; Moore, M.; Nielsen, R.B. Green Hydrogen as an Alternative Fuel for the Shipping Industry. Curr. Opin. Chem. Eng. 2021, 31, 100668. [Google Scholar] [CrossRef]
- Bilgili, L. A Systematic Review on the Acceptance of Alternative Marine Fuels. Renew. Sustain. Energy Rev. 2023, 182, 113367. [Google Scholar] [CrossRef]
- Fan, A.; Li, Y.; Liu, H.; Yang, L.; Tian, Z.; Li, Y.; Vladimir, N. Development Trend and Hotspot Analysis of Ship Energy Management. J. Clean. Prod. 2023, 389, 135899. [Google Scholar] [CrossRef]
- Jafarzadeh, S.; Schjølberg, I. Emission Reduction in Shipping Using Hydrogen and Fuel Cells. In Volume 10: Ocean Renewable Energy, Proceedings of the International Conference on Offshore Mechanics and Arctic Engineering, Trondheim, Norway, 25–30 June 2017; American Society of Mechanical Engineers: New York, NY, USA, 2017; p. V010T09A011. [Google Scholar]
- Fan, A.; Wang, J.; He, Y.; Perčić, M.; Vladimir, N.; Yang, L. Decarbonising Inland Ship Power System: Alternative Solution and Assessment Method. Energy 2021, 226, 120266. [Google Scholar] [CrossRef]
- Radonja, R.; Bebić, D.; Glujić, D. Methanol and Ethanol as Alternative Fuels for Shipping. Promet-Traffic Transp. 2019, 31, 321–327. [Google Scholar] [CrossRef]
- Rivarolo, M.; Rattazzi, D.; Lamberti, T.; Magistri, L. Clean Energy Production by PEM Fuel Cells on Tourist Ships: A Time-Dependent Analysis. Int. J. Hydrog. Energy 2020, 45, 25747–25757. [Google Scholar] [CrossRef]
- Bolbot, V.; Trivyza, N.L.; Theotokatos, G.; Boulougouris, E.; Rentizelas, A.; Vassalos, D. Cruise Ships Power Plant Optimisation and Comparative Analysis. Energy 2020, 196, 117061. [Google Scholar] [CrossRef]
- Dotto, A.; Satta, F.; Campora, U. Energy, Environmental and Economic Investigations of Cruise Ships Powered by Alternative Fuels. Energy Convers. Manag. 2023, 285, 117011. [Google Scholar] [CrossRef]
- Sofras, E.; Prousalidis, J. Developing a New Methodology for Evaluating Diesel—Electric Propulsion. J. Mar. Eng. Technol. 2014, 13, 63–92. [Google Scholar] [CrossRef][Green Version]
- Sulligoi, G.; Vicenzutti, A.; Menis, R. All-Electric Ship Design: From Electrical Propulsion to Integrated Electrical and Electronic Power Systems. IEEE Trans. Transp. Electrif. 2016, 2, 507–521. [Google Scholar] [CrossRef]
- Frangopoulos, C.A. Developments, Trends, and Challenges in Optimization of Ship Energy Systems. Appl. Sci. 2020, 10, 4639. [Google Scholar] [CrossRef]
- Bakountouzis, L.N. Marine Power Plants: Design Methodology and Trends. Mar. Eng. 1993. Available online: https://www.witpress.com/Secure/elibrary/papers/NEVA93/NEVA93009FU.pdf (accessed on 1 June 2023).
- Papanikolaou, A. Ship Design: Methodologies of Preliminary Design; Springer: Dordrecht, The Netherlands, 2014; ISBN 978-94-017-8750-5. [Google Scholar]
- Lamb, T. A Ship Design Procedure. Mar. Technol. SNAME News 1969, 6, 362–405. [Google Scholar] [CrossRef]
- Arctic Council. Navigating Arctic Waters with the Arctic Council and the International Maritime Organization. Available online: https://arctic-council.org/news/navigating-arctic-waters-with-the-arctic-council-and-imo/ (accessed on 1 June 2023).
- DNV. Alternative Fuels in the Arctic; DNV GL: Bærum, Norway, 2019. [Google Scholar]
- Joseph, L.; Giles, T.; Nishatabbas, R.; Tristan, S. A Techno-Economic Environmental Cost Model for Arctic Shipping. Transp. Res. Part Policy Pract. 2021, 151, 28–51. [Google Scholar] [CrossRef]
- Theocharis, D.; Rodrigues, V.S.; Pettit, S.; Haider, J. Feasibility of the Northern Sea Route for Seasonal Transit Navigation: The Role of Ship Speed on Ice and Alternative Fuel Types for the Oil Product Tanker Market. Transp. Res. Part A Policy Pract. 2021, 151, 259–283. [Google Scholar] [CrossRef]
- Lindstad, H.; Bright, R.M.; Strømman, A.H. Economic Savings Linked to Future Arctic Shipping Trade Are at Odds with Climate Change Mitigation. Transp. Policy 2016, 45, 24–30. [Google Scholar] [CrossRef]
- Kondratenko, A.A.; Bergström, M.; Reutskii, A.; Kujala, P. A Holistic Multi-Objective Design Optimization Approach for Arctic Offshore Supply Vessels. Sustainability 2021, 13, 5550. [Google Scholar] [CrossRef]
- Kondratenko, A.; Kujala, P.; Hirdaris, S. Holistic and Sustainable Design Optimization of Arctic Ships. Ocean Eng. 2023, 275, 114095. [Google Scholar] [CrossRef]
- Xu, H.; Yang, D. LNG-Fuelled Container Ship Sailing on the Arctic Sea: Economic and Emission Assessment. Transp. Res. Part Transp. Environ. 2020, 87, 102556. [Google Scholar] [CrossRef]
- Harvald, S.A. Normand’s Number for Merchant Ships. Eur. Shipbuild. 1964, XII. Available online: https://repository.tudelft.nl/islandora/object/uuid:c8d0ea57-5a5b-4704-b08a-8e4561cb24bd/datastream/OBJ/download (accessed on 1 June 2023).
- IMO. Special Areas under MARPOL. Available online: https://www.imo.org/en/OurWork/Environment/Pages/Special-Areas-Marpol.aspx (accessed on 7 May 2023).
- Pereira, N. A Diagnostic of Diesel-Electric Propulsion for Ships. Ship Sci. Technol. 2008, 1, 27–42. [Google Scholar]
- Boekhout, M. Hydrogen Powered Ship Propulsion for High-Speed Craft: The Implementation of Fuel Cell Battery Propulsion Systems. Master’s Thesis, Delft University of Technology, Delft, The Netherlands, 2020. [Google Scholar]
- Gaspar, H.M.; Ehlers, S.; Æsøy, V.; Erceg, S.; Balland, O.; Hildre, H.P. Challenges for Using LNG Fueled Ships for Arctic Routes. In Volume 10: Polar and Arctic Science and Technology, Proceedings of the International Conference on Offshore Mechanics and Arctic Engineering, San Francisco, CA, USA, 8–13 June 2014; p. 01007034.
- IMO. Regulation 21—Casualty Threshold, Safe Return to Port and Safe Areas; IMO: London, UK, 2010. [Google Scholar]
- Jeong, B.; Oguz, E.; Wang, H.; Zhou, P. Multi-Criteria Decision-Making for Marine Propulsion: Hybrid, Diesel Electric and Diesel Mechanical Systems from Cost-Environment-Risk Perspectives. Appl. Energy 2018, 230, 1065–1081. [Google Scholar] [CrossRef]
- Sarsby, A. Swot Analysis: A Guide to SWOT for Students of Business Studies; Leadership Library, an Imprint of Spectaris Limited: Welwyn Garden City, UK, 2016; ISBN 978-0-9932504-2-2. [Google Scholar]
- IMO. Resolution MEPC.308(73)—Guidelines on the Method of Calculation of the Attained Energy Efficiency Design Index (EEDI) for New Ships; IMO: London, UK, 2018. [Google Scholar]
- Kim, K.; Roh, G.; Kim, W.; Chun, K. A Preliminary Study on an Alternative Ship Propulsion System Fueled by Ammonia: Environmental and Economic Assessments. J. Mar. Sci. Eng. 2020, 8, 183. [Google Scholar] [CrossRef]
- Kanchiralla, F.M.; Brynolf, S.; Malmgren, E.; Hansson, J.; Grahn, M. Life-Cycle Assessment and Costing of Fuels and Propulsion Systems in Future Fossil-Free Shipping. Environ. Sci. Technol. 2022, 56, 12517–12531. [Google Scholar] [CrossRef] [PubMed]
- Perčić, M.; Vladimir, N.; Jovanović, I.; Koričan, M. Application of Fuel Cells with Zero-Carbon Fuels in Short-Sea Shipping. Appl. Energy 2022, 309, 118463. [Google Scholar] [CrossRef]
- Ma, S.; Lin, M.; Lin, T.-E.; Lan, T.; Liao, X.; Maréchal, F.; Van Herle, J.; Yang, Y.; Dong, C.; Wang, L. Fuel Cell-Battery Hybrid Systems for Mobility and off-Grid Applications: A Review. Renew. Sustain. Energy Rev. 2021, 135, 110119. [Google Scholar] [CrossRef]
- Elkafas, A.G.; Rivarolo, M.; Barberis, S.; Massardo, A.F. Feasibility Assessment of Alternative Clean Power Systems Onboard Passenger Short-Distance Ferry. J. Mar. Sci. Eng. 2023, 11, 1735. [Google Scholar] [CrossRef]
- Wrobel, K. A Tale of Two Disruptive Maritime Technologies: Nuclear Propulsion and Autonomy. TransNav Int. J. Mar. Navig. Saf. Sea Transp. 2022, 16, 733–741. [Google Scholar] [CrossRef]
- Hirdaris, S.E.; Cheng, Y.F.; Shallcross, P.; Bonafoux, J.; Carlson, D.; Prince, B.; Sarris, G.A. Considerations on the Potential Use of Nuclear Small Modular Reactor (SMR) Technology for Merchant Marine Propulsion. Ocean Eng. 2014, 79, 101–130. [Google Scholar] [CrossRef]
- Namikawa, S.; Morten, M.; Peter, H.; Erik, B. Nuclear Powered Ships—Findings from A Feasibility Study. In Proceedings of the International Conference on Nuclear Engineering, Osaka, Japan, 16–19 October 2011. [Google Scholar]
- Panasonic EVERVOLT® H Series Solar Module. Available online: https://na.panasonic.com/us/energy-solutions/solar/evervoltr-solar-modules/evervoltr-h-series-solar-module-410400w (accessed on 13 June 2023).
- NASA. The Balance of Power in the Earth-Sun System; NASA: Washington, DC, USA, 2005. [Google Scholar]
- YARA. Yara Birkeland. Available online: https://www.yara.com/news-and-media/media-library/press-kits/yara-birkeland-press-kit/ (accessed on 9 June 2023).
- Office of Energy Efficiency & Renewable Energy. Volumetric Energy Density of Lithium-Ion Batteries Increased by More than Eight Times between 2008 and 2020. Available online: https://www.energy.gov/eere/vehicles/articles/fotw-1234-april-18-2022-volumetric-energy-density-lithium-ion-batteries (accessed on 9 June 2023).
- Ellis, J.; Tanneberger, K. Study on the Use of Ethyl and Methyl Alcohol as Alternative Fuels in Shipping; European Maritime Safety Agency: Lisbon, Portugal, 2015. [Google Scholar]
- ’t Hart, P.; Pruyn, J.F.J.; Ferrari, F. Final Report—Bio-Ethanol as an Alternative Fuel for Vessels; TU Delft Library: Delft, The Netherlands, 2023. [Google Scholar]
- Seyam, S.; Dincer, I.; Agelin-Chaab, M. An Innovative Study on a Hybridized Ship Powering System with Fuel Cells Using Hydrogen and Clean Fuel Blends. Appl. Therm. Eng. 2023, 221, 119893. [Google Scholar] [CrossRef]
- Baena-Moreno, F.M.; Gonzalez-Castaño, M.; Arellano-García, H.; Reina, T.R. Exploring Profitability of Bioeconomy Paths: Dimethyl Ether from Biogas as Case Study. Energy 2021, 225, 120230. [Google Scholar] [CrossRef]
- Tyagi, P.; Kumar, V. Present and Future Perspectives of Liquid-Phase Slurry Processes Involved in Methanol and Dimethyl Ether Synthesis Using Biomass-Derived Syngas. Energy Fuels 2023, 37, 3328–3354. [Google Scholar] [CrossRef]
- IMO Alternative Fuel Use—Regulatory Status Mapped. Available online: https://www.imo.org/en/MediaCentre/Pages/WhatsNew-1841.aspx (accessed on 3 June 2023).
- Stuer-Lauridsen, F.; Nielsen, J.B.; Odgaard, T.; Birkeland, M.; Graugaard, C.W.; Blikom, L.P.; Muro-Suné, N.; Andersen, M.; Øvlisen, F. Natural Gas for Ship Propulsion in Denmark; Danish Ministry of the Environment, Environmental Protection Agency: Copenhagen, Denmark, 2010; p. 131. [Google Scholar]
- SEA-LNG LNG—Delivering Decarbonisation. 2023. Available online: https://sea-lng.org/wp-content/uploads/2023/01/SEA-LNG-VftB-2022-23-LNG-Delivering-Decarbonisation-.pdf (accessed on 1 March 2023).
- IMO. Resolution MSC.285(86)—Interim Guidelines on Safety for Natural Gas-Fuelled Engine Installations in Ships; IMO: London, UK, 2009. [Google Scholar]
- Wang, Q.; Zhang, H.; Huang, J.; Zhang, P. The Use of Alternative Fuels for Maritime Decarbonization: Special Marine Environmental Risks and Solutions from an International Law Perspective. Front. Mar. Sci. 2023, 9, 1082453. [Google Scholar] [CrossRef]
- Tvedten, I.Ø.; Bauer, S. Retrofitting towards a Greener Marine Shipping Future: Reassembling Ship Fuels and Liquefied Natural Gas in Norway. Energy Res. Soc. Sci. 2022, 86, 102423. [Google Scholar] [CrossRef]
- Chun, K.W.; Kim, M.; Hur, J.-J. Development of a Marine LPG-Fueled High-Speed Engine for Electric Propulsion Systems. J. Mar. Sci. Eng. 2022, 10, 1498. [Google Scholar] [CrossRef]
- Wang, Y.; Cao, Q.; Liu, L.; Wu, Y.; Liu, H.; Gu, Z.; Zhu, C. A Review of Low and Zero Carbon Fuel Technologies: Achieving Ship Carbon Reduction Targets. Sustain. Energy Technol. Assess. 2022, 54, 102762. [Google Scholar] [CrossRef]
- IMO. MSC.1/Circular.1621—Interim Guidelines for the Safety of Ships Using Methyl/Ethyl Alcohol as Fuel; IMO: London, UK, 2020. [Google Scholar]
- Marquez, C.; Deign, J. Marine Methanol: Future-Proof Shipping Fuel; Methanol Institute: Alexandria, VA, USA, 2023. [Google Scholar]
- McKinlay, C.J.; Turnock, S.R.; Hudson, D.A. Route to Zero Emission Shipping: Hydrogen, Ammonia or Methanol? Int. J. Hydrog. Energy 2021, 46, 28282–28297. [Google Scholar] [CrossRef]
- Prause, G.; Olaniyi, E.O.; Gerstlberger, W. Ammonia Production as Alternative Energy for the Baltic Sea Region. Energies 2023, 16, 1831. [Google Scholar] [CrossRef]
- Cheliotis, M.; Boulougouris, E.; Trivyza, N.; Theotokatos, G.; Livanos, G.; Mantalos, G.; Stubos, A.; Stamatakis, E.; Venetsanos, A. Review on the Safe Use of Ammonia Fuel Cells in the Maritime Industry. Energies 2021, 14, 3023. [Google Scholar] [CrossRef]
- Gerlitz, L.; Mildenstrey, E.; Prause, G. Ammonia as Clean Shipping Fuel for the Baltic Sea Region. Transp. Telecommun. J. 2022, 23, 102–112. [Google Scholar] [CrossRef]
- Furstenberg Stott, S. Ammonia-Powered Cruising on the Baltic Sea. Available online: https://www.ammoniaenergy.org/articles/ammonia-powered-cruising-on-the-baltic-sea/ (accessed on 27 June 2023).
- The Maritime Executive Norway Supports Project to Build Ammonia-Fueled Coastal Shipping. Available online: https://maritime-executive.com/article/norway-supports-project-to-build-ammonia-fueled-coastal-shipping (accessed on 27 June 2023).
- Stolz, B.; Held, M.; Georges, G.; Boulouchos, K. Techno-Economic Analysis of Renewable Fuels for Ships Carrying Bulk Cargo in Europe. Nat. Energy 2022, 7, 203–212. [Google Scholar] [CrossRef]
- Mohd Noor, C.W.; Noor, M.M.; Mamat, R. Biodiesel as Alternative Fuel for Marine Diesel Engine Applications: A Review. Renew. Sustain. Energy Rev. 2018, 94, 127–142. [Google Scholar] [CrossRef]
- Wärtsilä IMO Tier III Compliant Wärtsilä Engines to Power World’s Largest Expedition Mega Yachts. Available online: https://www.wartsila.com/media/news/11-05-2017-imo-tier-iii-compliant-wartsila-engines-to-power-worlds-largest-expedition-mega-yachts (accessed on 6 April 2023).
- Mallouppas, G.; Yfantis, E.A. Decarbonization in Shipping Industry: A Review of Research, Technology Development, and Innovation Proposals. J. Mar. Sci. Eng. 2021, 9, 415. [Google Scholar] [CrossRef]
- DNV. Alternative Fuels: The Options; DNV: Bærum, Norway, 2018. [Google Scholar]
- Latapí, M.; Davíðsdóttir, B.; Jóhannsdóttir, L. Drivers and Barriers for the Large-Scale Adoption of Hydrogen Fuel Cells by Nordic Shipping Companies. Int. J. Hydrogen Energy 2023, 48, 6099–6119. [Google Scholar] [CrossRef]
- Drăgan, O. Norway to Build One of the World’s First High-Speed Hydrogen Fuel Cell Boats. Autoevolution. 2021. Available online: https://www.autoevolution.com/news/norway-to-build-one-of-the-worlds-first-high-speed-hydrogen-fuel-cell-boats-175250.html (accessed on 1 May 2023).
- Fuel Cells Works. A Hydrogen Filling Station for Ships Is to Be Built in the Port of Ostend. Available online: https://fuelcellsworks.com/subscribers/a-hydrogen-filling-station-for-ships-is-to-be-built-in-the-port-of-ostend/ (accessed on 26 June 2023).
- HyShip about HyShip. Available online: https://hyship.eu/about/ (accessed on 26 June 2023).
- Port of Roenne Consortium Wants to Make Bornholm a Green Filling Station for Shipping. Available online: https://portofroenne.com/press/2021/6/14/consortium-wants-to-make-bornholm-a-green-filling-station-for-shipping (accessed on 26 June 2023).
- Elammas, T. Hydrogen Fuel Cells for Marine Applications: Challenges and Opportunities. Int. J. Adv. Res. 2023, 9, 38–43. [Google Scholar]
- Pelić, V.; Mrakovčić, T.; Bukovac, O.; Valčić, M. Development and Validation of 4 Stroke Marine Diesel Engine Numerical Model. Pomor. Zb. 2022, 3, 359–372. [Google Scholar]
- Wärtsilä Dispelling the Myth of High Losses in Modern Electrically Enhanced Propulsion Systems. Available online: https://www.wartsila.com/insights/article/dispelling-the-myth-of-high-losses-in-modern-electrically-enhanced-propulsion-systems (accessed on 27 June 2023).
- IMO. MARPOL Annex I, Regulations for the Prevention of Pollution by Oil; IMO: London, UK, 2006. [Google Scholar]
- Milioulis, K.; Bolbot, V.; Theotokatos, G. Model-Based Safety Analysis and Design Enhancement of a Marine LNG Fuel Feeding System. J. Mar. Sci. Eng. 2021, 9, 69. [Google Scholar] [CrossRef]
- Pomaska, L.; Acciaro, M. Bridging the Maritime-Hydrogen Cost-Gap: Real Options Analysis of Policy Alternatives. Transp. Res. Part Transp. Environ. 2022, 107, 103283. [Google Scholar] [CrossRef]
- Chun, K.W. Technical Guide for Materials of Containment System for Hydrogen Fuels for Ships. J. Adv. Mar. Eng. Technol. 2022, 46, 212–217. [Google Scholar] [CrossRef]
- Herdzik, J. Liquefied Natural Gas—The Future Fuel for Shipping or Cul-de-Sac. Rocz. Ochr. Śr. 2022, 24, 15–25. [Google Scholar] [CrossRef]
- Ha, S.; Lee, W.-J.; Jeong, B.; Choi, J.-H.; Kang, J. Regulatory Gaps between LNG Carriers and LNG Fuelled Ships. J. Mar. Eng. Technol. 2022, 21, 23–37. [Google Scholar] [CrossRef]
- IMO International Convention for the Safety of Life at Sea (SOLAS). 1974. Available online: https://www.imo.org/en/About/Conventions/Pages/International-Convention-for-the-Safety-of-Life-at-Sea-(SOLAS),-1974.aspx (accessed on 21 June 2023).
- Nyári, J.; Magdeldin, M.; Larmi, M.; Järvinen, M.; Santasalo-Aarnio, A. Techno-Economic Barriers of an Industrial-Scale Methanol CCU-Plant. J. CO2 Util. 2020, 39, 101166. [Google Scholar] [CrossRef]
- Nyári, J.; Izbassarov, D.; Toldy, Á.I.; Vuorinen, V.; Santasalo-Aarnio, A. Choice of the Kinetic Model Significantly Affects the Outcome of Techno-Economic Assessments of CO2-Based Methanol Synthesis. Energy Convers. Manag. 2022, 271, 116200. [Google Scholar] [CrossRef]
- Santasalo-Aarnio, A.; Nyari, J.; Wojcieszyk, M.; Kaario, O.; Kroyan, Y.; Magdeldin, M.; Larmi, M.; Järvinen, M. Application of Synthetic Renewable Methanol to Power the Future Propulsion; SAE International: Warrendale, PA, USA, 2020. [Google Scholar]
- Dinesh, M.H.; Pandey, J.K.; Kumar, G.N. Effect of Parallel LPG Fuelling in a Methanol Fuelled SI Engine under Variable Compression Ratio. Energy 2022, 239, 122134. [Google Scholar] [CrossRef]
- Usman, M.R. Hydrogen Storage Methods: Review and Current Status. Renew. Sustain. Energy Rev. 2022, 167, 112743. [Google Scholar] [CrossRef]
- Zou, J.; Yang, B. Evaluation of Alternative Marine Fuels from Dual Perspectives Considering Multiple Vessel Sizes. Transp. Res. Part D Transp. Environ. 2023, 115, 103583. [Google Scholar] [CrossRef]
- Kesieme, U.; Pazouki, K.; Murphy, A.; Chrysanthou, A. Biofuel as an Alternative Shipping Fuel: Technological, Environmental and Economic Assessment. Sustain. Energy Fuels 2019, 3, 899–909. [Google Scholar] [CrossRef]
- Banawan, A.A.; El Gohary, M.M.; Sadek, I.S. Environmental and Economical Benefits of Changing from Marine Diesel Oil to Natural-Gas Fuel for Short-Voyage High-Power Passenger Ships. Proc. Inst. Mech. Eng. Part M J. Eng. Marit. Environ. 2010, 224, 103–113. [Google Scholar] [CrossRef]
- Noh, H.; Kang, K.; Seo, Y. Environmental and Energy Efficiency Assessments of Offshore Hydrogen Supply Chains Utilizing Compressed Gaseous Hydrogen, Liquefied Hydrogen, Liquid Organic Hydrogen Carriers and Ammonia. Int. J. Hydrog. Energy 2023, 48, 7515–7532. [Google Scholar] [CrossRef]
- Aakko-Saksa, P.T.; Lehtoranta, K.; Kuittinen, N.; Järvinen, A.; Jalkanen, J.-P.; Johnson, K.; Jung, H.; Ntziachristos, L.; Gagné, S.; Takahashi, C.; et al. Reduction in Greenhouse Gas and Other Emissions from Ship Engines: Current Trends and Future Options. Prog. Energy Combust. Sci. 2023, 94, 101055. [Google Scholar] [CrossRef]
- Heywood, J. Internal Combustion Engine Fundamentals, 2nd ed.; McGraw-Hill Education: New York, NY, USA, 2018. [Google Scholar]
- Bayraktar, M.; Yuksel, O.; Pamik, M. An Evaluation of Methanol Engine Utilization Regarding Economic and Upcoming Regulatory Requirements for a Container Ship. Sustain. Prod. Consum. 2023, 39, 345–356. [Google Scholar] [CrossRef]
- Perčić, M.; Vladimir, N.; Fan, A. Life-Cycle Cost Assessment of Alternative Marine Fuels to Reduce the Carbon Footprint in Short-Sea Shipping: A Case Study of Croatia. Appl. Energy 2020, 279, 115848. [Google Scholar] [CrossRef]
- Ni, P.; Wang, X.; Li, H. A Review on Regulations, Current Status, Effects and Reduction Strategies of Emissions for Marine Diesel Engines. Fuel 2020, 279, 118477. [Google Scholar] [CrossRef]
- Bolbot, V. Storage, Handling and Boil-Off of LNG on Ships. Ph.D. Thesis, NTUA, Athens, Greece, 2014. [Google Scholar]
- Ortiz-Imedio, R.; Caglayan, D.G.; Ortiz, A.; Heinrichs, H.; Robinius, M.; Stolten, D.; Ortiz, I. Power-to-Ships: Future Electricity and Hydrogen Demands for Shipping on the Atlantic Coast of Europe in 2050. Energy 2021, 228, 120660. [Google Scholar] [CrossRef]
- U.S. Department of Energy. Fuel Cell Fact Sheet; U.S. Department of Energy: Washington, DC, USA, 2015. [Google Scholar]
- Zhang, Q.; Wan, Z.; Hemmings, B.; Abbasov, F. Reducing black carbon emissions from Arctic shipping: Solutions and policy implication. J. Clean. Prod. 2019, 241, 118261. [Google Scholar] [CrossRef]
- Horvath, S.; Fasihi, M.; Breyer, C. Techno-Economic Analysis of a Decarbonized Shipping Sector: Technology Suggestions for a Fleet in 2030 and 2040. Energy Convers. Manag. 2018, 164, 230–241. [Google Scholar] [CrossRef]
- Korberg, A.D.; Brynolf, S.; Grahn, M.; Skov, I.R. Techno-Economic Assessment of Advanced Fuels and Propulsion Systems in Future Fossil-Free Ships. Renew. Sustain. Energy Rev. 2021, 142, 110861. [Google Scholar] [CrossRef]
- Fan, H.; Tu, H.; Enshaei, H.; Xu, X.; Wei, Y. Comparison of the Economic Performances of Three Sulphur Oxides Emissions Abatement Solutions for a Very Large Crude Carrier (VLCC). J. Mar. Sci. Eng. 2021, 9, 221. [Google Scholar] [CrossRef]
- Oloruntobi, O.; Chuah, L.F.; Mokhtar, K.; Gohari, A.; Onigbara, V.; Chung, J.X.; Mubashir, M.; Asif, S.; Show, P.L.; Han, N. Assessing Methanol Potential as a Cleaner Marine Fuel: An Analysis of Its Implications on Emissions and Regulation Compliance. Clean. Eng. Technol. 2023, 14, 100639. [Google Scholar] [CrossRef]
- Biswajoy, R.; Comer, B. Alternatives to Heavy Fuel Oil Use in the Arctic: Economic and Environmental Tradeoffs; International Council on Clean Transportation: Washington, DC, USA, 2017. [Google Scholar]
- Verhelst, S.; Turner, J.W.; Sileghem, L.; Vancoillie, J. Methanol as a Fuel for Internal Combustion Engines. Prog. Energy Combust. Sci. 2019, 70, 43–88. [Google Scholar] [CrossRef]
- Kistner, L.; Bensmann, A.; Minke, C.; Hanke-Rauschenbach, R. Comprehensive Techno-Economic Assessment of Power Technologies and Synthetic Fuels under Discussion for Ship Applications. Renew. Sustain. Energy Rev. 2023, 183, 113459. [Google Scholar] [CrossRef]
- Ryste, J.A. Comparison of Alternative Marine Fuels; DNV GL: Bærum, Norway, 2019. [Google Scholar]
- Jeong, B.; Lee, B.S.; Zhou, P.; Ha, S. Determination of Safety Exclusion Zone for LNG Bunkering at Fuel-Supplying Point. Ocean Eng. 2018, 152, 113–129. [Google Scholar] [CrossRef]
- Livaniou, S.; Chatzistelios, G.; Lyridis, D.V.; Bellos, E. LNG vs. MDO in Marine Fuel Emissions Tracking. Sustainability 2022, 14, 3860. [Google Scholar] [CrossRef]
- Kovalenko, A.; Morgunova, M.; Gribkovskaia, V. Infrastructural Synergy of the Northern Sea Route in the International Context; Sinergia Arktiki, 2018; Volume 4, pp. 57–67. Available online: https://www.researchgate.net/publication/330643092_INFRASTRUCTURAL_SYNERGY_OF_THE_NORTHERN_SEA_ROUTE_IN_THE_INTERNATIONAL_CONTEXT#fullTextFileContent (accessed on 7 May 2023).
- Wissner, N.; Cames, M.; Healy, S.; Sutter, J. Methanol as a Marine Fuel; Naturschutzbund Deutschland: Stuttgart, Germany, 2023. [Google Scholar]
- Parfomak, P.W.; Frittelli, J.; Lattanzio, R.K.; Ratner, M. LNG as a Maritime Fuel: Prospects and Policy; Congressional Research Service: Washington, DC, USA, 2019. [Google Scholar]
- Mäkitie, T.; Steen, M.; Saether, E.A.; Bjørgum, Ø.; Poulsen, R.T. Norwegian Ship-Owners’ Adoption of Alternative Fuels. Energy Policy 2022, 163, 112869. [Google Scholar] [CrossRef]
- Parry, I.; Heine, D.; Kizzier, K.; Smith, T. Carbon Taxation for International Maritime Fuels: Assessing the Options; International Monetary Fund: Washington, DC, USA, 2018. [Google Scholar]
- Alam, S.; Flora, A.; Isaad, H.; Jain, P.; Jaller-Makarewicz, A.M.; Morrison, K.; Peh, G.; Reynolds, S.; Robertson, B.; Williams-Derry, C. Global LNG Outlook 2003–2027; The Institute for Energy Economics and Financial Analysis: Cleveland, OH, USA, 2023. [Google Scholar]
- MAN. MAN Engines: The First Dual Fuel Hydrogen Engines in Use on a Work Boat. Available online: https://press.mantruckandbus.com/corporate/man-engines-the-first-dual-fuel-hydrogen-engines-in-use-on-a-work-boat/ (accessed on 7 May 2023).
- He, Z.; Gao, Z.; Zhu, L.; Li, S.; Li, A.; Zhang, W.; Huang, Z. Effects of H2 and CO Enrichment on the Combustion, Emission and Performance Characteristics of Spark Ignition Natural Gas Engine. Fuel 2016, 183, 230–237. [Google Scholar] [CrossRef]
- Ma, F.; Wang, Y.; Liu, H.; Li, Y.; Wang, J.; Zhao, S. Experimental Study on Thermal Efficiency and Emission Characteristics of a Lean Burn Hydrogen Enriched Natural Gas Engine. Int. J. Hydrog. Energy 2007, 32, 5067–5075. [Google Scholar] [CrossRef]


| Item | Ship Data |
|---|---|
| Length (m) | 142 |
| Breadth (m) | 31 |
| Draft (m) | 8 |
| CB | 0.52 |
| Δ (tonnes) | 18,896 |
| Deadweight (tonnes) | 5000 |
| Passengers (incl. crew) | 130 |
| Operational area | Baltic Sea, North Sea, Norwegian Sea, Greenland Sea, Barents Sea, Svalbard Archipelago |
| a/a | Energy Source | Endurance and Energy Capacity for Operations | Technology Maturity and Regulatory Readiness for Technology Acceptance | Infrastructure Readiness and Fuel Availability in the Operational Area | Selection for SWOT |
|---|---|---|---|---|---|
| 1 | Nuclear | Very good | Mediocre, as the regulations are available and skills are present, but the skills are being degraded [51,52] | Low in Finland | No |
| 2 | Solar | Very limited | Good | Low solar power availability | No |
| 3 | Battery (electrical) | Low | Very good | Very good | No |
| 4 | Ethanol | Good | Mediocre | Low | No |
| 5 | Dimethyl ether | Good | Low | Low | No |
| 6 | CNG | Very good | Very good | Low | No |
| 7 | LNG | Very good | Very good | Very good | Yes |
| 8 | LPG | Very good | Mediocre | Low | No |
| 9 | Liquid methanol | Good | Good | Mediocre as it rapidly changing | Yes |
| 10 | Ammonia | Low | Low | Good | No |
| 11 | MDO/Biodiesel | Very good | Very good | Very good | Yes |
| 12 | Liquid hydrogen | Mediocre | Mediocre | Mediocre, but it is improving | Yes |
| MDO | LNG | LH2 | Methanol | |
|---|---|---|---|---|
| Energy density (MJ/kg) | 42.6 | 48.6 | 120 | 20 |
| η (-) | 0.45 | 0.45 | 0.5 | 0.45 |
| density (kg/m3) | 820 | 450 | 71 | 792 |
| Weight required (t) | 3790.7 | 3375.6 | 1215.0 | 7713.8 |
| Filling rate | 0.98 | 0.98 | 0.69 | 0.98 |
| Volume required for tanks (m3) | 4717.1 | 7654.4 | 24,801 | 9938.4 |
| Fuel Type | Location | Tank Dimensions (L × r) [m] | Reserved Space | Total Fuel Volume |
|---|---|---|---|---|
| MDO | Deck 1 | - | 8 tanks with a total volume of 5065 m3 | 4964 m3 (98% allowed filling rate) |
| LNG (Scenario 3) | Superstructure, main deck | 22.0 × 6.2 11.5 × 6.2 | 4 tanks with a total volume of 8091 m3 | 7929 m3 (98% allowed filling rate) |
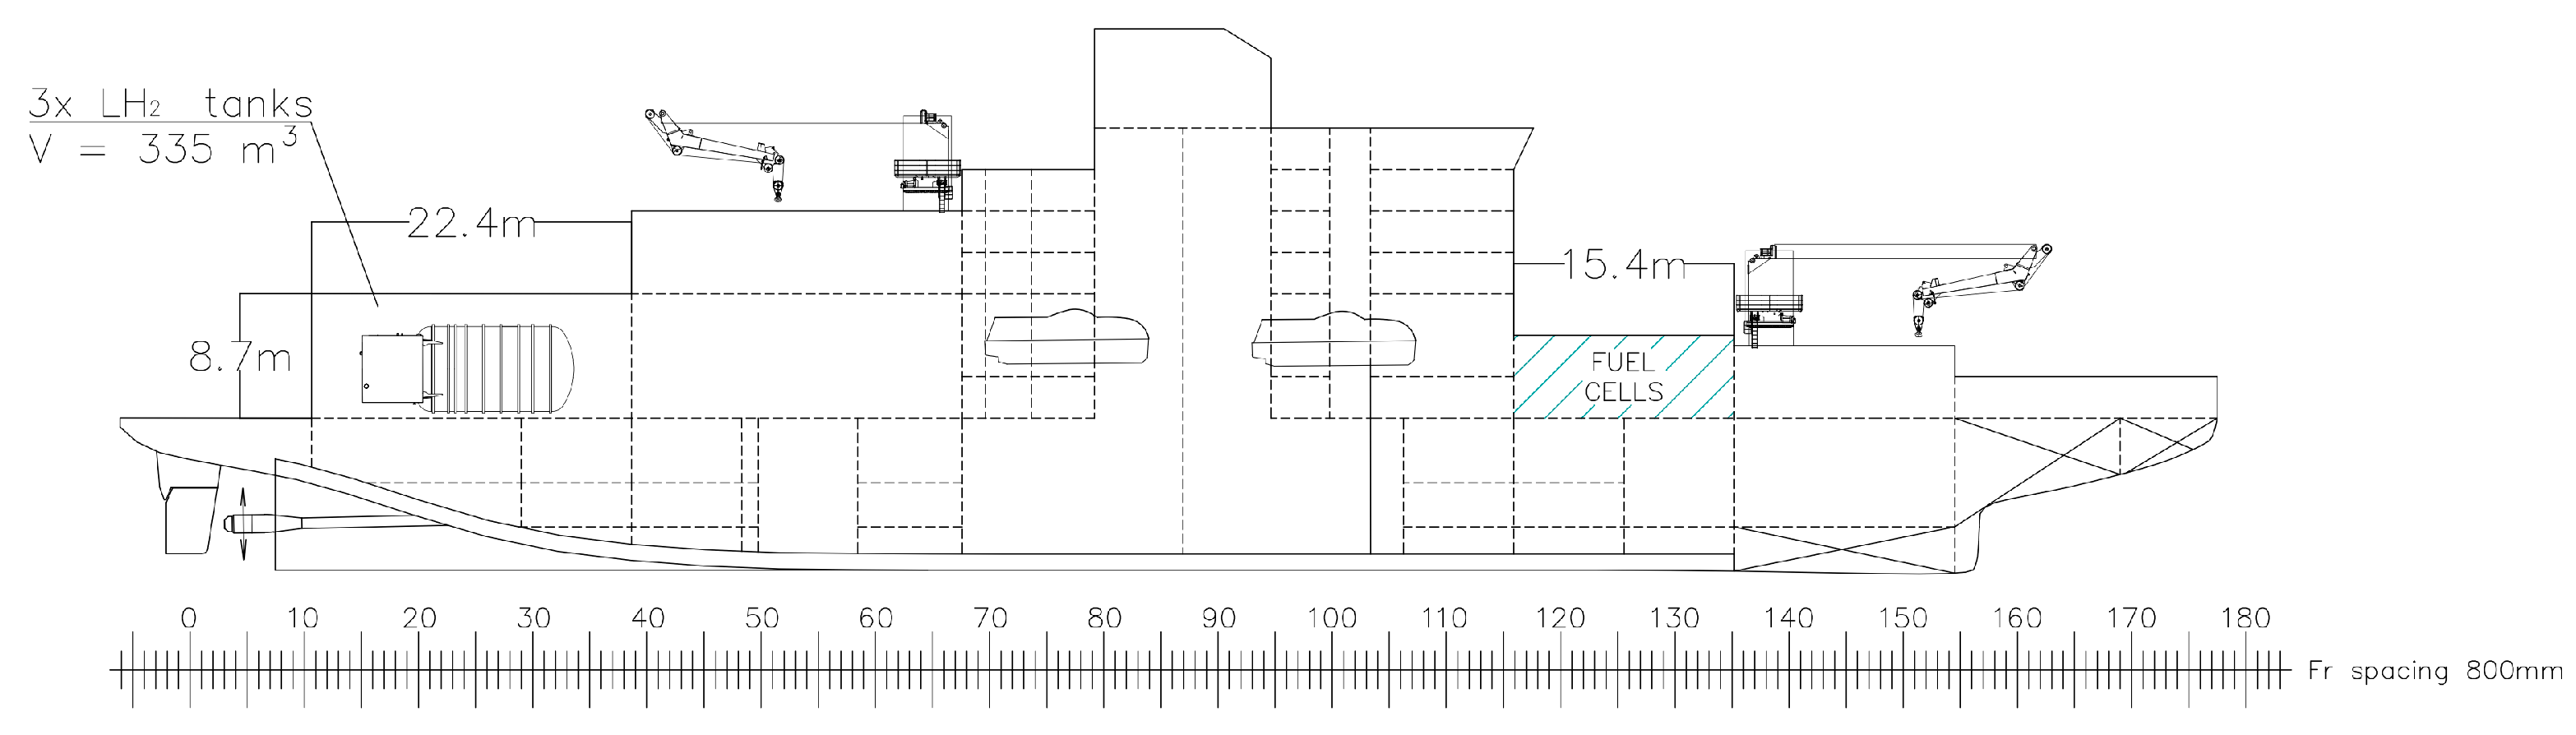
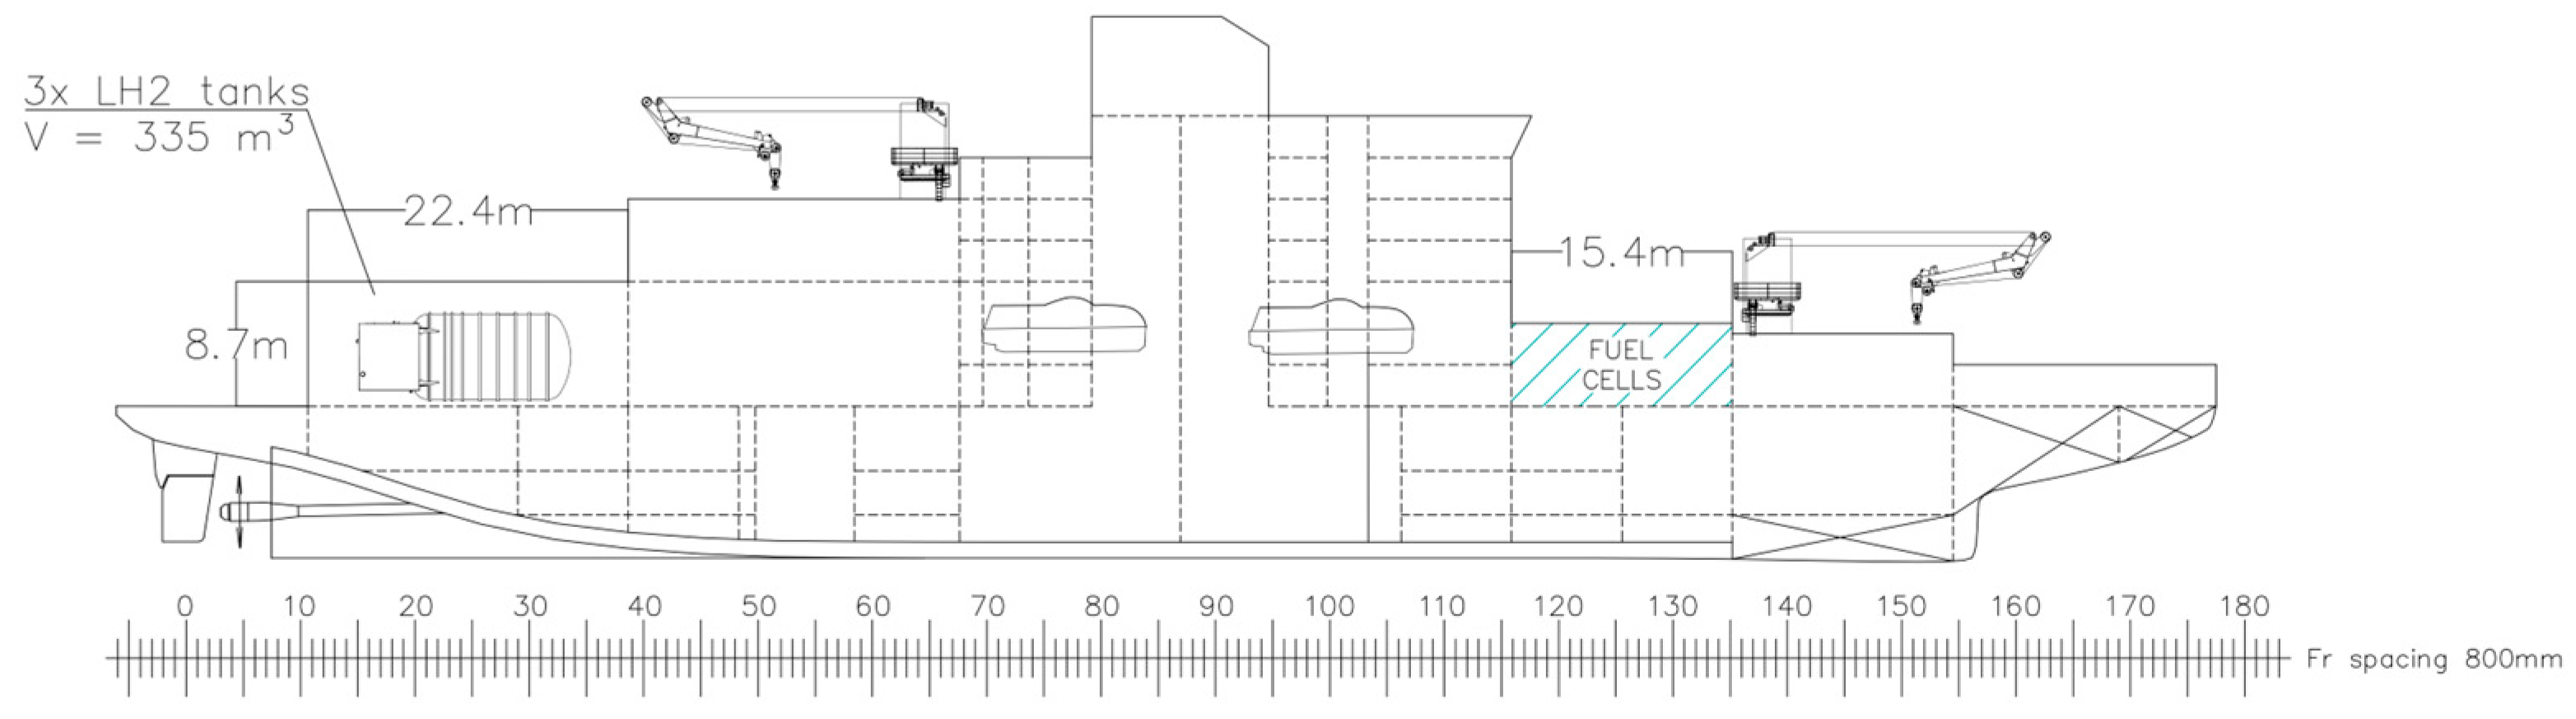
| LH2 | Superstructure, main deck | 18.0 × 5.3 | 3 tanks with a total volume of 1005 m3 | 693 m3 (69% allowed filling rate) |
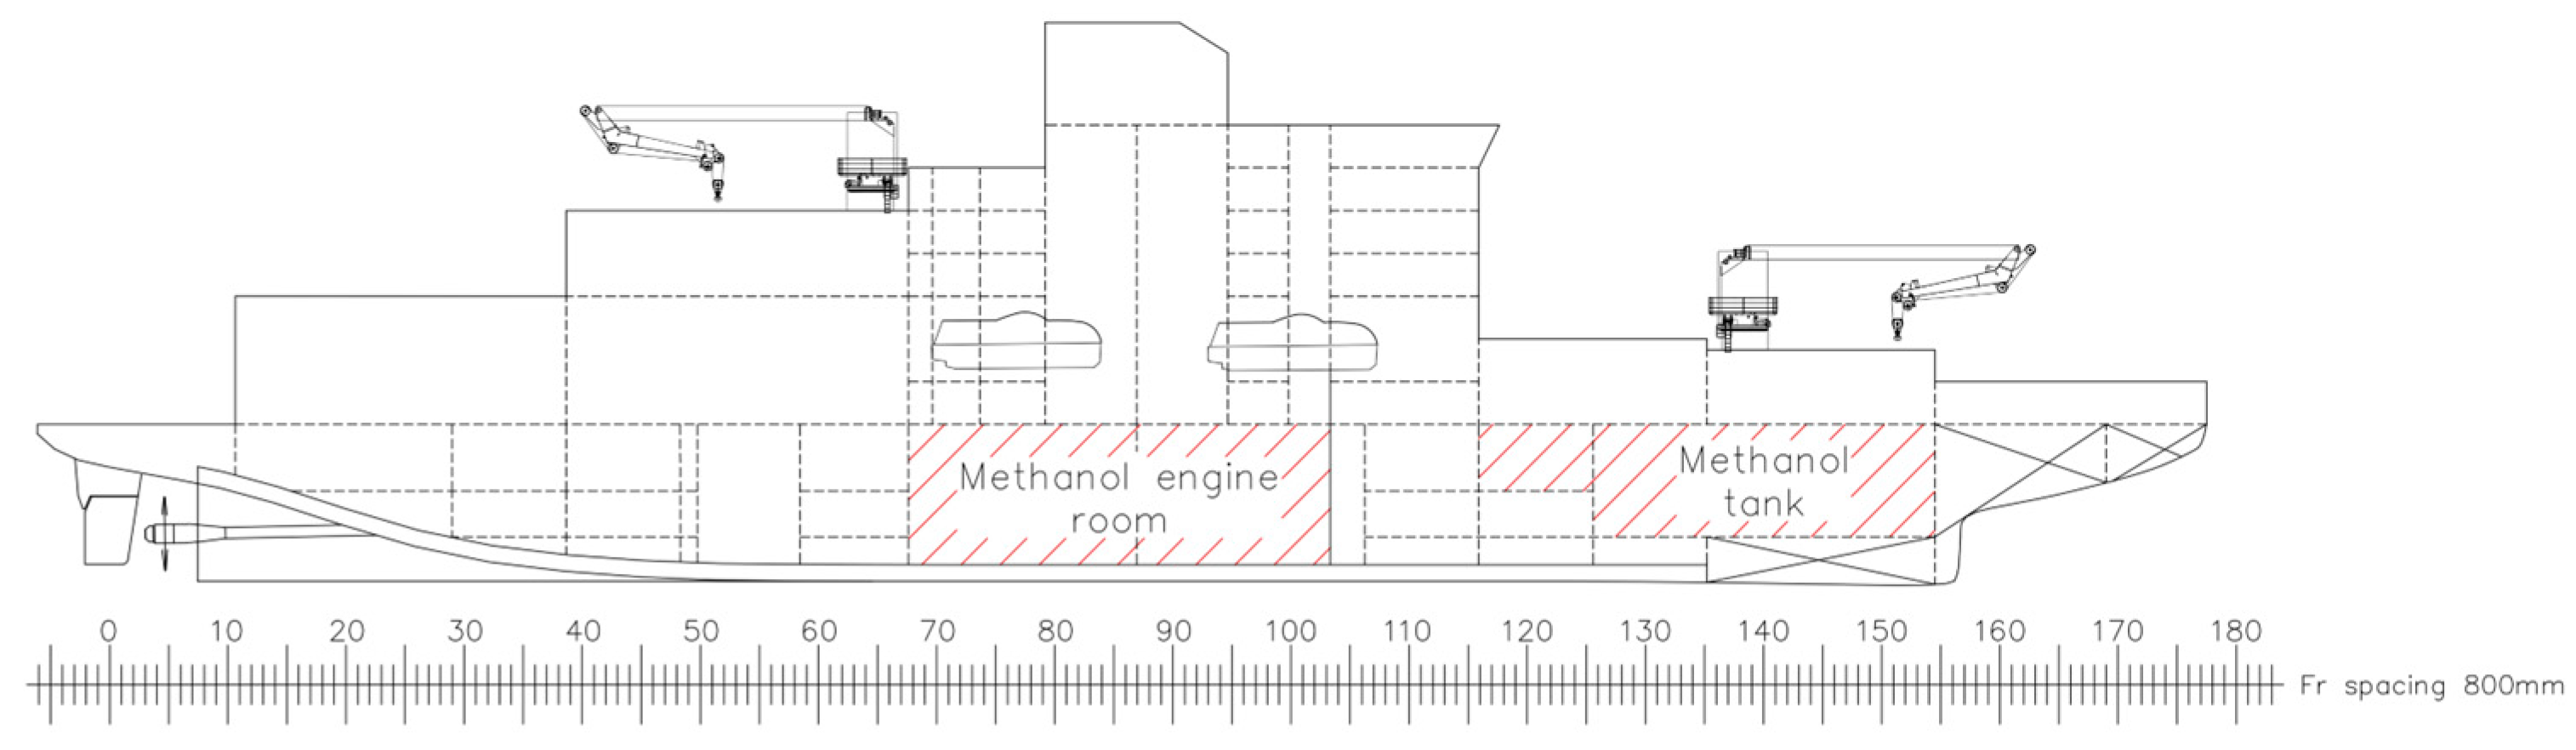
| Methanol | Deck 1, cargo space between deck 1 and the main deck | - | 8 tanks with a total volume of 5065 m3 and 6 tanks with a volume of 5000 m3 | 9859 m3 (98% allowed filling rate) |
| Diesel | LNG | Methanol | H2 | |
|---|---|---|---|---|
| (EUR/ton) | 877 | 560 | 375 | 1500 (fossil-based) 5500 (green hydrogen) |
| (EUR/kwh) | 0.012 | 0.012 | 0.012 | Not applicable |
| (t-CO2/t-fuel) | 3.206 | 2.750 | 1.375 | 0 |
| (EUR/kWh) | 0.083 | 0.31 | 0.14 | 1.71 |
| (EUR/kW) Four-stroke engines (for hydrogen PEMFC is assumed) | 240 | 470 | 265 | 730 |
| [-] | 0.45 | 0.45 | 0.45 | 0.5 |
| Diesel | LNG | Methanol | H2 (Fossil Hydrogen) | H2 (Green Hydrogen) | H2 (Green) + MDO | |
|---|---|---|---|---|---|---|
| Capex | EUR 9.4 M | EUR 25 M | EUR 12.6 M | EUR 86.1 M | EUR 86.1 M | EUR 20.6 M (EUR 28.1 M based on industry feedback) |
| Annual Opex | EUR 8.2 M | EUR 4.9 M | EUR 7.2 M | EUR 4.5 M | EUR 15.7 M | EUR 8.2 M |
| Life cycle costs | EUR 125.4 M | EUR 94.4 M | EUR 114.5 M | EUR 187.8 M | EUR 345.9 M | EUR 153.9 M (EUR 178.4 M based on industry feedback) |
| Life cycle CO2 emissions | 701 kt | 536 kt | 612 kt | 0 | 0 | 627 kt |
| Fuel | Pros | Cons |
|---|---|---|
| MDO | Business as usual. Good financial performance. No need for ship rearrangement. Can be an option if biodiesel becomes widely. available. Can be combined with other fuels. | No environmental emissions reduction. Risk of paying a carbon tax. Negative public company image. The ship needs to be ready for retrofit to another fuel type. |
| LNG | Can be combined with MDO. Reduced CO2 emissions. Greater security against a carbon tax. Can be retrofitted to methanol. Improved public image. Proven technology. Good Life cycle cost. | A radical change in ship arrangement is required if running solely on LNG with an impact on safety, if unaddressed. Issues with security supply of LNG. Still not a complete reduction in CO2. Methane slip needs due consideration as it might be considered in future regulations. High Capex. |
| LH2 or LH2 + MDO | Improved public image. Improved emissions if combined with MDO. High potential for innovation. Refuelling infrastructure available in Norway. | Can be applied only together with MDO due to low volumetric density, high boil-off rate, and inability to capture transients. Relatively new concept. Presently very costly solution. No security against carbon tax since MDO is still necessary. |
| Methanol | Easy fuel tank allocation without large modification. No frost risks. Can be combined with green methanol in the future. Achieving cost-efficient CO2 emission reduction without methane slip Improved public image. Greater safety against a potential carbon tax. DF engines available. | Toxicity risks need to be addressed. Less CO2 reduction than that of running on LNG. |
Disclaimer/Publisher’s Note: The statements, opinions and data contained in all publications are solely those of the individual author(s) and contributor(s) and not of MDPI and/or the editor(s). MDPI and/or the editor(s) disclaim responsibility for any injury to people or property resulting from any ideas, methods, instructions or products referred to in the content. |
© 2023 by the authors. Licensee MDPI, Basel, Switzerland. This article is an open access article distributed under the terms and conditions of the Creative Commons Attribution (CC BY) license (https://creativecommons.org/licenses/by/4.0/).
Share and Cite
Palmén, M.; Lotrič, A.; Laakso, A.; Bolbot, V.; Elg, M.; Valdez Banda, O.A. Selecting Appropriate Energy Source Options for an Arctic Research Ship. J. Mar. Sci. Eng. 2023, 11, 2337. https://doi.org/10.3390/jmse11122337
Palmén M, Lotrič A, Laakso A, Bolbot V, Elg M, Valdez Banda OA. Selecting Appropriate Energy Source Options for an Arctic Research Ship. Journal of Marine Science and Engineering. 2023; 11(12):2337. https://doi.org/10.3390/jmse11122337
Chicago/Turabian StylePalmén, Mikael, Ajda Lotrič, Aleksi Laakso, Victor Bolbot, Mia Elg, and Osiris A. Valdez Banda. 2023. "Selecting Appropriate Energy Source Options for an Arctic Research Ship" Journal of Marine Science and Engineering 11, no. 12: 2337. https://doi.org/10.3390/jmse11122337
APA StylePalmén, M., Lotrič, A., Laakso, A., Bolbot, V., Elg, M., & Valdez Banda, O. A. (2023). Selecting Appropriate Energy Source Options for an Arctic Research Ship. Journal of Marine Science and Engineering, 11(12), 2337. https://doi.org/10.3390/jmse11122337