Article

A New Model of Bubble Migration Velocity in Deep Water Wellbore Considering Hydrate Phase Transition

1
School of Petroleum Engineering, China University of Petroleum (East China), Qingdao 266580, China
2
Key Laboratory of Unconventional Oil & Gas Development, Ministry of Education, Qingdao 266580, China
3
National Engineering Research Center for Oil & Gas Drilling and Completion Technology, Qingdao 266580, China
4
National Key Laboratory of Marine Natural Gas Hydrate, Beijing 100028, China
*
Author to whom correspondence should be addressed.
J. Mar. Sci. Eng. 2023, 11(11), 2206; https://doi.org/10.3390/jmse11112206
Submission received: 26 October 2023 / Revised: 16 November 2023 / Accepted: 16 November 2023 / Published: 20 November 2023
(This article belongs to the Special Issue Marine Gas Hydrates: Formation, Storage, Exploration and Exploitation)

Abstract

:
Mass transfer and phase transition have an important effect on the velocity of bubble migration in deepwater wellbores, and accurate prediction of bubble migration velocity is crucial for calculating the safe shut-in period of deepwater oil and gas wells. Therefore, the effect of bubble dissolution mass transfer and hydrate phase transition on bubble migration behavior in the deepwater environment have attracted extensive attention from researchers in the fields of energy, marine chemistry, and marine engineering safety. In this work, a new model of bubble migration velocity in deepwater is developed, which considers the effect of hydrate phase transition and gas-water bidirectional cross-shell mass transfer during bubble migration. Based on the observation data of bubble migration in deepwater, the reliability of the model in predicting bubble migration velocity is verified. Then, the model is used to calculate and analyze the bubble migration velocity and bubble migration cycle under different initial bubble size, different annular fluid viscosity, and density. The results show that the initial size of bubble and the viscosity of annulus fluid are the main factors affecting the migration velocity of the bubble, but the density of annulus fluid has little effect on the migration velocity of the hydrated bubble and clean bubble. In addition, the migration velocity of the clean bubble gradually increases during the migration process from the bottom to the wellhead, while the migration velocity of the hydrated bubble is divided into a gradually decreasing stage and a slowly increasing stage. The gas consumption and the thickening of hydrate shell in the gradually decreasing stage play a dominant role, and the increase of bubble volume caused by the decrease of pressure in the slowly increasing stage is the most important factor. The formation of the hydrated bubble can significantly reduce the migration velocity of the bubble and effectively prolong the safe shut-in period. This study provides a reference for quantitative description and characterization of complex bubble migration behavior with phase change and mass transfer in deepwater environment.

1. Introduction

There are abundant oil and gas resources in deepwater areas of the world, and the scale of oil and gas exploration and development is gradually increasing. However, the harsh marine environment and complex geological condition greatly increase the difficulty of oil and gas exploration and development [1,2]. The well will be shut-in when encountering severe sea conditions or complex conditions such as gas invasion during drilling. Gas in the reservoir invades the wellbore annulus through diffusion and displacement during well shut-in. When the diameter of the bubble invading the annulus is larger than the critical suspension diameter, the bubble will slide off and rise [3,4]. As the fluid temperature in the wellbore annulus is close to the environment temperature during well shut-in, when the bubble slips up to the hydrate generation area, the hydrate shell will be formed on the surface and continuously thicken. When the gas bubble coating the hydrate shell (hereinafter referred to as “hydrated bubble”) migrates to the wellhead of the submarine mudline (in this study, the mudline refers to the seabed, which is the location of the underwater wellhead), the hydrate shell continues to grow and hydrated bubbles accumulate under the condition of low temperature and high pressure. This can even cause serious accidents such as blowout preventer blockage, which will bring severe challenges to subsequent well opening operations [5]. Therefore, accurate prediction of bubble migration velocity is crucial for calculating the safe shut-in period of deepwater oil and gas wells.
The migration behavior of bubbles in deepwater wellbores is closely related to the bubble shape, fluid properties, and other factors. Due to the special temperature and pressure environment, when bubbles enter the hydrate formation area, the influence of hydrate phase transition on the migration behavior of bubbles is more complex [6,7]. In recent years, many scholars have studied the migration behavior of bubbles in deepwater wellbores. Joseph et al. [8] established a model for the rising velocity of uncovered hydrate shell bubbles (hereinafter referred to as “clean bubble”) in deepwater environments, considering the influence of surface tension and fluid viscosity. Peebles and Garberd et al. [9] considered the influence of bubble deformation and flow field on the migration velocity of bubbles, and established a segmented prediction model for the migration velocity of clean bubbles based on the Reynolds number range. Collins et al. [10] further considered the influence of wall limitation on the rising velocity of deepwater bubbles, and modified the segmented prediction model established by Peebles and Garberd. Margaritis et al. [11] obtained a correlation formula for the migration velocity of clean bubbles using a large number of experimental data on bubble migration, which is suitable for various non-Newtonian fluids. Taylor et al. [12] used a microscope to accurately measure the thickness change of the hydrate shell at the gas–liquid interface during the experiment. Bigalke et al. [13] studied the influence of shape parameters such as bubble aspect ratio on the migration velocity of methane and carbon dioxide bubbles during their ascent in deepwater environments. Sun et al. [14] established a dynamic model for the inward growth of hydrate shell on the surface of bubbles in deepwater wellbores considering the permeation and mass transfer of water. Liu et al. [15] established a thickness prediction model for bubble migration in deepwater wellbores by considering factors such as internal pore renewal and mass transfer during hydrate shell growth. Sun et al. [16] explored the influence of undercooling on the thickness of the hydrate shell, and obtained the undercooling influence coefficient by fitting the experimental data. Wei et al. [17] established a model for the migration velocity of hydrate bubbles based on the force balance in the hydrate formation area, and characterized the increase of bubble density caused by the hydrate shell coating behavior with equivalent density.
The investigation shows that previous studies have been carried out on the prediction of the migration velocity of clean bubbles, the experimental observation and model prediction of the growth thickness of the hydrate shell. Since the migration of hydrated bubbles involves complex processes such as gas-water bidirectional mass transfer, pore renewal in hydrate shell, gas diffusion and dissolution, and gas properties changing with temperature and pressure, there are few studies on the migration velocity of hydrated bubbles in deepwater wellbore environments. In addition, the prediction model of bubble migration velocity in the whole process from generation to migration to the subsea wellhead is rarely studied. However, the research on the velocity of bubble migration in the whole process from generation to migration to the subsea wellhead is very important for accurately predicting the safe shut-in period and subsequent safe well-opening. Therefore, based on the characteristics of bubble migration in deepwater wellbores, this study established a velocity prediction model for the whole process of bubble migration from the bottom hole to the underwater wellhead by considering factors such as mass transfer, phase transition, temperature and pressure change, diffusion and dissolution. The model can accurately characterize the complex processes such as the dynamic change of hydrate shell thickness, gas-liquid bidirectional mass transfer, and pore renewal, and the accuracy of the model is verified by experimental observation data. Using the data of a deepwater well in the South China Sea, the influence of the initial size of the bubble and the properties of the annular fluid on the migration velocity were analyzed. It is hoped that this study can provide a reference for quantitative description and characterization of complex bubble migration behavior with phase transition and mass transfer in deepwater environments.

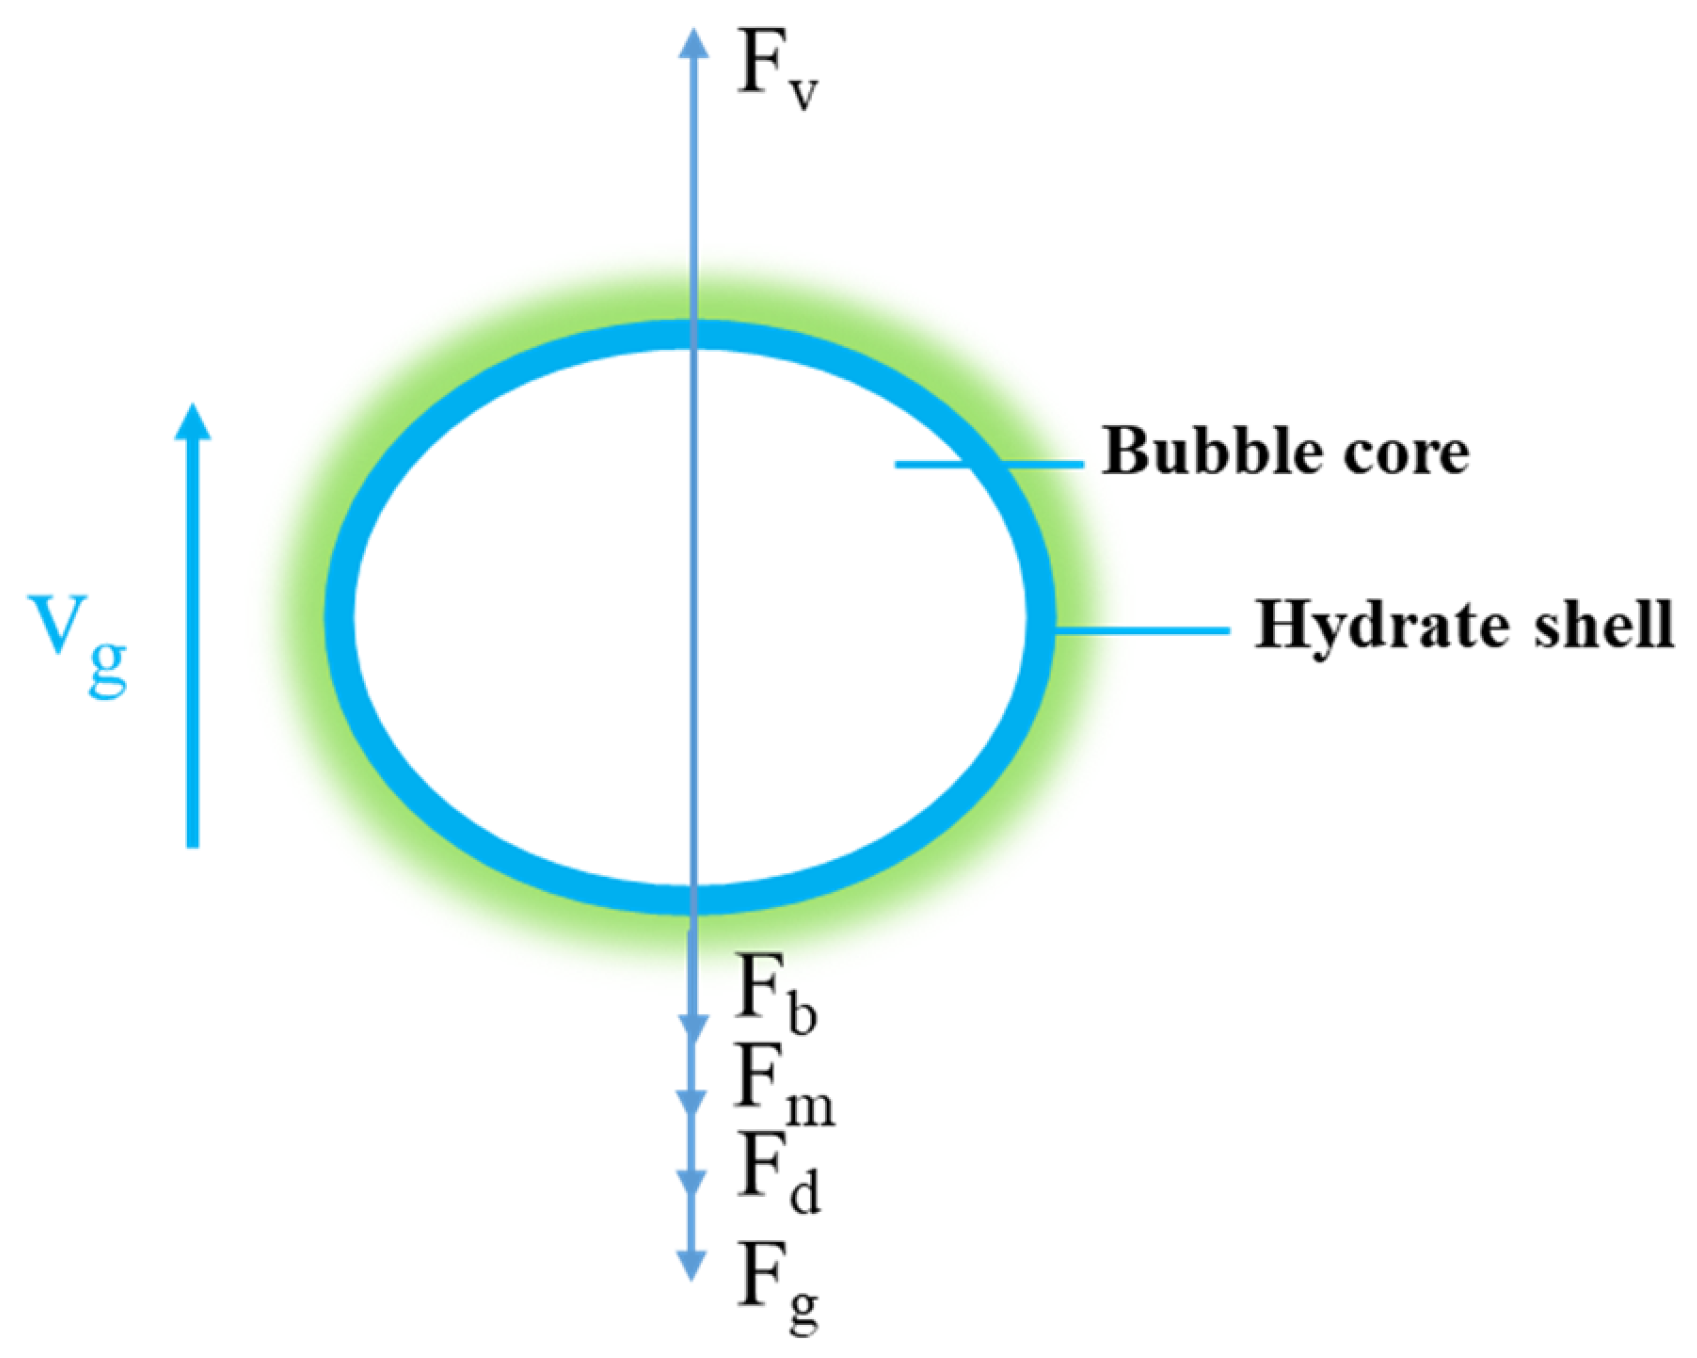
2. Model Description

Reservoir gas invades the wellbore annulus through diffusion and displacement from the rock pores in the open-hole section during the shut-in period. The gas invading the wellbore is dispersed in the annulus fluid in the form of bubbles. When the bubble size is larger than the critical suspension condition, it begins to slip and rise. Sikorski et al. found in their experiments that bubble width can better reflect the influence of fluid resistance on bubble suspension than equivalent diameter, and proposed the critical suspension condition considering the maximum bubble width [18]:
Y g = 2 π τ y R max 2 Δ ρ g V b
where Y g is the dimensionless yield stress. Δ ρ is the gas-liquid two-phase density difference, kg/m3. τ y is yield stress, Pa. g is the acceleration of gravity, m/s2. V b is bubble volume, m3. R max is the maximum width of the bubble in the horizontal direction, m.
When the maximum bubble width is larger than the critical suspension width, it migrates upward in the annulus fluid, and its migration process is shown in Figure 1. In Figure 1, the blue curve is the phase equilibrium curve of methane hydrate, and the orange curve is the shut-in wellbore temperature curve. The corresponding depth range of the area surrounded by the two curves represents the hydrate formation area. When bubbles migrate to this area, they change from clean bubbles to hydrated bubbles. When the bubble is below the hydrate formation area, its migration process is mainly affected by temperature, pressure, and the properties of the drilling fluid. When bubbles are located in the hydrate generation region, the migration process is not only influenced by the above factors, but also by the undercooling and mass transfer rate. The final position of bubble migration during well shut-in is the wellhead of the submarine mudline. Therefore, this study mainly establishes the velocity model of the whole process of bubble migration from the bottom hole to the underwater wellhead, including the clean bubble section and the hydrated bubble section.
Bubble migration in wellbore annulus is accompanied by the comprehensive effect of various forces, as shown in Figure 2. These include the gravity and buoyancy force of the bubble, the viscous resistance caused by the apparent viscosity of the fluid to the rise of the bubble, the additional mass force caused by the acceleration of the bubble and the movement of the surrounding fluid, and the Bassett force caused by the instantaneous velocity change of the bubble. The green color in Figure 2 indicates the dissolution or diffusion of the bubble into the surrounding fluid during its migration. Compared with the clean bubble, the number of forces on the hydrated bubble has not changed, but the force magnitude and change rate are different. Therefore, the clean bubble section and the hydrated bubble section can be unified modeling.
The gravity and buoyancy of bubbles can be expressed as:
F g = 4 3 π g r g + δ 3 ρ h r g 3 ρ h ρ g
F v = 4 3 π r g + δ 3 ρ l g
where F g is the force of gravity on the bubble, N. r g is bubble equivalent radius, m. ρ g and ρ l are the density of bubble and liquid, kg/m3. ρ h is the density of hydrate shell, kg/m3. δ represents the thickness of hydrate shell, m. F v is the buoyancy force of the bubble, N.
The viscous resistance caused by bubble migration in non-Newtonian fluid is mainly controlled by liquid viscosity, bubble volume, and bubble migration velocity. The viscous resistance of the bubble can be expressed as [19]:
F D = 1 2 C D π ρ l r g + δ 2 v g 2
where F D is the viscous resistance of the bubble, N. C D is the drag coefficient, dimensionless. v g is the migration velocity of bubbles, m/s.
As the bubble density is far less than the fluid density in the wellbore annulus, the bubble will accelerate when it rises from the bottom of the well, and drive the fluid around the bubble to move. The resistance increased by driving the fluid motion is the additional mass force, and its expression is [20]:
F m = 2 3 π r g + δ 3 ρ l d v g d t
where F m is the additional mass force on the bubble, N.
Bubbles will deform during the rising process, which will generate instantaneous flow resistance, whose expression is [21]:
F b = K b r g + δ 2 π μ ρ l t 0 t d v g / d t λ t t λ d t λ
where F b is Bassett force, N. K b is Bassett force coefficient. μ is fluid viscosity, Pa·s. t 0 is the initial time of deformation, s. t is the deformation termination time, s. t λ is the integral variable, s.
Considering the effects of various forces in the process of bubble migration, the force relationship is as follows:
m g d v g d t = F v F g F d F m F b
where m g is the mass of bubble, kg.
Substituting Equations (2)–(6) into Equation (7), the governing equation of bubble migration can be obtained as follows:
4 3 π r g + δ 3 ρ h r g 3 ρ h ρ g d v g d t = 4 3 π r g + δ 3 ρ l g 4 3 π r g + δ 3 ρ h r g 3 ( ρ h ρ g ) 1 2 C D π r g + δ 2 ρ l v g 2 2 3 π ( r g + δ ) 3 ρ l d v g d t K b r g + δ 2 π μ ρ l t 0 t d v g d t λ t t λ d t λ
Equation (8) is the governing equation for the migration velocity of the hydrated bubble in the deepwater wellbore annulus. When the bubble is in the non-hydrate formation region, the governing equation for the migration velocity of the clean bubble can be obtained by substituting δ = 0 ,   ρ h = ρ g into Equation (8):
4 3 π r g ρ g d v g d t = 4 3 π g r g ( ρ l ρ g ) 1 2 C D π ρ l v g 2 2 3 π r g ρ l d v g d t K b π μ ρ l t 0 t d v g d t λ t t λ d t λ

3. Determination of Key Model Parameters

According to Equations (8) and (9), the key parameters determining the migration velocity of hydrated bubbles are bubble equivalent radius r g , hydrate shell thickness δ , and drag coefficient C D , while the key parameters determining the migration velocity of clean bubbles are equivalent radius r g and drag coefficient C D . Since these key parameters are affected by temperature and pressure changes, mass transfer, and hydrate phase transition during the bubble migration process, the precise characterization of the key parameters in different bubble migration stages is the basis for accurately calculating the bubble migration velocity.

3.1. Dynamic Growth Thickness of Hydrate Shell

When the bubble enters the hydrate formation area, a thin hydrate shell will rapidly form on its surface, and the thickness of the hydrate shell is usually called the initial thickness. Shi et al. [22] found in their experiments that hydrate nucleates on the surface of the bubble, and then rapidly covers the whole bubble through lateral growth. Experimental statistics show that the formation time of the initial hydrate shell is between 10 and 25 s. Determining the initial hydrate shell thickness is the basis of establishing the hydrate shell thickness prediction model. Li et al. [23] measured the initial thickness of hydrate shell under different undercooling degrees. The results show that when the undercooling degree is greater than 1.0 K, the initial thickness of hydrate shell is inversely proportional to the undercooling degree.
δ 0 = b Δ T
where δ 0 is the initial thickness of hydrate shell, m. b is regression coefficient, m·K. Δ T is the degree of undercooling, K. According to the experimental data of Li et al., b = 3.1205 × 10 5 .
Lee et al. [24] observed the hydrate shell growing on the surface of water droplets in a gas-dominated system, and found that the hydrate shell showed an inward growth phenomenon. Li et al. [25] experimentally studied the growth process of hydrate film on the surface of water droplets suspended in the oil phase, and also found the inward growth phenomenon of the hydrate shell. Liu et al. [15] observed the inward growth phenomenon and local slight bulge of hydrate shell on the surface of suspended bubble in the aqueous phase-dominated system. These studies indicate that gas-water mass transfer determines the growth direction and thickness variation of the hydrate shell. During the dynamic growth of the hydrate shell, the changes of temperature and pressure will lead to the formation of micro-cracks in its interior [25]. Water penetrates into the hydrate shell under the action of capillary force, while gas diffuses outward through the hydrate shell. As shown in Figure 3, water penetrates into the gas-side hydrate formation layer through the micro-cracks in the hydrate shell. The water molecules infiltrated into the hydrate shell will combine with the gas molecules diffused outward to form hydrate, which makes the internal structure of the hydrate shell compact. When the gas molecules enter the water-side hydrate formation layer by diffusion, they will first dissolve into the liquid phase. When the concentration of liquid gas reaches saturation, the excess gas molecules will accelerate the growth of hydrate on the water side, and when the concentration of liquid gas is lower than the saturation concentration, the dissolution of gas in the liquid phase will inhibit the growth of hydrate on the water side. Based on the above analysis, the dynamic growth of the hydrate shell mainly includes outward growth, inward growth, and internal pore renewal.
Based on the above analysis, the reasonable assumptions before establishing the dynamic model of hydrate shell thickness in this study are as follows:
(1)
Hydrate shell is a kind of plastic-like material, which has a certain ability to resist damage [26]. Therefore, the mechanical failure of hydrate shell during bubble migration is not considered;
(2)
The hydrate shell has a porous medium-like structure, consisting of hydrate crystals and microscopic pore throats.
After the formation of the initial hydrate shell, the subsequent thickness change depends on the hydrate formation rate inside and outside the hydrate shell. The thickness change of the hydrate shell can be expressed as:
4 3 π d r g + δ 3 r g 3 ρ h d t = h f i h f o
where t is time, s. h f i and h f o are hydrate formation rates on the inside and outside of the hydrate shell, respectively, kg/s.
The bubble equivalent radius r g , hydrate shell thickness δ , and hydrate shell density ρ h all change with time due to the influence of temperature and pressure change, mass transfer, and hydrate shell compact growth. Therefore, the governing equation of hydrate shell thickness can be obtained by differentiating all variables in Equation (11):
d δ d t = 1 4 π ρ h r g + δ 2 h f i h f o 2 δ r g + δ d r g d t r g + δ 3 r g 3 3 ρ h r g + δ 2 d ρ h d t
When the water molecules on the outside of the hydrate shell permeate to the inside of the hydrate shell through micro-cracks, a large number of gas molecules around it rapidly combine with water to form the hydrate. Therefore, the water penetration rate determines the thickening rate of the inner hydrate shell, and the inward hydrate formation rate can be expressed as:
h f i = M g + n M w n M w ρ w f w
where n is the hydration number, dimensionless. M g is the molar mass of gas, kg/mol. M w is the molar mass of water, kg/mol. ρ w is the density of water, kg/m3. f w is the permeation rate of water through hydrate shell, m3/s.
According to the model proposed by Mori et al., the total mass transfer rate of water penetration can be expressed as follows [27]:
f w = π 8 μ l δ 2 σ + r c Δ p cos β γ c
where σ is the gas-water interfacial tension, N/m. β is the contact angle of capillary on the water side, rad. r c is the capillary radius, m. Δ p is the pressure difference between the inside and outside of the hydrate shell, Pa. γ c is the ability of water molecules to pass through micro-cracks, m3, which depends on the number and size of micro-cracks in the hydrate shell:
γ c = 4 π r g 2 n d r c 3 cos β s
where n d is the number of micro-cracks per unit area in the hydrate shell, 1/m2. s is the tortuosity of the micro-cracks, dimensionless.
On the outside of the hydrate shell, the formation rate of hydrate is mainly controlled by the mass transfer and dissolution rate of gas molecules. Therefore, the outer formation rate of hydrate shell can be expressed as:
h f o = M g + n M w M g ρ g f s f d
where f s is the mass transfer rate of inner gas diffusion through the hydrate shell, m3/s. f d is the dissolution rate of gas in the liquid phase, m3/s.
The mass transfer rate of bubble diffusion can be obtained by solving the steady-state diffusion equation. The diffusion equation adopted in this study is [28]
d h 2 C g r + 2 r C g r = 0
where C g is the gas concentration, m3/m3. d h is the gas diffusion coefficient inside the hydrate shell, m2/s. The diffusion coefficient d h inside the hydrate shell reflects the diffusivity of the gas along the concentration gradient. Ogasawara et al. [28] obtained that the gas diffusion coefficient inside the hydrate is about 10−11~10−12 m2/s on the basis of experimental research.
In this study, the boundary conditions corresponding to the diffusion equation are:
r = r g     ,       C g = C i         r = r g + δ     ,       C g = C o
where C i is the gas concentration inside the hydrate shell, m3/m3. C o is the gas concentration outside the hydrate shell, m3/m3.
According to the boundary conditions of Equation (18), the analytical formula of Equation (17) is obtained as follows:
C g r = r g C i r g r g + δ C o r g C i δ 1 r + r g + δ C o r g C i δ
According to Equation (19), the gas concentration gradient at position r = r g is
C g r | r = r g = r g + δ r g δ C o C i
The mass transfer rate of inner gas diffusion through the hydrate shell is
f d = 4 π r g 2 d h C g r | r = r g = 4 π d h r g r g + δ δ C i C o
The dissolution rate of gas in the liquid phase is closely related to the gas concentration difference and mass transfer coefficient at the interface between hydrate shell and the liquid phase. In addition, the rate of gas dissolution in the liquid phase also depends on the bubble surface area. The gas dissolution rate at the hydrate shell–liquid interface can be expressed as follows [29]:
f r = 4 π k h l r g + δ 2 C h C l
where C h is the gas concentration at the hydrate shell–liquid interface, m3/m3. C l is the gas concentration in the liquid phase, m3/m3. k h l is the mass transfer coefficient between hydrate shell and the liquid phase, m/s. The mass transfer coefficient determines the dissolution rate of gas in the liquid phase. Rehder et al. [30] showed that the existence of hydrate shells would increase the mass transfer resistance of gas dissolution and reduce the mass transfer coefficient. The formation of the hydrate shell leads to the transition from the original mass transfer across the gas–liquid interface to the mass transfer across the solid hydrate shell, and the mass transfer coefficient of gas in the solid phase is significantly lower than that in the liquid and gas phases. In order to accurately characterize the effect of the dissolution rate of gas mass transfer across the hydrate shell on the thickness of the hydrate shell, error analysis and optimization of the typical mass transfer model of bubble dissolution in Table 1 should be carried out by using experimental data. Rehder et al. [30] experimentally studied the variation law of the equivalent radius of methane bubbles released in the water depth range from 400 m to 1500 m with the bubble migration time. The experimental data were collected and recorded by ROV (Remote Operated Vehicle) observation. The data are of high practical value and have a strong reference significance for the establishment and verification of the bubble migration model. Therefore, in this study, error analysis and optimization of the typical mass transfer model of bubble dissolution were carried out based on the experimental data of bubble equivalent radius variation with migration time in the hydrate shell formation segment obtained by Rehder et al., which released methane bubbles at a depth of 1098.0 m.
Figure 4 shows the comparison between the calculated results of different typical mass transfer models of bubble dissolution and the experimental data. In this experiment, the equivalent radius of the hydration bubble was recorded by ROV several times from 180 s to 470 s after bubble release. The Clift model, Levich model, and Acrivos model all underestimate the gas mass transfer coefficient across the hydrate shell. Compared with the Rehder et al. experimental data, the maximum errors of the models are 21.26%, 17.35%, and 23.61%, respectively. The Oellrich model, Leclair model, Johnson model, and Winnikow model all overestimate the gas mass transfer coefficient across the hydrate shell. Compared with the Rehder et al. experimental data, the maximum errors of these models are 22.09%, 68.53%, 28.65%, and 43.11%, respectively. Based on the above analysis, the existing models cannot accurately describe the gas dissolution mass transfer behavior of hydrated bubbles. The main reason for the large prediction error of these models is that mass transfer of gas across solid hydrate shell is not considered. These models mainly consider mass transfer at the movable gas–liquid interface, so the prediction error of the mass transfer coefficient is relatively large. Among them, the average error of the Levich model is the smallest, because the situation that the gas–liquid interface is an immovable interface is considered in the modeling process. The reason for the error of this model is that the influence of the flow field around the bubble on the mass transfer coefficient is not considered. Therefore, a new mass transfer coefficient correlation model is obtained by considering the introduction of Reynolds number to modify the Levich model. The basic form of the model is as follows:
k h l = 0.624 v g 1 / 3 E r g + δ 2 / 3 Re a + b
Based on the experimental data of bubble equivalent radius of the hydrate shell formation section obtained by Rehder et al. [30], which released methane bubbles at a water depth of 1098.0 m, regression analysis was carried out and the coefficient in the model was obtained. The new mass transfer model is as follows:
k h l = 0.624 v g 1 / 3 E r g + δ 2 / 3 Re 1 / 4 + 0.72
Error analysis of the new mass transfer coefficient model was carried out using experimental data obtained by Rehder et al. [30] releasing methane bubbles at water depths of 1209.6 m and 1511.4 m. In these two experiments, the equivalent radius of the hydrated bubbles was observed and recorded, respectively, during the 140 s to 900 s and the 80 s to 1100 s after the bubbles were released. Figure 5a,b show the comparison between the calculated results of the new mass transfer coefficient model for bubble dissolution and the experimental data. The average errors are 5.41% and 6.92%, respectively, which indicates that the new mass transfer coefficient model of bubble dissolution can accurately characterize the mass transfer behavior of gas across hydrate shell.
The bidirectional mass transfer of gas and water across the hydrate shell is also accompanied by the renewal of pores in the hydrate shell. According to the relationship between the gas and water consumption during the formation of hydrate, we can obtain:
4 π r g 2 n d π r c 1 2 s δ π r c 2 s δ ρ h M g + n M w = n g c
where r c and r c 1 are pore radius before and after pore renewal, respectively, m. n g c is the gas consumption, mol. The variation of pore radius in hydrate shell with time can be obtained from Equation (24):
d r c d t = M g + n M w 8 π 2 ρ h s n d r c r g 2 δ m g s
where m g s is the gas consumption rate in the process of pore renewal, mol/s. The difference between the gas concentration in the hydrate shell near the gas phase and the gas concentration in the hydrate shell near the liquid phase represents the speed of this consumption rate, which can be expressed as:
m g s = 4 π r g 2 d h C g / r | r = r g 4 π ( r g + δ ) 2 d h C g / r | r = r g + δ

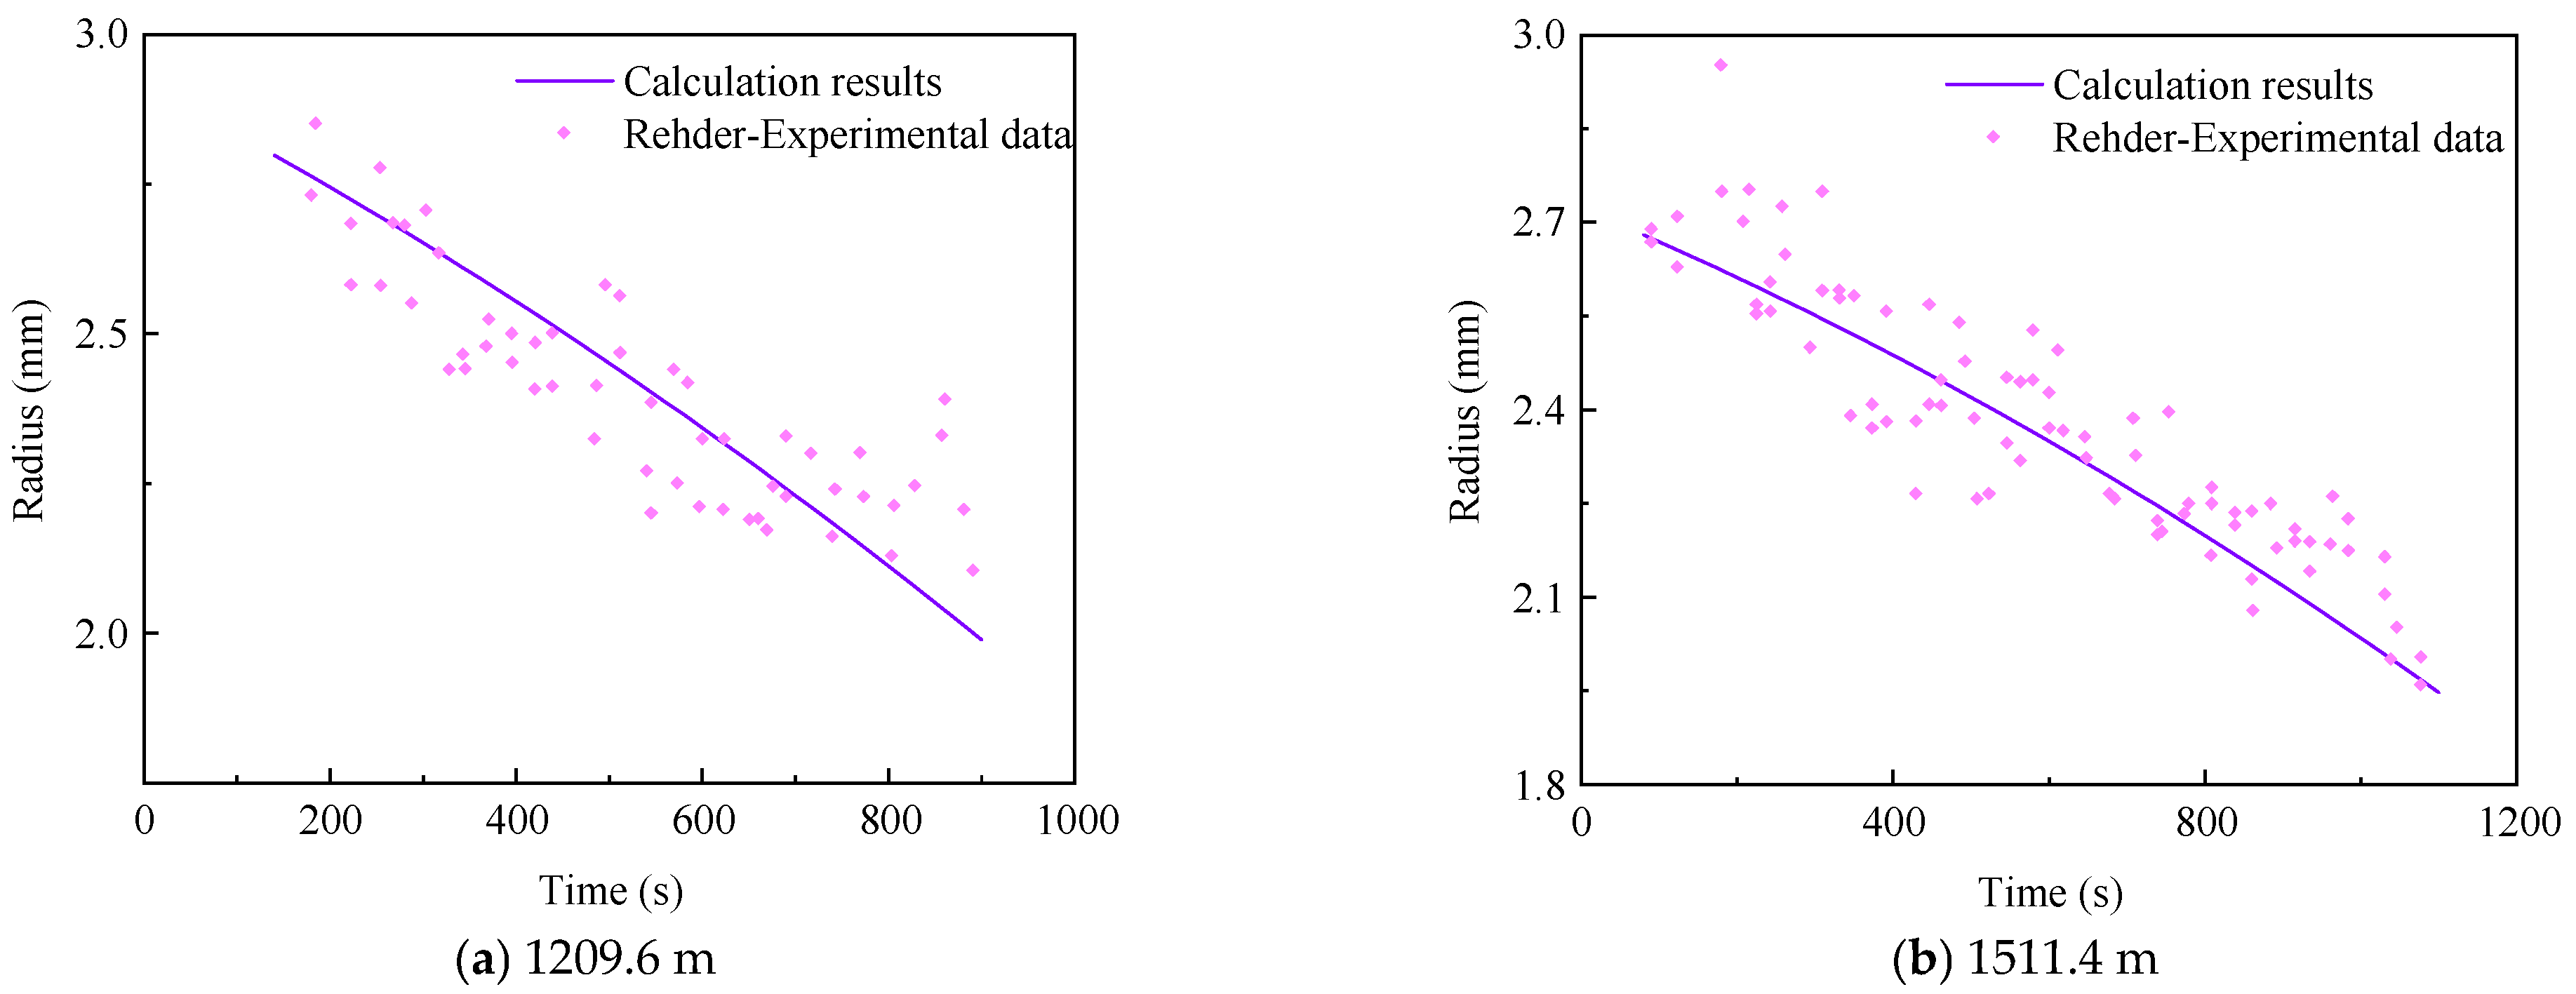
3.2. Bubble Dynamic Equivalent Radius

When the bubble is in the non-hydrate formation area in the wellbore annulus, the temperature and pressure change and dissolution are the main control factors affecting the equivalent radius of the bubble. Dissolution refers to the effect of the bubble spreading into the surrounding liquid phase due to the difference in concentration during the migration process, which causes the bubble to shrink. In the process of the bubble rising, the variation of temperature and pressure in the deepwater wellbore annulus will lead to bubble expansion. Bubble shrinkage is mainly due to the dissolution into the surrounding liquid phase during the migration process. Due to the slow upward migration speed and small pressure reduction, the volume shrinkage caused by bubble dissolution is greater than the volume expansion caused by pressure reduction, which will manifest as bubble shrinkage. Considering the influence of the above factors, the governing equation of equivalent radius in clean bubble migration section is established:
4 π r g 2 ρ g d r g d t = 4 3 π r g 3 v g ρ l g ρ g P a + T g ρ g T a 4 π r g 2 k g l m g l m l
where P a is the annular pressure of the deepwater wellbore, Pa. T a is the deepwater wellbore annulus temperature, K. T g is the temperature gradient of annulus drilling fluid, K/m. k g l is the mass transfer coefficient at the gas–liquid interface, m/s. m g l is the gas mass concentration at the gas–liquid interface, kg/m3. m l is the gas mass concentration in the drilling fluid, kg/m3.
In Equation (27), the first term on the right represents the influence of wellbore annular temperature and pressure variation on the bubble equivalent radius, and the second term on the right represents the influence of dissolution on the bubble equivalent radius. The mass transfer coefficient determines the effect of dissolution on bubble shrinkage. Clift et al. conducted relevant research on the dissolution and mass transfer of clean bubbles, and established multiple mass transfer coefficient models for different bubble migration states. Considering the air bubble migration process in the deepwater wellbore annulus, this study adopts the clean bubble dissolution mass transfer coefficient model at a low Reynolds number in deepwater established by Clift et al. [31]:
k g l = 2 π 1 2 3 1 ( 1 + 0.1415 Re 2 / 3 ) 3 / 4 E v g 2 r g 1 / 2
where Re is the Reynolds number, dimensionless. E is the diffusion coefficient of gas in drilling fluid, m2/s.
When bubbles migrate to the hydrate formation area, the change of bubble equivalent radius caused by the inward growth of hydrate shell can be described by the following equation:
M g + n M w n M w ρ w f w = 4 π r g 2 ρ h d r g d t

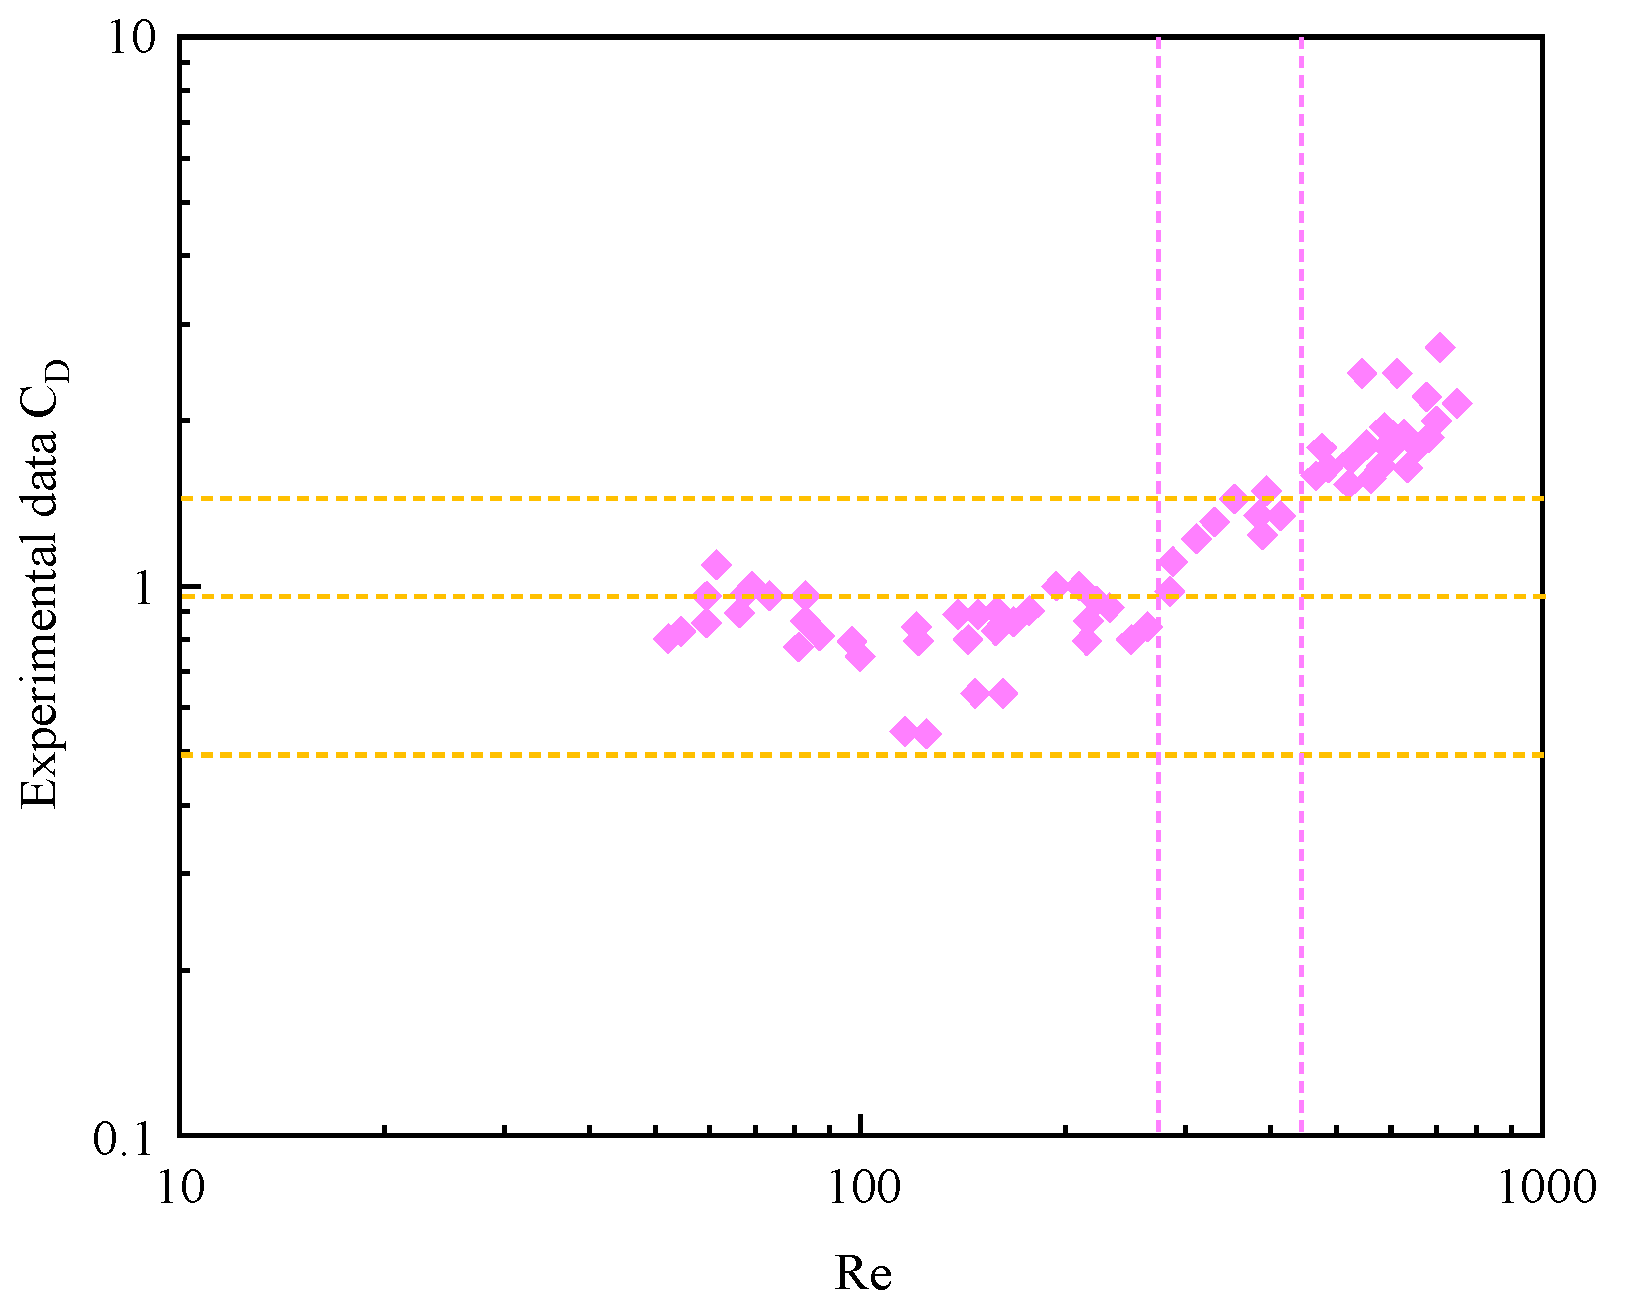
3.3. Drag Coefficient during Bubble Migration

In the research on the resistance coefficient of bubble migration, the existing models are mainly established by correlating with dimensionless numbers such as Reynolds number and Morton number, and the coefficients in the correlation model are obtained by fitting a large number of experimental data. The drag coefficient model of the clean bubble migration section is relatively mature. Since this paper mainly studies the migration of bubbles in non-Newtonian fluid in deepwater wellbore annulus, the drag coefficient model established by Rodrigue et al. [38] based on the experimental data of bubble migration in non-Newtonian fluid is adopted.
C D = 16 Re 2 n w 1 3 n w 1 2 1 + 7 n w 5 n w 2 n w n w + 2
where n w is the fluidity index, dimensionless.
Since the current research on the drag coefficient in the migration section of hydrated bubbles is not mature, this study selects the drag coefficient model suitable for the migration of hydrated bubbles by comparing the previous models with experimental data. As the applicable conditions of each model are different, the drag coefficient model which is widely used to describe bubble migration is selected for comparative analysis with the experimental data obtained during the previous research of our team [39]. By comparing the agreement between the calculated results of each model and the experimental data, the drag coefficient model suitable for the hydrated bubble migration section in non-Newtonian fluid is optimized. The typical drag coefficient model to describe bubble migration is shown in Table 2.
As shown in Figure 6a,b, the Bigalke model has a small difference with the experimental value at 0.5 < C D < 1.2 , the Tomiyama model has a high coincidence with the experimental value at C D > 1.5 , and the Bozzano model has a high coincidence with the experimental value at 0.95 < C D < 1.75 . The average error of these three models in the above interval is less than 10.0%. Since the drag coefficient calculation model is usually selected according to the Reynolds number of bubble migration, the relationship between Reynolds number and drag coefficient in the process of hydrated bubble migration obtained from previous experiments [39] is used in this study to divide the applicable range of the Bigalke model, Tomiyama model, and Bozzano model.
As shown in Figure 7, when Re < 275 , the drag coefficient value is roughly between 0.5 and 0.95, and the Bigalke model has good adaptability. When 275 Re 445 , the drag coefficient is roughly between 0.95 and 1.5, and the Bozzano model has good adaptability. When Re > 445 , the drag coefficient is greater than 1.5, and the Tomiyama model has good adaptability.
C D = f a R 2     ,     Re < 275     F A R o 2 ,     275 Re 445 max 24 Re 1 + 0.15 Re 0.687 , 8 3 E o E o + 4     ,     Re > 445  
f = 9 Re + 0.9 0.75 E o 2 0.75 E o 2 + 4.5
F = 48 Re 1 + 12 M o 1 / 3 1 + 36 M o 1 / 3 + 0.9 E o 3 / 2 1.4 1 + 30 M o 1 / 6 + E o 3 / 2
a R 2 = 2 3.974 × 10 3 W e 12.62 2 7.186 × 10 4 E o 17.87 2
A R o 2 = 10 1 + 1.3 M o 1 / 6 + 3.1 E o 10 1 + 1.3 M o 1 / 6 + E o
where E o is the Eotvos number, dimensionless, E o = g ( ρ l ρ g ) d e 2 σ . d e is the bubble equivalent diameter, m. σ is the surface tension of drilling fluid, N/m. M o is the Morton number, dimensionless, M o = g ( ρ l ρ g ) μ 4 ρ l 2 σ 3 . W e is a Weber number, dimensionless, W e = ( ρ l ρ g ) v g d e σ .

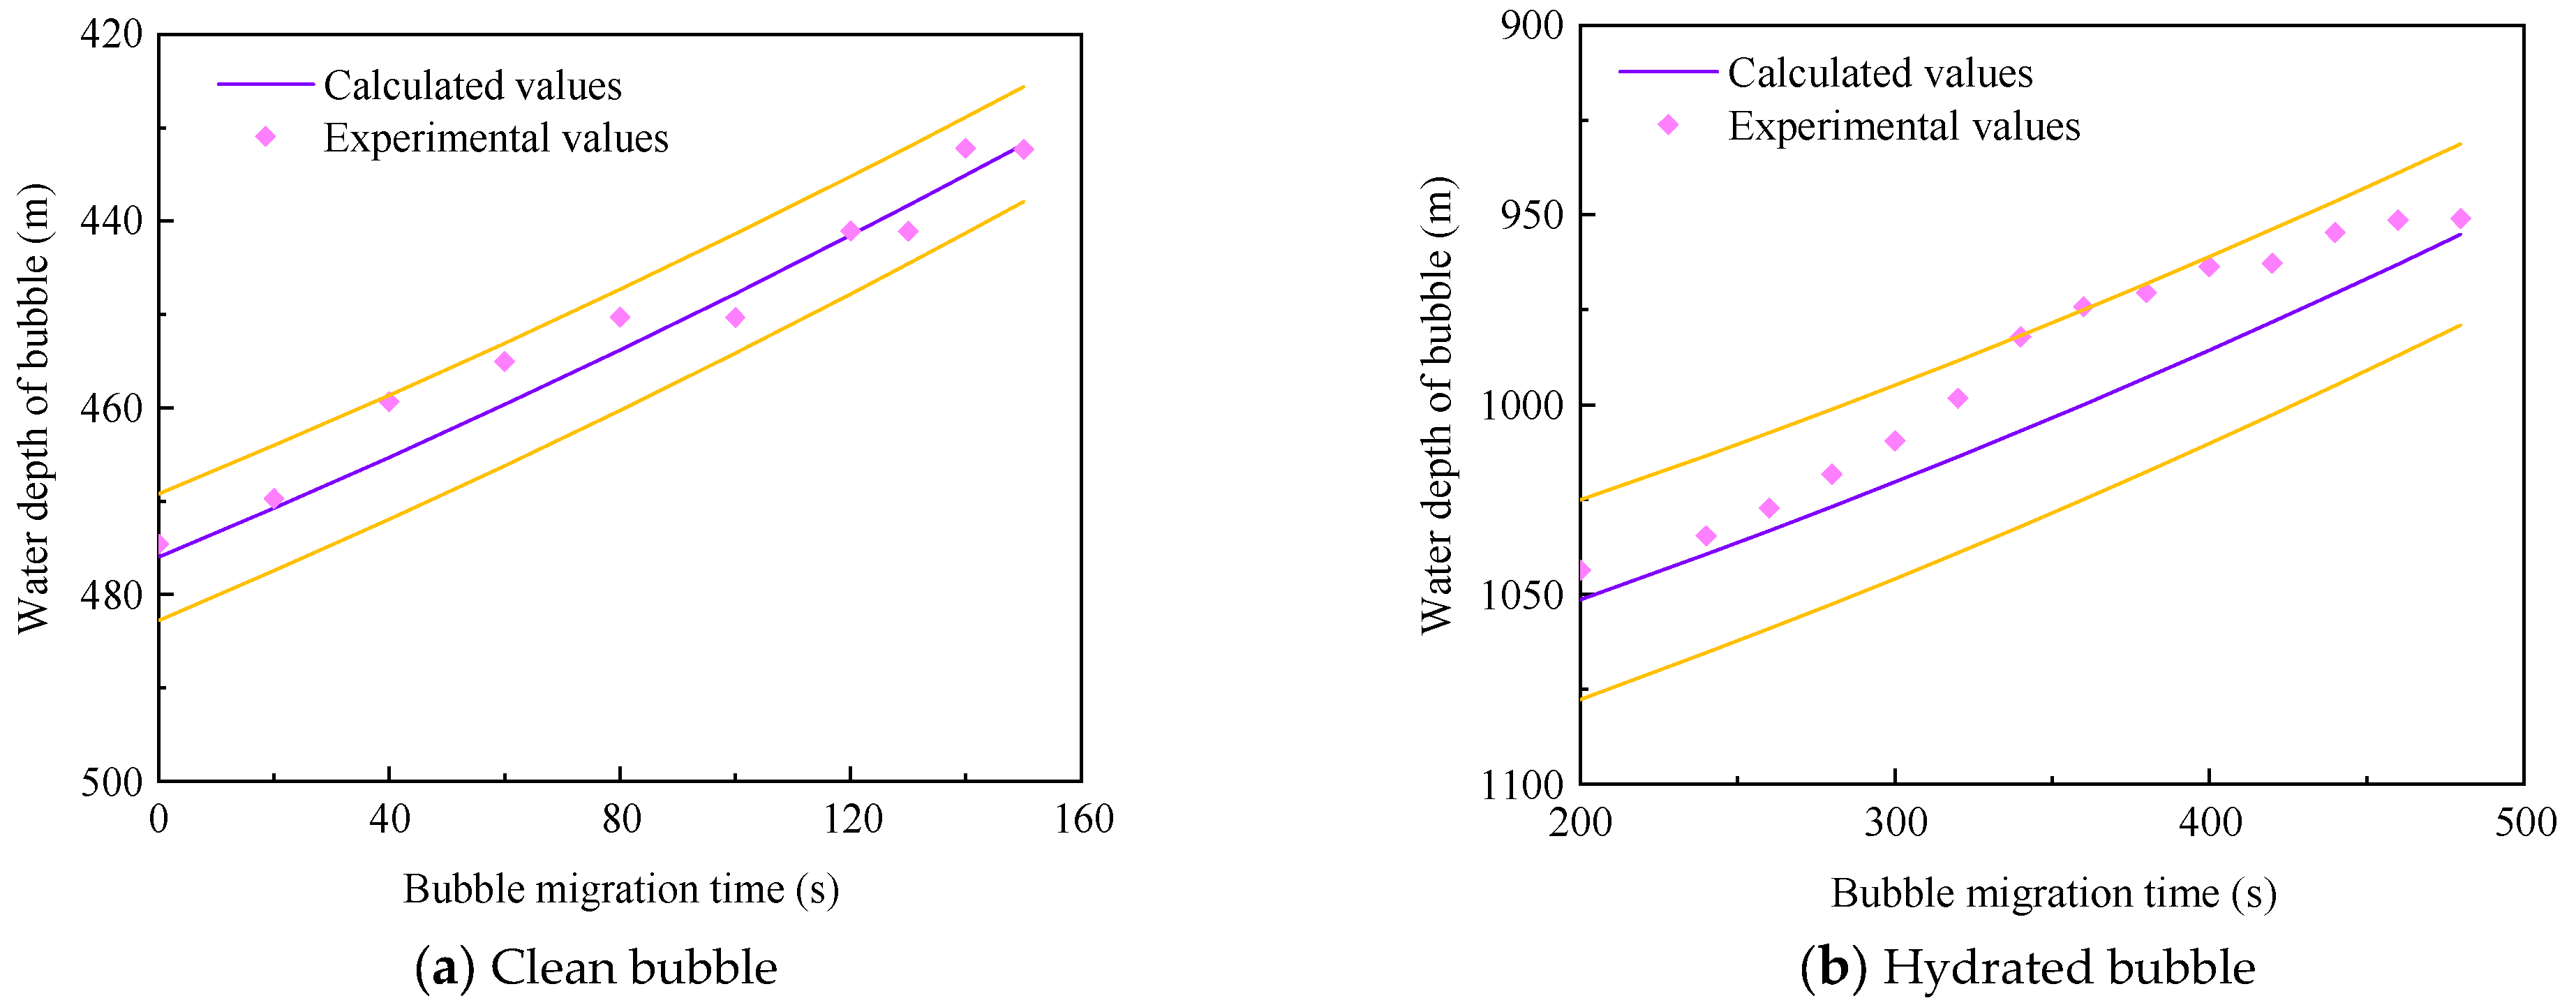
3.4. Model Verification

The clean bubble migration data obtained by Rehder et al. [30] from the observation of methane bubbles released at a depth of 475.9 m were used to verify the clean bubble migration velocity model established in this study. The observation data were collected from 0 to 150 s after the release of bubbles. At the same time, the hydrated bubble migration data obtained by Rehder et al. [30] at the depth of 1051.4 m were used to verify the hydrated bubble migration velocity model. The observed data were collected from 200 to 500 s after the release of bubbles.
Figure 8 shows the comparison between the calculated results of the clean bubble migration velocity model and the experimental data. The maximum prediction error of this model is less than 5%. Figure 8b shows the comparison between the calculated results of the hydrated bubble migration velocity model and the experimental data. The maximum prediction error of this model is less than 10%. Due to the influence of complex processes such as the dynamic growth of hydrate shell and dissolution mass transfer in the migration process of hydrated bubbles, the accuracy of the migration velocity prediction model of hydrated bubbles is lower than that of the migration velocity prediction model of clean bubbles. The error analysis shows that the bubble migration velocity model established in this study can basically realize the accurate prediction of bubble migration velocity.

4. Discussion

In deepwater wellbore annulus, key parameters such as drag coefficient and bubble equivalent radius in the bubble migration velocity model are affected by the initial bubble size and annulus fluid properties, which also lead to differences in the safe shut-in cycle. Therefore, it is necessary to analyze the influence of initial bubble size, annular fluid viscosity, and annular fluid density on the safe shut-in cycle based on the new model of bubble migration velocity. In this study, basic parameters of a deepwater gas well in the eastern South China Sea are used to analyze the influence of different parameters on bubble migration velocity and safe shut-in cycle. The well encountered severe sea conditions when drilling to the reservoir section and shut-in measures were taken. The main component of reservoir gas is methane. Basic parameters and relevant model parameters are shown in Table 3.

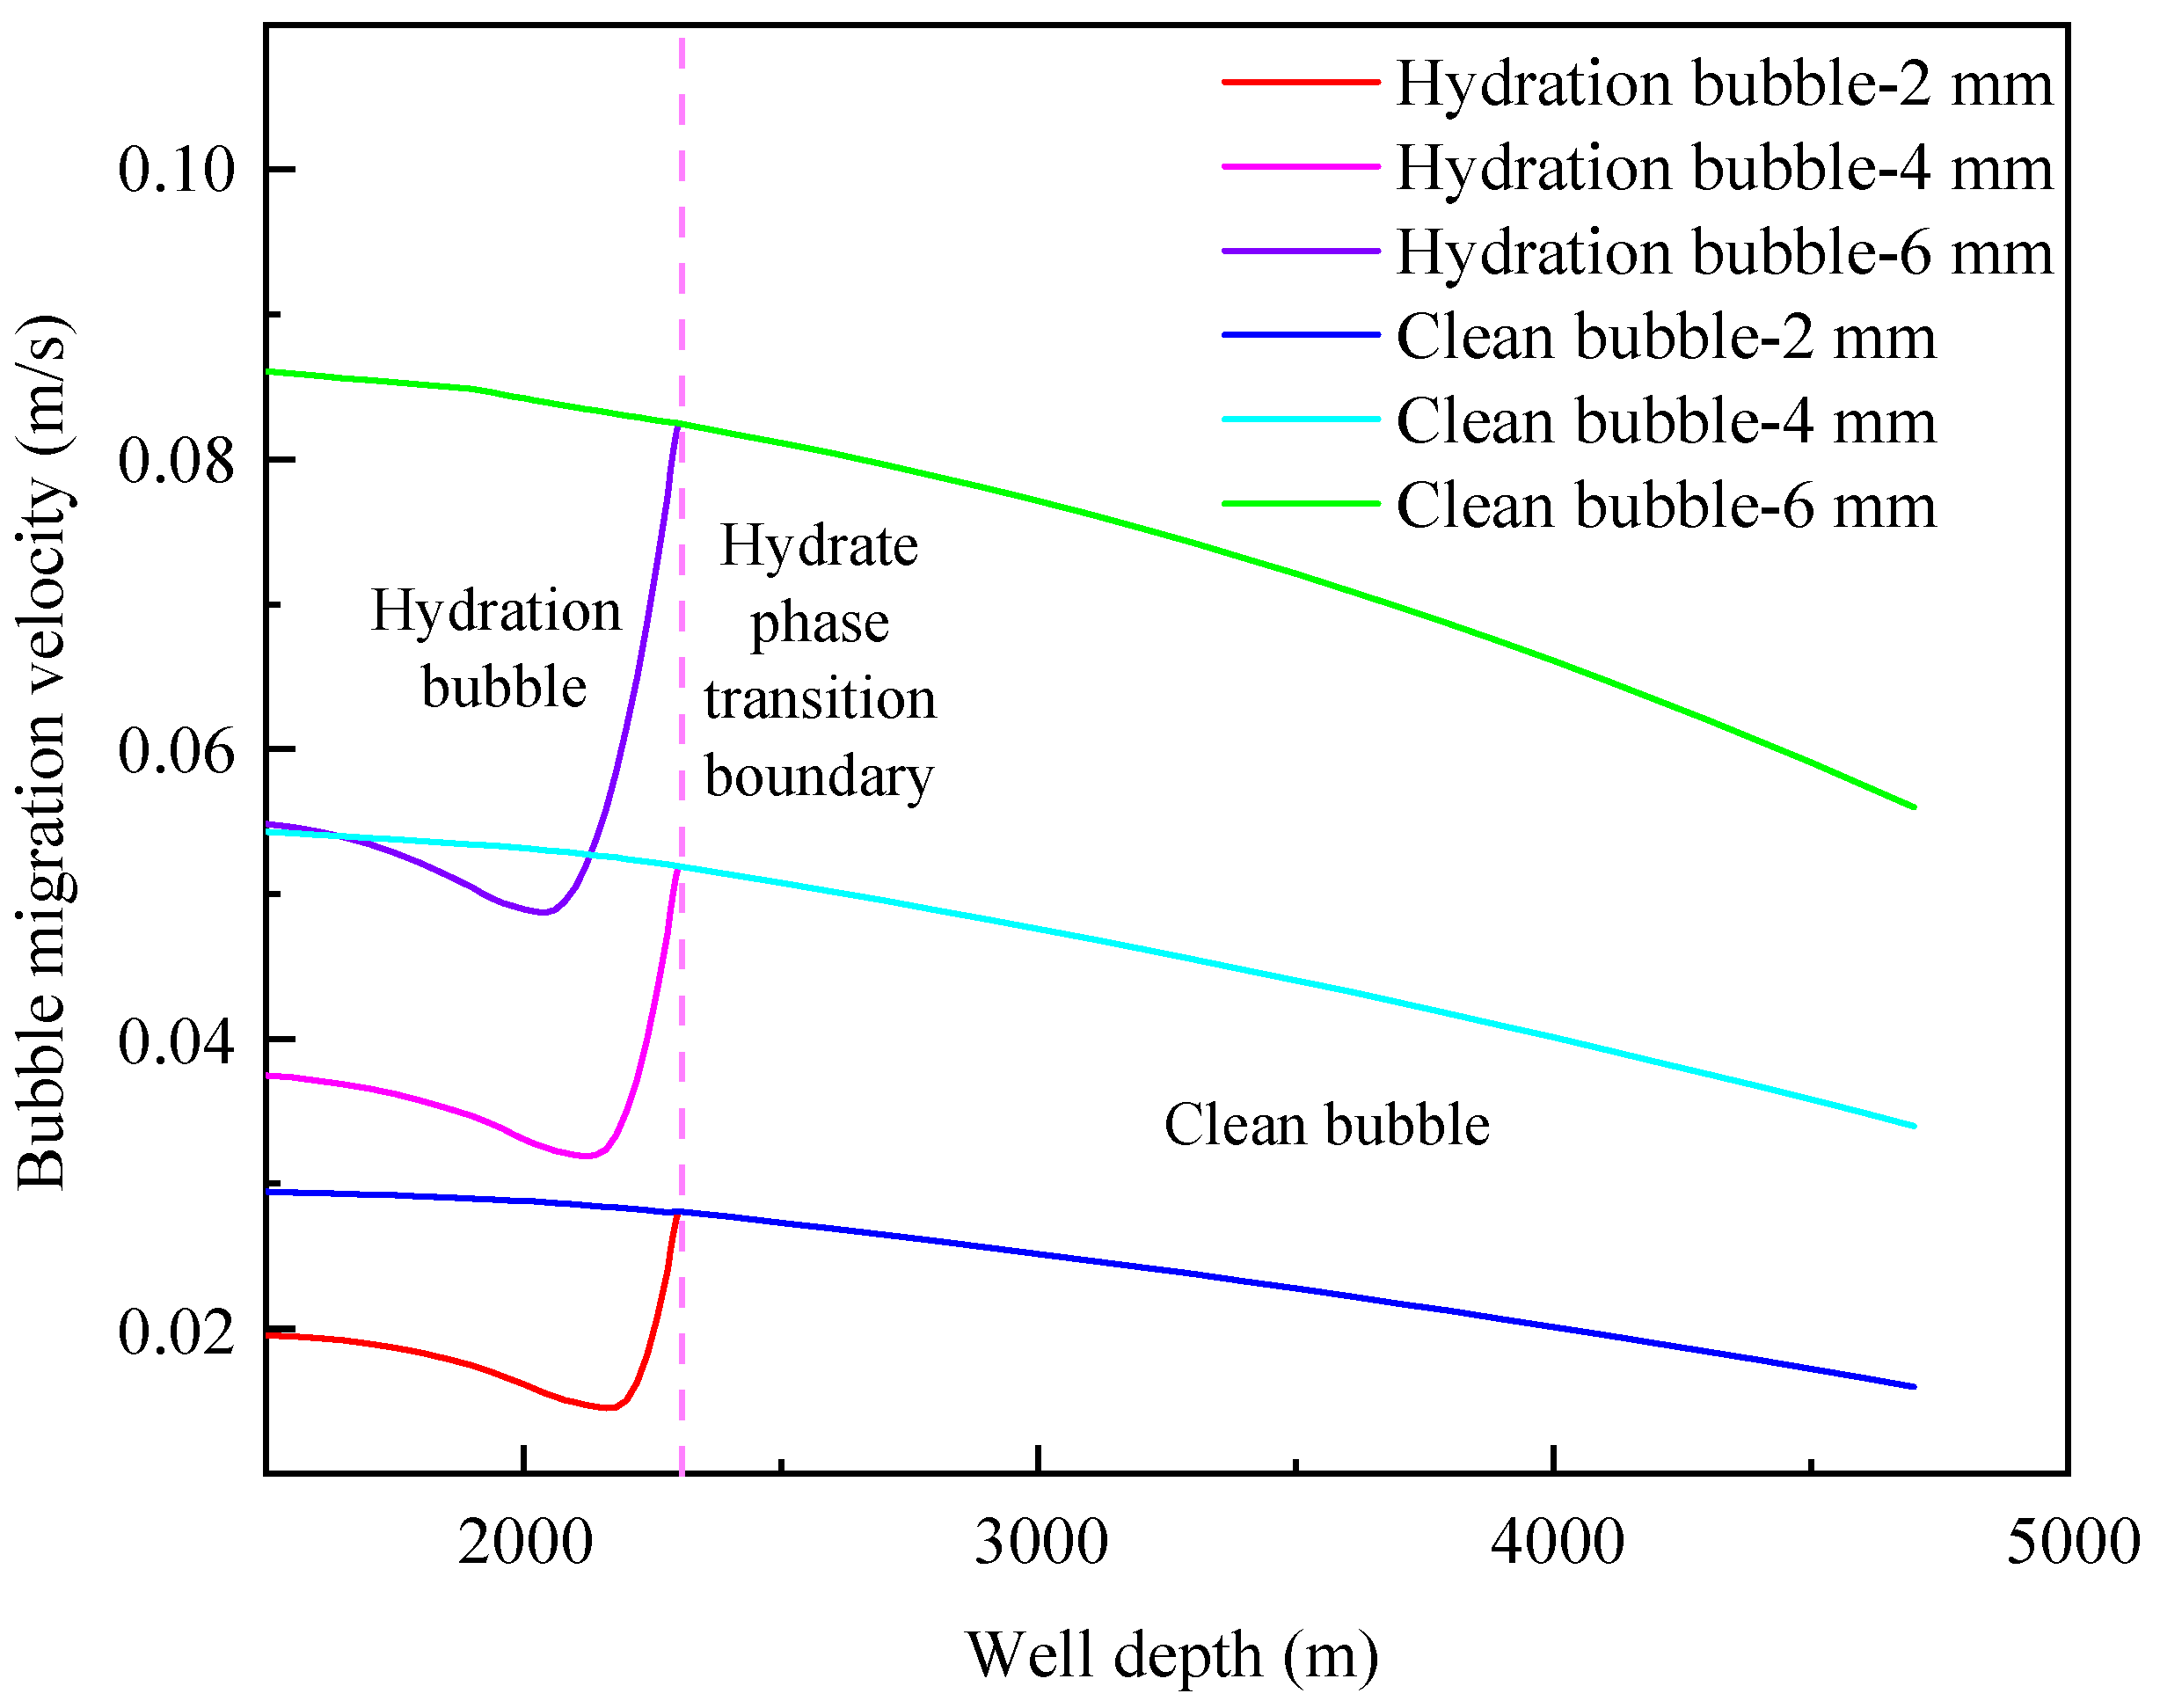
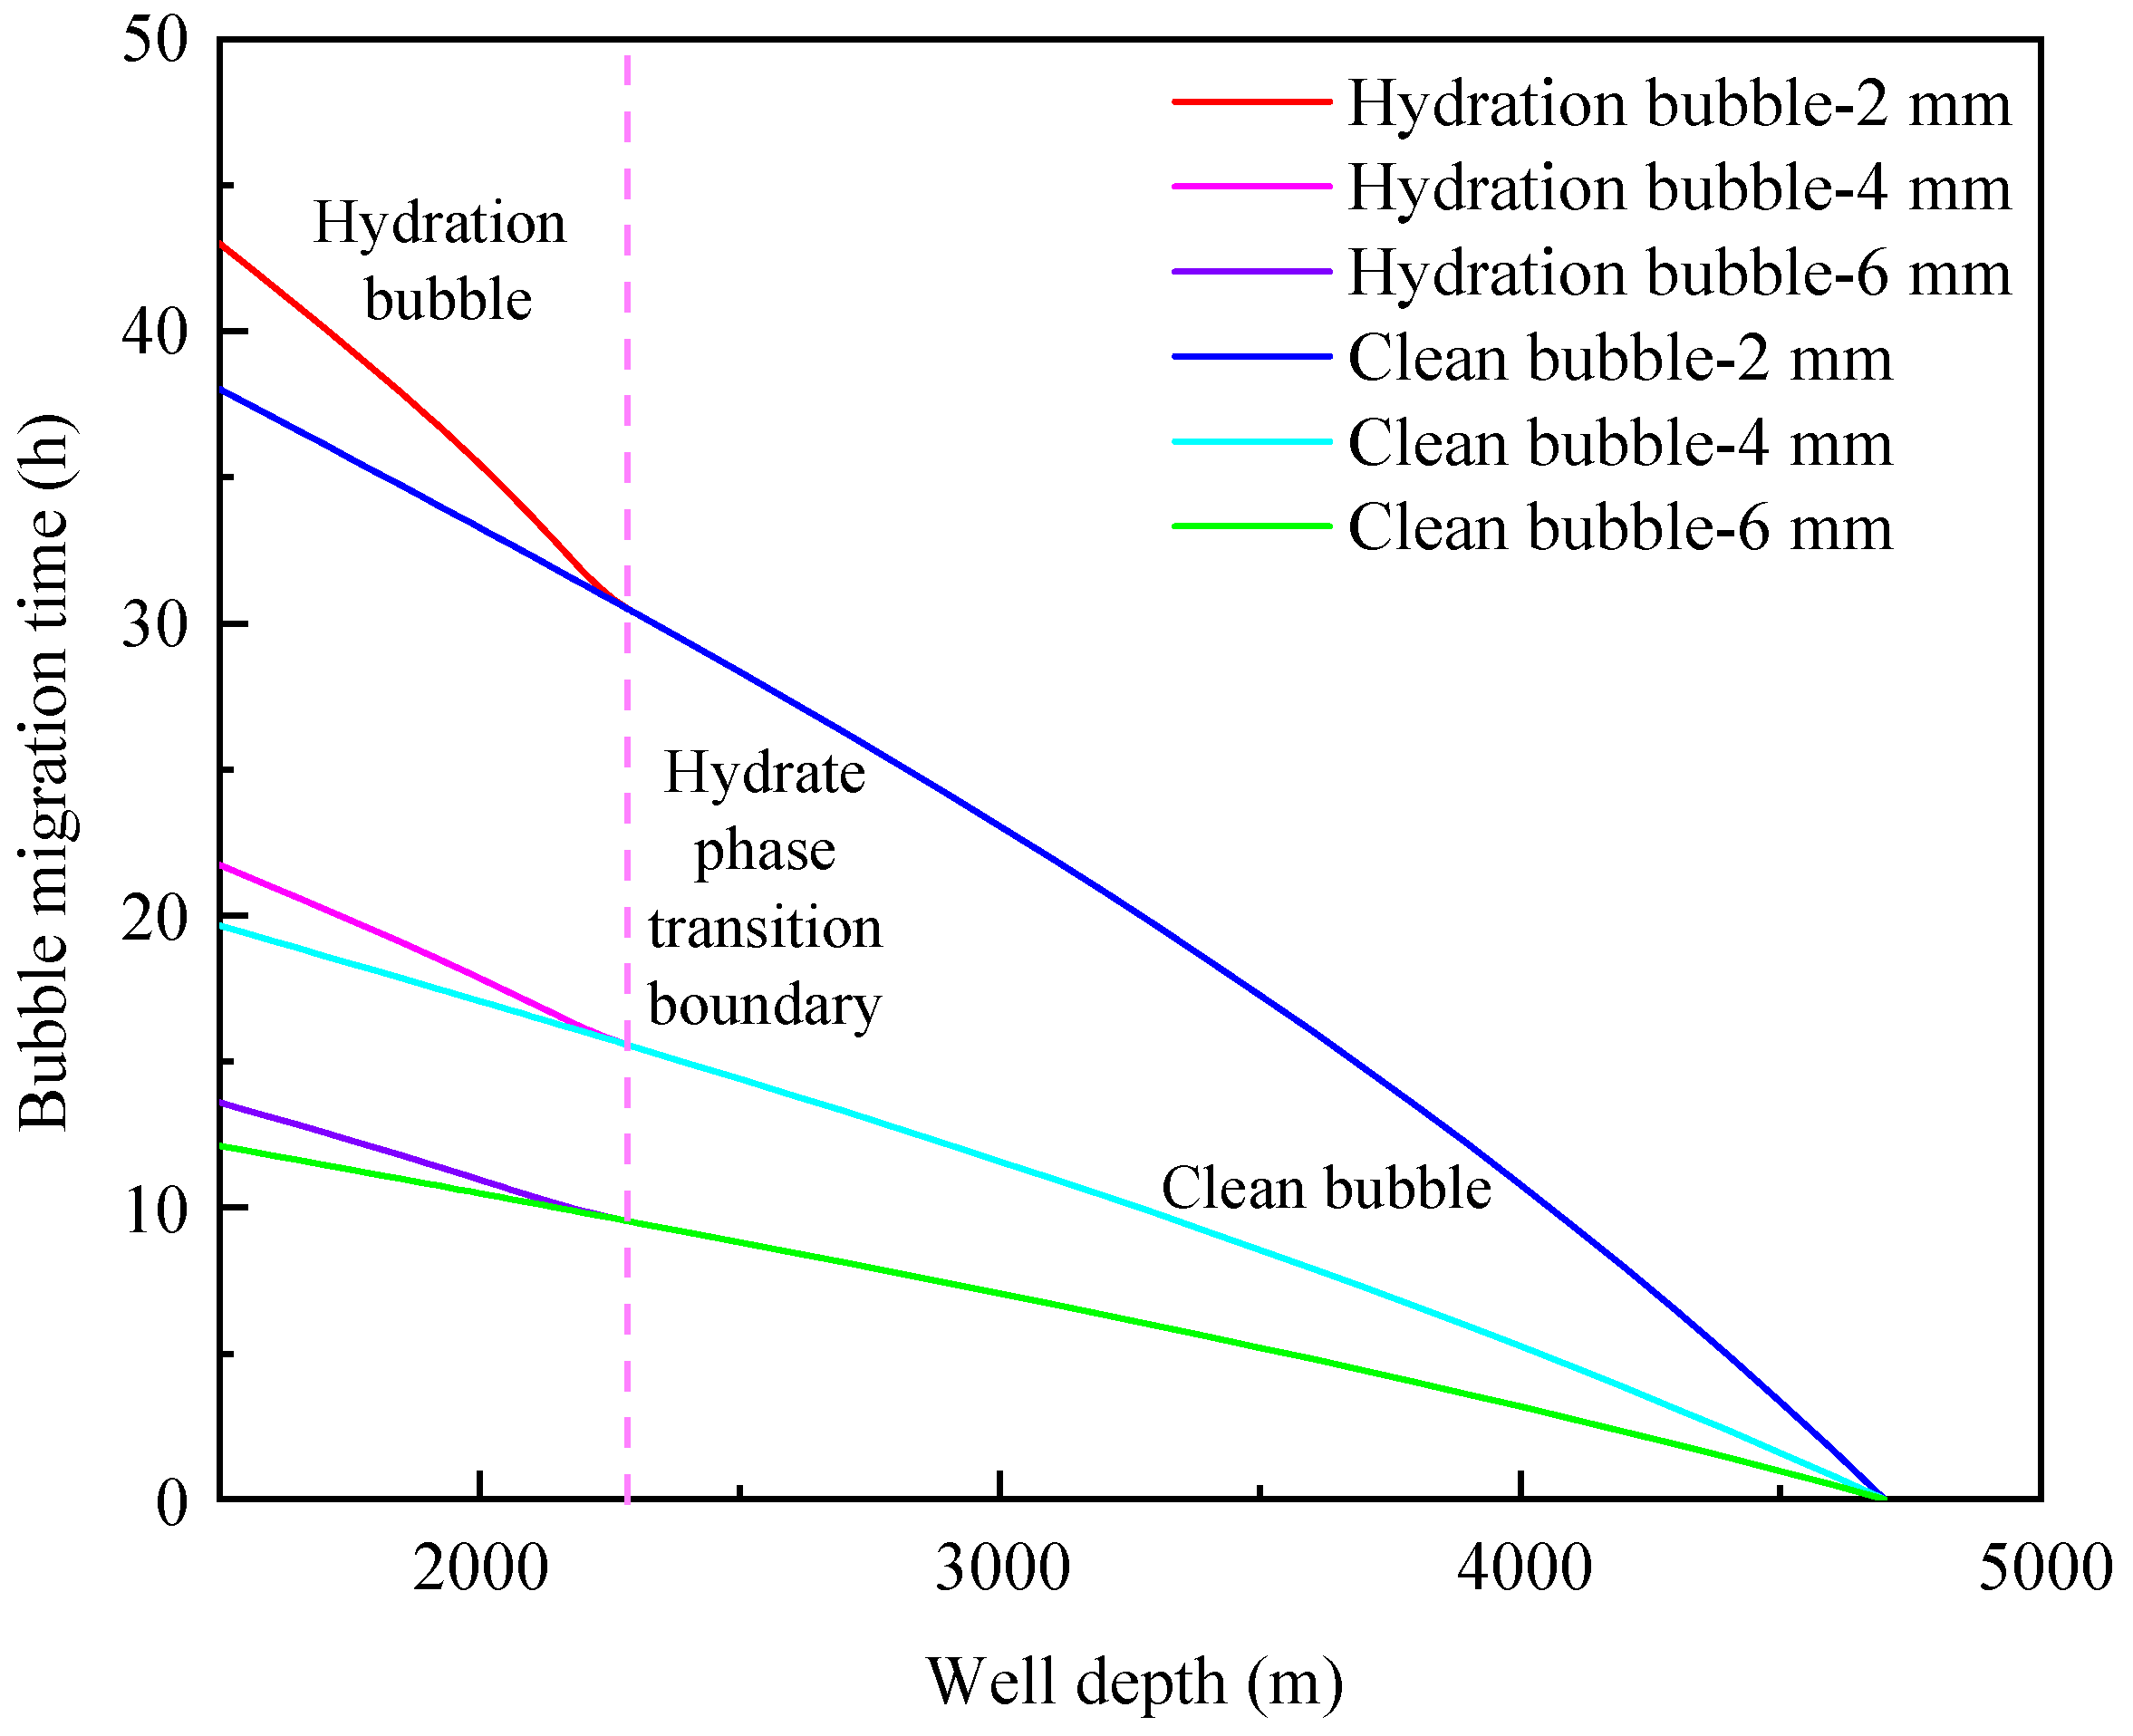
4.1. Influence of Initial Bubble Size

Due to the heterogeneity of reservoir porosity, the sizes of the initially formed bubbles are different, so it is necessary to explore the migration laws with different sizes of bubbles in deepwater wellbore annulus. Based on the new model of bubble migration velocity, the variation law of bubble migration velocity with well depth and safe shut-in cycle of different initial diameters are calculated under the condition of bottom hole fluid viscosity of 10 mPa·s and density of 1250 kg/m3.
Figure 9 shows the variation of the migration velocity of hydrated bubbles and clean bubbles with well depth when the initial bubble diameter is 2 mm, 4 mm, and 6 mm. In the process of clean bubble migration, the velocity from the bottom hole to wellhead gradually increases, but the increasing rate gradually slows down, which is the result of the comprehensive effect of bubble volume change, dissolution and fluid viscosity change. In order to recycle drilling fluid and simplify the treatment process of returned drilling fluid during deepwater drilling, the gas solubility of drilling fluid is very small. Therefore, in the process of clean bubble migration, the decrease of pressure leads to the increase of bubble volume, while the effect of dissolution has little effect on the change of bubble volume. In addition, the annular temperature gradually decreases and the drilling fluid viscosity increases accordingly from the bottom of the well to the subsea wellhead, which inhibits the increase of the bubble migration velocity to a certain extent. The migration velocity of hydrated bubbles is divided into a gradually decreasing stage and a slowly increasing stage. When a bubble initially enters the hydrate formation area, a hydrated bubble is gradually formed due to the growth and coating of the hydrate shell. Gas consumption and hydrate shell thickening play a dominant role, which leads to the gradual decline of bubble migration velocity. With the increase of hydrate shell thickness and the renewal of pores inside the hydrate shell, both the inward mass transfer of water and the outward mass transfer of gas are inhibited. The thickness of hydrate shell gradually increases slowly and the dissolution is limited. The decrease of pressure leads to the increase of bubble volume, which gradually plays a dominant role, and the bubble migration velocity also increases accordingly. In the process of migration near the subsea wellhead, the fluid viscosity gradually increases due to low temperature, which also causes the bubble migration velocity to increase slowly. Comparing the velocity change of bubbles with different sizes in the migration process, it can be found that the effect of hydrate transition on the migration velocity of large bubbles is more obvious. When the initial diameter of bubbles is 2 mm and 6 mm, the migration velocity of hydrated bubbles is about 0.010 m/s and 0.031 m/s lower than that of clean bubbles at the wellhead, respectively.
Figure 10 shows the migration cycles of hydrated bubbles and clean bubbles when the initial diameter of bubbles is 2 mm, 4 mm, and 6 mm. Since the bubble migration to the subsea wellhead can bring severe challenges to subsequent well opening operations, the bubble migration cycle is generally regarded as the safe shut-in cycle [17]. Comparing the migration cycles of bubbles with different sizes, it is found that the safe shut-in cycle decreases significantly with the increase of the initial bubble diameter. When bubble diameter is 2 mm and 6 mm, the safe shut-in cycle is 42.7 h and 13.6 h, respectively. Due to the coating and thickening growth of the hydrate shell, the migration velocity of the bubble is significantly reduced after the bubble enters the hydrate formation area. The formation of the hydrated bubble can prolong the safe shut-in cycle. When the initial diameter of the bubble is 2 mm and 6 mm, compared with the clean bubble, the safe shut-in cycle of the hydrated bubble can be extended by 5.1 h and 1.6 h, respectively. The above analysis shows that both bubble size and hydrate phase transition have significant effects on bubble migration velocity. The accurate calculation of safe shut-in cycle needs to consider the hydrate phase transition characteristics in the deepwater wellbore environment and the change of equivalent diameter during bubble migration.

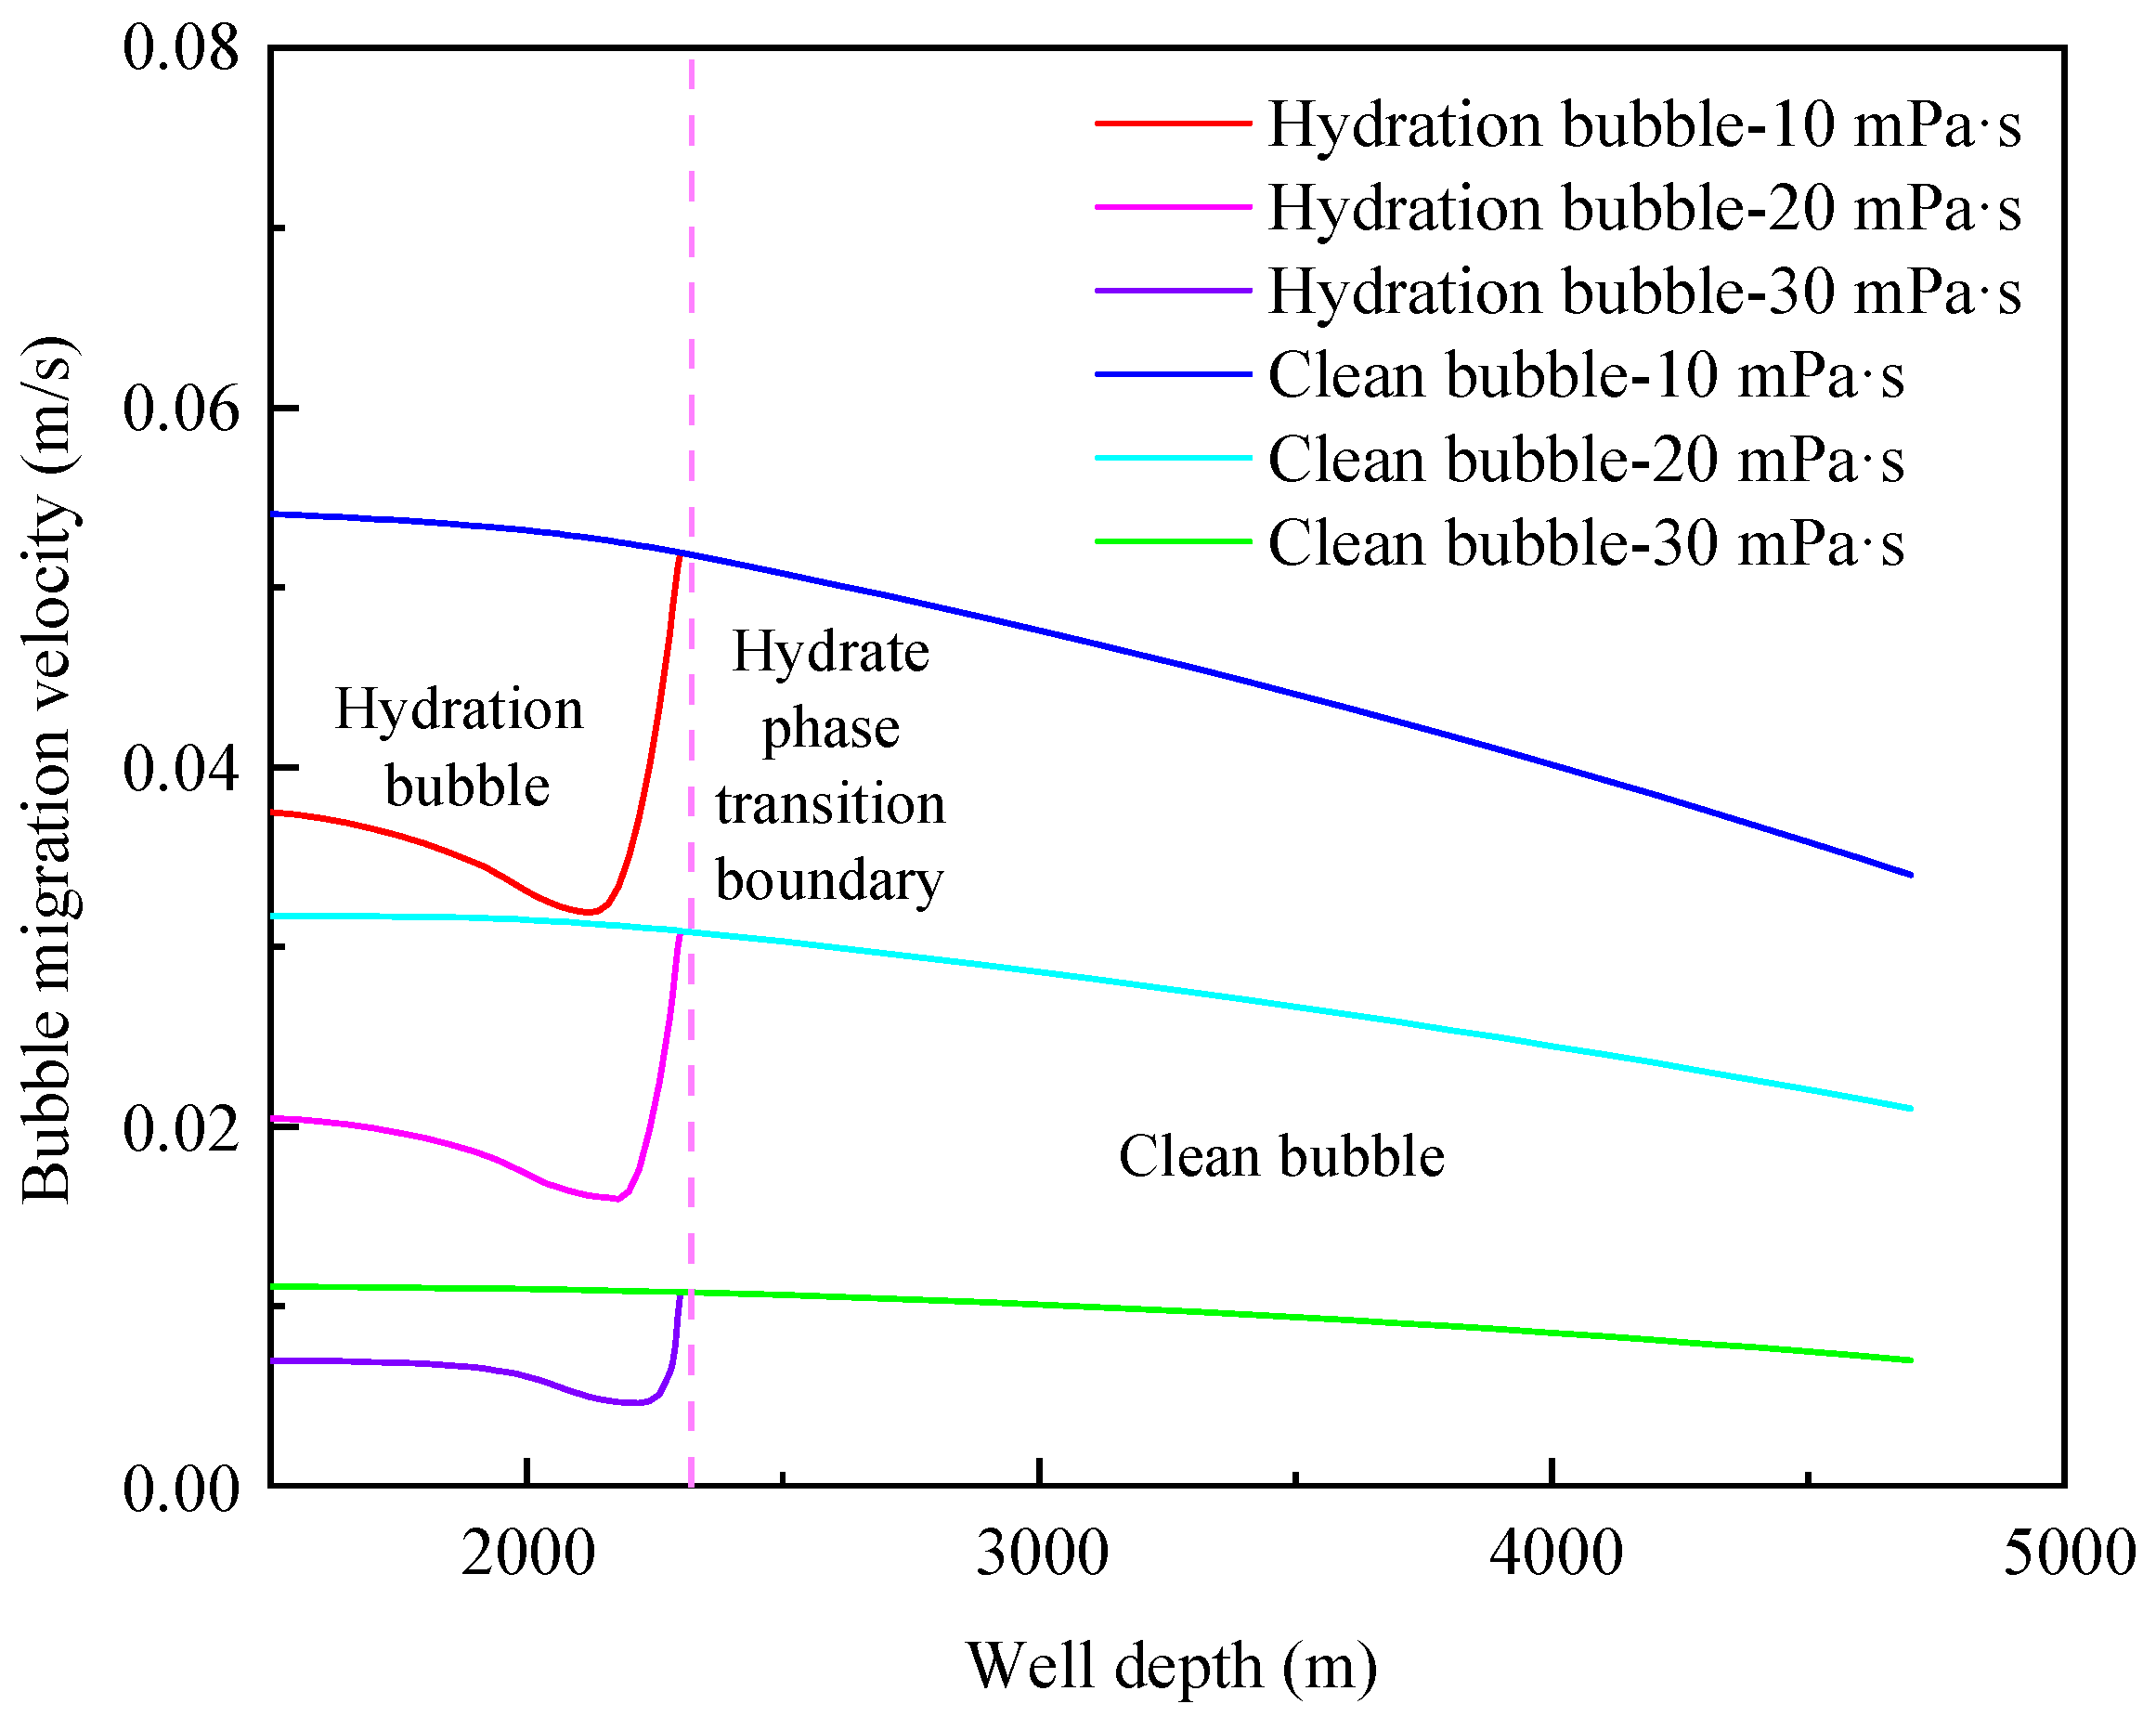
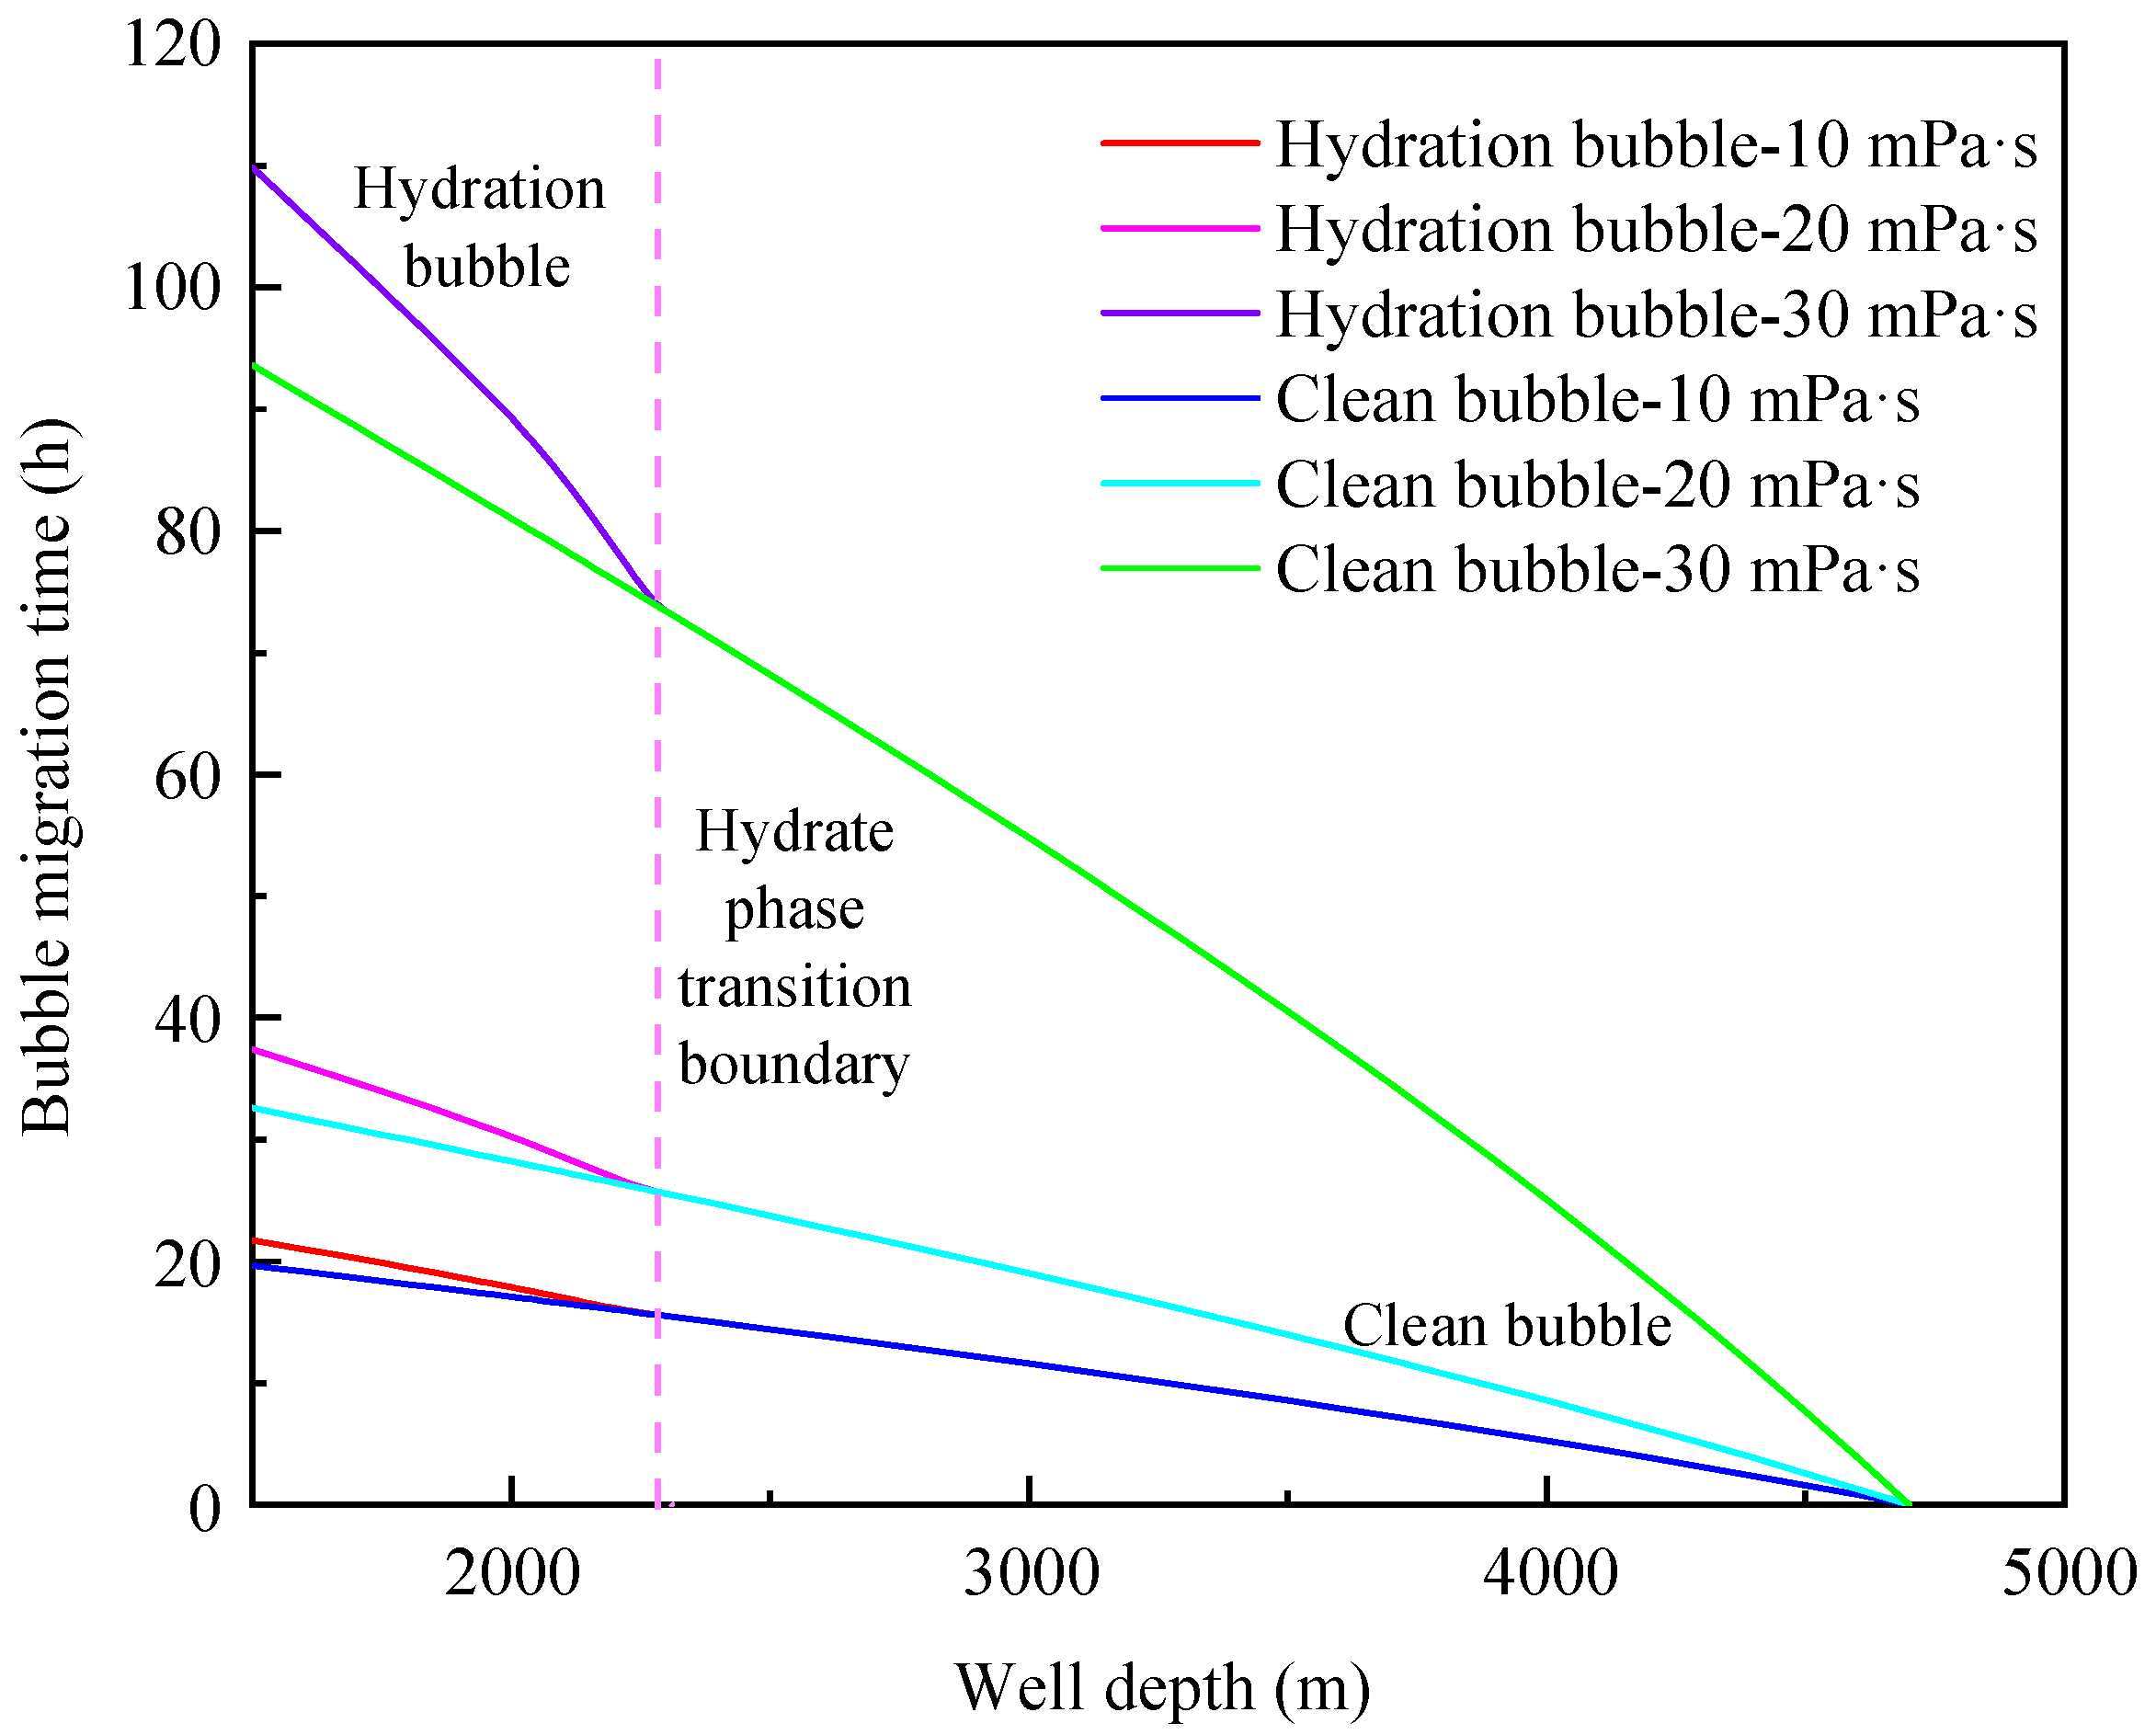
4.2. Influence of Annular Fluid Viscosity

The above research found that the change of annular fluid viscosity during bubble migration will affect its migration velocity. In order to further explore the influence of different fluid viscosities on bubble migration velocity, the variation law of bubble migration velocity with well depth and safe shut-in cycle are calculated under the conditions of initial bubble diameter of 4 mm and bottom hole fluid density of 1250 kg/m3.
Figure 11 shows the variation of the migration velocity of hydrated bubbles and clean bubbles with well depth when the bottom hole fluid viscosity is 10 mPa·s, 20 mPa·s, and 30 mPa·s. With the increase of bottom hole fluid viscosity, the migration velocity of clean bubbles decreases significantly and the migration velocity of clean bubbles in high viscosity fluid increases slowly. When the viscosity of bottom hole fluid is 10 mPa·s and 30 mPa·s, the velocity of clean bubble migration to the wellhead increases by 0.021 m/s and 0.004 m/s, respectively. This is caused by the significant increase of drag coefficient with the increase of fluid viscosity. For hydrated bubbles, the increase of fluid viscosity shortens the migration distance during the thickening growth of hydrate shell. The migration velocity of hydrated bubbles is more sensitive to the change of fluid viscosity. Due to the lower temperature near the subsea wellhead, the fluid viscosity increases significantly and the migration velocity of hydrated bubbles increases more slowly than that of clean bubbles in this section.
Figure 12 shows the variation of bubble migration cycle in annular fluid with different viscosities. Comparing the migration cycles of clean bubbles and hydrated bubbles under different fluid viscosities, the formation of hydrated bubbles is more conducive to prolonging the safe shut-in cycle with the increase of fluid viscosity. When the viscosity of bottom hole fluid is 30 mPa·s, the safe shut-in cycle of hydrated bubbles is 16.8 h longer than that of clean bubbles. The above analysis shows that the increase of bottom hole fluid viscosity can significantly decrease the bubble migration velocity and prolong the bubble migration cycle, which is more obvious in the thickening growth section of the hydrate shell. Therefore, the safe shut-in cycle can be greatly improved by means of “double liquid plug injection”, which is conducive to dealing with complex downhole accidents and harsh sea conditions. Double liquid plug injection means that a segment of high viscosity liquid is injected into the bottom hole reservoir section and hydrate shell growth and thickening section, respectively. Injecting a segment of fluid with high viscosity at the bottom of the well can effectively reduce the initial bubble migration velocity. At the same time, injecting a segment of high viscosity liquid into the thickening growth section of hydrate shell can effectively prolong the migration time of bubbles in this section and greatly decrease the migration velocity of hydrated bubbles.

4.3. Influence of Annulus Fluid Density

The annulus fluid density will affect the annulus pressure distribution, which will affect the bubble migration velocity. In order to further explore the influence law of different annulus fluid densities on bubble migration velocity, the variation law of bubble migration velocity with well depth and safe shut-in cycle are calculated under the conditions of initial bubble diameter of 4 mm and bottom hole fluid viscosity of 10 mPa·s.
Figure 13 shows the variation of the migration velocity of hydrated bubbles and clean bubbles with well depth when the bottom hole fluid density is 1200 kg/m3, 1250 kg/m3, and 1300 kg/m3. The influence of annulus fluid density on the migration velocity of hydrated bubbles and clean bubbles is consistent. With the increase of the bottom hole fluid density, the migration velocity of hydrated bubbles and clean bubbles increases slightly. When the fluid density is 1200 kg/m3, the migration velocity of hydrated bubbles and clean bubbles to the wellhead is 0.036 m/s and 0.052 m/s, respectively. While when the fluid density is 1300 kg/m3, the migration velocity of hydrated bubbles and clean bubbles to the wellhead is 0.038 m/s and 0.055 m/s, respectively. This indicates that the effect of fluid density on bubble migration velocity is not significant. This is consistent with the variation of the bubble migration cycle in fluid with different densities in Figure 14. When the bottom hole fluid density is 1200 kg/m3 and 1300 kg/m3, the migration cycle of hydrated bubbles is about 2.0 h and 1.9 h longer than that of clean bubbles, respectively. There is little difference in safe shut-in cycle under different annulus fluid densities. The above analysis shows that the migration velocity of hydrated bubbles and clean bubbles is not sensitive to the change of annular fluid density.

5. Conclusions

In this study, a new model of bubble migration velocity in deepwater wellbore annulus is established considering the effects of hydrate phase transition and gas-water bidirectional mass transfer. Combined with the influence of bubble size and fluid properties in deepwater wellbore annulus on key parameters of the bubble migration velocity model, the variation rules of bubble migration velocity and safe shut-in cycle under different initial bubble size, fluid viscosity, and density are analyzed. The main conclusions are as follows:
(1)
The migration velocity of hydrated bubbles is divided into a gradually decreasing stage and a slowly increasing stage. The gas consumption and the thickening of hydrate shell in the gradually decreasing stage play a dominant role, and the increase of bubble volume caused by the decrease of pressure in the slowly increasing stage is the most important factor;
(2)
The formation of a hydrated bubble can significantly reduce the migration velocity of bubble and effectively prolong the safe shut-in period. The migration cycle of the hydrated bubble can be significantly increased by decreasing bubble size and increasing annular fluid viscosity;
(3)
The initial size of the bubble and the viscosity of annulus fluid are the main factors affecting the migration velocity of the bubble, while the density of annulus fluid has little effect on the migration velocity of hydrated bubbles and clean bubbles.

Author Contributions

X.Z.: Conceptualization, Methodology, Writing-Original Draft; F.Y.: Software, Validation; H.Y.: Investigation; Y.Q.: Formal analysis; X.C.: Writing-Review and Editing. All authors have read and agreed to the published version of the manuscript.

Funding

The authors gratefully acknowledge the financial support by the Key R&D Plan of Shandong Province (2022CXGC020407), the National Natural Science Foundation of China (No. 52274022 and No. U21B2065), the Fundamental Research Project of the Central Universities (22CX01003A), the Postgraduate Innovation Funding Project (23CX04026A) and Major Project of National Natural Science Foundation of China, 2016ZX05020-006.

Institutional Review Board Statement

Not applicable.

Informed Consent Statement

Not applicable.

Data Availability Statement

All the data used in this study have been presented in the paper.

Conflicts of Interest

The authors declare no conflict of interest.

References

  1. Mori, Y.H. Clathrate hydrate formation at the interface between liquid CO2 and water phases—A review of rival models characterizing “hydrate films”. Energy Convers. Manag. 1998, 39, 1537–1557. [Google Scholar] [CrossRef]
  2. Hassanpouryouzband, A. Gas hydrates in sustainable chemistry. Chem. Soc. Rev. 2020, 49, 5225–5309. [Google Scholar] [CrossRef] [PubMed]
  3. Gao, Y.; Chen, Y.; Zhao, X.; Wang, Z.; Li, H.; Sun, B. Risk analysis on the blowout in deepwater drilling when encountering hydrate-bearing reservoir. Ocean Eng. 2018, 170, 1–5. [Google Scholar] [CrossRef]
  4. Zhao, J.; Zheng, J.-N.; Li, F.; Yang, M. Gas permeability characteristics of marine sediments with and without methane hydrates in a core holder. J. Nat. Gas Sci. Eng. 2020, 76, 103215. [Google Scholar] [CrossRef]
  5. Sun, B.; Pan, S.; Zhang, J.; Zhao, X.; Zhao, Y.; Wang, Z. A dynamic model for predicting the geometry of bubble entrapped in yield stress fluid. Chem. Eng. J. 2019, 391, 123569. [Google Scholar] [CrossRef]
  6. Li, C.; Huang, T. Simulation of gas bubbles with gas hydrates rising in deep water. Ocean Eng. 2016, 112, 16–24. [Google Scholar] [CrossRef]
  7. Okwananke, A. Methane recovery from gas hydrate-bearing sediments: An experimental study on the gas permeation characteristics under varying pressure. J. Pet. Sci. Eng. 2019, 180, 435–444. [Google Scholar] [CrossRef]
  8. Joseph, D.D. Rise velocity of a spherical cap bubble. J. Fluid Mech. 2003, 488, 213–223. [Google Scholar]
  9. Peebles, F.N.; Garber, H.J. Studies on the motion of gas bubbles in liquids. Chem. Eng. Prog. 1953, 49, 88–97. [Google Scholar]
  10. Collins, R. The effect of a containing cylindrical boundary on the velocity of a large gas bubble in a liquid. J. Fluid Mech. 1967, 28, 97–112. [Google Scholar] [CrossRef]
  11. Margaritis, A.; Bokkel, D.W. Bubble rise velocities and drag coefficients in non-Newtonian polysaccharide solutions. Biotechnol. Bioeng. 1999, 64, 257–266. [Google Scholar] [CrossRef]
  12. Taylor, C.J.; Miller, K.T.; Koh, C.A.; Sloan, E.D. Macroscopic investigation of hydrate film growth at the hydrocarbon/water interface. Chem. Eng. Sci. 2007, 62, 6524–6533. [Google Scholar] [CrossRef]
  13. Bigalke, N.; Enstad, L.; Rehder, G.; Alendal, G. Terminal velocities of pure and hydrate coated CO2 droplets and CH4 bubbles rising in a simulated oceanic environment. Deep. Sea Res. 2010, 57, 1102–1110. [Google Scholar] [CrossRef]
  14. Sun, X.; Sun, B.; Wang, Z.; Chen, L.; Gao, Y. A new model for hydrodynamics and mass transfer of hydrated bubble rising in deep water. Chem. Eng. Sci. 2017, 173, 168–178. [Google Scholar] [CrossRef]
  15. Liu, Z.; Li, H.; Chen, L.; Sun, B. A New Model of and Insight into Hydrate Film Lateral Growth along the Gas–Liquid Interface Considering Natural Convection Heat Transfer. Energy Fuels 2018, 32, 2053–2063. [Google Scholar] [CrossRef]
  16. Sun, B.; Guo, Y.; Wang, Z.; Yang, X.; Gong, P.; Wang, J.; Wang, N. Experimental study on the drag coefficient of single bubbles rising in static non-Newtonian fluids in wellbore. J. Nat. Gas Sci. Eng. 2015, 26, 867–872. [Google Scholar] [CrossRef]
  17. Wei, H.; Du, Q.; Cao, B.; Wang, Z.; Sun, B.; Liu, Z. The Ascending Law of Gas Bubbles in a Wellbore Considering the Phase Change of Natural Gas Hydrates during Deepwater Well Shut-in. Pet. Drill. Tech. 2019, 47, 42–49. [Google Scholar]
  18. Sikorski, D.; Tabuteau, H.; de Bruyn, J.R. Motion and shape of bubbles rising through a yield-stress fluid. J. Non Newtonian Fluid Mech. 2009, 159, 10–16. [Google Scholar] [CrossRef]
  19. Marks, C.H. Measurements of the terminal velocity of bubbles rising in a chain. ASME J. Fluids Eng. 1973, 95, 17–22. [Google Scholar] [CrossRef]
  20. Omran, N.M.; Foster, P.J. The terminal velocity of a chain of drops or bubbles in a liquid. Trans. Inst. Chem. Eng. 1977, 55, 171–177. [Google Scholar]
  21. Zhang, J.; Fan, L.-S. On the rise velocity of an interactive bubble in liquids. Chem. Eng. J. 2003, 92, 169–176. [Google Scholar] [CrossRef]
  22. Shi, B.H.; Gong, J.; Sun, C.Y.; Zhao, J.K.; Ding, Y.; Chen, G.J. An Inward and Outward Natural Gas Hydrates Growth Shell Model Considering Intrinsic Kinetics, Mass and Heat Transfer. Chem. Eng. J. 2011, 171, 1308–1316. [Google Scholar] [CrossRef]
  23. Li, S.; Sun, C.; Liu, B.; Feng, X.; Li, F.; Chen, L.; Chen, G. Initial thickness measurements and insights into crystal growth of methane hydrate film. AIChE J. 2013, 59, 2145–2154. [Google Scholar] [CrossRef]
  24. Lee, S.Y.; Kim, H.C.; Lee, J.D. Morphology Study of Methane−Propane Clathrate Hydrates on the Bubble Surface in the Presence of SDS or PVCap. J. Cryst. Growth 2014, 402, 249–259. [Google Scholar] [CrossRef]
  25. Li, S.L.; Sun, C.Y.; Chen, G.J.; Li, Z.Y.; Ma, Q.L.; Yang, L.Y.; Sum, A.K. Measurements of hydrate film fracture under conditions simulating the rise of hydrated gas bubbles in deep water. Chem. Eng. Sci. 2014, 116, 109–117. [Google Scholar] [CrossRef]
  26. Salamatin, A.N.; Hondoh, T.; Uchida, T.; Lipenkov, V.Y. Post-nucleation conversion of an air bubble to clathrate air–hydrate crystal in ice. J. Cryst. Growth 1998, 193, 197–218. [Google Scholar] [CrossRef]
  27. Mori, Y.H.; Mochizuki, T. Mass transport across clathrate hydrate films—A capillary permeation model. Chem. Eng. Sci. 1997, 52, 3613–3616. [Google Scholar] [CrossRef]
  28. Ogasawara, K.; Yamasaki, A.; Teng, H. Mass Transfer from CO2 Drops Traveling in High-Pressure and Low-Temperature Water. Energy Fuels 2001, 15, 147–150. [Google Scholar] [CrossRef]
  29. Daniel-David, D.; Guerton, F.; Dicharry, C.; Torré, J.-P.; Broseta, D. Hydrate growth at the interface between water and pure or mixed CO2/CH4 gases: Influence of pressure, temperature, gas composition and water-soluble surfactants. Chem. Eng. Sci. 2015, 132, 118–127. [Google Scholar] [CrossRef]
  30. Rehder, G.; Leifer, I.; Brewer, P.G.; Friederich, G.; Peltzer, E.T. Controls on methane bubble dissolution inside and outside the hydrate stability field from open ocean field experiments and numerical modeling. Mar. Chem. 2009, 114, 19–30. [Google Scholar] [CrossRef]
  31. Clift, R.C.; Grace, J.R. Bubbles, Drops and Particles; Academic Press: New York, NY, USA, 1978; pp. 58–67. [Google Scholar]
  32. Levich, V.G. Physicochemical Hydrodynamics; Prentice Hall: New York, NY, USA, 1962. [Google Scholar]
  33. Oellrich, L.; Schmidt-Traub, H. Theoretische Berechnung des Stofftransports in der Umgebung einer Einzelblase. Chem. Eng. Sci. 1973, 28, 711–721. [Google Scholar] [CrossRef]
  34. Leclair, B.P.; Hamielec, A.E. Viscous flow through particle assemblages at intermediate reynolds numbers—A cell model for transport in bubble swarms. Can. J. Chem. Eng. 1971, 49, 713–720. [Google Scholar] [CrossRef]
  35. Johnson, A.; Rezmer-Cooper, I.; Bailey, T.; McCann, D. Gas migration: Fast, slow or stopped. In Proceedings of the SPE/IADC Drilling Conference, Amsterdam, The Netherlands, 28 February–2 March 1995. [Google Scholar] [CrossRef]
  36. Winnikow, S. Letters to the editor. Chem. Eng. Sci. 1967, 22, 477. [Google Scholar] [CrossRef]
  37. Acrivos, A.; Goddard, J.D. Asymptotic expansions for laminar forced convection heat and mass transfer. J. Fluid Mech. 1965, 23, 273–291. [Google Scholar] [CrossRef]
  38. Rodrigue, D.; De Kee, D.; Fong, C.F.C.M. A note on the drag coefficient of a single gas bubble in a power-law fluid. Can. J. Chem. Eng. 1999, 77, 766–768. [Google Scholar] [CrossRef]
  39. Li, H.; Sun, B.; Gao, Y.; Guo, Y.; Zhao, X.; Wang, J.; Wang, J.B. Study on Rising Velocity of Methane Bubble in Deepwater Wellbore During the Shut-In Period. In Proceedings of the Abu Dhabi International Petroleum Exhibition & Conference, Abu Dhabi, United Arab Emirates, 13–16 November 2017. [Google Scholar]
  40. Mei, R.; Klausner, J.F. Unsteady force on a spherical bubble at finite Reynolds number with small fluctuations in the free-stream velocity. Phys. Fluids A Fluid Dyn. 1992, 4, 63–70. [Google Scholar] [CrossRef]
  41. Turton, R.; Levenspiel, O. A short note on the drag correlation for spheres. Powder Technol. 1986, 47, 83–86. [Google Scholar] [CrossRef]
  42. Tomiyama, A.; Kataoka, I.; Zun, I.; Sakaguchi, T. Drag coefficients of single bubbles under normal and micro gravity conditions. JSME Int. J. Ser. B Fluids Therm. Eng. 2008, 41, 472–479. [Google Scholar] [CrossRef]
  43. Wallis, G.B. The terminal speed of single drops or bubbles in an infinite medium. Int. J. Multiph. Flow 1974, 1, 491–511. [Google Scholar] [CrossRef]
  44. Bozzano, G.; Dente, M. Shape and terminal velocity of single bubble motion: A novel approach. Comput. Chem. Eng. 2001, 25, 571–576. [Google Scholar] [CrossRef]
  45. Ishii, M.; Chawla, T.C. Local Drag Laws in Dispersed Two-Phase Flow; Nasa Sti/recon Technical Report N; Argonne National Lab.: Lemont, IL, USA, 1979. [Google Scholar]
Figure 1. Schematic diagram of the bubble migration process in the wellbore annulus.
Jmse 11 02206 g001
Figure 2. Schematic diagram of forces on bubble migration in deepwater wellbore annular.
Jmse 11 02206 g002
Figure 3. Schematic diagram of mass transfer process of hydrate shell dynamic growth.
Jmse 11 02206 g003
Figure 4. Error analysis and optimization of typical mass transfer model of bubble dissolution based on Rehder et al. [30] experimental data; Clift—[31], Levich—[32], Oellrich—[33], Leclair—[34], Johnson—[35], Winnikow—[36], Acrivos—[37].
Jmse 11 02206 g004
Figure 5. Error analysis of new mass transfer coefficient model for bubble dissolution based on Rehder et al. [30] experimental data.
Jmse 11 02206 g005
Figure 6. Comparison between the calculated results of hydrated bubble migration drag coefficient model and experimental data.
Jmse 11 02206 g006
Figure 7. Division of the applicable range of drag coefficient model.
Jmse 11 02206 g007
Figure 8. Verification of clean bubble and hydrated bubble migration velocity model.
Jmse 11 02206 g008
Figure 9. Variation of bubble migration velocity with depth in annulus of deepwater wellbore.
Jmse 11 02206 g009
Figure 10. Migration cycle of bubbles with different sizes in annulus of deepwater wellbore.
Jmse 11 02206 g010
Figure 11. Variation of bubble migration velocity with well depth under different annular fluid viscosity.
Jmse 11 02206 g011
Figure 12. Migration cycle of bubbles in annular fluids with different viscosities.
Jmse 11 02206 g012
Figure 13. Bubble migration velocity changes with well depth under different fluid densities in deepwater wellbore annulus.
Jmse 11 02206 g013
Figure 14. Migration cycle of bubbles with different annular fluid densities.
Jmse 11 02206 g014
Table 1. Typical mass transfer coefficient model of bubble dissolution in liquid phase.
ResearchersMass Transfer Coefficient Model
Clift [31] k h l = E 2 r g + E 2 r g 1 + 2 r g v g E 1 / 3
Levich [32] k h l = 0.624 v g 1 / 3 E / r g 2 / 3
Oellrich [33] k h l = E r g + 0.651 2 r g v g / E 1.72 1 + 2 r g v g / E 1.22 E 2 r g
Leclair [34] k h l = 0.65 + 0.06 Re 1 / 2 E v g 2 r g 1 / 2
Johnson [35] k h l = 1.13 E v g 0.45 + 40 r g
Winnikow [36] k h l = 2 π 1 2.89 Re 1 / 2 E v g 2 r g 1 / 2
Acrivos [37] k h l = 0.624 v g 1 / 3 E / r g 2 / 3 + 0.46 E / r g
Table 2. Typical drag coefficient model describing bubble migration.
ResearchersDrag Coefficient Model
Mei [40] C D = 16 Re 1 + 8 Re + 1 2 1 + 3.315 Re 0.5 1
Bigalke [13] C D = f a R 2      
Peebles [9] C D = max max 24 Re , 18 Re 0.68 , min 0.0275 E o W e 2 , 0.82 E o 0.25 W e 0.5
Turton [41] C D = 24 Re 1 + 10.173 Re 0.657 + 0.413 1 + 16300 Re 1.09
Tomiyama [42]           C D = max 24 Re 1 + 0.15 Re 0.687 , 8 3 E o E o + 4
Wallis [43] C D = max min max 16 Re , 13.6 Re 0.8 , 48 Re , min E o 3 , 0.47 E o 0.25 W e 0.5 , 0.8
Bozzano [44] C D = F A R o 2
Ishii [45] C D = max 24 Re 1 + 0.1 Re 0.75 , min 8 3 , 2 3 E o
Table 3. Values of main parameters of the model.
ParameterValueParameterValue
Depth of reservoir H 4700 mBottom hole liquid density ρ l 1.2~1.3 g/cm3
Depth of water H w 1500 mInitial bubble diameter d e [14]2~6 mm
Design well depth H d 4850 mBottom hole liquid viscosity μ 10~30 mPa·s
Hydrate density ρ h 910 kg/m3Gas-liquid interfacial tension σ [15]0.0194 N/m
Contact angle β [15]Sea surface temperature T s 28 °C
Molar mass of water M w 18 g/molDiffusion coefficient d h [29]10−11 m2/s
Mudline temperature T m 3.4 °CBassett force coefficient K b [21]6.0
Geothermal gradient T D 0.03 °C/mCoefficient of undercooling b 3.1205 × 10 5 m·K
Micropore radius r c [15]0.05 μmMolar mass of methane M g 16 g/mol
Hydration number n 6.0Dissolved methane concentration C m 0.1 nmol/L
Micropore tortuosity s [15]2.0Number of pores per unit area n d [14] 1 × 10 12 1/m2
Disclaimer/Publisher’s Note: The statements, opinions and data contained in all publications are solely those of the individual author(s) and contributor(s) and not of MDPI and/or the editor(s). MDPI and/or the editor(s) disclaim responsibility for any injury to people or property resulting from any ideas, methods, instructions or products referred to in the content.

