Article

Benthic Respiration and Heavy Metal Benthic Fluxes in Artificial Shihwa Lake: Approaching In Situ Measurement

1
Marine Environment Research Department, Korea Institute of Ocean Science & Technology, 385, Busan 49111, Republic of Korea
2
Department of Convergence Study on the Ocean Science and Technology, Ocean Science and Technology School, Busan 49111, Republic of Korea
3
Department of Environmental Chemistry, Geosystem Research Corporation, Gunpo 15807, Republic of Korea
*
Authors to whom correspondence should be addressed.
J. Mar. Sci. Eng. 2023, 11(11), 2186; https://doi.org/10.3390/jmse11112186
Submission received: 7 October 2023 / Revised: 2 November 2023 / Accepted: 15 November 2023 / Published: 17 November 2023
(This article belongs to the Special Issue Benthic Biogeochemical Cycling of Ocean Nutrients and Carbon)

Abstract

:
This study assessed the impact of intensive human activities on organic matter (OM) and heavy metal cycles in Shihwa Lake, South Korea. Sediment oxygen demand (SOD), benthic nutrient flux (BNF), and benthic heavy metal flux were estimated using in situ benthic chambers. The combined analysis of sediment trap and SOD showed that the vertical supply of OM was a major controlling factor for benthic respiration. The BNF accounted for 35–144% and 32–184% of the N and P required, respectively, for primary production (PP) in the water column. The higher SOD may have also accelerated the release of Mn, Fe, Co, and Ni from the sediment. Benthic fluxes of Cr, As, Cd, Pb, Cu, and Zn were highest near the industrial complex, with ranges of 1.3 ± 0.9, 6.4 ± 4.9, 0.2 ± 0.1, 0.5 ± 0.4, 7.7 ± 1.4, and 452 ± 133 μmol m−2 d−1, respectively. Mn, Fe, Co, As, Pb, Ni, and Cu contributed more than 10% of the sediment to the current standing stock at Shihwa Lake.

Graphical Abstract

1. Introduction

Since the 1980s, the western coast of South Korea has been reclaimed for industrial and agricultural use, resulting in significant alterations to coastal ecosystems [1,2,3]. Over time, eutrophication, hypoxia, and the accumulation of pollutants in coastal lakes have become increasingly severe [4,5,6]. In particular, levels of organic matter (OM) and particle-reactive pollutants have become critically high via accumulation in artificial lakes or near artificial structures because of reduced tidal currents and hydrodynamic circulation. For example, reduced currents accelerate the deposition of suspended particles, and then deposition induces phytoplankton blooms in the water column because of increasing transparency, ultimately promoting the vertical flux of OM in the sediment [7,8,9].
Sediment oxygen demand (SOD) and benthic nutrient flux (BNF) are crucial parameters involved in understanding the impact of eutrophication in coastal waters [10,11]. Deposited OM is rapidly oxidized in the sediment via various electron acceptors, such as oxygen, nitrate, manganese oxide, iron oxide, and sulfate [12]. SOD can quantify the total oxidation rates of organic carbon (OC) because oxygen consumes the aerobic respiration of microorganisms and the reoxidation of reduced compounds via an anaerobic process [13,14]. Therefore, SOD has been used to assess the extent of OM enrichment in the sediment, which is an important proxy for determining the trophic state of the coastal ecosystem. Also, excess nutrient supply from terrestrial land and sediments can lead to increased primary productivity via benthic–pelagic coupling, and this aggravates OM accumulation in the sediment, which can develop into hypoxic and anoxic conditions [8,15,16,17]. Thus, estimating SOD and BNF can provide insights into the severity of eutrophication and help in designing effective management strategies to mitigate its impacts.
Heavy metals discharged from industrial complexes rapidly bind to various substances and then deposit into the sediment, serving as the final sink for heavy metals [18]. Upon the occurrence of early diagenetic processes in the sediment, heavy metals can be released at the sediment–water interface (SWI), acting as a contaminant source [19]. Biogeochemical condition changes could affect heavy metal cycles in the sediments [20]. For example, under anoxic conditions, dissolved manganese and iron are released into the water, but hydrogen sulfide-produced sulfate reduction acts as a sink for iron through the precipitation of troilite (FeS) [12]. Cobalt, cadmium, nickel, and arsenic can be scavenged by particles and OM or adsorb onto Fe(III) and Mn(IV) under oxic conditions [21,22]. Furthermore, continual metal release from the sediment can be toxic to marine organisms, and such releases can accumulate in marine organisms, or eventually humans, posing a severe health threat [23,24].
Previous studies have examined the biological impacts of the artificial Shihwa Lake dike; however, benthic processes that significantly control water quality have received less attention [8]. In this study, we investigated the impacts of the artificial dike on the following aspects: (1) the sediment geochemistry and OC oxidation in lake sediment; (2) the benthic release of nutrients and heavy metals across the SWI; and (3) the potential impacts of (1) and (2) on Shihwa Lake’s water quality.

2. Sampling and Methods
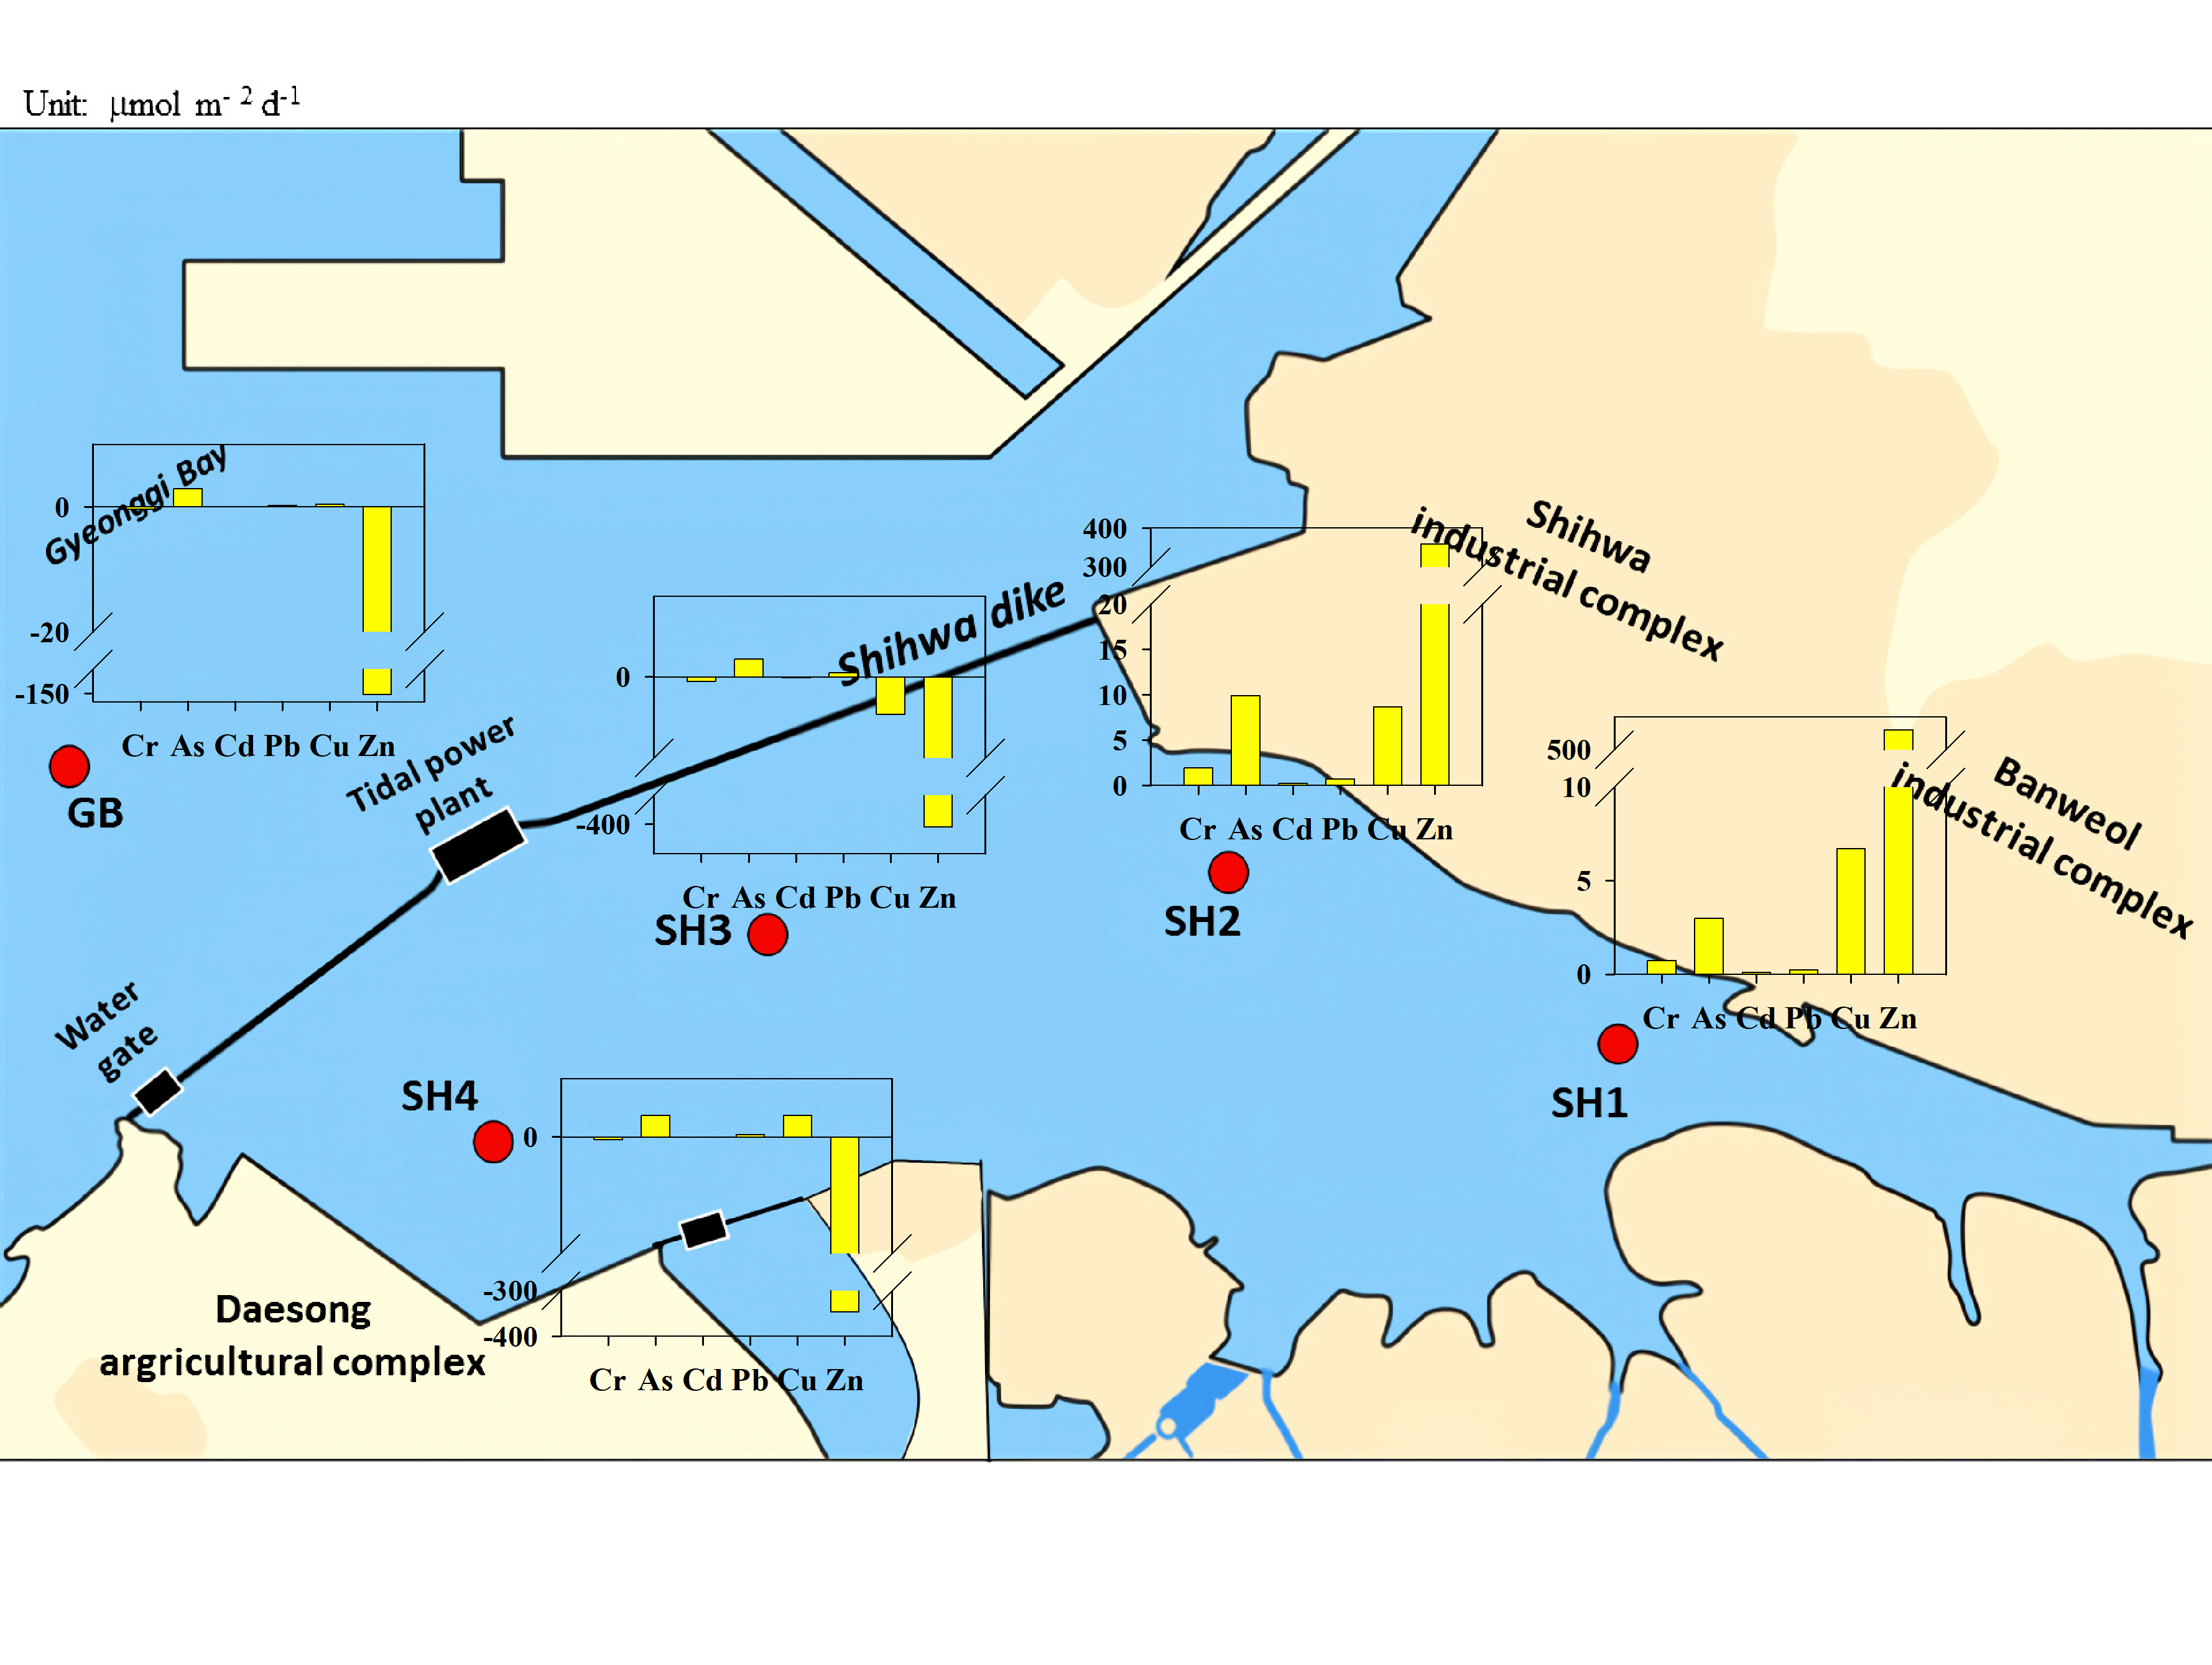
2.1. Study Area

Shihwa Lake is one of the artificial saltwater lakes typical of South Korea’s west coast, covering 56.5 km2, with a drainage basin of 476.5 km2 that introduces excessive inflows and continuous discharges of various nonpoint pollutants into the lake (Figure 1) [2]. The cites of Shiheung and Ansan, with a combined total population exceeding 1 million, have expanded near the lake, which also poses a potential risk of eutrophication. The northern part of the lake is adjacent to the Shihwa–Banweol industrial complex, where more than 13,000 are companies present—largely steel, electrical/electronic, mechanical, petrochemical, and textile companies—accounting for 32.7% of South Korea’s total industrial facilities [25]. The southern lake edge features a thriving urban center that features the Daesong agricultural complex (36.36 km2) and Songsan Green City (55.59 km2), which were built through reclamation efforts over the past decades [26]. Pollutants from the industrial complexes, e.g., heavy metals, organic compounds, and nutrients, have been found to affect Shihwa Lake’s ecosystem [27,28]. To solve Shihwa Lake’s serious problems, a tidal power plant was installed in 2011. Despite efforts to prevent environmental pollution, the rapid growth of the population and industrial development in the region has led to a deterioration in water quality and biodiversity [5,29,30].

2.2. Field Surveys and Sampling

In the central part of the Korean Peninsula, approximately 60% of annual precipitation occurs during the summer monsoon, lasting from July to September (https://data.kma.go.kr/resources/html/en/aowdp.html, accessed on 1 November 2023). To avoid disturbance by heavy rainfall, our sampling was conducted from 9 to 14 June 2022 on the inside of the Shihwa Lake dike (stations SH1, 2, 3, and 4) and the outside (station GB) of the Shihwa Lake dike (Figure 1; Table 1). Sampling stations SH1 and SH2 were located in close proximity to the wastewater discharge pathways from the Shihwa–Banweol industrial complex, while SH4 was situated near the freshwater reservoir gate used for the Daesong agricultural complex. SH3, on the other hand, was located in a transitional zone between the industrial complex and the water gate.
Surface and bottom water samples were collected using a Niskin water sampler. The water temperature, salinity, and dissolved oxygen (DO) of the water were measured using a water quality meter (6200; YSI, Yellow Springs, OH, USA). For the analysis of dissolved inorganic nutrients, water samples were immediately filtered through a membrane filter (pore size, 0.45 μm; Advantec, Tokyo, Japan), and then the samples were stored in a freezer (−20 °C) until analysis. Chlorophyll-a (Chl-a) in the water was filtered using a glass fiber filter (pore size, 0.7 μm; Whatman, Maidstone, UK), and then Chl-a was stored in the dark at −20 °C until analysis. Duplicate, or mostly triplicate, cores (8 cm in diameter and 30 cm in length) were collected by a SCUBA diver for geochemical analysis. Sediment samples of total reduced sulfur (TRS) were sectioned at 2 cm intervals up to 20 cm, and porewater samples were extracted through pre-drilled holes at 2 cm intervals up to 20 cm using a soil moisture sampler (Rhizon SMS, Rhizosphere Research Products, Wageningen, The Netherlands) under an N2-gas-filled glove box; porewater samples were then stored in a deep freezer (−20 °C) until analysis.

2.3. In Situ Chamber Experiment

A benthic lander (KIOST BelcII, Busan, Republic of Korea) was lowered carefully using a ship’s crane with the assistance of a SCUBA diver to minimize surface sediment disturbance [31,32]. In situ incubations were conducted for over 6 h to estimate SOD, benthic nutrients, and heavy metal benthic fluxes. The BelcII consists of a Teflon-coated incubation chamber, which can prevent contamination during incubation, and an automatic syringe water sampler [32]. The lid of the chamber contains an optode oxygen sensor (4330F, Aanderaa Data Instruments, Bergen, Norway) that measures O2 evolution during in situ incubation. The automatic syringe water sampler collects water samples from the benthic chamber at 40 min intervals.
All syringes, tubing, and plastic wares were rinsed with 5% alkaline surfactant (Extran MA 05, Merck, Rahway, NJ, USA) and 10% HCl (Ultra-100, Kanto, Tokyo, Japan) to prevent metal contamination, and onboard works were performed in a plastic vinyl chamber. Water samples for the nutrient analysis were filtered immediately using membrane syringe filter paper (pore size, 0.45 μm; Advantec, Tokyo, Japan) and then stored in a freezer (−20 °C) until further processing in the laboratory. Samples for heavy metal analysis were filtered through an acid-cleaned membrane syringe filter (0.45 μm; Advantec, Tokyo, Japan) and acidified to a pH of ~1.8 using 12 N HCl (Ultrapure, Merck) under a custom-made portable clean-bench system equipped with a clean HEPA filter (Class 100). The samples were stored in the refrigerator (<4 °C) until analysis.

2.4. Sediment Trap

Four acrylic cylinder traps with diameters of 7 cm, lengths of 60 cm, and aspect ratios of 8.6 were deployed at each site. After the benthic chamber was installed on the sediment, the sediment traps were gently placed on the top frame of the benthic chamber by a SCUBA diver [33]. About 2 h later, the trap cups (filled with high-density salt brine solution [>50‰], which can prevent washout and preserve the collected particles in the trap) were loaded to the bottom of the sediment trap. After retrieving the sediment trap and bringing it back on board the ship, it was left to stand for ~1 h to allow the particulate matter to settle. The overlying water was then carefully siphoned off, and the samples were stored in a dark refrigerator for further processing in the laboratory.

2.5. Laboratory Analysis

Dissolved inorganic nutrients (nitrate, ammonium, phosphate, and silicate) were measured using standard colorimetry methods [34] on a flow injection autoanalyzer (Bran + Luebbe, QuAAtro39 AutoAnalyzer, Delavan, WI, USA). The Chl-a in the water and sediment were spectrophotometrically determined according to the methodology of Parsons et al. [35]. The dissolved Fe2+ in porewater was determined via the colorimetric method using a ferrozine solution [36]. The heavy metals (Mn, Fe, Cr, Co, As, Cd, Pb, Ni, Cu, and Zn) of in situ incubated samples were measured using the Element-2 high-resolution ICP-MS (iCAP-RQ, Thermo Fisher Scientific, Waltham, CA, USA) coupled with a seaFAST (seaFAST-SP3, ESI, Omaha, NE, USA) automated sample introduction system. Measurement quality was assured using certified reference materials for CASS-6 (National Institute Standard and Technology, Gaithersburg, MD, USA) and nearshore seawater certified reference material for heavy metals. The results indicated a recovery rate of 96–108% (Table S1).
To estimate the vertical flux of total mass (TM), particulate organic carbon (POC), total nitrogen (TN), and stable carbon isotope, four aliquots of samples in the sediment trap cup were filtered through precombusted GF/F glass microfiber filters (6827-1315, Whatman, Maidstone, UK) and freeze-dried until reaching a constant weight. The POC and TN content, as well as the stable carbon isotopic composition (δ13C), were analyzed using an elemental analyzer (EA; Vario PYROcube, Elementar, Langenselbold, Germany) in conjunction with an isotope ratio mass spectrometer (IRMS; Isoprime 100, Isoprime, Cheadle Hulme, UK) after acidification with 1N HCl fumes. The isotopic composition was expressed in the δ notation as δ13C (‰) = ((Rsample/Rreference) − 1) × 1000, where R is the corresponding ratio 13C/12C. The isotopic reference for carbon was Vienna PeeDee Belemnite (VPDB).
TRS in the sediment, including acid-volatile sulfide (AVS = FeS + H2S) and chromium-reducible sulfur (CRS = S0 + FeS2), was determined using the methylene blue method [37] after the single-step distillation of sediment with cold 12 N HCl in boiling 0.5 M Cr2+ solution [38].

2.6. Calculation

Benthic fluxes of oxygen, nutrients, and heavy metals across the SWI were calculated as follows:
BF = (dC/dt) × (V/A),
where BF is the benthic flux (mmol m−2 d−1), dC/dt is the slope of the linear regression line derived from the relationship between the concentration and increasing time (mmol L−1 d−1), V is the chamber volume (m3), and A is the chamber area (m2). A negative slope denotes sinking into the sediment, and a positive slope denotes release from the sediment.
The contribution of heavy metal benthic flux to the total amount was calculated as follows [39]:
Contribution   ( % ) = m e a n   B F × R T × A B C × A × W D × 100
where mean BF is the mean benthic flux of each metal (μmol m−2 d−1), RT is the residence time (d), A is the area (m2), BC is the bottom concentration (μmol L−1), and WD is the mean water depth (m).

2.7. Statistical Analysis

Principal components analysis (PCA) was used to evaluate the benthic fluxes and classify the local characteristics of the station by human impacts. The PCA was conducted on the correlation matrix of the variables with varimax rotation [40] using PASW Statistics 19 (SPSS Inc., Chicago, IL, USA).

3. Results

3.1. Physicochemical Characteristics of Water and Vertical Fluxes

The water depth, temperature, salinity, DO, Chl-a, and nutrient values of the water samples are listed in Table 2. Water depth and temperature ranged from 4.4 to 7.9 m and from 16.1 to 21.2 °C, respectively. The DO was generally well saturated (94–135%), except for SH2 (79%) in the bottom water. The Chl-a concentrations in the water ranged from 2.7 ± 0.0 to 15.3 ± 0.9 μg L−1. The lower salinity and higher nutrient concentrations in the surface water of SH1 indicated freshwater inputs from the streams located near the industrial complex and Ansan City. Compared to other stations, all the nutrients in the surface water of SH1 were higher, with ammonium (NH4+) being 6–33 times as high, nitrate (NO3) being 2–34 times as high, phosphate (PO43–) being 6–11 times as high, and silicate (Si(OH)4) being 2–13 times as high.
The vertical fluxes are listed in Table 3. The vertical fluxes of TM, POC, and TN varied from 100 ± 10 to 142 ± 10 g m−2 d−1, from 87 ± 9 to 157 ± 11 mmol m−2 d−1, and from 8.4 ± 0.8 to 12.4 ± 0.9 mmol m−2 d−1, respectively, with the highest fluxes found at SH4, which is located near the freshwater reservoir gate servicing the Daesong agricultural complex. The POC and TN content in the sediment trap ranged from 1.00 ± 0.04 to 1.33 ± 0.17% and from 0.108 ± 0.005 to 0.122 ± 0.009%, respectively. SH4 also yielded the highest POC and TN values. The stable carbon isotopic compositions (δ13C) and C/N molar ratio were less different between the stations in this study.

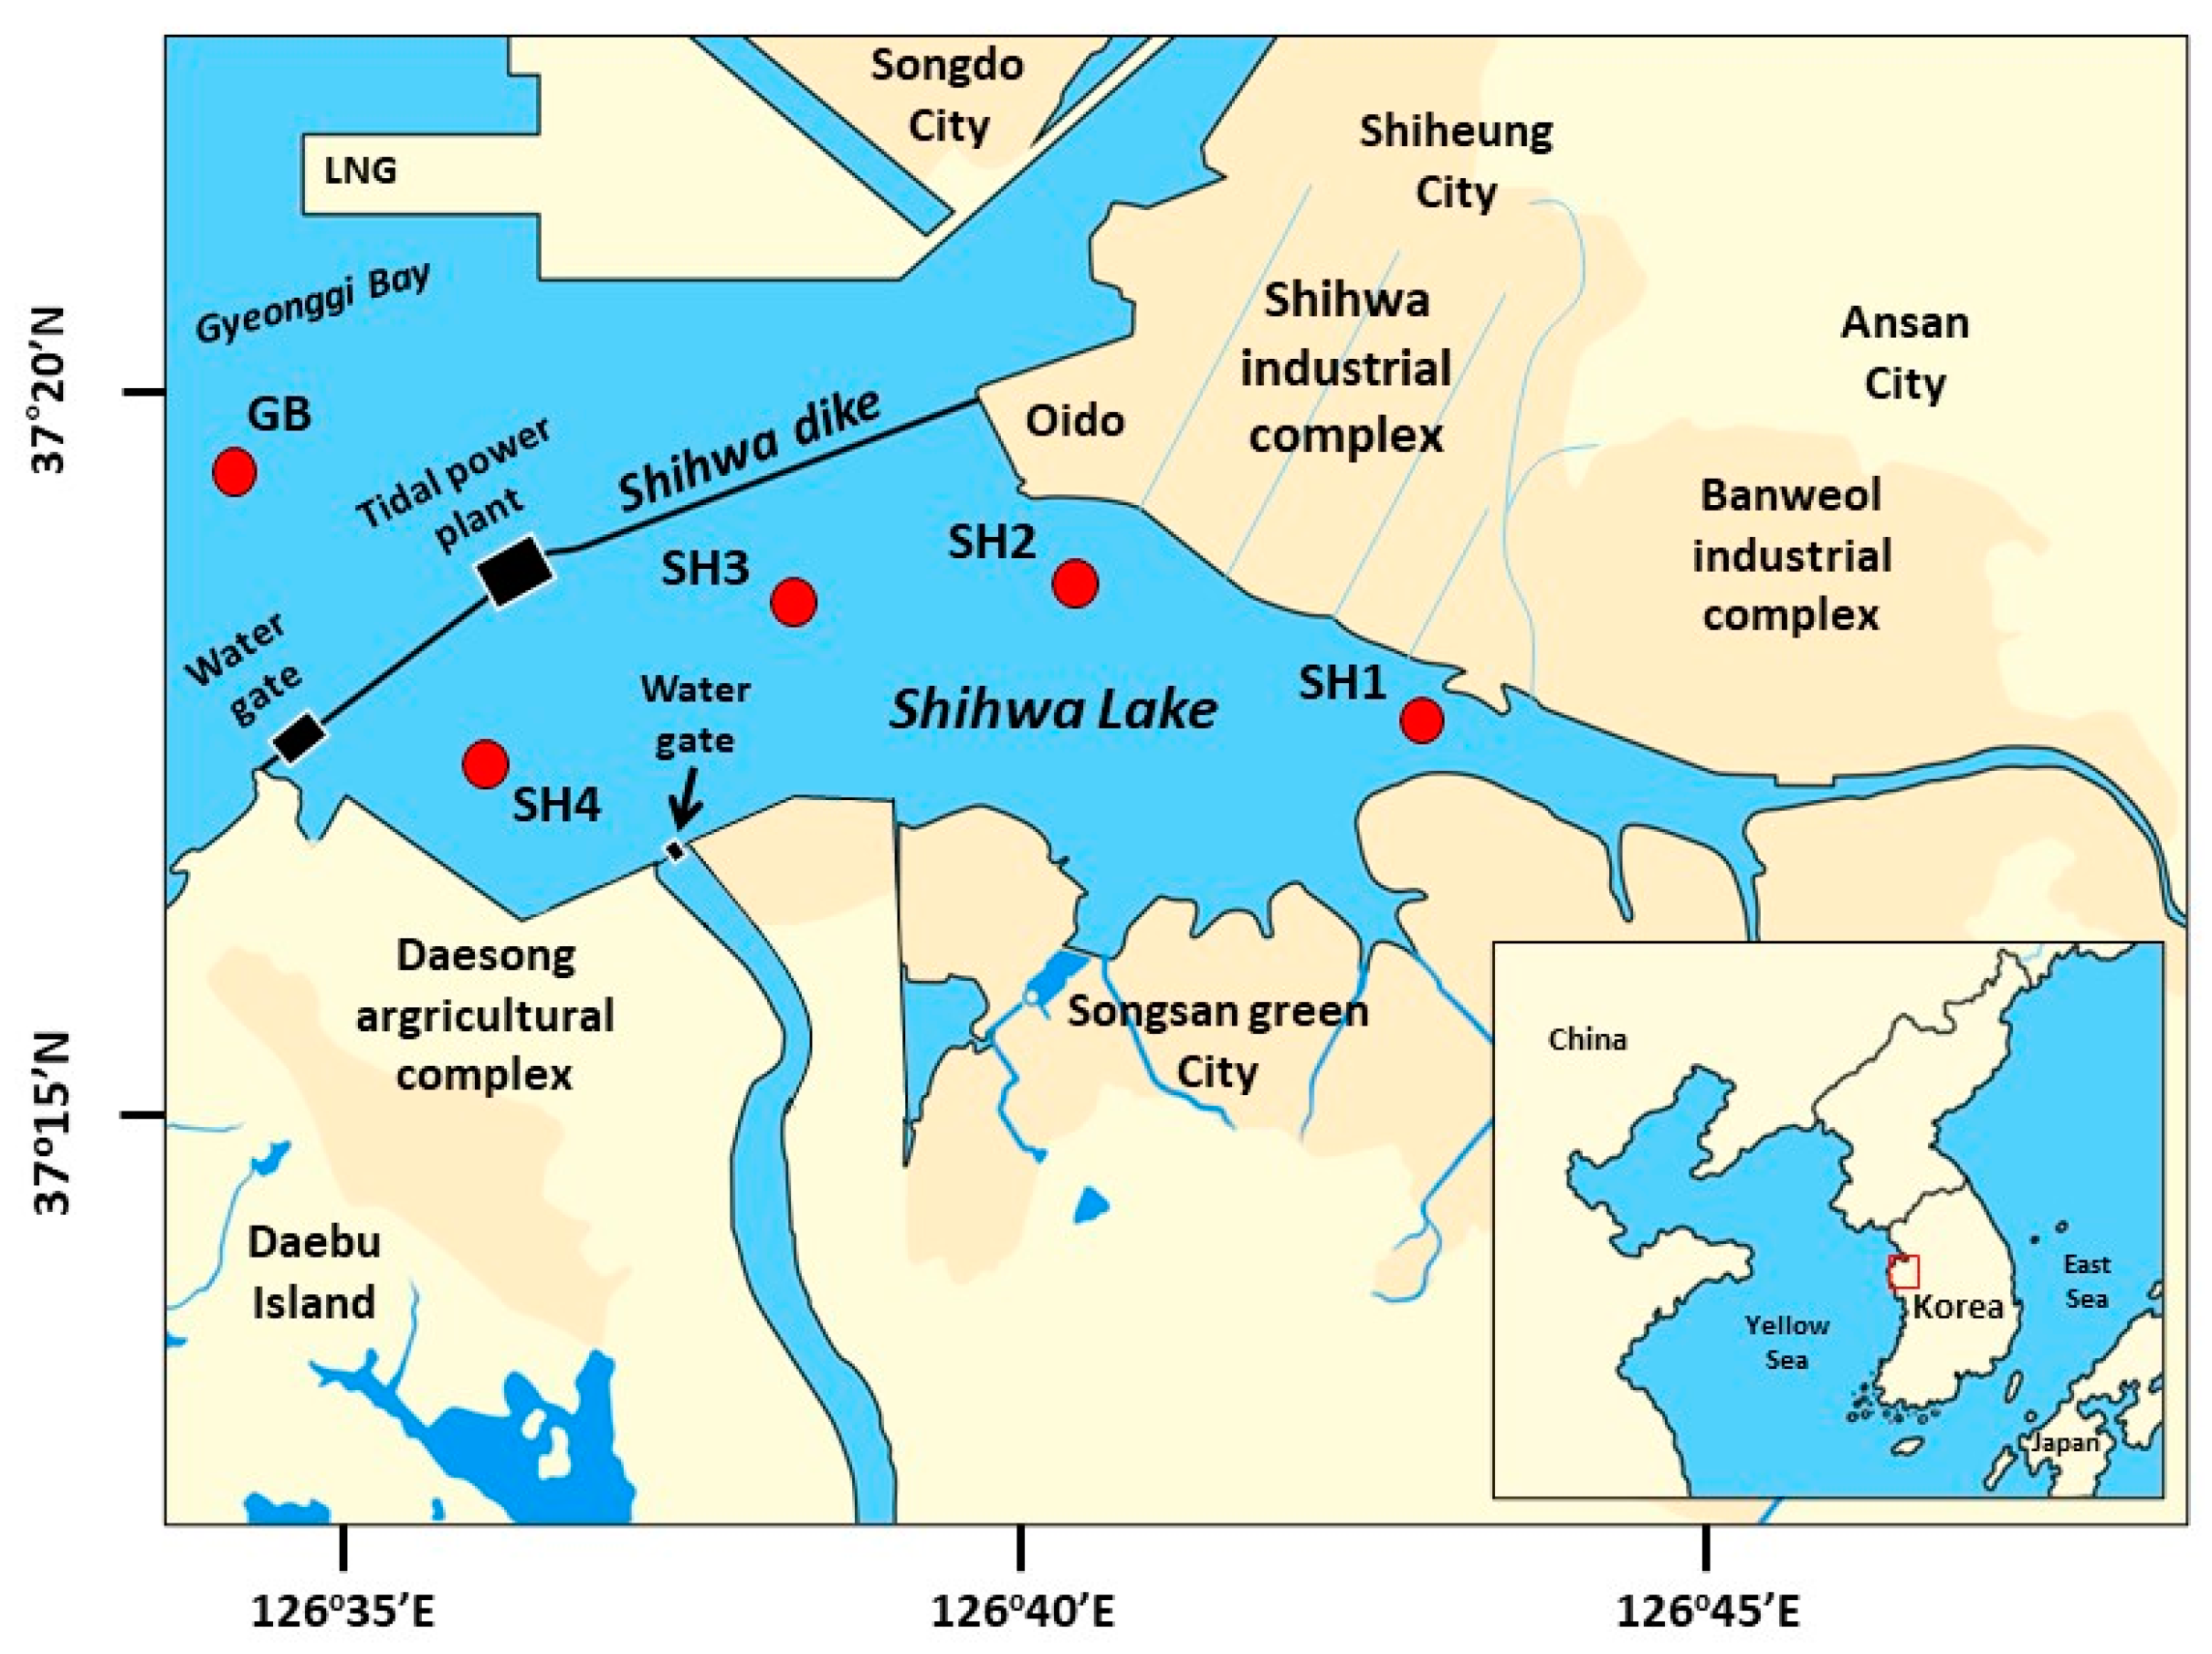
3.2. Porewater and Solid-Phase Geochemistry

Figure 2a shows the vertical profiles of the nutrients and dissolved iron (Fe2+) in the porewater. The NH4+, PO43−, and Si(OH)4 concentrations in the porewater ranged from 94 ± 8 to 879 ± 0 μmol L−1, from 0.7 ± 0.0 to 94 ± 77 μmol L−1, and from 97 ± 3 to 420 ± 56 μmol L−1, respectively. At stations SH1 and SH2, the vertical profiles of NH4+ and PO43−, as well as nd Si(OH)4 in the porewater, exhibited rapid increases with depth, whereas values at stations SH3, SH4, and GB were relatively constant with depth. The NO3 concentrations in the porewater ranged from 0.8 ± 0.1 to 3.4 ± 1.1 μmol L−1. Measured vertically, a higher concentration of NO3 was evident at depths of 0–2 cm, but NO3 was depleted at lower depths, suggesting denitrification and/or anammox in the sediment layer. In particular, high NO3 concentrations in the surface sediment were evident at sites (SH1 and SH2) nearest the industrial complexes. The Fe2+ concentrations in lake sediment ranged from 381 ± 139 to 0.7 ± 0.6 μmol L−1 and showed a sharp increase at a depth of 4–6 cm, but thereafter, Fe2+decreased with increased depth at all stations. Figure 2b shows the vertical profiles of lake sediment TRS, with concentrations ranging from 4.3 ± 0.1 to 94.2 ± 0.1 μmol cm−3, which increased rapidly with increasing depth at SH1, SH2, and SH3.
Table 4 presents depth-integrated nutrient, Fe2+, and TRS values down to a 10 cm depth. The depth-integrated inventory of SH1 and SH2 averaged values for NH4+, PO43−, and Si(OH)2 were ~2, 4–14, and ~2 times higher, respectively, than those of other stations (Table 4). Little difference in depth-integrated NO3 was observed across stations. Depth-integrated inventories of Fe2+ ranged from 6.62 to 15.45 mmol m−2, with the highest value evident at station SH1. The depth-integrated inventories of TRS at SH1 and SH2 (2.54–2.67 mol m−2) were comparable to or higher than those measured at other stations (1.19–2.56 mol m−2).

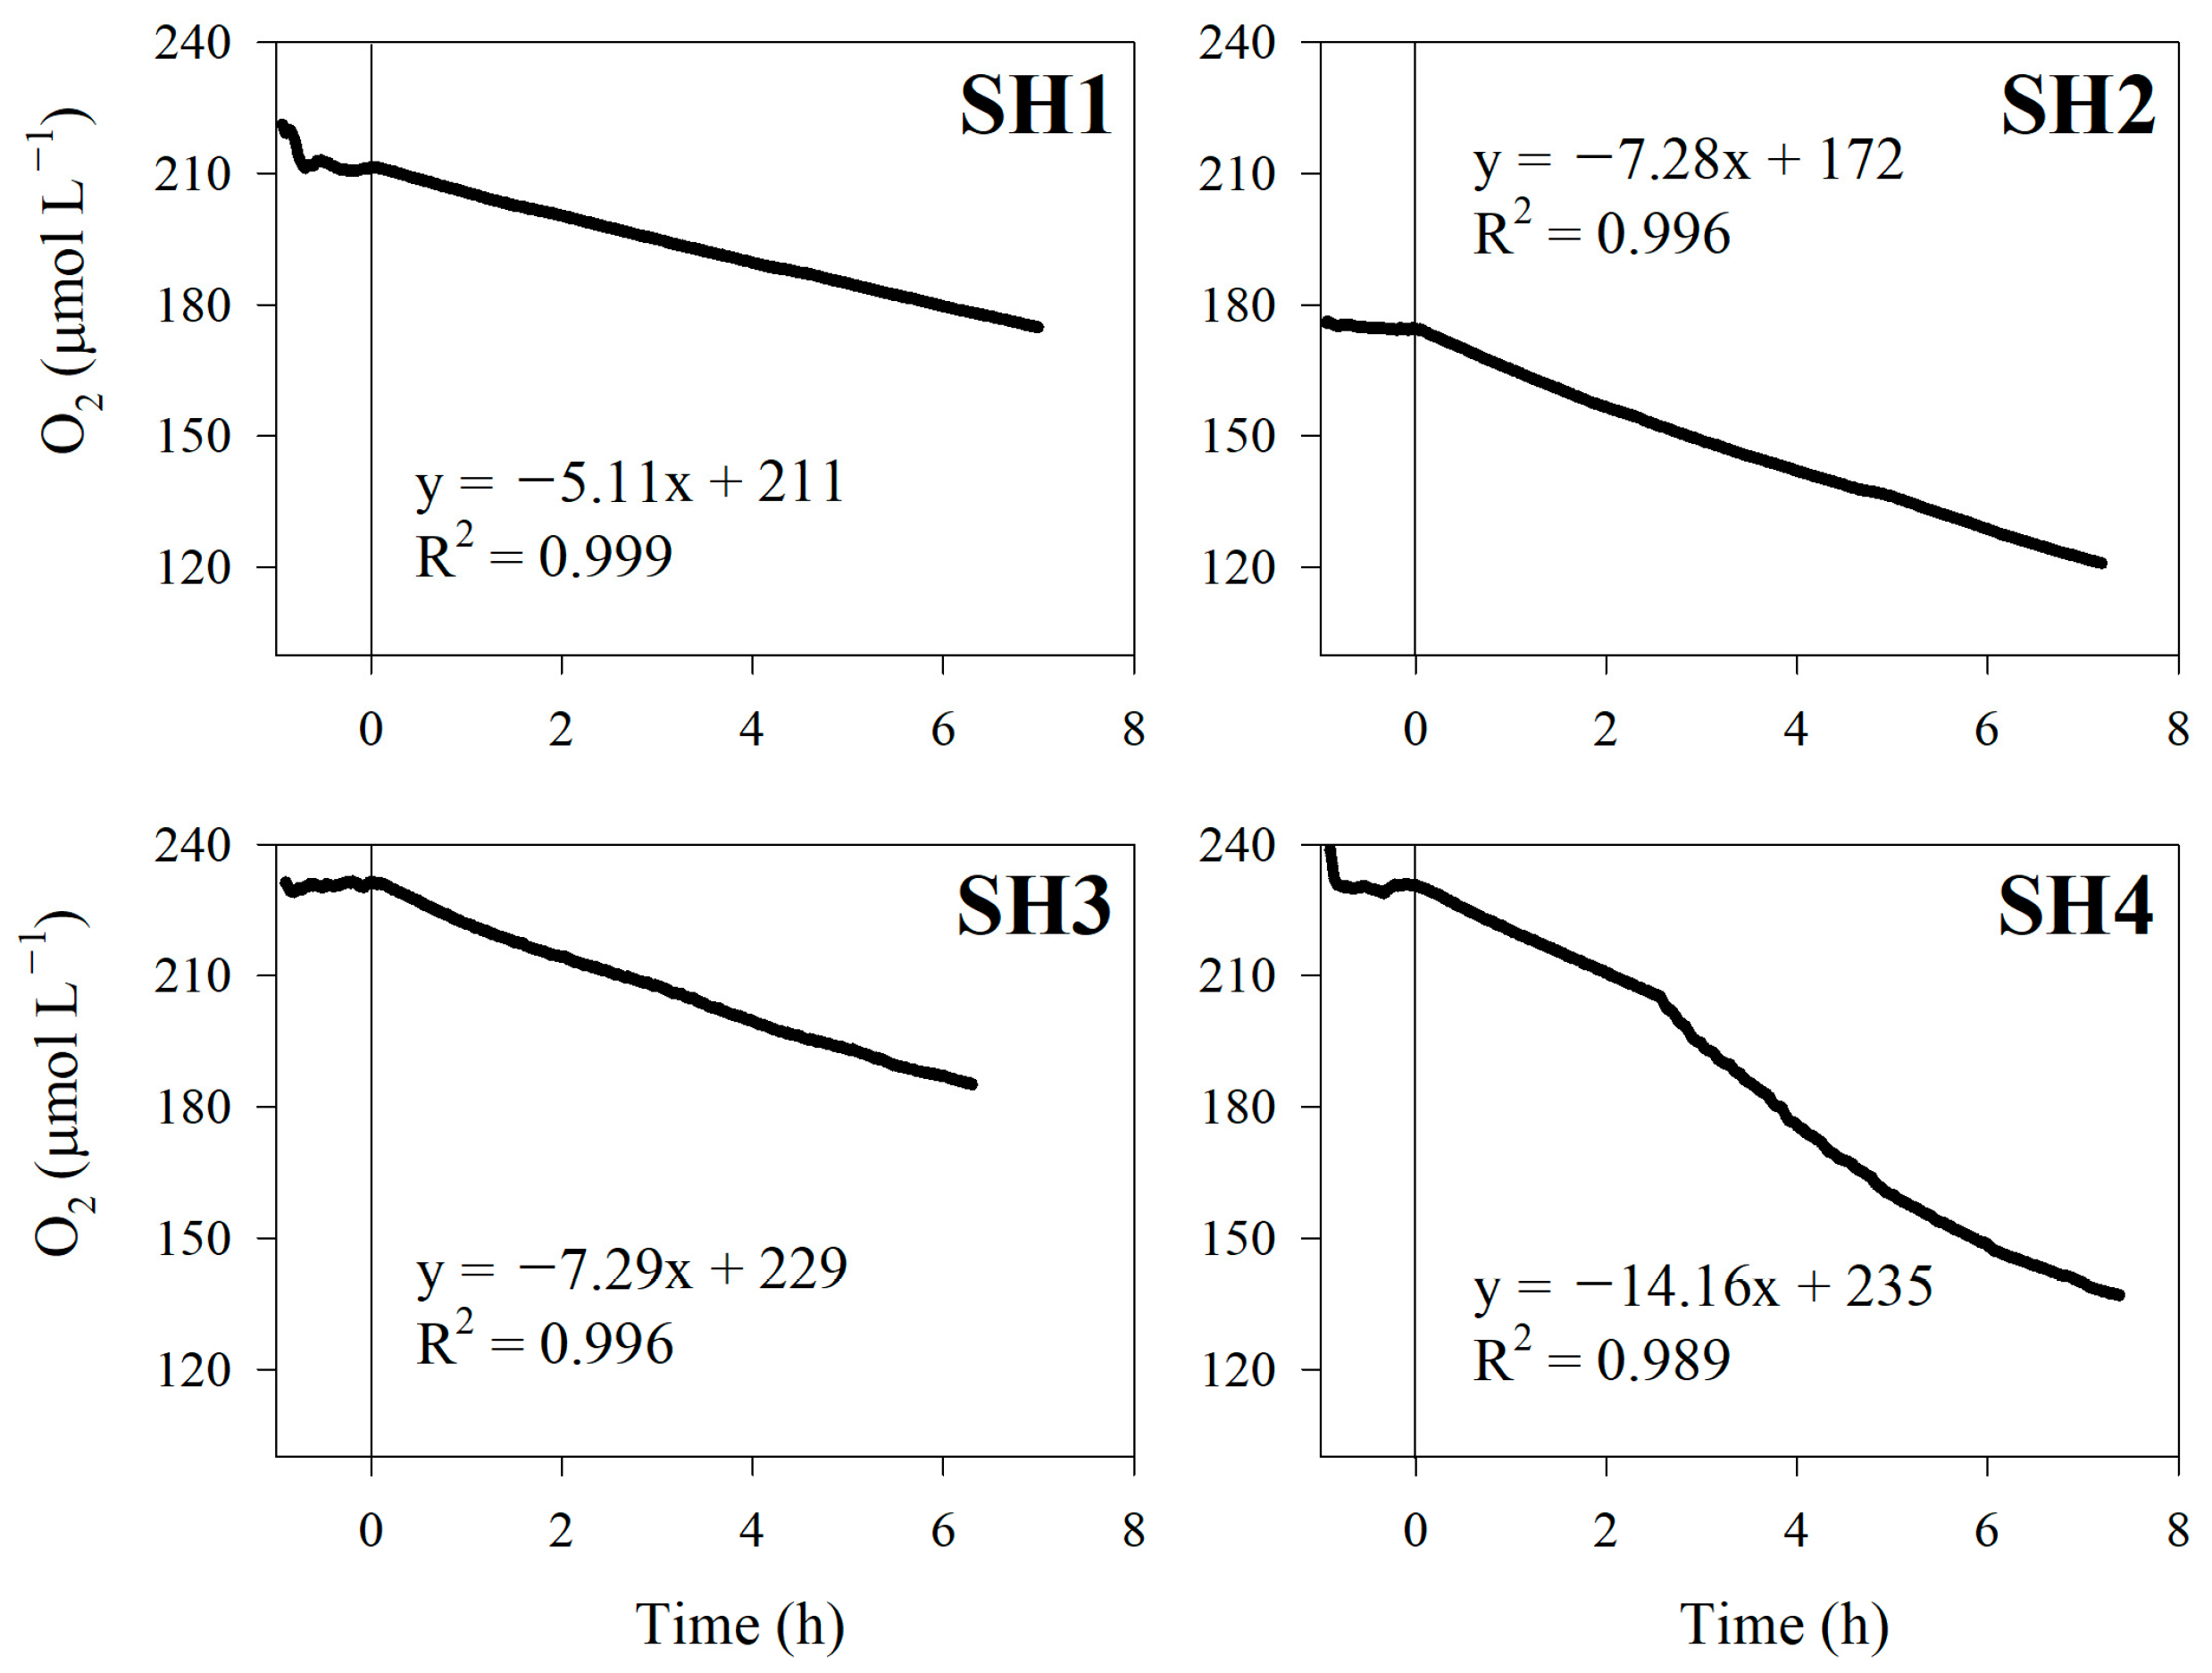
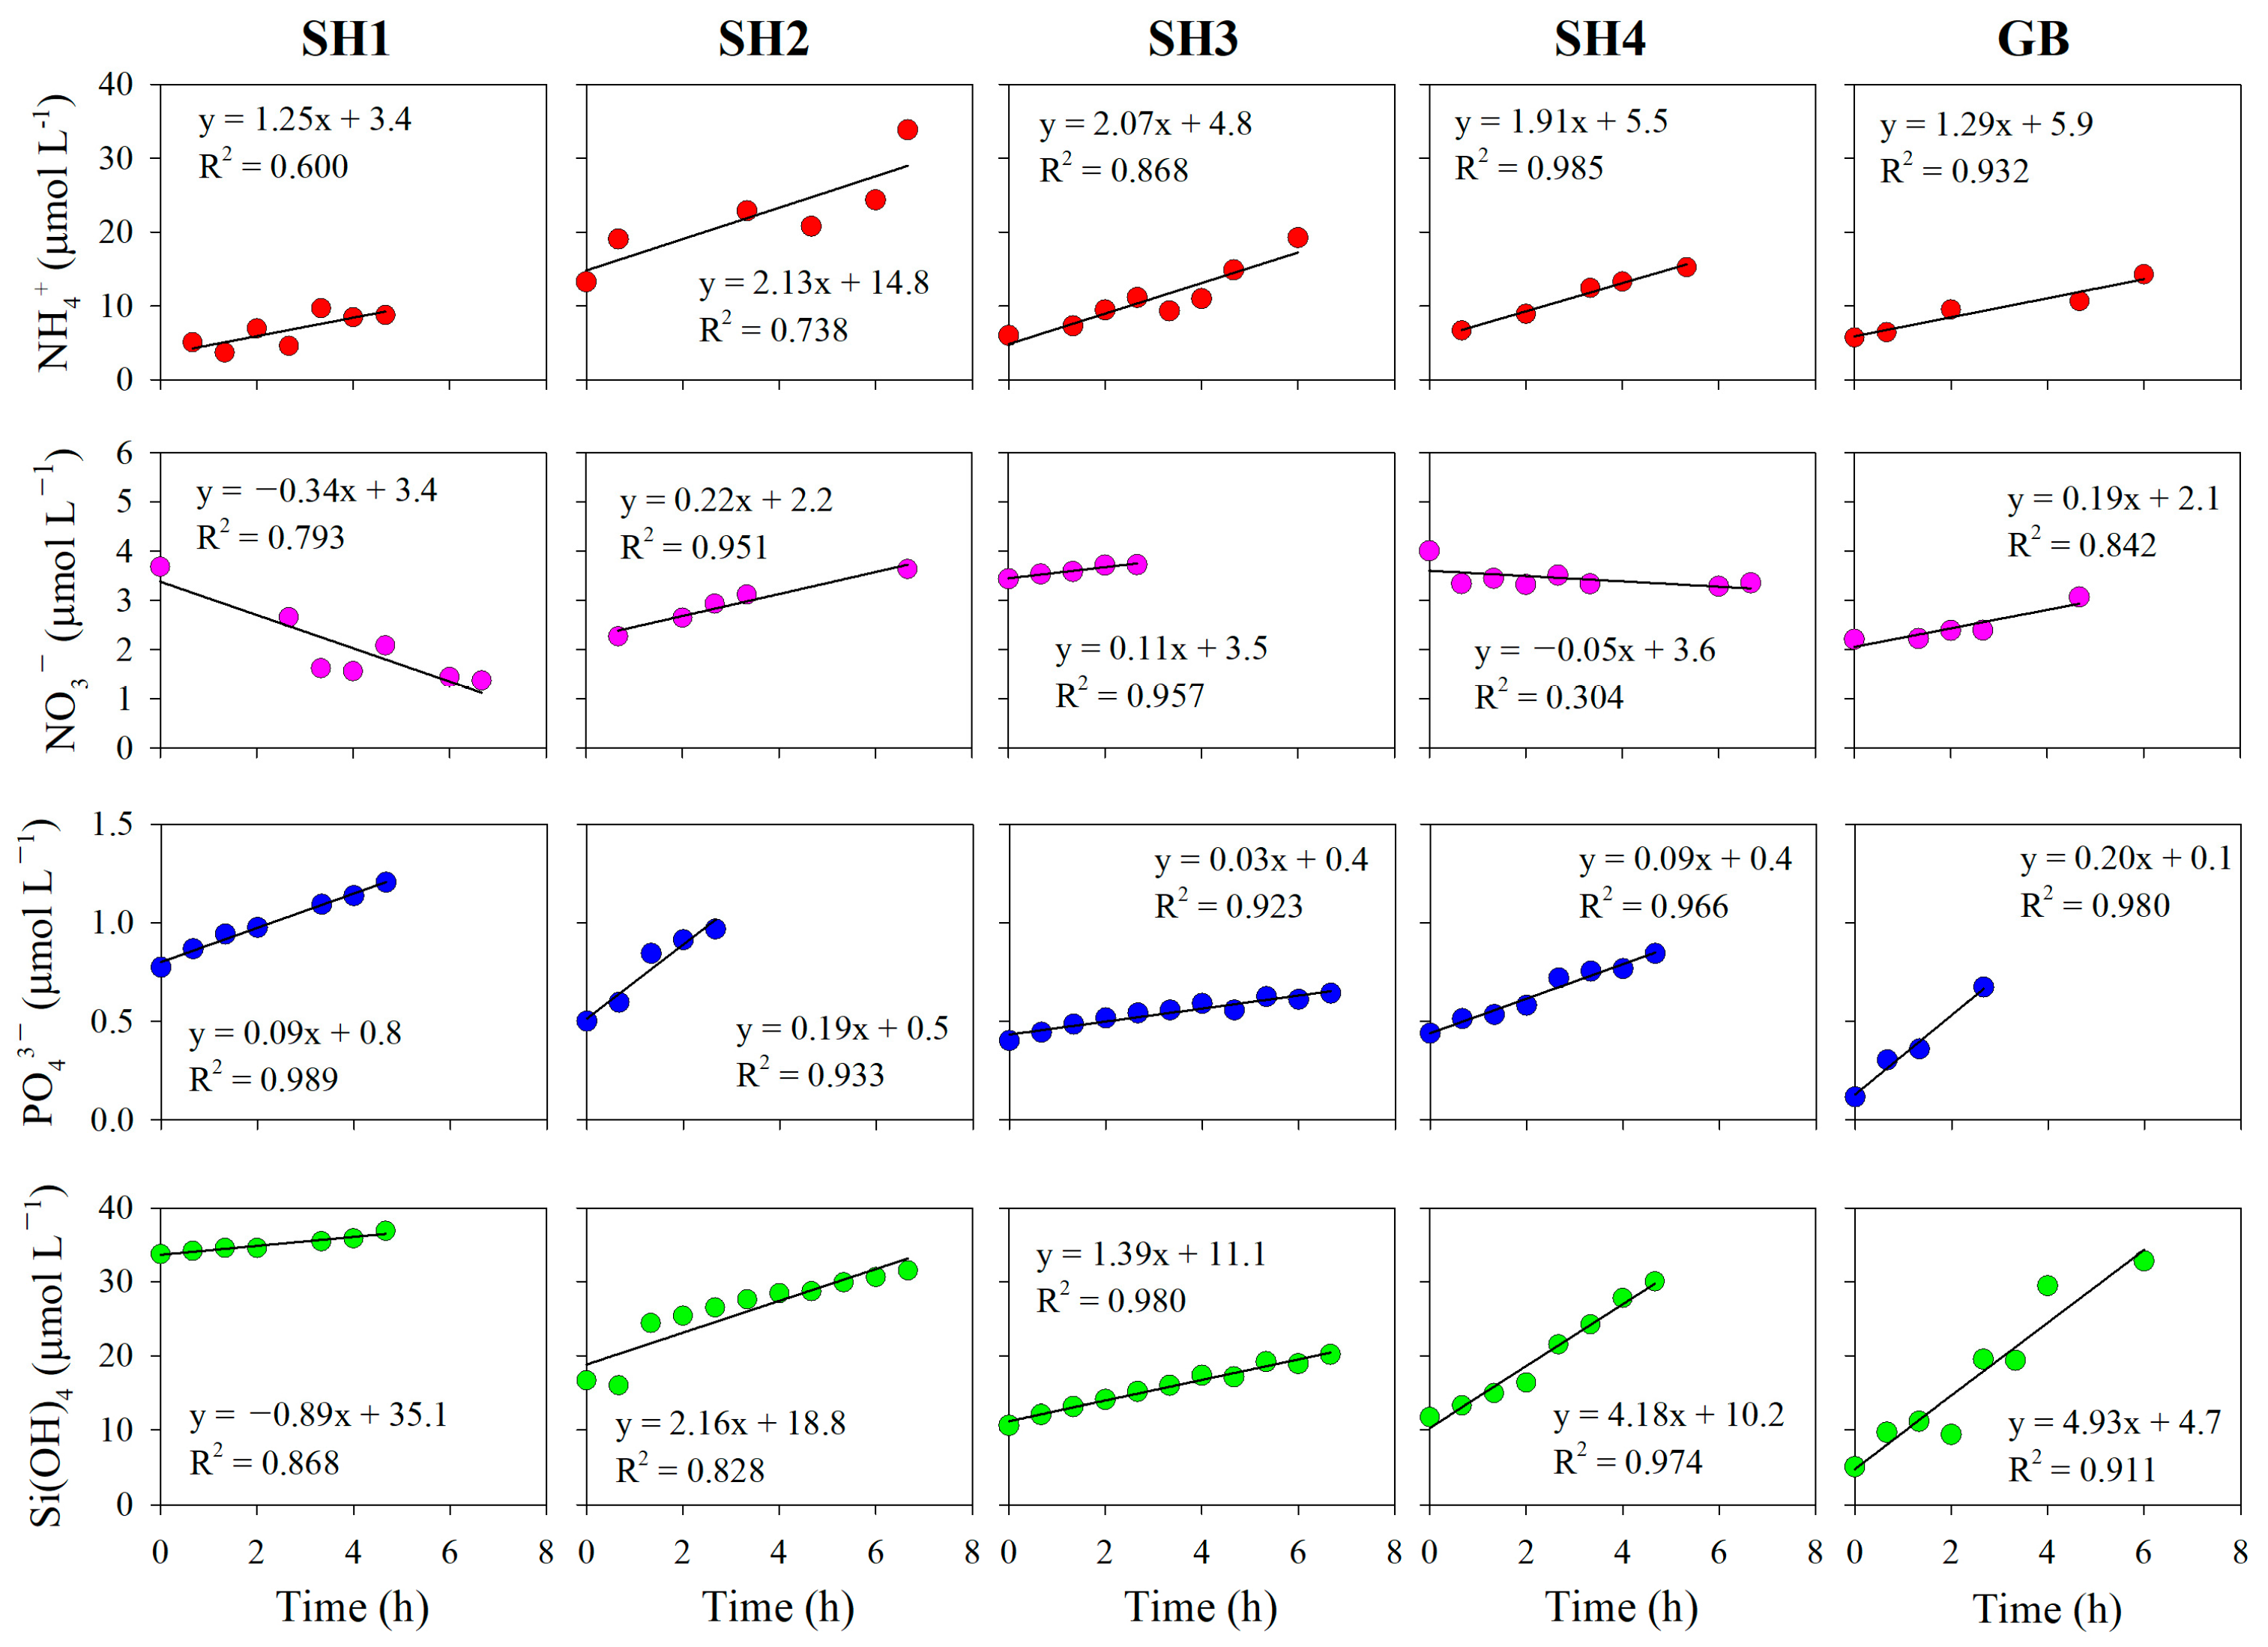
3.3. Sediment Oxygen Demand and Benthic Nutrient Flux

Figure 3 and Figure 4 show oxygen and nutrient variations yielded during in situ incubation, respectively. The SOD and BNF measurements are listed in Table 5. Oxygen concentrations in the benthic chamber decreased linearly over time at all stations. Unfortunately, the SOD measurement taken at the GB station is not included in our dataset because of a failure of the optode sensor. The SOD results ranged from 30.6 ± 0.0 to 83.3 ± 0.2 mmol m−2 d−1, with the highest value estimated at SH4. Overall, nutrient concentrations gradually increased over time, but the decreases in NO3 at stations SH1 and SH4 imply that denitrification and/or anammox may be more prominent than nitrification in lake sediment. The BNF across the SWI ranged from 7.36 ± 2.69 to 12.50 ± 3.72 mmol m−2 d−1 for NH4+, –from 1.99 ± 0.45 to 1.31 ± 0.17 mmol m−2 d−1 for NO3, from 0.19 ± 0.02 to 1.18 ± 0.12 mmol m−2 d−1 for PO43−, and from 3.56 ± 0.36 to 29.00 ± 3.71 mmol m−2 d−1 for Si(OH)4.

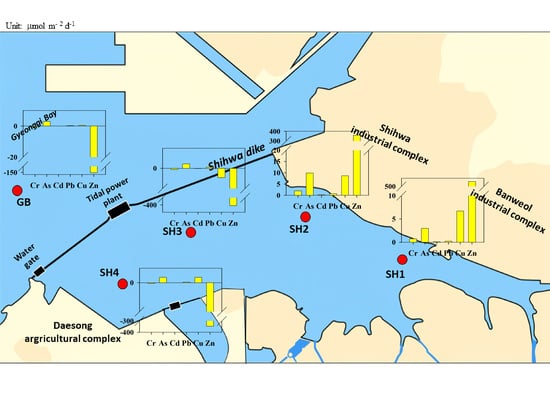
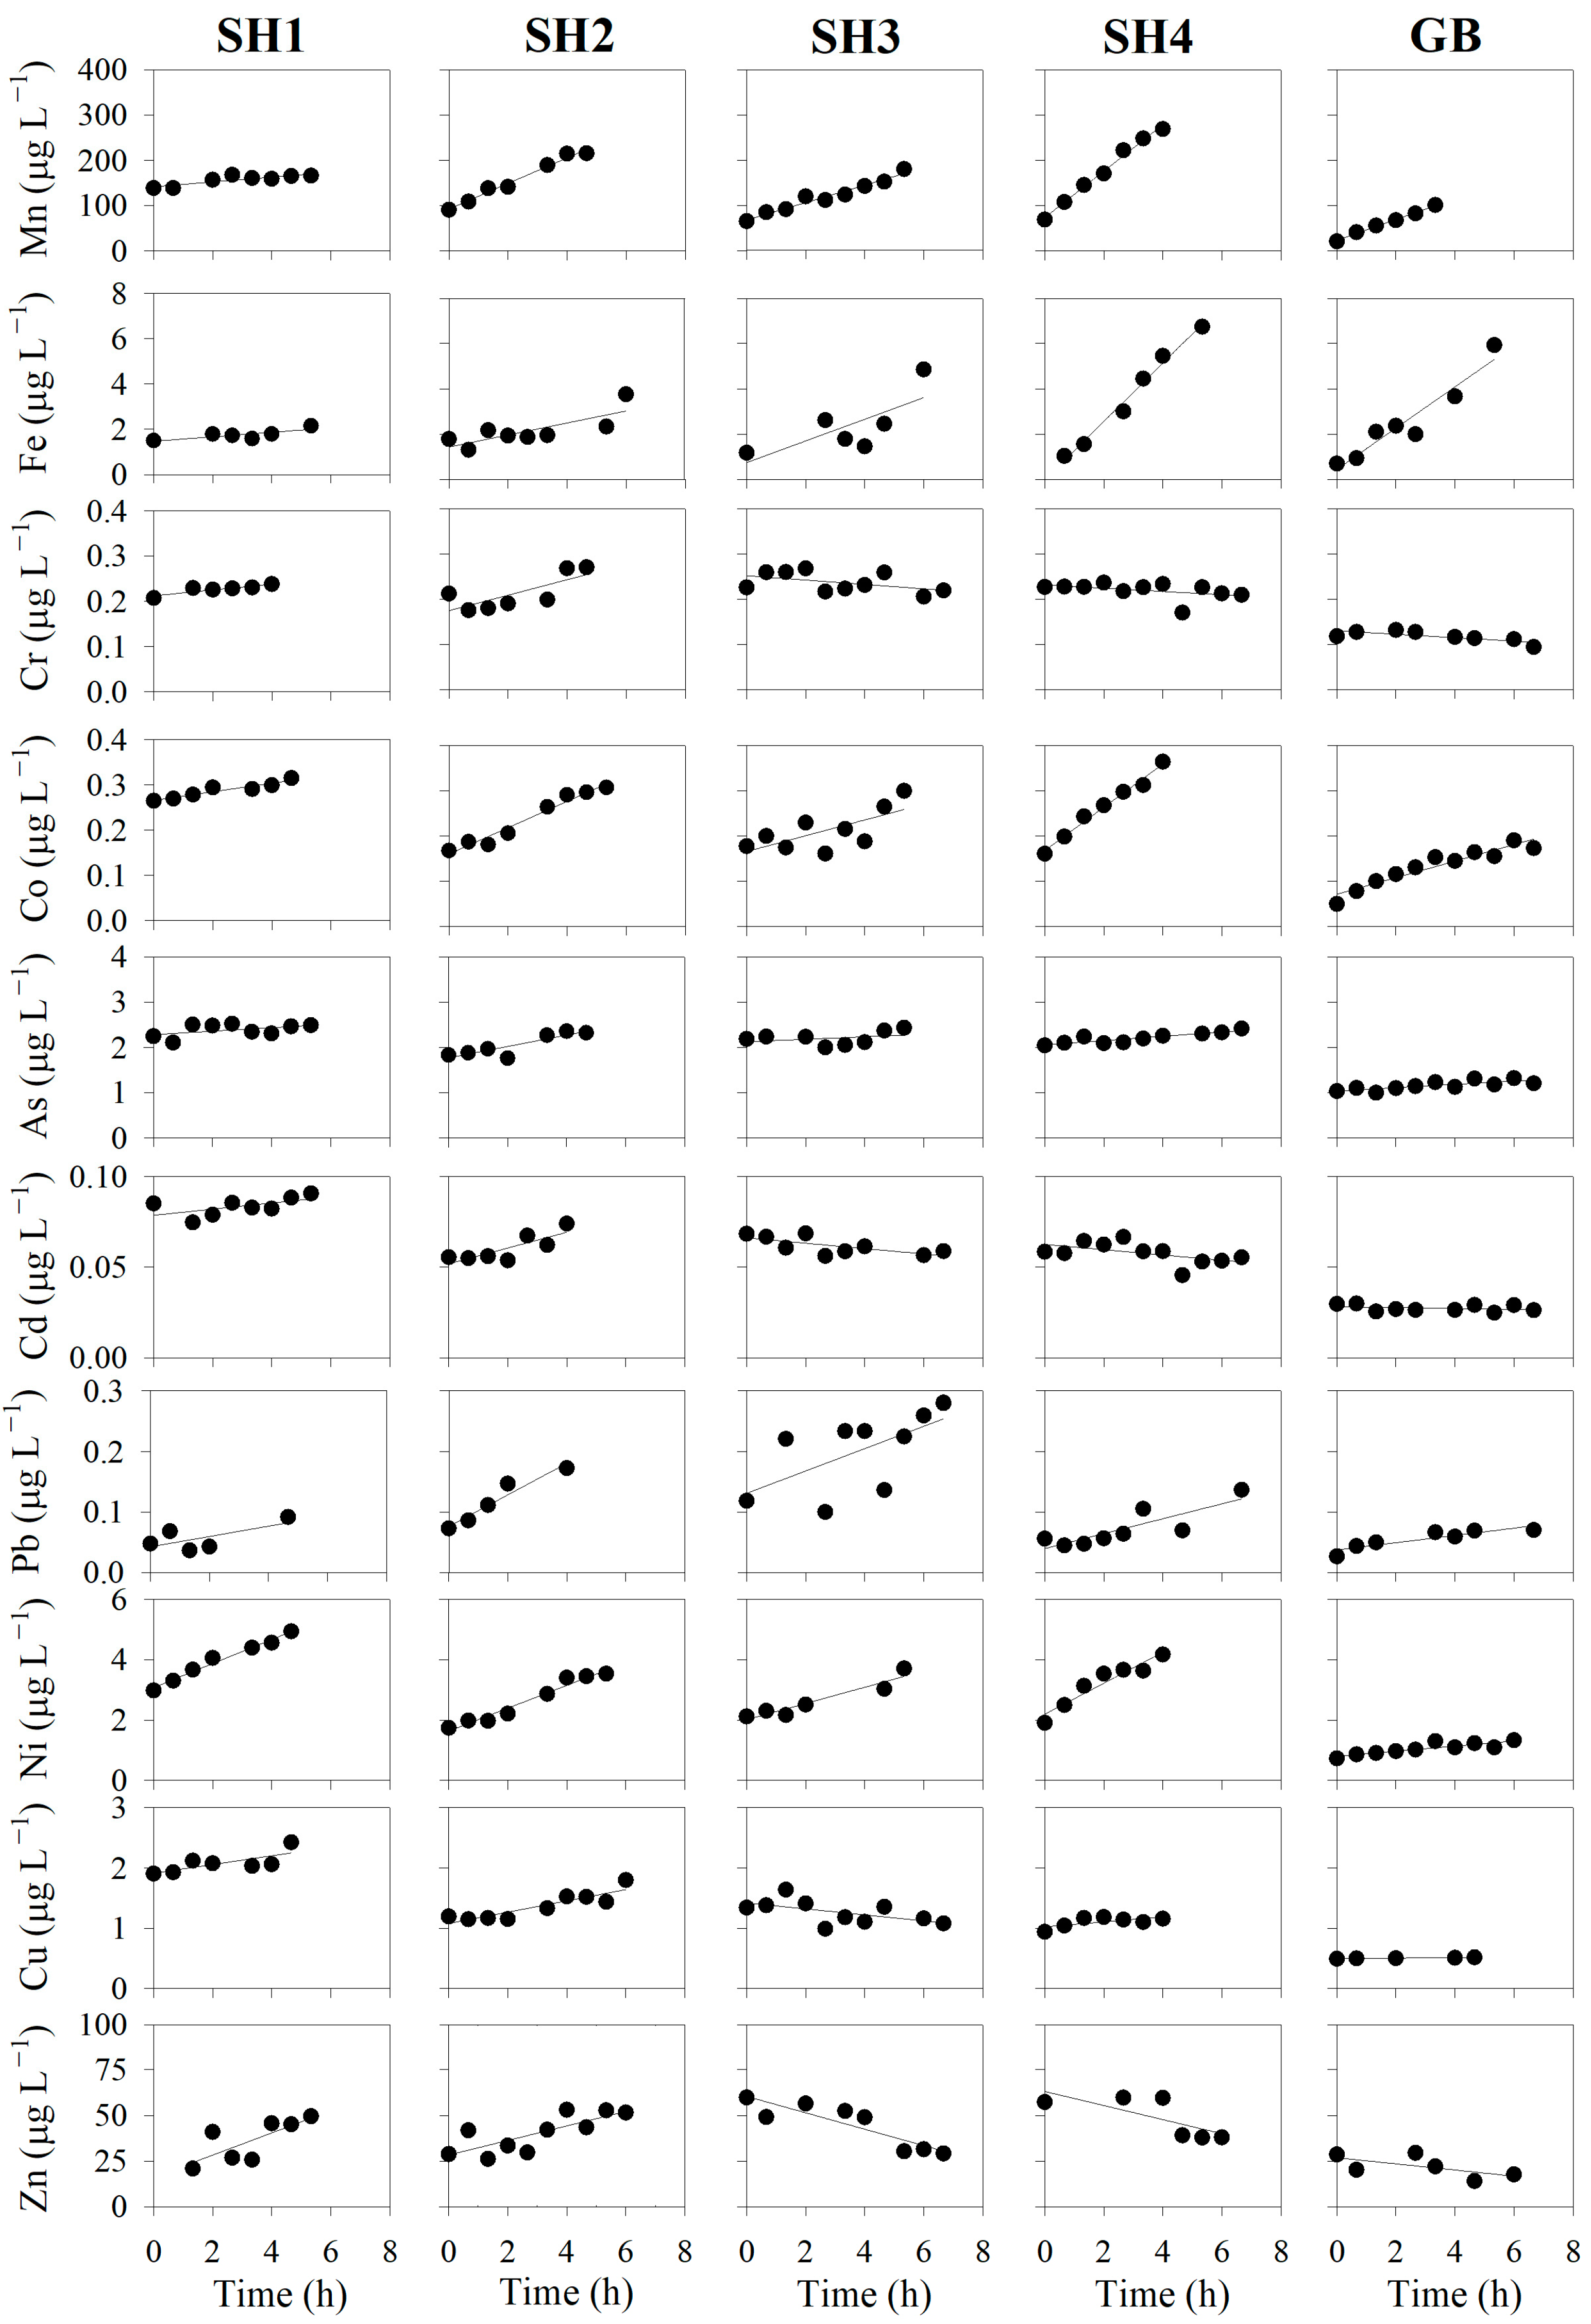
3.4. Heavy Metal Benthic Flux

Figure 5 shows the variation in dissolved heavy metals (Mn, Fe, Cr, Co, As, Cd, Pb, Ni, Cu, and Zn) during in situ incubation, and the fluxes of those are listed in Table 6. The initial concentrations of each heavy metal were comparable to previous results obtained at Shihwa Lake [41]. Nearly all heavy metal benthic fluxes were released via SWI. In particular, the benthic fluxes of Mn, Fe, Co, and Ni at SH4 were found to be 2–10, 1.4–13.6, 2–5, and 2–6 times higher, respectively, than those measured at other stations. On the other hand, the benthic fluxes of As and Pb at SH2 were 3–5 and 2–4 times higher, respectively. The benthic flux of Cu at SH2 showed the highest value, and it showed negative value at SH3. The benthic fluxes of Cr, Cd, and Zn at SH1 and SH2 were released via SWI, but they were sunk into other stations.

4. Discussion

4.1. Control Factors for Sediment Oxygen Demand

The benthic flux of oxygen has been used as a robust substitute for the OC oxidation rate and OM enrichment because microbial communities in the sediment use oxygen as an electron acceptor for OC degradation through complex respiration pathways [22]. SOD can be controlled by several factors, such as primary productivity in surface water, water depth, water temperature, oxygen concentration, vertical fluxes, and OM content [42,43,44]. As there were no significant differences in water depth, temperature, and DO concentration across the study area, the assessment of major control factors for SOD was not valid.
The SOD showed strong linear relationships with the POC content of settling particles (R2 = 0.87) and vertical POC flux (R2 = 0.99). In previous studies, the SOD showed a positive correlation with POC content in continental shelf sediment, but a negative correlation with the C/N ratio in OM-enriched fish farm sediment [44,45]. These results suggest that both OC quantity and quality in sediment are key to controlling the benthic mineralization of OM [46,47,48]. In the Shihwa Lake study area, however, the C/N and δ13C values, which are proxies of OM quality, showed a relatively narrow range with spatial variations. Otherwise, the spatial differences in vertical fluxes of POC could be explained by a potential point source of OM, i.e., the significantly higher SOD and POC fluxes at SH4 may imply that benthic respiration is controlled by the quantity of OM supply from the water column to the sediment. Despite the highest SOD being recorded at SH4, the recorded accumulations of reduced products of metabolic activities (i.e., NH4+, PO43−, Fe2+, and TRS) in the porewater and solid phase at SH4 were lower than the values recorded at SH1 and SH2. This result indicates that the reduced inorganic metabolites produced via OM oxidation were, in fact, a result of reoxidation or flushing out produced by the strong current velocity (12–13 m s−1) via the operation of the tidal power plant near SH4 [49].
The averaged SOD inside of Shihwa Lake (49.9 ± 23.0 mmol m−2 d−1) was significantly higher than the values obtained from other continental sediments, but it was comparable to values obtained from semi-enclosed and organically enriched coastal bay sediments elsewhere in South Korea (Table 7). However, our result was lower than that obtained from the aquaculture sediment deposited by excess OM from excess food and biodeposits (Table 7).

4.2. Benthic Nutrient Flux and Benthic–Pelagic Coupling

The mean BNF values were 10.7 ± 3.8 mmol N m−2 d−1 for dissolved inorganic nitrate (DIN; NH4+ + NO3), 0.58 ± 0.4 mmol P m−2 d−1 for dissolved inorganic phosphate (DIP; PO43−), and 10.05 ± 12.3 mmol m−2 d−1 for Si(OH)4 (Table 8). The BNF values measured at Shihwa Lake were higher than those measured in other coastal environments, such as Namhae Island and the South Sea of South Korea (1.5–3.2 mmol N m−2 d−1 and 0.11–0.33 mmol P m−2 d−1, respectively) [50] the Ria de Vigo of Galicia, Spain, and the wide Iberian Peninsula (1.1–5.4 mmol N m−2 d−1 and 0.08–0.34 mmol P m−2 d−1, respectively) [15]; and the Mid-Atlantic Bight that extends from Cape Hatteras, NC, USA, to Cape Cod, MA, USA (−0.27–2.63 mmol N m−2 d−1 and 0.01–1.26 mmol P m−2 d−1, respectively) [52]. Furthermore, those were comparable to that of the sediment at shellfish farms that received a tremendous amount of OM through biodeposition, an oyster farm in South Korea (9.30 mmol N m−2 d−1 and 0.46 mmol P m−2 d−1) [44], and a mussel farm in Canada (1.1–8.2 mmol N m−2 d−1 and 0.36–1.20 mmol P m−2 d−1) [53]. Additionally, outside of the Shihwa Lake dike, sampling station GB had a high efflux of dissolved inorganic nutrients, which were 8.7 mmol N m−2 d−1 for DIN, 1.18 mmol P m−2 d−1 for DIP, and 29.00 mmol m−2 d−1 for Si(OH)4.
In shallow coastal environments, the release of inorganic nutrients via SWI into the water column can sustainably support primary production (PP) [54,55,56,57,58]. To assess the contribution of BNF to the requirements of PP, it was used to estimate the value by applying the Redfield ratio to the BNF. Heo [59] and Shin et al. [60] reported that PP inside of the Shihwa Lake dike ranged from 129 to 146 mmol C m−2 d−1 (average, 64 mmol C m−2 d−1), and outside the Shihwa Lake dike, the value was 167 mmol C m−2 d−1. Based on the Redfield ratio (C:N:P = 106:16:1) for phytoplankton growth, the DIN and DIP requirements for PP were estimated to be 9.6 mmol N m−2 d−1 and 0.6 mmol P m−2 d−1 inside of the Shihwa Lake dike and 25.2 mmol N m−2 d−1 and 1.58 mmol P m−2 d−1 outside of the Shihwa Lake dike. Therefore, the benthic fluxes of DIN and DIP accounted for 35–144% (average, 96 ± 39%) and 32–184% (average, 92 ± 63%) of the N and P requirements for PP, respectively (Table 7). These results suggest that high BNF values were comparable to those measured on other eutrophic coasts, e.g., at sea squirt farms (88 ± 90% for N, 64 ± 53% for P [31]) and oyster farms in South Korea (89% for N, 70% for P [44]). Consequently, the BNF of Shihwa Lake can act as an important point source of nutrients via tight benthic–pelagic coupling, which may promote unusual phytoplankton blooms.

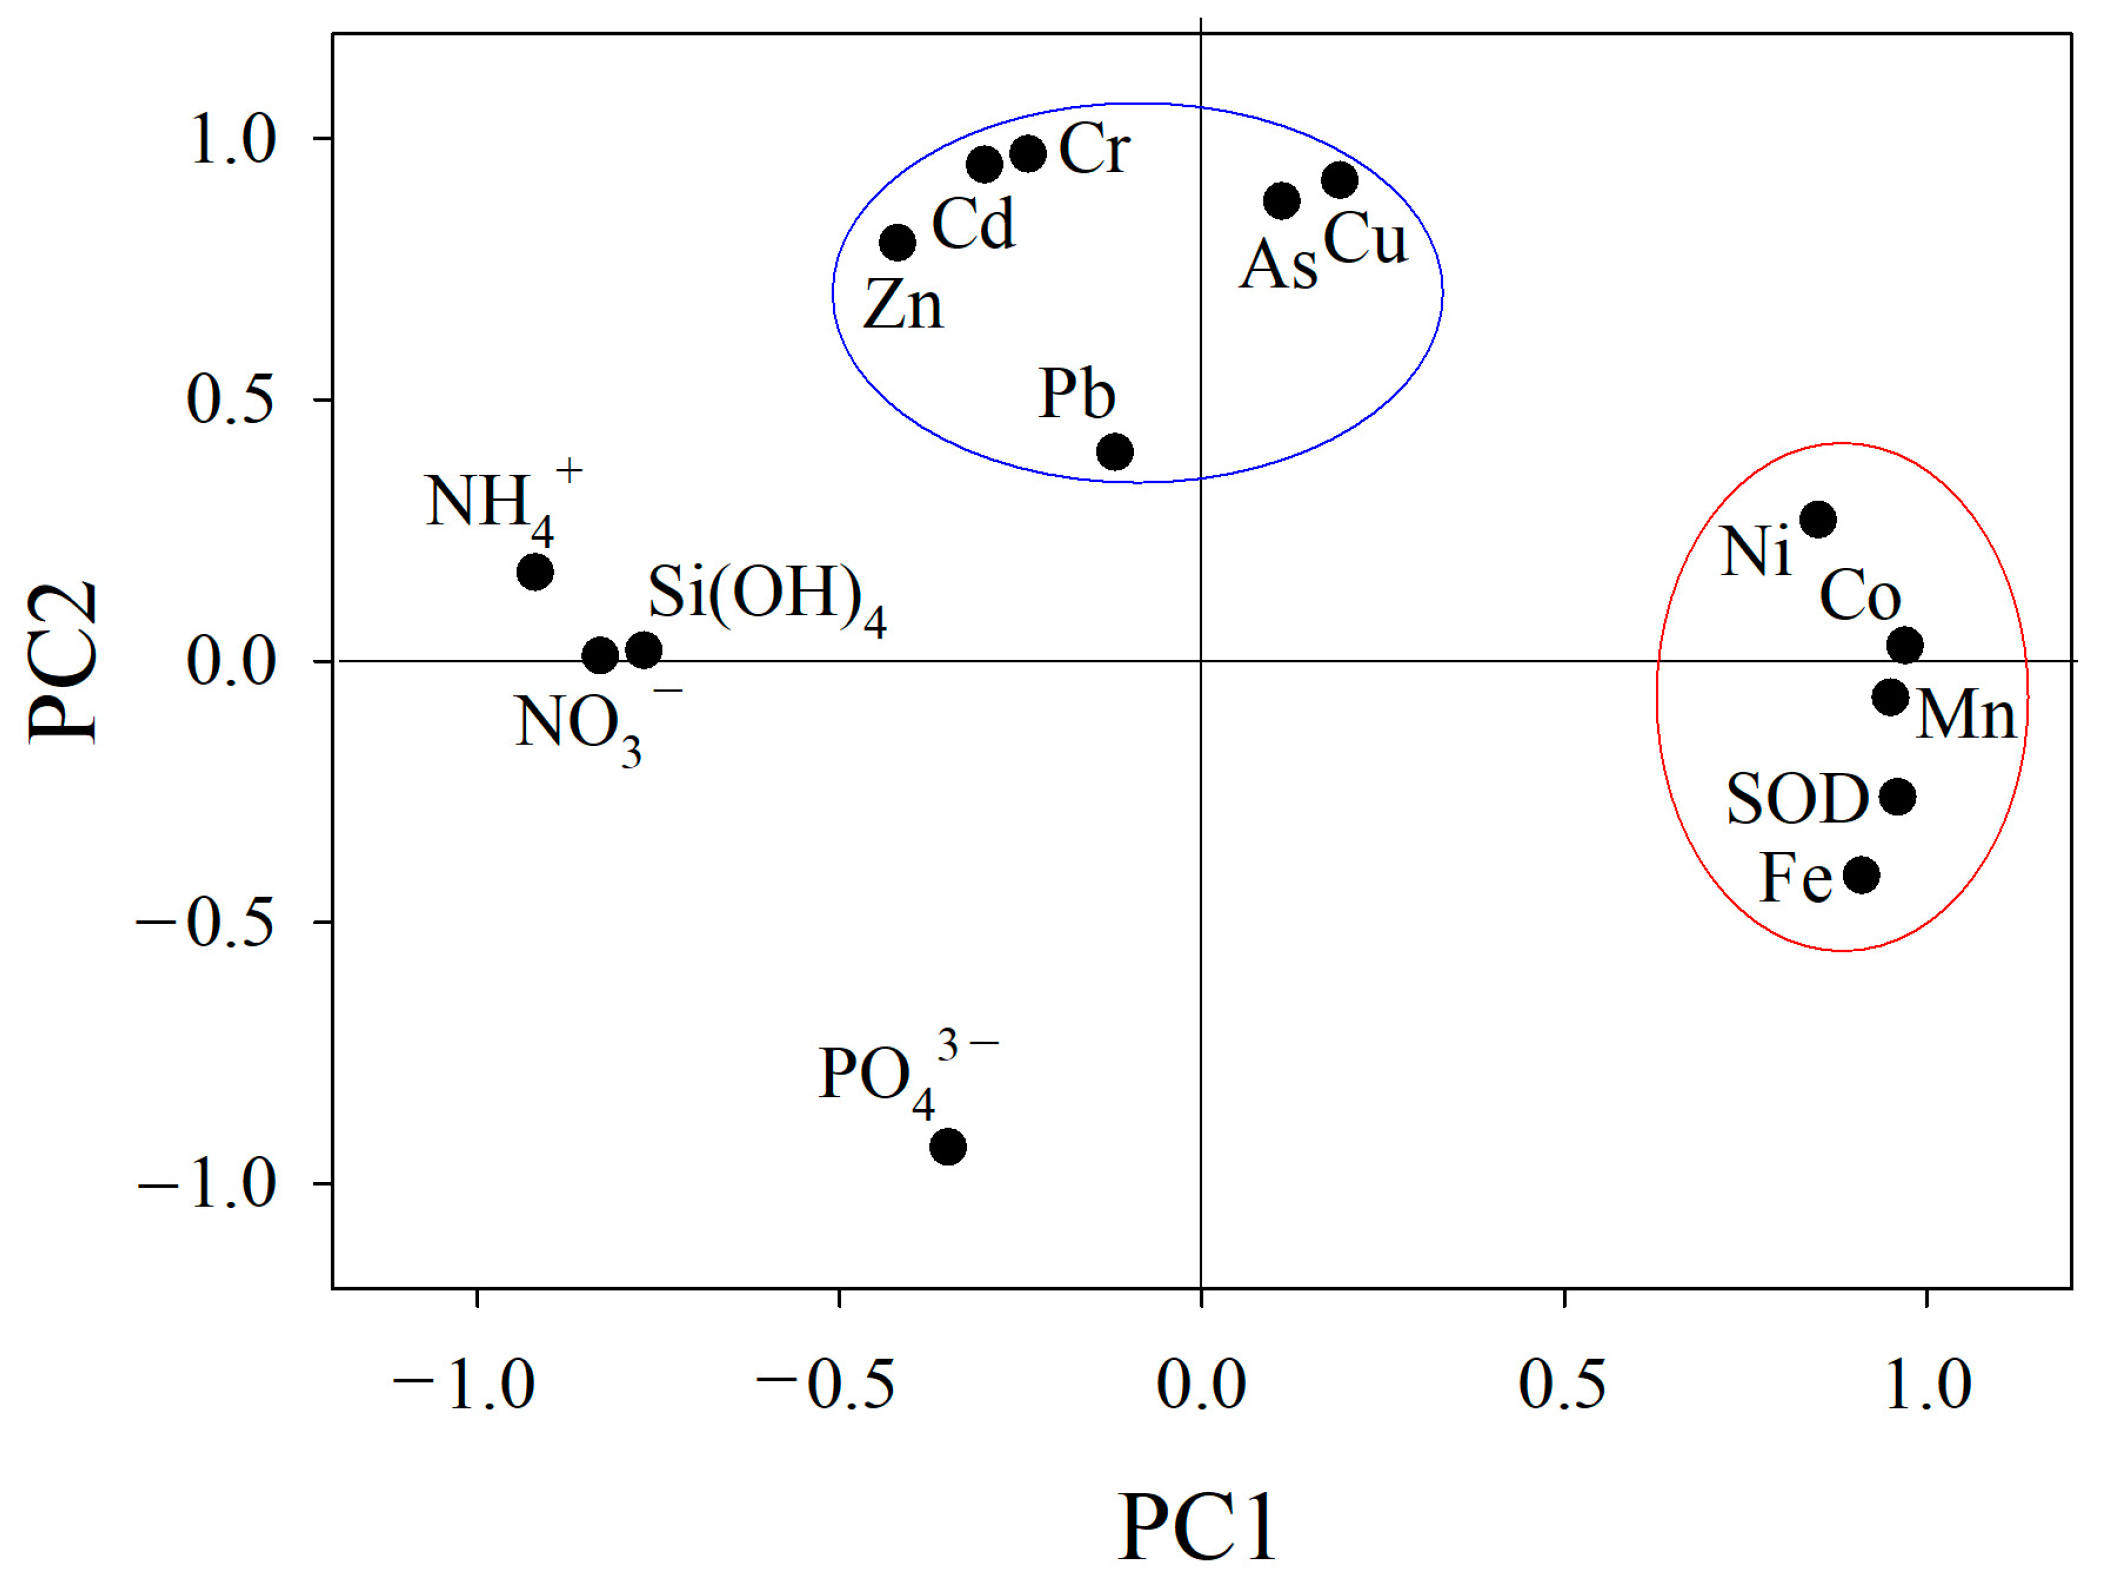
4.3. Control Factors for Heavy Metal Benthic Flux

Heavy metal benthic fluxes in Shihwa Lake have revealed remarkable and outstanding results compared to other polluted coastal waters (Table 9). Our findings highlight the significant impacts of anthropogenic pollution sources, particularly from the steel-smelting, semiconductor, and machine manufacturing facilities that make up approximately 81% of the Shihwa industrial complex [61,62], on the heavy metal benthic fluxes in Shihwa Lake.
Two principal components (PC) were identified that explained 82.4% of the total variance, with PC1 explaining 46.1% of the variance and PC2 explaining 36.3% of the variance (Table S2). The correlations between the measured fluxes and the two components are shown in Figure 6. The loading plot reveals that PC1 is primarily driven by heavy metal fluxes that can be controlled by early diagenesis of sediment, while BNF has a weaker influence on this component. The high positive scores for Mn, Fe, Co, Ni, and SOD, as well as the high negative scores for nutrient variables (Table S2), indicate that Mn and Fe are released from sediments via Mn- and Fe-oxide reduction [68,69], accompanied by the remobilization of Co and Ni in the sediment [70]. Additionally, dissolved Co could be a source of bottom water during the diagenetic reduction of Mn and Fe oxides in the benthic chamber [22].
Similarly, PC2 showed the highest scores for Cr, As, Cd, Cu, and Zn, with relatively high scores for Pb compared to the other scores (Table S2). Ra et al. [25] reported that the enrichment factor (EF) of the metals indicated that metal pollution was mainly driven by the industrial complex, and concentrations of Cr, As, Pb, Cu, and Zn in the sediment exceeded the effects range low (ERL) provided for assessing sediment quality and adverse benthic biota. SH1 and SH2, located near the Shihwa industrial complex, exhibited the highest levels of metal pollution, with the average benthic fluxes for Cr (1.3 ± 0.9 μmol m−2 d−1), As (6.4 ± 4.9 μmol m−2 d−1), Cd (0.2 ± 0.1 μmol m−2 d−1), Pb (0.5 ± 0.4 μmol m−2 d−1), Cu (7.7 ± 1.4 μmol m−2 d−1), and Zn (453 ± 132 μmol m−2 d−1) being the highest (Figure 1, Table 6). The transport of contaminated sediment from upstream to downstream via water circulation effected by tidal plant operations [25,71] may have resulted in the accumulation of heavy metals in the sediment, leading to a lower benthic metal flux at SH1 compared to SH2. Ultimately, the discharge of pollutants from the Shihwa–Banweol industrial complex may lead to the significant accumulation of heavy metals in lake sediment, greatly impacting the benthic fluxes of toxic metals such as Cr, As, Cd, Pb, Cu, and Zn.

4.4. Assessing the Contribution and Risk of Heavy Metal Benthic Fluxes in Shihwa Lake

To assess the significance of heavy metal flux as a source of the overlying water in Shihwa Lake, we applied our in situ measurements of heavy metal benthic fluxes to the inventories of each metal present in the lake. The residence time is estimated at 2 days [49], and the bottom concentration of metal is the average of the initial metal concentrations (t = 0) in the benthic chamber.
The release of heavy metals from sediment may have contributed to the current standing stock of dissolved Mn, Fe, Cr, Co, As, Cd, Pb, Ni, Cu, and Zn in Shihwa Lake, with contributions of 106%, 120%, 6%, 50%, 11%, 4%, 82%, 66%, 11%, and 3%, respectively, being recorded, which were significantly higher than those of the most contaminated harbors in China (Jinzhou Bay, the Bohai Sea [39]). The Cr, Cd, and Zn inputs into the Shihwa Lake water column are currently dominated by fluvial inputs containing industrial sewage, and the benthic flux of Mn, Fe, Co, As, Pb, Ni, and Cu (with contributions greater than 10%) may be a crucial source in the water column. Consequently, the endogenous release of heavy metals may pose a potential and continual risk to Shihwa Lake’s water quality. The benthic fluxes of heavy metals via SWI may significantly contribute to this issue.

5. Conclusions

The SOD in lake sediment was found to be regulated by vertical POC fluxes. The BNF accounted for more than 90% of N and P required for PP in the water column, indicating that it may act as a major source of nutrients in Shihwa Lake. Furthermore, the benthic fluxes of Fe, Mn, Co, and Ni were found to have strong correlations with OC oxidation rates, and these were associated with the reduction of Fe and Mn oxides. On the other hand, the benthic fluxes of Cr, As, Cd, Pb, Cu, and Zn were found to be highly dependent on the discharge of industrial wastewater from the steel-smelting, semiconductor, and machine manufacturing facilities, posing a potential risk to the marine environment and ecosystems. Although water exchange in Shihwa Lake was initiated in 2011 through the water gate of the tidal power plant to improve water quality, the contaminated sediment from industrial activities still releases heavy metals into the water, leading to metal contamination in the lake. The heavy metal-contaminated seawater flows outside of the Shihwa Lake dike through the water gate, posing a potential threat to coastal ecosystems. Therefore, the continuous monitoring of heavy metal fluxes and their sources in the SWI is necessary to prevent further contamination of the water and protect coastal ecosystems.

Supplementary Materials

The following supporting information can be downloaded via this link: https://www.mdpi.com/article/10.3390/jmse11112186/s1, Table S1: Comparison of the analytical results of heavy metals for nearshore Seawater Certified Reference Material (CASS-6; n = 3) from National Institute Standard and Technology of USA with certified value; Table S2: Factors loading for varimax-rotated PCA of benthic fluxes.

Author Contributions

Conceptualization, Y.-H.C., J.S.L. and S.-H.K.; Methodology, J.-W.B. and H.-M.B.; Validation, J.Y.C.; Formal analysis, Y.-H.C. and J.-W.B.; Investigation, Y.-H.C., S.-U.A. and H.-J.Y.; Resources, J.Y.C. and T.H.K.; Data curation, S.-U.A., H.-J.Y. and T.H.K.; Writing—original draft, Y.-H.C., J.S.L. and S.-H.K.; Supervision, K.-T.K.; Project administration, K.-T.K. All authors have read and agreed to the published version of the manuscript.

Funding

This research was funded by the Korea Institute of Ocean Science and Technology (KIOST; PE9996C).

Institutional Review Board Statement

Not applicable.

Informed Consent Statement

Not applicable.

Data Availability Statement

The data presented in this study are available on request from the corresponding author.

Acknowledgments

We thank Suhyun Oh for her assistance with graphic design.

Conflicts of Interest

Hyun-Ju Yoo and Tae Ha Kim are employed by the company Geosystem Research Corporation. The remaining authors declare that the research was conducted in the absence of any commercial or financial relationships that could be construed as a potential conflict of interest.

References

  1. Kim, S.G. The evolution of coastal wetland policy in developed countries and Korea. Ocean. Coast. Manag. 2010, 53, 562–569. [Google Scholar] [CrossRef]
  2. Lee, C.H.; Lee, B.Y.; Chang, W.K.; Hong, S.; Song, S.J.; Park, J.; Kwon, B.O.; Khim, J.S. Environmental and ecological effects of Lake Shihwa reclamation project in South Korea: A review. Ocean Coast. Manag. 2014, 102, 545–558. [Google Scholar] [CrossRef]
  3. Shin, J.-K.; Kim, D.-S.; Cho, K.-J. Dynamics of water environmental factors and phytoplankton before and after inflow of seawater in Shihwa Reservoir. J. Korean Environ. Sci. Soc. 2000, 9, 115–123. [Google Scholar]
  4. An, S.U.; Mok, J.S.; Kim, S.H.; Choi, J.H.; Hyun, J.H. A large artificial dyke greatly alters partitioning of sulfate and iron reduction and resultant phosphorus dynamics in sediments of the Yeongsan River estuary, Yellow Sea. Sci. Total Environ. 2019, 665, 752–761. [Google Scholar] [CrossRef]
  5. Han, M.W.; Park, Y.C. The development of anoxia in the artificial Lake Shihwa, Korea, as a consequence of intertidal reclamation. Mar. Pollut. Bull. 1999, 38, 1194–1199. [Google Scholar] [CrossRef]
  6. Lee, J.; Park, K.T.; Lim, J.H.; Yoon, J.E.; Kim, I.N. Hypoxia in Korean coastal waters: A case study of the natural Jinhae Bay and artificial Shihwa Bay. Front. Mar. Sci. 2018, 5, 70. [Google Scholar] [CrossRef]
  7. Byun, D.; Wang, X.; Holloway, P. Tidal characteristic adjustment due to dyke and seawall construction in the Mokpo Coastal Zone, Korea. Estuar. Coast. Shelf Sci. 2004, 59, 185–196. [Google Scholar] [CrossRef]
  8. Kim, S.H.; Lee, J.S.; Hyun, J.H. Extremely high sulfate reduction, sediment oxygen demand and benthic nutrient flux associated with a large-scale artificial dyke and its implication to benthic-pelagic coupling in the Yeongsan River estuary, Yellow Sea. Mar. Pollut. Bull. 2017, 120, 126–135. [Google Scholar] [CrossRef]
  9. Lee, J.S.; Kim, K.H.; Shim, J.; Han, J.H.; Choi, Y.H.; Khang, B.J. Massive sedimentation of fine sediment with organic matter and enhanced benthic–pelagic coupling by an artificial dyke in semi-enclosed Chonsu Bay, Korea. Mar. Pollut. Bull. 2012, 64, 153–163. [Google Scholar] [CrossRef]
  10. Sweerts, J.P.R.; Bär-Gilissen, M.J.; Cornelese, A.A.; Cappenberg, T.E. Oxygen-consuming processes at the profundal and littoral sediment-water interface of a small meso-eutrophic lake (Lake Vechten, The Netherlands). Limnol. Oceanogr. 1991, 36, 1124–1133. [Google Scholar] [CrossRef]
  11. Jessen, C.; Bednarz, V.N.; Rix, L.; Teichberg, M.; Wild, C. Marine Eutrophication. In Environmental Indicators; Armon, R., Hänninen, O., Eds.; Springer: Dordrecht, The Netherlands, 2015; pp. 177–203. [Google Scholar]
  12. Canfield, D.E.; Kristensen, E.; Thamdrup, B. Aquatic Geomicrobiology; Academic Press: Cambridge, MA, USA, 2005. [Google Scholar]
  13. Kim, S.H.; An, S.U.; Lee, W.C.; Lee, J.S.; Hyun, J.H. Influence of Manila clam aquaculture on rates and partitioning of organic carbon oxidation in sediment of Keunso Bay, Yellow Sea. Aquac. Environ. Interact. 2020, 12, 91–103. [Google Scholar] [CrossRef]
  14. Kim, S.H.; Lee, J.S.; Kim, K.T.; Kim, S.L.; Yu, O.H.; Lim, D.; Kim, S.H. Low benthic mineralization and nutrient fluxes in the continental shelf sediment of the northern East China Sea. J. Sea Res. 2020, 164, 101934. [Google Scholar] [CrossRef]
  15. Alonso-Pérez, F.; Castro, C.G. Benthic oxygen and nutrient fluxes in a coastal upwelling system (Ria de Vigo, NW Iberian Peninsula): Seasonal trends and regulating factors. Mar. Ecol. Prog. Ser. 2014, 511, 17–32. [Google Scholar] [CrossRef]
  16. Lawrence, D.; Dagg, M.J.; Liu, H.; Cummings, S.R.; Ortner, P.B.; Kelble, C. Wind events and benthic-pelagic coupling in a shallow subtropical bay in Florida. Mar. Ecol. Prog. Ser. 2004, 266, 1–13. [Google Scholar] [CrossRef]
  17. Vahtera, E.; Conley, D.J.; Gustafsson, B.G.; Kuosa, H.; Pitkänen, H.; Savchuk, O.P.; Tamminen, T.; Viitasalo, M.; Voss, M.; Wasmund, N. Internal ecosystem feedbacks enhance nitrogen-fixing cyanobacteria blooms and complicate management in the Baltic Sea. J. Hum. Environ. Stud. 2007, 36, 186–194. [Google Scholar] [CrossRef]
  18. Luoma, S.N. Can we determine the biological availability of sediment-bound trace elements? Hydrobiologia 1989, 176, 379–396. [Google Scholar] [CrossRef]
  19. Cundy, A.B.; Croudace, I.W.; Cearreta, A.; Irabien, M.A.J. Reconstructing historical trends in metal input in heavily-disturbed, contaminated estuaries: Studies from Bilbao, Southampton Water and Sicily. Appl. Geochem. 2003, 18, 311–325. [Google Scholar] [CrossRef]
  20. Sigg, L.; Sturm, M.; Kistler, D. Vertical transport of heavy metals by settling particles in Lake Zurich. Limnol. Oceanogr. 1987, 32, 112–130. [Google Scholar] [CrossRef]
  21. Heggie, D.; Kahn, D.; Fischer, K. Trace metals in metalliferous sediments, MANOP Site M: Interfacial pore water profiles. Earth Planet Sci. Lett. 1986, 80, 106–116. [Google Scholar] [CrossRef]
  22. Sundby, B.; Anderson, L.G.; Hall, P.O.; Iverfeldt, Å.; van der Loeff, M.M.R.; Westerlund, S.F. The effect of oxygen on release and uptake of cobalt, manganese, iron and phosphate at the sediment-water interface. Geochim. Cosmochim. Acta 1986, 50, 1281–1288. [Google Scholar] [CrossRef]
  23. Chatterjee, M.; Silva Filho, E.; Sarkar, S.; Sella, S.; Bhattacharya, A.; Satpathy, K.; Prasad, M.; Chakraborty, S.; Bhattacharya, B. Distribution and possible source of trace elements in the sediment cores of a tropical macrotidal estuary and their ecotoxicological significance. Environ. Int. 2007, 33, 346–356. [Google Scholar] [CrossRef]
  24. Sankhla, M.S.; Kumari, M.; Nandan, M.; Kumar, R.; Agrawal, P. Heavy metals contamination in water and their hazardous effect on human health-a review. Int. J. Curr. Microbiol. Appl. Sci. 2016, 5, 759–766. [Google Scholar] [CrossRef]
  25. Ra, K.; Bang, J.H.; Lee, J.M.; Kim, K.T.; Kim, E.S. The extent and historical trend of metal pollution recorded in core sediments from the artificial Lake Shihwa, Korea. Mar. Pollut. Bull. 2011, 62, 1814–1821. [Google Scholar] [CrossRef]
  26. Gyeonggi Green & Agriculture Foundation. Environmental Management Strategies for the Utilization of Hwaseong Lake, Tando Lake, and Nearby Reclaimed Land; Gyeonggi Green & Agriculture Foundation: Seoul, Republic of Korea, 2016. [Google Scholar]
  27. Moon, H.-B.; Choi, M.; Yu, J.; Jung, R.-H.; Choi, H.-G. Contamination and potential sources of polybrominated diphyenyl ethers (PBDEs) in water and sediment from the artificial Lake Shihwa, Korea. Chemospher 2012, 88, 837–843. [Google Scholar] [CrossRef]
  28. Jeong, H.; Choi, J.Y.; Lee, J.; Ra, K. Investigations of Pb and Cu isotopes to trace contamination sources from the artificial Shihwa Lake in Korea. J. Coast. Res. 2020, 95, 1122–1127. [Google Scholar] [CrossRef]
  29. Rostkowski, P.; Yamashita, N.; So, I.M.K.; Taniyasu, S.; Lam, P.K.S.; Falandysz, J.; Lee, K.T.; Taniyasu, S.; Kim, S.K.; Khim, J.S.; et al. Perfluorinated compounds in streams of the Shihwa industrial zone and Lake Shihwa, South Korea. Environ. Toxicol. Chem. 2006, 25, 2374–2380. [Google Scholar] [CrossRef]
  30. Yoo, H.; Yamashita, N.; Taniyasu, S.; Lee, K.T.; Jones, P.D.; Newsted, J.L.; Khim, J.S.; Giesy, J.P. Perfluoroalkyl acids in marine organisms from Lake Shihwa, Korea. Arch. Environ. Contam. Toxicol. 2009, 57, 552–560. [Google Scholar] [CrossRef]
  31. Lee, J.S.; Kim, Y.T.; Shin, K.H.; Hyun, J.H.; Kim, S.Y. Benthic nutrient fluxes at longline sea squirt and oyster aquaculture farms and their role in coastal ecosystems. Aquac. Int. 2011, 19, 931–944. [Google Scholar] [CrossRef]
  32. Lee, J.S.; An, S.U.; Park, Y.-G.; Kim, E.; Kim, D.; Kwon, J.N.; Kang, D.J.; Noh, J.-H. Rates of total oxygen uptake of sediments and benthic nutrient fluxes measured using an in situ autonomous benthic chamber in the sediment of the slope off the southwestern part of Ulleung Basin, East Sea. Ocean Sci. J. 2015, 50, 581–588. [Google Scholar] [CrossRef]
  33. Lee, J.S.; Kim, S.H.; Kim, Y.T.; Hong, S.J.; Han, J.H.; Hyun, J.H.; Shin, K.H. Influence of sea squirt (Halocynthia roretzi) aquaculture on benthic–pelagic coupling in coastal waters: A study of the South Sea in Korea. Estuar. Coast. Shelf Sci. 2012, 99, 10–20. [Google Scholar] [CrossRef]
  34. Hansen, K.; King, G.M.; Kristensen, E. Impact of the soft-shell clam Mya arenaria on sulfate reduction in an intertidal sediment. Aquat. Microb. Ecol. 1996, 10, 181–194. [Google Scholar] [CrossRef]
  35. Parsons, T.R.; Maita, Y.; Lalli, C.M. Determination of Chlorophylls and Total Carotenoids: Spectrophotometric Method, a Manual of Chemical and Biological Methods for Seawater Analysis; Pergamon Press: Oxford, UK, 1984; pp. 101–112. [Google Scholar]
  36. Stookey, L.L. Ferrozine–a new spectrophotometric reagent for iron. Anal. Chem. 1970, 42, 245–252. [Google Scholar] [CrossRef]
  37. Cline, J.D. Spectrophotometric determination of hydrogen sulfide in natural waters 1. Limnol. Oceanogr. 1969, 14, 454–458. [Google Scholar] [CrossRef]
  38. Fossing, H.; Jørgensen, B.B. Measurement of bacterial sulfate reduction in sediments: Evaluation of a single-step chromium reduction method. Biogeochemistry 1989, 8, 205–222. [Google Scholar] [CrossRef]
  39. Li, L.; Zhen, X.; Wang, X.; Ren, Y.; Hu, L.; Bai, Y.; Liu, J.; Shi, X. Benthic trace metal fluxes in a heavily contaminated bay in China: Does the sediment become a source of metals to the water column? Environ. Pollut. 2020, 257, 113494. [Google Scholar] [CrossRef]
  40. Jongman, E.; Jongman, S.R.R. Data Analysis in Community and Landscape Ecology; Cambridge University Press: Cambridge, UK, 1995. [Google Scholar]
  41. Park, S.; Choi, M.; Jang, D.; Joe, D.; Park, K.; Lee, H.; Woo, J.; Kim, T.; Park, J. Spatiotemporal distribution of dissolved heavy metals in Gyeonggi Bay, Korea. Ocean Sci. J. 2020, 55, 69–84. [Google Scholar] [CrossRef]
  42. Glud, R.N. Oxygen dynamics of marine sediments. Mar. Biol. Res. 2008, 4, 243–289. [Google Scholar] [CrossRef]
  43. Jørgensen, B.B.; Wenzhöfer, F.; Egger, M.; Glud, R.N. Sediment oxygen consumption: Role in the global marine carbon cycle. Earth-Sci. Rev. 2022, 228, 103987. [Google Scholar] [CrossRef]
  44. Kim, S.H.; Kim, H.C.; Choi, S.H.; Lee, W.C.; Jung, R.H.; Hyun, J.H.; Kim, S.H.; Lee, J.S. Benthic respiration and nutrient release associated with net cage fish and longline oyster aquaculture in the Geoje-Tongyeong coastal waters in Korea. Estuar. Coast. 2020, 43, 589–601. [Google Scholar] [CrossRef]
  45. Ferrón, S.; Alonso-Pérez, F.; Ortega, T.; Forja, J.M. Benthic respiration on the northeastern shelf of the Gulf of Cádiz (SW Iberian Peninsula). Mar. Ecol. Prog. Ser. 2009, 392, 69–80. [Google Scholar] [CrossRef]
  46. Edberg, N.; Hofsten, B.V. Oxygen uptake of bottom sediments studied in situ and in the laboratory. Water Res. 1973, 7, 1285–1294. [Google Scholar] [CrossRef]
  47. Holmer, M.; Duarte, C.M.; Heilskov, A.; Olesen, B.; Terrados, J. Biogeochemical conditions in sediments enriched by organic matter from net-pen fish farms in the Bolinao area, Philippines. Mar. Pollut. Bull. 2003, 46, 1470–1479. [Google Scholar] [CrossRef]
  48. Mouret, A.; Anschutz, P.; Deflandre, B.; Chaillou, G.; Hyacinthe, C.; Deborde, J.; Etcheber, H.; Jouanneau, J.-M.; Grémare, A.; Lecroart, P. Oxygen and organic carbon fluxes in sediments of the Bay of Biscay. Deep-Sea Res. I Oceanogr. Res. Pap. 2010, 57, 528–540. [Google Scholar] [CrossRef]
  49. Kang, N.S.; Lee, K.H.; Jeong, H.J.; Du Yoo, Y.; Seong, K.A.; Potvin, É.; Hwang, Y.J.; Yoon, E.Y. Red tides in Shiwha Bay, western Korea: A huge dike and tidal power plant established in a semi-enclosed embayment system. Harmful Algae 2013, 30, S114–S130. [Google Scholar] [CrossRef]
  50. Lee, J.S.; Han, J.H.; An, S.U.; Na, K.T.; Kwon, J.N.; Kim, E.S. Sedimentary organic carbon budget of coastal sediments and the importance of benthic-pelagic coupling off Namhae Island in the South Sea of Korea. Ocean Sci. J. 2014, 49, 433–447. [Google Scholar] [CrossRef]
  51. Kim, S.H.; Lee, J.S.; Kim, K.T.; Kim, H.C.; Lee, W.C.; Choi, D.; Choi, S.H.; Choi, J.H.; Lee, H.J.; Shin, J.H. Aquaculture Farming Effect on Benthic Respiration and Nutrient Flux in Semi-Enclosed Coastal Waters of Korea. J. Mar. Sci. Eng. 2021, 9, 554. [Google Scholar] [CrossRef]
  52. Laursen, A.E.; Seitzinger, S.P. The role of denitrification in nitrogen removal and carbon mineralization in Mid-Atlantic Bight sediments. Cont. Shelf Res. 2002, 22, 1397–1416. [Google Scholar] [CrossRef]
  53. Richard, M.; Archambault, P.; Thouzeau, G.; Desrosiers, G. Summer influence of 1 and 2 yr old mussel cultures on benthic fluxes in Grande-Entrée lagoon, Îles-de-la-Madeleine (Québec, Canada). Mar. Ecol. Prog. Ser. 2007, 131–143. [Google Scholar] [CrossRef]
  54. Boynton, W.R.; Kemp, W.M. Nutrient regeneration and oxygen consumption by sediments along an estuarine salinity gradient. Mar. Ecol. Prog. Ser. Oldendorf 1985, 23, 45–55. [Google Scholar] [CrossRef]
  55. Friedrich, J.; Dinkel, C.; Friedl, G.; Pimenov, N.; Wijsman, J.; Gomoiu, M.-T.; Cociasu, A.; Popa, L.; Wehrli, B. Benthic nutrient cycling and diagenetic pathways in the north-western Black Sea. Estuar. Coast. Shelf Sci. 2002, 54, 369–383. [Google Scholar] [CrossRef]
  56. Hopkinson, C.S., Jr.; Giblin, A.E.; Tucker, J. Benthic metabolism and nutrient regeneration on the continental shelf of Eastern Massachusetts, USA. Mar. Ecol. Prog. Ser. 2001, 224, 1–19. [Google Scholar] [CrossRef]
  57. Marinelli, R.L.; Jahnke, R.A.; Craven, D.B.; Nelson, J.R.; Eckman, J.E. Sediment nutrient dynamics on the South Atlantic Bight continental shelf. Limnol. Oceanogr. 1998, 43, 1305–1320. [Google Scholar] [CrossRef]
  58. Pratihary, A.; Naqvi, S.; Narvenkar, G.; Kurian, S.; Naik, H.; Naik, R.; Manjunatha, B. Benthic mineralization and nutrient exchange over the inner continental shelf of western India. Biogeosciences 2014, 11, 2771–2791. [Google Scholar] [CrossRef]
  59. Heo, J. Variation of Primary Productivity and Pigment of Phytoplankton According to Operation of Lake Shihwa Tidal Power Plant; Hanyang University: Seoul, Republic of Korea, 2016. [Google Scholar]
  60. Shin, J.H.; An, S.U.; Choi, J.H.; Lee, H.J.; Woo, S.B.; Hyun, J.H.; Kim, S.H. Rates and Controls of Organic Matter Mineralization and Benthic Nutrient Release in the Coastal Sediment Near Lake Shihwa. Sea J. Korean Soc. Oceanogr. 2021, 26, 110–123. [Google Scholar]
  61. MOTIE (Ministry of Trade, Industry and Energy). 2023. Available online: http://www.motie.go.kr/www/main.do (accessed on 1 March 2023).
  62. Ra, K.; Kim, E.S.; Kim, J.K.; Kim, K.T.; Lee, J.M.; Kim, E.Y. Distribution and Pollution Assessment of Trace Metals in Core Sediments from the Artificial Lake Shihwa, Korea. Ocean Polar Res. 2013, 35, 69–83. [Google Scholar] [CrossRef]
  63. Shine, J.P.; Ika, R.; Ford, T.E. Relationship between oxygen consumption and sediment-water fluxes of heavy metals in coastal marine sediments. Environ. Toxicol. Chem. 1998, 17, 2325–2337. [Google Scholar]
  64. Turetta, C.; Capodaglio, G.; Cairns, W.; Rabar, S.; Cescon, P. Benthic fluxes of trace metals in the lagoon of Venice. Microchem. J. 2005, 79, 149–158. [Google Scholar] [CrossRef]
  65. Emili, A.; Acquavita, A.; Covelli, S.; Spada, L.; Di Leo, A.; Giandomenico, S.; Cardellicchio, N. Mobility of heavy metals from polluted sediments of a semi-enclosed basin: In situ benthic chamber experiments in Taranto’s Mar Piccolo (Ionian Sea, Southern Italy). Environ. Sci. Pollut. Res. 2016, 23, 12582–12595. [Google Scholar] [CrossRef]
  66. Warnken, K.W.; Gill, G.A.; Griffin, L.L.; Santschi, P.H. Sediment-water exchange of Mn, Fe, Ni and Zn in Galveston Bay, Texas. Mar. Chem. 2001, 73, 215–231. [Google Scholar] [CrossRef]
  67. Hellali, M.A.; Zaaboub, N.; Oueslati, W.; Added, A.; Aleya, L. Diagenetic processes and sediment–water exchanges of heavy metals in the Mejerda River Delta (Gulf of Tunis). Environ. Earth Sci. 2015, 74, 6665–6679. [Google Scholar] [CrossRef]
  68. Audry, S.; Blanc, G.; Schäfer, J.; Chaillou, G.; Robert, S. Early diagenesis of trace metals (Cd, Cu, Co, Ni, U, Mo, and V) in the freshwater reaches of a macrotidal estuary. Geochim. Cosmochim. Acta 2006, 70, 2264–2282. [Google Scholar] [CrossRef]
  69. Tribovillard, N.; Algeo, T.J.; Lyons, T.; Riboulleau, A. Trace metals as paleoredox and paleoproductivity proxies: An update. Chem. Geol. 2006, 232, 12–32. [Google Scholar] [CrossRef]
  70. Shaw, T.J.; Gieskes, J.M.; Jahnke, R.A. Early diagenesis in differing depositional environments: The response of transition metals in pore water. Geochim. Cosmochim. Acta 1990, 54, 1233–1246. [Google Scholar] [CrossRef]
  71. Lee, J.H.; Jeong, H.R.; Choi, J.Y.; Ra, K. The spatial and Vertical Variations of Metal Pollution in Sediments after Tidal Power Plant Operation in Shihwa Lake. Sea J. Korean Soc. Oceanogr. 2019, 24, 535–547. [Google Scholar]
Figure 1. Sampling stations at Shihwa Lake.
Jmse 11 02186 g001
Figure 2. Vertical profiles of (a) nutrients (NH4+, NO3, PO43−, Si(OH)4) and Fe2+ in the porewater, as well as (b) total reduced sulfur (TRS) in the sediment.
Jmse 11 02186 g002
Figure 3. Evolution of dissolved oxygen (DO) concentration with time in the benthic chamber on the inside of Shihwa Lake.
Jmse 11 02186 g003
Figure 4. Time courses for the concentrations of the nutrients (NH4+, NO3, PO43−, Si(OH)4) in the benthic chamber. The solid lines show the results of linear regressions.
Jmse 11 02186 g004
Figure 5. Time courses for the concentrations of dissolved heavy metals (Mn, Fe, Cr, Co, As, Cd, Pb, Ni, Cu, and Zn) in the benthic chamber. The solid lines show the simple linear regression results.
Jmse 11 02186 g005
Figure 6. Principal component analysis (PCA) of benthic flux (oxygen, nutrients, and heavy metals). The red circle is related to PC1, and the blue circle is related to PC2.
Jmse 11 02186 g006
Table 1. Latitude and longitude.
StationLatitudeLongitude
SH137°17.961′ N126°43.901′ E
SH237°18.656′ N126°40.984′ E
SH337°18.319′ N126°38.588′ E
SH437°17.643′ N126°36.044′ E
GB37°19.165′ N126°33.406′ E
Table 2. Environmental parameters of the surface (S) and bottom (B) water.
StationDepthTemperatureSalinityDOChl-aNH4+NO3PO43−Si(OH)4
(m)(°C) (%)(μg L−1)(μmol L−1)
SH14.4S21.230.67974.0
(±1.0)
18.1
(±0.2)
6.7
(±0.1)
1.80
(±0.02)
41.9
(±0.0)
B19.931.16946.6
(±0.7)
2.0
(±0.1)
1.4
(±0.1)
0.76
(±0.00)
35.8
(±0.1)
SH26.1S20.331.201136.2
(±0.0)
0.6
(±0.1)
0.3
(±0.1)
0.28
(±0.00)
27.3
(±0.7)
B17.931.28797.9
(±0.2)
1.1
(±0.0)
0.7
(±0.0)
0.44
(±0.07)
28.8
(±3.7)
SH37.9S17.731.281055.9
(±0.2)
2.9
(±0.4)
2.8
(±0.5)
0.30
(±0.03)
6.1
(±0.5)
B17.031.26982.7
(±0.0)
4.0
(±0.5)
3.7
(±0.6)
0.30
(±0.01)
7.7
(±0.3)
SH46.0S17.731.231037.4
(±0.3)
1.8
(±0.5)
1.9
(±0.4)
0.16
(±0.02)
10.4
(±1.2)
B17.031.24975.0
(±0.6)
4.0
(±0.4)
2.6
(±0.4)
0.37
(±0.08)
8.3
(±2.0)
GB7.1S18.131.1713515.3
(±0.9)
0.6
(±0.1)
0.2
(±0.0)
BDL a3.3
(±0.0)
B16.731.271093.8
(±0.4)
2.0
(±0.0)
1.7
(±0.0)
0.10
(±0.00)
4.1
(±0.0)
Values represent averages ± 1 SD (n = 3). a BDL indicates below the detection limit.
Table 3. Vertical particle flux of total mass (TM), particulate organic carbon (POC), total nitrogen (TN), and stable carbon isotope composition of particulate matter collected via the sediment trap.
StationTM Fluxδ13CPOCTNPOC FluxTN FluxC/N Ratio
(g m−2 d−1)(‰)(%, dry wt.)(mmol m−2 d−1)
SH1100 (±10)−24.5 (±0.8)1.05 (±0.07)0.118 (±0.019)87 (±9)8.4 (±0.8)10.4
SH2130 (±12)−24.2 (±0.1)1.00 (±0.04)0.117 (±0.005)109 (±10)10.9 (±1.0)10.0
SH3117 (±4)−23.4 (±0.1)1.04 (±0.04)0.108 (±0.005)101 (±4)9.0 (±0.3)11.2
SH4142 (±10)−23.3 (±0.3)1.33 (±0.17)0.122 (±0.009)157 (±11)12.4 (±0.9)12.7
Values represent averages ± 1 SD (n = 3).
Table 4. Depth-integrated (0–10 cm) inventories of porewater and solid-phase inventories.
StationPorewaterSolid Phase
(mmol m−2)(mol m−2)
NH4+NO3PO43−Si(OH)4Fe2+TRS
SH136.380.1061.7214.2515.452.54
SH223.950.1083.0023.516.622.67
SH312.190.1170.6413.459.502.56
SH417.900.0780.4610.988.191.43
GB17.070.0840.1714.5412.701.19
Table 5. Sediment oxygen demand (SOD) and benthic nutrient flux (BNF) at the sediment–water interface (SWI).
StationSODBNF
(mmol m−2 d−1)
O2NH4+NO3PO43−Si(OH)4
SH130.6 (±0.0)7.36 (±2.69)−1.99 (±0.45)0.51 (±0.02)3.56 (±0.36)
SH242.8 (±0.1)12.50 (±3.72)1.31 (±0.17)1.11 (±0.17)12.68 (±1.92)
SH342.9 (±0.1)12.15 (±1.94)0.66 (±0.08)0.19 (±0.02)8.17 (±0.39)
SH483.3 (±0.2)11.21 (±0.80)−0.32 (±0.20)0.52 (±0.04)24.59 (±1.65)
GB-7.59 (±1.18)1.11 (±0.28)1.18 (±0.12)29.00 (±3.71)
Error denotes the uncertainty of each individual flux, estimated as the error of the slope of the concentrations versus time data; “-” denotes no data.
Table 6. The benthic fluxes of dissolved heavy metals (Mn, Fe, Cr, Co, As, Cd, Pb, Ni, Cu, and Zn).
StationMnFeCrCoAsCdPbNiCuZn
μmol m−2 d−1
SH1573
(±139)
10
(±4)
0.72
(±0.18)
0.9
(±0.1)
3.0
(±2.0)
0.09
(±0.05)
0.24
(±0.15)
40
(±3)
6.7
(±2.7)
546
(±212)
SH23028
(±195)
28
(±9)
1.93
(±0.76)
2.9
(±0.2)
9.9
(±2.4)
0.23
(±0.07)
0.74
(±0.12)
38
(±3)
8.7
(±1.7)
359
(±101)
SH32060
(±169)
50
(±23)
−0.54
(±0.35)
1.7
(±0.7)
2.2
(±2.4)
−0.08
(±0.03)
0.53
(±0.25)
27
(±4)
−4.6
(±2.4)
−404
(±86)
SH45488
(±242)
136
(±8)
−0.41
(±0.28)
4.8
(±0.3)
3.7
(±0.6)
−0.08
(±0.04)
0.35
(±0.09)
51
(±7)
3.7
(±1.9)
−346
(±156)
GB2473
(±95)
96
(±13)
−0.43
(±0.15)
1.8
(±0.2)
2.9
(±0.8)
−0.01
(±0.02)
0.17
(±0.04)
9
(±2)
0.4
(±0.0)
−151
(±92)
Error denotes the uncertainty of each individual flux, estimated as the error of the slope of the concentrations versus time data.
Table 7. Comparison between sediment oxygen demand (SOD) and associated environmental parameters measured in various environments.
LocationEnvironmental
Description
Water DepthTempSalinitySODReference
(m)(°C)(psu)(mmol m−2 d−1)
Shihwa Lake,
South Korea
Enclosed saline lake4.4–7.1
(6.3 ± 1.3)
16.6–19.9
(14.7 ± 7.3)
31.2–31.330.6–83.3
(49.9 ± 23.0)
This study
Chonsu Bay,
South Korea
Enclosed bay12–1720–2131.5–31.725.6–50.4
(37.5 ± 12.4)
[9]
Namhae and Geoje Islands,
South Korea
Coastal
continental shelf
24–2819.8–20.533.7–34.534.9–54.1
(46.3 ± 10.1)
[50]
Geoje-Tongyoung coastal,
South Korea
Oyster farm1115.3–18.8-60–84
(73 ± 12)
[51]
Finfish farm1915.9–19.1-77–157
(117 ± 40)
Gulf of Cadiz,
Iberian Peninsula
Near-shore
continental shelf
8–3412–2435.3–36.79–27
(18 ± 5)
[45]
Northern East China Sea
(ECS)
Continental shelf83–9313.4–14.132.0–33.92.7 and 8.4
(5.6 ± 4.1)
[14]
“-” denotes no data.
Table 8. Benthic nutrient flux (BNF) and contribution of BNF to primary production (PP) in Shihwa Lake.
StationBenthic Nutrient Flux
(mmol m−2 d−1)
Contribution of BNF to PP
(%)
DINDIPDINDIP
SH15.37 (±3.14)0.51 (±0.02)5685
SH213.82 (±3.90)1.11 (±0.17)144184
SH312.82 (±2.02)0.19 (±0.02)13332
SH410.90 (±0.99)0.52 (±0.04)11386
GB8.70 (±1.46)1.18 (±0.12)3575
Table 9. Comparison of heavy metal benthic fluxes (μmol m2 d1) measured in this study with in situ fluxes sourced from other locations.
LocationShihwa Lake,
South Korea
New Bedford
Harbor, USA
Lagoon of
Venice, Italy
Mar Piccolo,
Italy
Galveston Bay,
USA
Mejerda River Delta, Tunisia
Mn573–5488
(2724 ± 1794)
-2.9–4.6
(3.7 ± 1.2)
4.7–5.0
(4.9 ± 0.2)
450–2320
(1207 ± 792)
86–190
(130 ± 35)
Fe10–136
(64 ± 51)
-−1.5–0.8
(−1.2 ± −1.5)
3.9–8.7
(6.3 ± 3.4)
6.3–34
(18 ± 12)
-
Cr−0.54–1.93
(0.3 ± 1.1)
--−1.2–0.6
(−1.0 ± 0.4)
--
Co0.9–4.8
(2.4 ± 1.5)
0.001–0.045
(0.02 ± 0.02)
---−0.38–1.92
(0.67 ± 0.79)
As2.2–9.9
(4.3 ± 3.2)
-−0.04–0.06
(0.01 ± 0.07)
−0.15–0.83
(0.34 ± 0.69)
--
Cd−0.08–0.23
(0.03 ± 1.13)
0.01–0.29
(0.12 ± 0.11)
0.04–0.05
(0.05 ± 0.01)
−0.04–0.00
(−0.02 ± 0.03)
-−0.38–0.38
(−0.05 ± 0.32)
Pb0.1–0.74
(0.41 ± 0.23)
−0.04–0.14
(0.03 ± 0.06)
-0.12–0.27
(0.19 ± 0.11)
-0.2–0.5
(0.41 ± 0.11)
Ni9–51
(33 ± 16)
0.04–1.10
(0.5 ± 0.4)
-0.32–0.37
(0.35 ± 0.04)
0.9–2.7
(1.6 ± 0.6)
-
Cu−4.6–8.7
(3.0 ± 5.3)
1.3–11.0
(4.8 ± 3.1)
0.07–0.12
(0.09 ± 0.04)
−0.9–7.0
(3.1 ± 5.6)
-0.1–0.4
(0.22 ± 0.09)
Zn−404–546
(1 ± 428)
4–51
(20 ± 15)
15–16
(15 ± 1)
−0.4–6.9
(3.3 ± 5.2)
1.8–3.3
(2.3 ± 0.5)
27–270
(135 ± 86)
ReferenceThis study[63][64][65][66][67]
“-” denotes no data.
Disclaimer/Publisher’s Note: The statements, opinions and data contained in all publications are solely those of the individual author(s) and contributor(s) and not of MDPI and/or the editor(s). MDPI and/or the editor(s) disclaim responsibility for any injury to people or property resulting from any ideas, methods, instructions or products referred to in the content.

