Article

A Preliminary Snapshot Investigation of the Marine Soundscape for Malta: A Steppingstone towards Achieving ‘Good Ecological Status’

1
Institute of Earth Systems, University of Malta, MSD 2080 Msida, Malta
2
Department of Geosciences, University of Malta, MSD 2080 Msida, Malta
3
Istituto Nazionale di Fisica Nucleare-Laboratori Nazionali del Sud, Via S. Sofia 62, 95123 Catania, Italy
*
Author to whom correspondence should be addressed.
J. Mar. Sci. Eng. 2023, 11(11), 2163; https://doi.org/10.3390/jmse11112163
Submission received: 20 September 2023 / Revised: 29 October 2023 / Accepted: 9 November 2023 / Published: 13 November 2023
(This article belongs to the Topic Marine Ecology, Environmental Stress and Management)

Abstract

:
The ever-accelerating rate of research focusing on the issue of underwater noise pollution, particularly concerning low-frequency, continuous noise, has steadily been unveiling the myriad of detrimental ecological implications caused to marine life. Despite this, many European Member States, such as Malta, still lack solid monitoring and regulatory frameworks aimed at characterising and improving the state of the marine acoustic environment and achieving ‘Good Ecological Status’ in accordance with the Marine Strategy Framework Directive. This shortcoming is directly reflected in the complete absence of baseline information covering the quality of the national soundscape. This paper aims to serve as a preliminary investigation into continuous underwater noise generation within Maltese waters, focusing on two sites characterised by heavy marine activity: Ċirkewwa and the Grand Harbour. Digital signal processing software packages (dBWav version 1.3.4) were used to extract and analyse sound pressure levels from in situ recorded audio files. Further statistical analysis was also carried out so as to evaluate the resultant snapshot of the baseline marine soundscapes at both sites. Furthermore, AIS data were used to tentatively identify the identifiable sources of underwater noise pollution. Given the current information lacuna revolving around the issue of underwater noise pollution in Malta, this paper may serve as a pilot study, with the aim of bridging this knowledge gap and forming the basis of future national research for Maltese marine conservation.

1. Introduction

The imminent biodiversity crisis related to the detrimental implications of underwater noise pollution (UNP) is fostering a growing field of marine bioacoustics investigations [1,2,3]. Extensive research has proven that the overlapping marine frequency bands occupied by human activity are masking those used by marine animals and subsequently pose a host of deleterious physiological and behavioural impacts on marine life [4,5]. Thus, the warranted increase in international scientific attention has consequently encouraged several initiatives at local, regional, and global scales in order to achieve sustainable targets and mitigate the effects of UNP on marine life [6]. In the European context, the EU’s Marine Strategy Framework Directive 2008/56/EC (MSFD) is the key regulatory instrument that legally binds Member States (MS) in promoting and achieving ‘Good Ecological Status’ (GES) of European waters [7]. According to Article 2b of this Directive, MS were required to produce a Program of Measures (PoM) by 2015, which, amongst other things, aims to address and mitigate the harmful impact of UNP and enhance the state of the marine environment by 2020.
Low frequencies emitted by ships, ranging between 10 Hz and 150 Hz, have been identified as those most disruptive to fish and marine mammals [8]. However, Descriptor 11.2 in the 2017 Commission Decision (2017/848/EU), hereunder referred to as the Decision, has anointed the yearly average sound pressure levels (SPLs) of the two one-third-octave bands (TOBs) of 63 Hz and 125 Hz as the prime indicative criteria for achieving GES [9]. In doing so, the Decision’s standard for GES completely omits the influence of frequencies beyond this narrow range. Meanwhile, the EU Technical Subgroup on underwater noise (TSG) proposed that the frequency range should be expanded to include the monitoring of broadband sounds up to 20 kHz and 50 kHz [10,11]. This is due to three main reasons. Firstly, low-frequency emissions, such as those earmarked by the Decision, are easily absorbed in the shallow waters of some European seas, including the western Mediterranean Sea and the Baltic Sea. This consequently raises challenges in appropriately characterising and mapping out shipping noise in European waters [12]. Secondly, many researchers claim that the high presence of recreational vessels, such as sailboats, in European coastal waters is a dominant threat to the integrity of the marine soundscape as these vessels emit sound at higher frequencies than commercial ships. Therefore, experts have recommended taking into account a wider range of frequencies when generating regulatory frameworks [11]. Thirdly, ships emit noise from different sources (e.g., propeller singing, on-board machinery and the effect of the ship’s hull), each having their own frequencies, resulting in a complex noise field surrounding the vessel [13].
Numerous other factors come into play when considering the behaviour of sound waves and their propagation in marine environments; these are mainly due to the different physical conditions present, such as the geophysical nature of the bathymetry, salinity and temperature that influence sound propagation [14]. Therefore, it is imperative that, when such studies are conducted, these factors are accounted for and appropriate attenuation measures are taken to obtain accurate data.
With the global shipping fleet projected to increase in the immediate future [15], the state of the global marine soundscape is expected to become noisier, regressing in quality and thus resulting in more acute ecological impacts [4]. The recent advancements in technology and ship hull design suggest potential in combating this issue. However, doing so would require enforcement from policymakers in order to culminate into positive change [16]. As it currently stands, no satisfactory concerted efforts have been made in regulating and monitoring UNP, and albeit the existence of international guidelines and conventions targeting marine conservation, the persistent lack of standard definitions and criteria revolving the notion of GES continues to hinder progress in this regard [16].
Limited official information is available on what thresholds and measures have been set by EU MS to improve the state of the European marine soundscape. This follows the substantial gaps in data and in the understanding of the current ecological state of our seas that precede the establishment and implementation of an adequate regulatory framework [17]. Moreover, despite the MSFD being one of the main regulatory decrees aimed at reducing UNP, the criteria for attaining GES are yet to be defined, particularly with regards to the lack of quantitative limits that must be set [2]. These criteria must then also be agreeable and attainable on a transnational basis, particularly for MS sharing a marine environment. For instance, despite the numerous efforts being made by EU and non-EU Mediterranean countries, the lack of harmonization between states means that tangible progress is yet to be made [18]. Further to this, defining limit values for continuous low frequencies emitted through shipping activity proves to be somewhat impossible due to the extent of ship typology variability [13], and thus, laws that limit underwater noise remain virtually non-existent in Europe.
In a bid to further safeguard marine fauna, around 12% of all EU terrestrial waters have been anointed as Natura 2000 sites [19]. However, these have been described as being mere ‘paper parks’, with no stringent conservation measures in place [19,20]. With particular reference to the Mediterranean Sea and its mere ~6% designated Marine Protected Areas (MPAs) [21], the level of protection through existing management measures against UNP remains debatable. In fact, an assessment conducted in 2020 [22] revealed that few measures were taken to minimise UNP in the Capo Caccia-Isola Piana MPA in Italy, despite its formal protection and regulation.
The strategic location of the Mediterranean Sea warrants its fundamental role in bridging Eastern and Western civilisations through tourism and trade, hence permitting this Sea to hold great economic importance [23,24]. According to the United Nations Conference on Trade and Development’s (UNCTAD) 2021 Review of Maritime Transport [25], the Mediterranean maritime trading activity proved resilient against the COVID-19 pandemic. The growing scale and importance of maritime industries, especially in a time during which they were heavily relied upon, has brought with it drastic environmental repercussions which have manifested in the inadequate ecological status of the Mediterranean marine soundscape [19,26].
The fulfilment of the objectives set out by the Directive to achieve GES within the Mediterranean region remains obstructed to this day due to existing incongruent national policies and inadequate management practices within the basin preventing transboundary collaboration [6,19]. In addition to this, cooperation from each Mediterranean country is reflected in its economic reliance on the sea [27]. In order to reach this target, the EU Directorate-General for Maritime Affairs and Fisheries (DG MARE) shall provide the necessary support for relatively less developed southern Mediterranean countries to improve their current situation [27]. Meanwhile, the concept of collaborative efforts aimed at tackling marine conservation across large, shared seas has received significant endorsement from different political entities, and thus further elucidates the will of transboundary governments to manage marine systems as a joint commitment [28]. The first long-term monitoring of UNP in the Mediterranean Sea was carried out over the course of three years in the Port of Cartagena in Spain [29], in which the conductors of the study further supported the need to broaden the frequency bandwidths to increase and enhance the representation of the marine soundscape, as mentioned above. Furthermore, only four of the eight Mediterranean MS have complied with the 2015 revision deadlines and updated environmental targets as stipulated by Articles 17 and 10, respectively, of the Directive [7], with Malta publishing their PoM in 2017 and exclude any measures to be taken to mitigate continuous, low frequency UNP due to insufficient data [30]. Moreover, the quantitative parameters required for achieving GES still need to be defined and the lax attitude towards the PoM implementation must be rectified [2,31]. This has consequently contributed to the inability to meet the MSFD’s target of achieving good environmental status (GES) by 2020.
Located in the middle of the Mediterranean Sea (Figure 1 and Figure 2), the Maltese Islands reap the economic gains brought by marine activity [30]. Moreover, the indentations along the Maltese coastline serve as natural harbours and further attract the mooring of seafaring vessels in national coastal waters. Despite the 2019 pandemic, data compilations from the 2021 Maltese National Statistics Office show that marine activity was not as severely impacted in Malta, with the largest impact on marine activity being the suspension of cruise liner berthings between March and August 2020 in the Grand Harbour [32]. Meanwhile, the activity of the Gozo ferry at Ċirkewwa—which connects the mainland of Malta to its sister island, Gozo via the Gozo Channel—astoundingly increased by 5.1% during that same year, with passenger traffic between the two islands being busiest over the weekends [32]. As of yet, no monitoring efforts have been made across Maltese coastal waters with regards to the regulation of continuous, low-frequency UNP, despite the high rate of marine traffic recorded (Figure 1).
The Maltese national Environment and Resource Authority (ERA) had assigned up to 4138 km2 of Maltese coastal waters as special protected areas (SPAs) and special areas of conservation (SACs) [33] (Figure 3), with the Gozo Channel falling under zone MT0000112 and marginally under zone MT0000105. The latter zone, extending from Il-Ponta ta’ San Dimitri in Gozo and Il-Qaliet in Malta, has also included the loggerhead turtle (Caretta caretta) as a species present within the area [34], and which falls under Annexes II and IV of the Habitats Directive [35].
Although the effects of UNP on loggerhead turtles are not well-understood due to limited studies being conducted, research shows that this species is still sensitive to low frequency vibrations [37]. Furthermore, this lack of certainty on the effect of UNP on this species serves as a valid basis for the implementation of the precautionary principle. Despite this, no monitoring regulations have been implemented for monitoring UNP in the area as a result of insufficient data being available [38]. The map presented in Figure 4 and obtained from the official MarineTraffic website [39] may serve as an adequate starting point for the establishment of monitoring stations, especially as MarineTraffic provides real-time information of marine activity through the automatic identification system (AIS). AIS data must be broadcast by all commercial vessels with a gross tonnage of at least 300 tons and thus includes all vessels emitting low frequencies into the marine environment [40].
The issue of UNP in Maltese waters is severely understudied and has therefore inspired this research. Ċirkewwa and the Grand Harbour are two Maltese coastal areas that are characterised with intense volumes of marine traffic, thus alluding to noisy marine soundscapes. Feasibility constraints did not allow for a comparative analysis between the two soundscapes, however, the novel data and results obtained from this research aspires to serve as a steppingstone for future research by shedding light and providing first-ever recorded data on the current state of the Maltese marine soundscape. This pilot study on UNP around the Maltese Islands further aims to lay the foundations for future works that may aspire to address and establish the necessary regulatory framework for achieving GES in Maltese waters.

2. Materials and Methods

2.1. Data Collection

For the purpose of this study, the SoundTrap ST300 hydrophone (Figure 5), by Ocean Instruments, New Zealand, was used for Passive Acoustic Monitoring (PAM), and audio data was collected at a resolution of 96,000 samples per second. This model has a very low self-noise with less than 23 dB re 1 µPa above 2 kHz. It has a 16-bit successive approximation register (SAR). Such an instrument was used as it is compact and self-contained and has gained good reputation as it has been used in other works to monitor underwater noise. See [41,42,43].
The sites of data collection were the Grand Harbour (35°54′20.0″ N and 14°31′23.9″ E) and Ċirkewwa (35°59′23.78″ N and 14°19′38.86″ E), located along the eastern and northern coastline of the islands of Malta, respectively, shown in Figure 2 and Figure 6. These sites were selected for this research on the basis of the extent of marine traffic characteristic of these sites. Due to time and feasibility constraints, it was not possible to include data from a quieter bay to serve as a control site. Data collection occurred well before the initiation of this research, with audio data recorded in July 2020 and November 2021 in the Grand Harbour and in June 2022 in Ċirkewwa.
Only one hydrophone was available to carry out this research, and therefore, data collection could not be carried out at both sites in parallel. Moreover, due to the different geophysical characteristics (e.g., in depth and bathymetry) and the depth of the ships’ hulls in these areas, the hydrophone was deployed on the seafloor at a depth of 11 m in Ċirkewwa, whilst the deeper bathymetry of the Grand Harbour allowed for the hydrophone to be deployed at a depth of 35 m. The locations and depths selected for the hydrophone deployment, as shown in Figure 2 and Figure 6, were selected since these are popular with the SCUBA diving and shipping industries, respectively. Moreover, given the large vessel sizes of the of cruise liners, which are the predominant vessel-type in the harbour, the installation of the instrument at 35 m allowed for the best compromise between maintaining a relatively shallow depth similar to the deployment of the hydrophone in Ċirkewwa whilst also preventing damage from large vessels. Due to the different circumstances under which audio data was collected, it is crucial to note that this is not a comparative study between the two sampled sites, but rather a preliminary study aspiring to be considered as ‘groundwork’ that provides novel baseline information on the quality of the Maltese soundscape within these two locations.
Audio data at Ċirkewwa was recorded continuously from the 6th to the 17th of June 2022, whilst at the Grand Harbour, data was collected at 5-min intervals every 15 min between the 1st and 14th of July 2020 and then again between the 22nd and 29th November 2021. With regards to the latter site, data collection occurred twice, in order to observe any seasonal variations in the soundscape. The datasets corresponding to the July 2020 Grand Harbour and November 2021 Grand Harbour will hereunder be referred to as GHS (Grand Harbour Summer) and GHW (Grand Harbour Winter). Attention must be given to the fact that the July 2020 GHS data is not an accurate representation of the marine soundscape in this Harbour as data collection occurred during the onset of COVID-19 national marine travel restrictions.
The collected audio data was stored by the instrument in wave file format (.wav) and a filename convention which included the instrument serial number followed by the date and time of sampling was used. These files were then analysed using the dBWav software (Version 1.3.4) from Marshall Day Acoustics [44], which is a novel, user-friendly screening and visualisation tool that significantly reduces costs and complications when handling large audio data files and facilitates Fast Fourier Transform (FFT) analysis of selected timeframes (Figure 7).

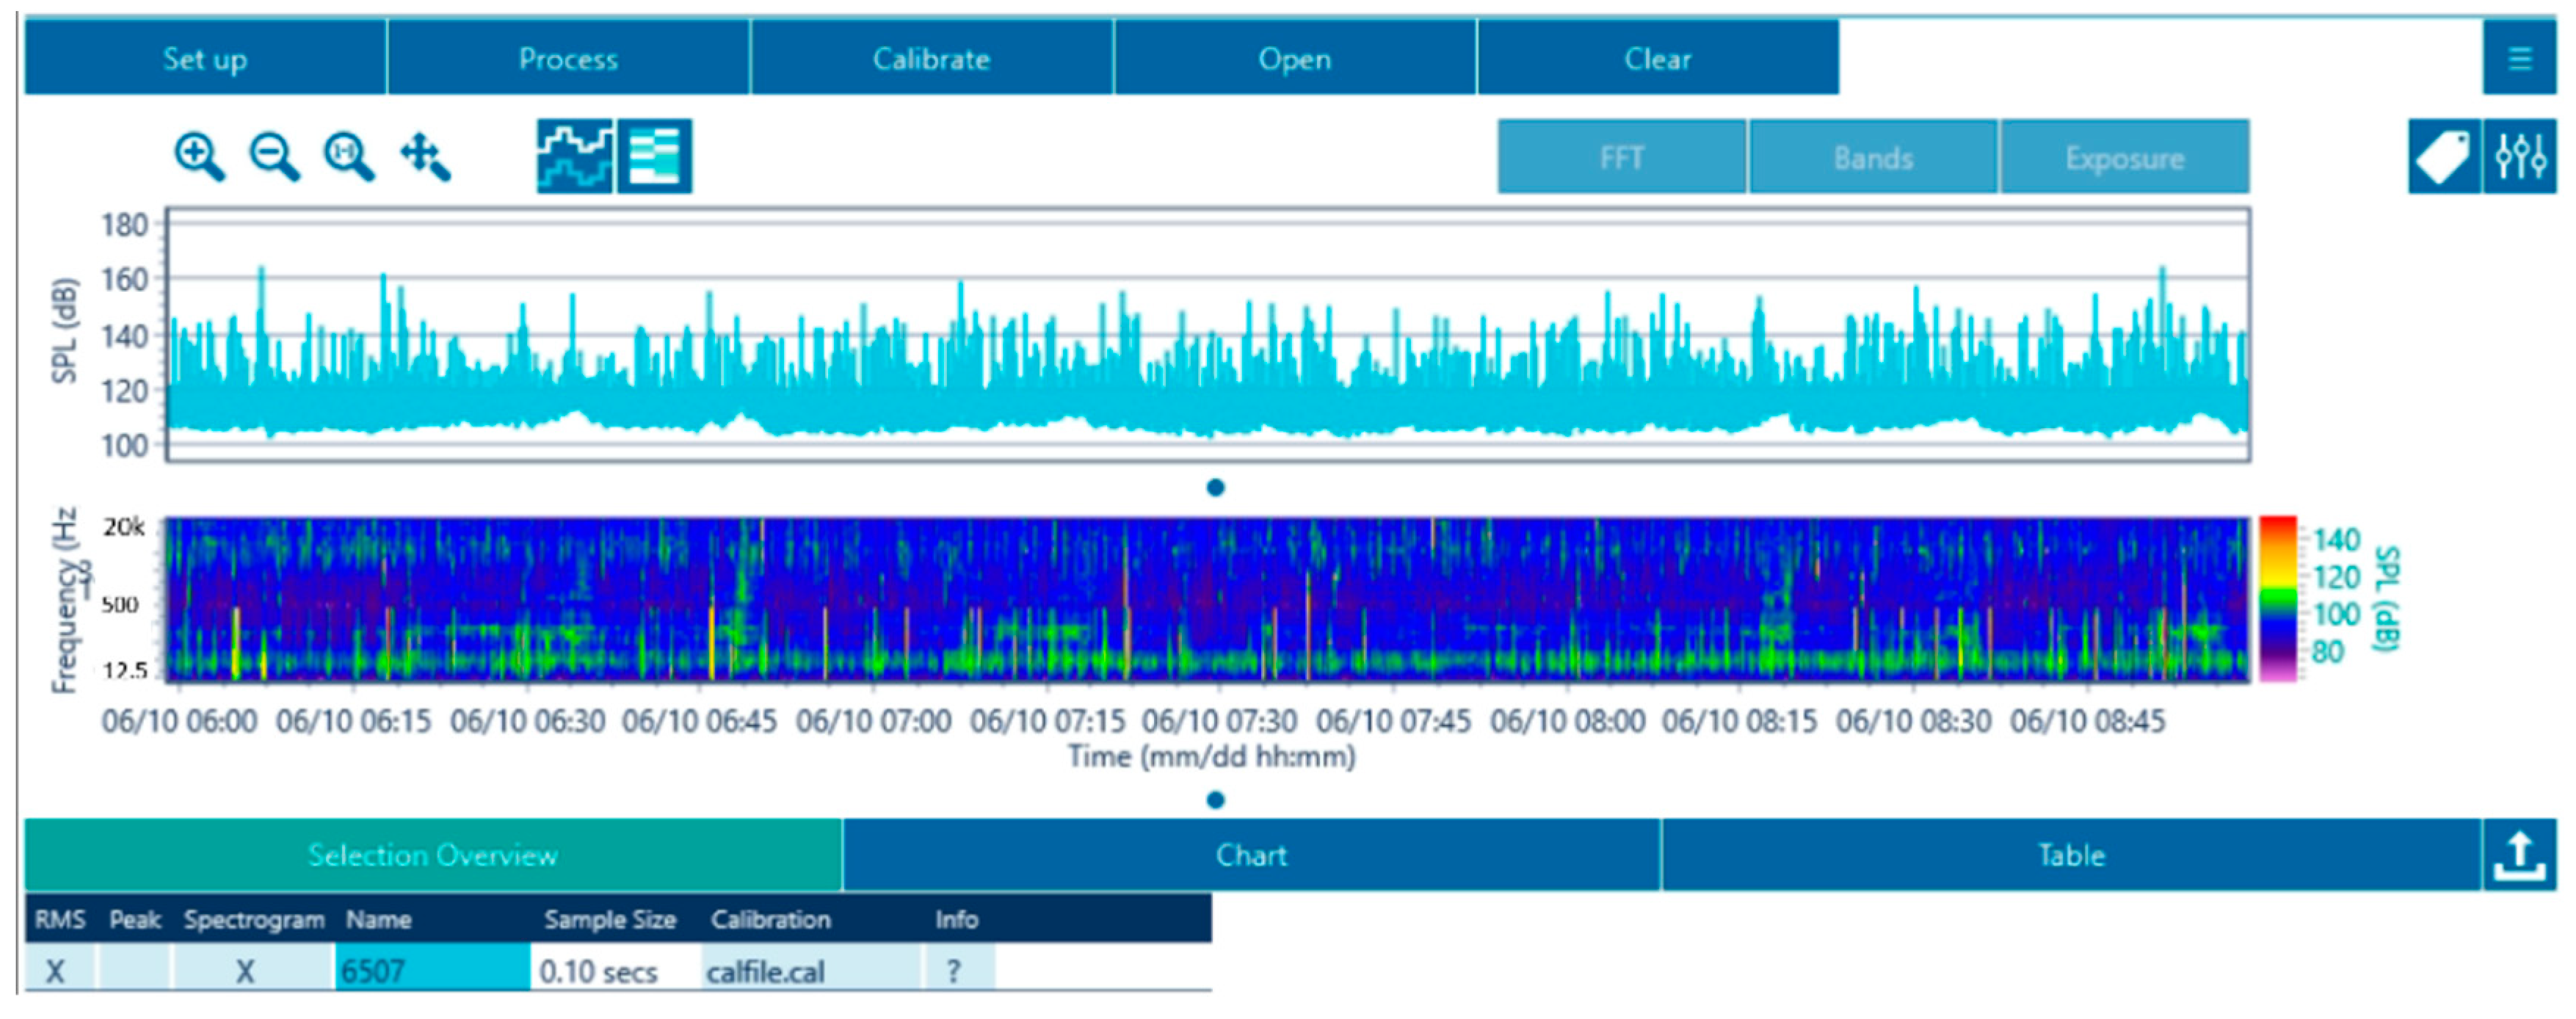
2.2. Data Extraction, Visualisation and Processing

Following data collection, the wave files were uploaded onto a computer and data selection took place. In order to capture the range of vessel activity levels throughout the day for the two weeks over which data collection occurred, ten-minute-long windows of data were selected at multiple points throughout the day for every day of audio data collected. These were 00:00–00:10, 06:00–06:10, 09:00–09:00, 12:00–12:10, 15:00–15:10, 18:00–18:10, 21:00–21:10. The 10-min-long windows of data allowed to maintain a balance between the processing time required by the software in computing the audio file for all of the wave files that were to be observed. Therefore, the resultant dataset comprised of daily snippets of SPL measurements over the span of two weeks.
The selected wave files were then uploaded to the dBWav software and calibrated, based on the coefficients obtained from the supplier of the instrument. To ensure the robustness of the datasets obtained, no data cleaning and filtering were carried out on dBWav to ensure that all underwater frequencies present could be observed. The power spectral density plots were computed with a window length of 4096 samples and with a window overlap of 50%. A Blackman-Harris filter was applied.
The root mean squares (RMS) of the SPLs for the TOBs of 63 Hz and 125 Hz as well as their 95th percentiles were extracted using the dBWav software and inputted into IBM SPSS Statistics version 28 to evaluate their prevalence and intensity within the marine soundscapes, in accordance with the 2017 EU Commission Decision [9]. Besides observing these two frequencies, this research also expanded its observations to include the assessment of frequencies 12.5 Hz and 2000 Hz in view of their ecological relevance, as well as to account for the reflection, absorbance, and loss of lower ranging frequencies (<100 Hz) within shallow waters. Higher frequencies may also provide a more precise soundscape as a lot of watercraft emit higher-ranging frequencies.

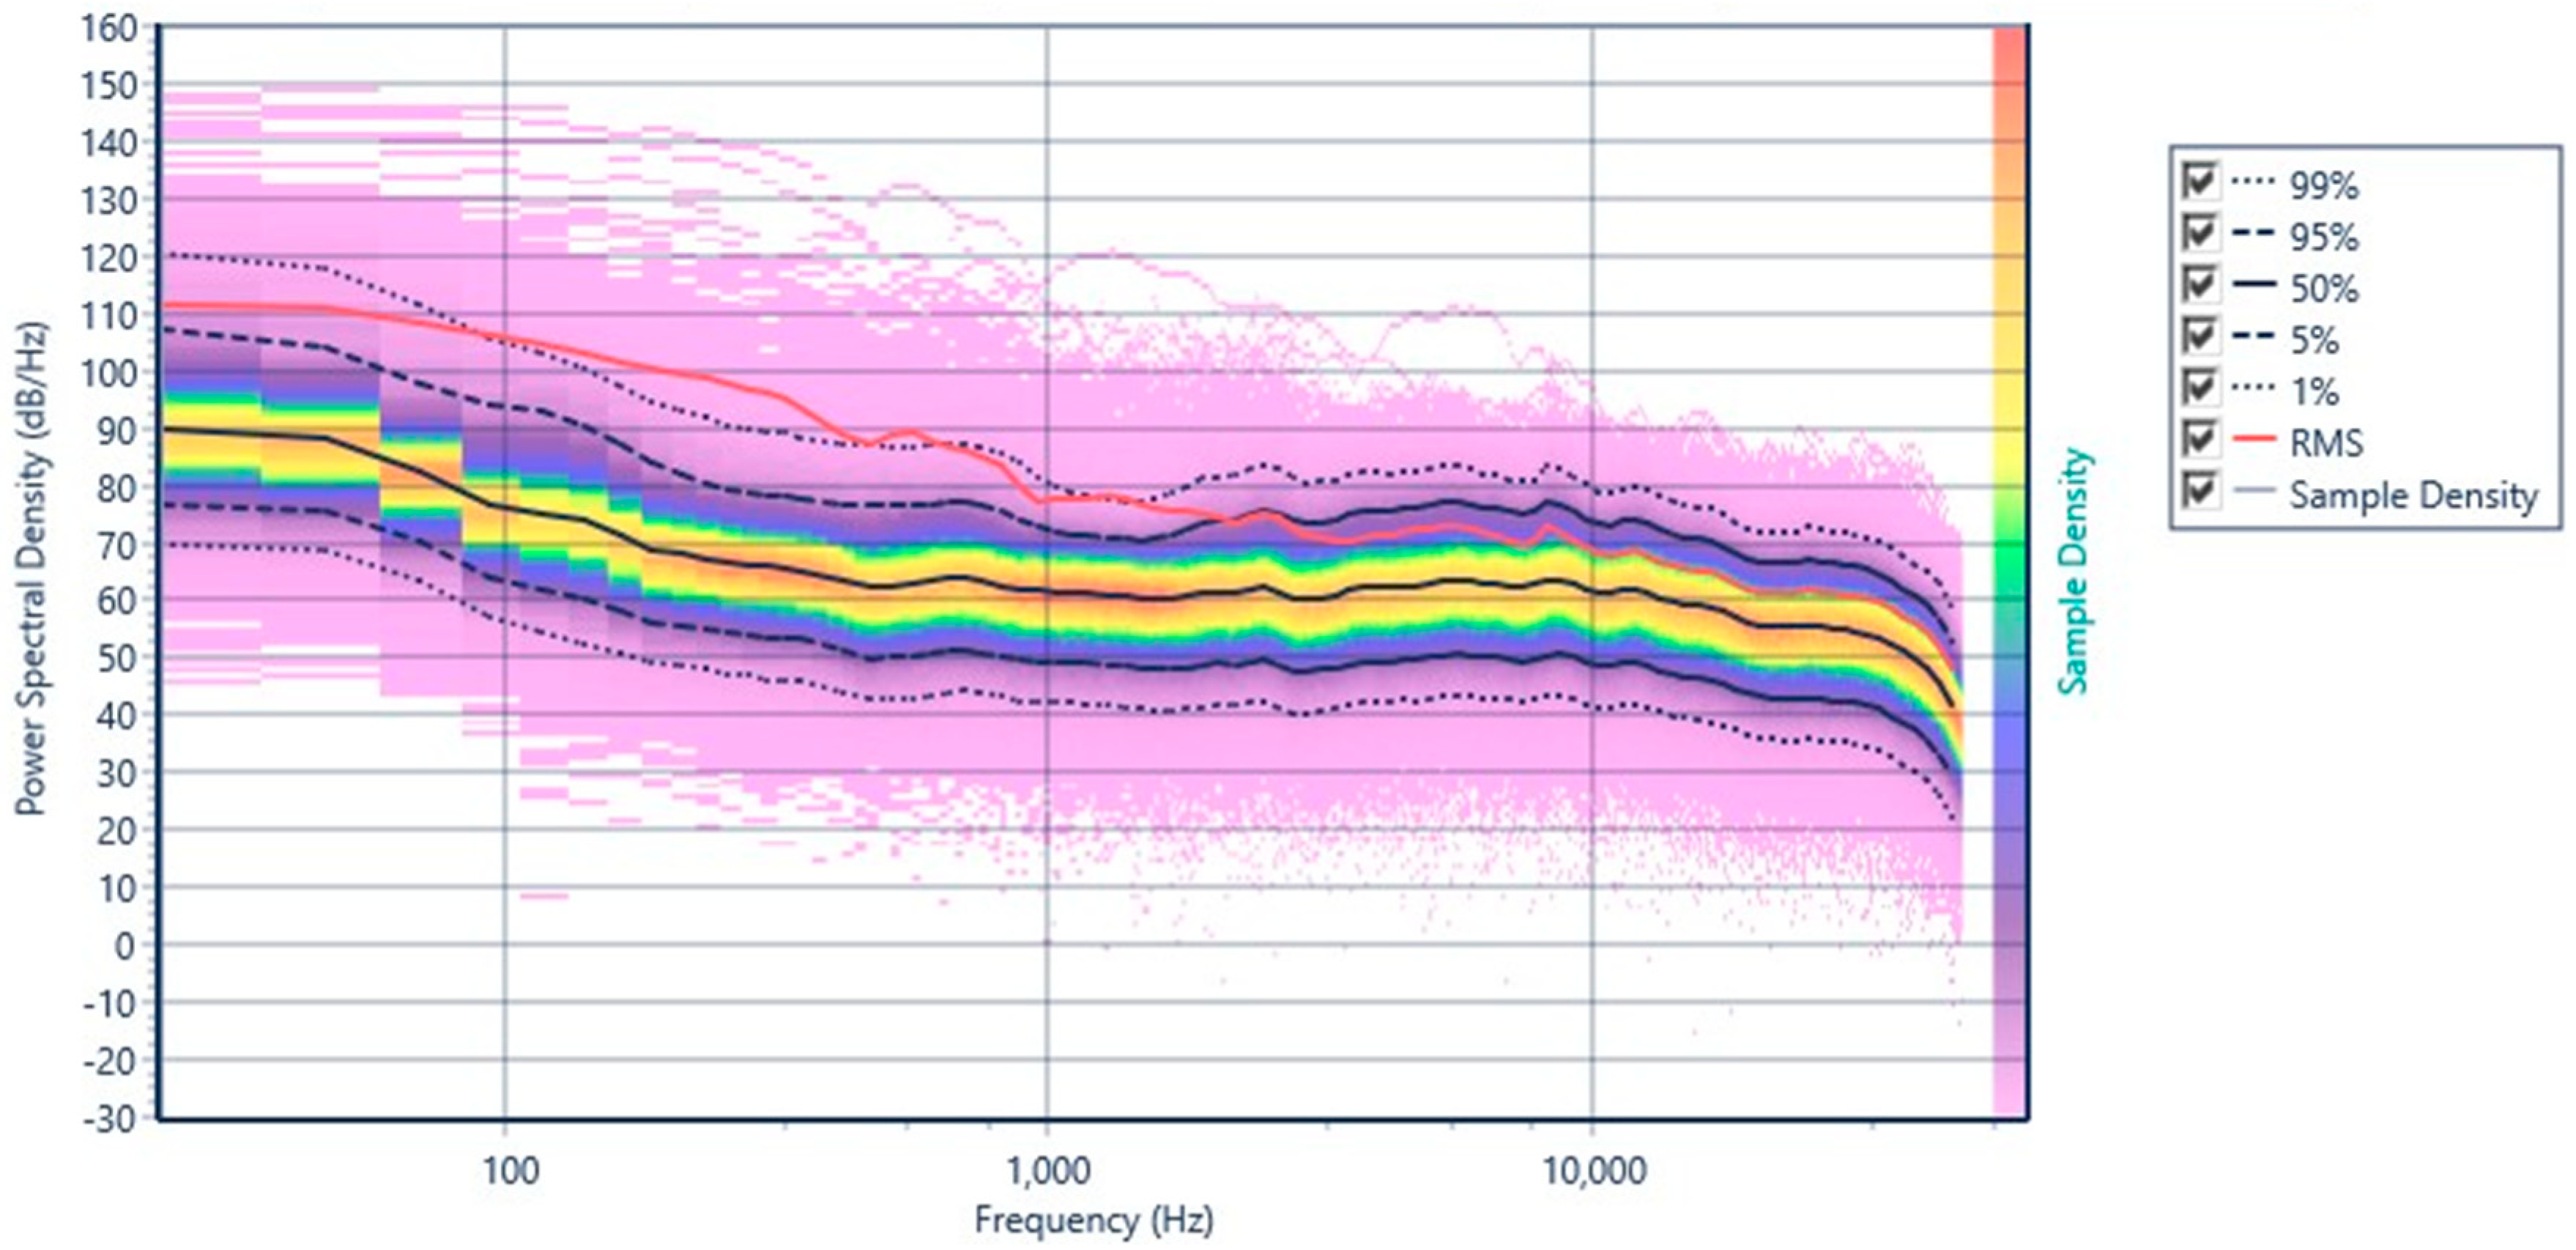
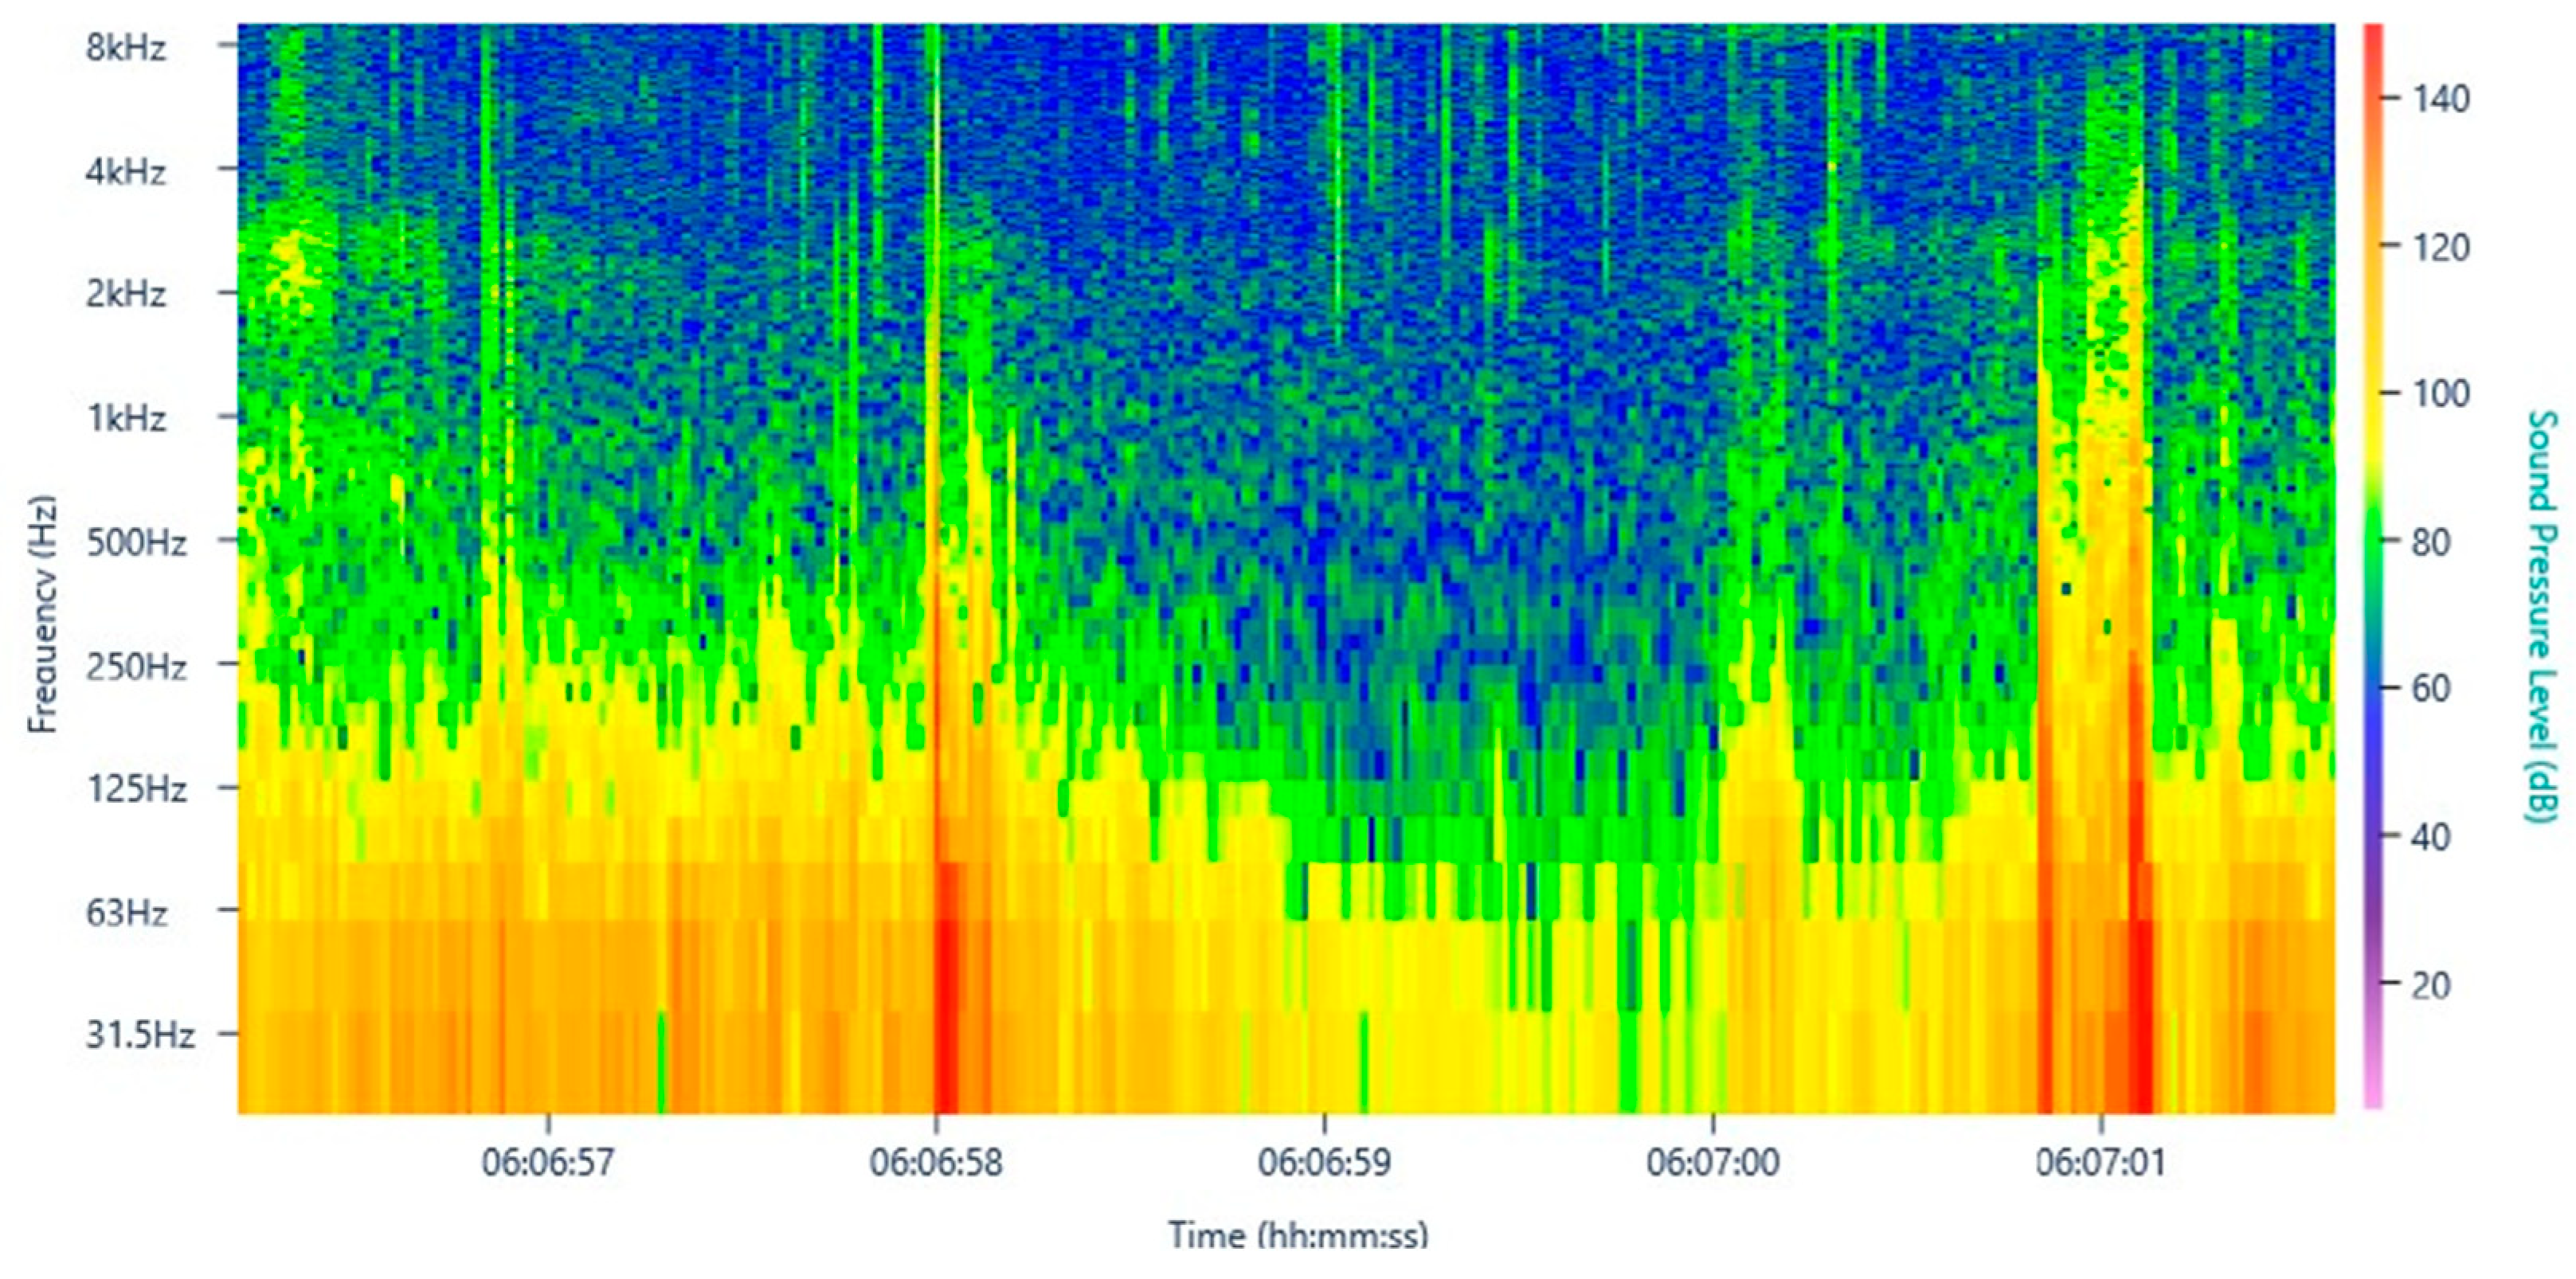
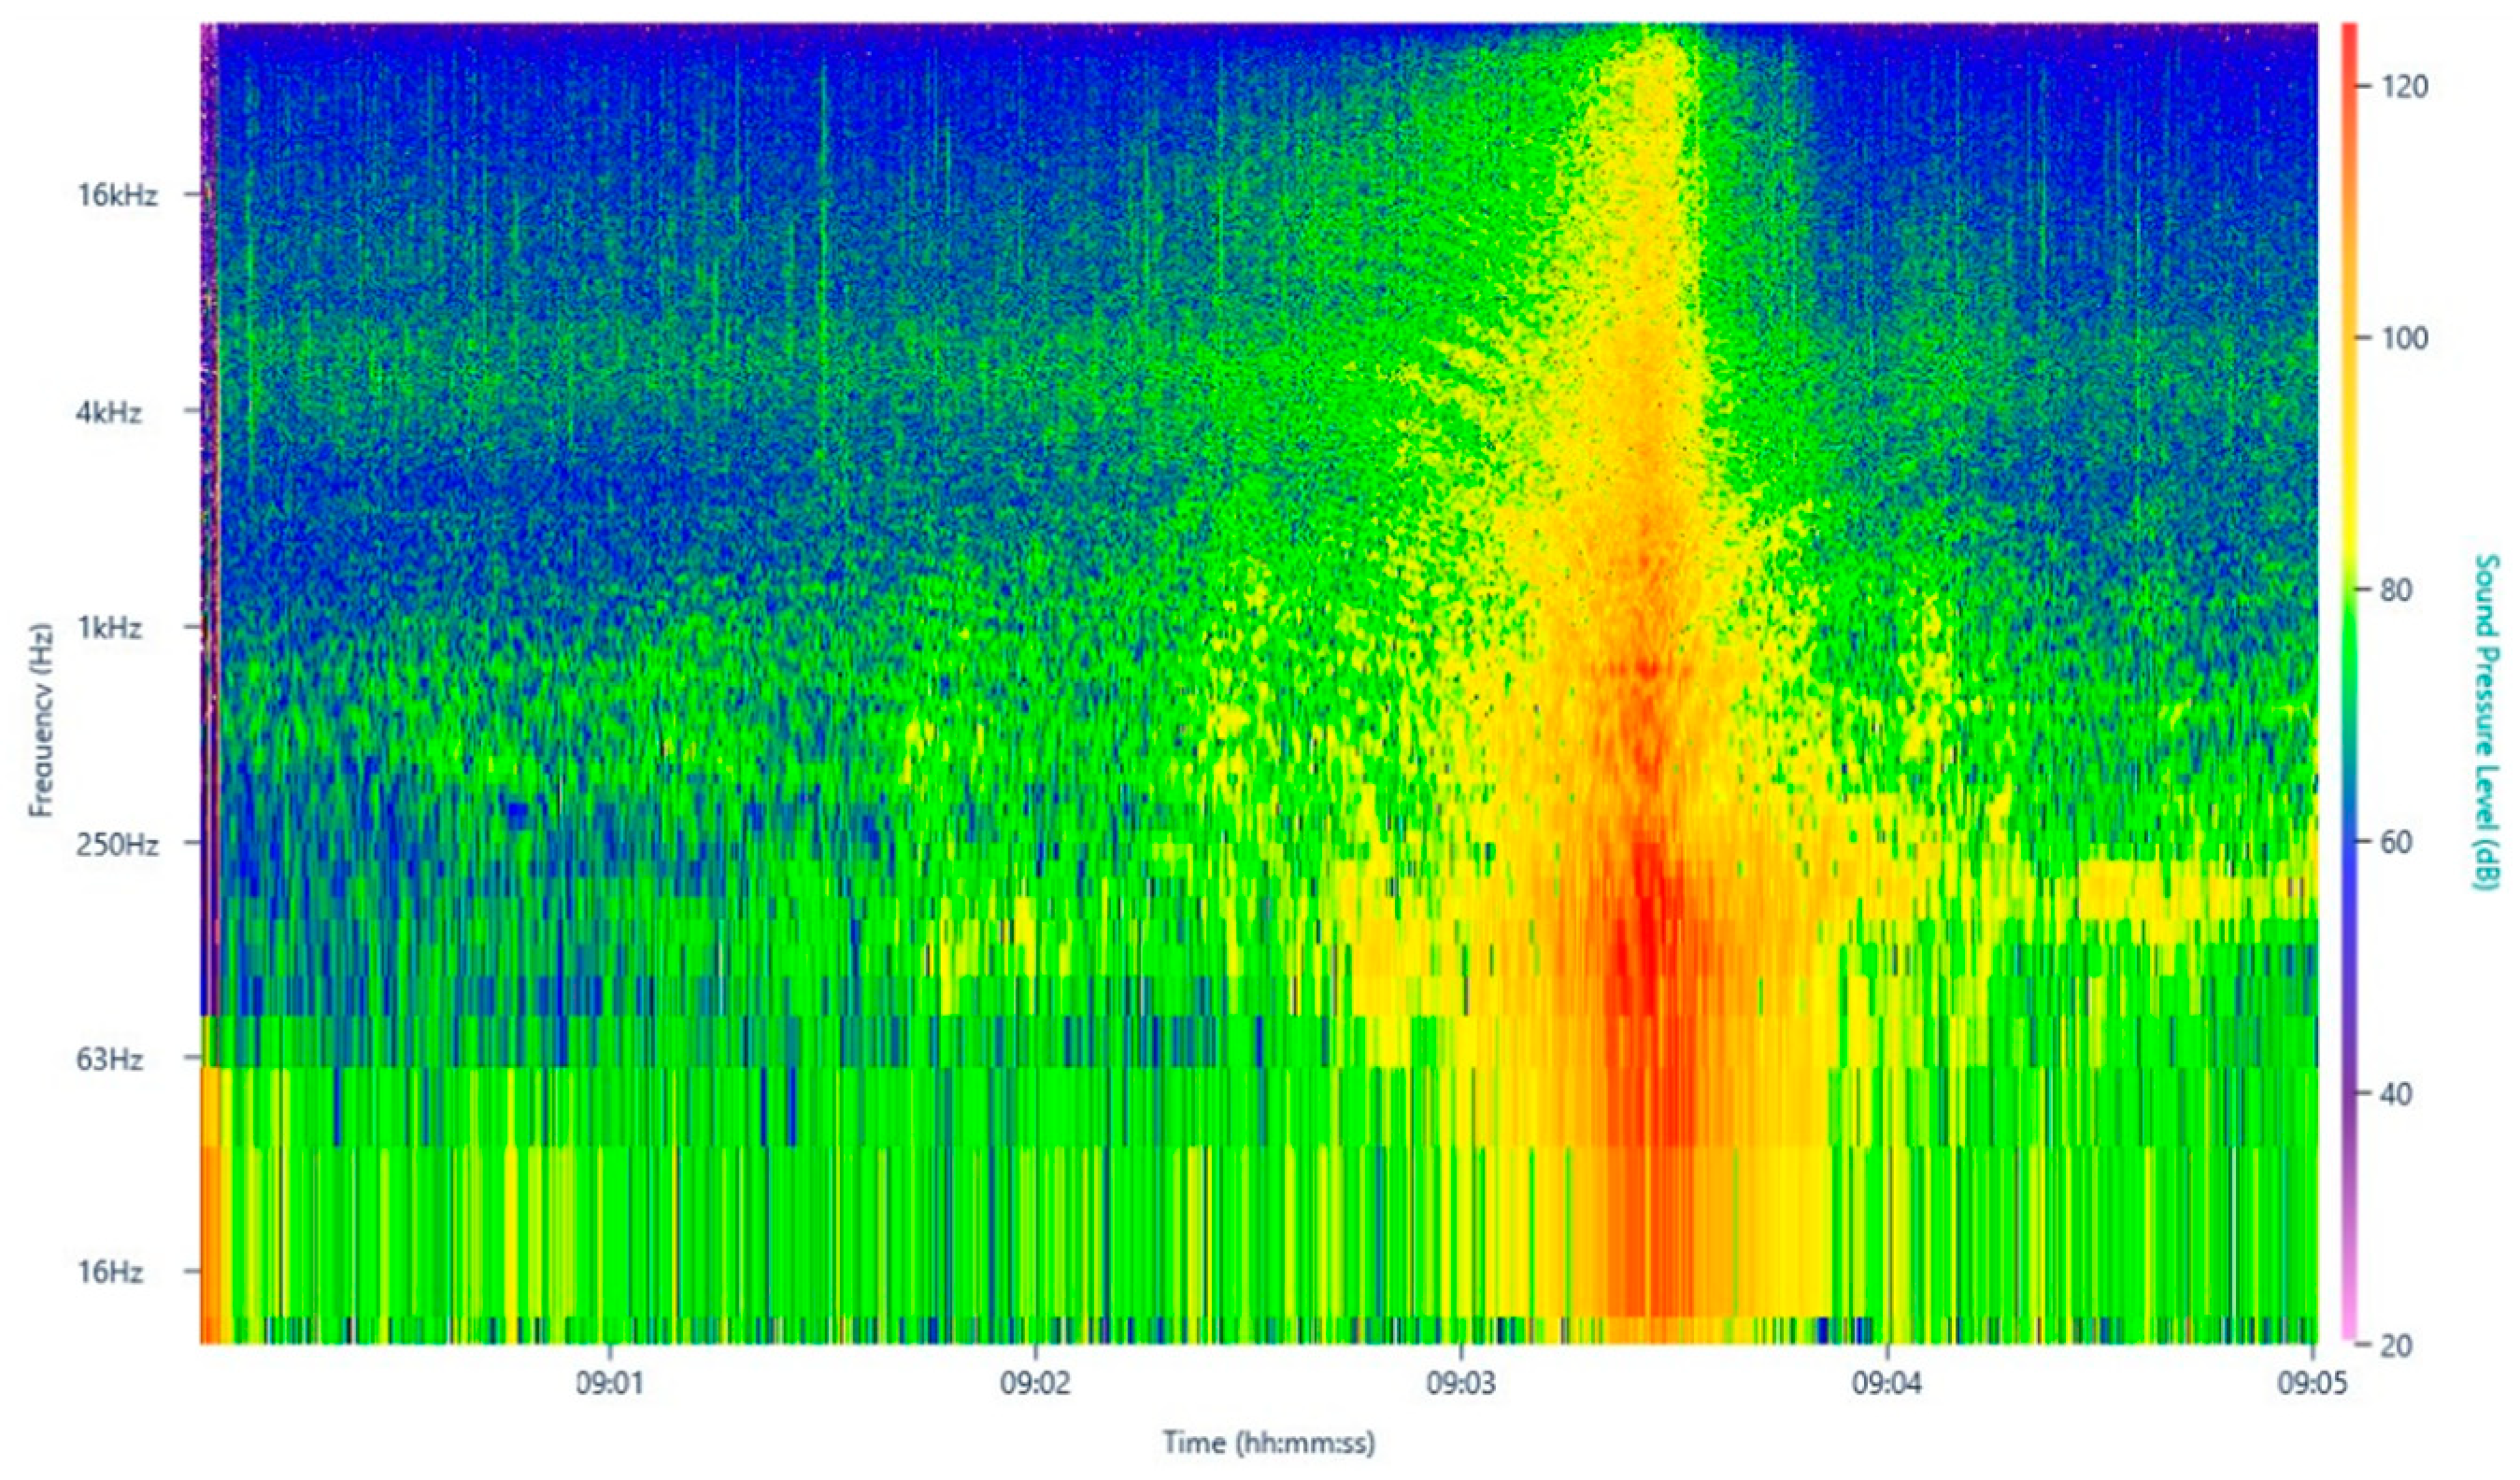
2.3. FFTs, Spectrograms and Power Spectral Density Analysis

Spectrograms and power spectral densities (PSD) analysis via dBWav allowed for the visualisation of SPL intensity and thus, provided valuable insight into UNP in Ċirkewwa and the Grand Harbour. Spectrograms were generated for audio files returning high SPL values and were produced through the FFT function provided by the software. In conducting FFTs, a window length of 4096 samples was used with a 50% overlap. The Blackman-Harris function was used to reduce spectral leakage. This function was used over the Hamming function as it provides a more accurate representation of the frequency distribution and provides better spectral resolution.

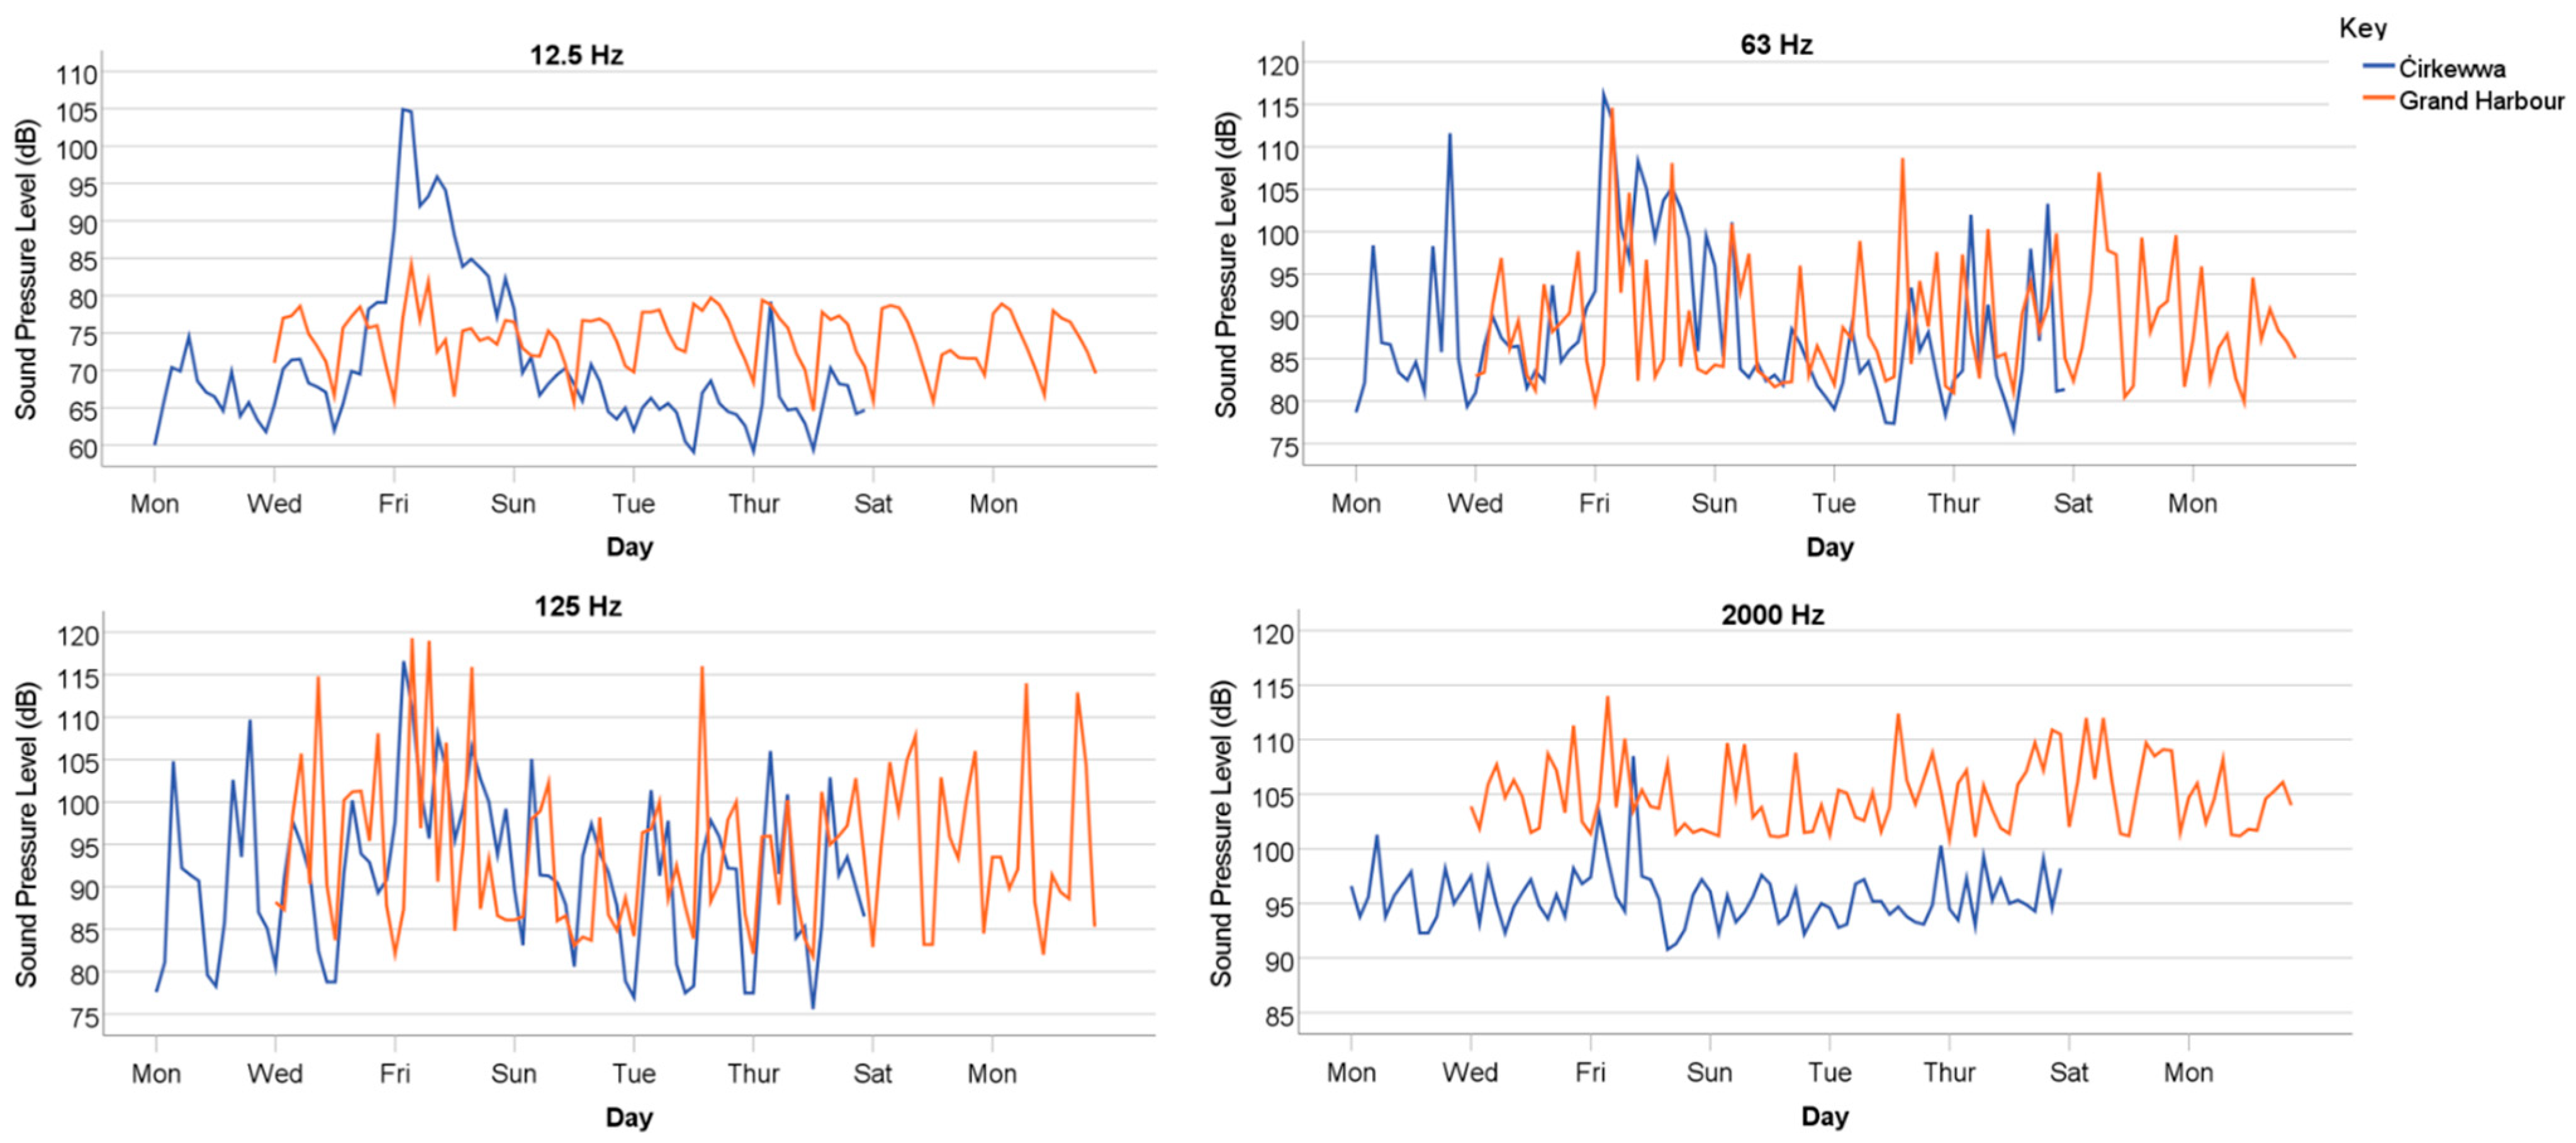
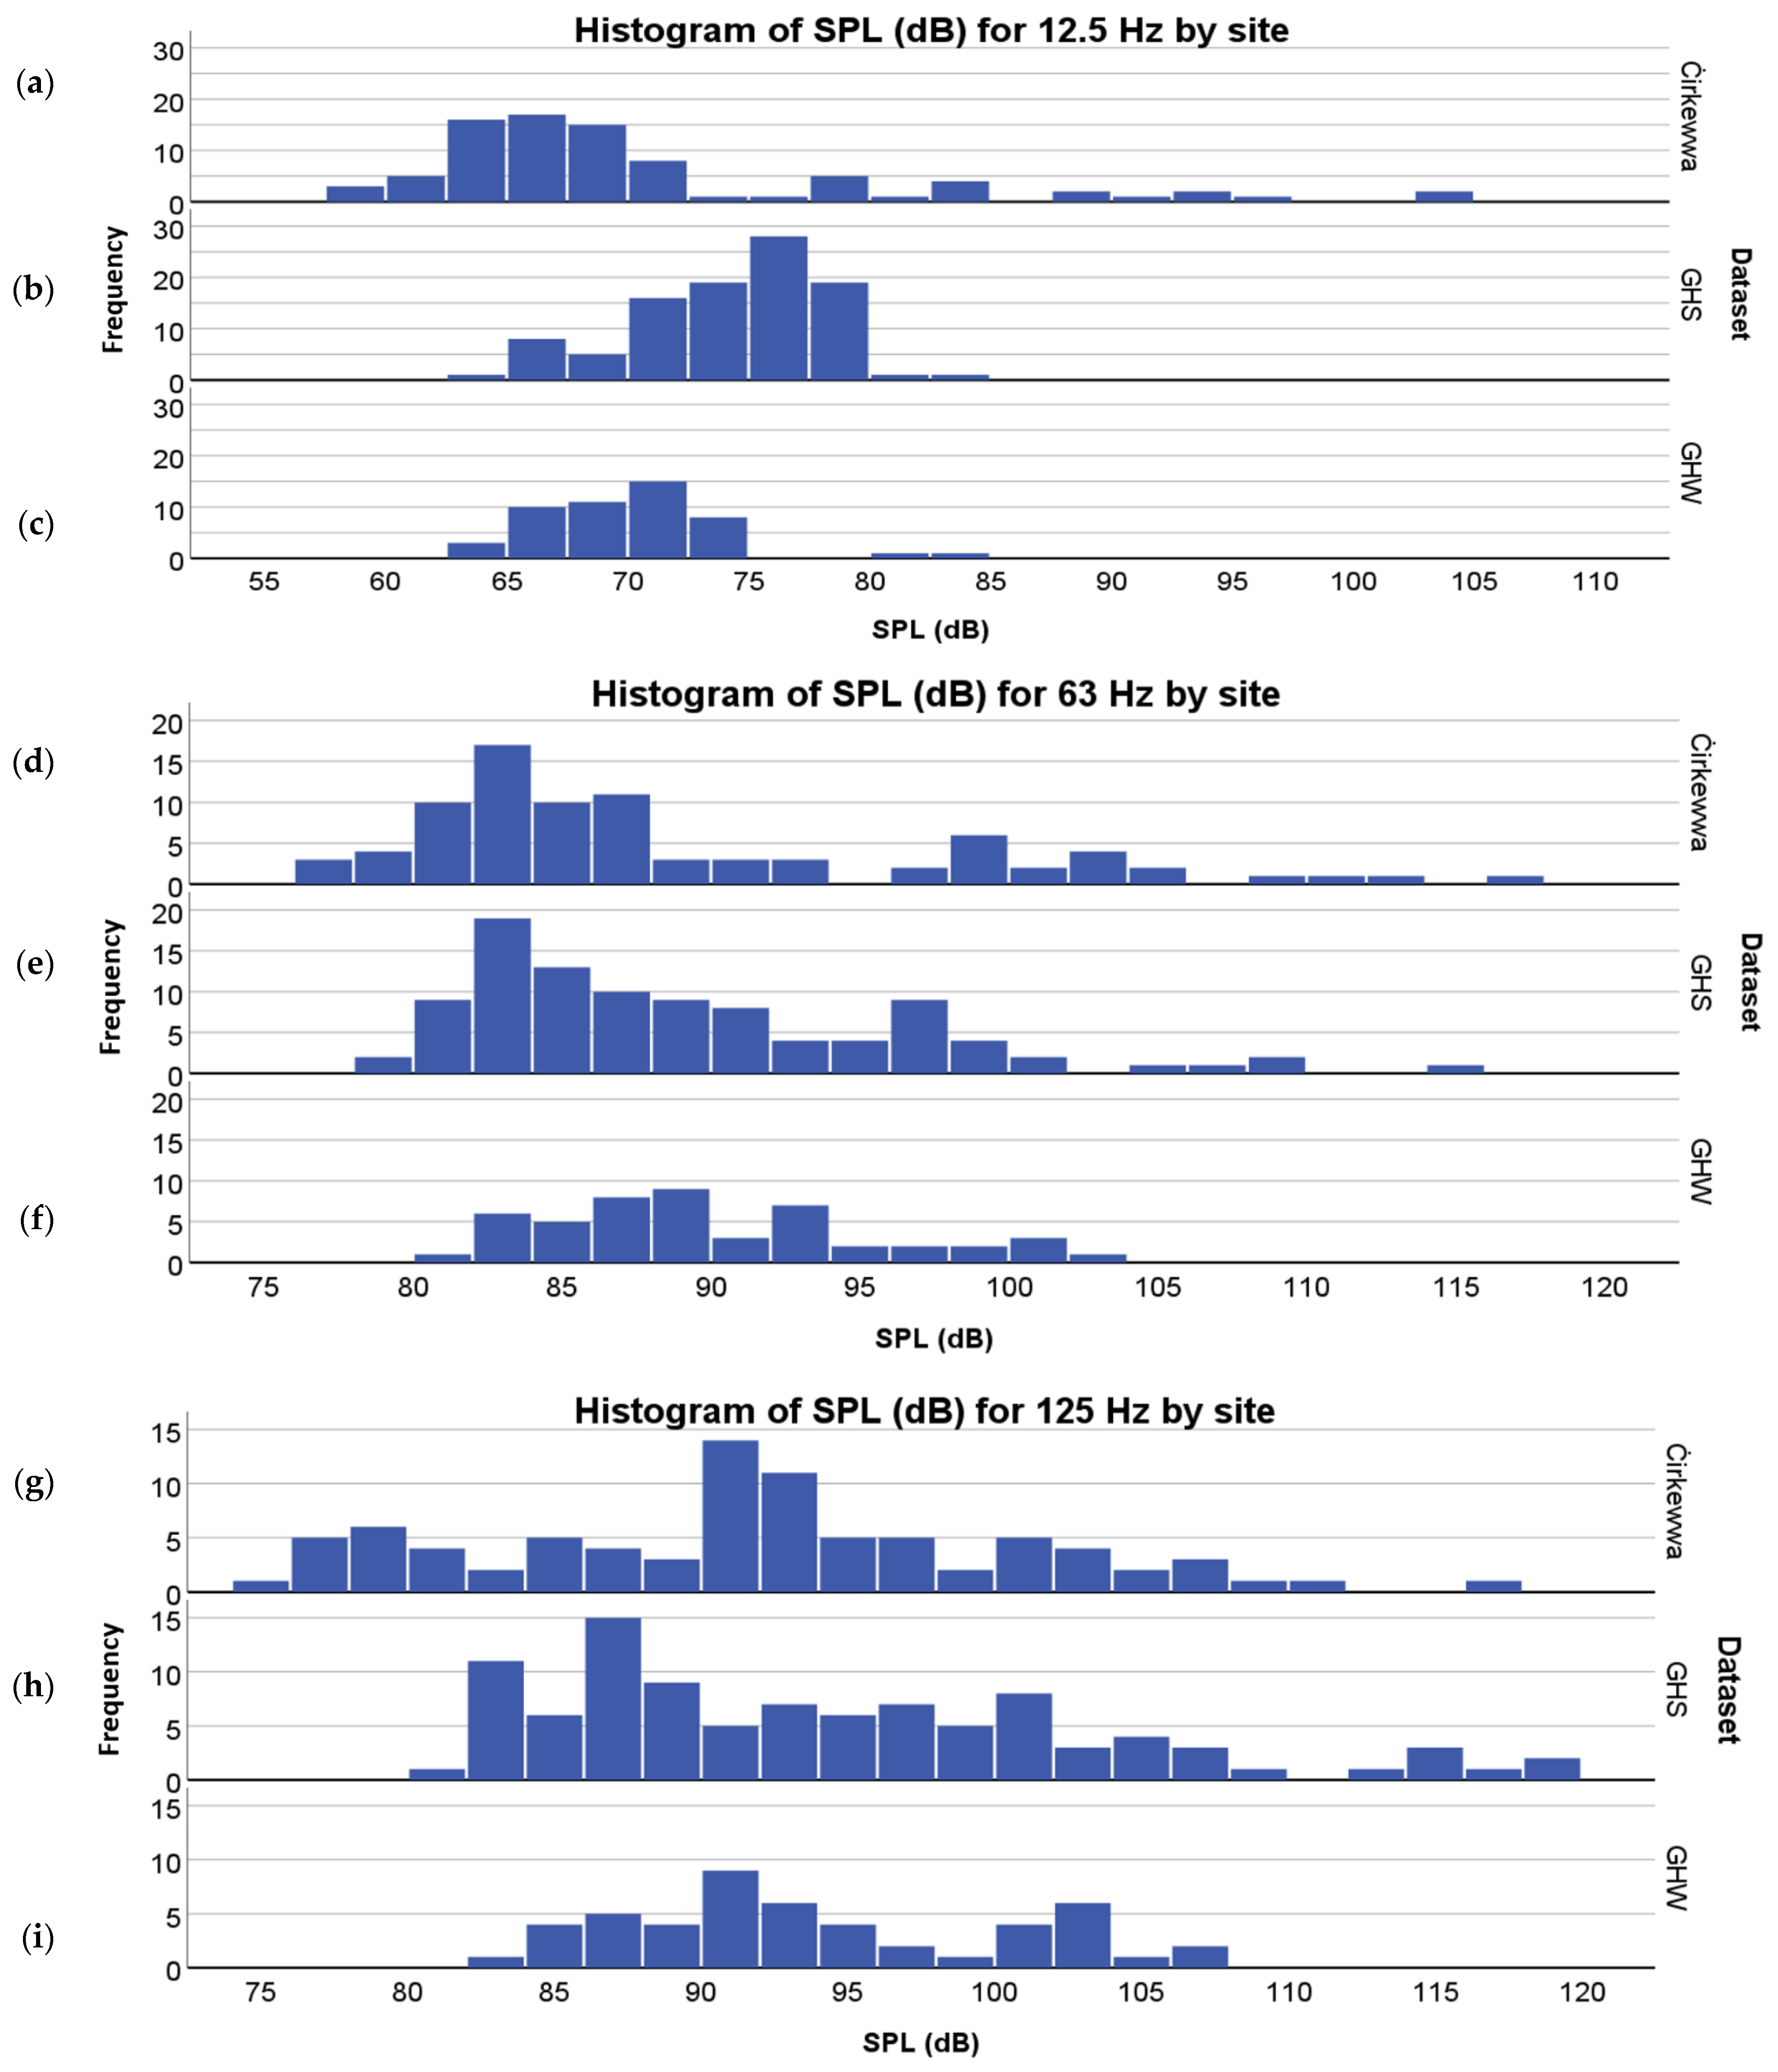
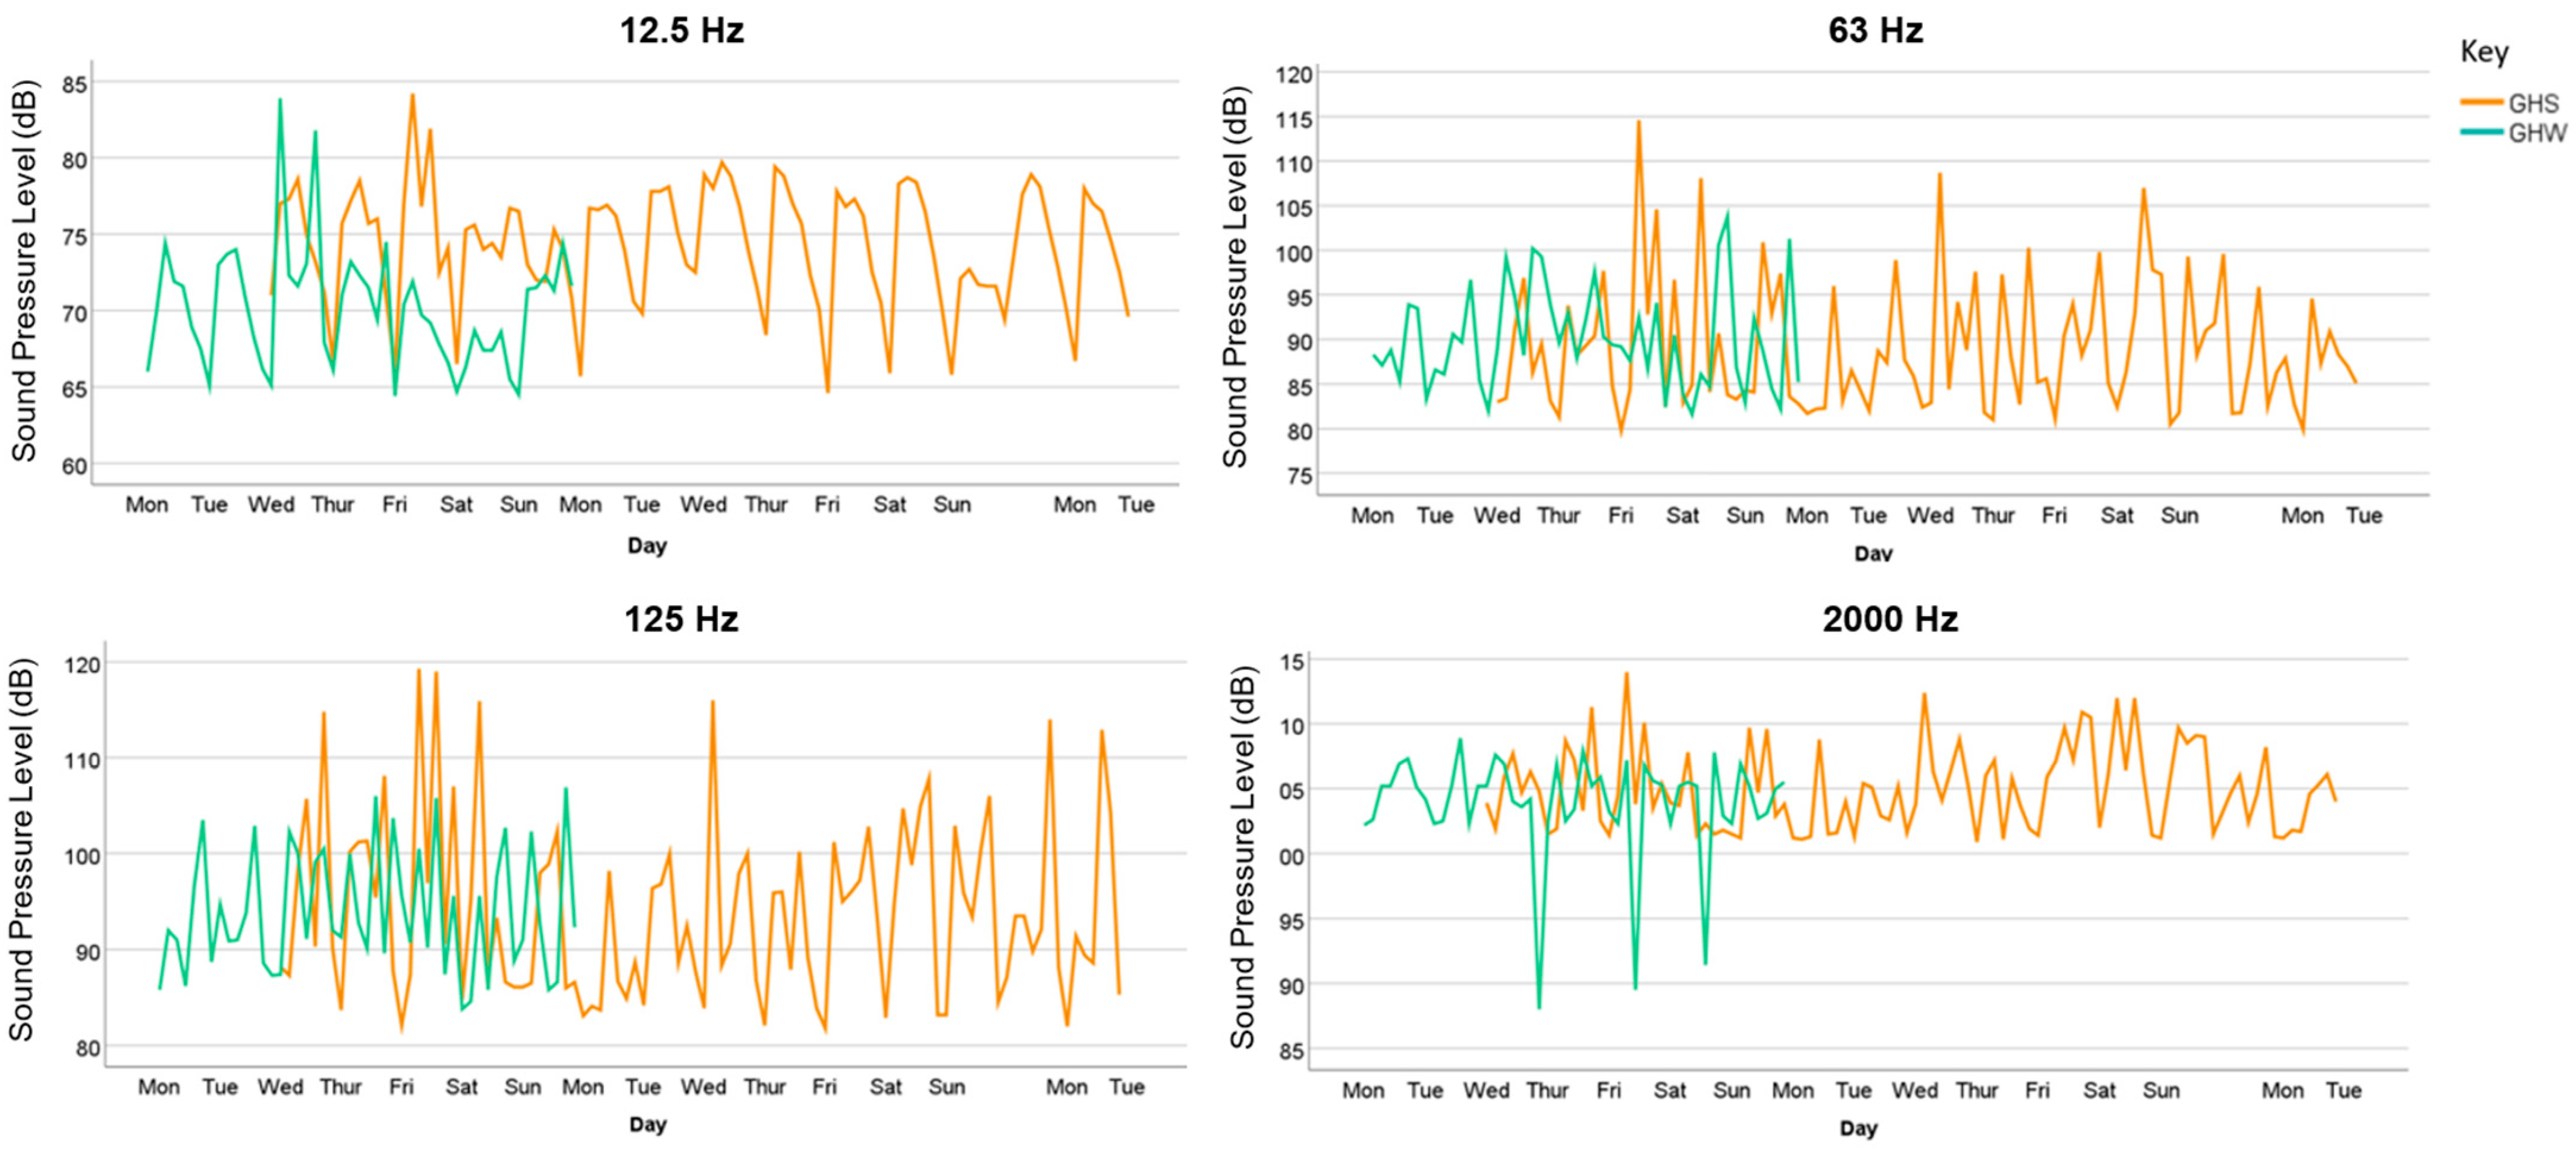
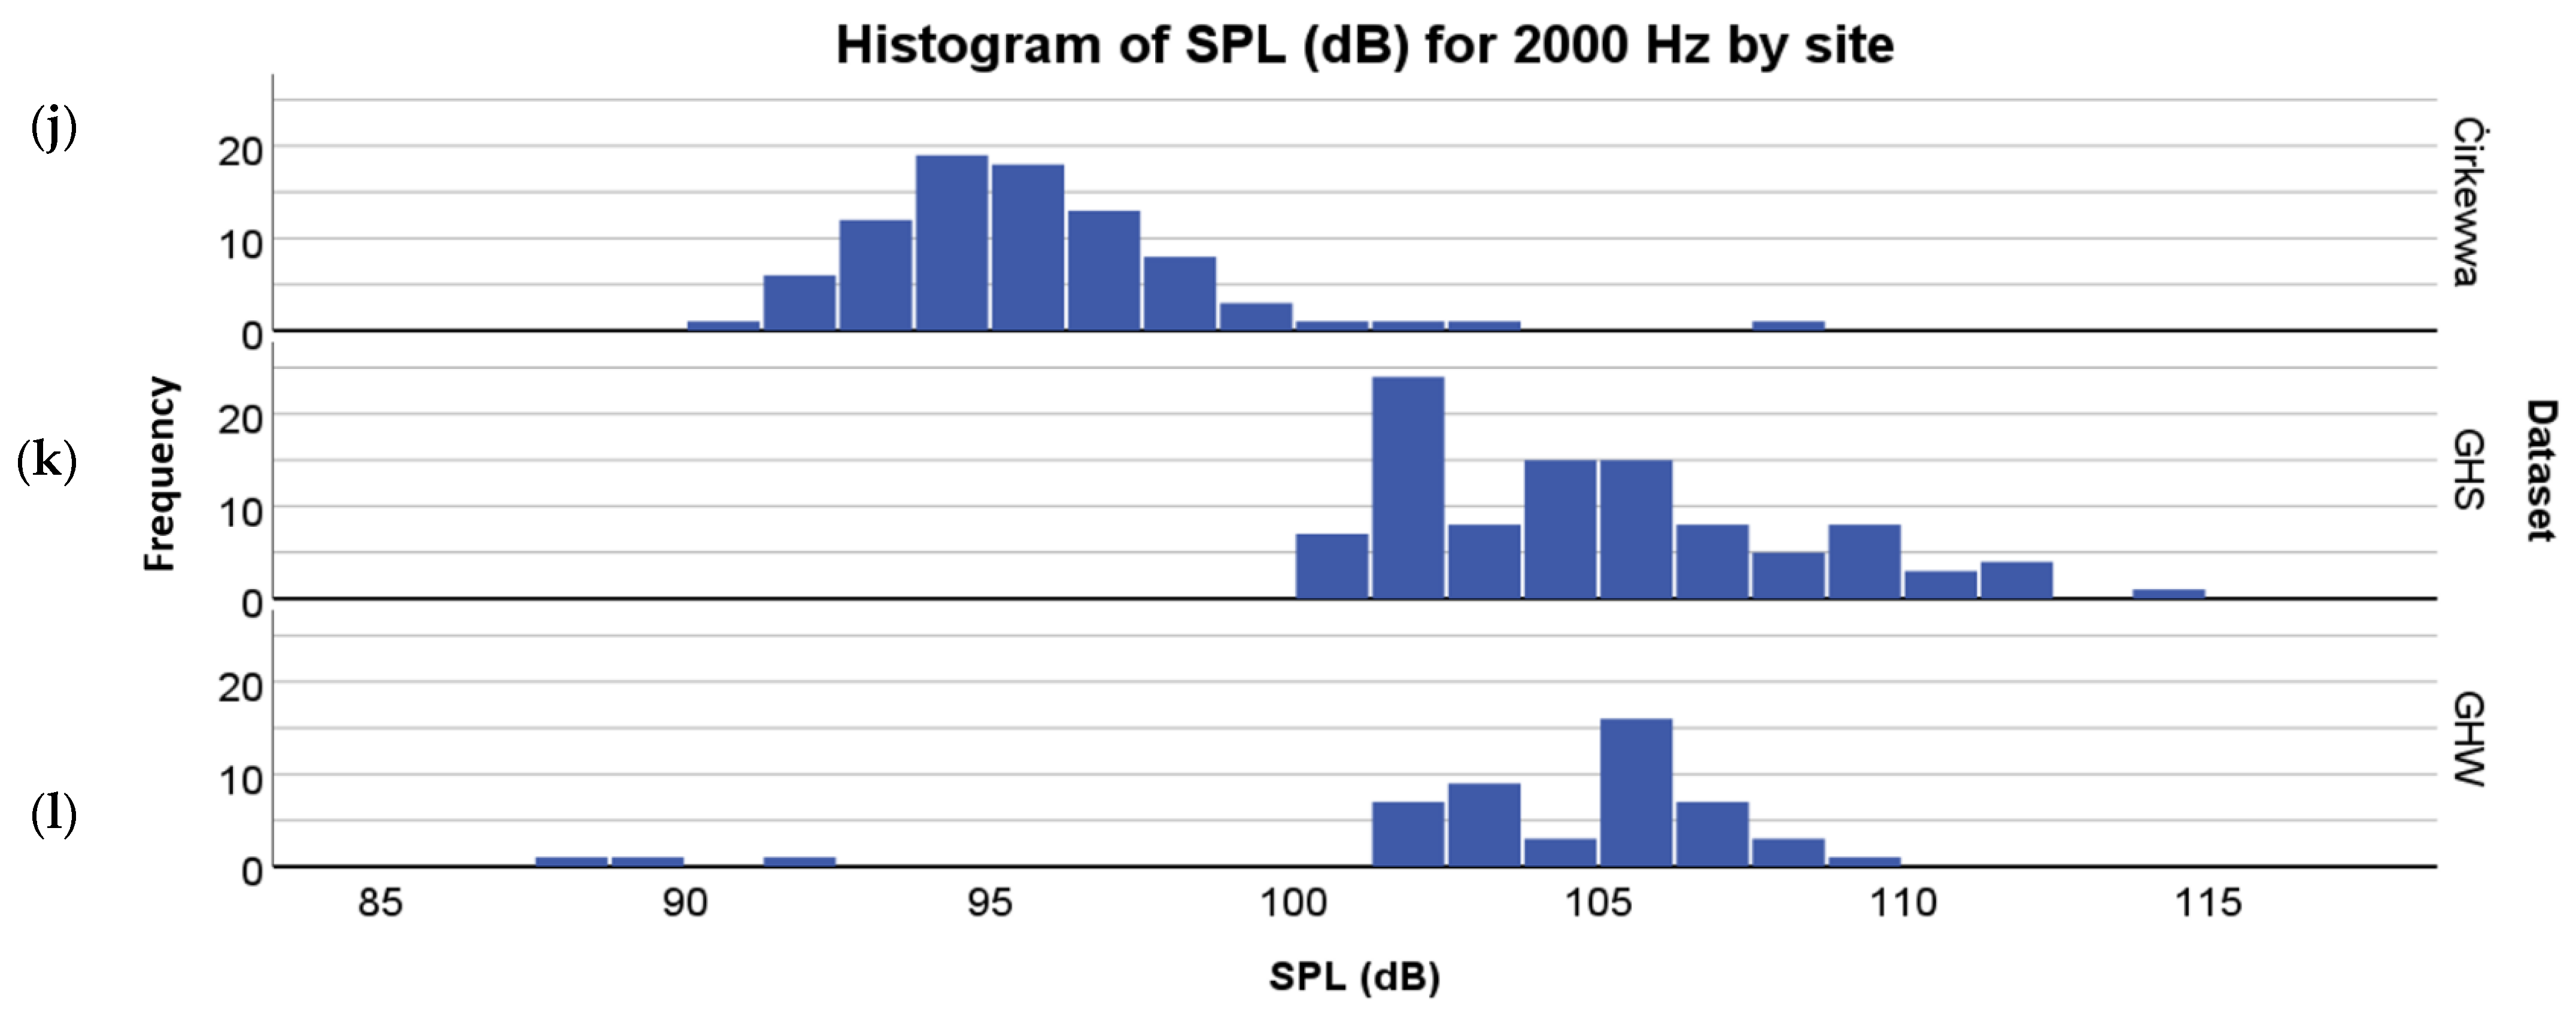
2.4. Cross-Examination and Analysis of Data between Sites and Seasons

Time series in the form of line graphs were generated in order to visualise temporal and spatial variations in SPLs for the tested frequencies. Before producing these graphs, the sampling dates were aligned with the days of the week so as to emphasise any variations between weekend and weekday SPLs. Following this, one set of time series was produced in order to illustrate the frequency patterns for each individual site and another set was produced in order to superimpose each site’s frequency pattern on each other and to reveal and accentuate these differences. This juxtaposition of data was also carried out for the summer and winter data collected from the Grand Harbour to infer any seasonal differences.

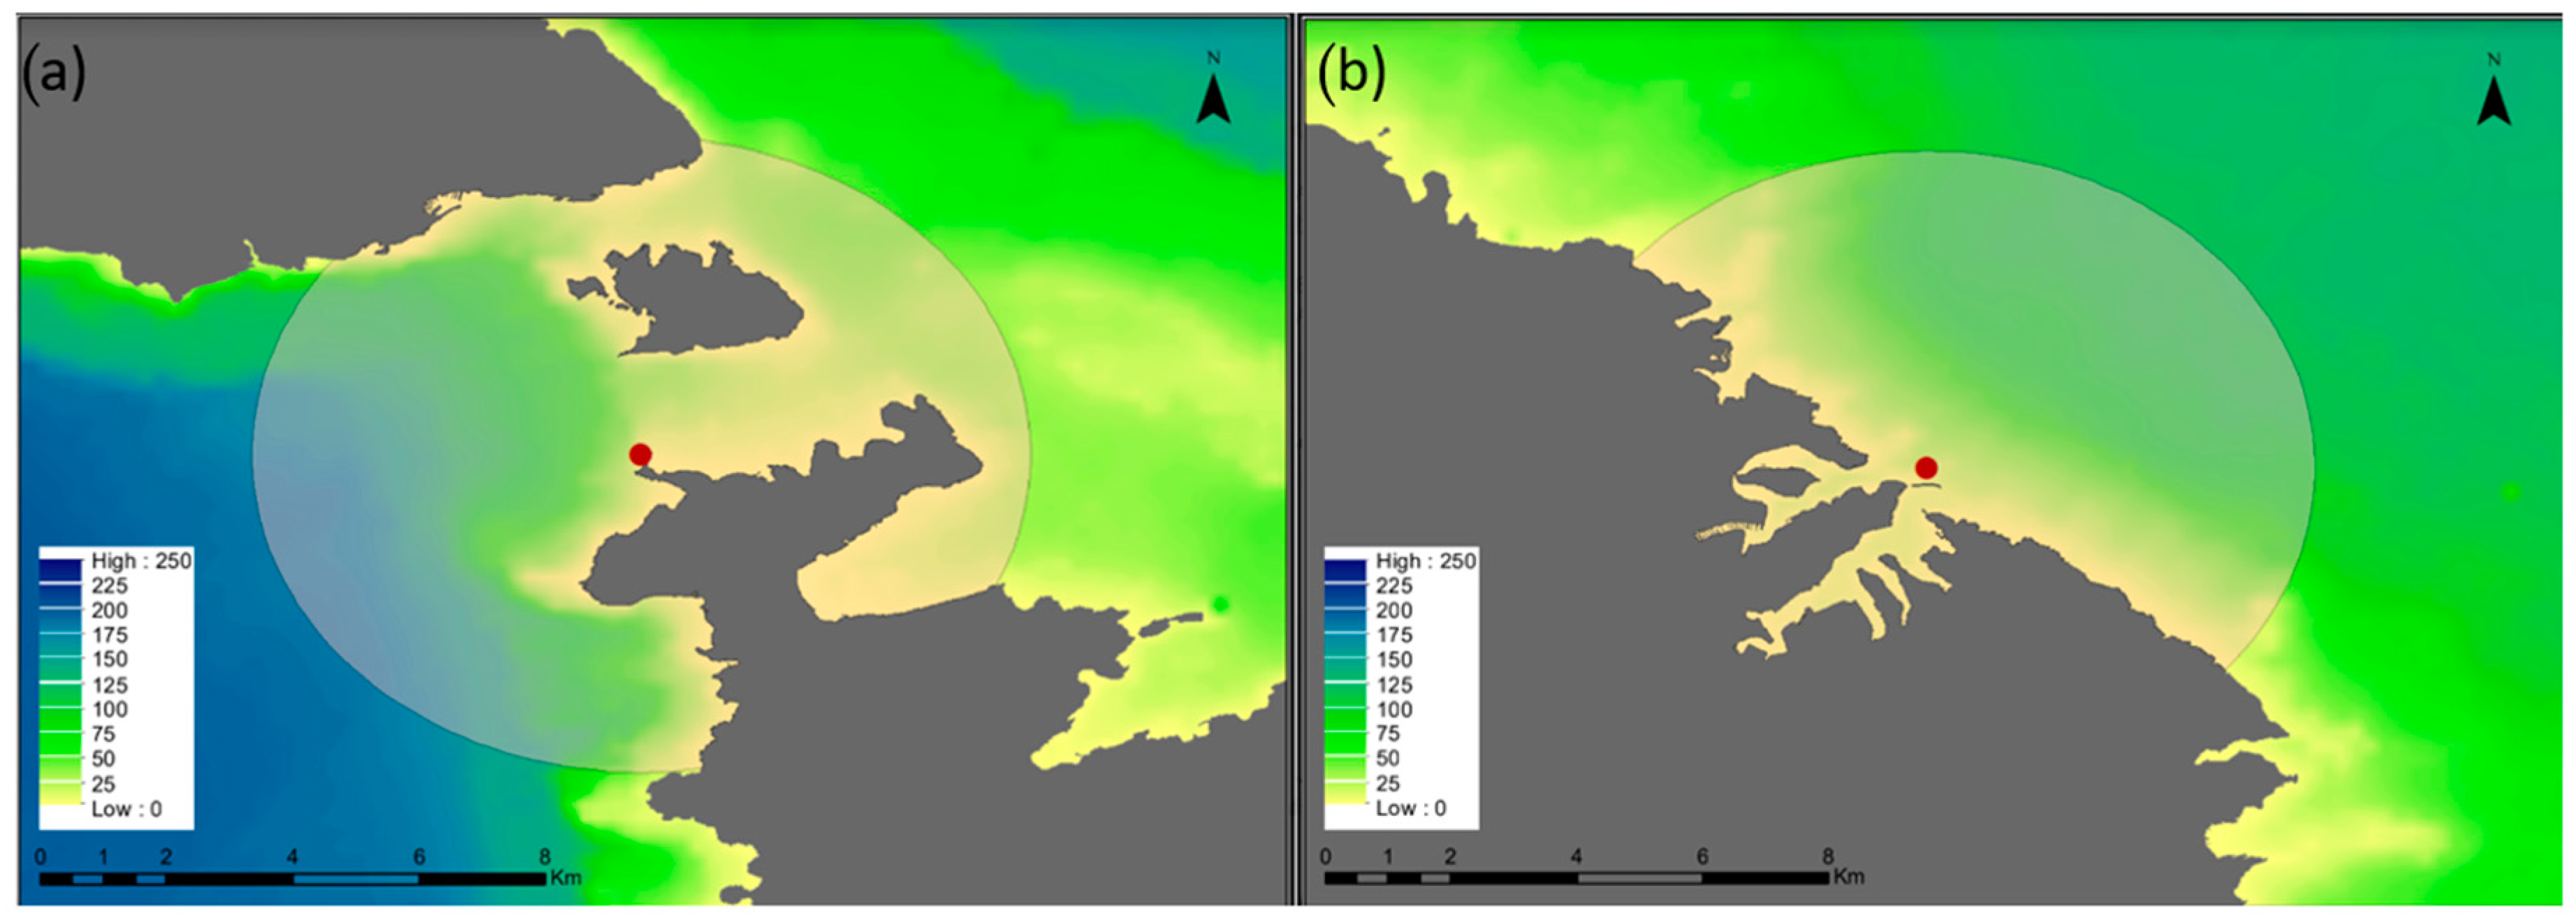
2.5. Identifying Contributors of Underwater Noise through the Use of AIS Data

To supplement the findings, AIS data made available by MarineTraffic were utilised to identify the main contributing sources of UNP. In dealing with the extensive dataset provided, temporal (time and date) and spatial (geographical extents) filters were used to narrow down the dataset. With regards to setting the spatial filters, a buffer zone of 12 km around the deployed hydrophone (Figure 6) was adopted with the purpose of defining a subset region of focus and facilitate data filtering. After this, the vessels identified to be passing nearby the hydrophone were identified and ship hash codes, also provided by MarineTraffic, were used to match the code with their corresponding ship type.

3. Results

3.1. Analytic Overview of Audio Data Recorded at Ċirkewwa and the Grand Harbour
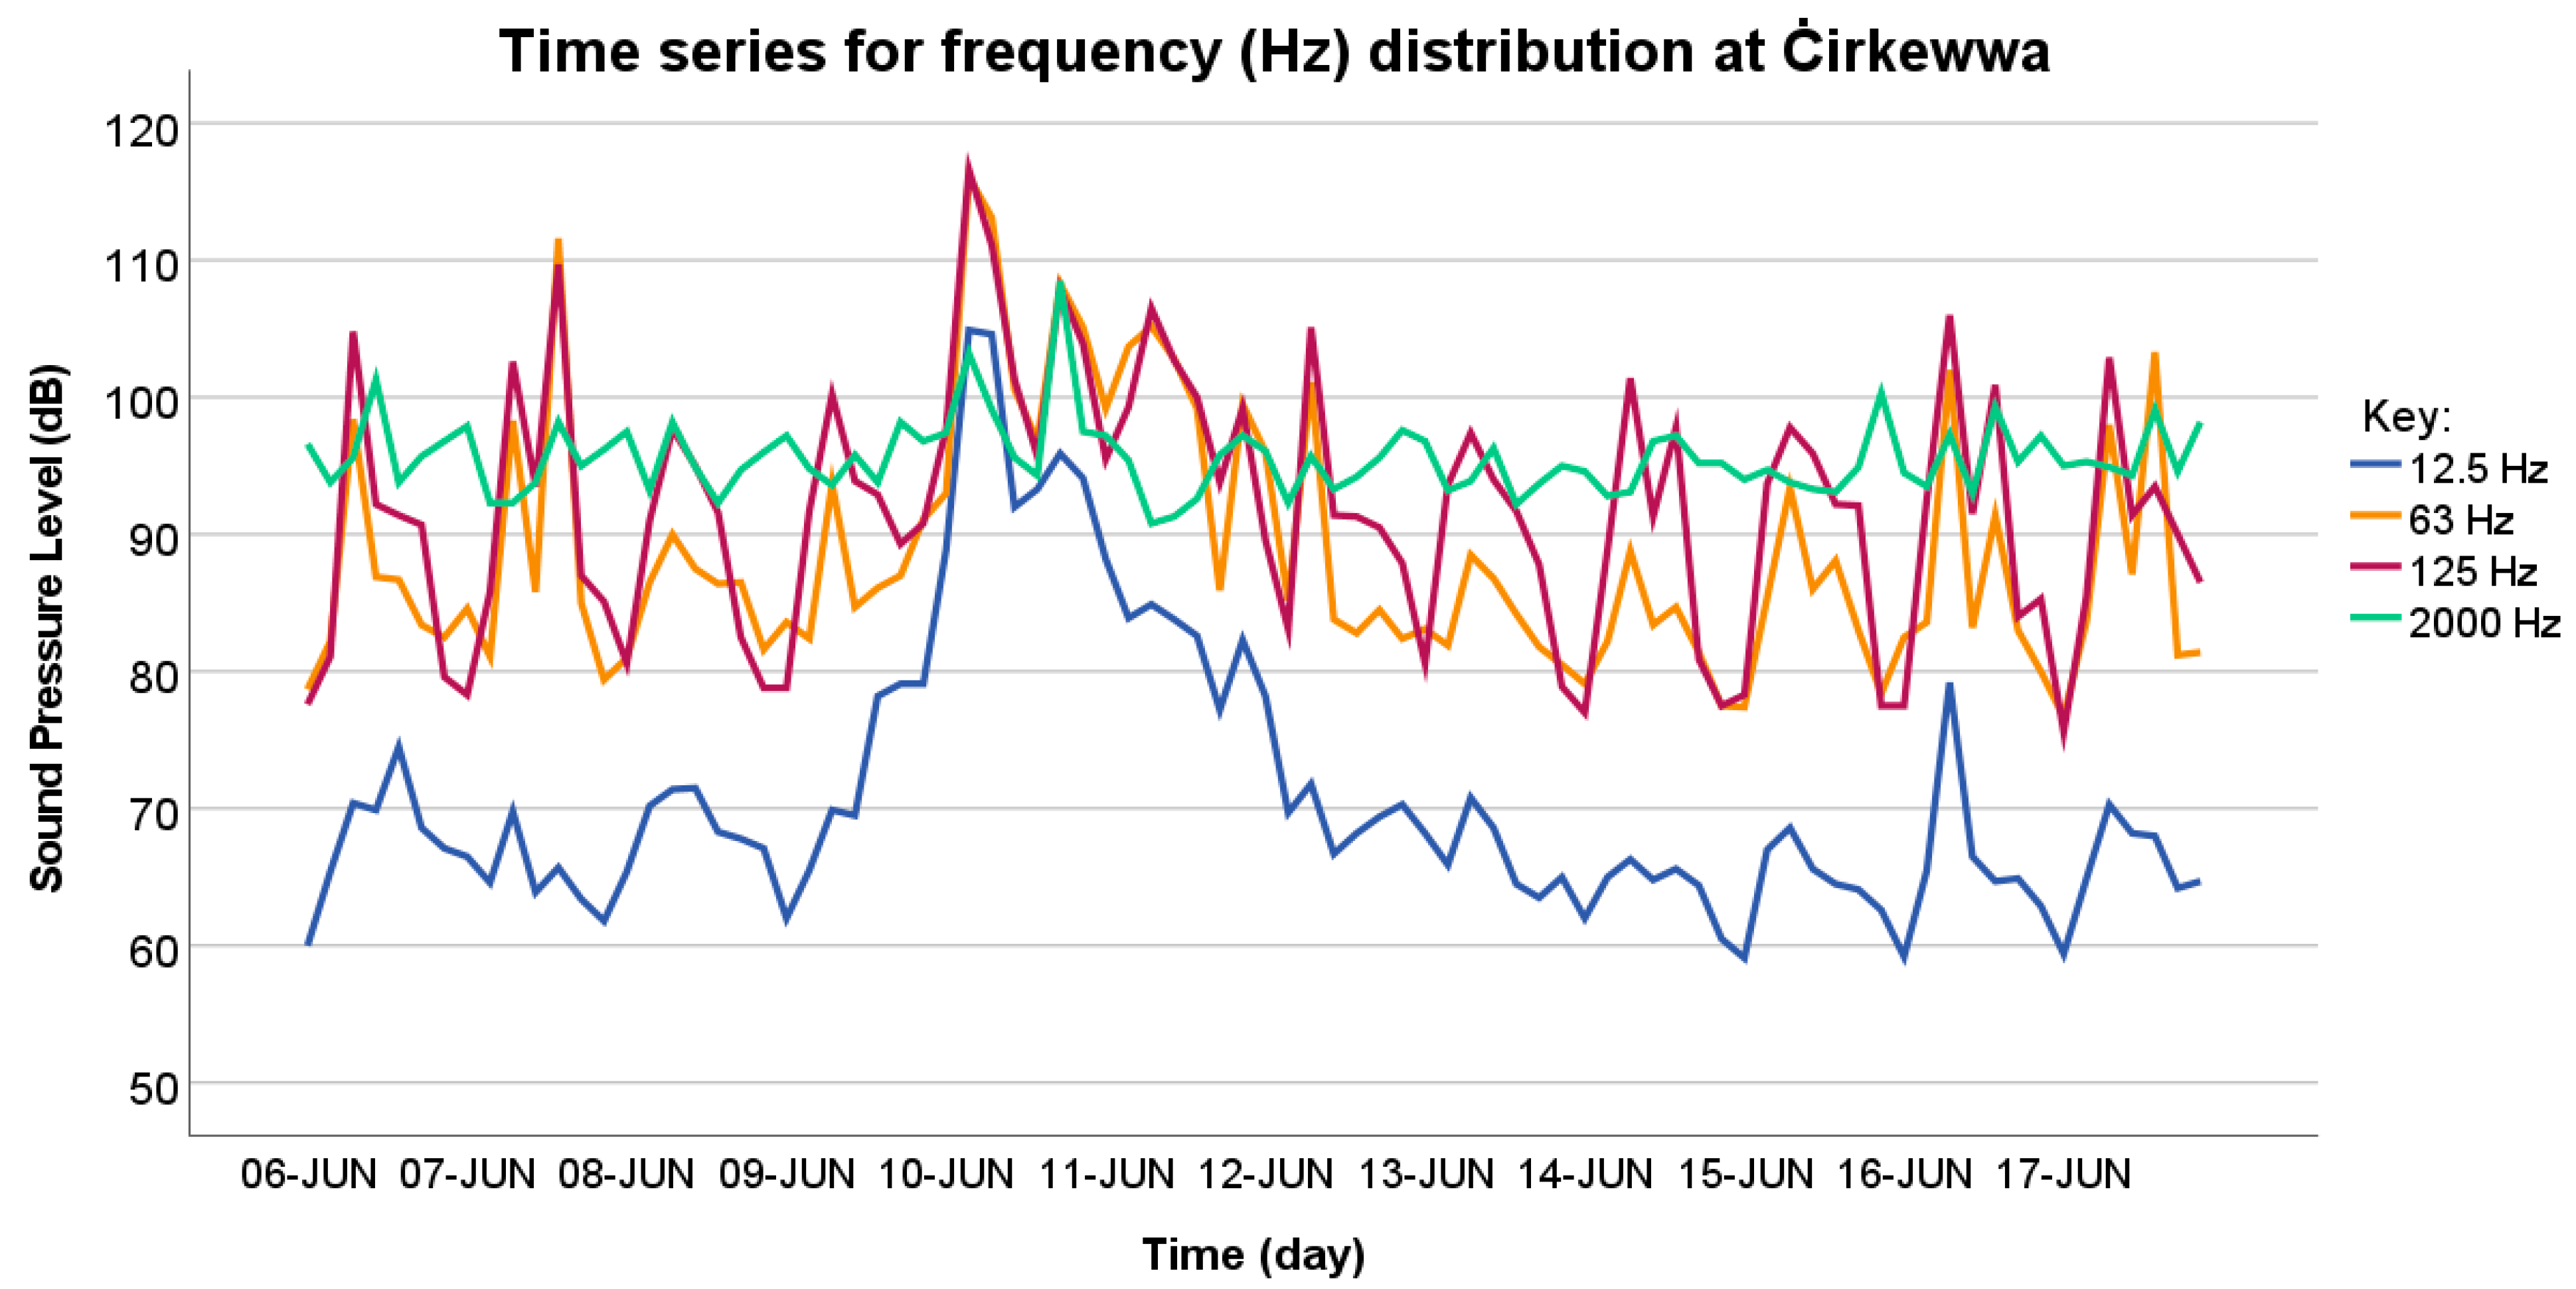
With a total of 2290 min of audio data collected over the two sampling sites, the mean SPLs of Ċirkewwa and the Grand Harbour soundscapes exhibit a high degree of similarity, with the GHS data yielding higher average SPLs for 12.5 Hz, 63 Hz, and 125 Hz, with differences of 4.68%, 0.56% and 2.58%, respectively (Table 1). With regards to the 2000 Hz, a significant difference of was calculated between these sites. Whilst the numerical differences are seemingly small, the logarithmic nature of the decibel infer considerable significance. Moreover, the seasonal comparison between the GHS and GHW datasets also reveals slightly higher mean SPLs during July 2020 with the exception of the mean SPLs for 63 Hz.
The daily SPLs for Ċirkewwa, GHS and GHW are shown in Figure 8 and Figure 9 and display the pattern in SPL variation throughout the week. Ċirkewwa and GHS (Figure 8) display a similar trend of generally higher SPLs aligning with weekends and lower SPLs aligning with weekdays, however, this does not hold true for the GHS and GHW time series (Figure 9), with audio data collected over the weekend for GHW exhibiting comparatively low SPL levels. Overall, the GHS audio recorded slightly higher SPLs for all frequencies except 12.5 Hz.
Moreover, the distribution of SPLs, as illustrated in Figure 10, revealed interesting variability in noise intensity between both marine soundscapes subjected to this investigation. The Ċirkewwa soundscape during the time of data collection was predominantly characterised by the higher frequencies of 125 Hz and 2000 Hz. Meanwhile, the Grand Harbour soundscape over summer and winter are shown to have been particularly noisy during data collection, with 63 Hz, 125 Hz, and 2000 Hz each returning high SPL distribution. After being cross-referenced with archived meteorological data of the Maltese Islands, the particularly high GHW SPLs for 2000 Hz may be attributed to windy or rainy weather conditions that had occurred during the week that the hydrophone was deployed.

3.2. Ċirkewwa

Figure 11 illustrates the PSD of all of the frequencies present within the Ċirkewwa dataset and highlights the comparatively higher prevalence of the lower-ranging frequencies over the higher frequencies. This is observed as frequencies around the 100 dB mark and below coincided with high RMS of around 105 dB/Hz and 110 dB/Hz. This serves as further support into the monitoring of low frequency UNP.
The average SPLs of the 125 Hz recorded in June 2022 was higher than that recorded for 63 Hz, with mean values of 91.8 dB and 88.7 dB, respectively (Table 2). Additionally, Figure 11 illustrates that emissions of 125 Hz exceeded 100 dB 5.95% more than that which was recorded at 63 Hz. Both datasets returned standard deviations of over 9, which may relate to the high variability of SPLs shown in Figure 12.
From Figure 12, the SPLs for both 63 Hz and 125 Hz are seen to surpass the 100 dB mark at multiple points throughout the time series. After cross-referencing the dates with the 2022 calendar, these peaks corresponded to 9 a.m. during the weekdays and the prominent apexes reaching nearly 120 dB were noted to have occurred on Friday 10th and Saturday 11th June and again -though to a lesser extent—on Friday 17th June 2022, thus suggesting a high influx of people traversing the Gozo Channel over the weekends and the consequent shift of the ferry system from schedule to shuttle in order to accommodate for the surge in commuters. With the SPLs for 12.5 Hz following the same patterns of peaks and dips, however at lower levels averaging at 75.23 dB, it can be deduced that the Gozo ferries emit underwater noise with frequencies ranging from 12.5 Hz to 125 Hz. The SPLs for 2000 Hz display a somewhat constant variation around a mean value of 95.6 dB. This may be attributed to benthic material, such as Posidonia oceanica, pebbles, sand, and other flora, that were possibly brushing against the hydrophone. The hydrophone at Ċirkewwa had to be deployed on the seafloor to prevent potential tempering by SCUBA divers, and was therefore placed among benthic flora to keep it concealed. However, this ultimately prevented a proper analysis of the occurrence of this high frequency range.
The spectrogram in Figure 13 was generated and displays the high sound levels recorded on Friday 10th June between 6 a.m. and 7 a.m. As is evident from Figure 13, significantly high SPLs were constantly generated during the sampled timeframe. To further supplement this revelation, the ship type number for vessels passing through the 12 km buffer zone was obtained through the AIS data provided by MarineTraffic. The ship types ‘60’ and ‘70’ (Table 3) correspond to ‘Passenger’ and ‘Cargo’ vessels, which accurately describe the Gozo ferries that frequently traverse the Gozo Channel.

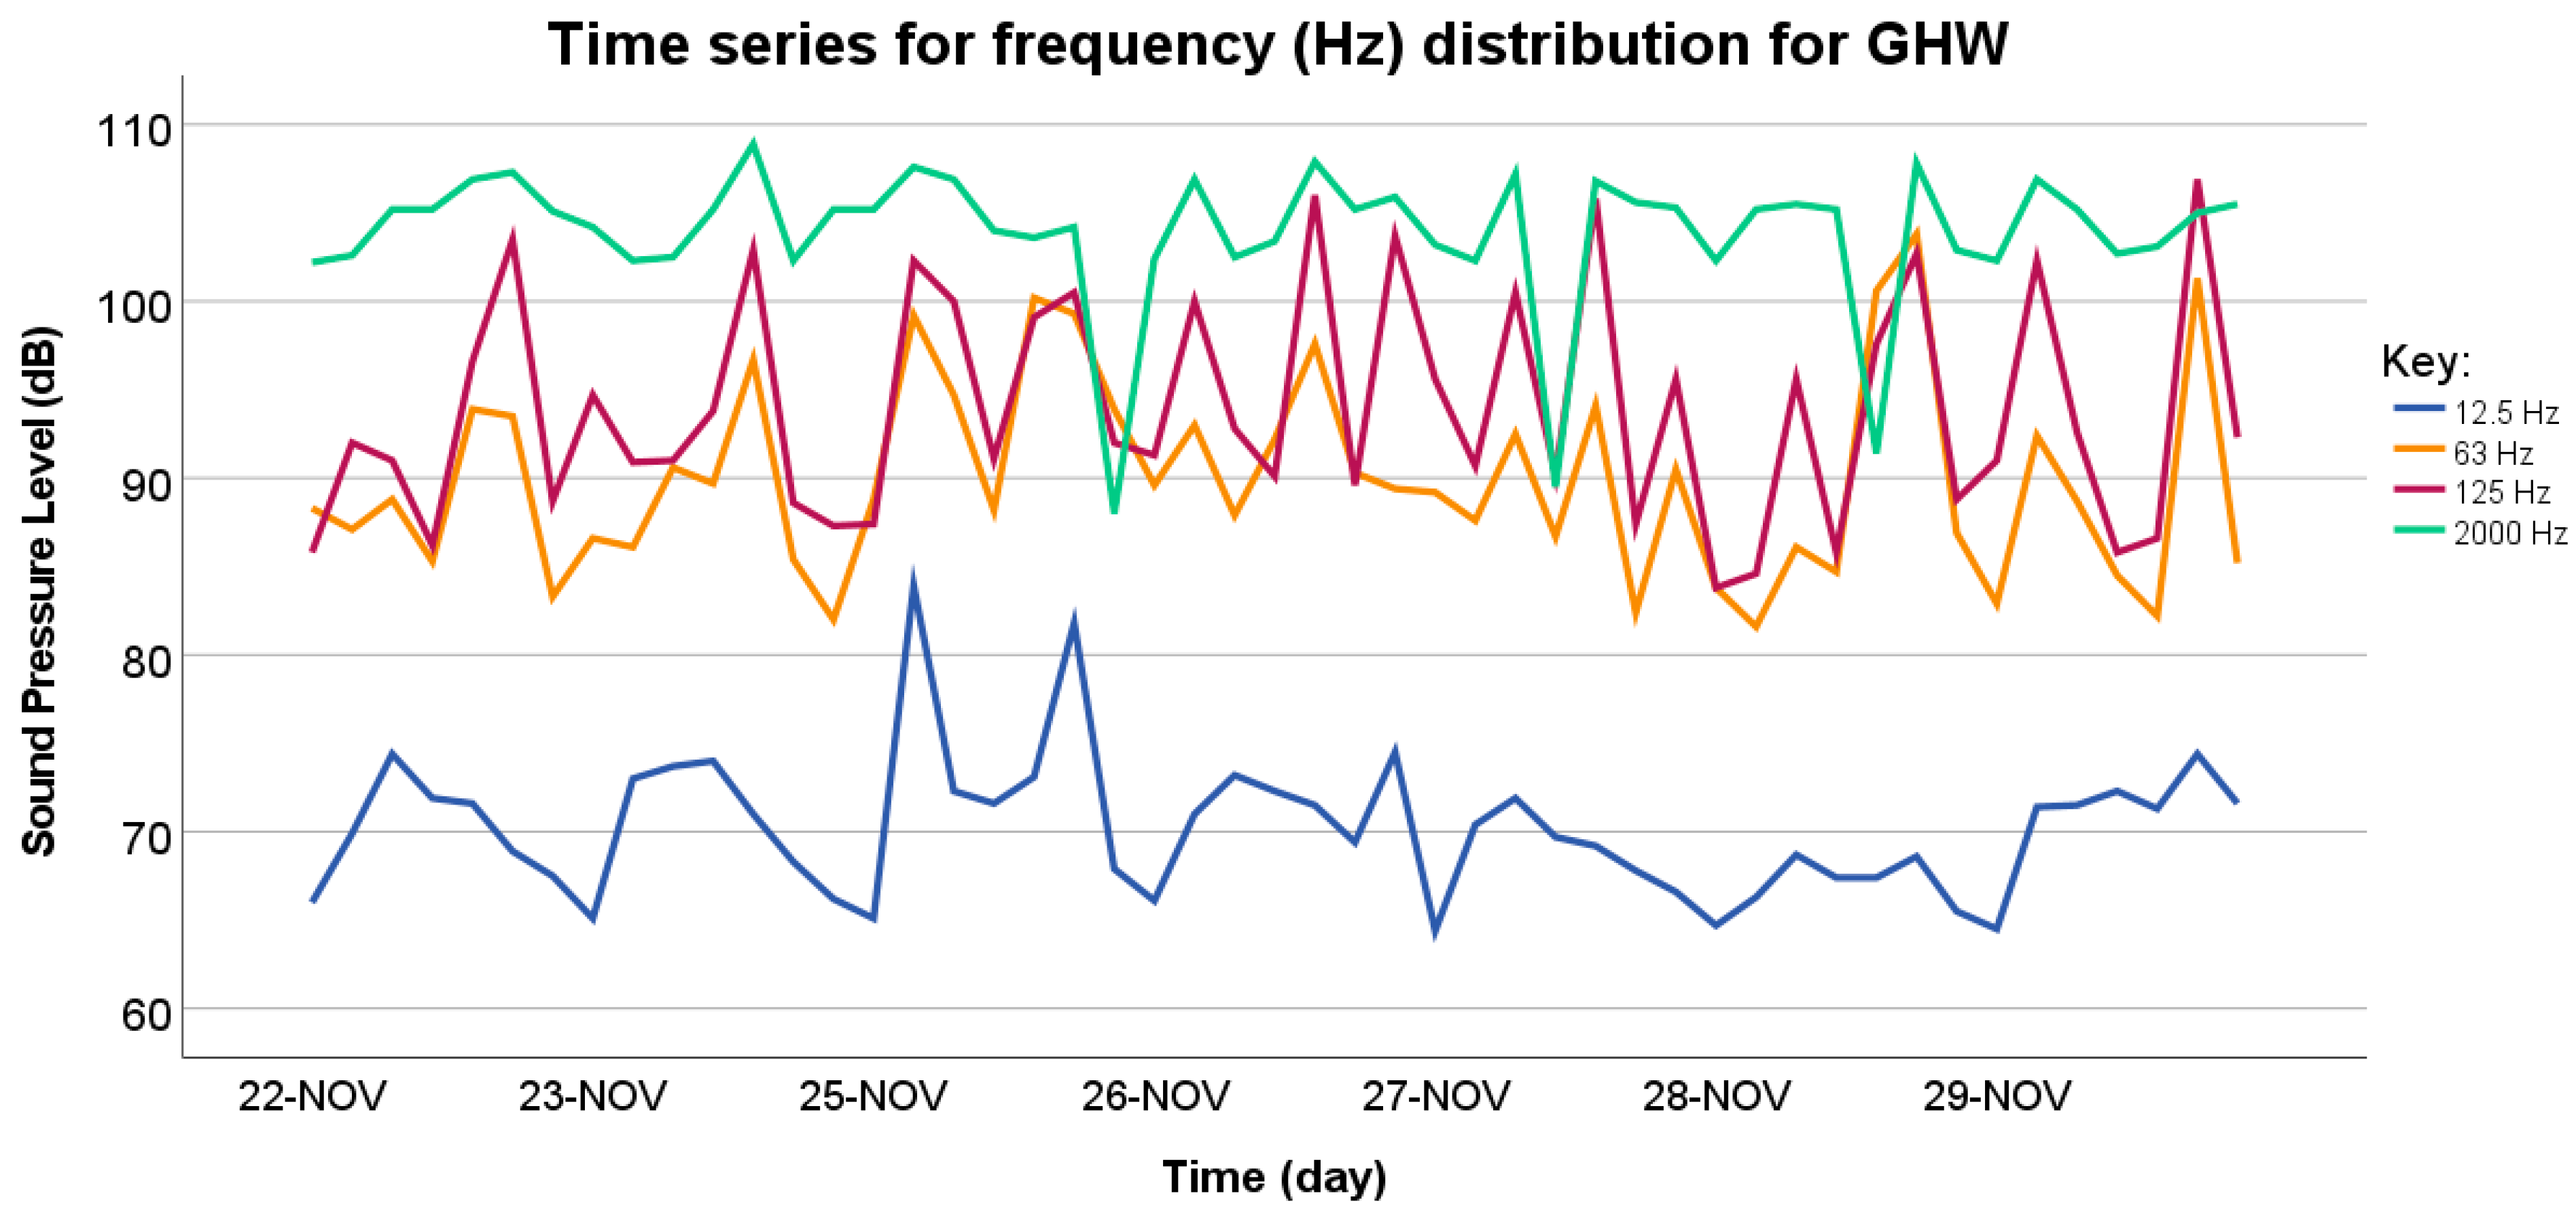
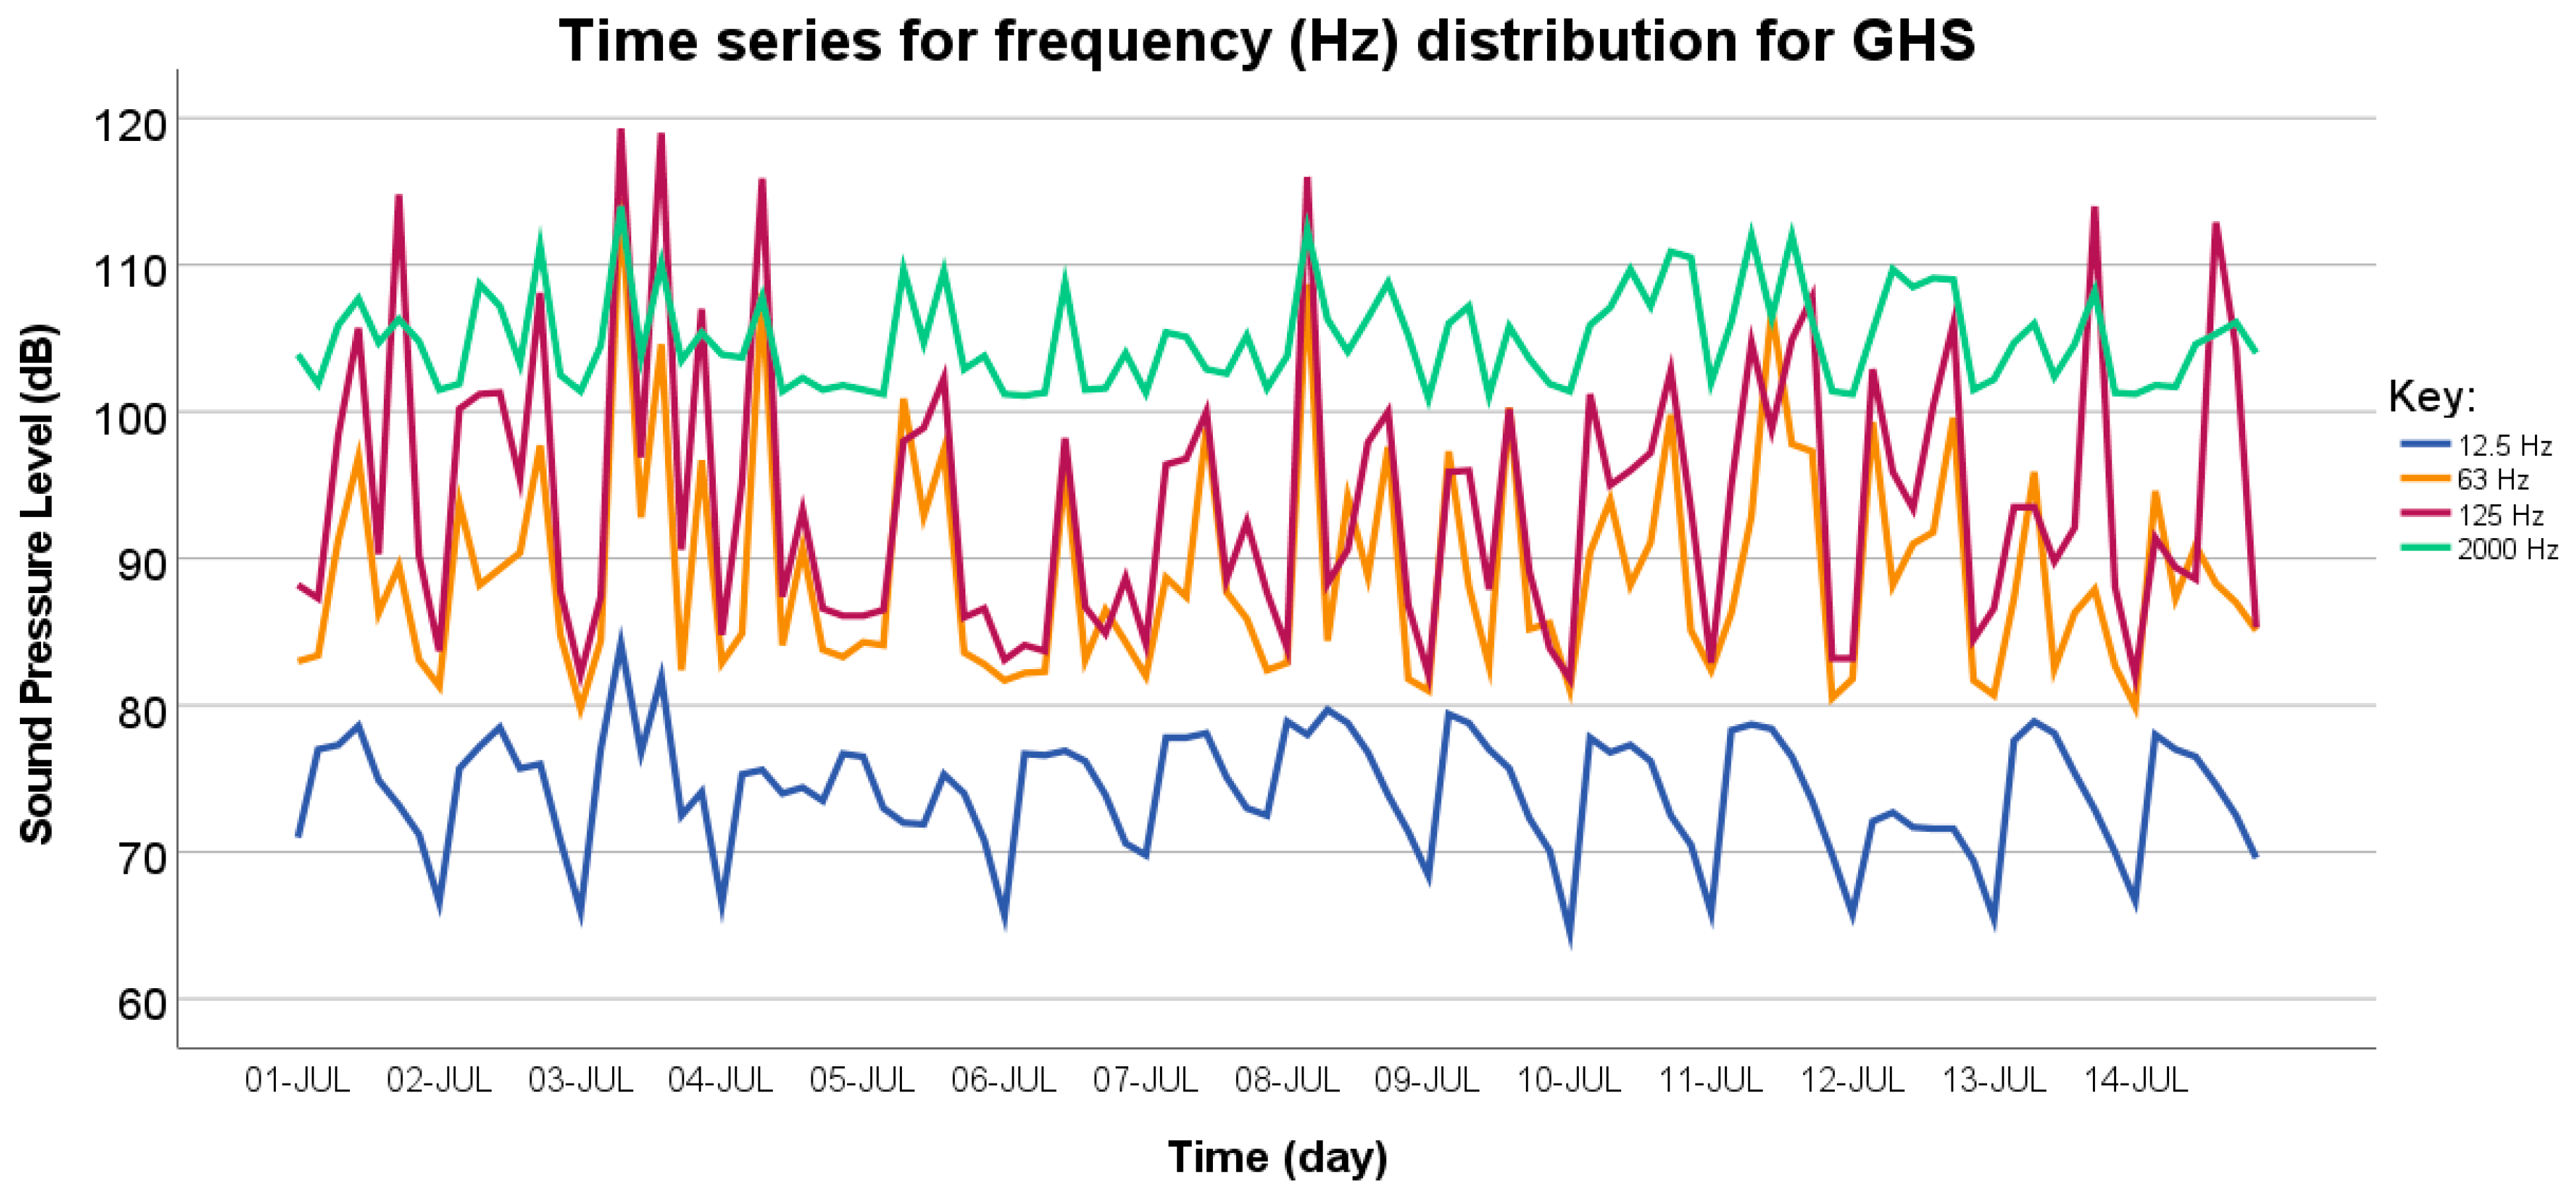
3.3. The Grand Harbour

Similarly to the PSD generated for the Cirkewwa dataset, the Grand Harbour dataset also yielded intense SPL values for the lower-ranging frequencies, with the PSD in Figure 14 displaying a range of 107 dB/Hz to 110 dB/Hz for the frequencies under 200 Hz.
The average SPLs for the 63 Hz and 125 Hz recorded for the GHS dataset were 89.1 dB and 94.1 dB, respectively (Table 4), with the latter frequency of 125 Hz exceeding the 100 dB mark by 18.43% in comparison to the emission of 63 Hz at this site (Figure 15). No significant difference is observable between the GHS and GHW audio data for any of the frequencies investigated. This might be suggestive of maritime activity levels having reduced to winter-time levels during the COVID-19 pandemic. Moreover, the temporal and contextual differences under which the audio data were collected does not provide for an accurate representation of the underwater soundscape at the harbour.
The time series of all of the monitored frequencies for the GHS dataset are shown in Figure 15 and display interesting prominent peaks for 63 Hz and 125 Hz measuring at 114.6 dB and 119.3 dB, respectively, on Friday 3 July 2020 at 9 a.m. and again on Saturday 4th July, also at 9 a.m., reaching 108.1 dB and 115.9 dB for 63 Hz and 125 Hz accordingly.
Figure 16 provides further insight on the frequency intensities and signatures for 3rd July at 9 a.m., which illustrates a sudden increase in SPL for lower-ranging frequencies (<1000 Hz) between 09:03 and 09:04, signifying the passage of a vessel nearby the hydrophone. The ship type ‘36’ (Table 5) corresponds to ‘sailing vessel’ according to information provided by MarineTraffic.
Additional peaks in SPLs were recorded on Wednesday 8th and Tuesday 14th. Whilst the considerably high SPLs over the weekend may be associated with leisurely yacht usage, it is not as easy to explain those peaks reached during the weekdays, especially under the pandemic restrictions. Therefore, these high SPLs might be attributed to general harbour maintenance, such as dredging or otherwise might stem from impulsive underwater noise sources.
Figure 17 depicts the variation of underwater radiated frequency distribution for GHW per frequency observed, collected in November 2021. Overall, the underwater frequency distribution proved to be constant and moderately high throughout the week, with no noteworthy peaks or dips in SPL.

4. Discussion

The outcomes emerging from this study represent the first-ever published investigation into underwater continuous noise levels within Maltese nearshore waters. This preliminary study reveals the alarming state of the marine acoustic environment with regards to low frequency, continuous noise emissions at Ċirkewwa and the Grand Harbour. Underwater acoustic data collected in July 2020, November 2021, and June 2022 reveal that both sites are characterised with noisy underwater soundscapes owing to the intense utilisation of these ports by passenger ferries and for the transportation of cargo, respectively.
Despite marginal variations in SPL levels, the Grand Harbour ultimately yielded overall higher SPL values in July 2020. Power spectral density analysis further highlighted the higher intensity of the lower-ranging frequencies over higher frequencies. In fact, the Grand Harbour summer dataset produced an approximate PSD of circa 110 dB/Hz for 63 Hz and 125 Hz, and Ċirkewwa returning PSDs for these TOBs of between 105 dB/Hz and 110 dB/Hz. This directly reflects the pertinence of monitoring and mitigating low frequencies emitted by the passenger, cargo, and sailing vessels denoted as ship types 60, 70 and 36, respectively, according to information provided by MarineTraffic. With both sites exhibiting high SPLs and PSDs for 63 Hz and 125 Hz, frequencies which have been proven to interfere with marine biophony, the need for low-frequency, continuous UNP to be regulated and monitored in accordance with GES targets within the MSFD, has become more acute and urgent.
Whilst this preliminary investigation, serving as a ‘snapshot’ analysis, may not be representative of the entirety of the Maltese coastal waters, it provides valuable insight into the state of the national marine soundscape. Despite this, the information revealed in this work may still be used as suggestive data and may help in extrapolating the state of other busy harbours and marine areas in Malta. For instance, the Grand Harbour site may be potentially considered as a proxy for other busy harbour sites, such as the cargo-handling Freeport in the southern Maltese town of Birżebbuġa, which were not explored in the current study. Moreover, with the July 2020 GHS data being collected during the COVID-19 pandemic restrictions, the state of the marine acoustic environment from this site must be especially considered as indicative data. A comprehensive baseline study of the Maltese marine acoustic environment and the identification of trends in underwater noise levels across sites and seasons is left as future work. Additional parameters such as the temperature, salinity, and the bathymetry, which may have influenced sound propagation, may also be analysed while recording underwater noise with more than one hydrophone deployed in parallel, in different sites.
Furthermore, although the Grand Harbour proved to have higher SPL and PSD values in comparison to the two other datasets analysed, this does not serve as an accurate representation of the underwater soundscape. This is due to the COVID-19 pandemic restrictions on tourism and subsequently cruise liner activity in the Harbour which were imposed at the time of data collection. Therefore, this raises concerns of a more intense and noisier underwater environment under normal operating conditions. Additionally, despite the Ċirkewwa site being categorised as a marine Natura 2000 site by virtue of the Habitats and the Birds Directives, the high values for the recorded SPLs expose the lack of effective environmental management of this site and stresses the urgency for addressing UNP as a major national threat to marine life.
Tackling the issue of UNP requires a collaborative effort across stakeholders and policymakers in order to identify and address its multifaceted roots, and further collaboration is needed to address UNP in the broader context of the Mediterranean Sea. Whilst relevant efforts have been documented in the past, such as the QUIETMED project in the Mediterranean, which focused on impulsive UNP falling under Descriptor 11.1 of the 2017 EU Commission Decision, the current suggested measures, aimed towards mitigating and reducing continuous low-frequency shipping noise, do not seem to match the scale of the known ecological impacts of UNP.

5. Conclusions

The main aim of this work was to provide a broad-brush and preliminary characterisation and assessment of the quality of the Maltese soundscape by analysing audio data collected from two highly utilised ports: Ċirkewwa and the Grand Harbour. Data analysis was conducted via a novel software, dBWav by Marshall Day Acoustics, which is specifically designed for efficiently conducting Fast Fourier Transform and power spectral density analyses. The results obtained concluded that the Maltese marine acoustic environment is in a sub-optimal condition and aspire to encourage the national competent authorities to appropriately allocate resources in order to stay on track in achieving ‘Good Ecological Status’ as stipulated by the MSFD. Whilst transnational efforts are being made across European waters, significant progress is yet to be made in order to safeguard the state of our shared and valued marine biodiversity.

Author Contributions

Conceptualization, A.G., A.D. and J.M.F.; methodology, A.G. and J.M.F.; formal analysis, J.M.F.; investigation, J.M.F.; resources, A.D. and A.G.; data curation, J.M.F.; writing—original draft preparation, J.M.F.; writing—review and editing, J.M.F., A.G., A.D., G.R. and S.V.; visualization, J.M.F.; supervision, A.G.; project administration, A.D.; funding acquisition, A.D. All authors have read and agreed to the published version of the manuscript.

Funding

This research was supported by the projects CORALLO and SenHAR, funded by the Interreg Italia-Malta 2014–2020 Programme II.

Institutional Review Board Statement

Not applicable.

Informed Consent Statement

Not applicable.

Data Availability Statement

All data are available upon request.

Acknowledgments

This work has been partially supported by MarineTraffic.

Conflicts of Interest

The authors declare no conflict of interest.

References

  1. Buscaino, G.; Ceraulo, M.; Pieretti, N.; Corrias, V.; Farina, A.; Filiciotto, F.; Maccarrone, V.; Grammaua, R.; Caruso, F.; Giuseppe, A.; et al. Temporal patterns in the soundscape of the shallow waters of a Mediterranean marine protected area. Sci. Rep. 2016, 6, 34230. [Google Scholar] [CrossRef] [PubMed]
  2. Merchant, N.D.; Putland, R.L.; André, M.; Baudin, E.; Felli, M.; Slabbekoorn, H.; Dekeling, R. A decade of underwater noise research in support of the European Marine Strategy Framework Directive. Ocean Coast. Manag. 2022, 228, 106–299. [Google Scholar] [CrossRef] [PubMed]
  3. Pieretti, N.; Lo Martire, M.; Corinaldesi, C.; Musco, L.; Dell’Anno, A.; Danovaro, R. Anthropogenic noise and biological sounds in a heavily industrialized coastal area (Gulf of Naples, Mediterranean Sea). Mar. Environ. Res. 2020, 159, 105002. [Google Scholar] [CrossRef] [PubMed]
  4. Chang, Y.-C.; Zhang, X. Legal Issues Concerning the Impact of Anthropogenic Underwater Noise in the Marine Environment. Sustainability 2021, 13, 4612. [Google Scholar] [CrossRef]
  5. Southall, B.L.; Scholik-Schlomer, A.; Hatch, L.; Bergmann, T.; Jasny, M.; Metcalf, K.; Weilgart, L.; Wright, A.J. Underwater Noise from Large Commercial Ships—International Collaboration for Noise Reduction. In Encyclopedia of Maritime and Offshore Engineering; 2017; pp. 1–9. Available online: https://onlinelibrary.wiley.com/doi/full/10.1002/9781118476406.emoe056 (accessed on 29 April 2023).
  6. Fraschetti, S.; Pipitone, C.; Mararis, A.D.; Rilov, G.; Badalamenti, F.; Bevilacqua, S.; Claudet, J.; Carić, H.; Dahl, K.; D’Anna, G.; et al. Light and shade in marine conservation across European and contiguous seas. Front. Mar. Sci. 2018, 5, 420. [Google Scholar] [CrossRef]
  7. Directive 2008/56/EC of the European Parliament and of the Council of 17 June 2008 Establishing a Framework for Community Action in the Field of Marine Environmental Policy (Marine Strategy Framework Directive). Available online: https://eur-lex.europa.eu/legal-content/EN/TXT/PDF/?uri=CELEX:02008L0056-20170607&from=PL (accessed on 17 April 2023).
  8. Diviacco, P.; Nadali, A.; Iurcev, M.; Burca, M.; Carbajales, R.; Gangale, M.; Busato, A.; Brunetti, F.; Grio, L.; Viola, A.; et al. Underwater noise monitoring with real-time and low-cost systems (The CORMA experience). J. Mar. Sci. Eng. 2021, 9, 390. [Google Scholar] [CrossRef]
  9. Commission Decision (EU) 2017/848 on Laying Down Criteria and Methodological Standards on Good Environmental Status of Marine Waters and Specifications and Standardised Methods for Monitoring and Assessment, and Repealing Decision 2010/477/EU (2017) Official Journal of the European Union L125. Available online: https://eur-lex.europa.eu/legal-content/EN/TXT/PDF/?uri=CELEX:32017D0848 (accessed on 3 March 2023).
  10. Dekeling, R.P.A.; Tasker, M.L.; Van der Graaf, A.J.; Ainslie, M.A.; Andersson, M.H.; André, M.; Borsani, J.F.; Brensing, K.; Castellote, M.; Cronin, D.; et al. Monitoring Guidance for Underwater Noise in European Seas, Part II: Monitoring Guidance Specifications; Publications Office of the European Union: Luxembourg, 2014. [Google Scholar]
  11. European Marine Safety Agency (EMSA). Sounds: Status of Underwater Noise from Shipping; European Maritime Safety Agency: Lisbon, Portugal, 2021. [Google Scholar]
  12. Li, N.; Zhu, H.; Wang, X.; Xiao, R.; Xue, Y.; Zheng, G. Characteristics of very low frequency sound propagation in full waveguides of shallow water. Sensors 2020, 21, 192. [Google Scholar] [CrossRef]
  13. Erbe, C.; Marley, S.A.; Schoeman, R.P.; Smith, J.N.; Trigg, L.E.; Embling, C.B. The effects of ship noise on marine mammals—A review. Front. Mar. Sci. 2019, 6, 606. [Google Scholar] [CrossRef]
  14. Erbe, C.; Duncan, A.; Vigness-Raposa, K.J. Introduction to sound propagation under water. In Exploring Animal Behaviour through Sound: Volume 1; Erbe, C., Thomas, J.A., Eds.; Springer: Cham, Switzerland, 2022; pp. 185–216. [Google Scholar]
  15. Oloruntobi, O.; Mokhtar, K.; Gohari, A.; Asif, S.; Chuah, L.F. Sustainable transition towards greener and cleaner seaborne shipping industry: Challenges and opportunities. Clean. Eng. Technol. 2023, 13, 100628. [Google Scholar] [CrossRef]
  16. Smith, T.A.; Rigby, J. Underwater radiated noise from marine vessels: A review of noise reduction methods and technology. Ocean Eng. 2022, 266, 112863. [Google Scholar] [CrossRef]
  17. Schlacke, S.; Maier, N.; Markus, T. Legal implementation of integrated ocean policies: The EU’s marine strategy framework directive. Int. J. Mar. Coast. Law 2011, 26, 59–90. [Google Scholar] [CrossRef]
  18. Gorjanc, S.; Klančnik, K.; Papadopoulou, N.K.; Murillas-Maza, A.; Jarni, K.; Paramana, T.; Pavičić, M.; Ronchi, F.; Uyarra, M.C.; Koren, Š.; et al. Evaluating the progress in achieving Good Environmental Status in the Mediterranean: A methodology to assess the effectiveness of Marine Strategy Framework Directive’s Programmes of Measures. Mar. Policy 2022, 136, 104889. [Google Scholar] [CrossRef]
  19. Katsanevakis, S.; Coll, M.; Fraschetti, S.; Giakoumi, S.; Goldsborough, D.; Mačić, V.; Mackelworth, P.; Rilov, G.; Stelzenmüller, V.; Albano, P.G.; et al. Twelve recommendations for advancing marine conservation in European and contiguous seas. Front. Mar. Sci. 2020, 7, 879. [Google Scholar] [CrossRef]
  20. Rife, A.N.; Erisman, B.; Sanchez, A.; Aburto-Oropeza, O. When good intentions are not enough … Insights on networks of “paper park” marine protected areas. Conserv. Lett. 2012, 6, 200–212. [Google Scholar] [CrossRef]
  21. Perry, A.L.; Blanco, J.; García, S.; Fournier, N. Extensive use of habitat-damaging fishing gears inside habitat-protecting marine protected areas. Front. Mar. Sci. 2022, 9, 811926. [Google Scholar] [CrossRef]
  22. La Manna, G.; Picciulin, M.; Crobu, A.; Perretti, F.; Ronchetti, F.; Manghi, N.; Ruiu, A.; Ceccherelli, G. Marine soundscape and fish biophony of a Mediterranean marine protected area. PeerJ 2021, 9, e12551. [Google Scholar] [CrossRef]
  23. Coll, M.; Piroddi, C.; Steenbeek, J.; Kaschner, K.; Lasram, F.B.R.; Aguzzi, J.; Ballesteros, E.; Bianchi, C.N.; Corbera, J.; Dailianis, T.; et al. The biodiversity of the Mediterranean Sea: Estimates, patterns, and threats. PLoS ONE 2010, 5, e11842. [Google Scholar] [CrossRef]
  24. Plan Bleu. Maritime Transport in the Mediterranean: Status and Challenges; Plan Bleu: Marseille, France, 2021. [Google Scholar]
  25. United Nations Conference on Trade and Development (UNCTAD). Review of Maritime Transport 2021; United Nations Publications: Geneva, Switzerland, 2021. [Google Scholar]
  26. Dailianis, T.; Smith, C.J.; Papadopoulou, N.; Gerovasileiou, V.; Sevastou, K.; Bekkby, T.; Bilan, M.; Billett, D.; Boström, C.; Carreira-Silva, M.; et al. Human activities and resultant pressures on key European marine habitats: An analysis of mapped resources. Mar. Policy 2018, 98, 6. [Google Scholar] [CrossRef]
  27. Maccarrone, V.; Filiciotto, F.; De Vincenzi, G.; Mazzola, S.; Buscaino, G. An Italian proposal on the monitoring of underwater noise: Relationship between the EU Marine Strategy Framework Directive (MSFD) and marine spatial planning directive (MSP). Ocean Coast. Manag. 2015, 118, 215–224. [Google Scholar] [CrossRef]
  28. Cavallo, M.; Elliott, M.; Touza, J.; Quintino, V. Benefits and impediments for the integrated and coordinated management of European seas. Mar. Policy 2017, 86, 206–213. [Google Scholar] [CrossRef]
  29. Rodrigo, F.J.; Ramis, J.; Carbajo, J.; Poveda, P. Underwater anthropogenic noise pollution assessment in shallow waters on the south-eastern coast of Spain. J. Mar. Sci. Eng. 2022, 10, 1311. [Google Scholar] [CrossRef]
  30. Environment and Resources Authority (ERA). Marine Strategy Framework Directive (2008/56/EC) Malta’s Program of Measures: Summary Report; Environment and Resources Authority: Marsa, Malta, 2017. [Google Scholar]
  31. Paramana, T.; Katsouras, G.; Dassenakis, M. Assessing the first MSFD implementation cycle in Greece under biodiversity and contaminants descriptors. Water 2021, 13, 3547. [Google Scholar] [CrossRef]
  32. National Statistics Office (NSO). Transport Statistics 2021—Reference Year: 2020; National Statistics Office: Valletta, Malta, 2021; p. 58. [Google Scholar]
  33. Environment and Resources Authority (ERA). Conservation Objectives and Measures for Malta’s Marine Natura 2000 Sites; Environment and Resources Authority: Marsa, Malta, 2023. [Google Scholar]
  34. Environment and Resources Authority (ERA). Natura 2000 Standard Data Form; Environment and Resource Authority: Marsa, Malta, 2019. [Google Scholar]
  35. Council Directive 92/43/EEC of 21 May 1992 on the Conservation of Natural Habitats and of Wild Fauna and Flora. Available online: https://eur-lex.europa.eu/legal-content/EN/TXT/PDF/?uri=CELEX:31992L0043 (accessed on 7 February 2023).
  36. Environment and Resources Authority (ERA), Marine Protected Areas. Available online: https://era.org.mt/topic/marine-protected-areas-2/ (accessed on 29 April 2023).
  37. Martin, K.J.; Alessi, S.C.; Gaspard, J.C.; Tucker, A.D.; Bauer, G.B.; Mann, D.A. Underwater hearing in the loggerhead turtle (Caretta caretta): A comparison of behavioral and auditory evoked potential audiograms. J. Exp. Biol. 2012, 215, 3001–3009. [Google Scholar] [CrossRef]
  38. Environment and Resources Authority (ERA). Monitoring Factsheet: Underwater Noise; Environment and Resources Authority: Marsa, Malta, 2015. [Google Scholar]
  39. MarineTraffic—Global Ship Tracking Intelligence. Available online: www.marinetraffic.com (accessed on 9 May 2023).
  40. Skarsoulis, E.; Piperakis, G.; Prospathopoulos, A.; Makropoulos, D. Prediction of shipping noise in range-dependent environments. J. Mar. Sci. Eng. 2023, 11, 290. [Google Scholar] [CrossRef]
  41. Malinka, C.; Atkins, J.; Johnson, M.; Tønnesen, P.; Dunn, C.; Claridge, D.; Aguilar de Soto, N.; Madsen, P. An autonomous hydrophone array to study the acoustic ecology of deep-water toothed whales. Deep Sea Res. Part I Oceanogr. Res. Pap. 2020, 158, 103233. [Google Scholar] [CrossRef]
  42. Sakai, M.; Haga, R.; Tsuchiya, T.; Akamatsu, T.; Umeda, N. Statistical analysis of measured underwater radiated noise from merchant ships using ship operational and design parameters. J. Acoust. Soc. Am. 2023, 154, 1095–1105. [Google Scholar] [CrossRef] [PubMed]
  43. Lagrois, D.; Chion, C.; Sénécal, J.; Kowalski, C.; Michaud, R.; Vergara, V. Avoiding sharp accelerations can mitigate the impacts of a Ferry’s radiated noise on the St. Lawrence whales. Sci. Rep. 2022, 12, 12111. [Google Scholar] [CrossRef]
  44. Marshall Day Acoustics. dBWav Version 1.3.4; Marshall Day Acoustics: Auckland, New Zealand, 2019. [Google Scholar]
Figure 1. Ship traffic density of the Mediterranean Sea, highlighting the location of the Maltese Islands as an area experiencing over 1497 k routes on a yearly basis. The location of both sites of interest for this study are also shown: Ċirkewwa and the Grand Harbour.
Jmse 11 02163 g001
Figure 2. Map of the Maltese Islands, its bathymetry and the sites of interest of this study demarcated by a 12 km diameter buffer zone to facilitate processing of AIS data.
Jmse 11 02163 g002
Figure 3. Map illustrating MPAs and SACs in Maltese waters [36].
Jmse 11 02163 g003
Figure 4. Ship traffic density around Malta. Colour bar on the right corresponds to the usage intensity of vessel passage, emphasising the high marine traffic experienced at the sites of interest of this study. Image obtained from Marine Traffic [39].
Jmse 11 02163 g004
Figure 5. (a) Image of SoundTrap ST300 hydrophone used; (b) Image of the hydrophone deployed on seafloor in Ċirkewwa, amidst the Posidonia meadows.
Jmse 11 02163 g005
Figure 6. Maps showing the sites of data collection: (a) Ċirkewwa, (b) the Grand Harbour. Maps produced on QGIS 3.16. The 12 km buffer zones were defined arbitrarily and used to facilitate ship type identification through AIS data.
Jmse 11 02163 g006
Figure 7. Screen capture displaying dBWav software interface. Image showing calibrated wave file uploaded to the software.
Jmse 11 02163 g007
Figure 8. Superimposed time series for the Ċirkewwa and GHS audio data. Key found on top right corner.
Jmse 11 02163 g008
Figure 9. Superimposed time series for GHS and GHW. Gap in GHW data due to corrupted wavefiles.
Jmse 11 02163 g009
Figure 10. Histograms illustrating the distribution of SPLs (dB) per dataset, organised as follows: (ac); SPL distribution for 12.5 Hz; (df); SPL distribution for 63 Hz; (gi); SPL distribution for 125 Hz; (jl); SPL distribution for 2000 Hz.
Jmse 11 02163 g010aJmse 11 02163 g010b
Figure 11. PSD for audio data collected in Ċirkewwa June 2022.
Jmse 11 02163 g011
Figure 12. Time series for frequency distribution of audio data collected in Ċirkewwa, June 2022.
Jmse 11 02163 g012
Figure 13. Spectrogram of audio data recorded on 10 June 2022 at 6 a.m., displaying the variation in SPL intensity of different frequencies with time. Two strong sources around 140 dB can be seen when vessels passed by the hydrophone at 06:06:58 and 06:07:01.
Jmse 11 02163 g013
Figure 14. PSD of GHS audio data collected in July 2020.
Jmse 11 02163 g014
Figure 15. Time series for GHS audio data collected in July 2020.
Jmse 11 02163 g015
Figure 16. Spectrogram of GHS audio data recorded on 3 July 2020 at 9 a.m.
Jmse 11 02163 g016
Figure 17. Time series of GHW audio data collected in November 2021.
Jmse 11 02163 g017
Table 1. 1/3 octave band average levels calculated for Ċirkewwa, GHS, and GHW datasets for the 12.5 Hz, 63 Hz, 125 Hz, and 2000 Hz.
Frequency (Hz)Ċirkewwa (dB)GHS (dB)GHW (dB)
12.570.9 74.3 70.2
63.088.7 89.2 90.0
125.091.8 94.2 93.9
200095.6 105.0103.9
Table 2. Overview of SPL dataset for Ċirkewwa.
Frequency (Hz)Min. (dB)Max. (dB)Mean (dB)Std. Deviation (dB)
12.55910570.99.9
6376.7116.188.79.1
12575.6116.691.89.1
200090.8108.595.62.7
Table 3. Ship hash and corresponding ship type data for vessels passing within the 12 km buffer zone on the 10 June 2022, at 6 a.m. and 9 a.m., when high SPL levels were recorded.
Ship HashShip TypeTimestampLongitudeLatitude
70ef36683b1c429c949c7f809ade705d82f22629edaf68244f0f41d1552b52b46010 June 2022 05:5414.3296346735.98947906
70ef36683b1c429c949c7f809ade705d82f22629edaf68244f0f41d1552b52b46010 June 2022 06:1514.3296365735.98946762
70ef36683b1c429c949c7f809ade705d82f22629edaf68244f0f41d1552b52b46010 June 2022 09:0014.329955135.98982239
be7c52d83c37ee9ca20f0ef7850533e172ca4fccb88b52d49a29f459b36f686e7010 June 2022 09:0314.3298683235.98926544
Table 4. Overview of SPL (dB) datasets for GHS and GHW.
Site and Frequency (Hz)Min. (dB)Max. (dB)Mean (dB)Std. Deviation (dB)
GHS 12.564.684.274.24.0
GHS 6379.8114.689.17.3
GHS 12581.8119.394.19.3
GHS 2000100.9114.0104.93.2
GHW 12.564.483.970.24.0
GHW 6381.6103.890.05.6
GHW 12583.8106.993.96.4
GHW 200088.0108.9103.94.1
Table 5. Ship hash and corresponding ship type data for vessels passing within the 12 km buffer zone on the 3 July 2020, at circa 9 a.m., when high SPL levels were recorded.
Ship HashShip TypeTimestampLongitudeLatitude
263f8e5958a94c15dcdcf259227fa1ccd25e4929b702630f7b6840f06a3af147363 July 2020 08:53:0014.5229463635.90517807
02eb631cd4899a949ad088b2f08fd049660ab67623eb37ee07f284b3fa37358c363 July 2020 09:0714.5238485335.90645218
Disclaimer/Publisher’s Note: The statements, opinions and data contained in all publications are solely those of the individual author(s) and contributor(s) and not of MDPI and/or the editor(s). MDPI and/or the editor(s) disclaim responsibility for any injury to people or property resulting from any ideas, methods, instructions or products referred to in the content.

