1. Introduction
Major impacts derived from climate change are expected in Europe in the coming decades. Particularly, coastal flood risk is projected to increase strongly in Europe due to global warming [
1]. Extreme sea levels (ESLs) are expected to unprecedentedly rise in the frequency of catastrophic coastal flooding events [
2]. For a business-as-usual IPCC scenario (RCP8.5), it has been estimated that by 2100, 0.5–0.7% of the world’s coastal areas will be at risk of episodic coastal flooding from a 1 in 100 yr return period event, impacting 2.5–4.1% of the world’s population and threatening assets worth up to 12–20% of global GDP [
3]. In fact, coastal flood risk will increase in all European countries with a coastline, with France, the UK, Italy, and Denmark showing the highest absolute increase in coastal flood risk by the end of the century [
1].
This continuous rise in sea levels along Europe’s coastlines derived from global warming could result in unprecedented coastal flood losses, in case no additional coastal protection and risk-reduction measures are implemented [
4]. Even if adaptation measures implemented can keep current flood probabilities constant, overall losses from coastal flooding will increase to USD 60–63 billion per year by 2050, due to the effects of coastal subsidence and mean sea level rise [
5]. In Europe, the current expected annual number of people exposed (EAPE) to coastal flooding is 102,000, and this number is projected to reach 1.52–3.65 million by the end of the century [
4].
Globally, the coastline is characterized by a high population density and significant socio-economic activity, as well as the presence of multiple critical infrastructures (CI) [
2]. In this context, multiple international organizations have established a main goal to increase resilience by 2030. The Sendai Framework for Disaster Risk Reduction 2015–2030 [
6] aims to achieve “the substantial reduction of disaster risk and losses in lives, livelihoods and health and in the economic, physical, social, cultural and environmental assets of persons, businesses, communities and countries”. Specifically, “the substantial reduction of disaster damage to critical infrastructure and disruption of basic services, developing their resilience by 2030” [
6], is defined as a critical objective.
Despite this objective, a review of the existing literature shows that there are still important gaps in the analysis of the climate risk over CI. There is a limited number of studies in the current state of the art that have studied the risk of CI to natural hazards [
7], mostly devoted to local case studies [
8,
9]. Addressing CI risk to coastal flooding all along the European coast has been considered of vital importance, identifying qualitatively and quantitatively the increase when considering the consequences of CI failure and disruption on the population. Nevertheless, most studies still underestimate risk, not considering the possible indirect impacts that could arise outside the directly flooded area, resulting in suboptimal decision processes [
10]. Qiang [
11] performed an analysis of CI at the national level, but only considered the exposure and not the risk, and Amer et al. [
12] proposed a methodology for measuring resilience, as a component of vulnerability.
Some authors [
13,
14,
15] have identified the lack of studies that address the indirect impacts of a natural hazard by applying complex conceptual frameworks to real-world situations, beyond the well-established methods to determine CI risk and the direct impacts of coastal flooding. Currently, most climate change adaptation plans focus on what adaptation measures and investment proposals are required, considering that the population of certain cities (such as Genoa, Edinburgh, Patra, Thessaloniki, Tromsø, etc.), do not suffer and will not suffer in the future and for the different RCP-SSPs scenarios any risk derived from coastal flooding and, therefore, do not require the implementation of climate adaptation actions. This study tries to highlight the existence of indirect risks on the population of European coastal cities derived from the damages or stop of operations in their CI and the loss of the services they provide, such as energy supply, transport services, or water treatment.
The aim of this study is to develop a new methodology to quantify the risk level of the population to natural hazards when CI is affected, and the risk increases as a consequence of climate change-related impacts. This research focuses on the frequent underestimation of risk that occurs in analyses of climate change impacts, particularly from natural hazards such as coastal flooding, when the service provided by CI within the flooded area is not considered. In fact, many regional climate change adaptation plans develop risk analysis and adaptation and mitigation strategies considering only direct risk, but not the population indirectly affected by potential CI disruption.
The proposed approach intends to analyze CI risk not from the conventional point of view, which considers exclusively the damage to the infrastructure itself, but from the consideration of the consequences of CI failure on the population, as the main element exposed and vulnerable to climate change-induced risk. Therefore, this study presents a risk analysis considering European CI and potential direct and indirect risks caused by coastal flooding, with the aim of achieving a better understanding of the impacts of this climatic hazard on CI, which is essential for achieving community resilience [
16].
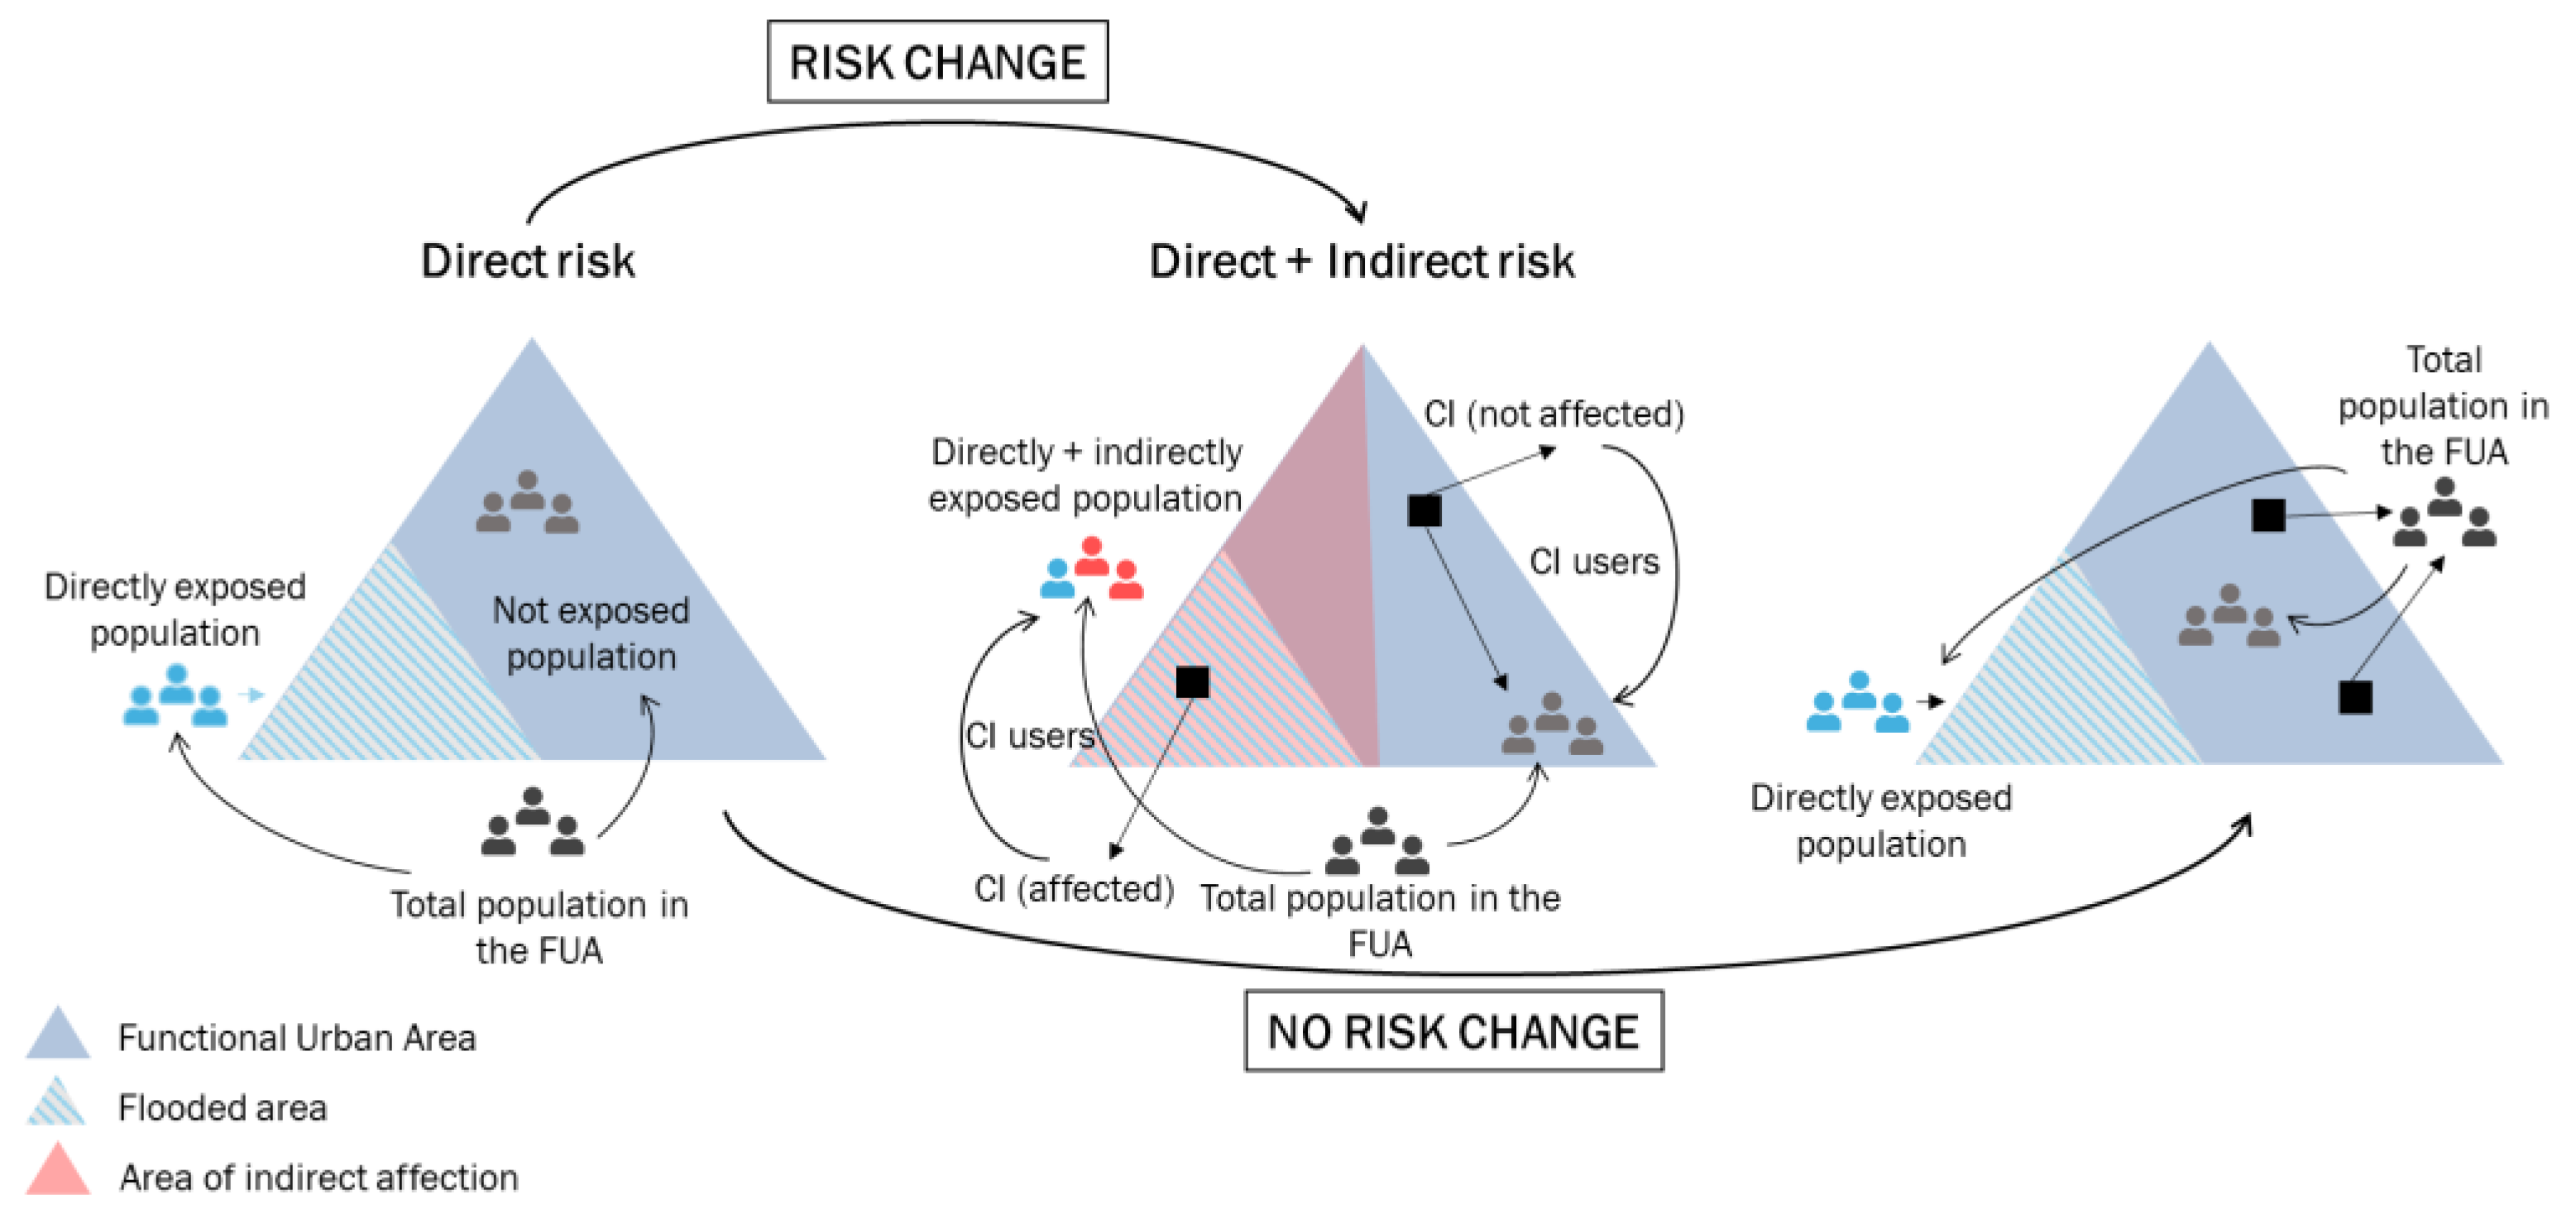
Direct and indirect impacts of coastal flooding considering the affected CI will be quantified in terms of socio-economic damage, i.e., people potentially affected. In this context, direct impacts are those on people who are directly affected by the flood, estimated from the population density in the area spatially covered by the flood maps used. Generally, these are people living in the affected areas. Indirect impacts, on the other hand, are impacts on the population that, whether or not they are located in the space determined by the flood maps as an area affected by coastal flooding, are indirectly impacted by the disruption of the normal functioning of CI which, due to their location in flood-prone areas, have been disturbed.
To the best of our knowledge, there is no similar study in the literature that analyses the risk derived from CI on the European coastal population and, moreover, addresses the effects of indirect risk, considering not only the population directly affected by coastal flood risks, but also the indirect effects that may arise on infrastructures that provide a service to society, and its derived impacts on the population. Recent studies propose similar approaches, but at a more local and limited level [
14].
As a novelty, this study intends to apply the proposed approach at a higher scale, analyzing the risk of European CI affected by coastal flooding, based on the experienced increasing trend in the frequency and intensity of flooding events in Europe, and the even higher expected increase in the coming decades. This work intends to analyze if the risk of coastal flooding overpopulation in Europe is underestimated.
1.1. Critical Infrastructure
According to the Council Directive 2008/114/EC [
17], CIs are “assets, systems or parts thereof which are essential for the maintenance of societal functions, health, safety, security, economic or social well-being of people, and the disruption or destruction of which would have a significant impact as a result of the failure to maintain those functions”. These infrastructures are “the backbone of modern economies and societies” [
18] due to their fundamental role in the continued provision of goods and services, maintaining social well-being [
8].
Despite the lack of consensus in the literature on which infrastructures should be considered critical, the definition of CI has barely undergone substantial modifications in the existing literature. Serre & Heinzlef [
19] consider CI as “critical” since their potential destruction could weaken the defense and economic organization of a whole country. Some authors consider CI as “generators of vulnerabilities” since their location and dependencies might propagate risk across different geographical regions [
20].
Hence, it can be classified as CI all infrastructures related to transport, energy generation and distribution, water, industry, education, and health [
21], among other systems, and services that are critical to ensure the health, wealth, and security of a country [
17,
22]. Therefore, its essential role in society becomes clear when a situation of disaster or crisis occurs, when CI failure is more probable and, consequently, the disruption of daily functioning affects society [
23].
CI networks are vulnerable to multiple stressors that could interrupt their proper functioning [
24]. According to Rinaldi et al. [
22], a failure that happens to one infrastructure can, directly and indirectly, affect other(s), cause impacts in large geographic regions, and send ripples throughout the national and global economy. These failures can cause large-scale disruptive effects in the economy and society [
10,
25], but also in politics [
26].
Hence, a proper understanding of the behavior of a CI cannot be achieved considering itself as an element isolated from other infrastructures or the surrounding environment but evaluating the interconnections and interdependences in a holistic approach [
22]. Modern CI generally operates with a system-of-systems structure, in which interactions, interconnections, and interdependencies between the nodes predominate [
27,
28,
29,
30]. Generally, the literature considers four infrastructure interdependencies, first stated by Rinaldi et al. [
22]: physical, geographical, cyber, and logical. The dependencies and interdependencies between these infrastructure networks mean that failure can propagate between networks, with cascading effects [
10,
31,
32].
Therefore, interconnections between CI of different sectors arise, which are essential in the analysis as they give rise to cascade effects, increasing the possibility of magnifying the effects of a disruptive event, with its associated significant costs [
30]. Some studies about CI failure involve the representation of infrastructure interdependencies [
22], considering physical network connectivity failure, the disruption of services provision, and the impacts on the potential customers [
8,
29,
33,
34].
The lack of sufficient information to establish the connections and interdependencies between CI at the European scale is identified as an important source of uncertainty. Nevertheless, not considering interdependencies does not affect the relevance and scope of this study. The proposed approach focuses on presenting the underestimation when considering the indirect risk of CI on the population. Therefore, it is considered beyond the scope of the paper to analyze interconnections between CI sectors and interdependencies between CI.
1.2. CI Risk Analysis
The most common definition of risk is “the results from the interaction of hazards, exposure and vulnerability” [
35]. In this conceptual frame, hazard is considered “the potential occurrence of a natural or human-induced physical event or trend or physical impact that may cause loss of life or any kind of health impacts, as well as damage and loss to property, infrastructure, livelihoods, service provision, ecosystems, and environmental resources”; exposure is defined as “the presence of people, livelihoods, species or ecosystems, environmental functions, services and resources, infrastructure, or economic, social, or cultural assets in places and settings susceptible of being adversely affected”; and vulnerability, as one of the most controversial terms, is defined as “the propensity and predisposition to be adversely affected” [
35,
36,
37]. However, this last term also comprises a range of concepts and elements including “sensitivity or susceptibility to harm and lack of capacity to cope and adapt” [
35,
37].
In order to facilitate exposure analysis of CI, several authors have provided different CI spatial harmonized gridded datasets [
7,
21]. Some studies address the infrastructure exposure by developing different metrics to associate the number of users to each individual infrastructure asset, and conducting a hotspot analysis, by applying the Kernel density estimator [
33,
38]. Pant et al. [
8] quantify infrastructure flood impacts in terms of disrupted customers linked directly to flooded assets and customers disrupted indirectly due to network effects, at a regional scale. Others, however, do not consider the users associated with CI or the cascading effects and interrelations between CI and, instead, focus on the number of CI disrupted by flooding events, and make an analysis by applying statistical tools to identify clusters with a high CI exposure ratio as “hot spots” [
11]. These analyses provide a visual representation of exposure aided by a geospatial representation of “priority areas” for planners to focus on [
33].
CI as elements highly exposed to the increasing frequency and intensity of Extreme Weather Events (EWEs) and their effects [
39] can be affected directly (damage to strategic buildings such as power plants) or indirectly (interruption of services or loss of capability) [
40], resulting in direct and indirect impacts (and consequences), respectively. Some authors highlight the importance of distinguishing between impacts within and outside the areas affected by hazards [
8]. Previous studies have pointed out the benefits of substituting the conventional impact and risk assessments that tend to focus on the people and assets directly located in flood-prone areas, with an analysis based on the estimation of the potential disruption to infrastructure systems and the people and industries that they serve, determining the number of people dependent on the infrastructure assets and identifying concentrations of these critical assets [
8,
33]. The underestimation of risk, implicit in risk analysis that fails to consider impacts outside the area directly affected by a hazard, can lead to poor investment decisions [
10].
In fact, it can be stated that risk studies that do not include the failure of CI may be underestimating the total economic losses [
10]. Nevertheless, in the existing literature, “most analysis of the cost of infrastructure failure is often estimated in terms of monetary values of physical stocks that are damaged or have failed due to direct exposure to natural hazard” [
41].
The resilience of cities and CI can be achieved by considering the nexus between extreme events, CI failures, dependency of users on CI services, and their vulnerability (user vulnerability) to CI failures [
42]. The concept of resilience applied in this study is similar to that of Murdock et al. [
43] by quantifying flood impacts in terms of disruption, which would provide a metric for the resilience approach.
3. Results and Discussion
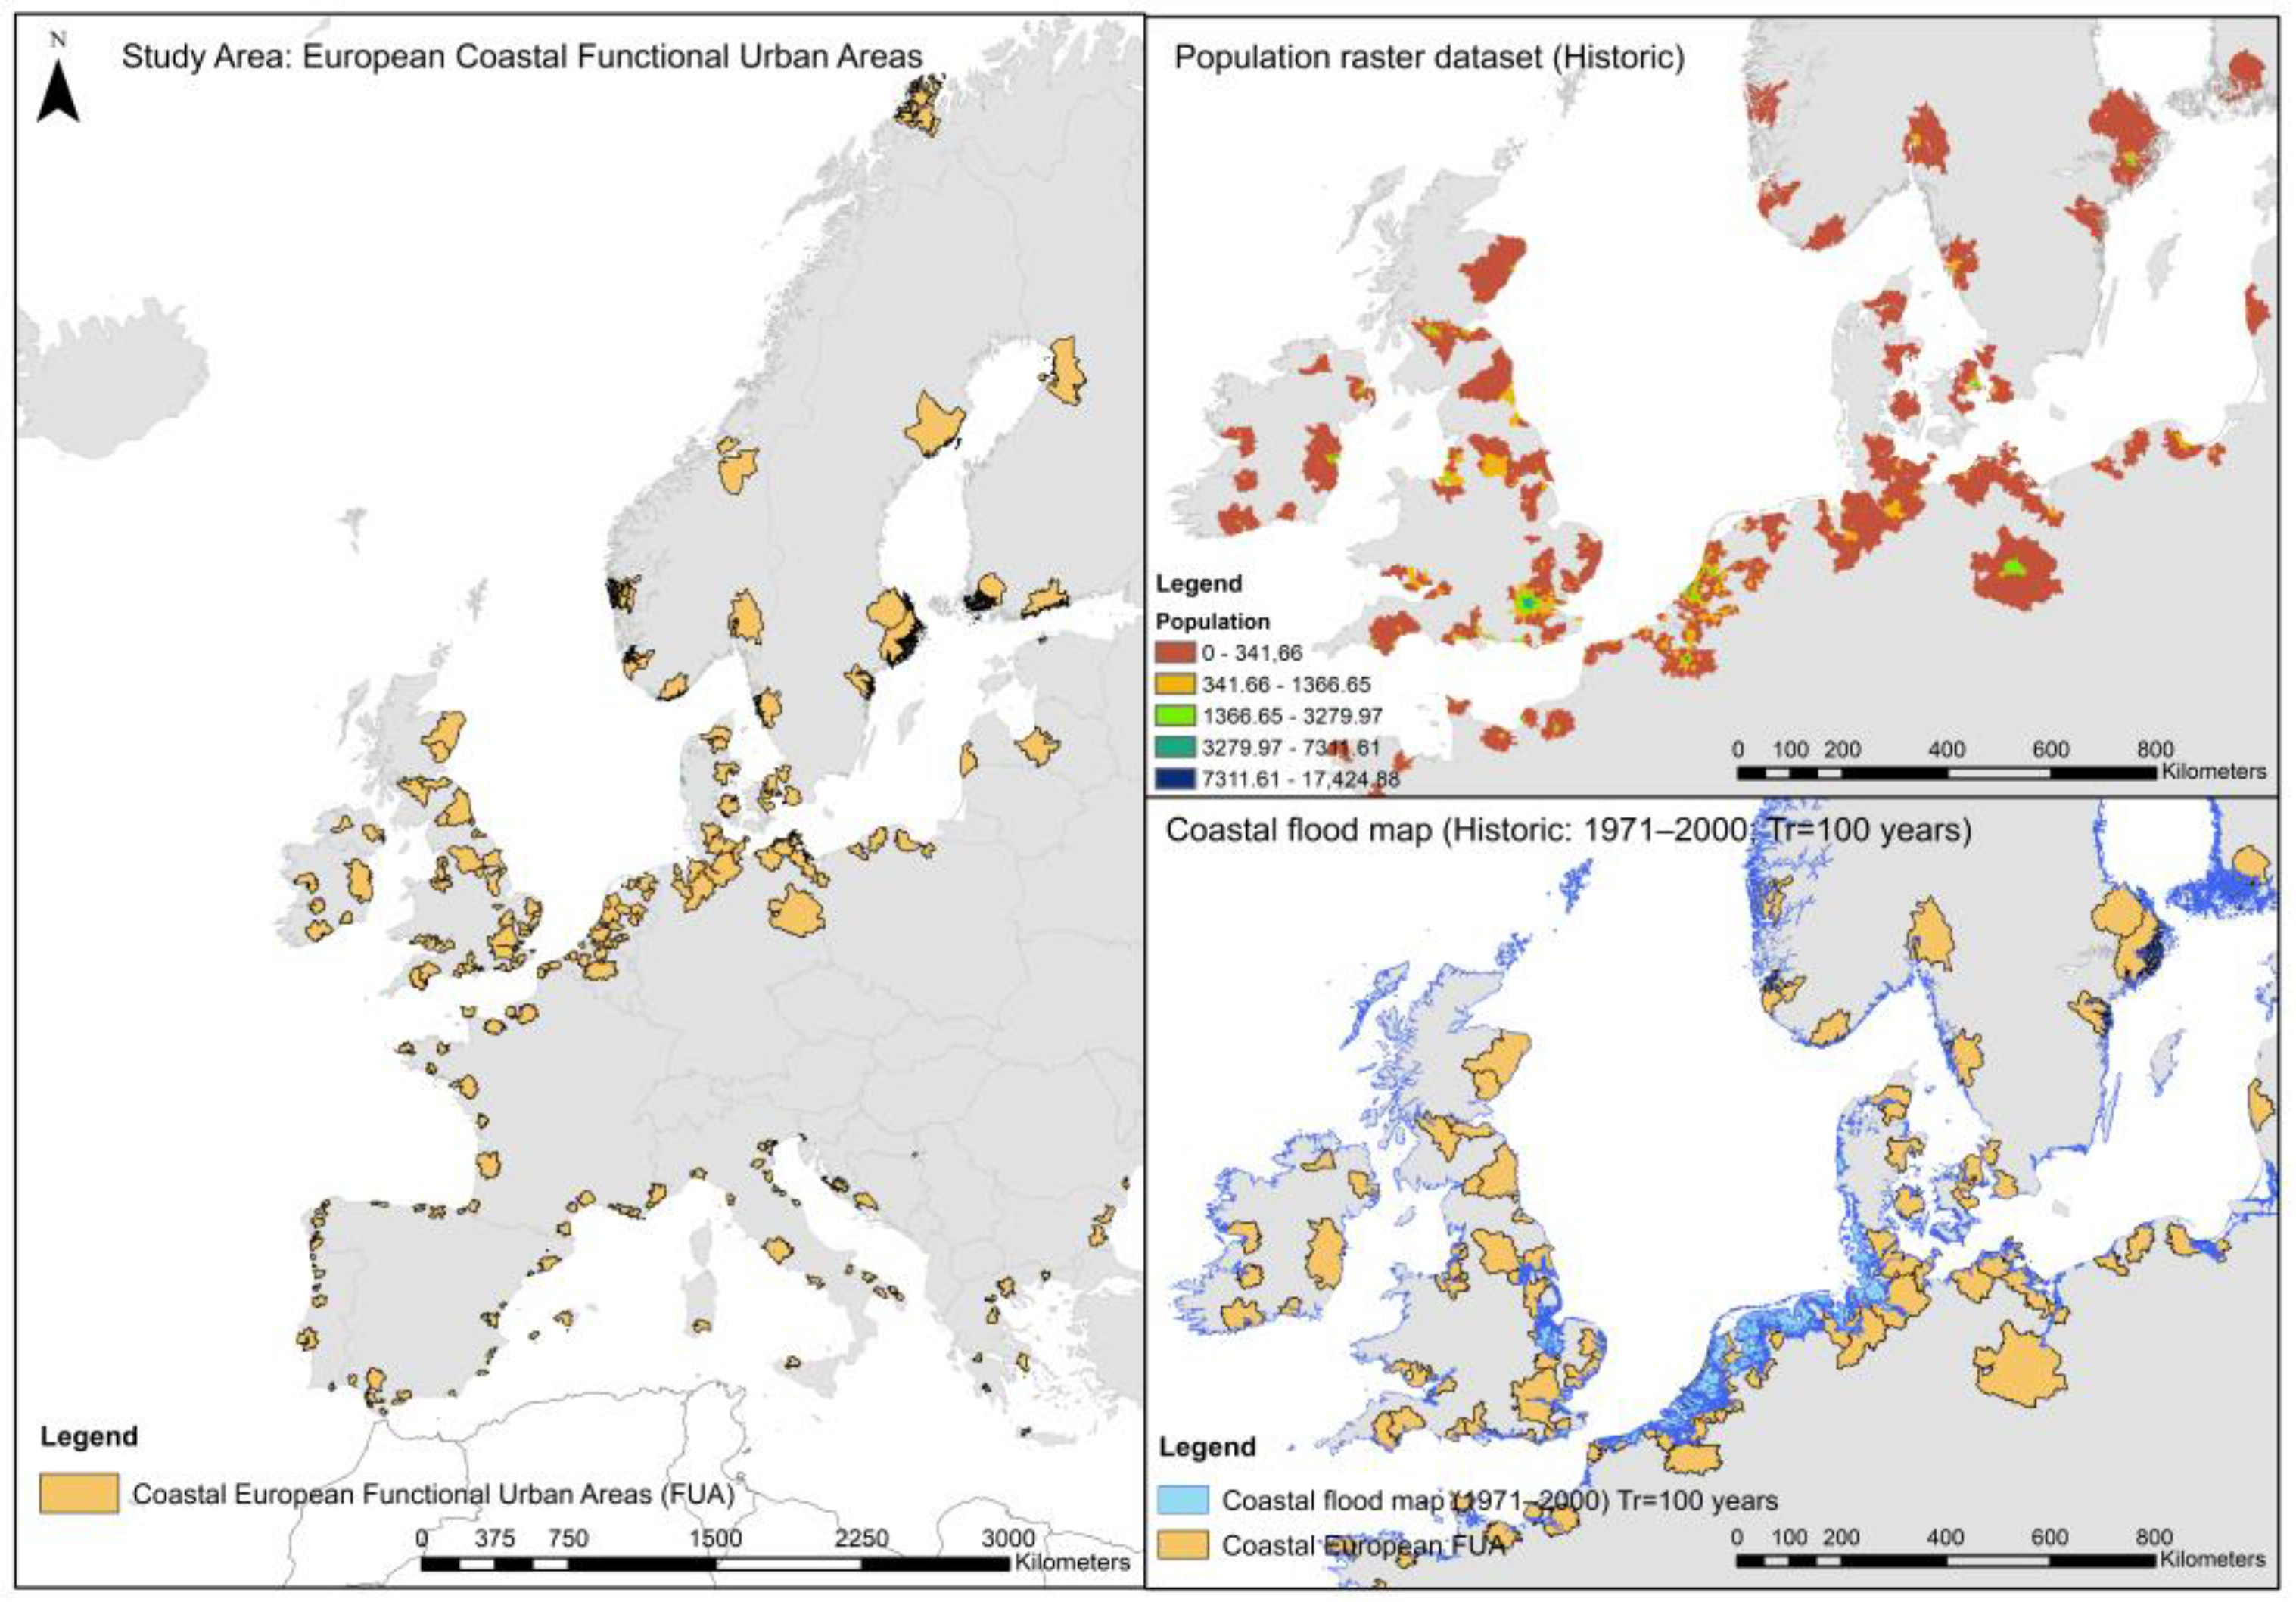
The following subsections present the results from the application of the methodological framework to the case of coastal flooding within the coastal areas in Europe. In this section, the results are presented together with the discussion of the results, in order to facilitate the understanding of the main findings.
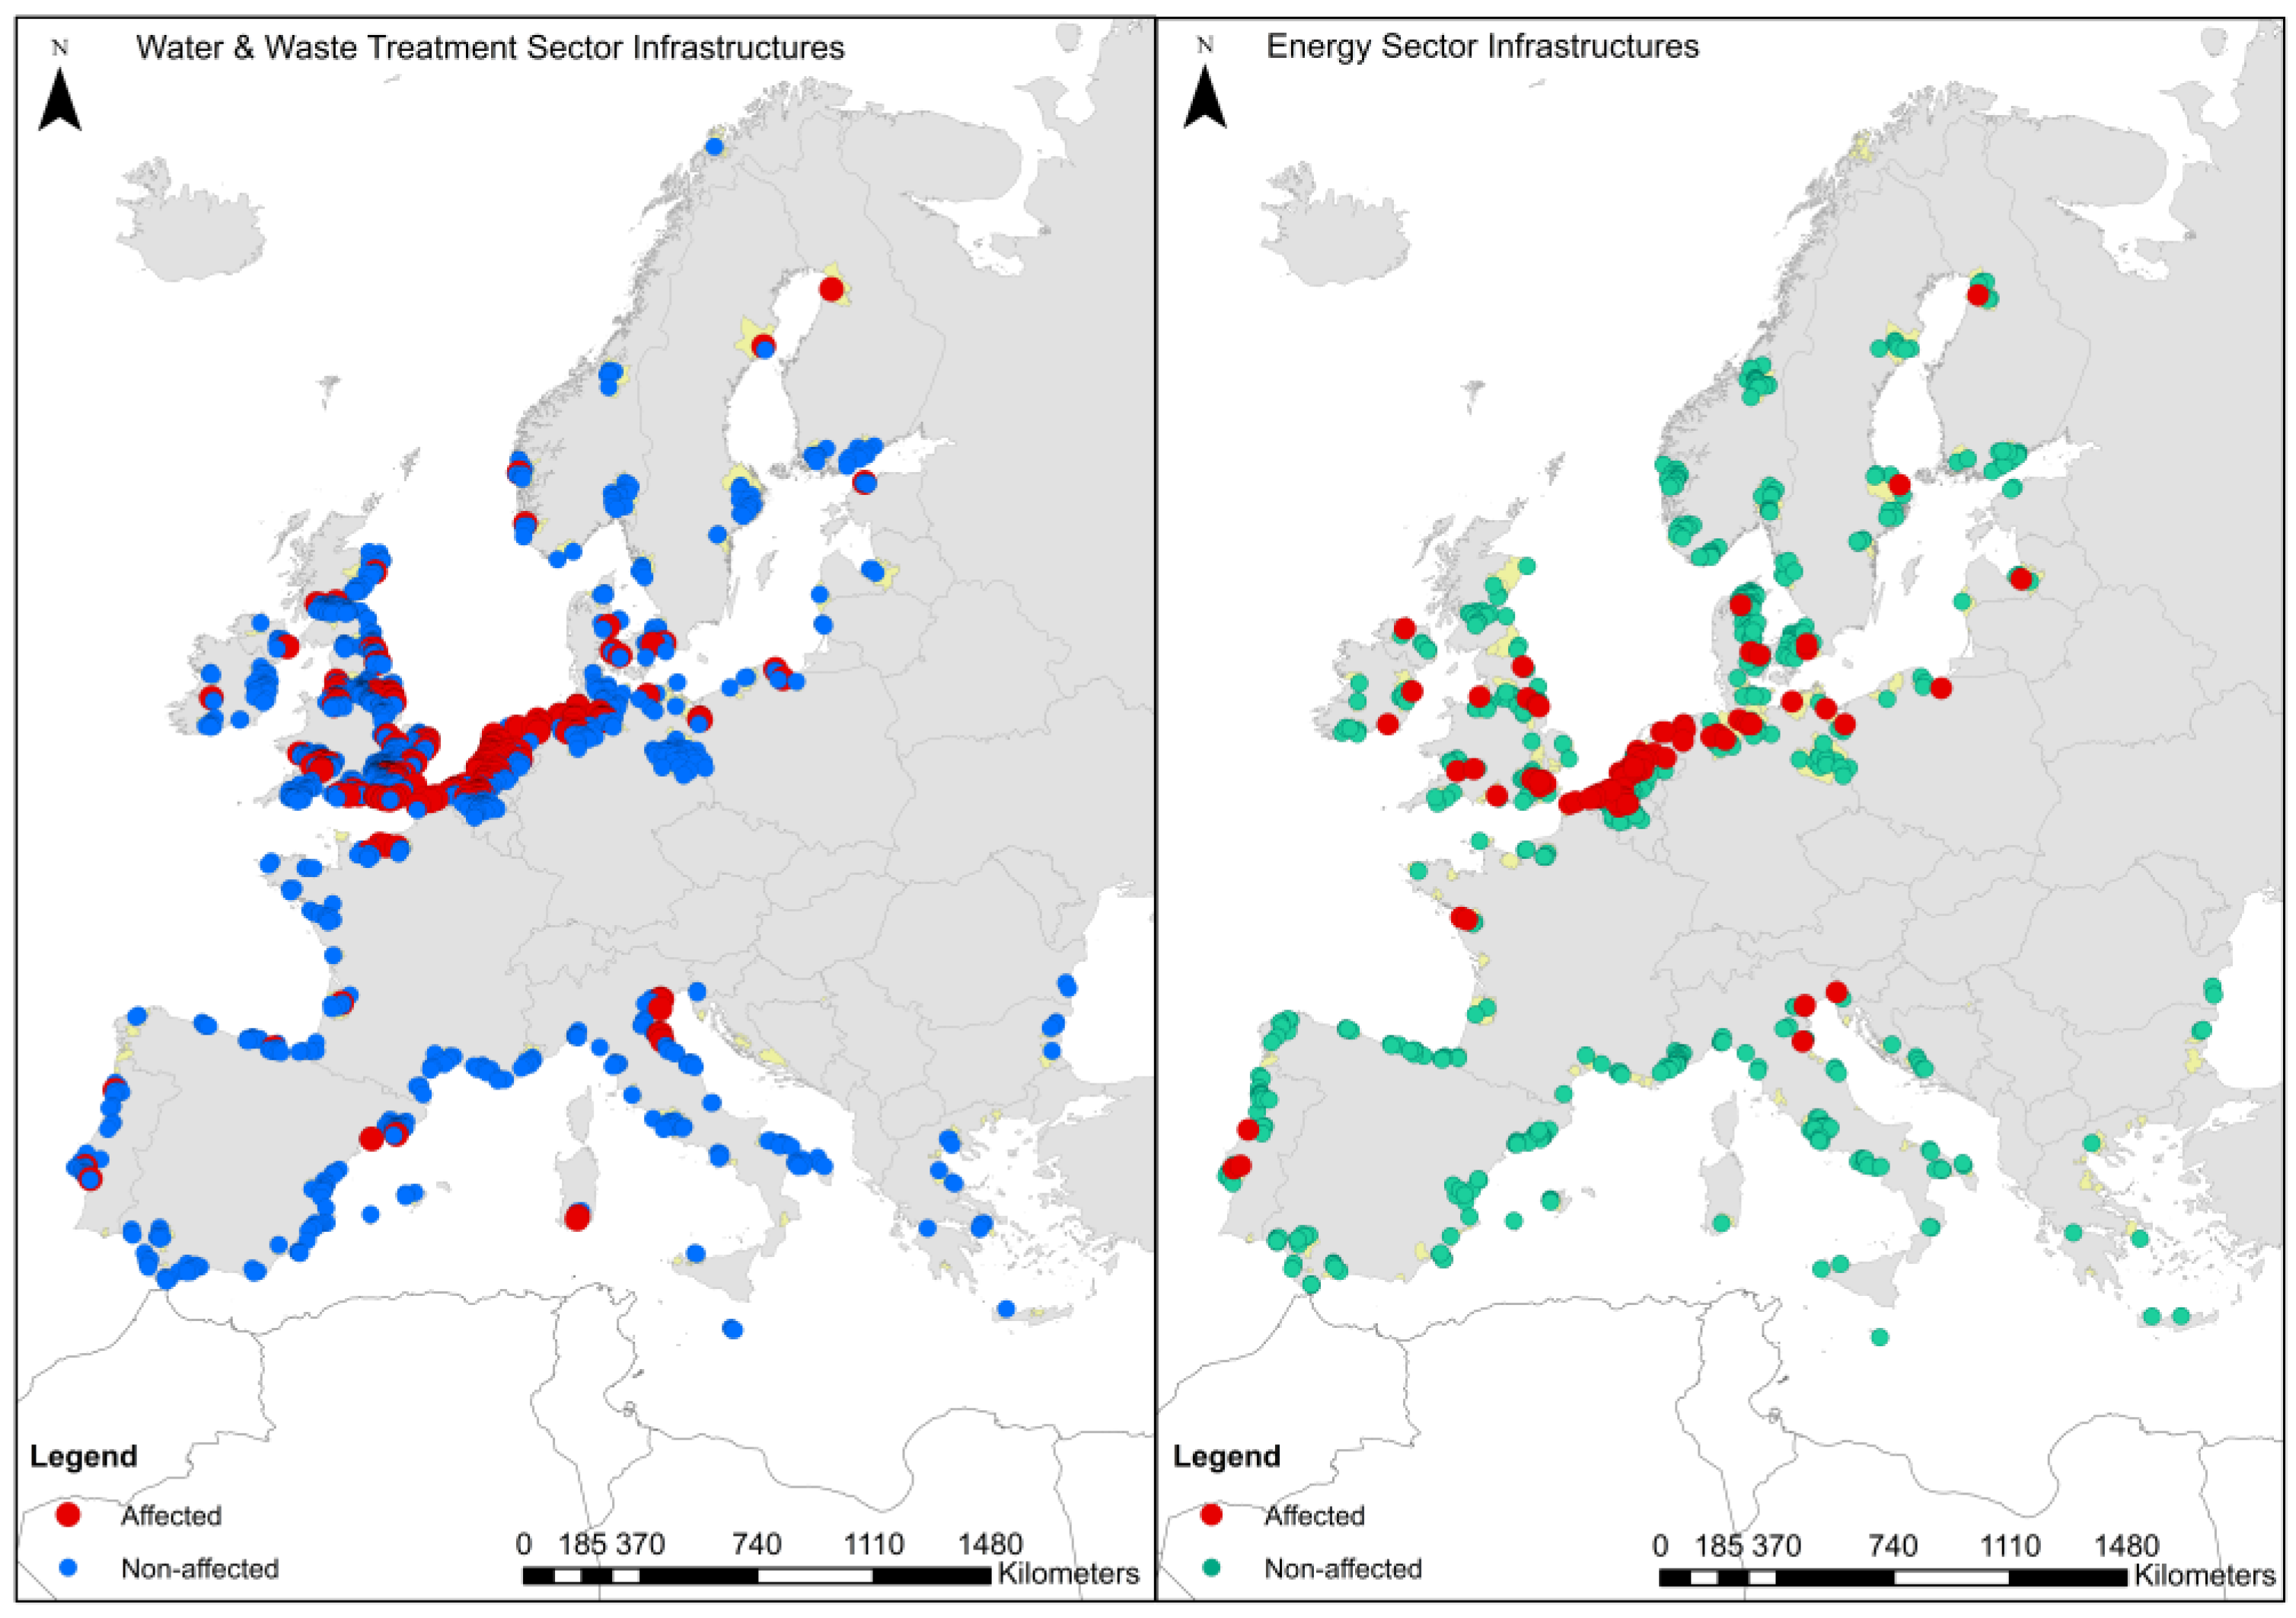
3.1. Hotspots Analysis (CI at Risk of Coastal Flooding)
The first step in the coastal flooding risk analysis of European CI implies assessing their spatial distribution. The spatial location patterns of CI exposed to coastal flooding allow for the identification of exposure patterns and targeting adaptation efforts in the most affected areas.
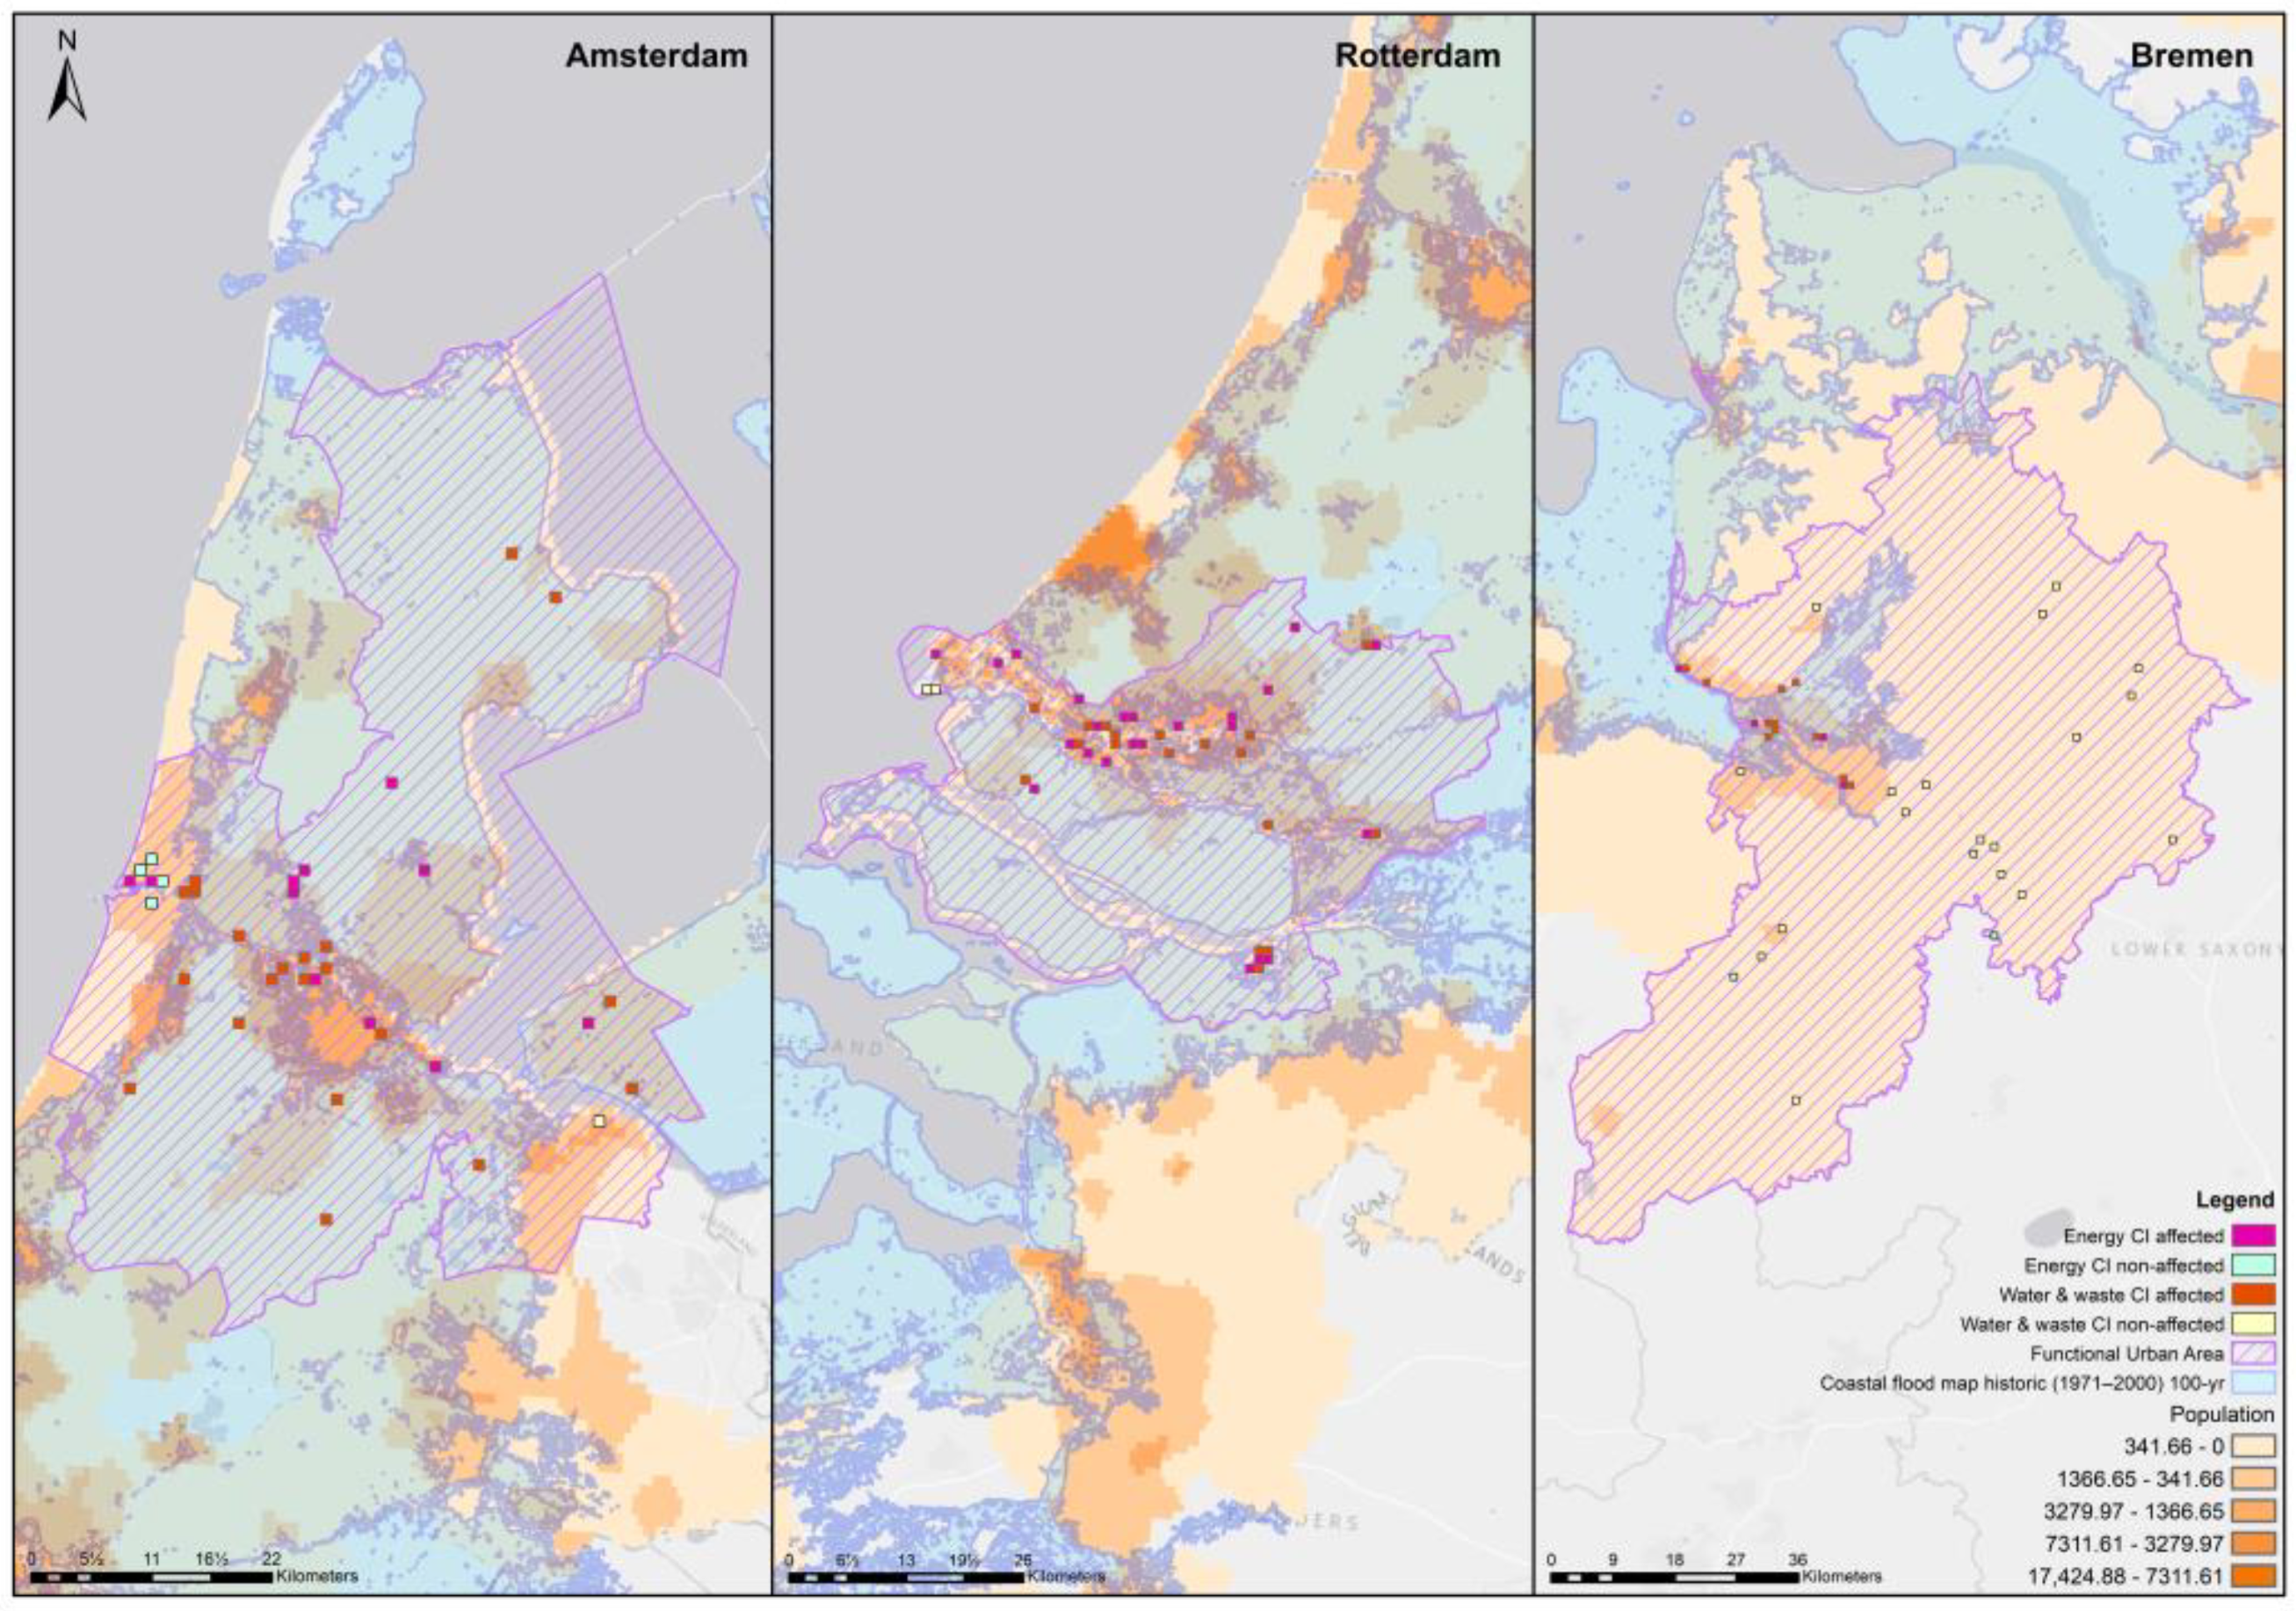
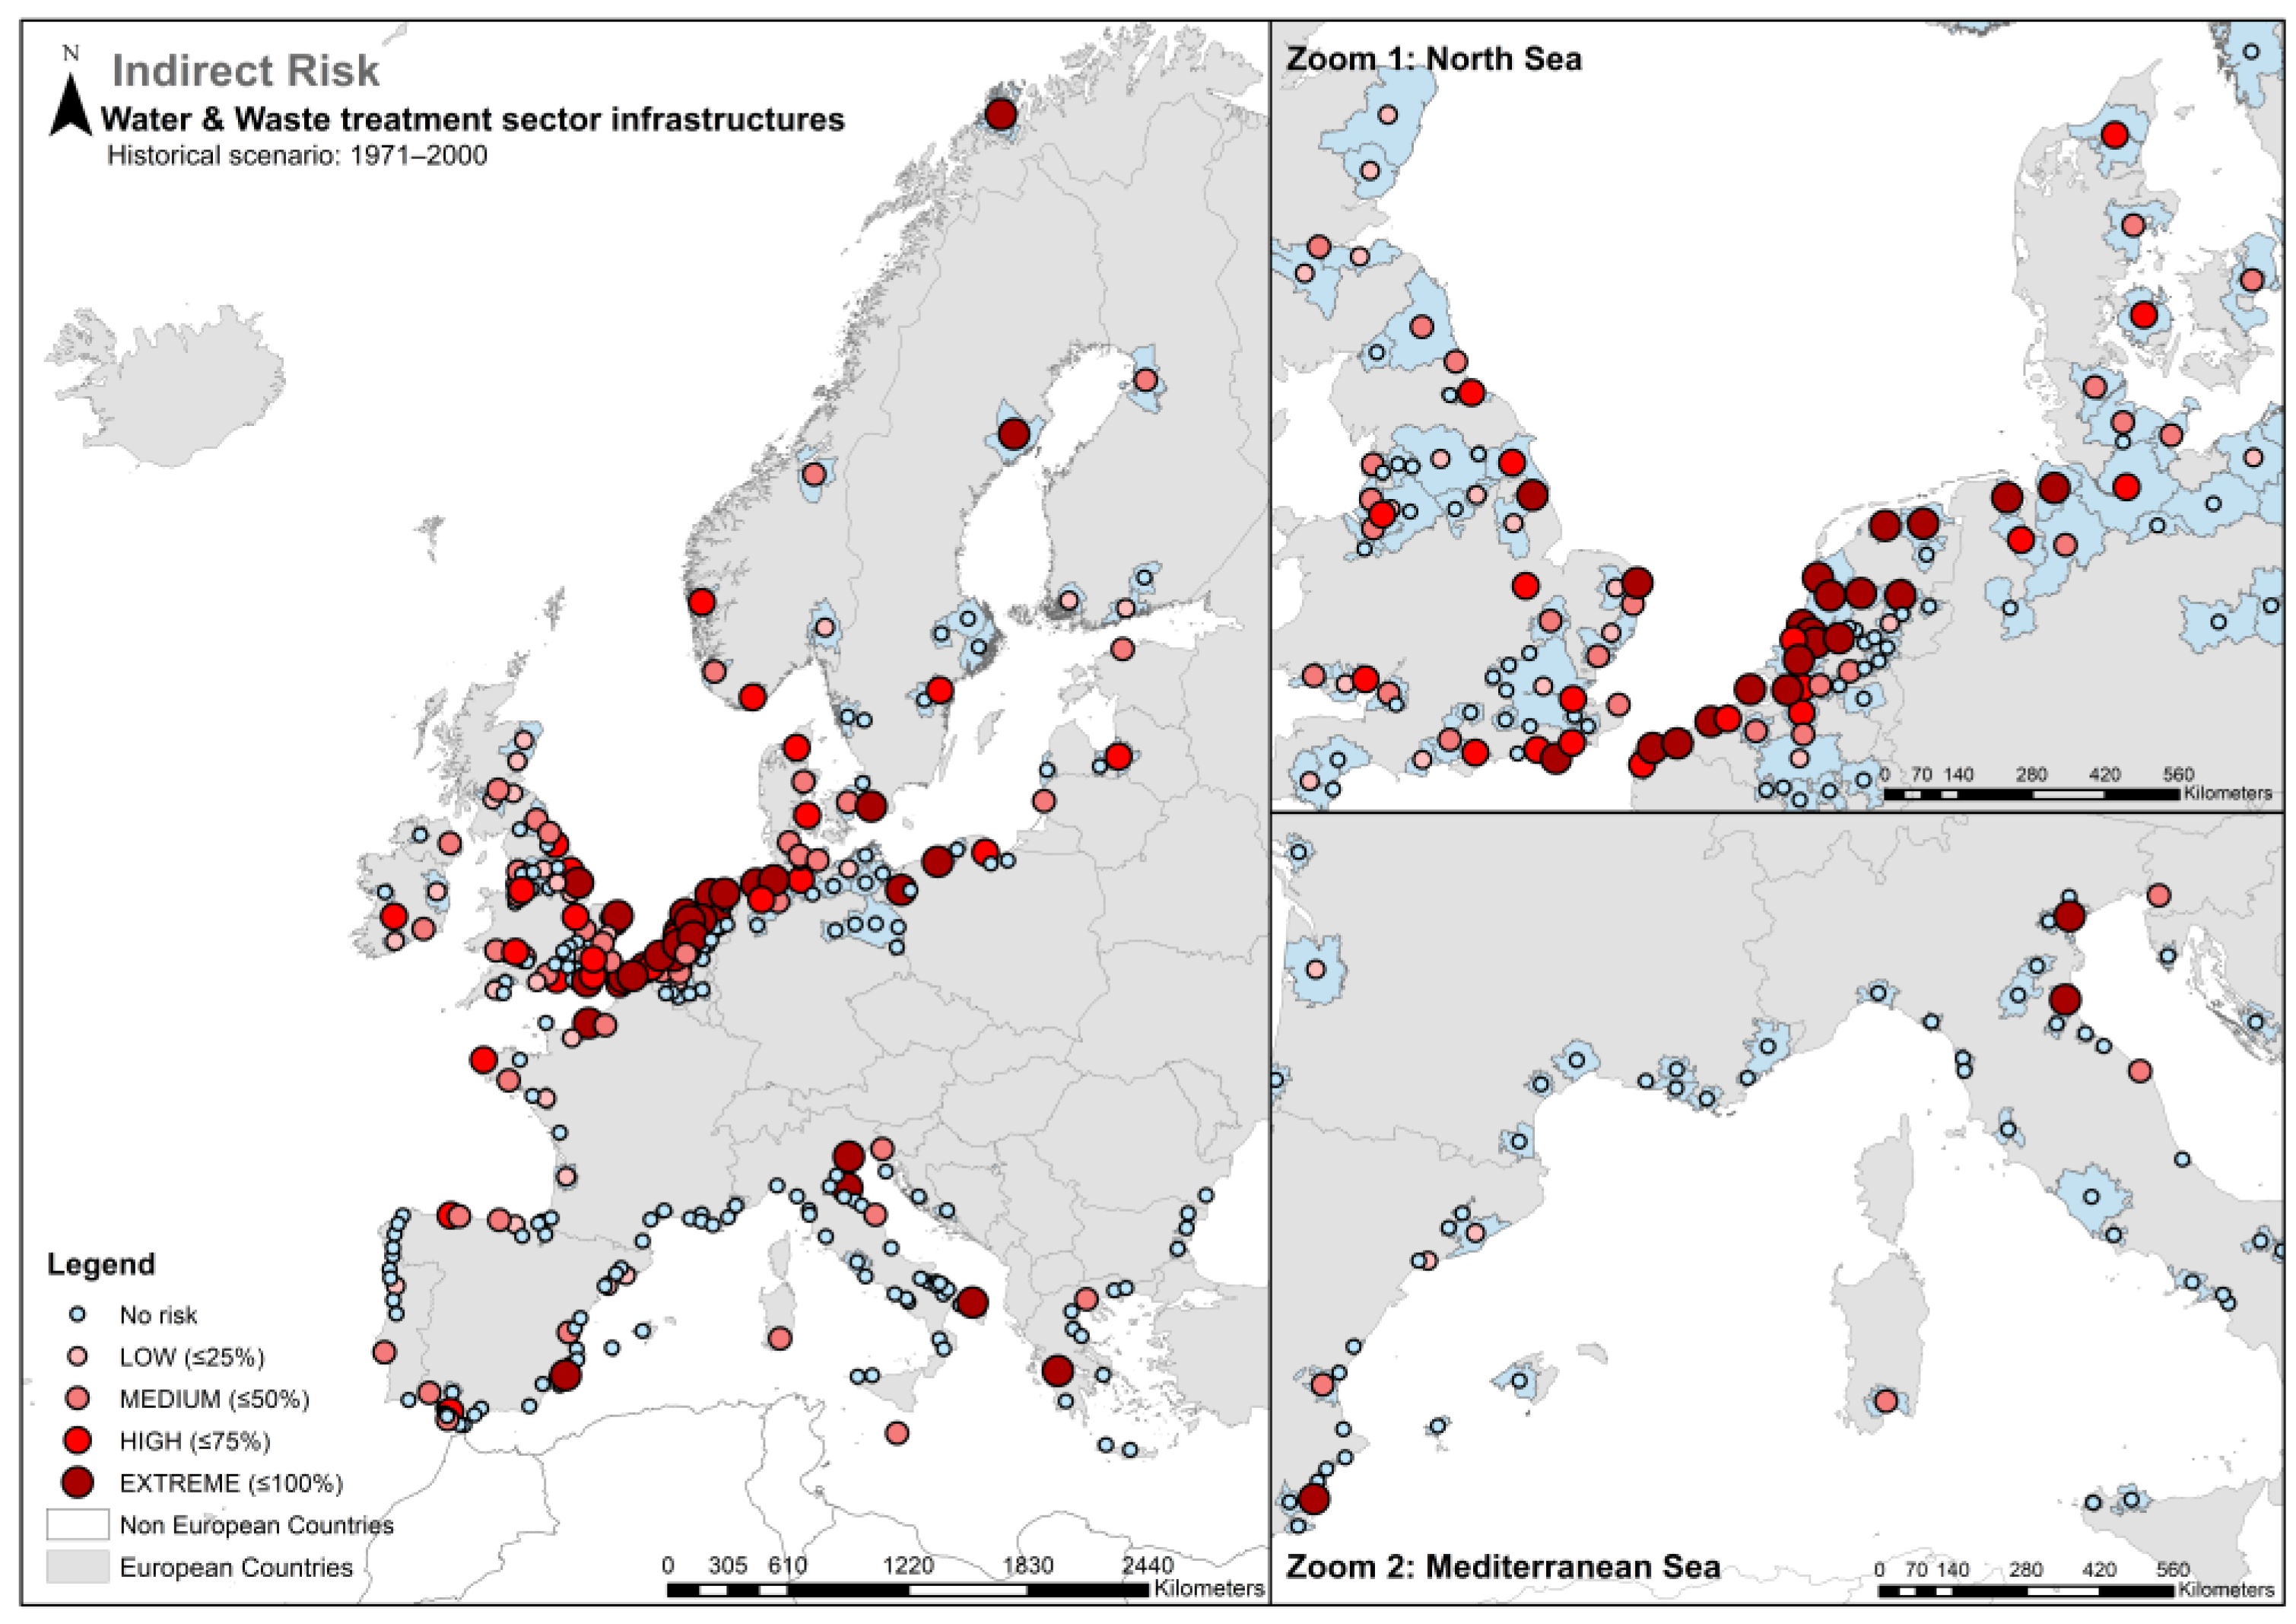
Figure 5 shows, in red, the coastal European CI at risk of coastal flooding, according to historical data from 1971 to 2000.
As can be induced from
Figure 5, some areas, such as those located within the North Sea area, are easily identified as hotspots due to their CI’s major exposure to coastal flooding. Some other areas in the Iberian Peninsula and the north of the Adriatic Sea can be also highlighted due to the existence of more affected CI.
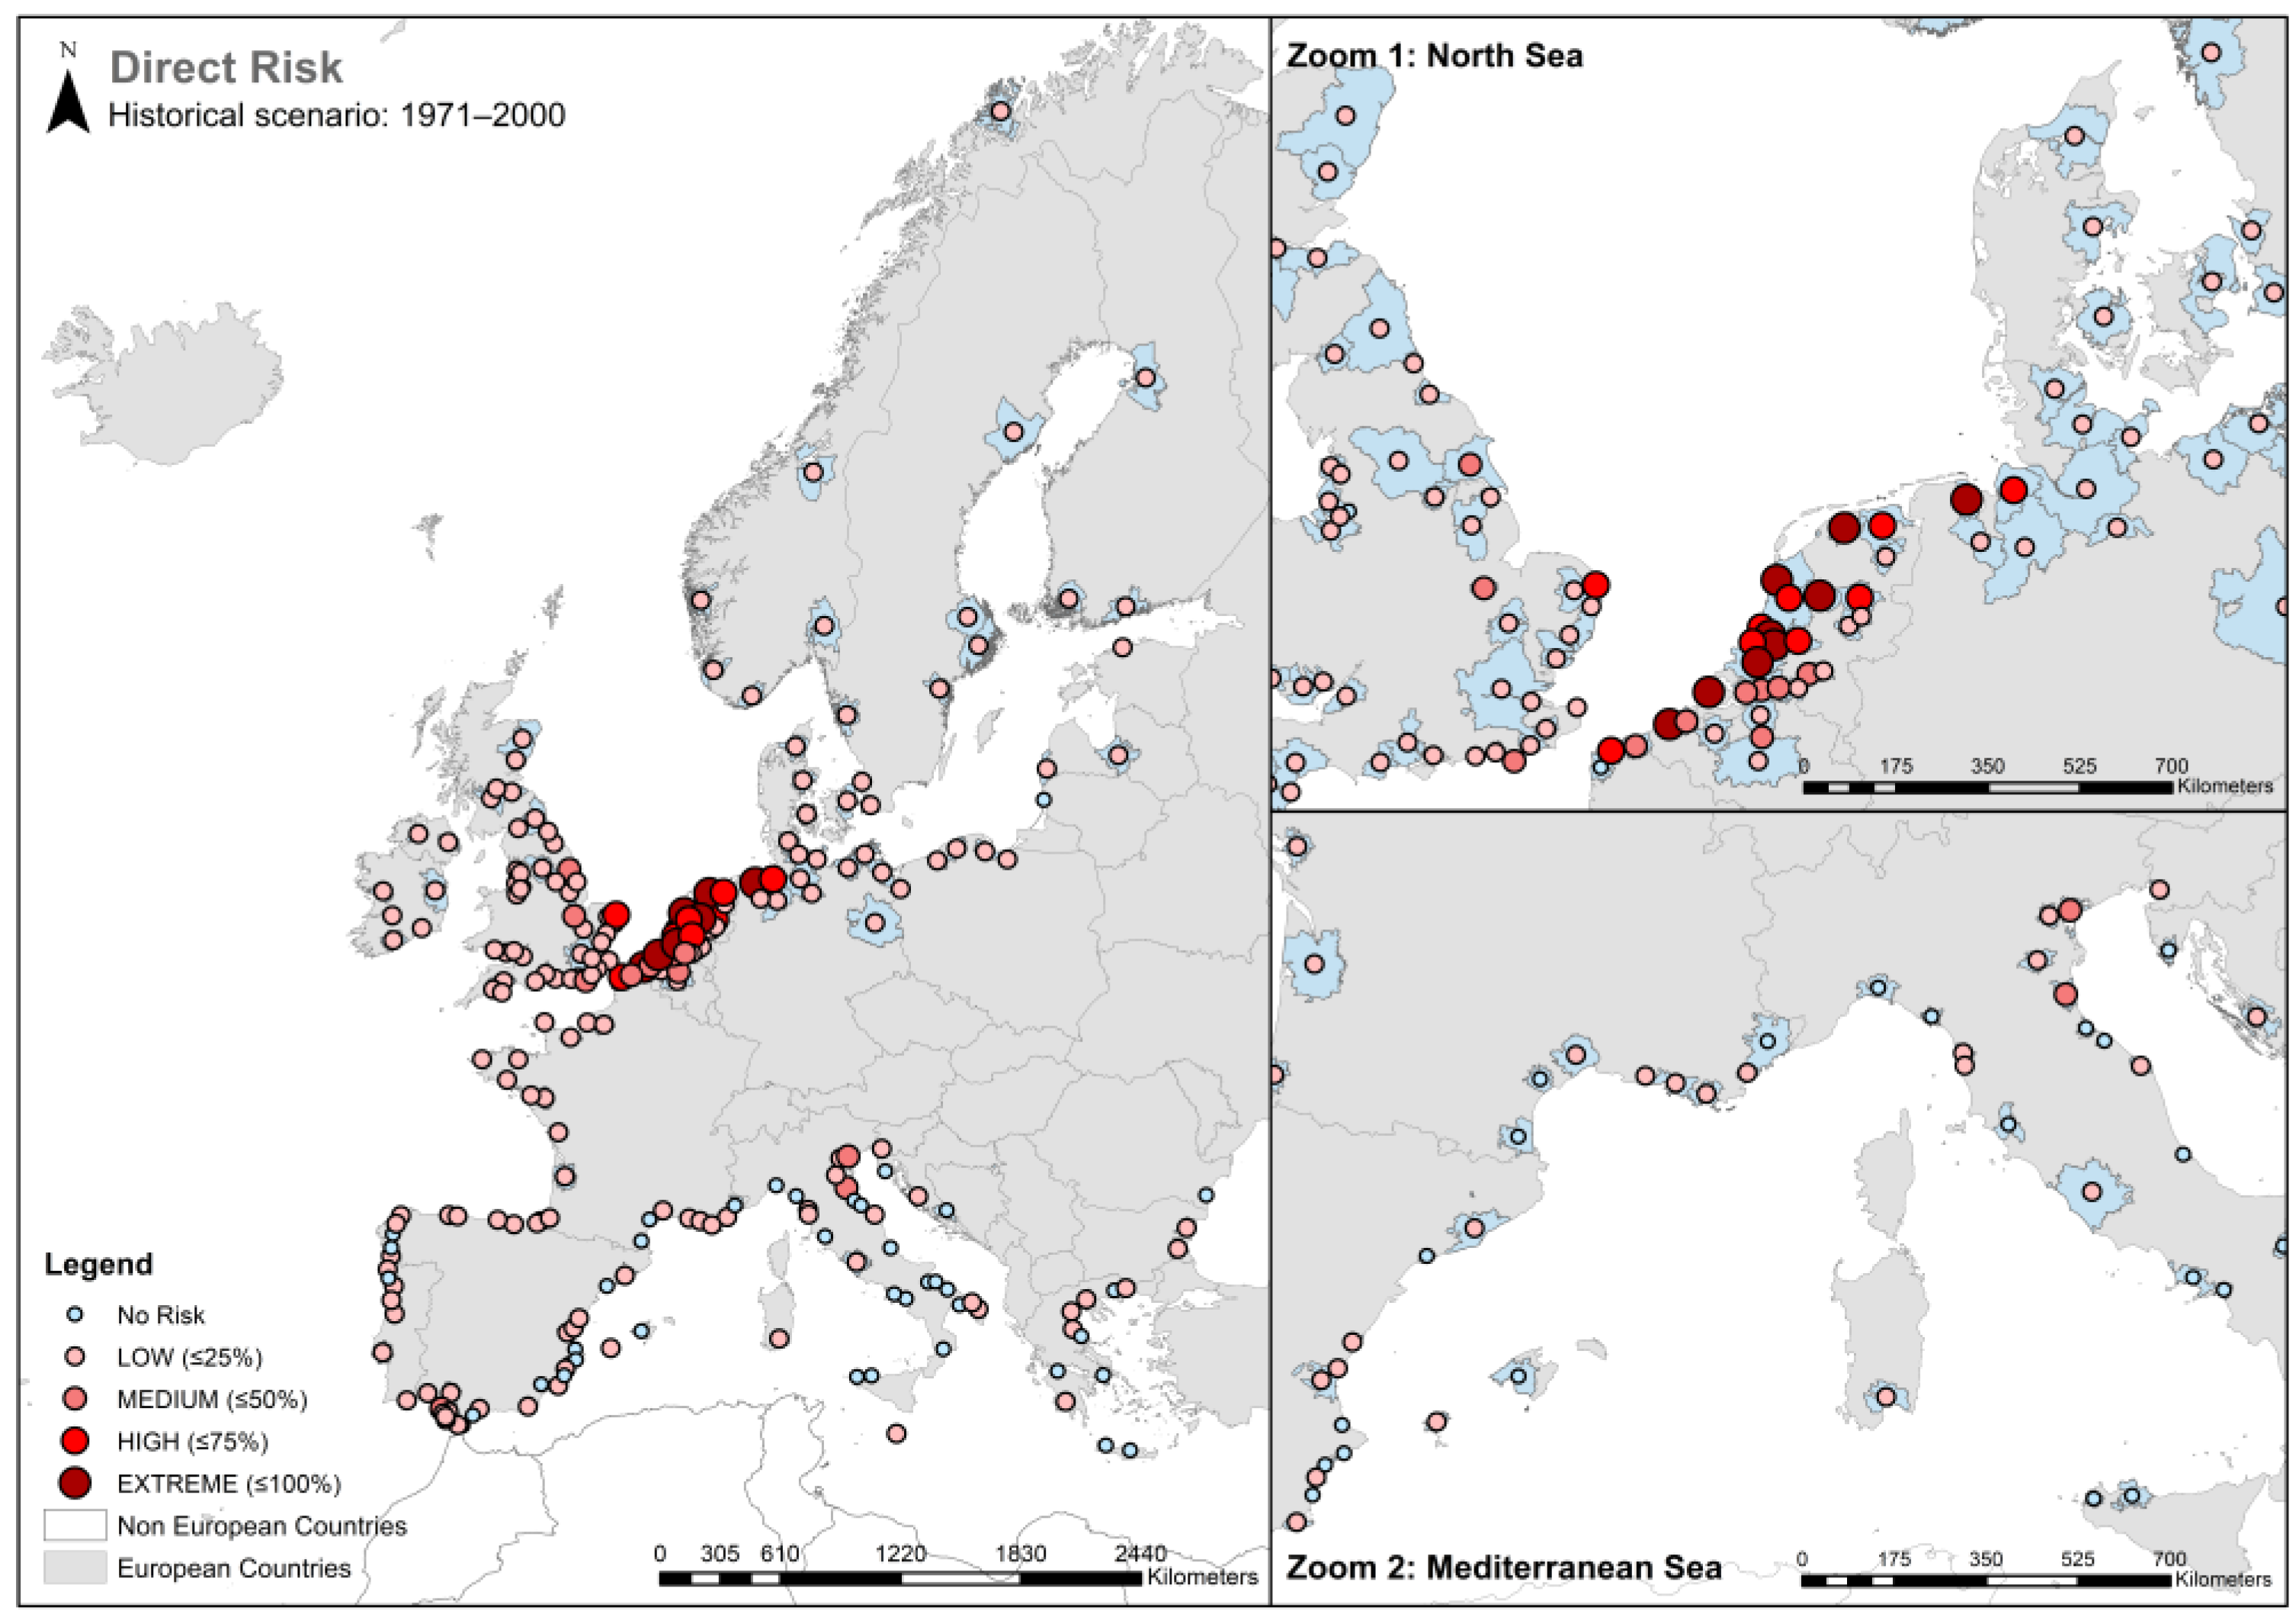
3.2. A Comparison between Direct and Indirect Risk in Coastal European FUA
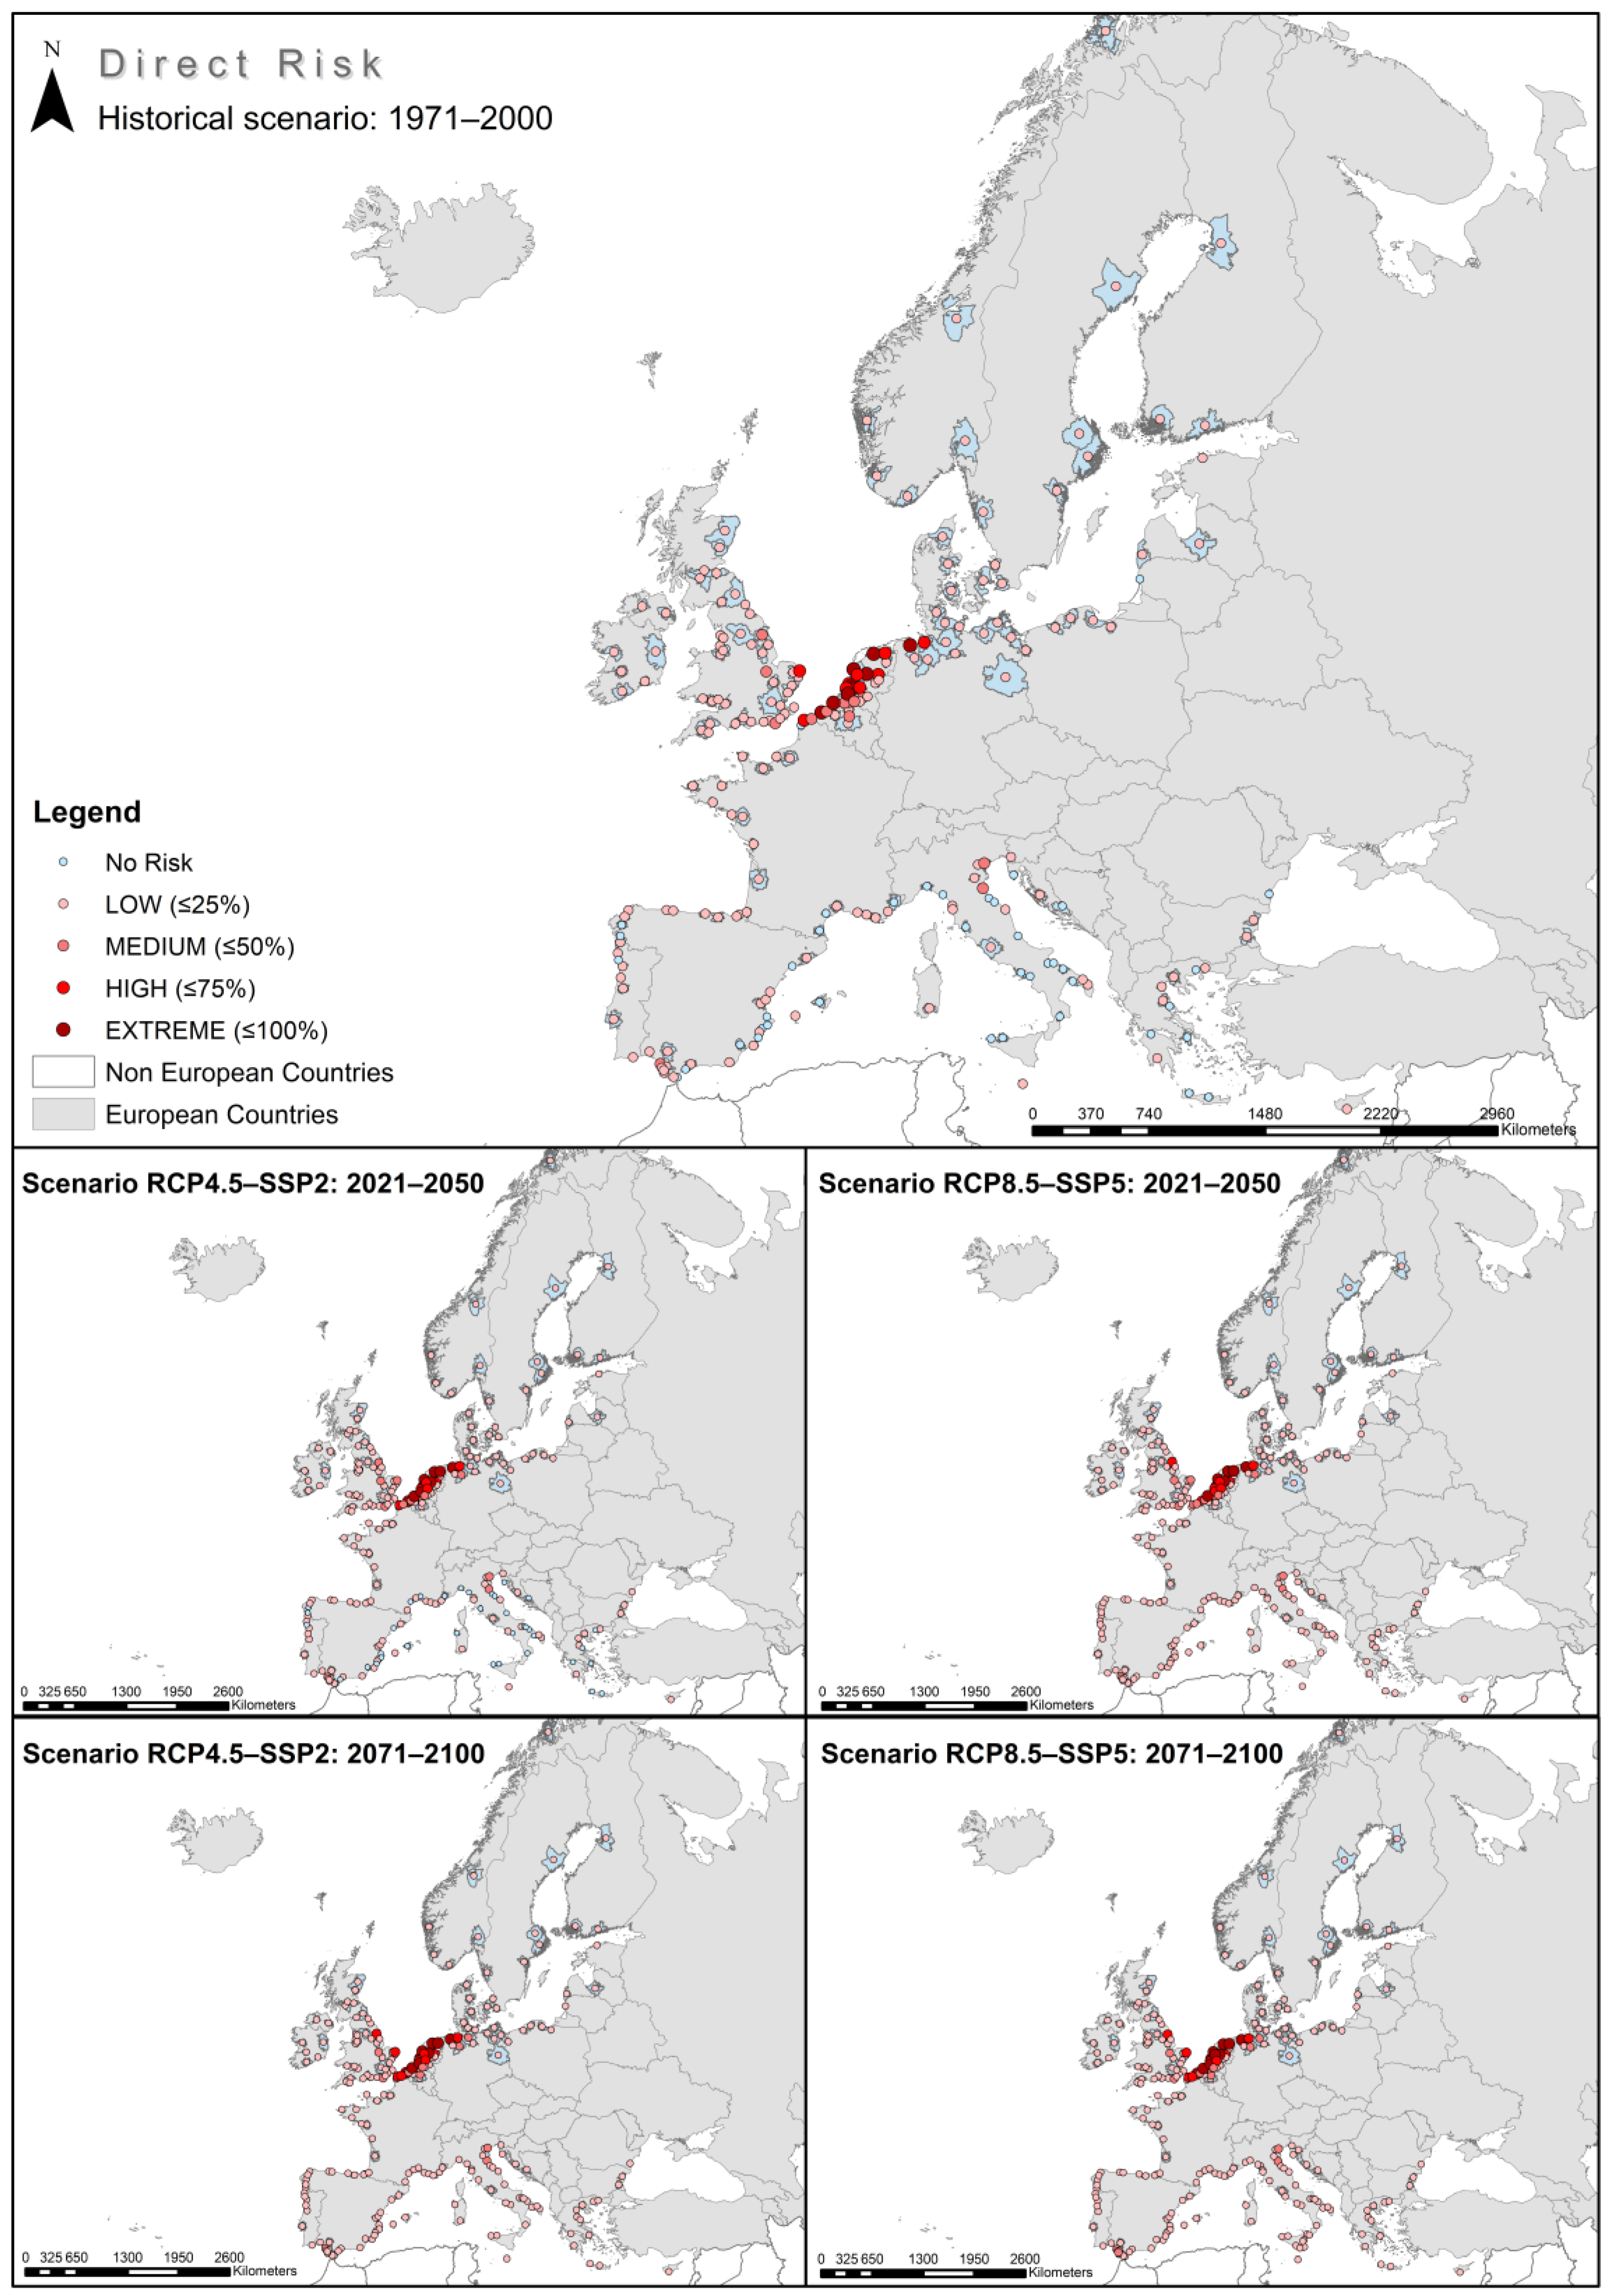
The percentages of the population directly affected by coastal flooding for the base scenario, corresponding to the historical period (1971–2000) are presented in
Figure 6. For the RCP-SSPs scenarios and future time horizons studied, these percentages of the population directly affected by the 100-year return period flood are presented in
Figure A1 (
Appendix A).
As expected, there is a high concentration of FUA with high and extreme direct risk levels in part of the “low countries” region (that comprises Belgium, the Netherlands, Luxembourg, and the Rhine–Meuse–Scheldt delta region), with the FUA of Lelystad, Middelburg, Oostende, Rotterdam, Amsterdam, among others, standing out, with percentages of the population directly affected by coastal flooding exceeding the 50% of the total population and, in some cases, as in Alphen aan den Rijn, Leeuwarden and Gouda, with almost 100% of their population affected by coastal flooding. The southeast coast of the island of Great Britain, with some FUA at high-risk levels, and the Ravenna and Venice FUA in the Adriatic Sea, with a medium risk level affecting the population, are also noteworthy. For the rest of the European coastal FUA, the levels of direct risk are predominantly low.
Maps presented in
Figure 7 show three examples of FUA where the analysis has been developed and that are characterized by extreme percentages of the population directly affected by coastal flooding. In these maps, the spatial units considered (FUA) are clearly shown together with the distribution of the population, the flood maps affecting these areas, and the physical location of the CI that provides services to the population living in each FUA, highlighting the ones located in areas affected by coastal flooding.
Indirect risk results have been prepared on a sector-specific basis for energy and W&W infrastructure. The main justifications for the separate approach of the different sectors analyzed are, firstly, the high uncertainty in the cross-sectoral dependencies (these interrelationships are unknown), and, secondly, the existing variations between the services provided by each sector and the characteristics of each sector’s network require a particularized interpretation of the results.
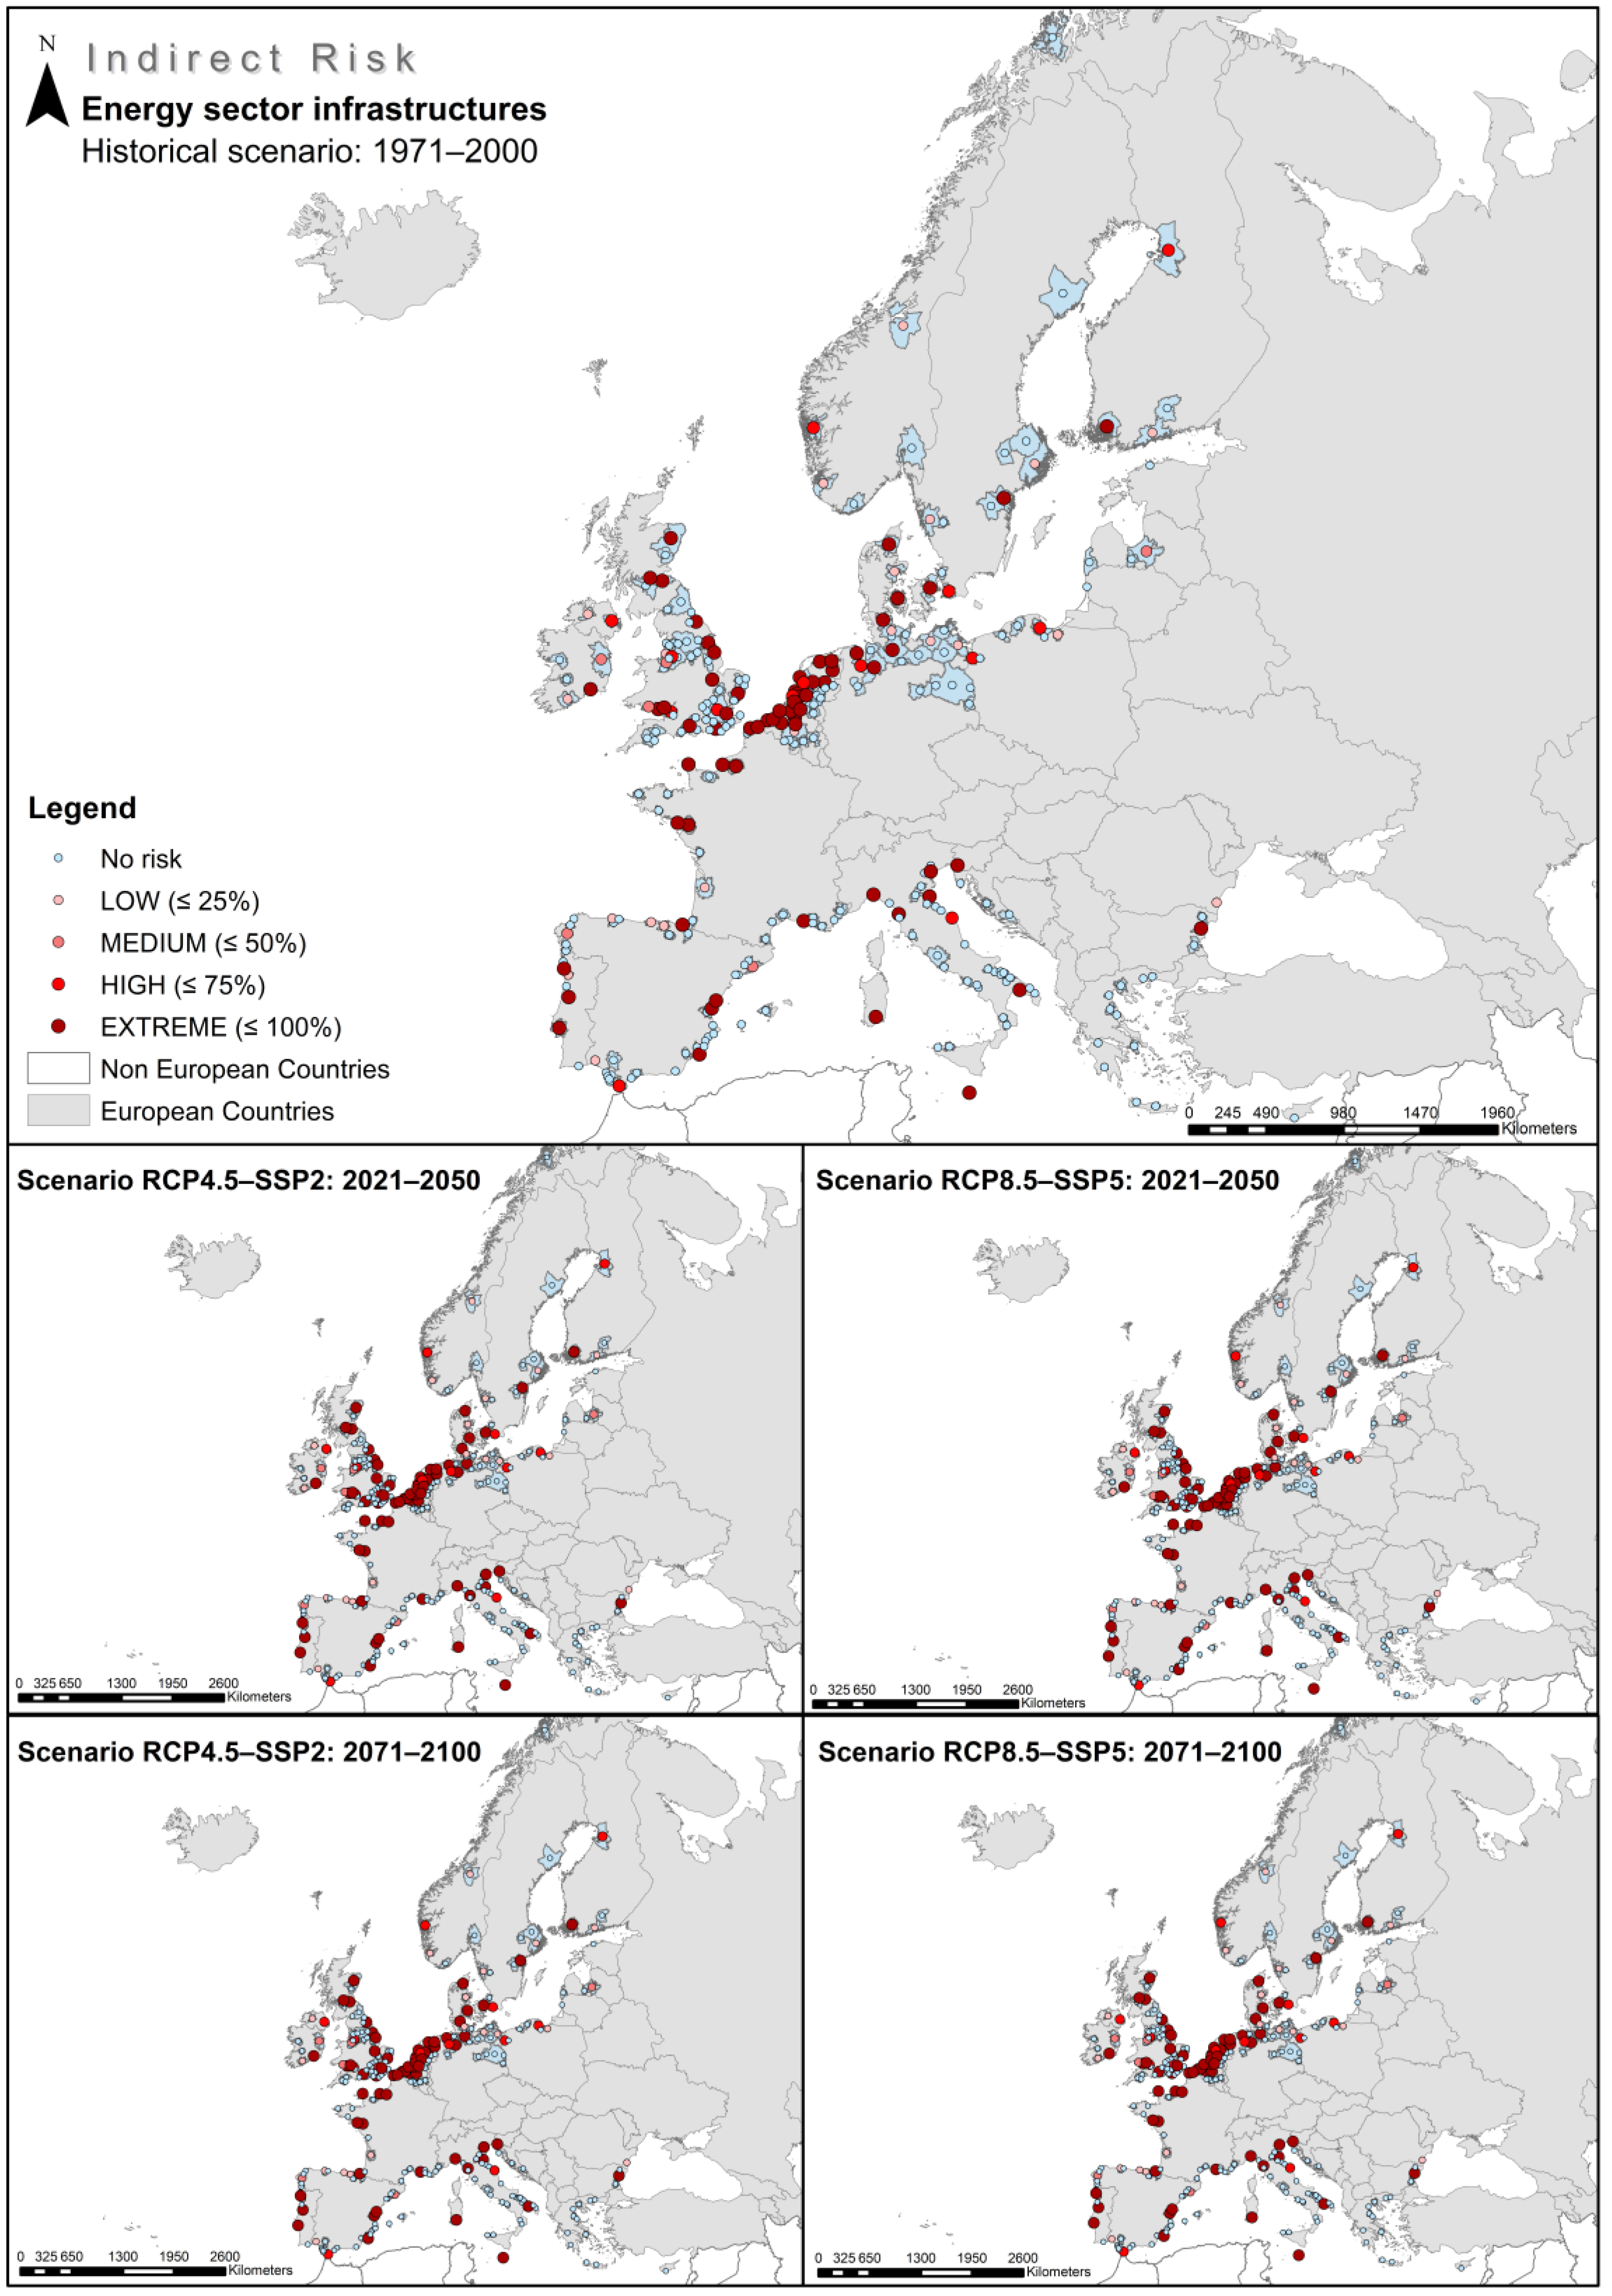
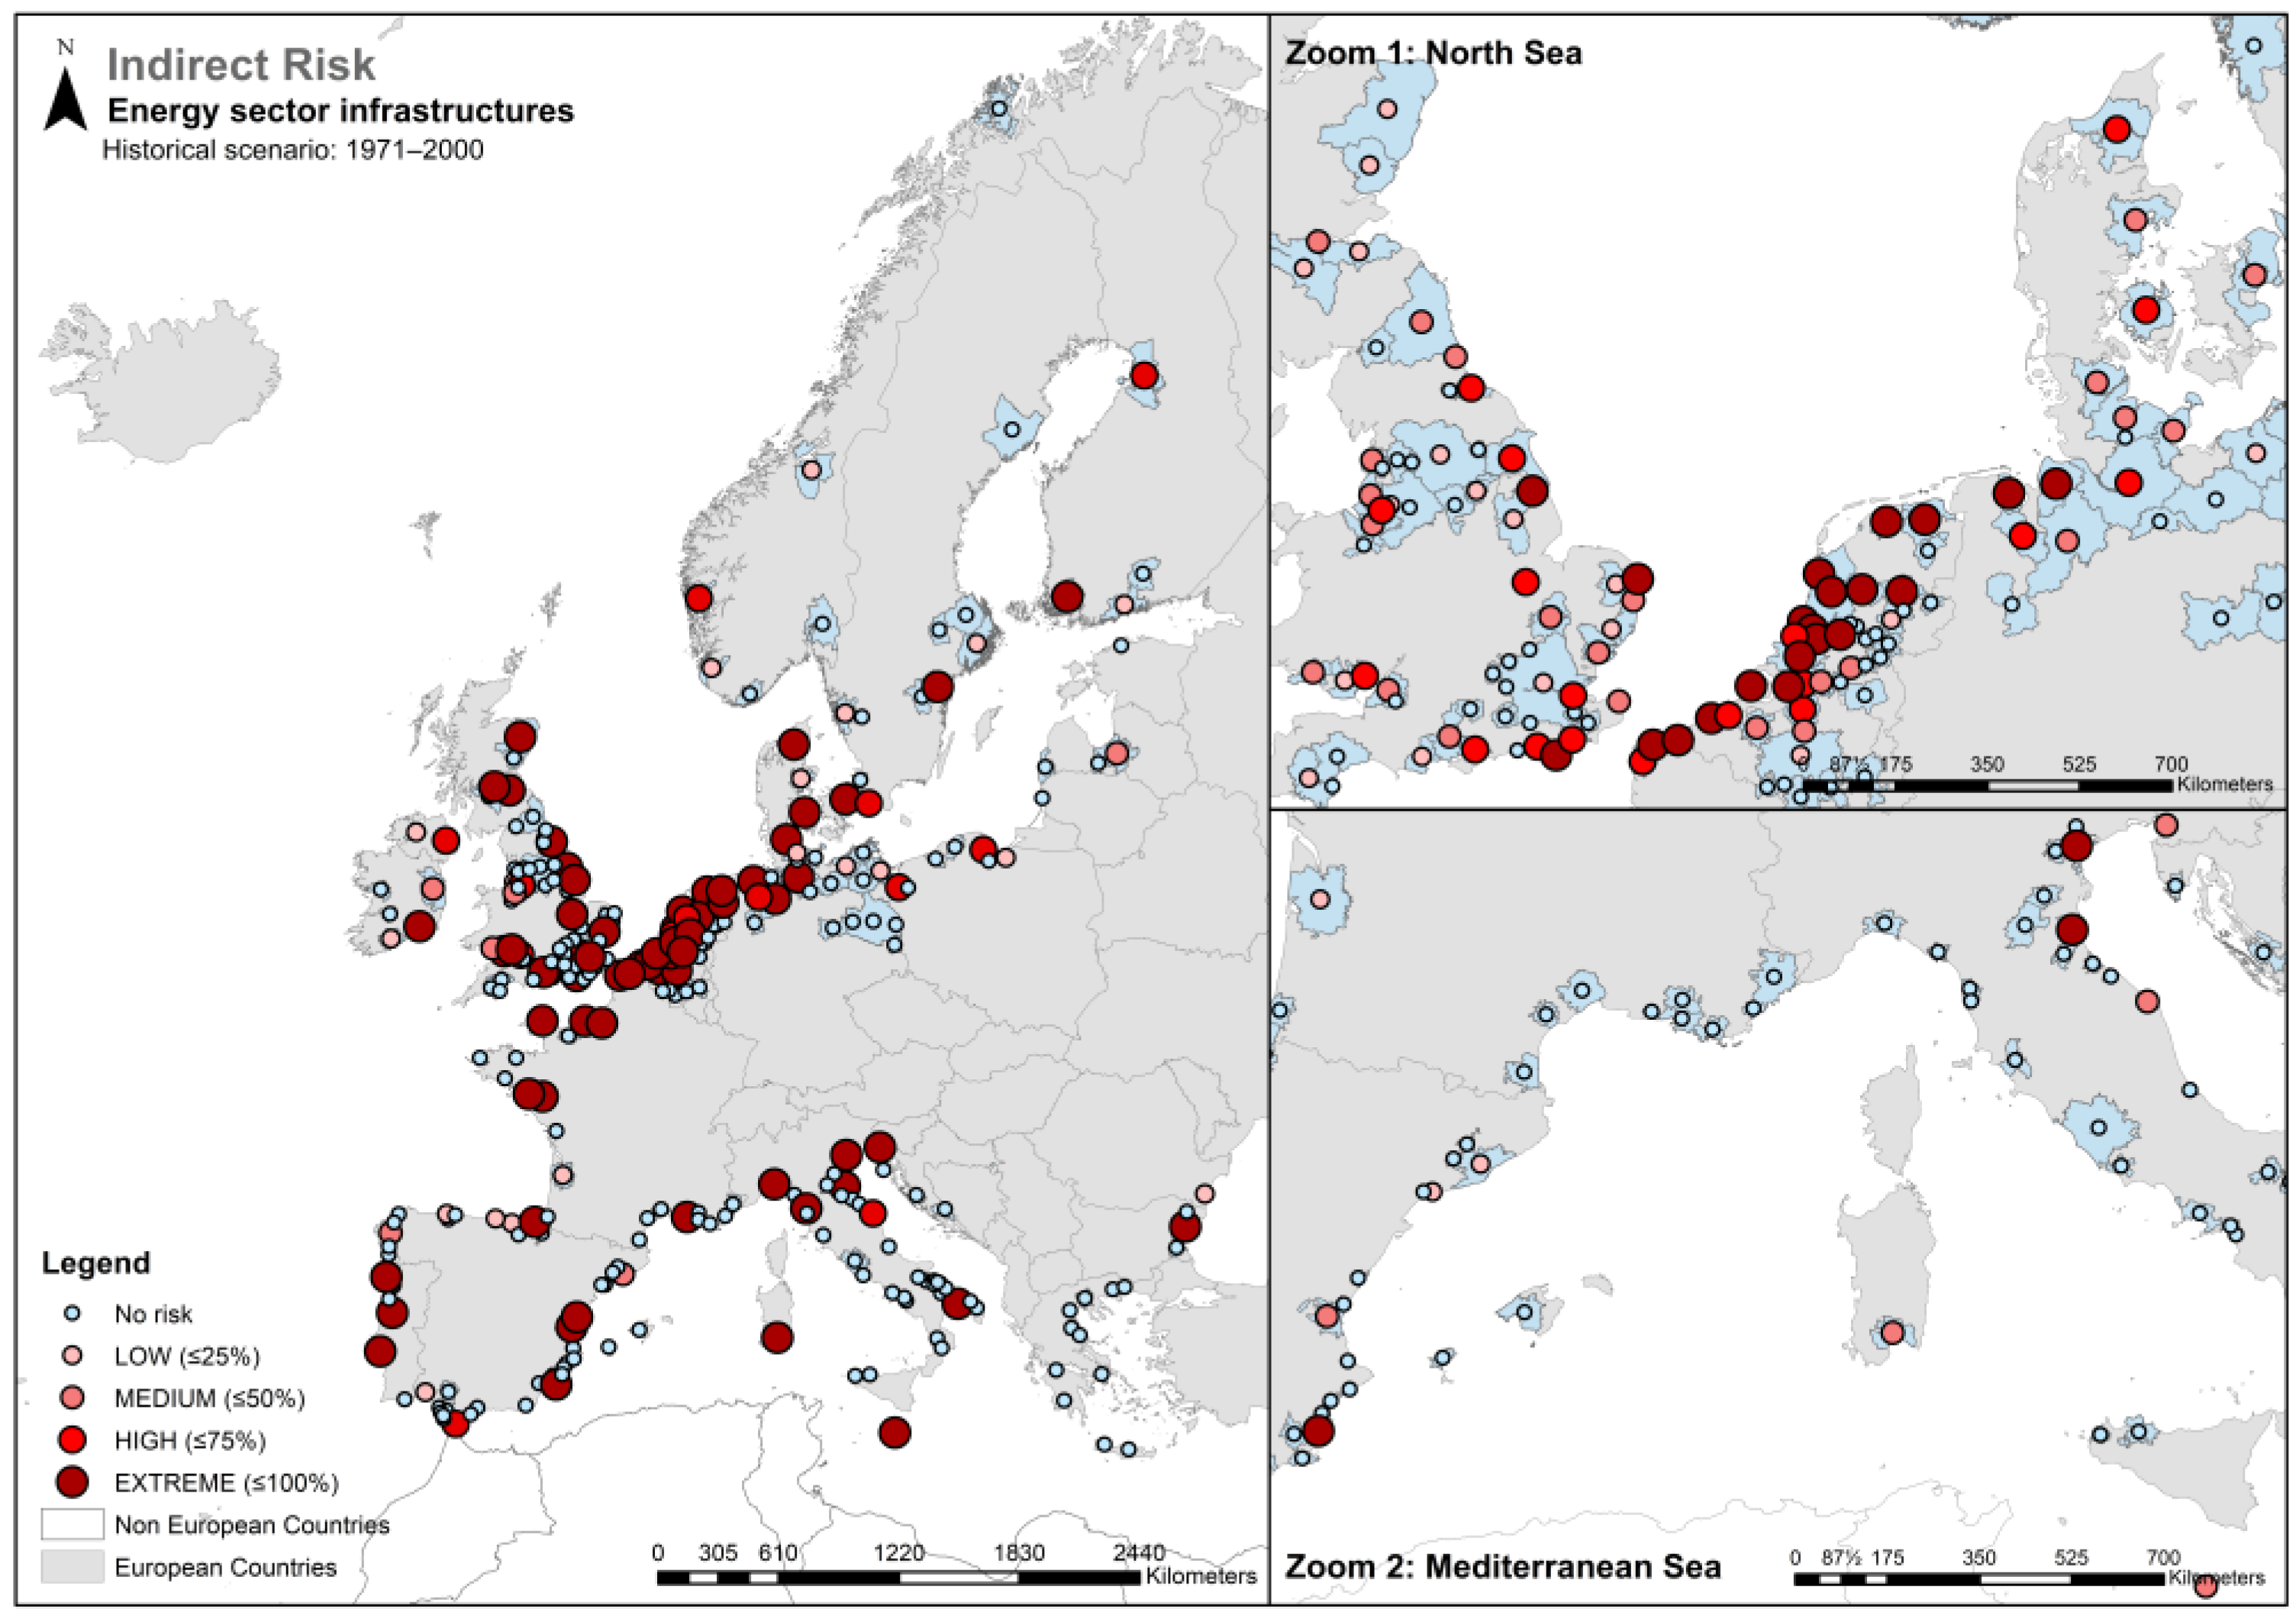
3.2.1. Energy Sector Infrastructure
In the case of energy sector infrastructure, the maps show a significant increase in the number of FUA with high or extreme risk percentages compared to the direct risk (
Figure 6). Additionally, an increase in the percentage of the population indirectly affected compared to the analysis of direct exposure is also found.
In this case, it can be seen (
Figure 8 and
Figure A2 (
Appendix A)) that some of the areas that already showed high levels of percentage of population directly affected by flooding also present high percentages of indirect risk. It is the case for the FUA of Rotterdam, Bremen, Amsterdam, Hamburg, Alphen aan den Rijn, Leeuwarden, Gouda, etc. However, it can also be observed that a considerable number of FUA whose population was not affected, or was affected with low levels of risk, present now high levels of indirect risk due to the impact on their CI. This can be observed in some FUA located along the coasts of the Iberian Peninsula and Italy, as well as on the coasts of Denmark and the Scandinavian countries, among others. To illustrate this finding, maps in
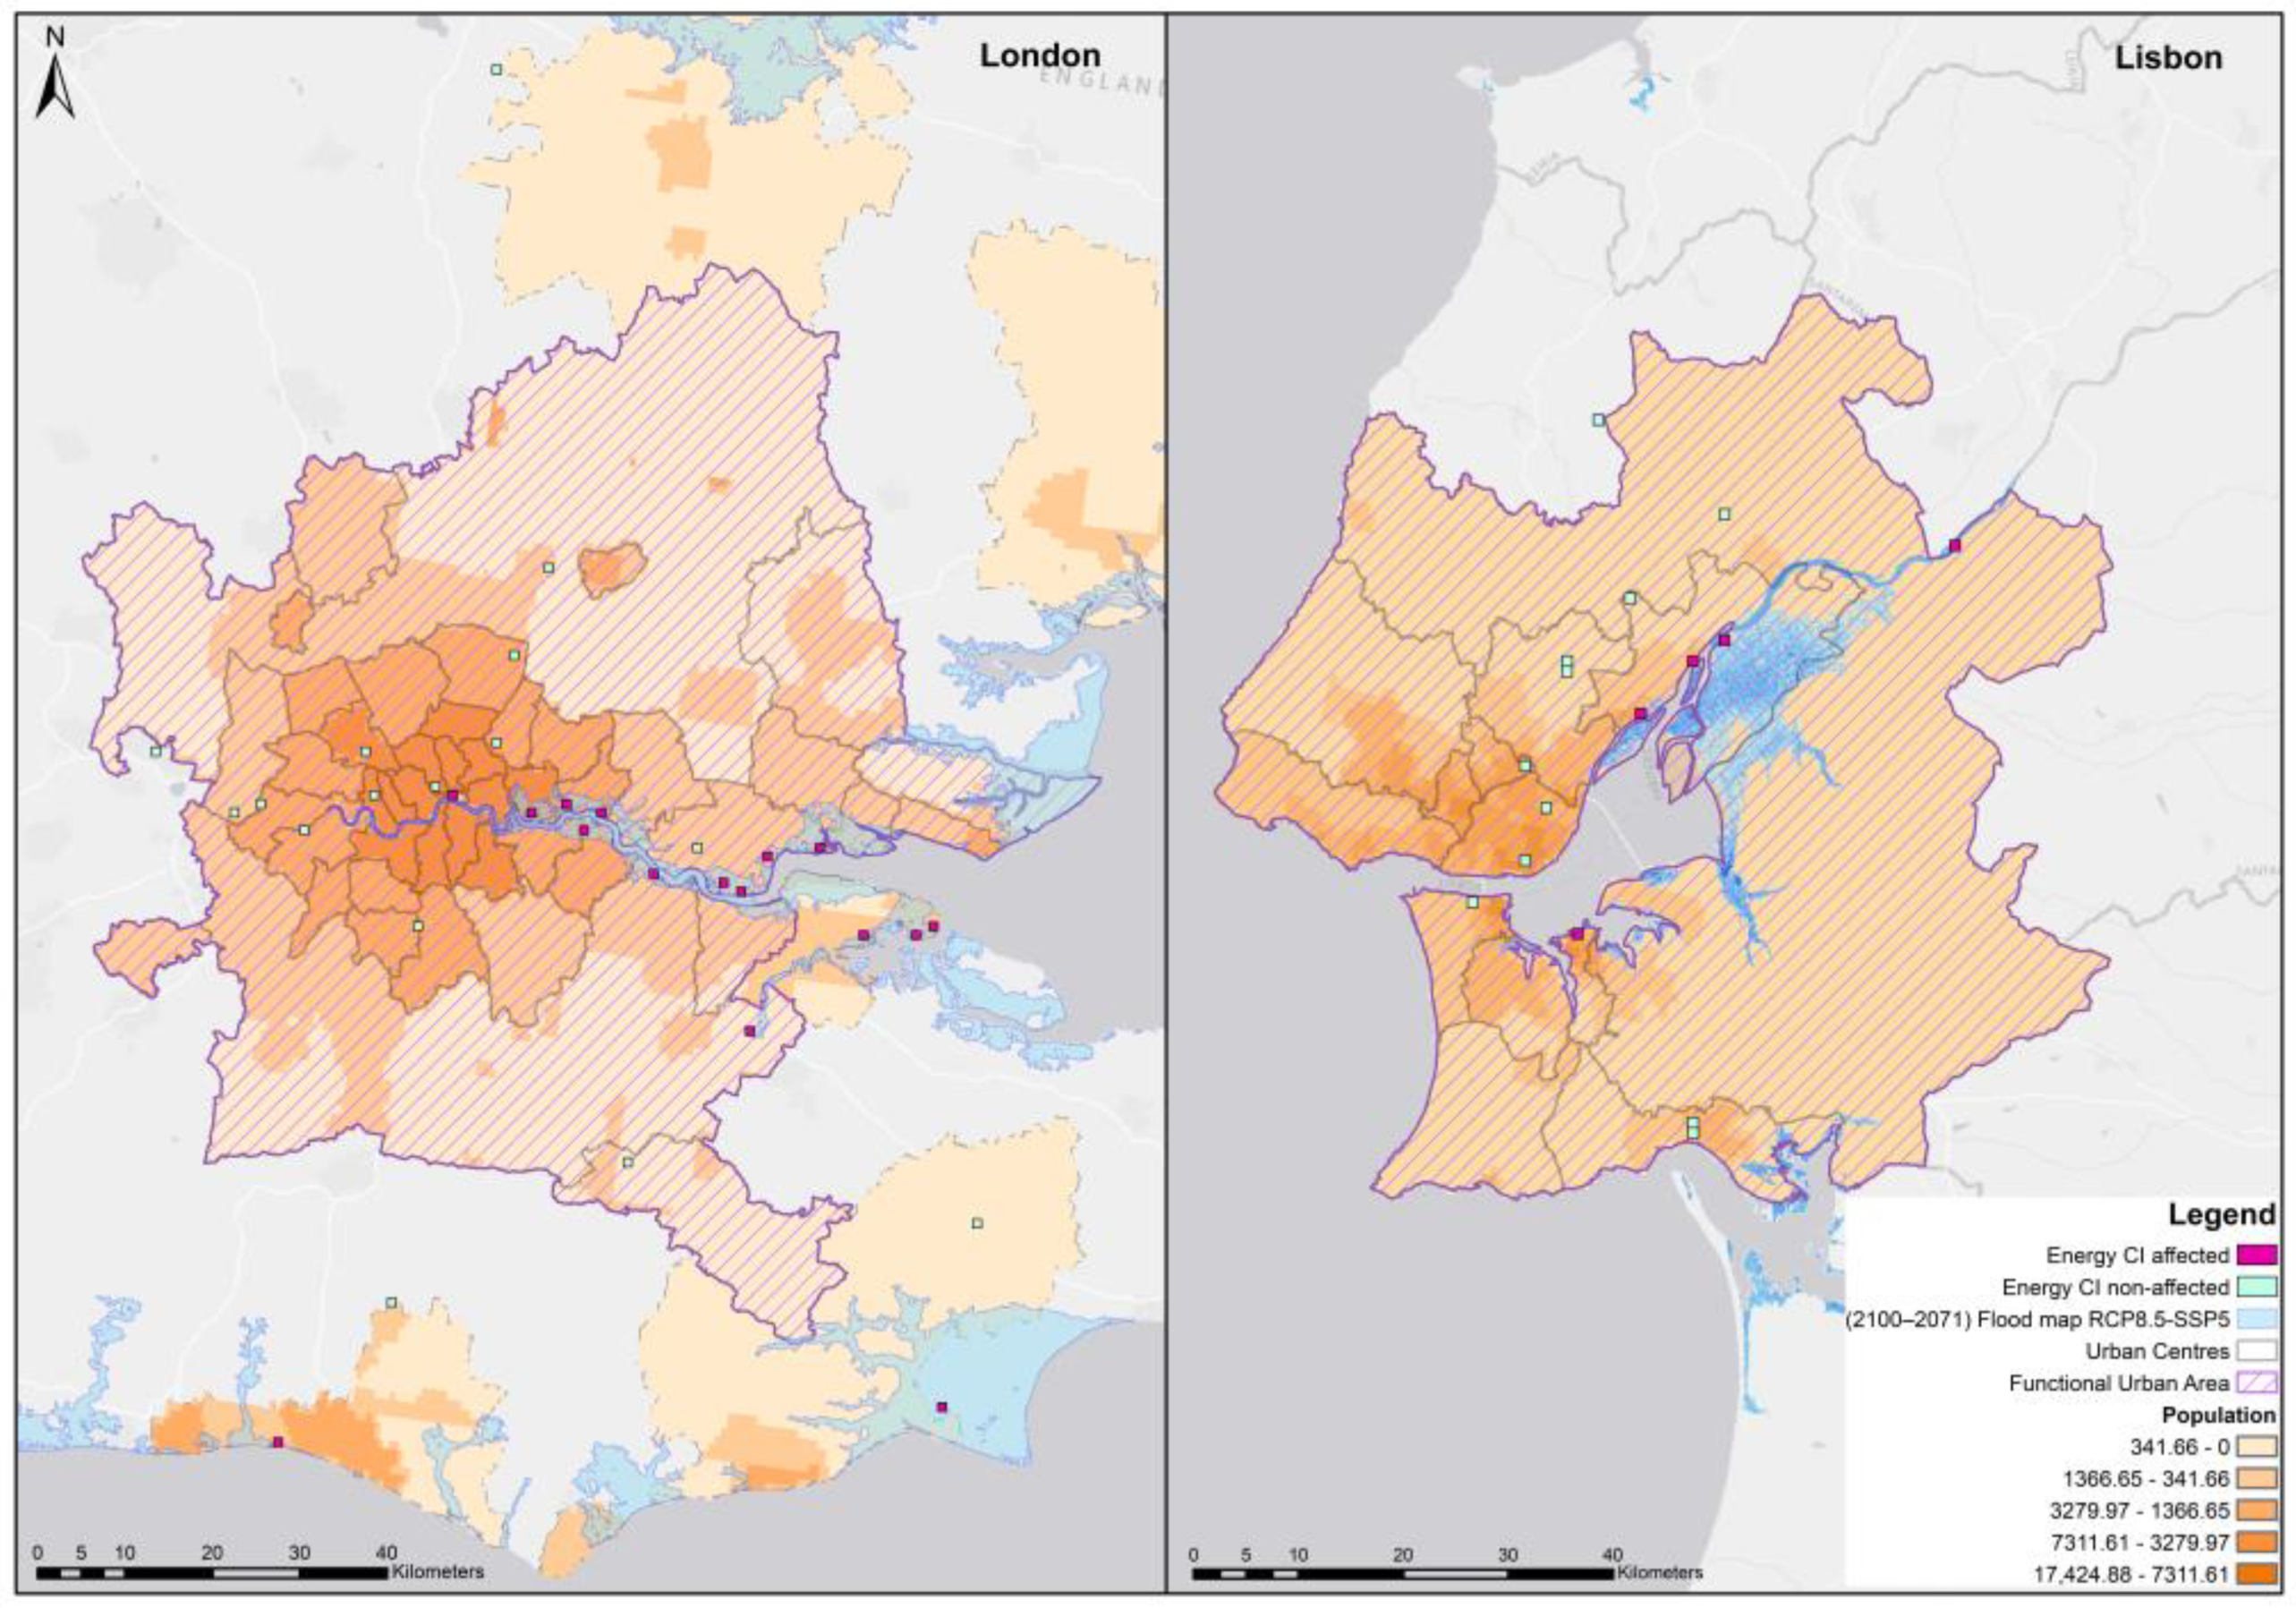
Figure 9 provide examples of the results obtained for the FUA of London and Lisbon, respectively. As can be observed in these maps, coastal flooding does not affect areas particularly large or with very high population density for the cases of London and Lisbon FUA. However, the areas affected host many CI that, in these cases, belong to the energy sector. Flooding in these areas will imply cessation of service to a significant percentage of the population served by these CI, even if they are not directly affected by this climatic hazard.
3.2.2. Water and Waste Treatment Sector Infrastructure
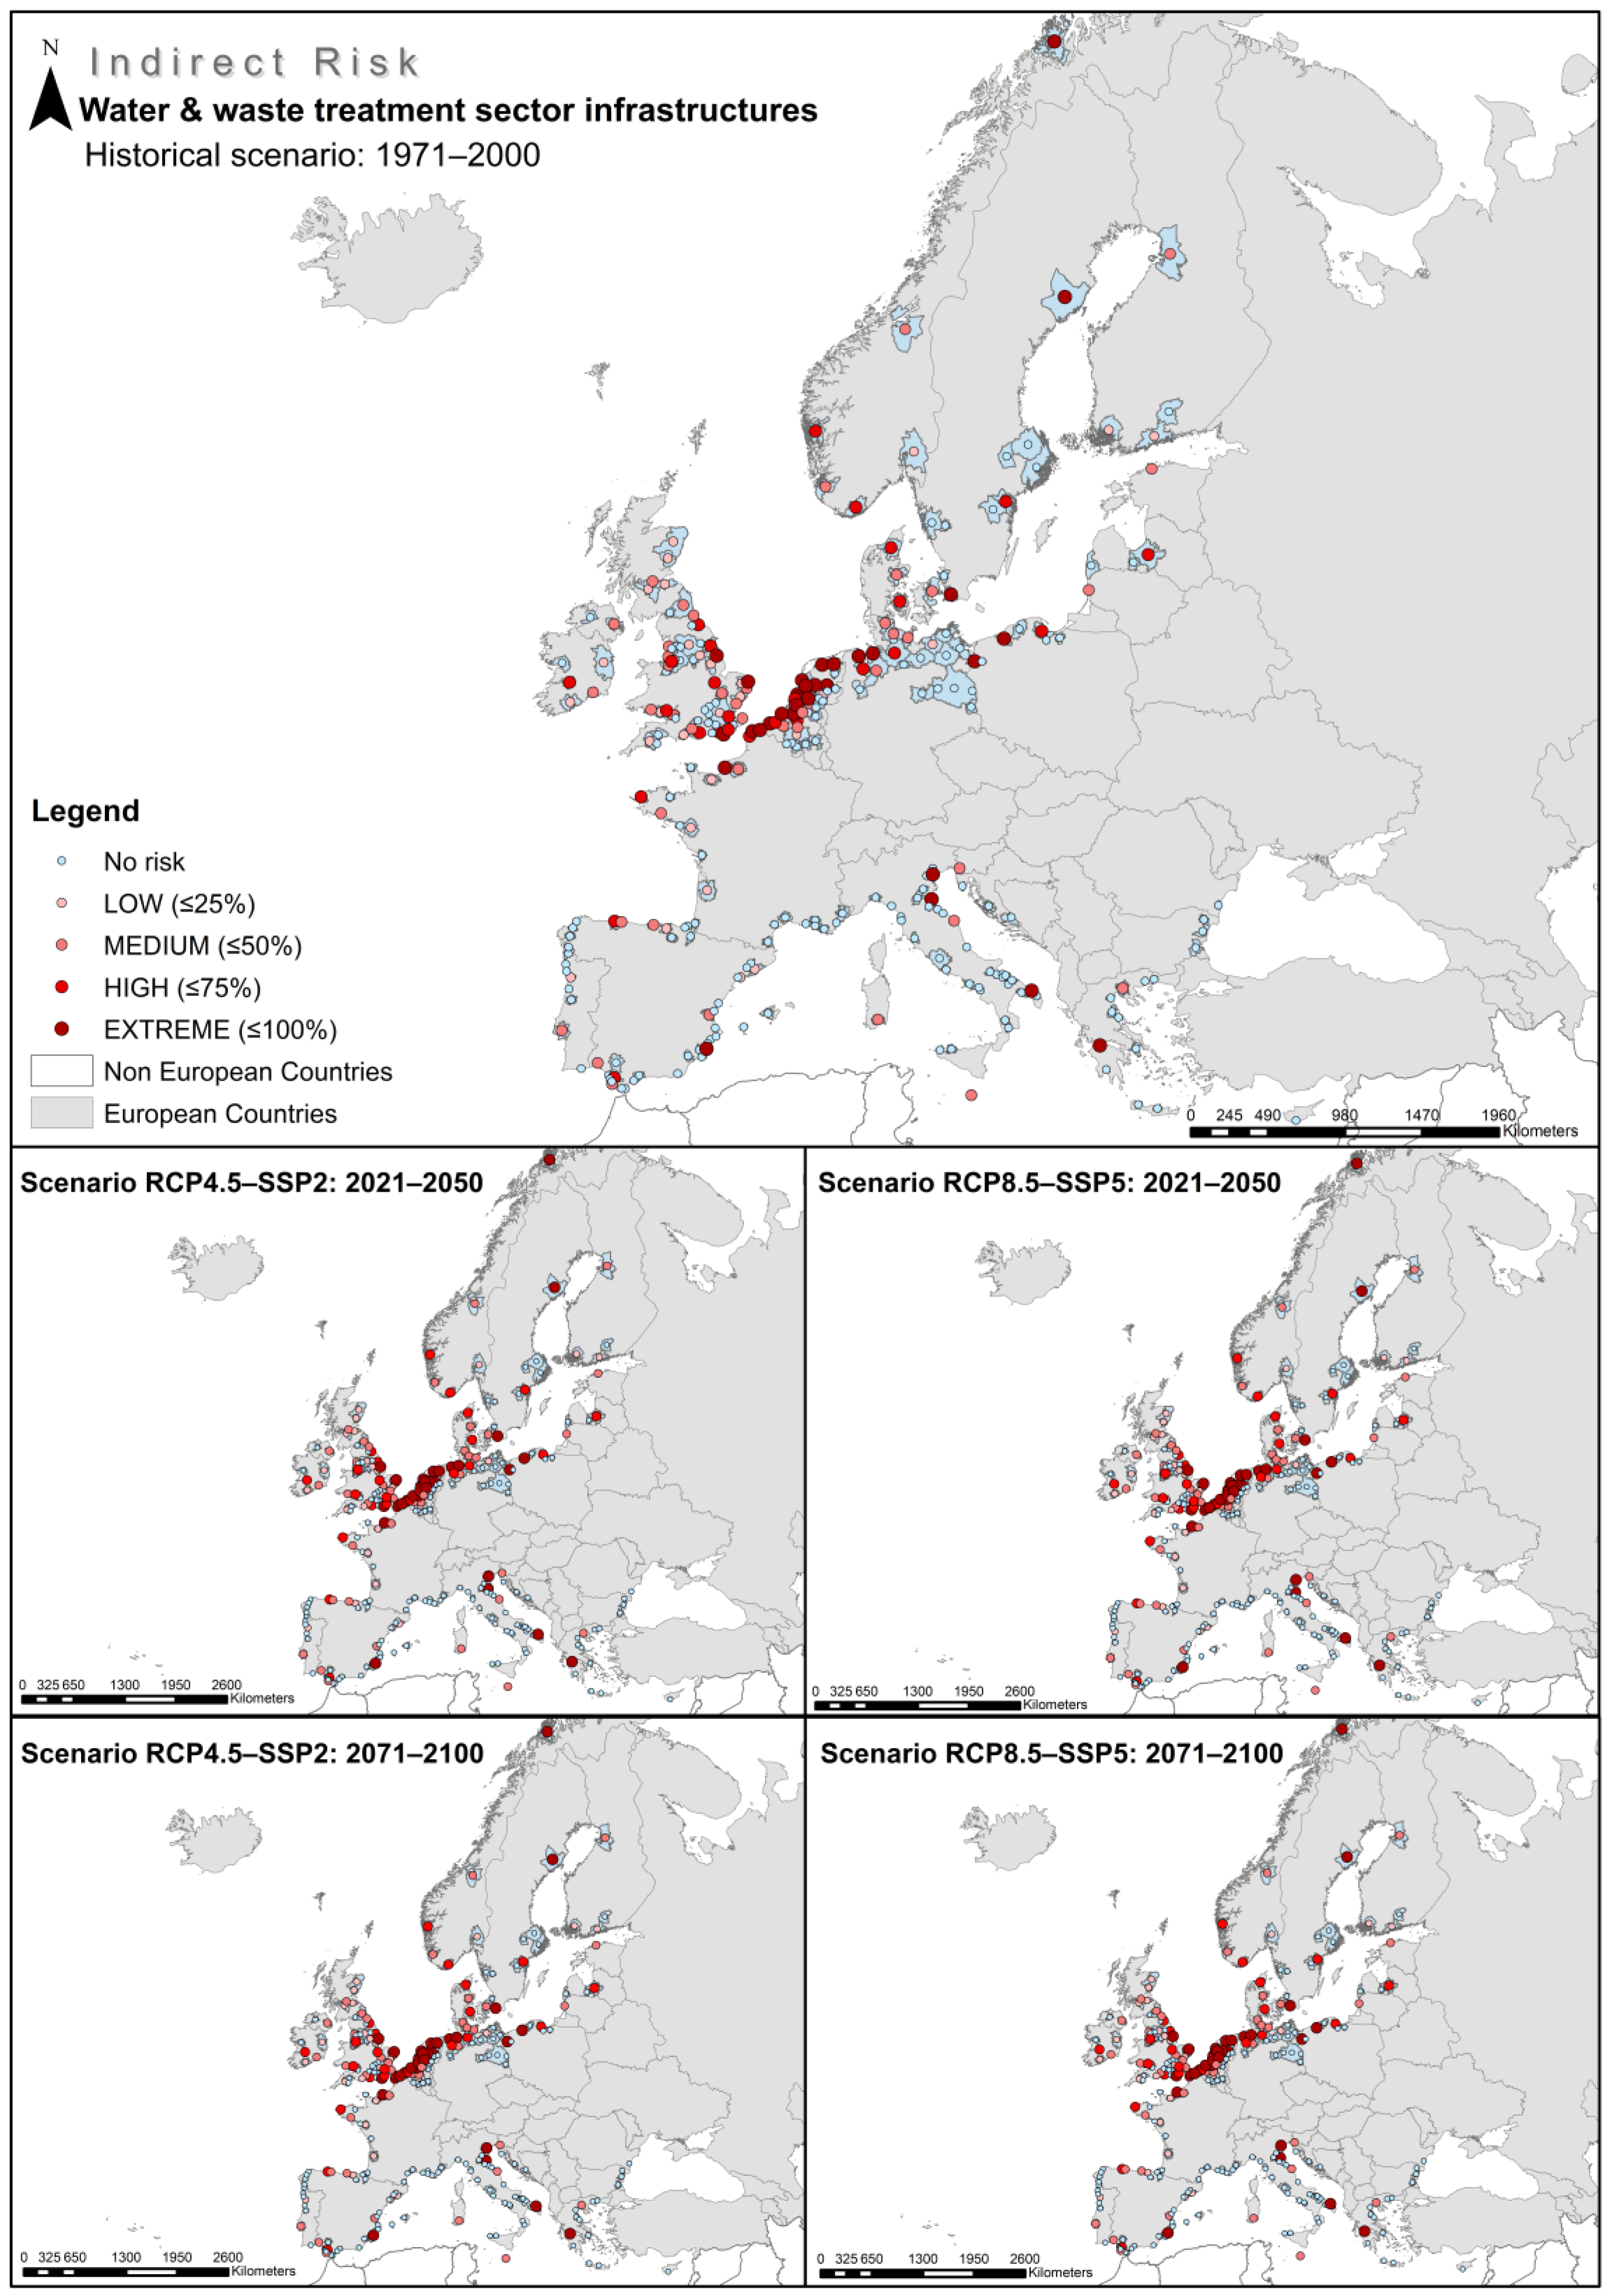
In relation to W&W critical infrastructures, the Netherlands and Belgium present a higher indirect risk to the population (
Figure 10 and
Figure A3 (
Appendix A). These areas present the higher percentages of the population affected by service interruption due to CI affected by coastal flooding. The east and south coasts of Great Britain, and some FUA in Denmark and the Scandinavian countries, also have many FUA with high levels of indirect risk. In southern Europe, Torrevieja and Valencia, in Spain; Venice, Ravenna, and Brindisi, in Italy; and Patras and Thessaloniki, in Greece, stand out with extreme levels of indirectly affected population.
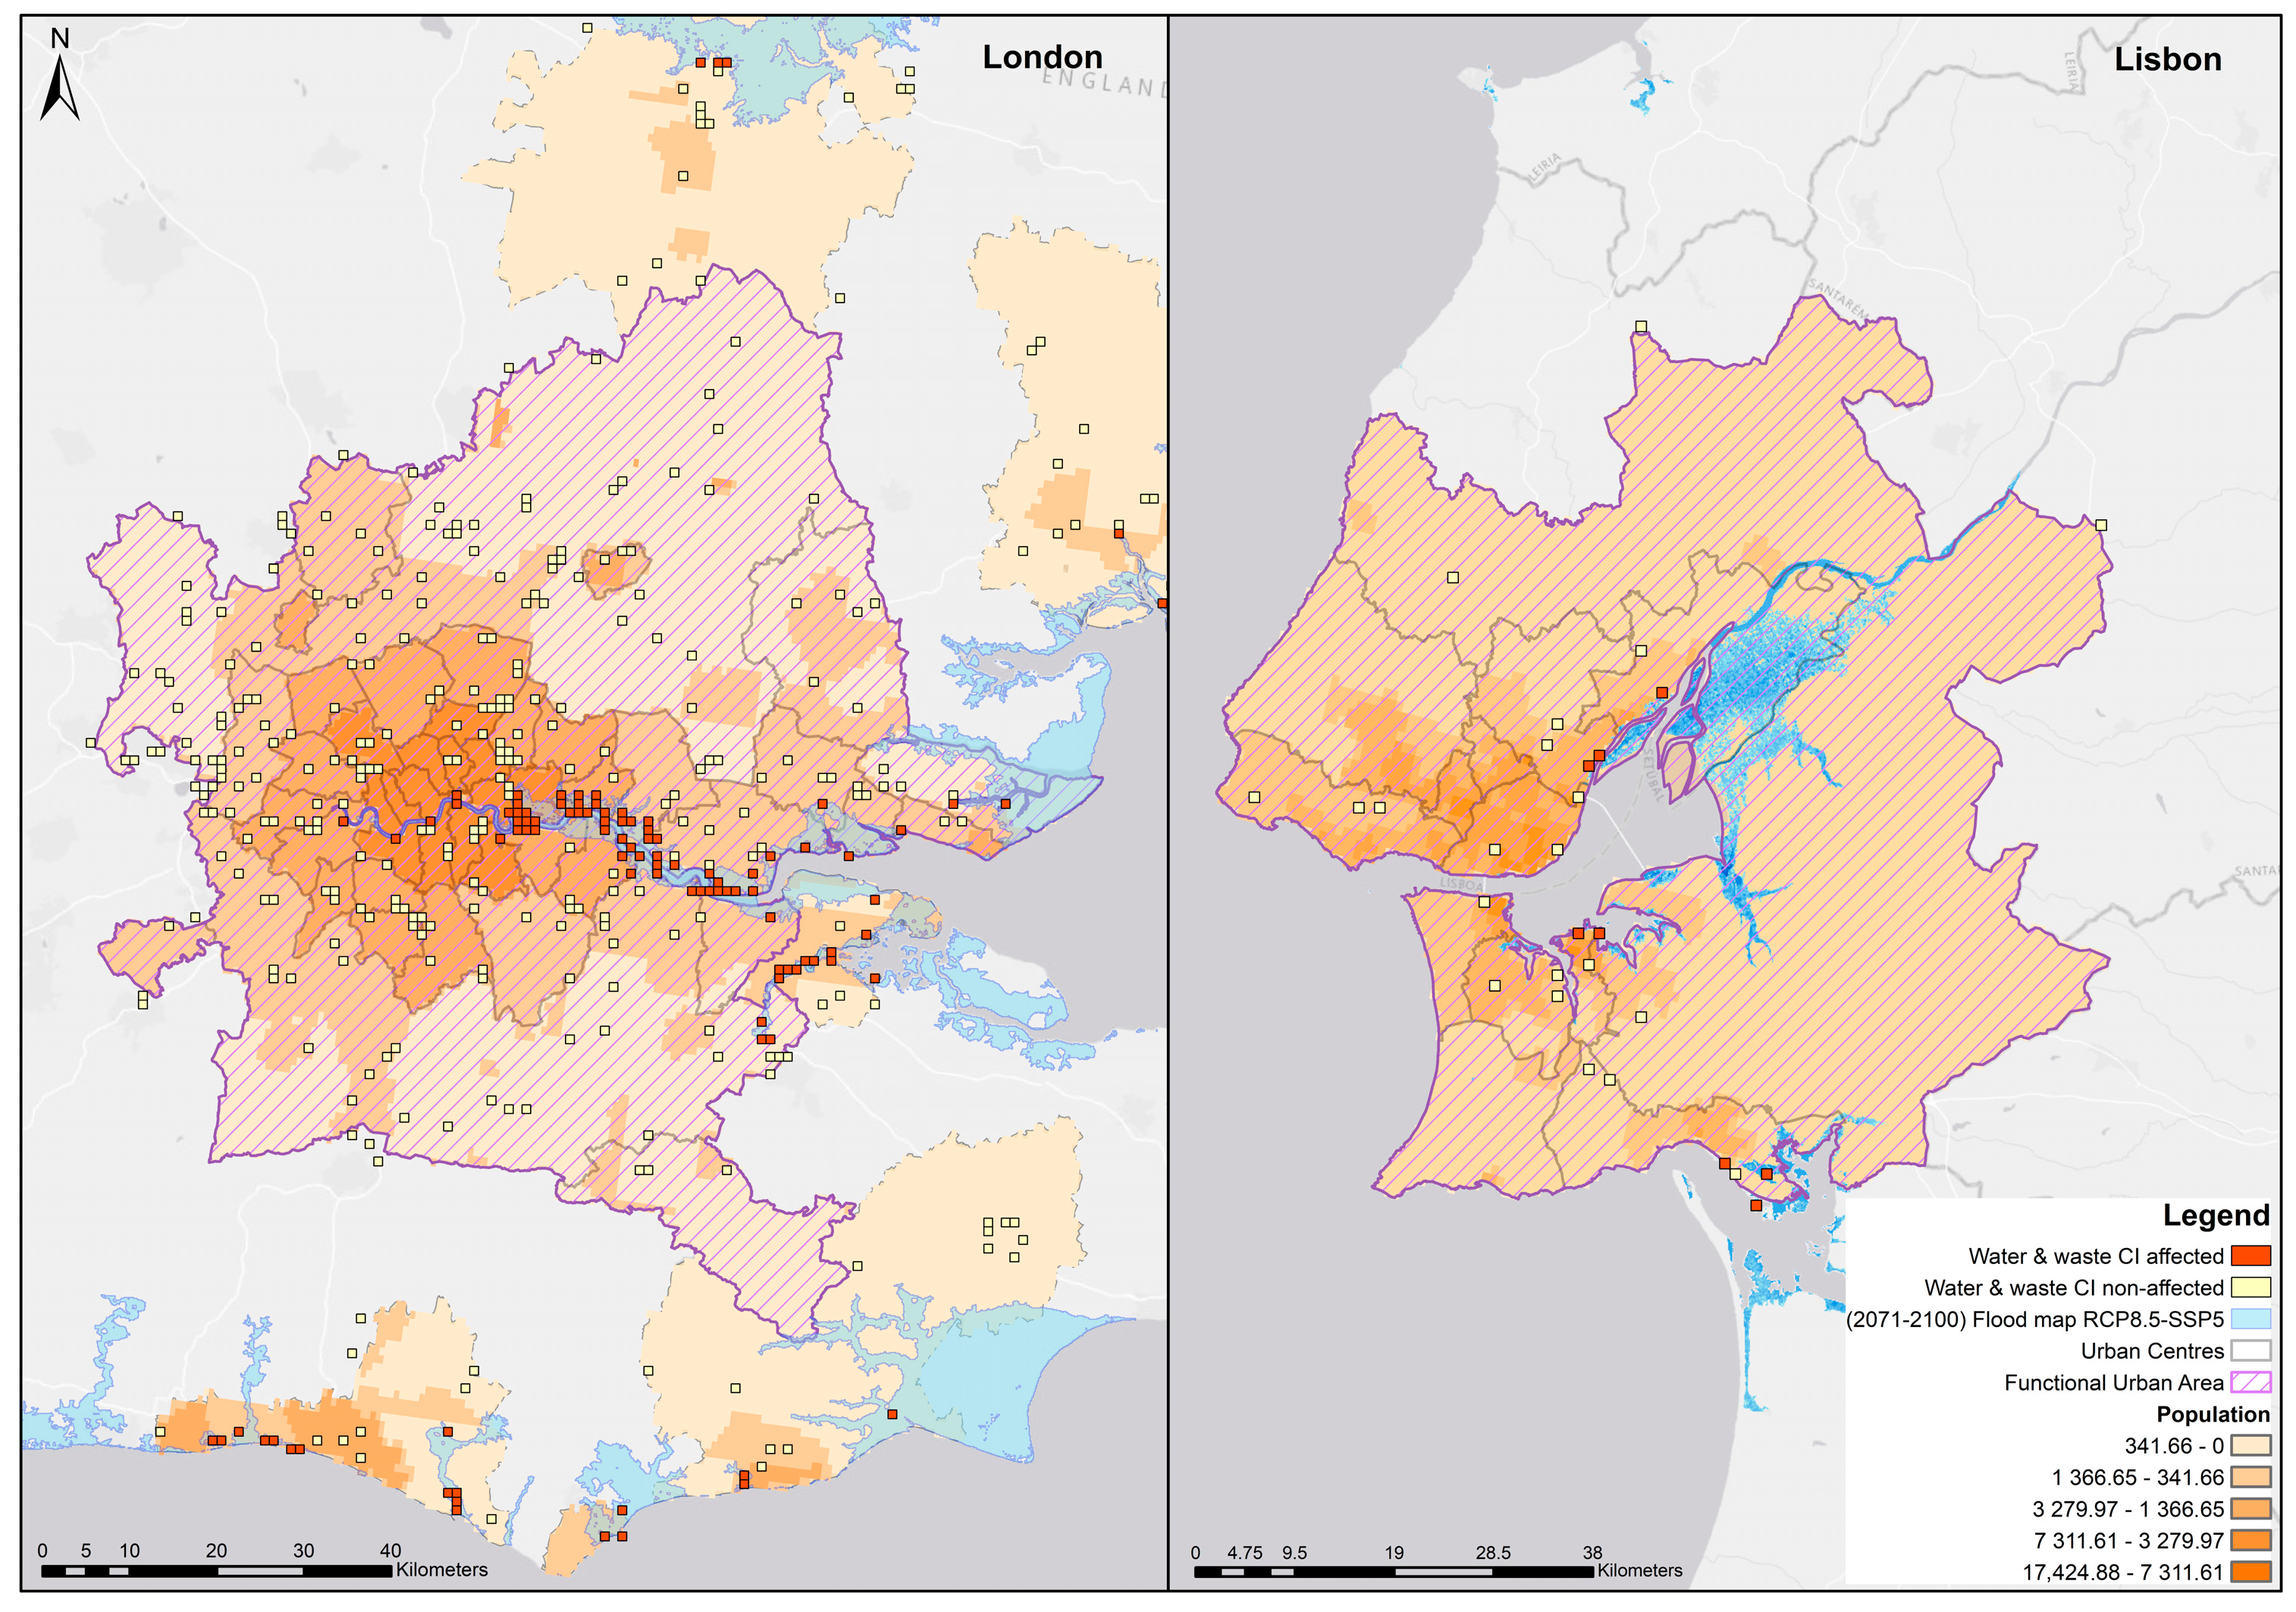
As for the energy sector,
Figure 11 illustrates the same examples (FUA of London and Lisbon) for the W&W treatment sector. As it can be observed, in both areas, an important proportion of CI is affected due to their location in flood-prone areas. This translates into a high number of people affected by service disruption in case of coastal flooding.
3.3. Risk Underestimation
The risk underestimation is calculated as the difference between the population directly affected by coastal flooding and the population indirectly affected considering the disruptions of CI in each FUA. The maps presented in
Appendix A (
Figure A4 and
Figure A5) have been developed as a result.
These maps can serve to focus on those FUA where affections on citizens are underestimated when risk assessments limit their approach to the first step of this analysis: directly assessing the exposure of citizens to coastal flooding, neglecting the effects of CI disruption to citizens.
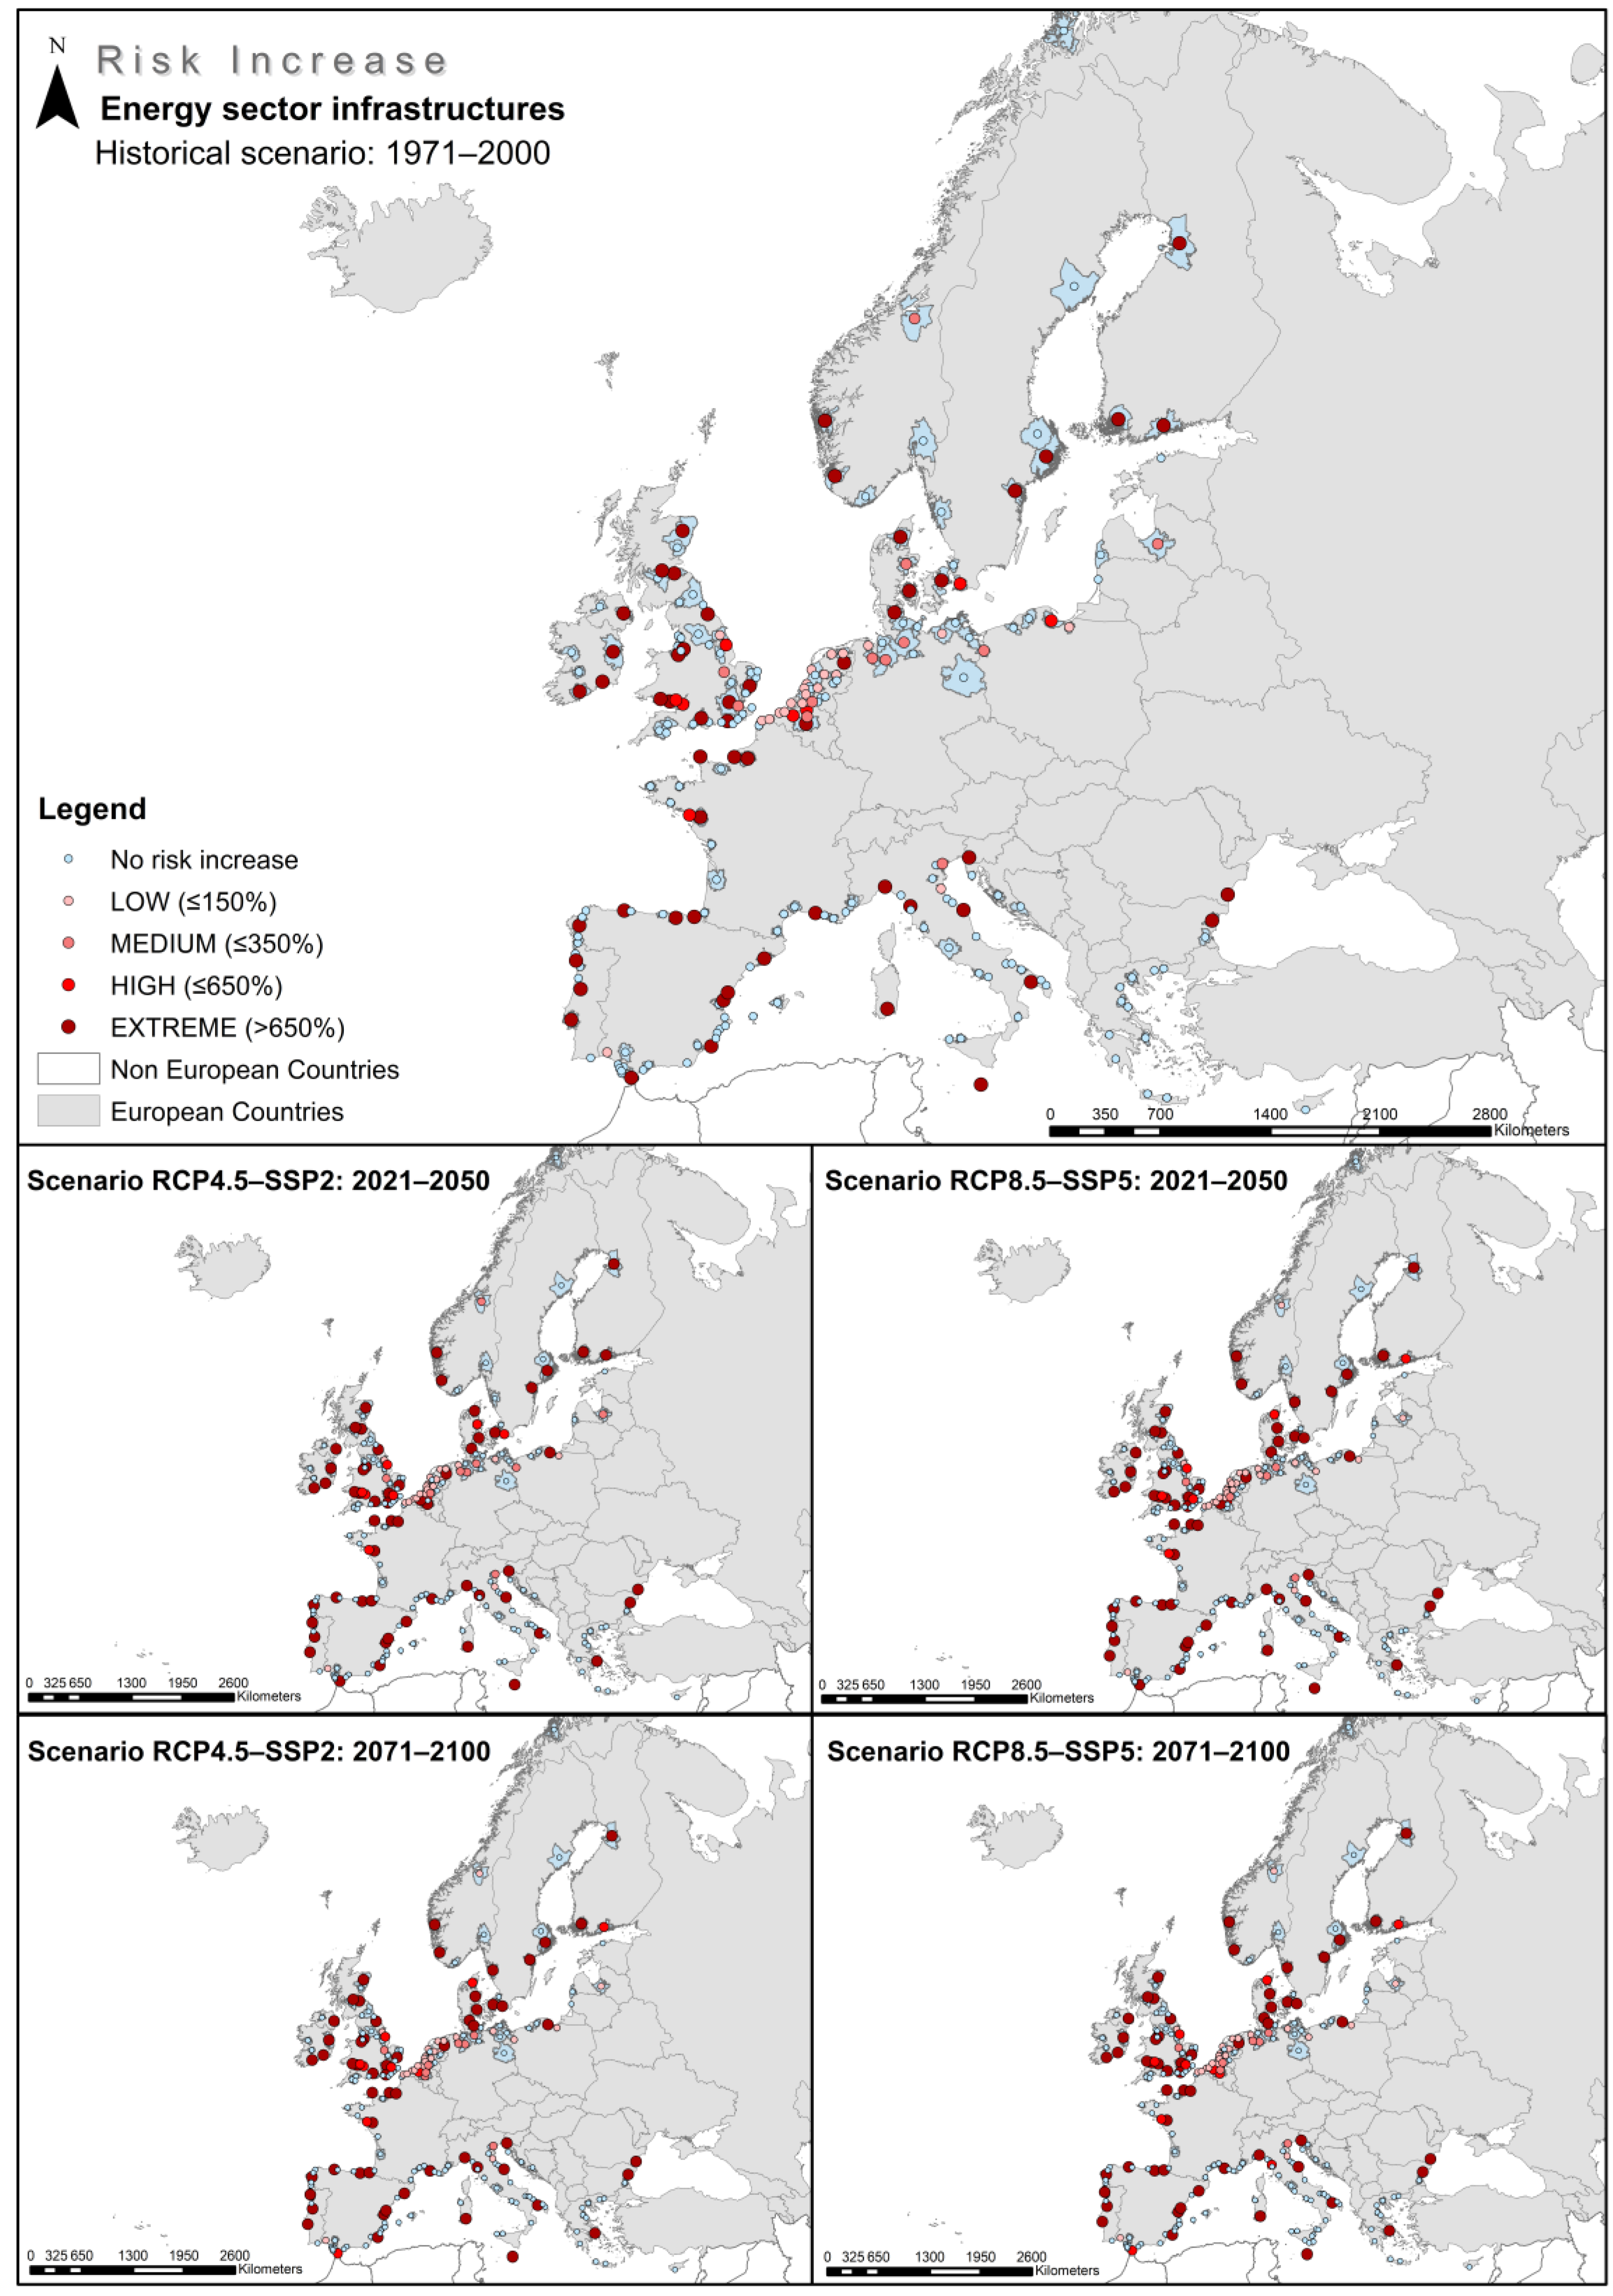
3.3.1. Energy Sector Infrastructures
Regarding the Energy CI sector, many FUAs in Europe show high-risk increases (over 650%) when considering the increase in the number of people affected by indirect risk compared to those affected by direct risk. Up to 55 urban areas have been found that show extreme levels of risk increase.
Figure 12 presents the results for the historical period for illustrative purposes, although the results for the RCP4.5 and RCP8.5 scenarios are also presented in
Appendix A. From these maps, it is possible to identify the FUA or areas in the European coastline where the greatest increases in risk overpopulation occur. One of the most significant results that can be derived from these results is that the area comprising the “low countries” does not stand out for presenting high percentage increases of risk. This implies that the difference between direct and indirect risk is low, so no risk underestimation in these areas is considered in risk analysis. The directly at-risk population is high and, therefore, no major increases could occur when CI disruptions take place. On the contrary, results show that areas such as Genoa, Barcelona, Edinburgh, Malta, or Cadiz stand out for showing a great risk underestimation, with a low directly at-risk population percentage, but higher risk levels when considering the risk over CI and the served population.
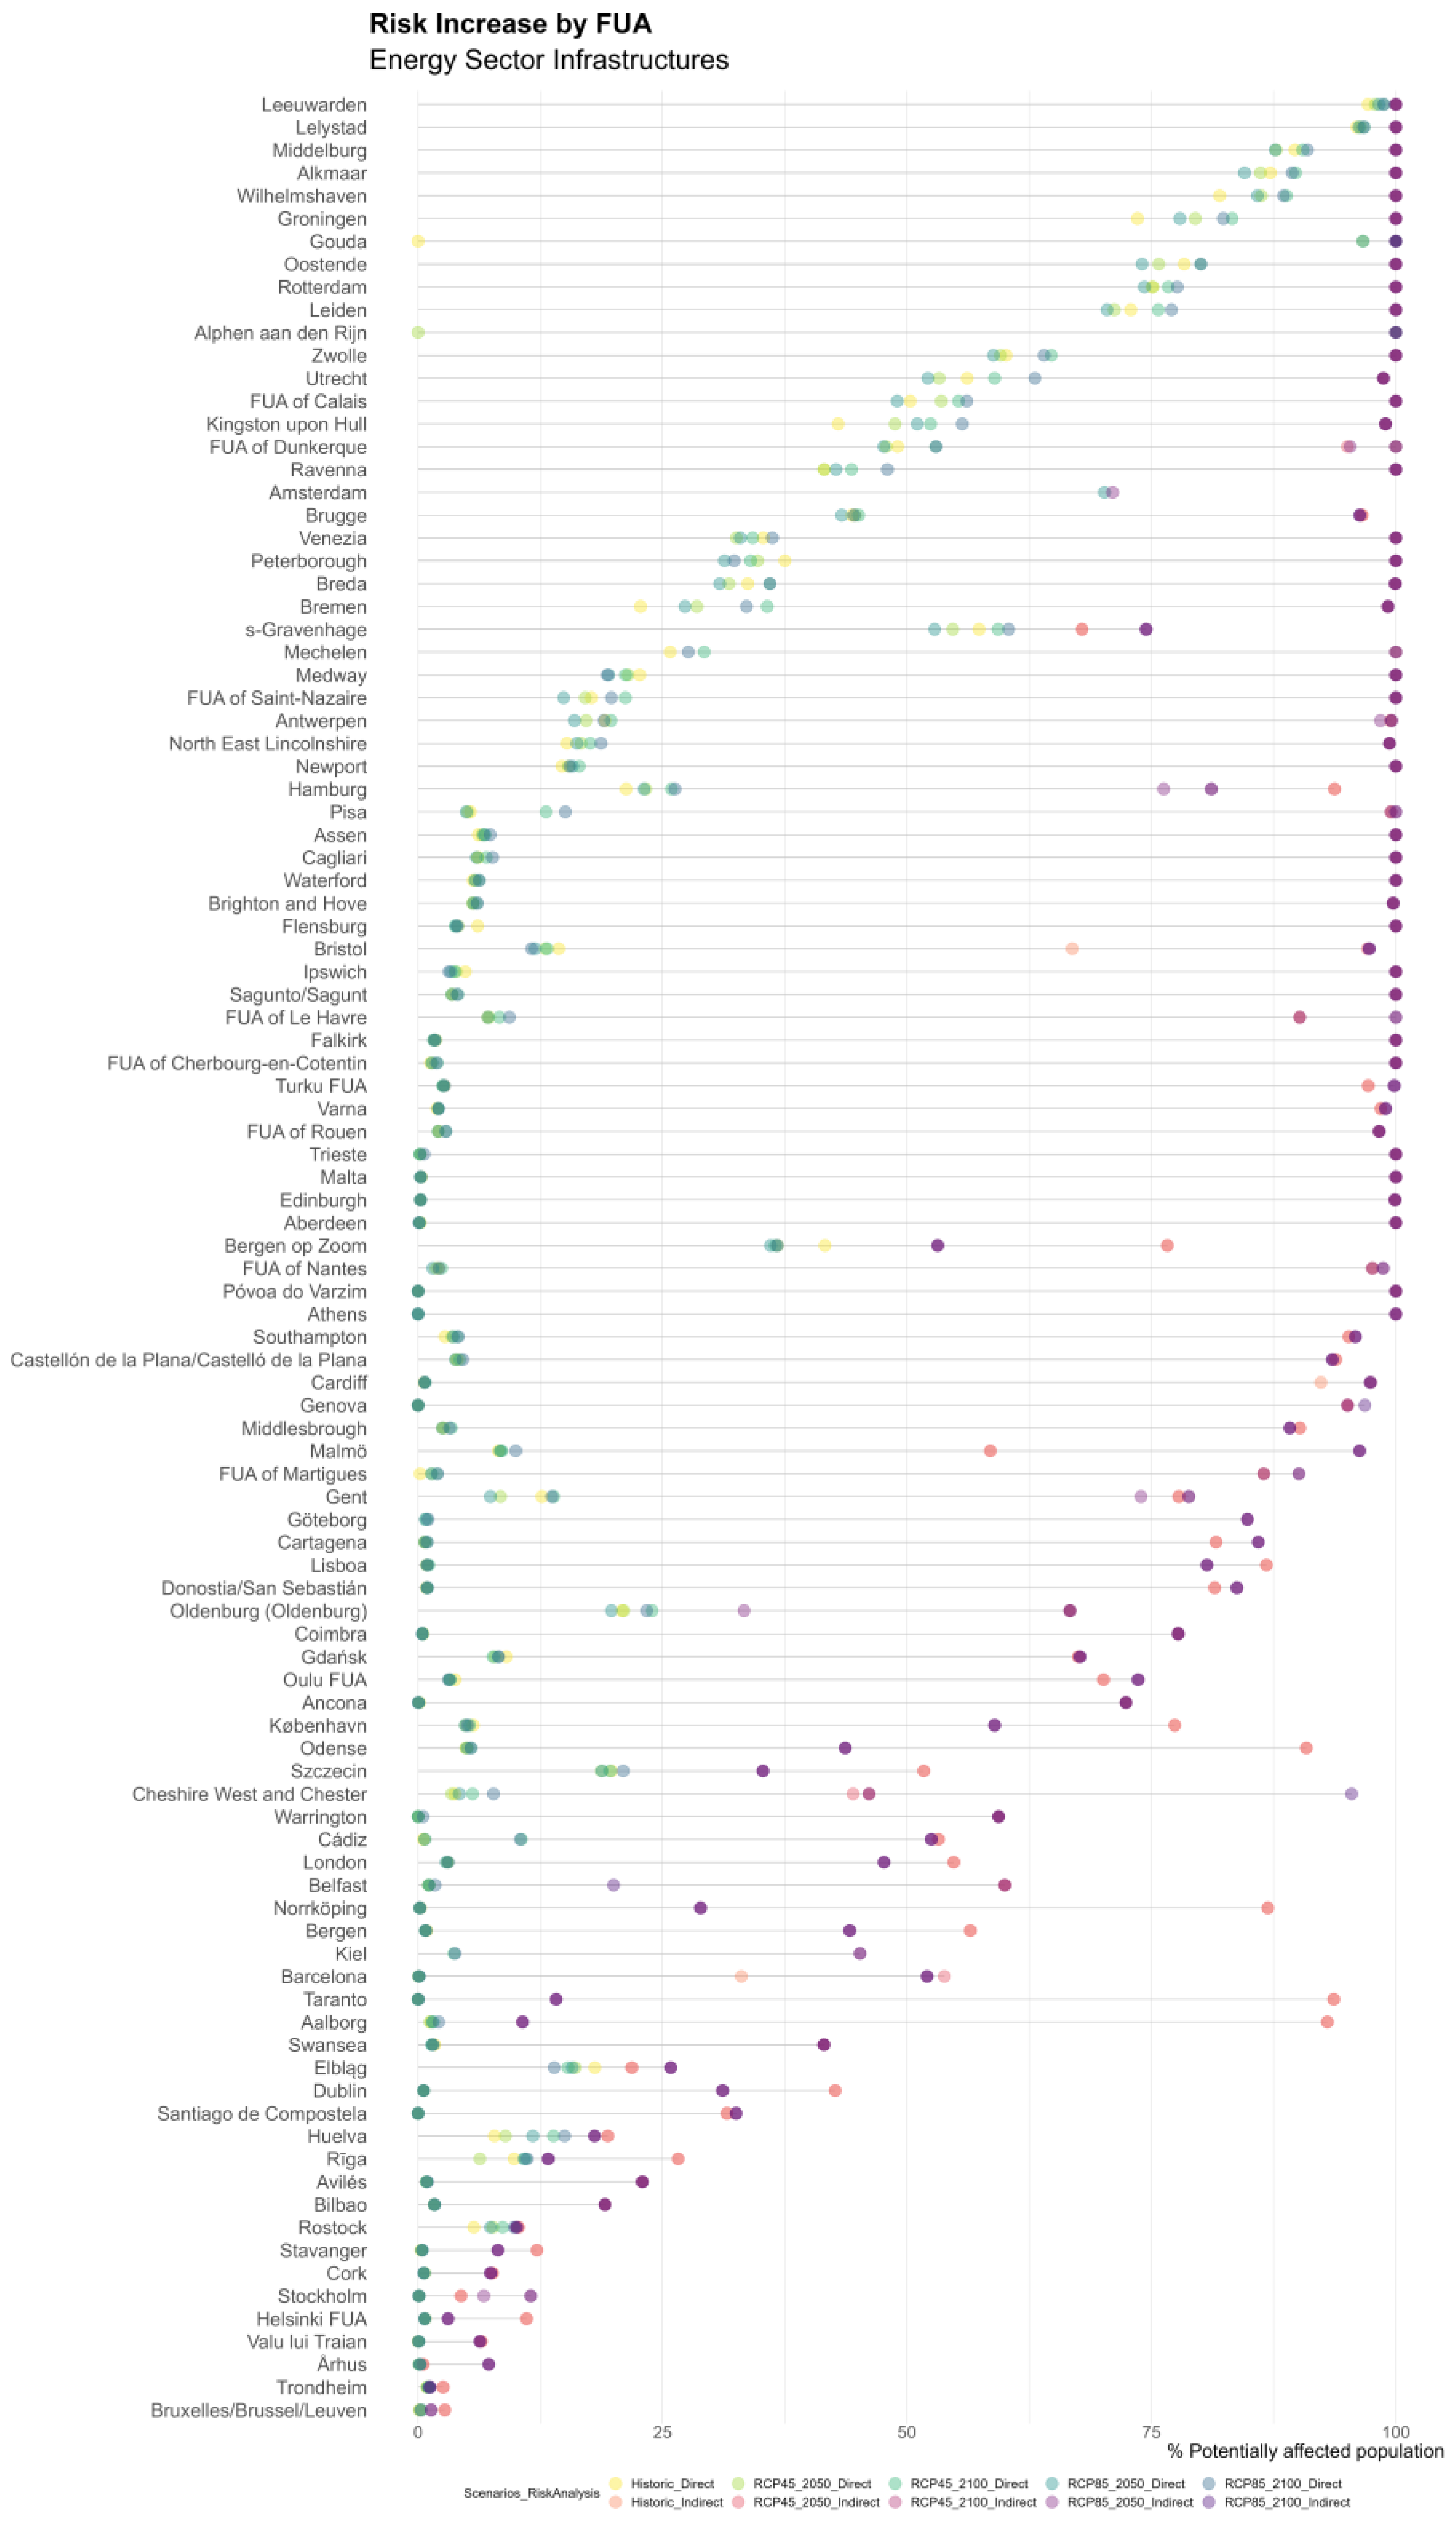
Analyzing the results shown in
Figure 13 (and
Figure A6 in
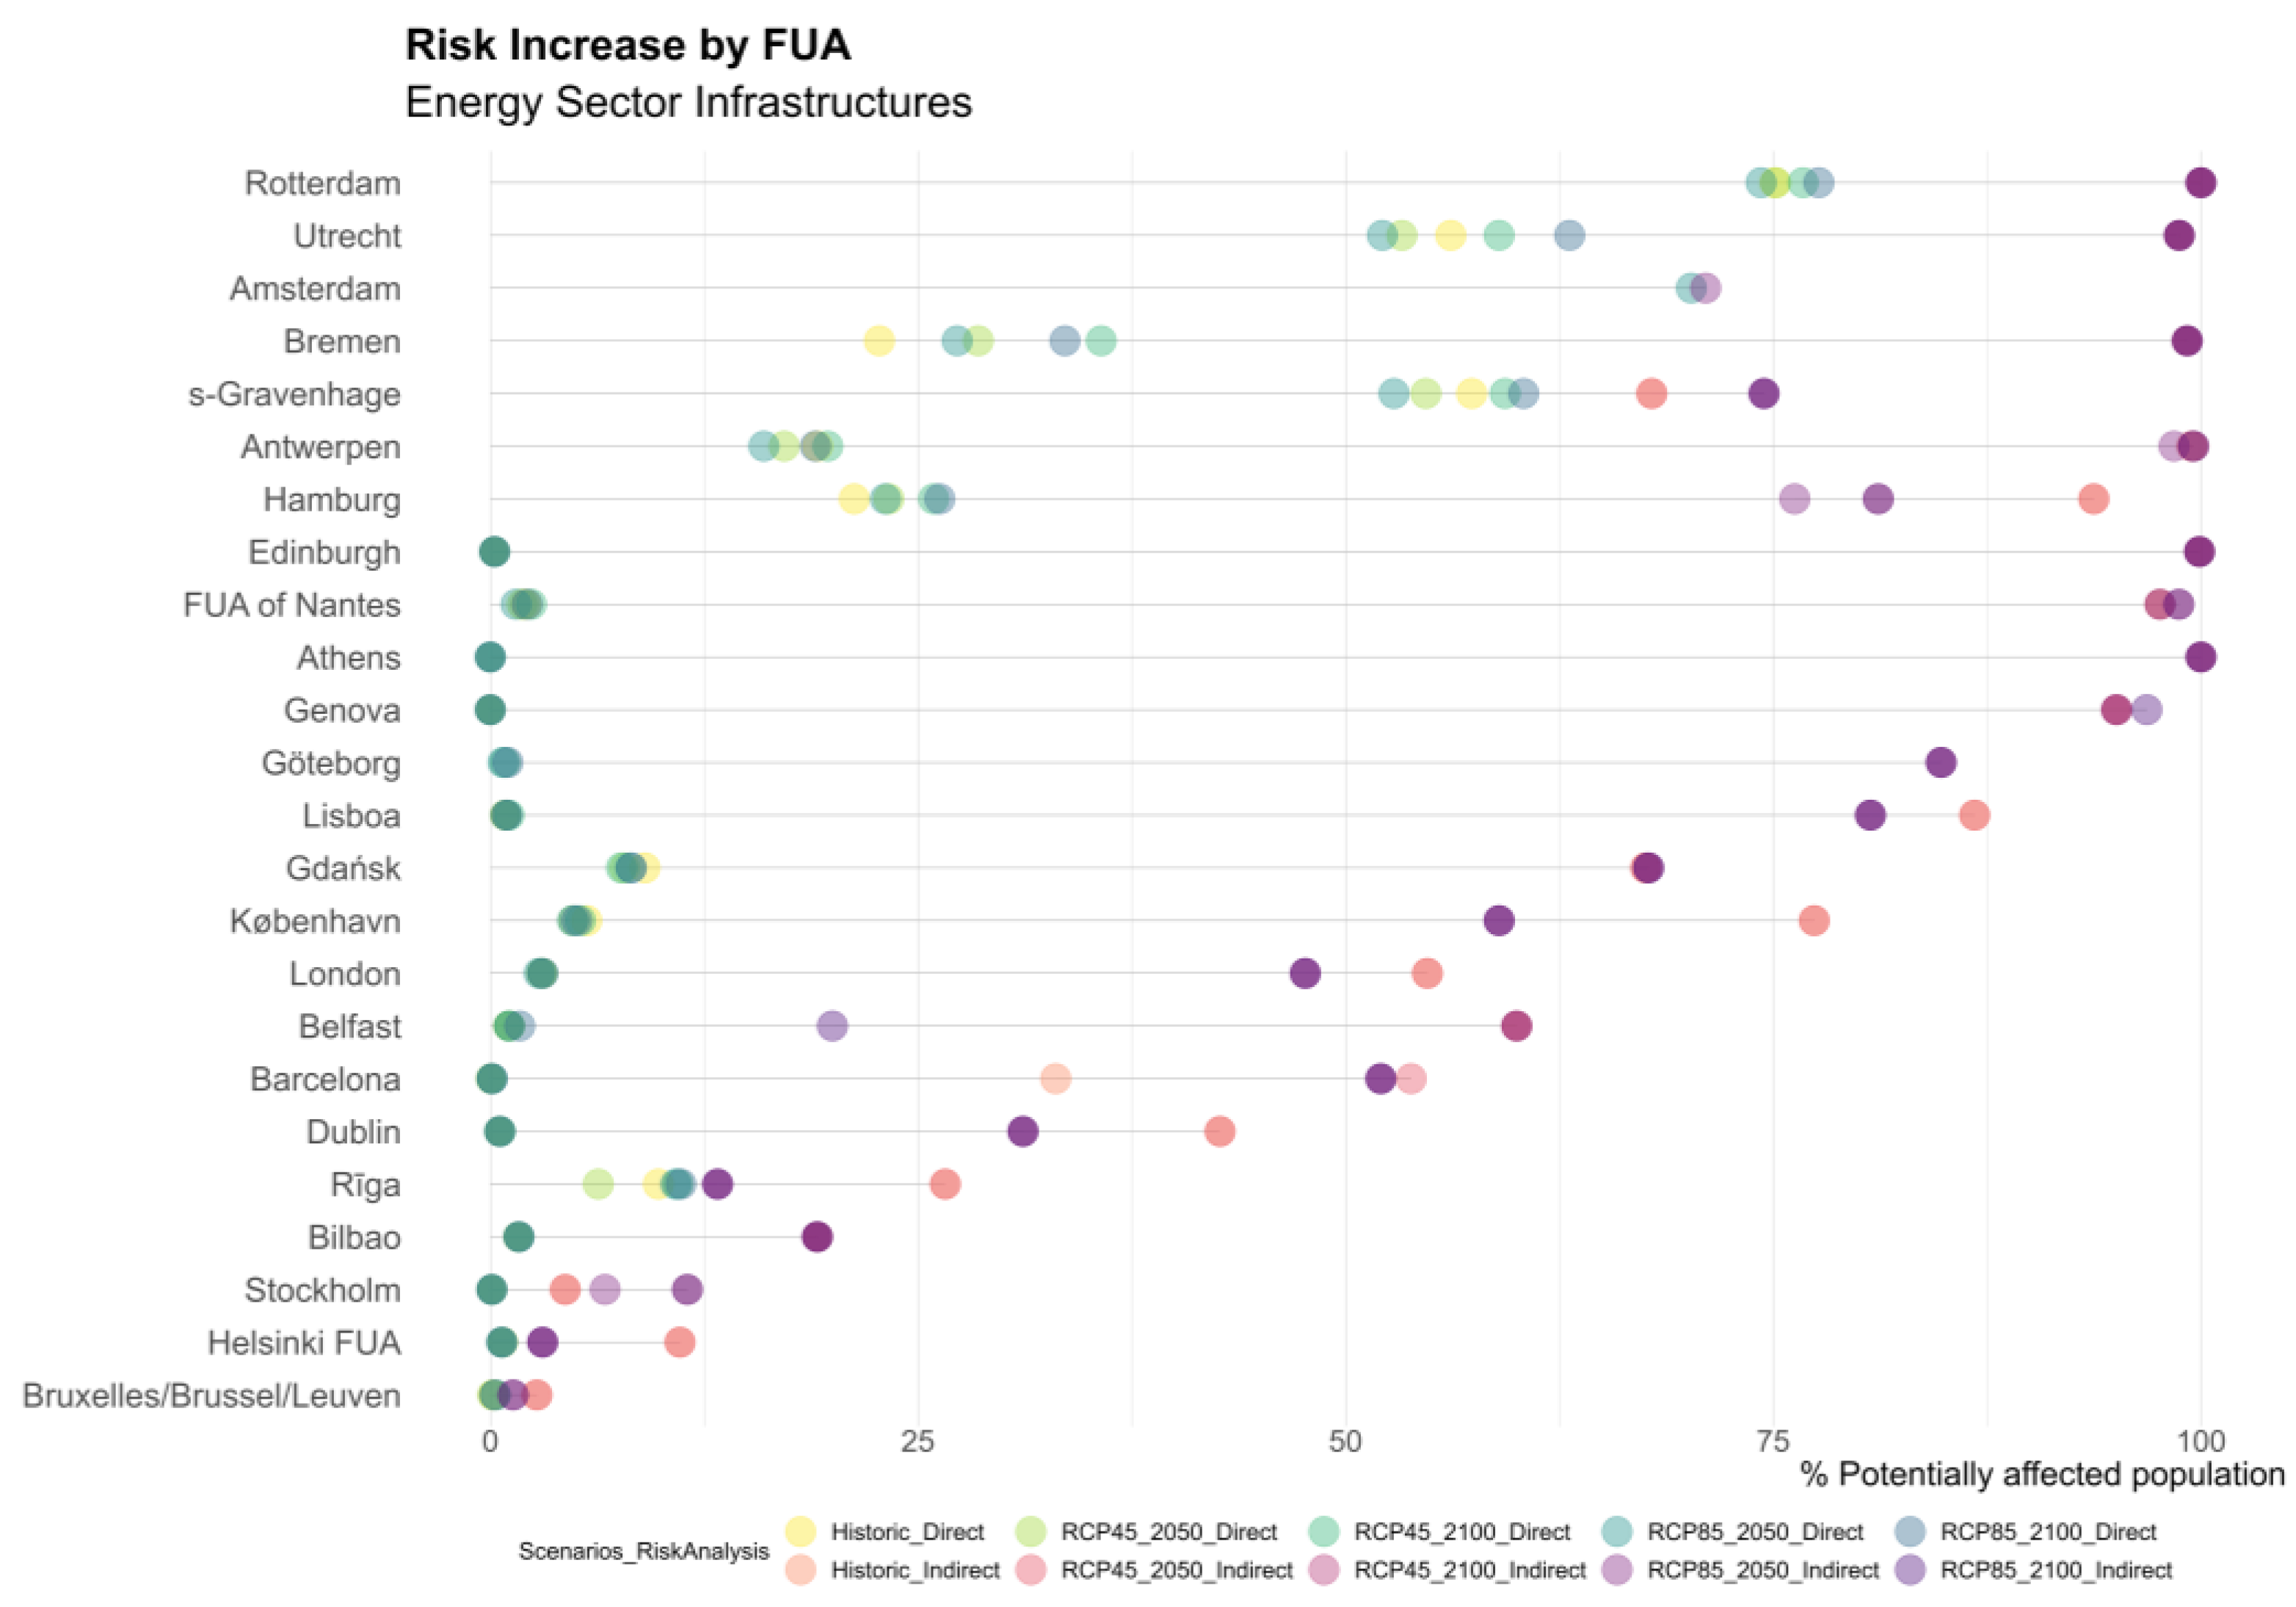
Appendix B), European coastal FUA can be distinguished into three different types, depending on risk underestimation:
Upper sector of the chart (Type A): The FUAs in this range have percentages of the population directly affected by coastal flooding that exceeds 50% and percentages of the population indirectly affected due to the disruption of the functioning of the CI that is close to 100%. In these FUAs, the underestimation of indirect risk is not classified as critical. The direct risk level of overpopulation is high per se, so indirect risk only emphasizes the relevance of coastal flood risk in the area.
Intermediate sector of the chart (Type B): This type includes the FUAs that present differences between the percentage of the population directly and indirectly affected by the effects of coastal flooding between 50 and 100%. FUAs of this group present the highest degree of criticality from the perspective of risk underestimation.
Lower sector of the chart (Type C): This type includes the FUAs with lower direct risk level overpopulation by coastal flooding, and percentages of the population indirectly at risk lower than 50%. In the case of these FUAs, despite the indirect risk to the population, the risk level is not so critical, mainly due to the greater resilience of the infrastructure network in these areas (in particular, due to the greater redundancy or fragmentation of the network).
The categorization of the FUA into the three types previously defined (type A, B, and C) allows us to make a first approximation to the identification of the most critical areas in terms of the underestimation of the indirect risks of coastal flooding on the population. Although, in terms of the percentage of affected population, it is possible to identify those FUA with the greatest increase in people affected by coastal flooding when CI failures are considered (
Figure 12), this does not provide a sufficiently complete overview to determine which cities are the most critical, concerning risk underestimation. This is because an increase of 100 people can represent a very high percentage increase in FUAs with a low population density, while in another FUA with a higher population density, this increase would be considered negligible. For this purpose, it is necessary to include the scale factor of the population density of the FUA in the analysis. This need highlights the complexities in measuring risk and establishing generic risk levels.
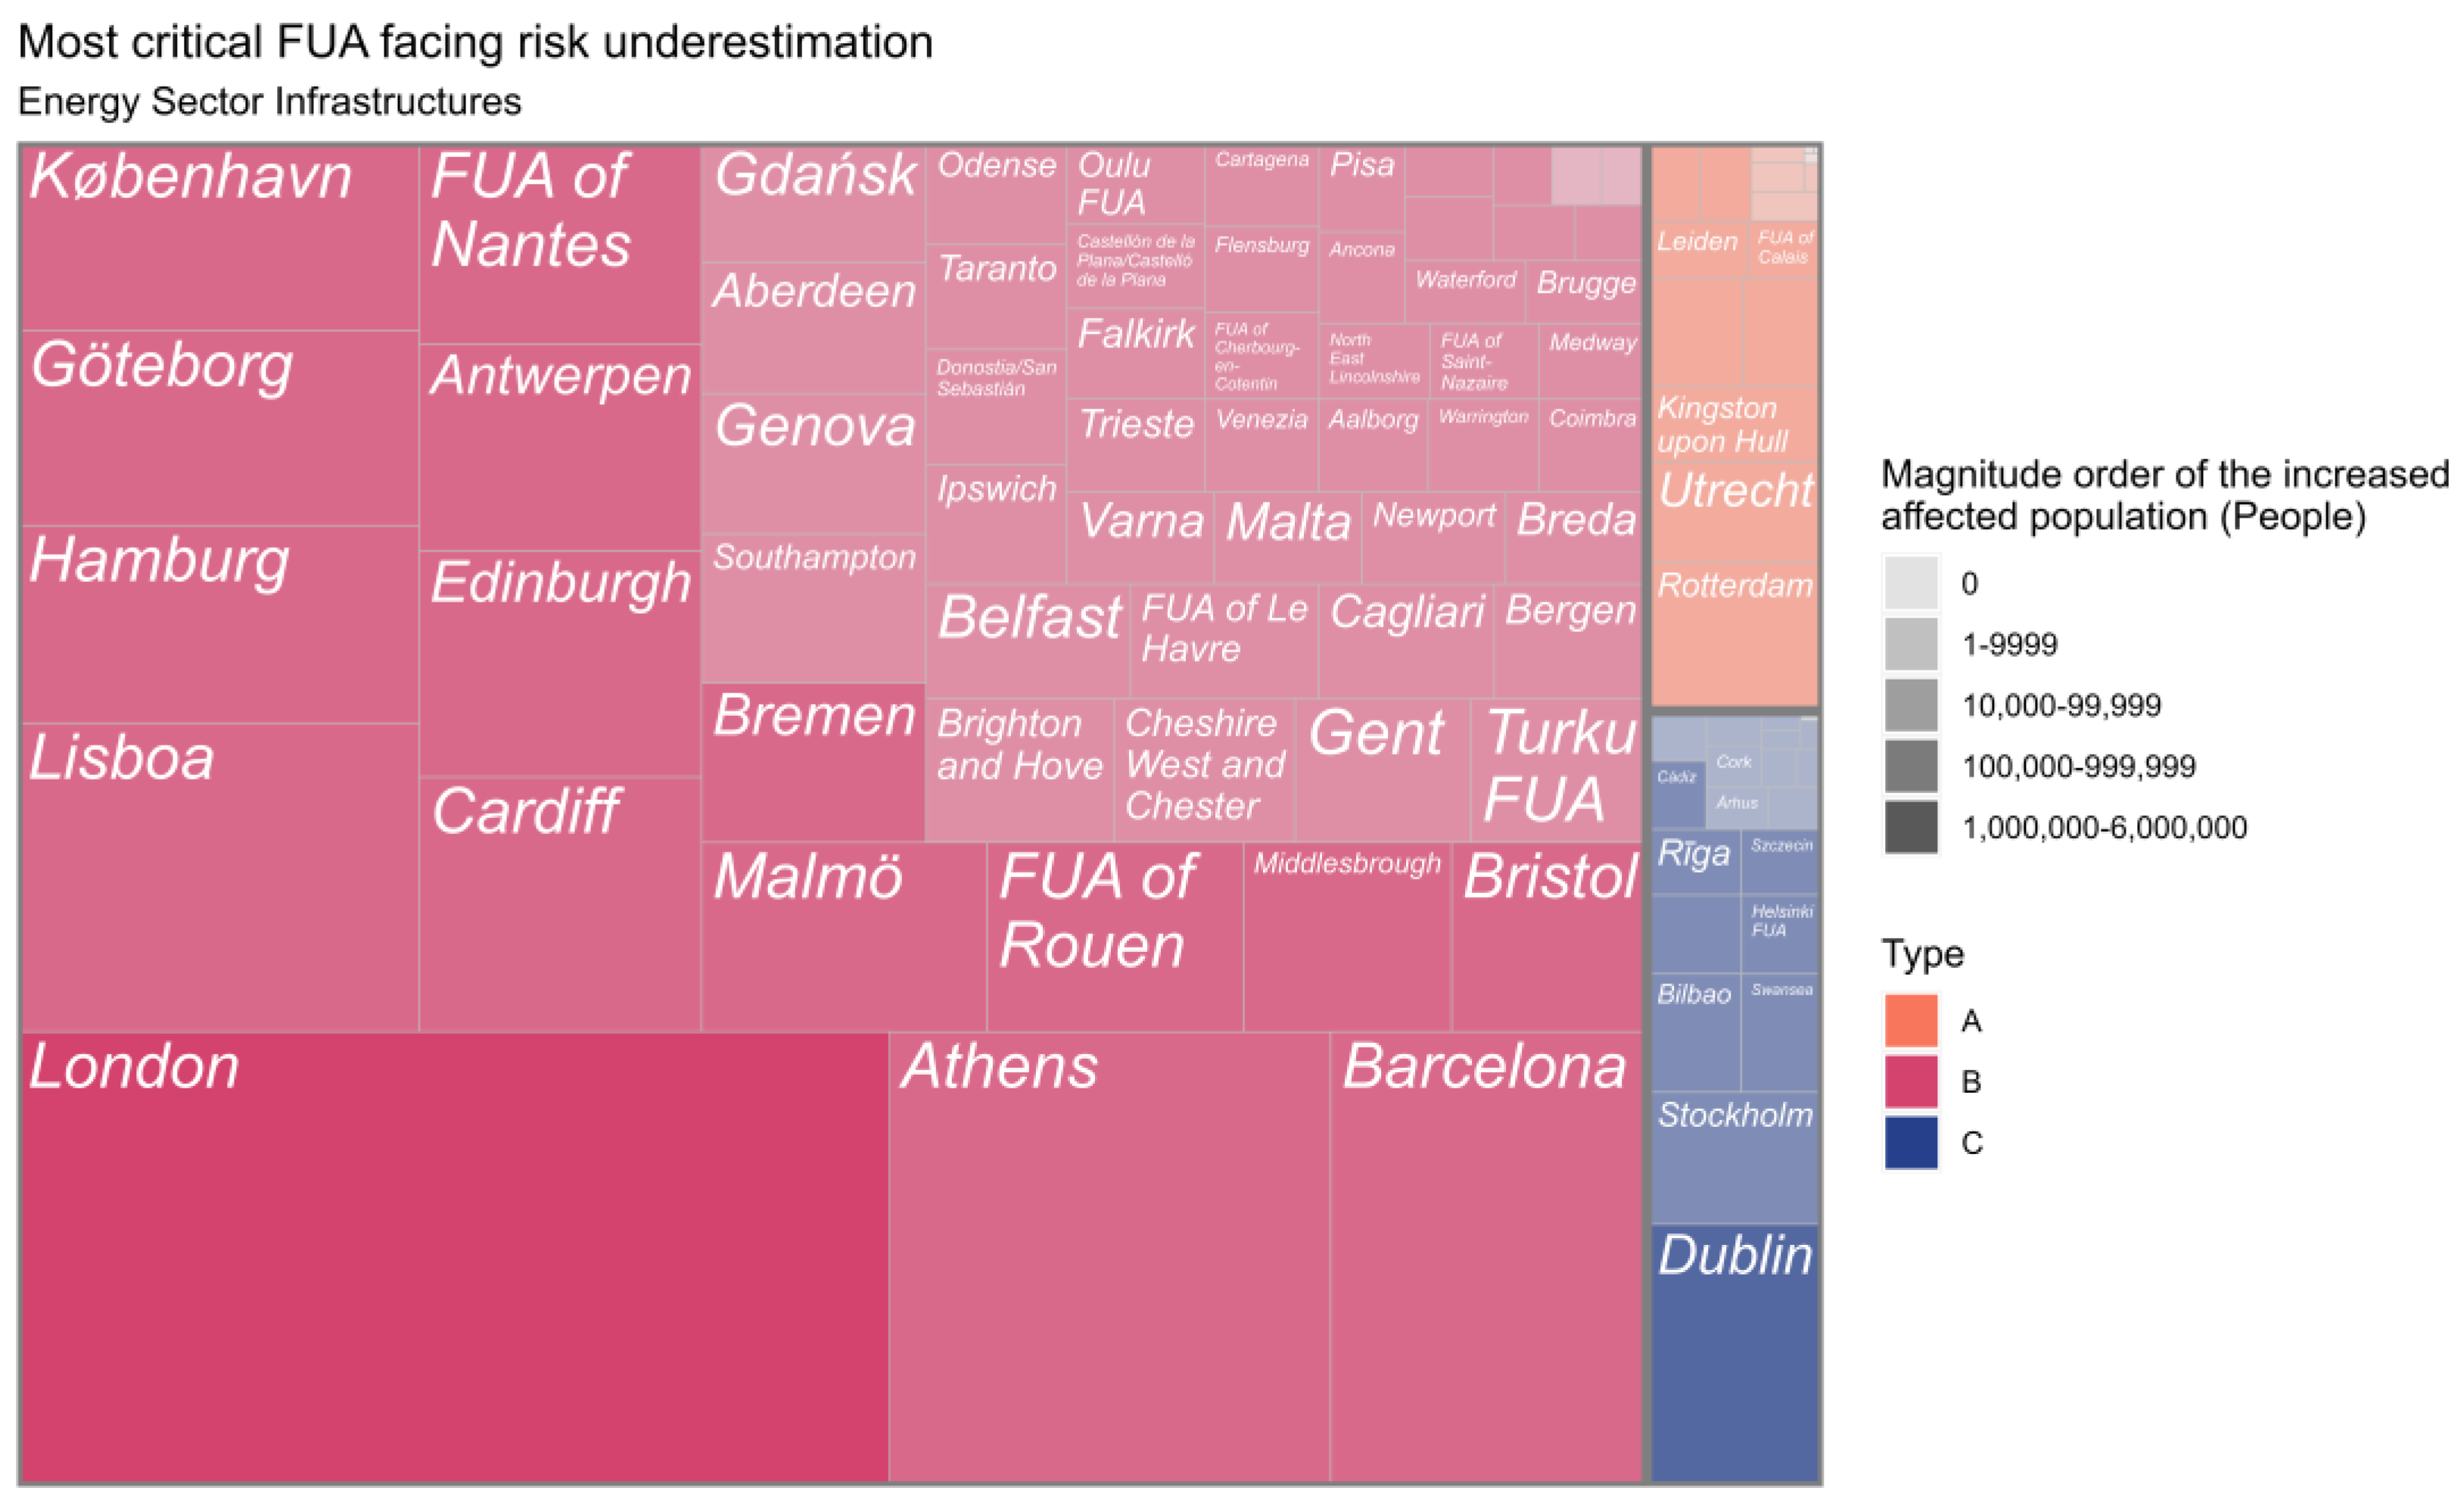
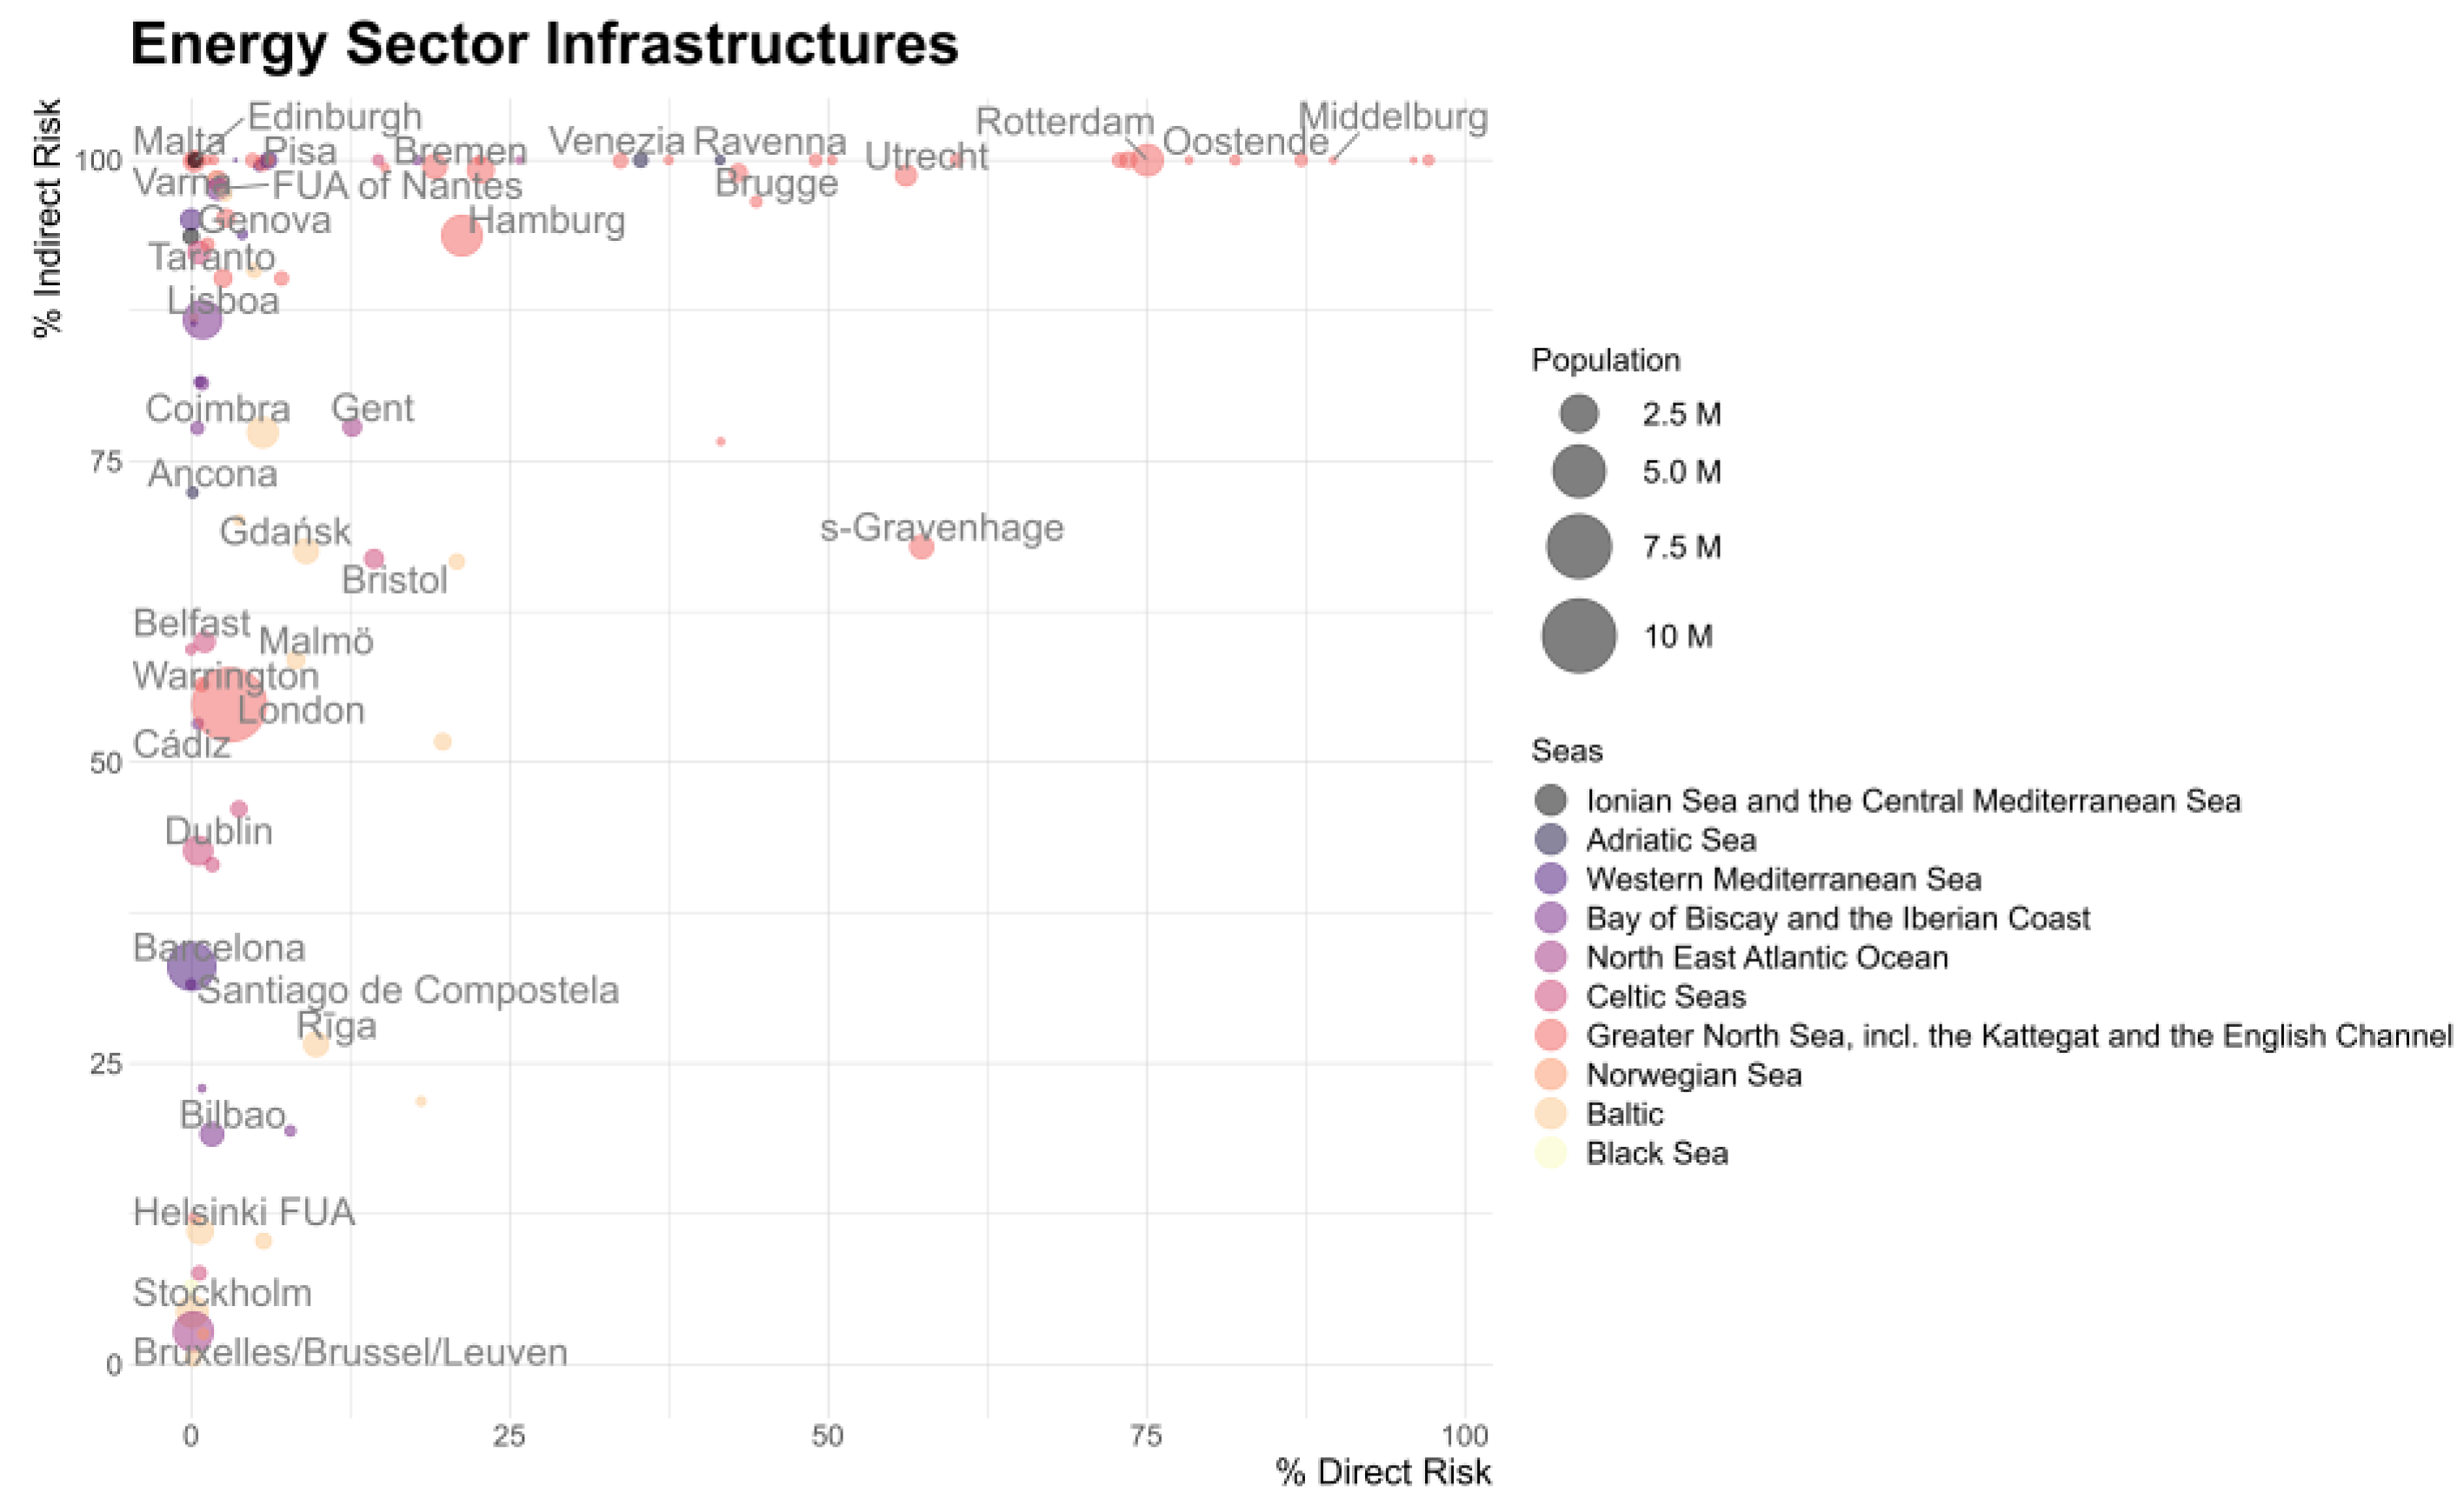
The graph in
Figure 14 shows the European coastal FUA in which the population indirectly affected by the disruption of their Energy sector CI due to coastal flooding has been identified, and classified as the three types previously described (A, B, and C). The graph represents the absolute variation of the affected population between considering the population directly affected and the indirectly affected by the disruption of the energy CI.
For the analysis of the risk over the Energy sector, London, Athens, and Barcelona appear as the most critical FUA, considering the greatest increases in risk (type B), since the order of magnitude of the increase (in absolute terms) of their affected population is millions of people. Among the FUA of type A to be highlighted as more critical, given that a high percentage of their population is exposed both directly and indirectly, Rotterdam and Utrecht stand out.
3.3.2. Water and Waste Treatment Sector Infrastructure
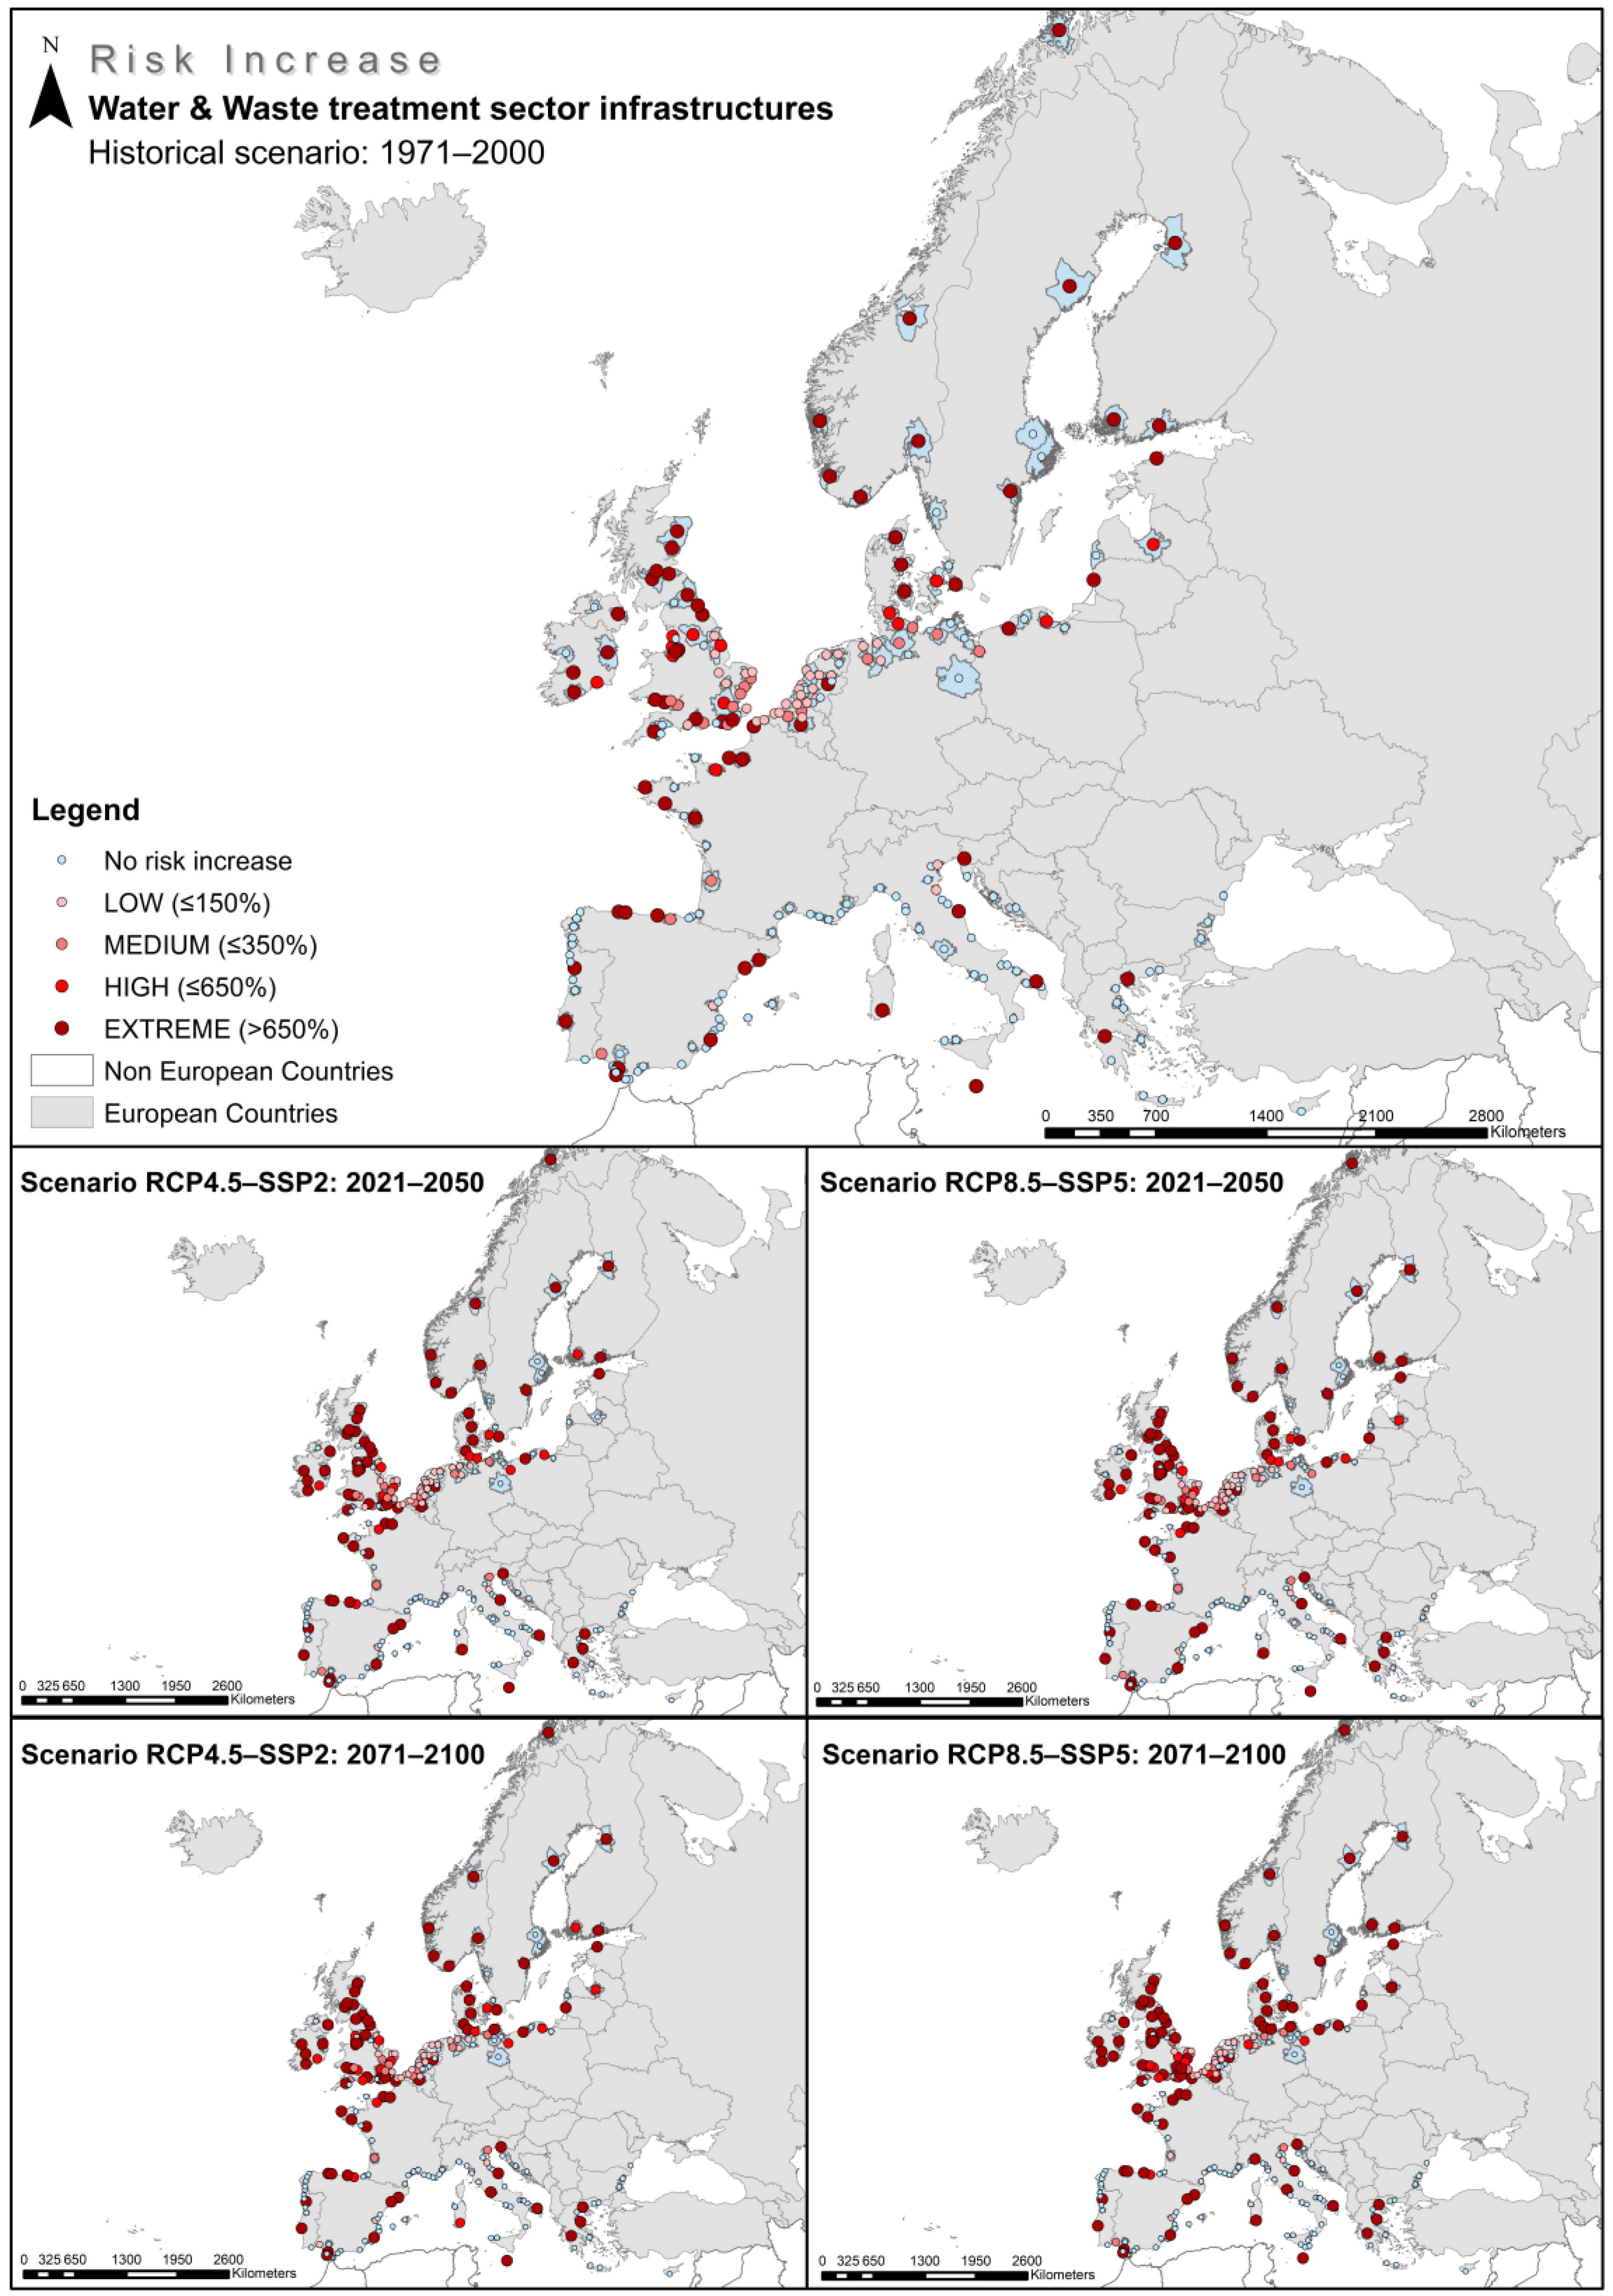
Regarding the W&W treatment CI, certain parallelisms can be found with the results obtained for the energy sector. The large number of FUA that present extreme and high levels of increased risk percentages when considering CI disruption is noteworthy.
Figure 15 shows the percentages of risk increase for the European coastal FUA, considering the impact of the infrastructures of the W&W treatment sector for the historical scenario for the period (1971–2000).
Figure A5 presents the results for the five scenarios and time horizons analyzed.
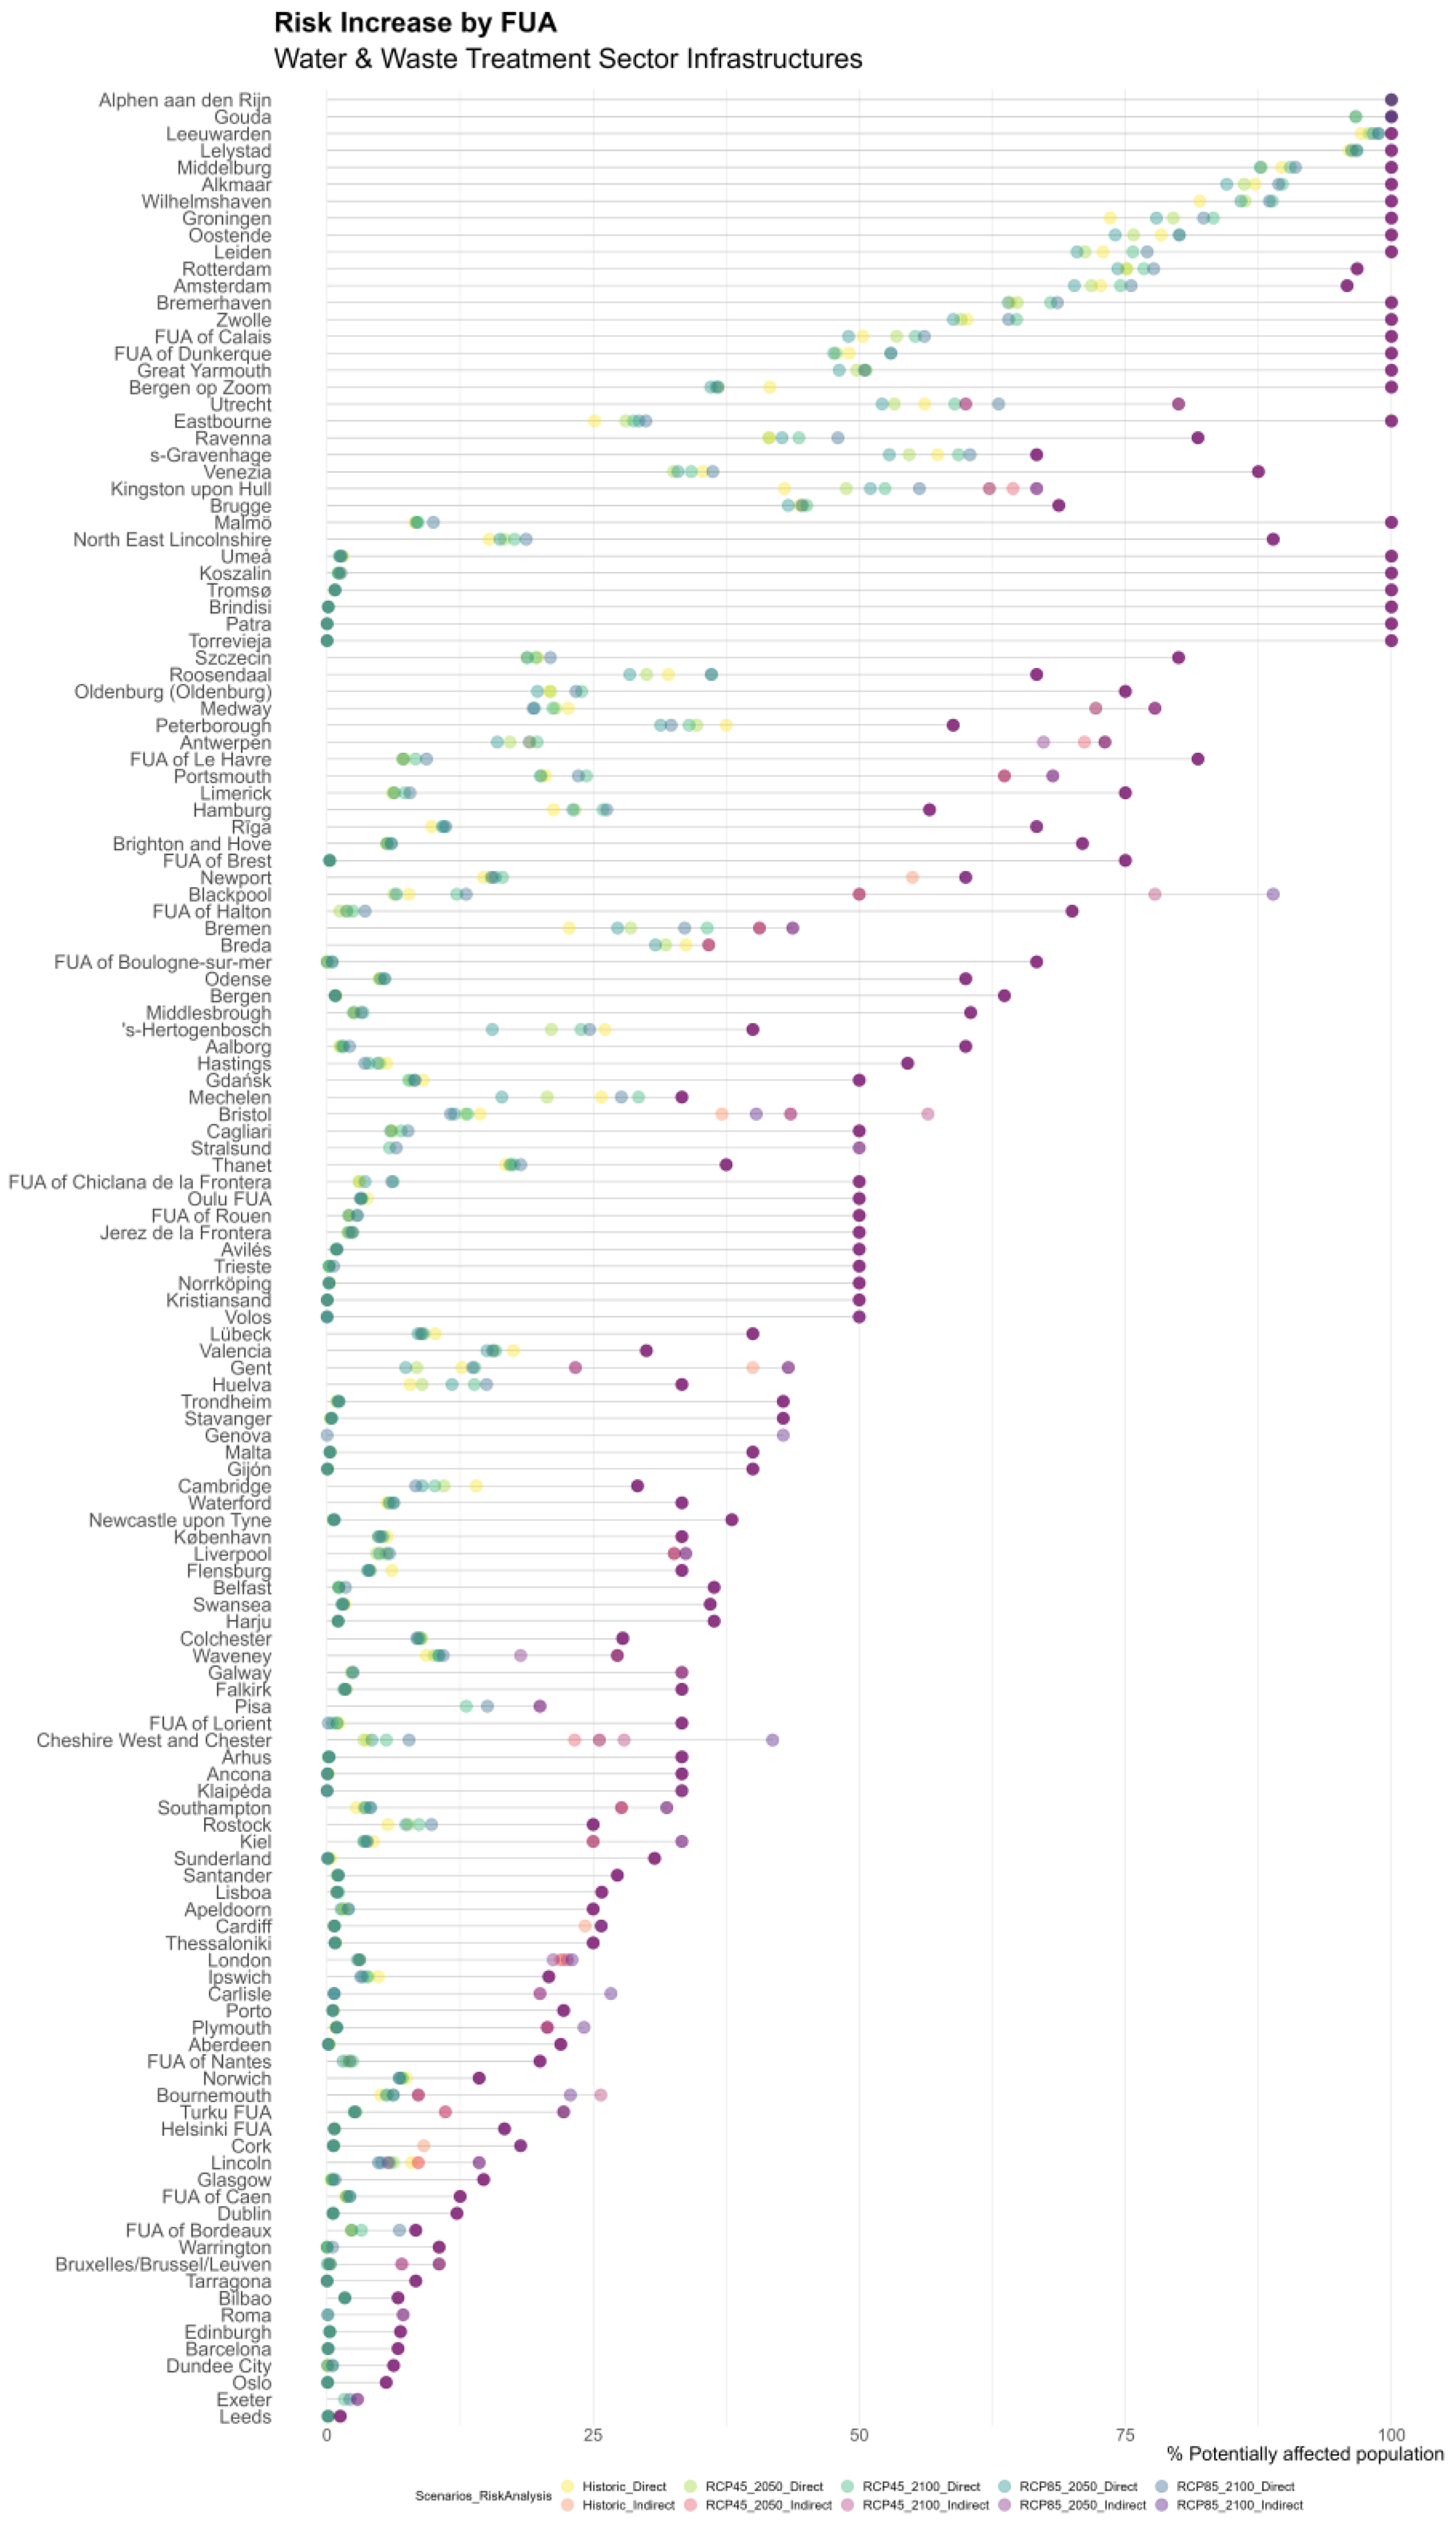
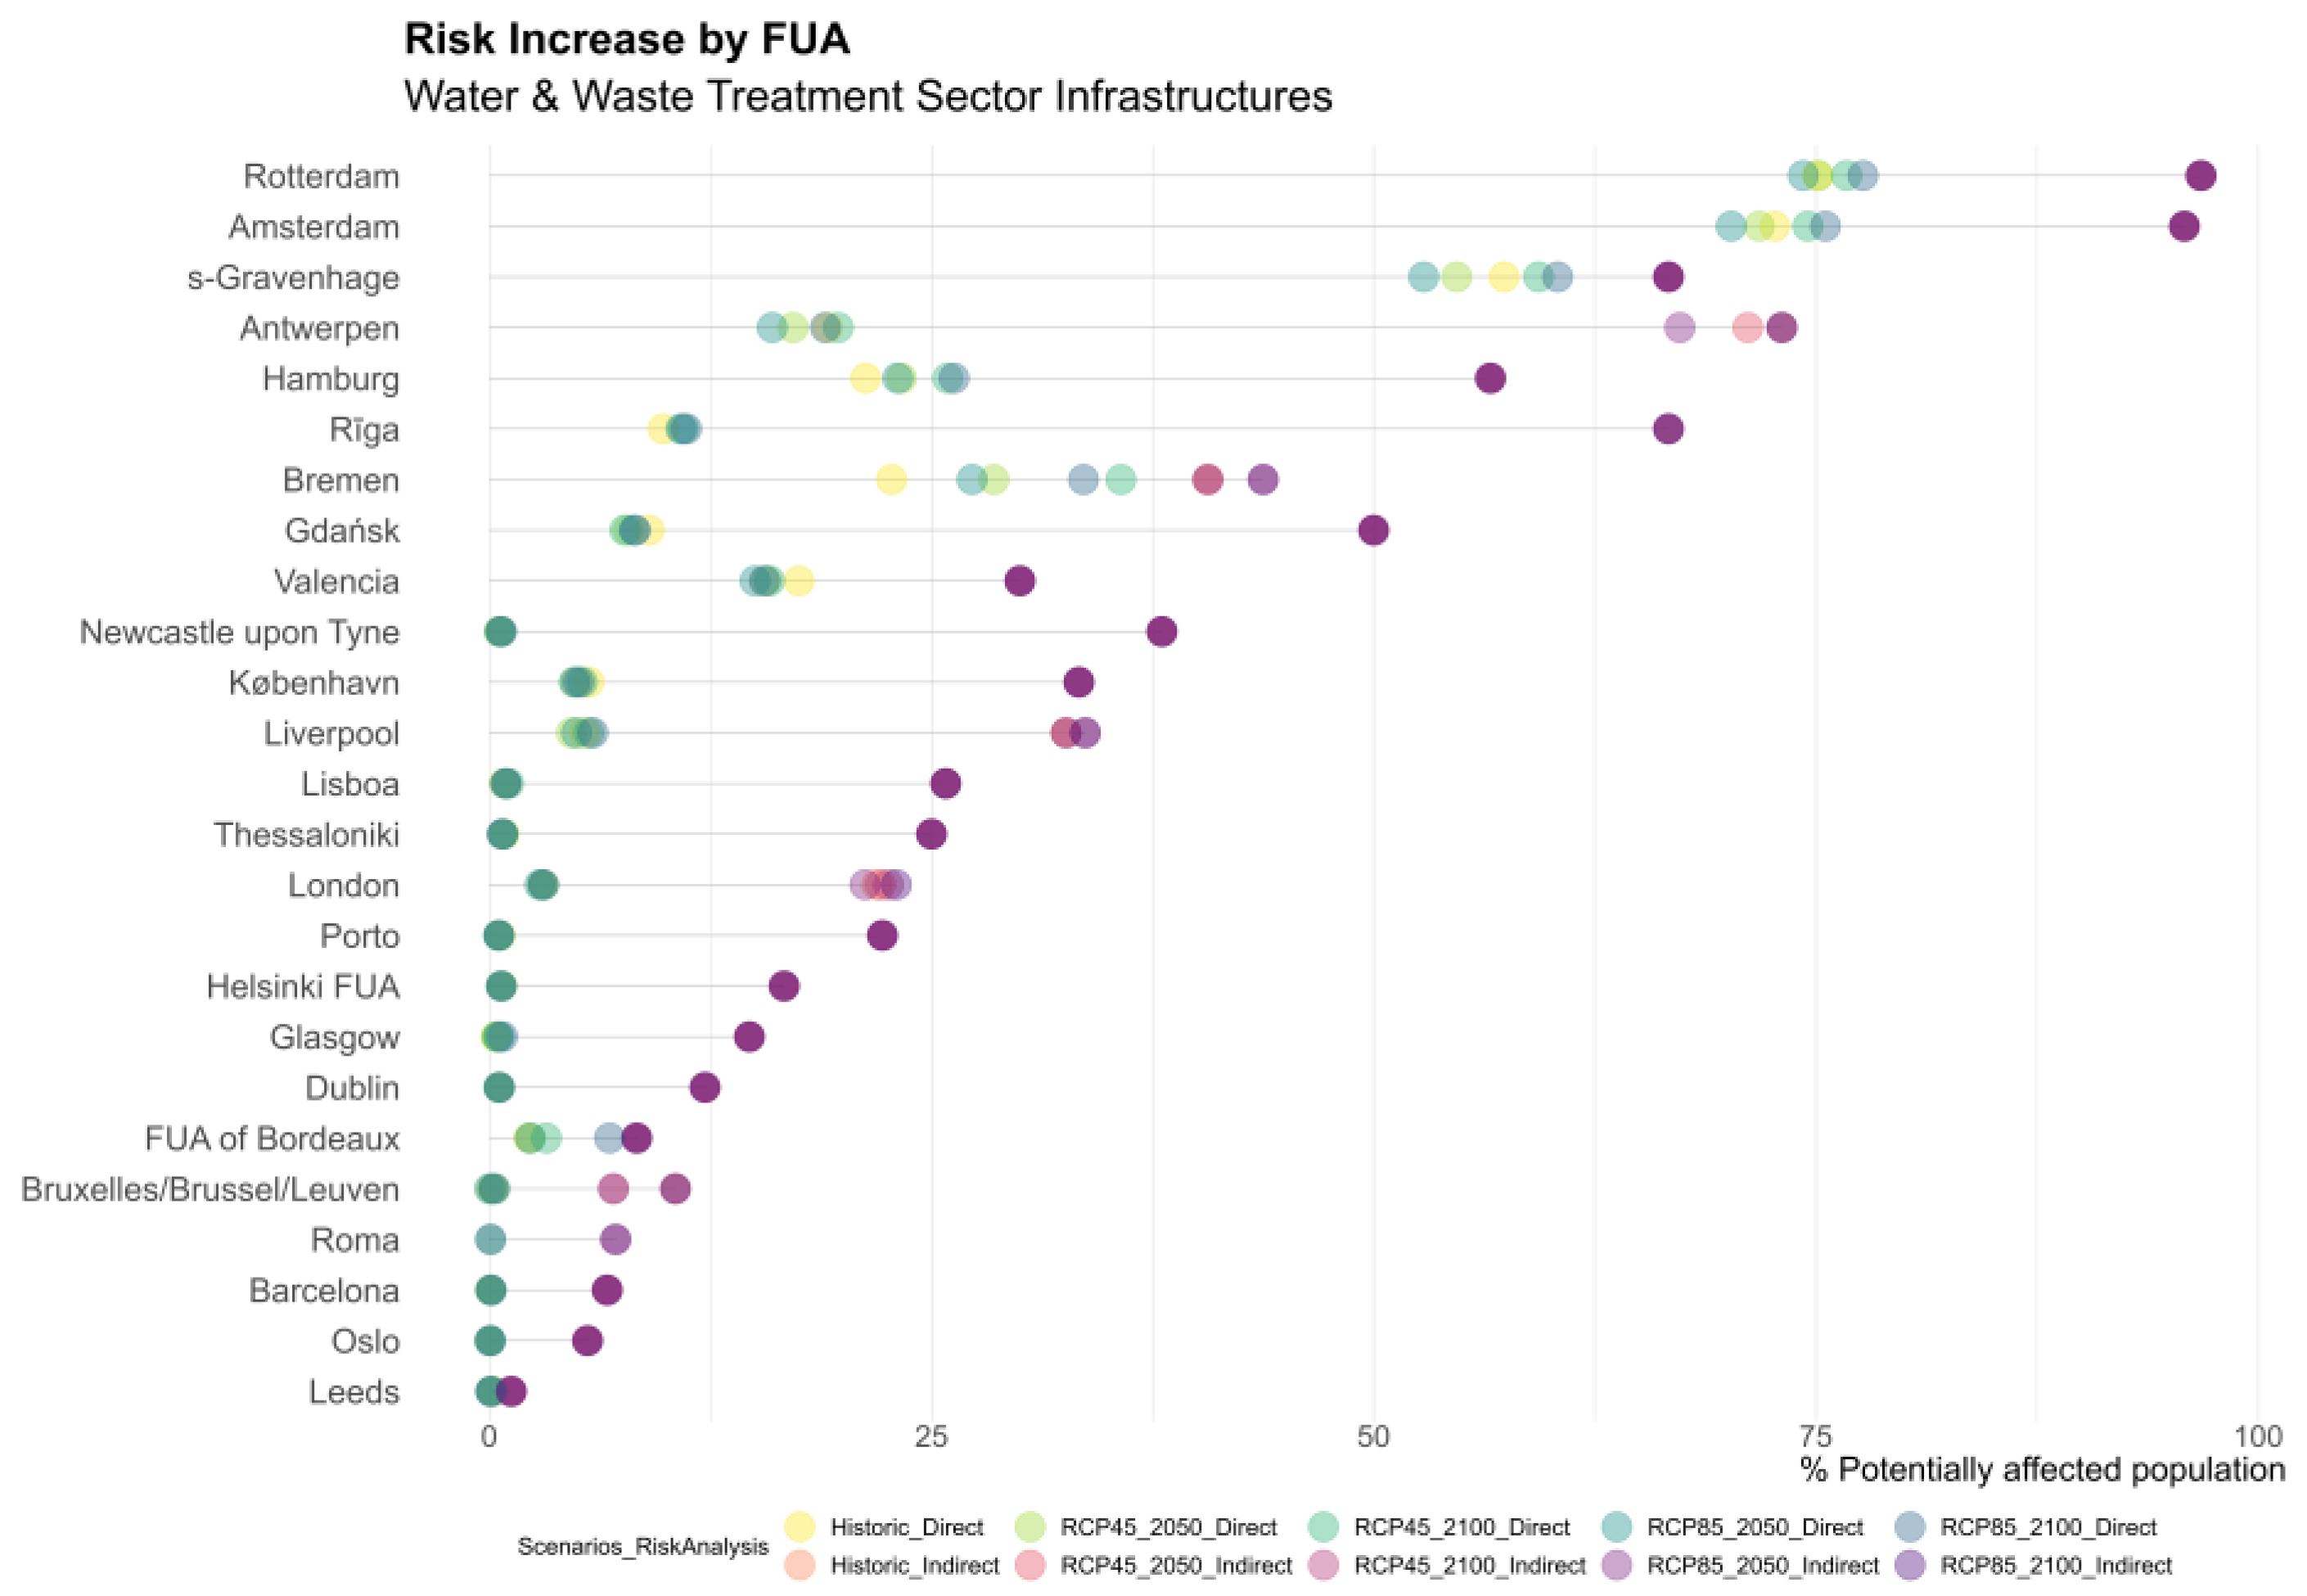
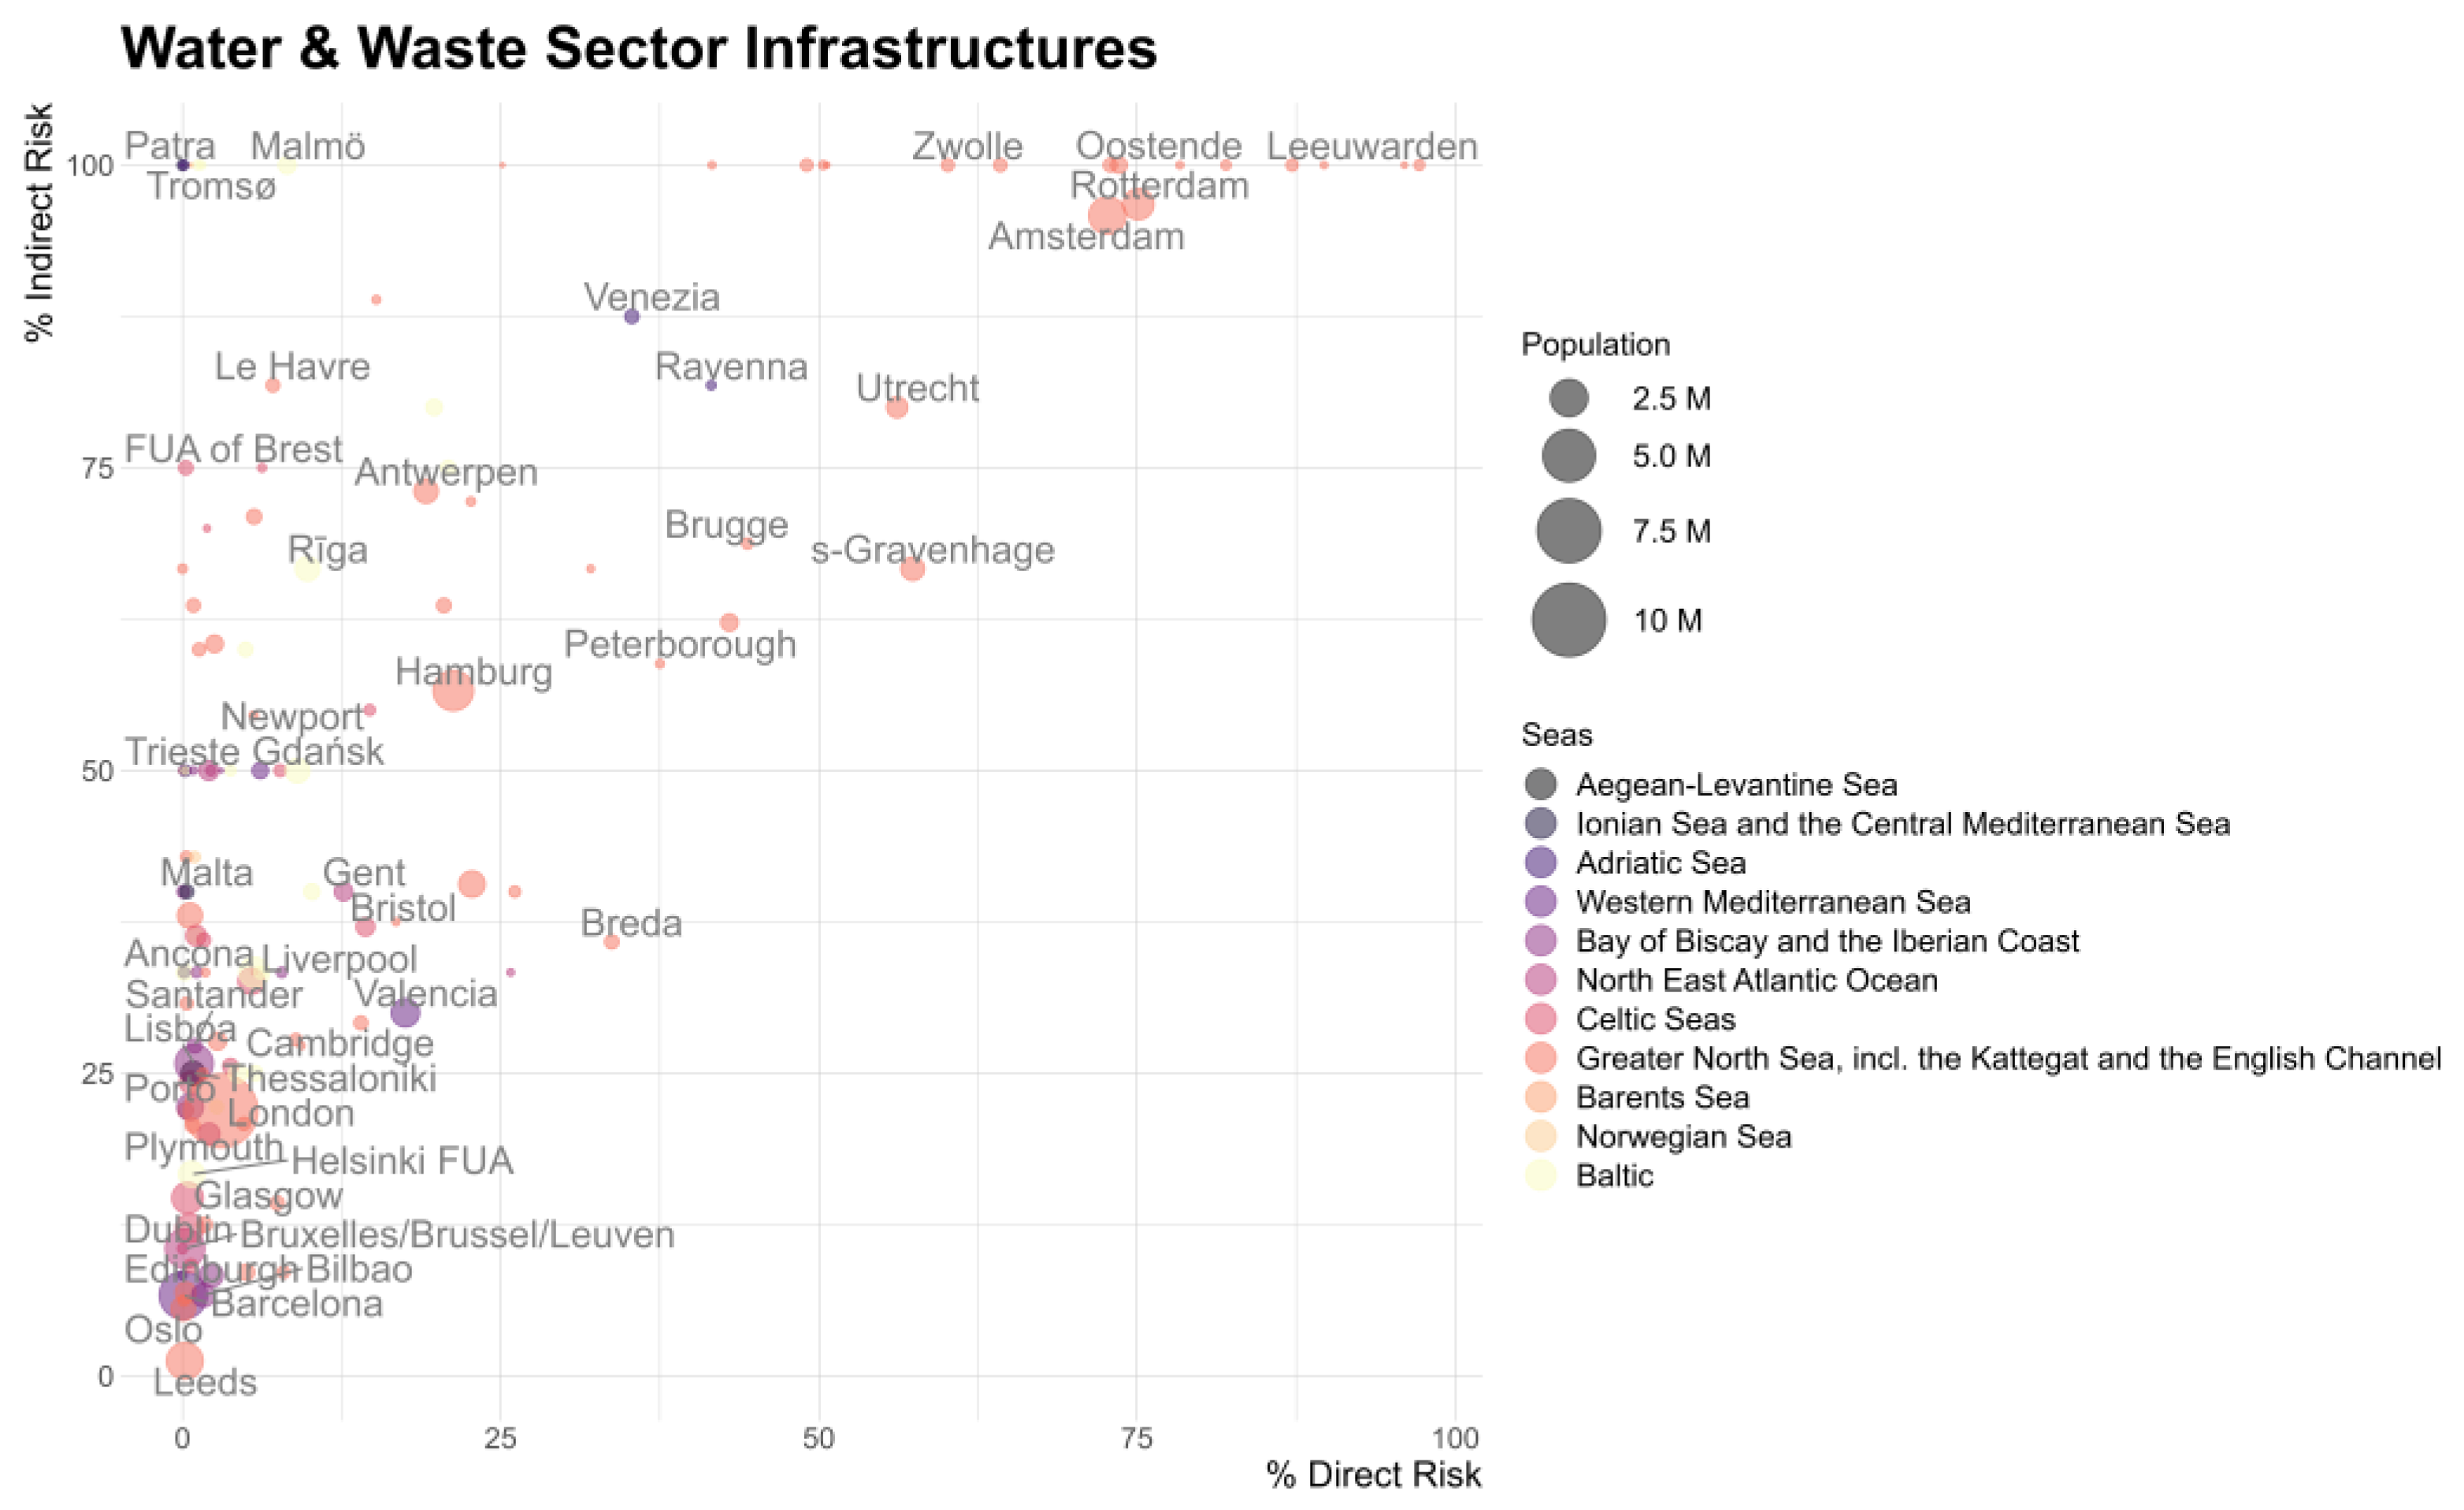
Figure 16 (and
Figure A7 in
Appendix B) presents a comparative graph of the percentages of the population directly and indirectly affected in each FUA. This graph, unlike the analogous results for the energy infrastructure sector, does not show such an extensive number of FUA with very large differences between the percentages of population directly and indirectly affected. In this infrastructure sector, the lower percentages of the population indirectly affected by the suspension of the operation of their CI can be explained due to the higher redundancy of the network.
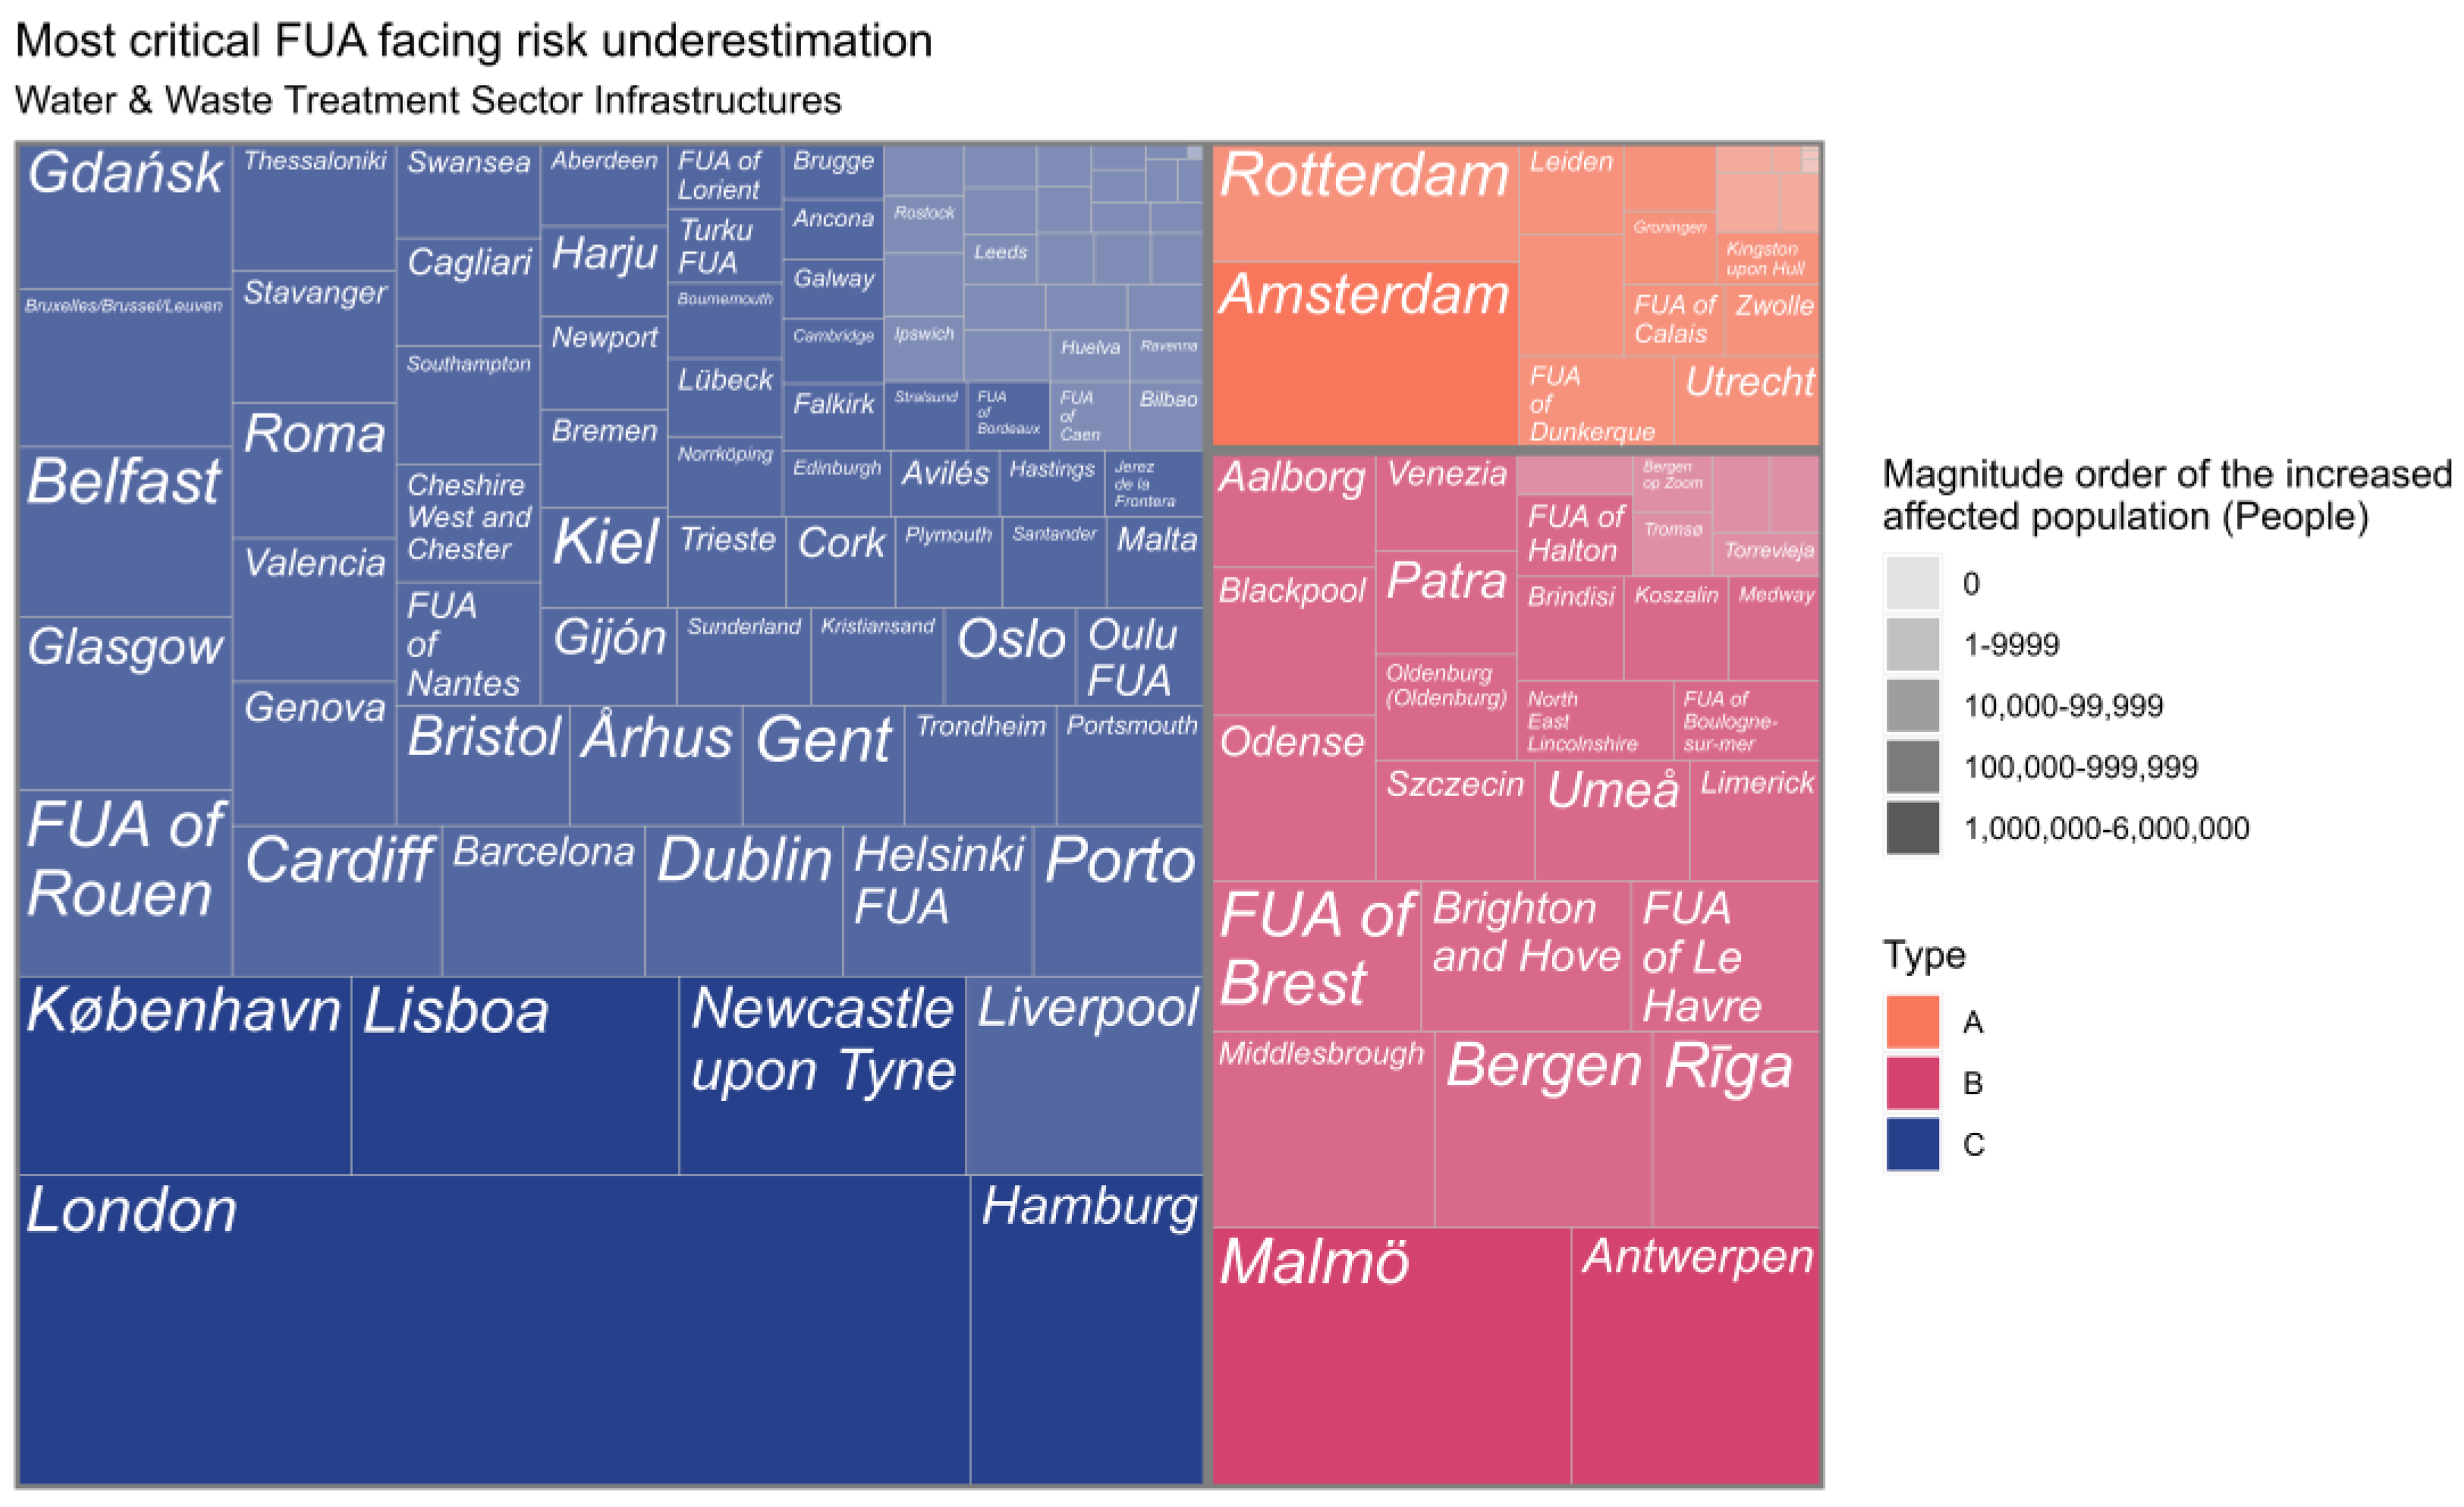
The graph in
Figure 17 groups these FUA according to the increase in risk faced by their population, showing that, for this infrastructure sector, most FUA belong to type C, i.e., the increased percentages of the population affected when considering the disruption of the CI are lower than 50%, with no direct risk due to flooding. This may be caused mainly by the sanitation and water supply networks, which are characterized by a high degree of fragmentation, which makes them more robust than other sectors. Within type C, which is, in principle, the least critical, it is worth highlighting the case of London. For this FUA, even though it has a percentage of the population affected by indirect risk of less than 25%, the increase in people affected by indirect risk is millions of people. In the most critical type, considering risk underestimation (type B), the FUA of Malmö, Antwerp, Bergen, Riga, and Middlesbrough, mainly stand out. The type A is led by the FUA of Amsterdam and Rotterdam.
Determining which are the most critical FUA in terms of underestimation of the indirect risk to the population is of great relevance and usefulness for conducting accurate risk analyses and developing climate change adaptation plans (in this case, to coastal flooding exacerbated due to sea level rise and storm surges). Identifying the FUA with the highest levels of risk derived from the indirect effects of CI disruption on the population is not a trivial task. The high number of FUA (and the heterogeneity of these in terms of their population scales) that present increases in affected populations, presents a challenge when establishing risk levels or indicators that provide an accurate and coherent view of the underestimation of risk in the different FUA.
However, considering the results obtained, London, Athens, and Barcelona have been identified, for the analysis of the energy sector, as the FUA where the underestimation of indirect risk is the most critical. On the other hand, for the analysis of the W&W treatment infrastructures sector, London, Malmö, Antwerp, and Amsterdam stand out as the most critical FUA. Considering the possibility that a coastal flood event could imply the simultaneous interruption of the services provided by the CI of the two types studied, in those FUA where CI of both types are located in potentially exposed areas, some FUA, such as London, Lisbon, and Hamburg, have been identified as highly critical due to the existence of two simultaneous sources of indirect risk for the population.
The graphs in
Figure 18 and
Figure 19 are an alternative way of representing the comparison between the percentages of population directly and indirectly affected in the different FUA, also allowing the identification of coastal areas with a tendency to underestimate risk.
In the case of the analysis related to the energy sector infrastructures (
Figure 18), it can be observed that, based on the distribution of their FUA in the graph, most of the FUA with high percentages of both direct and indirect risk are located on the coasts of the Greater North Sea, while among the FUA with high percentages of indirect effects and very low direct risk are most of those located on the coasts of the Mediterranean Sea and the Bay of Biscay and the Iberian Coast.
Regarding the analysis of the W&W treatment infrastructures, the graph in
Figure 19 shows that the distribution of the FUA based on the percentages of population directly and indirectly affected by coastal flooding differs from that of the Energy sector. In this case, as previously mentioned, there is a majority of FUA with low percentages of their population affected by direct risk and percentages of indirect risk lower than 50%. This group includes, mainly, the FUA located on the coasts of the Mediterranean and the Iberian Coast. The most prevailing group along all sectors of the graph, i.e., the area with the highest risk (both direct and indirect), is the FUA located along the coasts of the Greater North Sea, including the Kattegat and the English Channel, being the most common geographical area in the upper half of the graph (high percentages of population indirectly affected).
3.4. Main Findings of the Study
From the results obtained, it can be concluded that neglecting the indirect affection on the population derived from CI normal functioning interruption caused by extreme climate events, such as coastal flooding, implies the underestimation of risk and substantial negative consequences on households, which can lead to poor adaptation planning.
The use of FUA as an approach to CI area of influence provides results that identify areas where this risk underestimation due to CI disruption might be critical. More specifically, the results allow the categorization of coastal European FUA depending on the cause of risk underestimation (as shown in
Section 3.3 and in
Figure 14 and
Figure 17). The main underestimation of coastal flood-derived risk is identified in those areas where the percentage of the directly affected population to this hazard is low, very low or even null. Meanwhile, other FUA present a critical rise in borne risk due to the double exposure of the population, both to the direct risk of flooding and to the indirect risk derived from the loss of services provided by the affected CI.
The results obtained complement existing previous studies found in the scientific literature, which have been considered in the conceptualization of this work. Concerning the assessment of the area of influence of CI affected by any damage, the methodology employed in this work complements and constitutes an alternative to other methods commonly used previously by different authors such as [
8,
10,
29,
54,
55]. Regarding the results that highlight the relevance of considering the indirect impacts of coastal flooding, the findings in this work are consistent with those presented by Lan et al. [
14], contributing to a better understanding of these impacts. Nevertheless, unlike most previous studies that address indirect impacts derived from coastal flooding at regional or local scales (e.g., [
14,
56]), in this study, these impacts are analyzed at the European scale.
To our knowledge, there is no other study that establishes a comparison between the potentially affected population due to the direct impact of coastal flooding and the indirect impact due to CI disruption caused by this hazard. Therefore, these results cannot be compared. In fact, the main contribution of this work relies on the fact that it highlights the relevance of considering the consequences of CI failure due to EWEs on the population in risk analyses, based on this comparison of the potentially affected population.
The novelty of the use of FUA as an approach to the area of influence of the analyzed CI allows us to develop risk analyses considering indirect affection on the population from climate-derived impacts when detailed information on the CI network connectivity is not available or the interconnections are too complex to be modeled. FUA are consistent spatial units, compared to other methods employed that require a detailed characterization of the CI networks that is not always feasible, or that are less accurate with relation to administrative and organizational characteristics in services provision, such as methods considering a ratio of influence with a “buffer” method or Thiessen tessellation. Moreover, this approach has allowed us to expand the analysis to the European scale, which had not been previously carried out, with coherent results.
The main findings of this work highlight a dimension of risk borne by the population that is largely ignored in conventional approaches to climate risk analysis, and which has major implications for the design of measures and adaptation plans to the impacts of extreme climate events, not only in the coastal regions of Europe, but also in regions whose CI are affected by these impacts worldwide.
3.5. Sources of Uncertainties
Risk analyses that consider the indirect risk derived from the failure of CI on the population present a great complexity derived from the high uncertainty inherent to the processes and data used. Therefore, some hypotheses have been identified that may be sources of uncertainty in the study and that should be improved in future work. The following assumptions have been established for the treatment of uncertainty in this analysis.
Regarding the user allocation to the infrastructures, we have assumed FUA as the areas of influence of CI located in a certain geographical region, and the allocation of users to the CI has been based on the number of CI in the FUA and, also, proportionally to the economic impact of each CI. The degrees of affection of the CI in the face of a flood event are not considered as a function of the flood depth, but the categories of “affected” or “unaffected” are established.
Another potential source of uncertainty is not explicitly considering dependencies and interdependences between the nodes of a CI network due to the lack of this information at the European scale and for all the FUA considered. Also, for the future projections analysis, current critical assets, as well as their current location, are considered. The lack of data and studies regarding the presence and location of CI in the future is a potential source of uncertainty in the analysis.
Existing coastal protections are not considered. This would imply that coastal flood hazard is considered to exist in areas where this impact would be reduced by adaptation actions through the construction of coastal protection infrastructures. However, this analysis has been considered appropriate from the point of view of the assessment of risk underestimation, taking as a premise the fact that studies such as the one conducted by Hallegatte et al. [
5] state that, even though the improvement of coastal protection infrastructures reduces risk levels and the number of floods, the magnitude of losses generated when a coastal flooding event occurs, mainly due to sea level rise and subsidence exceeding adaptation levels, are up to 50% higher.
Additionally, since flood maps are highly influenced by the assumed levels of protection, relying on the protection standards considered may lead to underestimation of the hazard by neglecting the reliability of the protections [
57]. According to these authors, there are considerable variations in the extent of flood areas depending on the coastal protection databases used (JRC or FLOODPROS), which would justify not considering these flooding areas for our study.
4. Conclusions
The main purpose of this study has been to assess the influence of CI consideration in risk analysis and how CI failure caused by extreme climatic events, such as coastal flooding, may exacerbate the impacts on society. The main targets of the study have been assessing the estimation of the potential number of users affected by CI disruption and highlighting the underestimation of risk in certain areas where these infrastructures and their cascading effects are not adequately approached. For this purpose, a methodology that assigns potential users to CI, based on the FUA territorial unit has been applied to quantify the risk increase derived from the disruption of these CIs, in terms of the population potentially affected. The use of FUA as an approximation to the area of influence of CI, which is proposed for the first time in this study, provides a spatially and administratively coherent approach to estimating the area potentially affected by CI disruption.
The main novelty of the study lies in the fact that it provides, to our knowledge, the first spatial assessment of coastal flood risk of CI for the whole European coastline. Our analysis provides evidence for the need for CI consideration in risk analysis and the need for further development of CI network assessment. The spatial approach in the risk analysis developed in this study allows us to identify which regions face more risk than others, allowing the optimization of adaptation policymaking. Therefore, the results provide a guideline for optimal investments in flood protection of CI. As a major finding, potential risk has been identified in regions that, in a first approximation, would not be considered as particularly affected by coastal flooding. This methodology has made it possible to establish a classification of European coastal FUA according to the degree of underestimation of risk derived from the CI disruption they present. These findings provide a new scale of the potential population at risk due to coastal flooding, highlighting the spatial propagation of CI disruption effects. Evidence is provided that the risk to the population from an EWE can occur even when the source of the risk (in the case study, coastal flooding) does not affect the population directly, but through the disturbance of the CI that provides basic services.
The large variations in risk identified in this study considering the population affected by the disruption of CI exposed to coastal flooding imply a large tendency to underestimate risk in prevailing risk assessments. In fact, a significant number of FUA along the European coasts experience an increase in the population affected due to coastal flooding when considering the indirect risk derived from the damage of CI: the number of indirectly potentially affected populations can increase up to 4.5 times the directly potentially affected population caused by the coastal flooding event of 1 in 100 years return period associated with a RCP4.5-SSP2 (2021–2050) scenario, when the alteration of energy CI is considered. The results obtained allow to characterize the criticality of each CI sector analyzed with regard to the population that would be potentially affected in the event of the interruption of their normal functioning due to a coastal flooding event, finding that, from the two sectors analyzed, the FUA with energy CI in their flood-prone areas are those with the greatest increase in population affected with respect to conventional approaches, with up to 28% of the European FUA being affected by coastal flooding at extreme risk.
These findings are particularly relevant for their significant policy implications, specifically regarding risk management and adaptation policies. Policymakers are provided with new metrics to base their adaptation decisions on, with a holistic perspective of coastal flood risk disruptions to CI and its effect on the European population. Results reveal the necessity to increase the resilience (robustness, redundancy, resourcefulness, and rapidity [
58]) of CI networks and to improve urban planning and development to minimize exposure and vulnerability of CI and citizens exposed.
Further research will attempt to look at how variations in the presence and location of existing CI influences the exposure analysis and, also, to consider variations in urban development and demographics of FUA according to SSPs scenarios. Formulating cascade effects through a network-based approach will open the possibility to include linear infrastructures. Lastly, improvements in the accuracy and resolution of the datasets employed are proposed, for the characterization of CI and its exposure to coastal flooding. More accurate and precise flood maps and CI-gridded datasets would imply a substantial improvement in the results and conclusions of this study. Equally relevant is the need to consider the interrelationships between CI nodes of a network, i.e., increased risk due to the breakdown of one CI leads to the failure of others outside the area directly affected. Although this approach is out of the scope of the present study, the further characterization of CI networks at the FUA level, but also at the national, international, and European levels, would allow the development of risk analyses of this kind with much higher accuracy and reliability. Therefore, we encourage the provision of precise data regarding the existent CI network and its interdependencies. In addition, assessing the vulnerability of the study area, considering the resilience through socio-economic indicators representative of the adaptive capacity to cope with the impact(s) analyzed, is also highlighted.
Considering the results obtained, which show the general trend of underestimating the risk faced by European societies, there is an urgent need to improve climate risk management and planning. Additionally, these findings and conclusions form evidence to support the ongoing policy efforts to optimally mitigate and adapt to climate-derived risks. Possible applications of the metrics and methodologies developed can be its implementation to exposure and risk analysis in other geographical areas and consideration of other natural hazards or even the simultaneous combination of several hazards by employing multi-impact indicators.
Despite the limitations of the study and the need for further research, the authors consider the findings achieved as a crucial contribution and a starting point for the elaboration of strategic adaptation plans and for climate adaptation decision-making processes that adequately approach the indirect risk faced by CI users along the European coastal areas, taking into consideration the concept of “risk underestimation”.


